the performances of process capability indices in the six
TRANSCRIPT

Proceedings of the International Conference on Industrial Engineering and Operations Management Bandung, Indonesia, March 6-8, 2018
The Performances of Process Capability Indices in the Six-Sigma Competitiveness Levels
Vimal Kumar Department of Management Studies
National Institute of Technology Bhopal, India ([email protected])
Pratima Verma Department of Industrial & Management Engineering, Indian Institute of Technology Kanpur, Kanpur, India
([email protected], [email protected])
Vignaesh Muthukumaar Consultant, EXL Services, Bengaluru, India
Abstract: Six-Sigma is a powerful business strategy that employs a disciplined approach to tackle process variability using the application of statistical and non-statistical tools and techniques in a rigorous manner. The process quality of six-sigma corresponds to a defect rate of at most 3.4 parts per million (ppm). The applications of six-sigma will continue to grow in the forthcoming years. The six-sigma concept of process capability indices such as Cp, Cpk, Cpm, and Cpmk have been considered in this research. It provides quantitative measures of process potential and performance. Moreover, based on the “sigma level” the various competitive levels have been categorized as world class, industry average, and non-competitive industry. It aims to identify the firm performance within these three competitive levels at the four process capability indices and see the consequences of these indices. Further, it does provide good understanding and foundation for future research. The practitioners and researchers can use the procedure to test whether the processes meet the capability requirement. We plan to undertake the vast study to verify the framework given in the paper.
Keywords: Process Capability Indices, Six-Sigma Approach, Competitive Levels
I. IntroductionThe concept of six-sigma quality initiative was evolved in the early 1980s by Motorola. Six-sigma is defined by utilizing an extensive set of rigorous tools, advanced mathematical and statistical tools, and a well-defined methodology that produce significant results quickly (Raisinghani, 2005). Further, Koch et al. (2004) defined six-sigma is a quality philosophy at the highest level, relating to all processes, and a quality measure at the lowest level. Motorola was facing the problems related to the loss of quality cost which includes not only the 2,600 PPM (parts per million) loss in manufacturing but lost business due to defective parts and support of systems in the field that was unreliable (Raisinghani, 2005). To overcome on product failure levels, Motorola CEO Bob Galvin tried to address these problems in 1981. Later, an engineer at the company Bill Smith found that failure rate of the manufactured products and quality level associated with a measure of six-sigma. Subsequently, to minimize and ideally, eliminate defects from the manufacturing process, Mike J. Hary introduced six-sigma to Motorola to make their customer satisfaction. Thus, six-sigma yield improvement, cost reduction of poor quality, improve process capability and process understanding and measure value according to the customer are the key elements of result-oriented quality programs. Incidentally, six-sigma in the current manufacturing era becomes is being considered as potential and rigorous tools.
1945
Proceedings of the International Conference on Industrial Engineering and Operations Management Bandung, Indonesia, March 6-8, 2018 Carl Fredrick Gauss (1777-1855) defined the term “sigma” as a measurement of standard and concept of normal distribution. It actually measures the capability of the process to perform the defect-free work. The increment the values of sigma (from 1 to 6) indicates the betterment of the process is increased. In quality management, Walter Shewhart introduced the three sigmas considered as a measurement of output variation in 1922 (Raisinghani, 2005). The three sigma concept is related to a process yield of 99.973 percent and represented a defect rate of 2,600 per million, which was adequate for most manufacturing organizations until the early 1980s. For instances, to the understanding of 99 percent of the quality level is surprisingly high but statistically, it is not acceptable, it can be considered through the following facts (Raisinghani, 2005; McClusky, 2000; and Rath and Strong, 2016):
• At major airports, 99 percent quality means two unsafe plane landings per day; • In mail processing 99 percent quality means 16,000 pieces of lost mail every hour; • In power generation, 99 percent quality will result in 7 hours of no electricity each month; • In medical surgery, 99 percent quality means 500 incorrect surgical operations per week; • In water processing, 99 percent quality means one hour of unsafe drinking water per month; and • In credit cards, 99 percent quality will result in 80 million incorrect transactions in the UK each
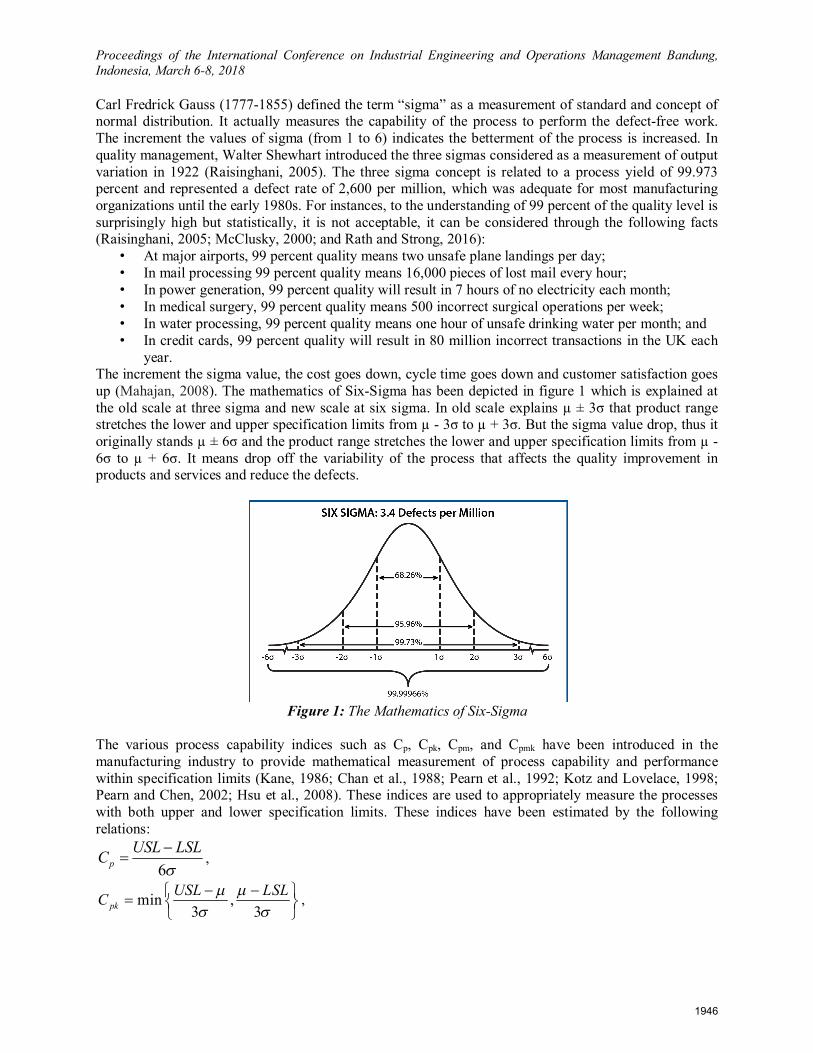
year. The increment the sigma value, the cost goes down, cycle time goes down and customer satisfaction goes up (Mahajan, 2008). The mathematics of Six-Sigma has been depicted in figure 1 which is explained at the old scale at three sigma and new scale at six sigma. In old scale explains µ ± 3σ that product range stretches the lower and upper specification limits from µ - 3σ to µ + 3σ. But the sigma value drop, thus it originally stands µ ± 6σ and the product range stretches the lower and upper specification limits from µ - 6σ to µ + 6σ. It means drop off the variability of the process that affects the quality improvement in products and services and reduce the defects.
Figure 1: The Mathematics of Six-Sigma
The various process capability indices such as Cp, Cpk, Cpm, and Cpmk have been introduced in the manufacturing industry to provide mathematical measurement of process capability and performance within specification limits (Kane, 1986; Chan et al., 1988; Pearn et al., 1992; Kotz and Lovelace, 1998; Pearn and Chen, 2002; Hsu et al., 2008). These indices are used to appropriately measure the processes with both upper and lower specification limits. These indices have been estimated by the following relations:
6pUSL LSLC
,
min ,3 3pk
USL LSLC
,
1946

Proceedings of the International Conference on Industrial Engineering and Operations Management Bandung, Indonesia, March 6-8, 2018
2 26 ( )pm
USL LSLCT
,
2 2 2 2min ,
3 ( ) 3 ( )pmk
USL LSLCT T
Where USL is the upper specification limit, LSL is the lower specification limit, σ is the standard deviation of the process (overall process variation), µ is the process mean, and T is the target value. The index Cp is the capability ratio which considers the overall process variability relative to the manufacturing tolerance, reflecting product quality consistency. The index Cpk takes the magnitude of process variance as well as the location of the process average and has been regarded as a yield-based index since it providing current process average’s proximity to either lower bounds or upper bounds on process yield. The index Cpm emphasizes on measuring the processability to cluster around the target and the design is based on the average process loss relative to the manufacturing tolerance, called TaguchiIndex. It provides an upper bound on the average process loss. The index Cpmk is constructed by combining the modifications to Cp that produced Cpk and Cpm, which inherits the merits of both indices.
II. Competitive Level Based on Sigma level distribution, defect rate, yield, and cost of poor quality, there is three type of industry defined in the following terms:
A. Manufacturing Class Industry During the 1980’s US manufacturing industries rediscovered the power that comes from superior manufacturing and initiated a variety of activities to improve their competitiveness ((Hayes and Pisano, 1994). Many researchers have classified the manufacturing strategy as ‘manufacturing class industry’. The term ‘world class manufacturing (WCM)’ was first used by Hayes and Wheelwright in 1984. According to Greene (1991, p. 14), WCM companies are those companies which continuously outperform the industry’s global best practices and which know intimately their customers and suppliers, know their competitors’ performance capabilities and know their own strengths and weaknesses. All of which form a basis of – continually changing – competitive strategies and performance objectives. Sharma and Kodali (2008) have identified practices of WCM as manufacturing strategy, leadership, environmental manufacturing, human resource management, flexible management, supply chain management, customer relationship management, production planning, total quality management, total productive maintenance, and lean manufacturing. WCM is based on the belief that competitive manufacturing requires an emphasis on customer service, high quality, timeliness, and employee involvement (Hall et al., 1991). It draws heavily on Japanese management practices, especially continuous improvement, benchmarking, JIT (just information system) and selective automation (Jazayeri and Hopper, 1999). It is argued that WCM is a set of fundamental managerial beliefs that transcend its constituent techniques (Jazayeri and Hopper, 1999). WCM is generally broad term but we can include viz. new approach to product quality, JIT product techniques, change in the way the workforce is managed, and flexible approach to customer requirements (Maskell, 1991, pp.4). Hall (1987) has further identified common practices among world-class manufacturing organizations as total quality, JIT, and people involvement. Steudel and Desruelle (1992) identified practices that separate world-class manufacturers from traditional manufacturing organizations-total quality, supplier relationship, employee involvement, lean operations, total productive maintenance, and group technology. We consider 5σ and 6σ that have been classified in this industry in the marketplace. Thus, the concept of 5σ and 6σ process capability means the defect of 233 and 3.4 parts per million or 99.9767% and 99.99966% good respectively. The cost of poor quality depends upon 0 to 15 percent of the sales.
1947
Proceedings of the International Conference on Industrial Engineering and Operations Management Bandung, Indonesia, March 6-8, 2018
B. Industrial Average The traditional literature and empirical evidence suggest that firms in industrial average defined in terms of financial components and consumption of resources. Industrial average lies between world-class manufacturing and non-competitive type industry that focus on involving partial competition. Industrial average is defined as the average of the returns of the stocks in the industry over the designated time frame. They do focus also their financial components (such as liquidity ratio, debt ratio, profitability ratio and market value ratio) of the business to achieve their targets. The financial ratios can be used to compare companies to the industrial average that great way to analyze a company’s strengths and weaknesses. Moreover, the certain figures as gross profit percentage, net profit percentage, and the return of capital employed in industrial average. Industrial average financial ratios are benchmark or comparison tools to help a business gauge its own financial health and performance. If the rate of growth is high, accounting practices which reduce it should be adopted and vice versa. If the six-sigma level 3σ and 4σ fall in this industry, then the organization’s performance is said to be of ‘industrial average’ in the marketplace. Thus, the concept of 3σ and 4σ process capability means the defect of 66807 and 6210 parts per million or 93.3193% and 99.3790% good respectively. The cost of poor quality depends upon 15 to 30 percent of the sales.
C. Non-competitive Industry These types of industries are not involving or determined by rivalry or competition. Some organizations reported an inability to quantify the cost of quality in a non-competitive environment (Kaye and Dyason, 1995). They have non-competitive product lines and the nature of the information being sought is not too sensitive (Spendolini, 1992). They don’t focus on market competition to produce the best quality at lowest price. In this case, the sigma level 1σ and 2σ, then such an organization is classified as ‘non-competitive’ category of the marketplace. Thus, the concept of 1σ and 2σ process capability means the defect of 690000 and 308537 parts per million or 31.0000% and 69.1462% good respectively. The cost of poor quality depends upon 30 to 40 percent for 2σ of the sales and greater than 40 percent for 1σ of the sales. Table 1 represents the sigma level of defects.
Sigma Level Defect Rate (PPM*)
Yield in % Cost of Poor Quality (% of sales)
Competitive Level
6σ 3.4 99.99966 <10% World Class 5σ 233 99.97670 10 to 15% 4σ 6210 99.37900 15 to 20% Industry Average 3σ 66807 93.31930 20 to 30% 2σ 308537 69.14620 30 to 40% Non-competitive 1σ 690000 31.00000 >40%
Table 1: Sigma level of defects (PPM*: Parts per Million). Source: Harry (1998) and Mahajan (2008) In view of the absence of such research on the performance of the process capability indices, therefore, this research was designed to address three research questions: (1) What essential of four process capability indices on the “sigma level” and competitive levels? (2) To identify the firm performance within these three competitive levels at four process capability indices. (3) To what extent, the consequences of these indices?
III. Discussions As seen from the earlier discussion the organization always tries to improve its supplier process, customer expectation, defect rate and design specification. Obviously, the firms aim to achieve the six-sigma goal of 3.4 ppm. A numerical study will present to illustrate how the process capability indices are calculated
1948

Proceedings of the International Conference on Industrial Engineering and Operations Management Bandung, Indonesia, March 6-8, 2018
at various values. From the table 1, we see that world-class manufacturing firms provide efficient and effective way to reduce their product defect rate, increase the yield improvement and reduce the cost of poor quality in order to improve the customers need and customer satisfaction. For the adjustment of process capabilities of six-sigma on the other hand, the performance level of the industry average and non-competitive is lower than world class manufacturing firms. But they try to regulate and improve their processes opportunities through systematic measurement to sustain in the current competitive era. Their ultimate goal is to enhance the firm’s performance.
IV. Conclusions and further scope of the studyWhen the firm levels move from non-competitive to world class, their cost of poor quality and defect rate decreases while increase the yield improvement. The study identifies the theoretical concepts of firm performance within world-class, industry average, and non-competitive industry over the four process capability indices that evaluate the ability of a process to attain within certain limits. The study of Cp, Cpk, Cpm, and Cpmk to construct with the more desirable capability and increasing higher values such as various range less than 1, equal to 1, range between 1-1.5, and 1.5-2 and greater than 2. After getting the results, use the following table below to present the non-conforming parts per million (ppm) for a process corresponding to Cp, Cpk, Cpm, and Cpmk values. We focus on histograms, control charts and probability plots for defect rate and Cp, Cpk, Cpm, and Cpmk and assess properly. Further, the study will focus when the difference between USL and LSL is very high, low and centered (centering and spread of the process variation). We plan to undertake to explore and verify the framework suggested in this study that will also provide a new dimension to the research. Further, it will definitely provide good insights and many contributions; through the findings and the results of this research which we will do in future.
References
Chan, L.K., Cheng, S.W., Spiring, F.A. (1988). A new measure of process capability Cpm. Journal of Quality Technology 20 (3), pp. 162–175.
Greene, A. (1991), “Plant-wide systems: a world class perspective”, Production Inventory Management, Vol. 11 No. 7, pp. 14-15.
Greenwich, M., & Jahr-Schaffrath, B. L. (1995). A process incapability index. International Journal of Quality & Reliability Management, 12(4), pp. 58-71.
Hall, R. W. (1987). Attaining manufacturing excellence: just-in-time, total quality, total people involvement. Irwin Professional Pub.
Harry, M.J. (1998). “Six sigma: a breakthrough strategy for profitability”. Quality Progress, 31 (5), pp. 60–64.
Hayes, R. H., & Pisano, G. P. (1994). Beyond world-class: the new manufacturing strategy. Harvard Business Review, 72(1), pp. 77-86.
Hayes, R. H., & Wheelwright, S. C. (1984). Restoring our competitive edge: competing through manufacturing. New York, John Wiley & Sons.
Hsu, Y. C., Pearn, W. L., & Wu, P. C. (2008). Capability adjustment for gamma processes with mean shift consideration in implementing Six Sigma program. European Journal of Operational Research, 191(2), pp. 517-529.
1949

Proceedings of the International Conference on Industrial Engineering and Operations Management Bandung, Indonesia, March 6-8, 2018
Jazayeri, M., & Hopper, T. (1999). Management accounting within world class manufacturing: a case study. Management Accounting Research, 10(3), pp. 263-301. Kane, V. E. (1986). Process capability indices. Journal of quality technology, 18(1), pp. 41-52. Kaye, M. M., & Dyason, M. D. (1995). “The fifth era”. The TQM Magazine, 7(1), pp. 33-37. Koch, P. N., Yang, R. J., & Gu, L. (2004). Design for six sigma through robust optimization. Structural and Multidisciplinary Optimization, 26(3-4), pp. 235-248. Kotz, S., Lovelace, C.R. (1998). Process Capability Indices in Theory and Practice. Arnold, London, UK. Mahajan, M. S. (2008). “Statistical Quality Control”. Chapter 17, Dhanpat Rai & Co. (P) Ltd. Educational & Technical Publishers, Delhi. Maskell, B. H. (1991). Performance measurement for world class manufacturing: a model for American companies. CRC press. McClusky, B. (2000), “The rise, fall and revival of Six Sigma quality: measuring business excellence”, The Journal of Business Performance Measurement, 4 (2), Second Quarter 2000. Pearn, W. L., & Chen, K. S. (2002). One-sided capability indices C PU and C PL: decision making with sample information. International Journal of Quality & Reliability Management, 19(3), pp. 221-245. Pearn, W.L., Chen, K.S. (1997). Capability indices for non-normal distributions with an application in electrolytic capacitor manufacturing. Microelectronics and Reliability, 37 (12), pp. 1853–1858. Raisinghani, M. S., Ette, H., Pierce, R., Cannon, G., & Daripaly, P. (2005). Six Sigma: concepts, tools, and applications. Industrial management & Data systems, 105(4), pp. 491-505. Rath and Strong Management Consultants (2016), “Six Sigma Consulting”, available at: http://www.rathstrong.com/six-sigma/ (accessed on 15th November, 2016). Sharma, M., Kodali, R. (2008). Development of a framework for manufacturing excellence. Measurement Business Excellence, 12(4), pp. 50–66. Spendolini, M.J. (1992). “The Benchmarking Book”, Amacon, New York, NY. Steudel, H. J., & Desruelle, P. (1992). Manufacturing in the'90s: How to Become a Mean, Lean World-Class Competitor. Van Nostrand Reinhold Company.
BIOGRAPHY
Vimal Kumar is currently working as Assistant Professor at MANIT, Bhopal. He has done his Doctoral degree from the Department of Industrial & Management Engineering, IIT Kanpur, India in the year 2017. He completed his Masters in Supply Chain Management from the Department of Industrial & Management Engineering, IIT Kanpur in the year 2012. He completed his graduation (B.Tech) in Manufacturing Technology in the year 2010 from JSS Academy of Technical Education, Noida. Currently, he is pursuing research in the domain of TQM and Manufacturing Strategy. He has published fourteen articles in reputable international journals and presented nine papers at international conferences. He was invited to serve as session chair for Quality Control & Management at the International Conference on Industrial Engineering & Operations Management (IEOM-2016) at Kuala Lumpur, Malaysia. He is a contributing author in journals including IJPPM, IJQRM, IJPMB, IJPQM, IJBIS,
1950
Proceedings of the International Conference on Industrial Engineering and Operations Management Bandung, Indonesia, March 6-8, 2018
AJOR, The TQM Journal, and Benchmarking: An International Journal, etc. and also a guest reviewer of reputable journal like TQM & Business Excellence, Benchmarking: An International Journal, and JSIT. He is corresponding author and he can be contacted at [email protected].
Pratima Verma is Doctoral Candidate in Industrial & Management Engineering at IIT Kanpur, India. She received her MBA in Finance and Human Resource Management from BBDNITM, Uttar Pradesh Technical University Lucknow, India in the year 2011. She completed her graduation (B.Tech) in Information Technology in the year 2009 from BBNITM, Lucknow. She has one year of experience in teaching. She is currently working in the field of horizontal strategy. She also awarded JRF/SRF in the area of human resource management. She has published eight articles in reputable international journals and presented nine papers at international conferences. She was invited to serve as session chair for Human Factors and Ergonomics Track at the International Conference on Industrial Engineering & Operations Management at Kuala Lumpur, Malaysia. She is a contributing author in journals including IJPMB, IJISE, IJBIS and Benchmarking: An International Journal, etc. She can be contacted at: [email protected] or [email protected].
Vignaesh Muthukumaar is currently working as a Consultant in Decision Analytics at EXL Services, Bengaluru, India. He graduated this year 2017 from the Indian Institute of Technology, Kanpur, India, with a B.Tech in Material Science and Engineering and a Minor in Industrial and Management Engineering. He has international publications to his credit. He can be contacted at: [email protected].
1951