the phenolics of peanut skins and their impact in …
TRANSCRIPT

THE PHENOLICS OF PEANUT SKINS AND THEIR IMPACT
IN PEANUT BUTTER FORMULATIONS
by
YUANYUAN MA
(Under the Direction of Ronald Bruce Pegg)
ABSTRACT
The overall aims of this work were to ascertain the primary phenolic constituents in peanut
skins (PS), and to determine if their antioxidant content and capacities are conserved through
industrial dry-blanching and roasting processes. The first and second studies undertaken revealed
that ground PS incorporation into peanut butters effectively enhances the total phenolics and
fiber contents of the product, and offers product-line diversification while still retaining the
product’s standard of identity. This research will aid the peanut industry via (1) by-product/waste
stream utilization; and (2) diversification of product lines by creating a value-added peanut butter
with potential health beneficial properties. Adding ground PS to peanut butter at 1.25, 2.5, 3.75
and 5.0% (w/w) resulted in a concentration-dependent change in the Commission Internationale
de l’Éclairage L* C* h values. Peanut butters formulated with medium- and dark-roasted PS
showed an increase in hardness, and were generally more adhesive than those without PS or with
dry-blanched PS added. A marked change in spreadability was found with greater than 2.5% PS
fortification. Incorporation of dry-blanched PS, especially at levels below 3.75%, showed the
fewest differences in terms of physical properties of the peanut butters relative to the control.

Importantly, a concentration-dependent increase in the total phenolics content (TPC) was
evident with PS fortification. Dry-blanched PS possessed a TPC of ~166 mg (+)-catechin
equivalents/g extract and yielded peanut butters with a 32, 33 and 38% higher TPC than that for
light-, medium- and dark-roasted skin incorporation on a same mass basis, respectively.
Correspondingly, dry-blanched PS addition at 1.25, 2.5, 3.75 and 5.0% (w/w) resulted in an
increase in the TPC by 86, 357, 533 and 714%, respectively, compared with peanut butters
devoid of PS fortification; the total proanthocyanidins content (TPACs) rose by 633%, 1,933%,
3,500%, and 5,033%, respectively. Normal-phase high-performance liquid chromatography
(NP-HPLC) detection confirmed that the increase in the phenolics content was attributed to the
endogenous PACs from the PS, which were characterized as dimers to nonamers by ionization
mass spectrometry (NP-HPLC/ESI-MS). FRAP values increased correspondingly by 62, 387,
747, and 829%, while H-ORACFL values rose by 53, 247, 382, and 415%, respectively. The
dietary fiber (DF) content of dry-blanched PS was 55%, with 89 to 93% being insoluble fiber.
The third and fourth studies undertaken involved liquid chromatography-electrospray
ionization mass spectrometry (LC-ESI-MSn) characterization of free, as well as soluble-ester and
glycoside-bound phenolic compounds from dry-blanched PS. A large variety of phenolic
compounds, including phenolic acids (hydroxybenzoic acids, hydroxycinnamic acids, and their
esters), stilbenes (trans-resveratrol and trans-piceatannol), flavan-3-ols (e.g., (–)-epicatechin,
(+)-catechin, and their polymers {the proanthocyanidins, PACs}), other flavonoids (e.g.,
isoflavones, flavanols, and flavones) and biflavonoids (e.g., morelloflavone), were identified in
dry-blanched PS by this study. PS provide an abundant and inexpensive source of natural
antioxidants, especially p-coumaroyl species and PACs. All of these studies indicated that
processing is altering the content of the phenolics in PS, but their antioxidant efficacy is retained

in the product.
INDEX WORDS: Peanut Skins (PS), Peanut Industry, Dry-blanching, Roasting, Antioxidants,
Phenolics, Proanthocyanidins (PACs), high-performance liquid
chromatography (HPLC), electrospray ionization mass spectrometry
(ESI-MSn).

THE PHENOLICS OF PEANUT SKINS AND THEIR IMPACT
IN PEANUT BUTTER FORMULATIONS
by
YUANYUAN MA
M.S., University of Kentucky, 2008
A Dissertation Submitted to the Graduate Faculty of the University of Georgia in Partial
Fulfillment of the Requirements for the Degree
DOCTORATE OF PHILOSOPHY
ATHENS, GEORGIA
2014

© 2014
YUANYUAN MA
All Rights Reserved

THE PHENOLICS OF PEANUT SKINS AND THEIR IMPACT
IN PEANUT BUTTER FORMULATIONS
by
YUANYUAN MA
Major Professor:Ronald B. Pegg
Committee: William L. Kerr
Ruthann B. Swanson
Phillip Greenspan
Electronic Version Approved:
Julie Coffield
Interim Dean of the Graduate School
The University of Georgia
August 2014

iv
DEDICATION
I am indebted to my loving parents and husband for their unconditional support and
encouragement during the entire course of my graduate study. Without their care, understanding,
and trust, none of this would be possible. Also, to my beautiful kittens, who bring me laughter,
companion, and emotional support.

v
ACKNOWLEDGEMENTS
I would like to take this opportunity to express my heartfelt gratitude to many people for
helping and supporting me during my research. Thanks and appreciations especially go to my
advisor and mentor, Dr. Ronald B. Pegg, who has guided me through each step of the research
process, inspired my scientific thinking, and offered me financial support. It is such an honor to
do my doctoral degree under his tutelage. Without his encouragement and patience, my academic
career could never go any further. His great understanding and professionalism in regard to
science will affect my career all my life.
I must thank Drs. William L. Kerr, Ruthann B. Swanson, Phillip Greenspan, and James L.
Hargrove for their willingness to serve on my committee as well as their support and
contribution to my curriculum development and dissertation preparation. I would also like to
thank Dr. Dennis R. Phillips from the Department of Chemistry. Thank you for your invaluable
suggestions and technical support. My acknowledgements also extend to Drs. Ryszard
Amarowicz and Agnieszka Kosińska-Cagnazzo of the Division of Food Science, Institute of
Animal Reproduction and Food Research of the Polish Academy of Sciences, Olsztyn, Poland
for their technical assistance.
My many thanks must also go to my loving friends and lab mates for their willingness to
share extensive knowledge of research with me and for their precious friendship. I am especially
thankful to Ms. Vickie Wentzel and Marybeth Kellett for their selfless help during my research
and dissertation writing.

vi
Last but not least, I am indebted to my loving family, to whom I owe my undying
gratitude; thank you for standing by me, through the good times and the bad.
Sincerely,
Yuanyuan Ma

vii
TABLE OF CONTENTS
ACKNOWLEDGEMENTS……………………………………………………………………….v
LIST OF TABLES………………………………………………………………………………..ix
LIST OF FIGURES……………………………………………………………………………....xi
CHAPTER
1 INTRODUCTION……………………………………………………………………….1
2 LITERATURE REVIEW……………………………………………………………….13
3 EFFECT OF PEANUT SKINS INCORPORATION ON THE COLOR, TEXTURE,
AND TOTAL PHENOLICS CONTENT OF PEANUT BUTTERS…………………...70
4 PEANUT SKINS-FORTIFIED PEANUT BUTTERS: EFFECT OF PROCESSING
ON THE PHENOLICS CONTENT, FIBER CONTENT AND ANTIOXIDANT
ACTIVITY……………………………………………………………………………103
5 SEPARATION AND CHARACTERIZATION OF FREE PHENOLIC
COMPOUNDS FROM DRY-BLANCHED PEANUT SKINS BY LIQUID
CHROMATOGRAPHY-ELECTROSPRAY IONIZATION
MASS SPECTROMETRY……………………………………………………………140
6 SEPARATION AND CHARACTERIZATION OF SOLUBLE-ESTER AND
GLYCOSIDE-BOUND PHENOLIC COMPOUNDS FROM DRY-BLANCHED
PEANUT SKINS BY LIQUID CHROMATOGRAPHY-ELECTROSPRAY
IONIZATION MASS SPECTROMETRY……………………………………………202

viii
7 SUMMARY AND CONCLUSIONS…………………………………………………263
INDEX OF ABBREVIATIONS………………………………………………………………..265

ix
LIST OF TABLES
Table 2.1 Classification of major dietary phenolics and related food sources……………….57
Table 2.2 Basic carbon skeletons and structures of selected phenolic compounds…………..58
Table 3.1 Peanut butter formulations…………………………………………………………96
Table 3.2 Color analysis of formulated peanut butters……………………………………….97
Table 3.3 Textural properties of formulated peanut butters…………………………………..98
Table 3.4 Firmness and spreadability of formulated peanut butters………………………….99
Table 4.1 Total phenolics contents (TPCs) of peanut skins (PS) and PS-fortified peanut
butters (PB), expressed as (+)-catechin equivalents/g PS of 100-g peanut
butter……………………………………………………………………………...133
Table 4.2 Dietary fiber (DF) content (i.e., total, insoluble, and soluble, g/100 g) of peanut skins
(PS) and PS-fortified peanut butters…………………………………....................134
Table 4.3 Proanthocyanidins (PACs) observed in peanut skins (PS) and dry-blanched (DB)
PS-fortified peanut butters (0% skins vs 5% DB) based on NP-HPLC-ESI-MS
analysis………………………………………………………………………........135
Table 5.1 Tentative identification of phenolic compounds in dry-blanched peanut skins (PS) by
C18 RP-HPLC-ESI-MSn…………………………………………………………..175
Table 5.2 Tentative identification of proanthocyanidins (PACs) in dry-blanched peanut skins
(PS) by HILIC-ESI-MS/MS……………………………………………………...182

x
Table 5.3 Content of selected phenolics quantified in dry-blanched peanut skins (PS) by C18
RP-HPLC…………………………………………………………………………186
Table 5.4 Quantification of proanthocyanidin (PAC) compounds in dry-blanched peanut skins
(PS) by HILIC……………………………………………………………………187
Table 6.1 Tentative identification of phenolic compounds in dry-blanched peanut skins (PS)
crude extracts by C18 RP-HPLC-ESI-MS/MS…………………………………….238
Table 6.2 Tentative identification of ester-bound phenolic compounds in dry-blanched peanut
skins (PS) by C18 RP-HPLC-ESI-MS/MS………………………………………...240
Table 6.3 Tentative identification of glycoside-bound phenolic compounds in dry-blanched
peanut skins (PS) by C18 RP-HPLC-ESI-MSn…………………………………….243
Table 6.4 Content of selected phenolics quantified in dry-blanched peanut skins (PS) by C18
RP-HPLC…………………………………………………………………............249
xi
LIST OF FIGURES
Figure 2.1 Biosynthesis of phenolic compounds: (A) Biosynthesis of phenylpropanoids and
phenolic acids and (B) Biosynthesis of flavonoids (Adapted from Shahidi, 2000).
Abbreviations are as follows: PAL= Phenylalanine ammonia lyase; TAL = Tyrosine
ammonialyase……………………………………………………...........................60
Figure 2.2 Chemical structures of flavan-3-ols………………………………………………..63
Figure 2.3 Linkages found in proanthocyanidins (PACs): A-type bond with both (C4→C8) and
(C2→O→C7) linkages or (C4→C6) and (C2→O→C7) linkages, B-type bond
which can be (C4→C8) or (C4→C6) linkage……………………………………..64
Figure 2.4 Proposed mechanisms for (A) Dimethylaminocinnamaldehyde (DMAC) assay
(Adapted from Wallace & Giusti, 2010), (B) Oxygen radical absorbance capacity
(ORACFL) assay, and (C) Ferric Reducing Antioxidant Power (FRAP) assay
(Adapted from Huang, Ou, & Prior, 2005). Abbreviations are as follows: ArOH,
antioxidant; ArO•, phenoxyl radical; ROO•, peroxyl radical; ROOH,
hydroperoxide……………………...........................................................................65
Figure 2.5 The flowchart of total dietary fiber (TDF) assay. Adapted from AOAC Official
Method 991.43 (AOAC, 2005).……………………………....................................69
Figure 3.1 Particle size distribution histograms of ground peanut skins (PS). (A) on left, 45.8 g
of dry blanched PS ground with 195 g of sugar & on right, 91.6 g of dry blanched
PS ground with 195 g of sugar; (B) on left, 51.4 g of light roasted PS ground with

xii
195 g of sugar & on right, 102.8 g of light roasted PS ground with 195 g of sugar;
and (C) on left, 51.3 g of dark roasted PS ground with 195 g of sugar & on right,
102.6 g of dark roasted PS ground with 195 g of sugar…………………………..101
Figure 3.2 Total phenolics content (TPC) of peanut skins (A) and peanut butters (B). Means (n =
3) without a common letter differ significantly (P < 0.05)………………………...102
Figure 4.1 Total proanthocyanidins (TPAC) contents (A), ferric reducing antioxidant power
(FRAP) values (B), and hydrophilic-oxygen radical absorbance capacity
(H-ORACFL) values (C) of peanut skins (PS). Abbreviations for the type of PS
examined are as follows: DB, dry-blanched; LR, light-roasted; MR,
medium-roasted; and DR, dark-roasted. Means (n=3) without a common letter
differ significantly (P < 0.05) according to a one-way ANOVA and Tukey’s
studentized range test……………………………………………………………137
Figure 4.2 Total proanthocyanidins (TPAC) contents (A), ferric reducing antioxidant power
(FRAP) values (B), and hydrophilic-oxygen radical absorbance capacity
(H-ORACFL) values (C) of peanut skins (PS)-fortified peanut butters. A set of
clustered bars on the y-axis depicts the concentration for the identified PS type (i.e.,
DB, LR, MR, or DR); within each cluster, PS-fortification levels increased (i.e., 1.25,
2.5, 3.75, 5.0%) from the lowest to highest bar. The formulated peanut butter sample
(0% PS) depicted as a single bar was the control. See the caption of Figure 4.1 for
details concerning the abbreviations employed and statistical treatment of the
data..........................................................................................................................138
Figure 4.3 Positive linear correlations between total phenolics contents (TPCs, A),
hydrophilic-oxygen radical absorbance capacity (H-ORACFL) values (B), and total

xiii
dietary fiber (TDF) contents (C) to peanut skins (PS)
incorporation…………….......................................................................................139
Figure 5.1 Structures of monomeric phenolic aglycones found in dry-blanched peanut skins
(PS)……………………………………………………………………………….189
Figure 5.2 Linkages found in proanthocyanidins (PACs) and quinone methide (QM) cleavage
of dimers to tetramers to identify the connection sequence. E represents the
extension units and T the terminal unit of the PAC oligomers. A-type bond with
both (C4→C8) and (C2→O→C7) linkages or (C4→C6) and (C2→O→C7)
linkages, B-type bond which can be (C4→C8) or (C4→C6)
linkage……………………………………………………………………………192
Figure 5.3 Tentative structures and fragmentation schemes (A is MS2 and B is MS3) of
p-Coumaroyltartaric acid ester-linked nictotinoyl (R-18, m/z 400); Formononentin
(R-49, m/z 545); trans-Resveratrol (R-62, m/z 505); Piceid (R-63, m/z 667); and a
second p-Coumaroyl moiety (R-65, m/z 441). See Table 5.1 for formal
designations……………………………………………………………………….195
Figure 5.4 Tentative structures and fragmentation scheme of (A) PAC dimer
[(E)C(C4)→Luteolin or Kaempferol (C8) or (C6)] (R-48 and R-50, m/z 573); (B)
Prodelphinidin A-type dimer [(E)C→A→(E)GC] (R-28, m/z 591); and (C)
Prorobinetidin A-type dimer [(E)C→A→C-methyl (Epi)robinetinidol] (R-56, m/z
589). See Table 5.1 for formal designations……………………………………...196
Figure 5.5 Tentative structures and fragmentation scheme of (A) Biflavonoid
[Eriodictyol→C-methyl (Epi)robinetinidol] (R-75, m/z 587); (B) Biflavonoid
[Homoeriodictyol (C3)→Eriodictyol (C8)] (R-76, m/z 587); and (C) Morelloflavone

xiv
[Naringenin (C3)→Luteolin (C8)] (R-82, m/z 555). See Table 5.1 for formal
designations……………………………………………………….........................199
Figure 6.1 Structures of monomeric phenolic aglycones released from soluble-ester and
glycoside in dry-blanched peanut skins (PS)……………………………………..251
Figure 6.2 Tentative structures and fragmentation schemes of (A) Prodelphinidin A-type dimer
[(E)C→A→6-O-methyl (E)GC] (F-2-18, m/z 605); (B) Prodelphinidin A-type trimer
[(E)GC→A→(E)C→A→(E)C] (F-2-34, m/z 877); and (C) Prodelphinidin A-type
tetramer [(E)C→A→(E)GC→A→(E)C→A→(E)C] (F-2-48, m/z 1163). See Table
6.3 for formal designations………………………………………………………..254
Figure 6.3 Tentative structures and fragmentation schemes of (A) PAC B-type dimer
[(E)C→B→(E)C→Phloroglucinol] (F-3-13, 16, and 19, m/z 701); (B) PAC A-type
dimer [(E)C→A→(E)C→Phloroglucinol] (F-3-10, 12, 15, 17, 18, 20, 25, 26, and
38, m/z 699); and (C) PAC A-type dimer [(E)C→A→(E)Afz→Phloroglucinol]
(F-3-34 and 43, m/z 683). See Table 6.3 for formal designations………………..257
Figure 6.4 Tentative structures and fragmentation schemes of (A) PAC A-type dimer
[(E)C→A→a novel Flavan-3-ol] (F-3-39, m/z 589); (B) Prorobinetidin A-type dimer
[(E)C→A→C-methyl (Epi)robinetinidol] (F-3-56, 62, 64 and 68, m/z 589); and (C)
Biflavonoid [Eriodictyol→C-methyl (Epi)robinetinidol] (F-3-48, 57 and 67, m/z
587). See Table 6.3 for formal designations……………………………………...260
1
CHAPTER 1
INTRODUCTION
1.1 Health Benefits of Peanuts
Health benefits associated with the consumption of peanuts have been well documented,
notably the possible prevention of cancer (Awad, Chan, Downie, & Fink, 2000), coronary heart
disease (Kris-Etherton, Hu, Ros, & Sabaté, 2008), and type-II diabetes (Jiang et al., 2002). The
cardio-protective effect of nuts, including peanuts, has been demonstrated consistently from
epidemiological studies (Hu & Stampfer, 1999; Kelly & Sabaté, 2006). One such study showed
that women eating moderate (1-4 servings/week) and high (≥ 5 servings/week) amounts of nuts
and/or peanut butter revealed their risk of CHD-related death by 18 and 19%, respectively (Kelly
& Sabaté, 2006). The fatty acid profiles of peanuts have largely contributed to these benefits;
peanuts are known to possess zero-trans fatty acids (Sanders, 2001), while being rich in
monounsaturated (MUFA) and polyunsaturated fatty acids (PUFA) (Mercer, Wynne, & Young,
1990), as well as phytosterols (Awad, Chan, Downie, & Fink, 2000). Furthermore, other
beneficial functional nutrients inherent to peanuts include vitamin E, L-arginine, and soluble- and
insoluble-fiber, as well as water- and lipid-soluble phenolic antioxidants (Kris-Etherton et al.,
1999; Isanga & Zhang, 2007); these may act synergistically with the numerous protective
bioactives, truly making the peanut a desirable plant food (Kris-Etherton, Hu, Ros, & Sabaté,
2008). In 2003, the U.S. Food and Drug Administration affirmed a qualified health claim for

2
selected tree nuts and peanut consumption concluding that there was sufficient evidence that
habitual consumption of these would reduce the risk of coronary heart disease (FDA, 2003).
1.2 Peanut Production
As demonstrated by George Washington Carver more than a century ago, peanuts (Arachis
hypogaea L.) are a valuable cash crop to the southern United States. The major peanut-producing
states can be divided into three regions, namely the Southwest (Texas and Oklahoma), the
Southeast (Alabama, Georgia, and Florida), and the Virginia/Carolina region (Virginia, North
Carolina, and South Carolina). Revenue generated from the peanut crop in the United States
alone has averaged $1 billion annually from 1996 to 2001 (Dohlman, Young, Hoffman, &
Mcbride, 2004). Peanuts are consumed in many parts of the world with China, India, and the
United States accounting for roughly two-thirds of the world’s peanut production (USDA 2011).
While in many countries the largest portion of the crop is destined for oil production, the major
products fabricated from peanuts in the United States are peanut butters, salted peanuts,
confections, and roasted peanuts in-the-shell (Carley, 1983). Peanut butter is considered the most
important peanut-based product, with slightly more than half of the U.S. crop used for its
manufacture (Woodroof, 1983). The volume of edible peanuts utilized for peanut butter
significantly increased from 400 million pounds in the early 1950s (Woodroof, 1983) to over
1,000 million pounds in 2008 with steady growth through 2011 for 1,200 million pounds (USDA
2008-2009, USDA 2008-2012). These values reflect over 60% of the total edible peanut usage in
the United States.

3
1.3 Manufacture and Uses of Peanut Butter
Peanut butter is relatively simple to manufacture: it involves the steps of shelling, dry
roasting, blanching, and grinding the peanuts into a paste (Woodroof, 1983). Shelled peanuts,
generally from Runner varieties, are first subjected to a uniform roasting to develop the
characteristic peanut flavor. The generated flavor and color characteristics will directly impact
the palatability of the resultant peanut butter. After a quick cooling, peanut skins (PS) are
removed via dry blanching before the meats are ground to the desired texture (i.e., smooth or
chunky formulation). Additional ingredients, such as salt, sugar, and stabilizer, may be added in
order to improve consumer appeal. Stabilizers (i.e., hydrogenated cottonseed, canola, soybean,
palm oils, or a mixture thereof) help to prevent the separation of the oils from the solid fractions.
In the United States, the FDA has established a legal standard of identity (21 CFR §164.150) in
the Code of Federal Regulations: it states that for a product to be called ‘peanut butter,’ it must
contain no less than 90% peanuts by weight; otherwise, it will be referred to as a peanut spread
(Merrill & Collier, 1974; FDA 2009). The remaining 10% may consist of salt, sweetener for the
enhancement of flavor, emulsifier and/or stabilizer.
The profile of oil and protein constituents in peanut kernels makes peanut butter a highly
nutritious end-product (Knauft, Moore, & Gorbet, 1993; Andersen, Hill, Gorbet, & Brodbeck,
1998), especially when consumed in a sandwich or on crackers where the wheat flour of bread
(i.e., grain source) complements the limiting amino acids of the peanuts. The appealing flavor,
convenience of use, and excellent shelf-life of peanut butter contribute greatly to its popularity.
According to the American Peanut Council, peanut butter ranks as one of the favorite foods of
American households (Jolly et al., 2005). Owing to both its nutrient profile and palatability,
peanut butter is nutritious for growing children; it is often taken to schools for lunch and has

4
been formulated in other lunch-based foodstuffs (Woodroof, 1983).
1.4 Peanut Skins (PS) Production and their Phenolic/Dietary Fiber (DF) Profile
A major by-product of the peanut industry is the skins. Most skins are dumped into landfills,
as only a small quantity is added to animal feed (Sobolev & Cole 2004). In 1999/2000, over
750,000 tons of PS were generated worldwide based on an estimated 29.1 million tons
production of peanuts. The red skins of peanuts comprise 2.0 to 3.5 weight percent of the kernels.
In the United States, the total volume of commercially processed shelled edible-grade peanuts
used in primary products was roughly 2,000 million pounds during 2011 (USDA 2010–2012);
hence, 40 to 70 million pounds of PS were generated.
PS are only now being recognized as being extremely rich in polyphenols, and therefore as
having potential as a functional food ingredient. Nepote, Grosso, and Guzmán (2002) reported a
content of about 159 mg total phenolics/g defatted dry skin, which had a marked antioxidant
activity, as demonstrated by its capacity to inhibit oxidation of sunflower oil. A study conducted
by Yu, Ahmedna, and Goktepe (2005) revealed that the phenolics from PS are abundant not only
in the quantity but also in the variety of phenolics, which primarily include phenolic acids (e.g.,
caffeic, chlorogenic, ferulic, and coumaric acids), flavonoids {e.g., (epi)catechins and
epigallocatechin (EGC), catechin gallate (CG), and epicatechin gallate (ECG)}, and stilbene (e.g.,
trans-resveratrol). Free phenolic acids are not the predominant phenolic composition in PS (Yu,
Ahmedna, Goktepe, & Dai, 2006) but proanthocyanidins (PACs) comprised 17% weight of PS
(Karchesy & Hemingway, 1986). Because PACs are polymers of flavonoids, their phenolic
nature makes them excellent antioxidant agents. Six A-type procyanidin dimers identified in PS
(Lou et al., 1999) were found to inhibit the inflammatory pathway mediated by

5
hyaluronidase-induced release of histamine. Further study by Lou et al. (2004) led to the
isolation of five oligomeric PACs from the water-soluble fraction of PS with potential
free-radical scavenging activity. Although A-type linkages are much more abundant, both A- and
B-type PACs exist in PS. The degree of polymerization (DP) identified in PS was up to 12 bonds
by A-type linkages; whereas, B-type structures were detected with a DP of up to only six
(Monagas et al., 2009).
PS are also rich in dietary fiber (DF). The total DF comprises ~45% weight of roasted PS
with only 2.2% as soluble fiber (Shimizu-Ibuka et al., 2009). A high daily intake of DF helps
lower both blood pressure and cholesterol levels, resulting in the reduced risk of coronary heart
disease, stroke, hypertension, diabetes and obesity (Anderson et al., 2009). Unfortunately, the
average fiber consumption amongst adults in the U.S. is ~15 g a day instead of the recommended
25 to 30 g. Polyphenols and DF are two well-documented dietary factors in the prevention of
chronic diseases but are usually addressed as separate compounds, acting independently in the
disease prevention. One study conducted by Saura-Calixto (2011) demonstrated a synergistic
function of DF and dietary antioxidants, mainly in the creation of an antioxidant environment in
the colon.
1.5 The Effect of Processing on Phenolics Content of Peanut Skins (PS)
Phenolic compounds are secondary metabolites in plants and they generally concentrate in
the outer layers such as the peel, shell, and hull to protect inner matter. A large number of
intrinsic and extrinsic factors greatly influence the types and levels of phenolics in plants; these
include genetic types, environmental conditions, germination, ripening, processing, and storage
(Bravo, 1998). Mild heat treatment was able to break some of the covalent bounds of phenolic

6
constituents, notably phenolic acids, with insoluble polymers (Peleg, Naim, Rouseff, & Zehavi,
1991) and other cell-wall components such as arabinoxylans (Hartley, Morrison, Himmelsbach,
& Borneman, 1990). This liberated low-molecular-weight antioxidant compounds from the
repeating subunits of high-molecular-weight polymers (Jeong et al., 2004). Lee et al. (2006)
reported that after heat treatment at 150 °C for 60 min, the TPC value of peanut hulls increased
from 73 to 90 μM tannic acid equivalents. PS roasted at 175 °C for 5 min were found to contain
a higher TPC than raw PS, especially when recovered by aqueous ethanolic extraction (Yu,
Ahmedna, & Goktepe, 2005).
1.6 PS Fiber Content and Utilization as Dietary Fiber (DF)
Little information is currently available regarding the DF content in PS. Shimizu-Ibuka et al.
(2009) studied the hypocholesterolemic effect of PS whereby they used a commercial roasted PS
that contained ~45% of total DF with only 2.2% as soluble DF. As early as 1981, Collins and
Post explored the use of peanut hull flour as a potential source of DF. The flour was prepared
from either Virginia- or Runner-type peanuts, containing ~ 47% crude fiber and relatively large
amounts of cellulose, hemi-cellulose, and lignin. Collins, Kalantari, and Post (1982) developed a
series of wheat breads containing 0, 4 or 8% peanut hull flour in an attempt to increase the DF
content. Correspondingly, the neutral detergent fiber content of the breads was increased from 4
to 6.7%. Breads containing 4% peanut hull flour were more acceptable and thus, more deemed a
potential source of DF. Similarly, the sensory evaluation performed by Sanders et al. (2013)
indicated a good acceptability of PS-formulated peanut butters, especially when incorporated at
levels below 3.75%. Therefore PS, a major by-product of the peanut industry, have a potential
utilization as a source of DF.
7
1.7 Significance of PS-fortified Peanut Butters
An increased awareness of the potential role of dietary antioxidants and fiber in health
promotion and disease prevention has led to high demand for antioxidant- and fiber-enriched
functional foods. PS are a concentrated source of DF and phenolics; hence, their incorporation
into a variety of foods effectively enhances the fiber content and antioxidant capacity of the
product in question, while providing an inexpensive and abundant source of such dietary
bioactives. Incorporating PS into different food systems would maximize the availability of
antioxidants and fiber to consumers. Despite the tremendous potential benefits found in PS as an
alternative source of antioxidants and DF, the utilization of PS as a functional food ingredient in
value-added products is not well developed.
1.8 Research Objectives
The overall objective of the research was to examine and expand on the utilization of PS as a
functional food ingredient. My studies focused on three main areas: (1) the effect of PS
incorporation on the color, texture, and total phenolics content of peanut butters; (2) the effect of
processing on the phenolics content, fiber content and antioxidant activity of PS and resultant
peanut butters; and (3) the identification of phenolics profiles in dry-blanched PS. The specific
objectives of my research were to …
1) assess the effect of PS incorporation on the physical attributes (color, texture and
spreadability) and total phenolics content (TPC) of the finished peanut butters compared to that
void of PS (Project I);
2) validate and investigate the processing on the total phenolics content (TPC), PACs content,
fiber content, and antioxidant activity of PS and PS-fortified peanut butters. (Project II); and

8
3) determine the phenolics profiles in dry-blanched (DB) PS by combination of
high-performance liquid chromatography (HPLC) and mass spectrometry (MS) (Project III).
Normal phase (NP)-HPLC-MS2 was employed to determine the PACs profile in DB PS.
References
Anderson, J. W.; Baird, P.; Davis, R. H. Jr.; Ferreri, S.; Knudtson, M.; Koraym, A.; Waters, V.;
Williams, C. L. Health benefits of dietary fiber. Nutr. Rev. 2009, 67, 188–205.
Andersen, P. C.; Hill, K.; Gorbet, D. W.; Brodbeck, B. V. Fatty acid and amino acid profiles of
selected peanut cultivars and breeding lines. J. Food Compos. Anal. 1998, 11, 100–111.
Awad, A. B.; Chan, K. C.; Downie, A. C.; Fink, C. S. Peanuts as a source of B-sitosterol, a sterol
with anticancer properties. Nutr. Cancer. 2000, 36, 238–241.
Bravo, L. Polyphenols: chemistry, dietary sources, metabolism, and nutritional significance. Nutr.
Rev. 1998, 56, 317–333.
Carley, D. H. Production and marketing of peanuts in the United States. In Peanuts: Production,
Processing, Products, 3rd ed.; Woodroof, J. G., Ed.; AVI Publishing Company, Inc.: Westport,
CT, 1983; pp. 19–32.
Collins, J. L.; Kalantari, S. M.; Post, A. R. Peanut hull flour as a dietary fiber in wheat bread. J.
Food Sci. 1982, 47, 1899–1902, 1920.
Collins, J. L.; Post, A. R. Peanut hull flour as a potential source of dietary fiber. J. Food Sci.
1981, 46, 445–448, 451.
Dohlman, E.; Young, E.; Hoffman, L.; Mcbride, W. U.S. Peanut sector adapts to major policy
changes. Amber Waves. 2004, 2, 31–37.

9
Hartley, R. D.; Morrison, W. H. III; Himmelsbach, D. S.; Borneman, W. S. Cross-linking of cell
wall phenolic arabinoxylans in graminaceous plants. Phytochemistry. 1990, 29, 3701–3709.
Hu, F. B.; Stampfer, M. J. Nut consumption and risk of coronary heart disease: a review of
epidemiologic evidence. Curr Atherosclerosis Rep. 2007, 1, 204–209.
Isanga, J.; Zhang, G.-N. Biologically active components and nutraceuticals in peanuts and related
products. Food Rev Int. 2007, 23, 123–140.
Jeong, S-M.; Kim, S-Y.; Kim, D-R.; Jo, S-C.; Nam, K. C.; Ahn, D. U.; Lee, S-C. Effect of heat
treatment on the antioxidant activity of extracts from citrus peels. J. Agric. Food Chem. 2004,
52, 3389–3393.
Jiang, R.; Manson, J. E.; Stampfer, M. J.; Liu, S.; Willett, W. C.; Hu, F. B. Nut and peanut butter
consumption and risk of type 2 diabetes in women. J. Amer. Med. Assoc. 2002, 288,
2554–2560.
Jolly, C. M.; Hinds; M. J., Lindo; P., Ligeon, C.; Weiss, H. Consumers acceptance of peanut
butter and products containing peanut butter in two southeastern states in the U.S. Journal of
International Food and Agribusiness Marketing. 2005, 17, 87–105.
Kelly, J. H.; Sabaté J. Nuts and coronary heart disease: an epidemiological perspective. Br J Nutr.
2006, 96, S61–S67.
Knauft, D. A.; Moore, K. M.; Gorbet, D.W. Further studies on the inheritance of fatty acid
composition in peanut. Pean Sci. 1993, 20, 74–76.
Kris-Etherton, P. M.; Hu, F. B.; Ros, E.; Sabaté, J. The role of tree nuts and peanuts in the
prevention of coronary heart disease: multiple potential mechanisms. J. Nutr. 2008, 138,
1746S–1751S.
10
Kris-Etherton, P. M.; Yu-Poth, S.; Sabaté J.; Ratcliffe, H. E.; Zhao, G.; Etherton, T. D. Nuts and
their bioactive constituents: effects on serum lipids and other factors that affect disease risk.
Am. J. clin. Nutr. 1999, 70, 504S–511S.
Lee, S-C.; Jeong, S-M.; Kim, S-Y.; Park, H-R.; Nam, K. C.; Ahn, D. U. Effect of far-infrared
radiation and heat treatment on the antioxidant activity of water extracts from peanut hulls.
Food Chem. 2006, 94, 489–493.
Lou, H.; Yamazaki, Y.; Sasaki, T.; Uchida, M.; Tanaka, H.; Oka, S. A-type procyanidins from
peanut skin. Phytochemistry. 1999, 51, 297–308.
Lou, H., Yuan, H., Ma, B., Ren, D., Ji, M., & Oka, S. Polyphenols from peanut skins and their
free radical-scavenging effects. Phytochemistry. 2004, 65, 2391–2399.
Mercer, L. C.; Wynne, J. C.; Young, C. T. Inheritance of fatty acid content in peanut oil. Pean Sci.
1990, 17, 17–21.
Merrill, R. A.; Collier, E. M. JR. “Like mother used to make”: an analysis of FDA food standards
of identity. Columbia Law Rev. 1974, 74, 561–621.
Nepote, V., Grosso, N. R., & Guzmán, C. A. Extraction of antioxidant components from peanut
skins. Grasas Aceites. 2002, 54, 391–395.
Peleg, H., Naim, M., Rouseff, R. L., & Zehavi, U. Distribution of bound and free phenolic acids
in oranges (Citrus sinensis) and grapefruits (Citrus paradisi). J. Sci. Food Agr. 1991, 57,
417–426.
Sanders, C. T., III; DeMasie, C. L.; Kerr, W. L.; Hargrove, J. L.; Pegg, R. B.; Swanson, R. B.
Peanut skins-fortified peanut butters: effects on consumer acceptability and quality
characteristics. J. Food Sci. 2013, submitted.

11
Sanders, T. H. Non-detectable levels of trans-fatty acids in peanut butter. J. Agric. Food Chem.
2001, 48, 1243–1246.
Saura-Calixto, F. Dietary fiber as a carrier of dietary antioxidants: an essential physiological
function. J. Agric. Food Chem. 2011, 59, 43–49.
Shimizu-Ibuka, A.; Udagawa, H.; Kobayashi-Hattori, K.; Mura, K.; Tokue, C.; Takita, T.; Arai, S.
Hypocholesterolemic effect of peanut skin and its fractions: a case record of rats fed on a
high-cholesterol diet. Biosci. Biotech. Biochem. 2009, 73, 205–208.
Sobolev, V. S.; Cole, R. J. Note on utilisation of peanut seed testa. J. Sci. Food Agr. 2004, 84,
105–111.
United States Department of Agriculture (USDA). 2008–2012. Peanut stocks and processing.
National Agricultural Statistics Service, Washington, DC.
United States Department of Agriculture (USDA). 2011. Peanut area, yield, and production. In
World Agricultural Production. Foreign Agricultural Service, Washington, DC.
United States Food and Drug Administration (FDA). 2009. Food standard innovations: peanut
butter’s sticky standard. http://www.fda.gov/AboutFDA/WhatWeDo/History/Product
Regulation/ucm132911.htm (accessed July 20th, 2014).
United States Food and Drug Administration (FDA). 2003. Qualified health claims: letter of
enforcement discretion – nuts and coronary heart disease. (Docket No 02P-0505).
http://www.fda.gov/food/ingredientspackaginglabeling/labelingnutrition/ucm072926.htm
(accessed July 20th, 2014)
Woodroof, J. G. Peanut butter. In Peanuts: Production, Processing, Products, 3rd Ed.; Woodroof,
J. G., Ed.; AVI Publishing Company, Inc.: Westport, CT, 1983; pp. 181–227.

12
Yu, J.; Ahmedna, M.; Goktepe, I. Effects of processing methods and extraction solvents on
concentration and antioxidant activity of peanut skin phenolics. Food Chem. 2005, 90,
199–206.
Yu, J.; Ahmedna, M.; Goktepe, I.; Dai, J. Peanut skin procyanidins: composition and antioxidant
activities as affected by processing. J. Food Compos. Anal. 2006, 19, 364–371.

13
CHAPTER 2
LITERATURE REVIEW
2.1 Oxidation and Health Problems
2.1.1 Reactive Oxygen Species and the Human Body
Reactive oxygen species (ROS) comprise two main categories: free radicals and non-radical
derivatives (Dhalla, Temsah, & Netticadan, 2000). Free radicals, e.g., •OH and O2•–, are highly
reactive species due to the presence of one or more unpaired electrons. Non-radical derivatives,
e.g., H2O2 and HOCl, possess no unpaired electrons but as the name suggests, they are derived
from a radical. They enter the oxidation chain reactions by acting as an activator or precursor of
radicals and other highly oxidative molecules, such as singlet oxygen (1O2). ROS can be
desirable when produced in low concentrations. For example, ROS are involved in the
phagocytosis of macrophages to combat pathogens and can serve as important physiological
signals to modulate the functions of cells (Forman & Torres, 2002; Finkel, 2011). Studies have
found that instead of stochastic generation by cellular metabolism, ROS are synthesized
purposefully by cells as secondary messengers to activate signaling pathways mediated by
proinflammatory response and growth factors (Hensley, Robinson, Gabbita, & Salsman, 2000;
Winterbourn & Hampton, 2008; Finkel, 2011).
14
As a means of regulating those signaling messengers and protecting cells from oxidative
damage, the human body has both intracellular and extracellular mechanisms that can be
enzymatic or non-enzymatic nature (Finkel, 2011; Birben et al., 2012). For instance, superoxide
dismutase (SOD) (an enzyme involved in O2•- dismutation to H2O2), catalase, and glutathione
peroxidase (enzymes that detoxify H2O2) are dominant intracellular antioxidant enzymes.
α-Tocopherol and ascorbic acid are non-enzymatic antioxidants acting as intracellular and
extracellular radical scavengers. Additionally, they are synergic antioxidants, as ascorbic acid can
regenerate α-tocopherol radicals to α-tocopherol (Flora, 2009).
2.1.2 Oxidative Stress and Diseases
The human body’s antioxidant defense systems can be quite fragile, as they depend on a
balance between oxidative stress and antioxidant defense optimums. When oxidation stress is too
great, oxidation occurs. This is commonly caused by overproduction of ROS or a depleted
antioxidant reserve. Oxidative stress broadly refers to an imbalance where generated ROS cannot
be efficiently eliminated by the body’s antioxidant defense system (Birben et al., 2012).
Harman et al. (1956) first proposed the radical theory of aging in which aging and
degenerative diseases were gradually-established consequences resulting from oxidative
impairment of cell constituents and connective tissues. Since then, oxidative damage in
development of aging and many other pathological conditions have been extensively studied.
Growing evidence suggests that ROS-induced oxidative stresses are implicated in oxidative
modification of proteins, lipids and nucleic acids, alterations of cell signaling pathways and
redox conditions. Consequently, these change are responsible for cell injury or death (Dhalla,
Temsah, & Netticadan, 2000; Hensley, Robinson, Gabbita, & Salsman, 2000; Waris & Ahsan,

15
2006; Birben et al., 2012). These chronic impairments in cells and biomolecules continue to a
point where various degenerative conditions and diseases start to manifest.
Although the exact mechanisms involved in ROS-mediated chronic degenerations are not
fully understood, a positive association between oxidative damage and disease developments has
been consistently demonstrated. ROS-induced oxidative stress has been shown to be actively
involved in a variety of human diseases and chronic degeneration. These include cancer (Waris
& Ahsan, 2006; Kryston, Georgiev, Pissis, & Georgakilas, 2011), cardiovascular diseases
(Dhalla, Temsah, & Netticadan, 2000; Gerienling & Fitzgerald, 2003a,b), neurodegenerative
diseases (Jomova, Vondrakova, Lawson, & Valko, 2010), diabetes (Rains & Jain, 2011), and
ageing (Cencioni et al., 2013). Mitochondrial oxidative stress, which is characterized by a
pro-oxidative shift in the thiol-disulfide redox state and impaired glucose tolerance, resulting in
elevated ROS production is seen in diabetes and cancer (Waris & Ahsan, 2006; Pala & Gurkan,
2008). Some diseases are associated with “inflammatory oxidative conditions,” which are
characterized by enhanced activity of either NADH/NADPH oxidase and/or xanthine
oxidase-induced generation of ROS (Dhalla, Temsah, & Netticadan, 2000; Waris & Ahsan, 2006;
Pala & Gurkan, 2008). The excessively stimulated activity of NADH/NADPH oxidase by
cytokines and other factors can lead to atherosclerosis and chronic inflammation. Overproduction
of ROS induced by xanthine oxidase can cause ischemia-reperfusion injury. Ageing and
neurodegenerative diseases are mainly attributed to ROS-induced lipid peroxidation, DNA
damage, and protein oxidation (Waris & Ahsan, 2006; Pala & Gurkan, 2008; Jomova,
Vondrakova, Lawson, & Valko, 2010; Cencioni et al., 2013).

16
2.2 ROS-induced Lipid and Protein Oxidation in Foods
Because animals and plants are the raw materials of foodstuffs, the mechanisms of oxidation
in these raw materials are the sources of food oxidation. Under physiological conditions, animal
and plant tissues possess endogenous antioxidant defenses; however in foods, these protective
systems are depleted and oxidation processes can begin to take place. Excessive oxidation in
food leads to a deterioration in food quality and can generate off-odors, off-flavors,
discolorations and loss of nutrients. The production of oxidation endproducts, together with a
decreased nutritional value and antioxidant content, might ultimately impair the health of
consumers, resulting in disrupted antioxidant defenses in the body and an increased risk of
oxidative stress-induced diseases (Kołakowska & Bartosz, 2014).
2.2.1 Lipid Oxidation
Amongst all types of biological molecules vulnerable to ROS attack, including proteins,
carbohydrates, and nucleic acids, the initiation of the oxidation process in lipids requires a low
energy barrier. Secondary products of lipid oxidation cannot only deplete endogenous
antioxidant systems, but also interact with proteins and nucleic acids. During lipid oxidation, for
example, various carbonyl compounds are generated, such as 4-hydroxynonenal, malonaldehyde,
and other aldehydic scission products, which can modify the amino groups of proteins, enzymes,
and DNA by intermolecular crosslinking (Frankel, 1984; Kołakowska & Bartosz, 2014).
Unsaturated fatty acids in food are most susceptible to oxidative attack leading to off-flavor
generation (Frankel, 1984). Typically, free radical-mediated lipid oxidation is a self-catalytic
chain reaction with the following three main steps (Frankel, 1984; Sevanian & Hochstein, 1985;

17
Kanner & Rosenthal, 1987; Dix & Aikens, 1993; Nawar, 1996; Girrotti, 1998; Márquez-Ruiz,
Holgado, & Velasco, 2014):
(1) Initiation: lipid free-radicals are formed by abstraction of a hydrogen atom from an
allylic methylene group or attaching a radical to a double bond of the unsaturated
fatty acid in the presence of ROS, transition metal ions, UV light, or singlet oxygen
(1O2).
RH + initiator → R•
R′-CH=CH-R″ + O2 → ROOH
(2) Propagation: lipid peroxyl radicals (ROO•) are produced by the reaction between
oxygen and lipid free radicals. Once ROO• radicals are generated, they can attack
and abstract a hydrogen atom from other lipid molecules to give hydroperoxides
(ROOH). These primary products of lipid oxidation are odorless and colorless, but
unstable and decompose to secondary oxidation products such as aldehydes,
alcohols, acids, alkyl radicals, and oxoesters.
R• + O2 → ROO•
ROO• + RH → ROOH + R•
ROOH → RO• + HO•
2ROOH → RO• + ROO• + H2O

18
(3) Termination: the reaction is terminated by the formation of non-radical compounds
via associations and cross-linking between free radicals.
R• + R• → R-R
R• + ROO• → ROOR
ROO• + ROO• → ROOR + O2
2.2.2 Protein Oxidation
Protein oxidation refers to a situation in which amino acid side residues and/or peptide
bonds are attacked by ROS or derivatives from ROS-mediated oxidation (e.g., malonaldehyde
from lipid oxidation), resulting in cleavage of the protein peptide backbone, formation of
covalent protein cross-links, or simply the unfolding of proteins (Stadtman & Levine, 2000;
Xiong, 2000; Baron, 2014). Carbonyls are characteristic products from ROS-induced protein
oxidation. Protein oxidation has been reported to occur via the following mechanisms (Stadtman
& Levine, 2000; Xiong, 2000; Stadtman & Levine, 2003; Lund, Heinonen, Baron & Estévez,
2011; Baron, 2014): (1) modification of amino acid side chains, such as deamination; (2)
cleavage of peptide bonds; (3) interactions between sugar aldehydes or lipid carbonyls and
protein amino groups; (4) Michael addition; and (5) Schiff base formations. These derived
carbonyls can also react with ε–NH2 groups of lysyl residues to form protein cross-links and
ultimately, polymerization. Moreover, oxidation-induced protein cross-links can be initiated by
other reactions, such as the oxidation of sulfhydryl groups in cysteine, methionine oxidation
(Xiong, 2000; Stadtman & Levine, 2003; Lund, Heinonen, Baron & Estévez, 2011) and tyrosine
oxidation (to dityrosine) (Giulivi, Traaseth, & Davies, 2003; Stadtman & Levine, 2003; Lund,

19
Heinonen, Baron & Estévez, 2011). Physicochemical changes in oxidatively-modified proteins
include alterations in protein hydrophobicity, solubility, proteolytic affinity, and thermal stability
(Xiong, 2000). In food systems, mild and limited protein oxidation may be desirable due to the
enhancement of functionalities (Srinivasan & Xiong, 1996). However, uncontrolled and
irreversible protein oxidation always leads to inactivation of functional proteins and enzymes.
The accumulation of oxidatively-modified proteins is considered as one factor that contributes to
decreased product qualities (Xiong, 2000).
2.3 Antioxidants
Antioxidants refer to a category of compounds, both synthetic and natural, that can retard or
inhibit oxidative processes at a much lower low concentration compared to that of an oxidizing
substance (Sies, 1997; Dai & Mumper, 2010). It is important to note differences in terminology:
an antioxidant is a reductant, but not all reductants are antioxidants. In explanation, “reductant”
and “oxidant” are chemical (redox) terms, while “antioxidant” and “pro-oxidant (a synonym for
reactive species)” hold a specific reference to biological systems (Prior & Cao, 1999). For
unsaturated lipids, the mechanisms involved in the antioxidant action are related to three
functions; that is, (1) eliminating the presence of free radicals {e.g. peroxyl radicals (ROO•) and
alkoxyl radicals (RO•)} generated in the propagation step by hydrogen atom donation or single
electron transfer; (2) sequestering prooxidative transition metal ions, decomposing
hydroperoxides, and scavenging ROS; and (3) donating hydrogen atoms to antioxidants or
providing a stable antioxidant environment (Eskin & Przybylski, 2001).
According to their specific functions, antioxidants are classified into three categories,
including primary chain-breaking antioxidants, secondary or preventive antioxidants, and

20
synergists (Eskin & Przybylski, 2001; Venskutonis, 2014). Primary antioxidants refer to
hydrogen atom/electron donators, such as tocopherol isomers, phenolics and polyphenolics.
After accepting a hydrogen atom or single electron from an antioxidant, active radical species are
converted to neutral products while the antioxidant itself becomes a radical intermediate (albeit,
a more stable one) with resonance stabilization occurring by the aromatic ring(s). Secondary or
preventative antioxidants act as sequestrants to chelate metal ions as well as remove singlet
oxygen, peroxides and other initiators. As their names implies, they are a series of active
compounds capable of eliminating initiators and preventing oxidation chain reactions at the very
beginning. For example, ethylenediamine tetraacetic acid (EDTA) is a widely-used metal
ion-chelating agent for Fe2+/3+ and Cu2+. Synergists are compounds that can reinforce the
antioxidative activity of primary or secondary antioxidants through developing a more suitable
functional environment, inactivating metal ions, or regenerating oxidized antioxidants. A good
example is α-tocopherol and ascorbic acid. The latter can reduce α-tocopherol radicals back to
α-tocopherol, thereby restoring its antioxidant capacity.
2.3.1 The Role of Antioxidants in Disease Prevention
Tremendous interest in antioxidant food supplements has arisen in recent years due to the
recognition of antioxidants role in fighting ROS-induced oxidative stresses and associated
pathogenesis and chronic diseases. Antioxidants fall into two broad groups: nutrient antioxidants
(e.g., vitamin E and selenium) and natural-source antioxidants {e.g., (poly)phenolics}. Vitamin E
is the most well-known fat-soluble nutrient antioxidant and imparts protection against oxidative
stress-induced diseases in preclinical animal models of cancers (Kline, Lawson, Yu, & Sanders,
2007), cardiovascular diseases (Galli & Azzi, 2010), and neurodegenerative disorders

21
(Butterfield, Castegna, Drake, & Scapagnini, 2002). Yet, the outcomes of clinical trials remain
inconsistent. Selenium is another nutrient antioxidant with proven preventive benefits against
oxidative impairments (Fairweather-Tait et al., 2011). Unlike vitamin E, the antioxidant activity
of selenium stems from being an essential constituent of selenium-containing antioxidative
enzymes like glutathione peroxidase.
In addition to vitamins and minerals, (poly)phenolics (e.g., flavonoids) have attracted much
attention due to their favorable health benefits, which are largely attributed to their antioxidant
activity. There is steadily accumulated evidence from epidemiological studies indicating an
inverse association between the intake of fruits and vegetables in diets and the incidence of
certain cancers and chronic diseases such as cardiovascular diseases and neurodegenerative
disorders (Riboli & Norat, 2003; Barberger-Gateau et al., 2007; He, Nowson, Lucas, &
MacGregor, 2007). As the most abundant antioxidants of such diets, (poly)phenolics are believed
to partially contribute to these beneficial effects. The preventative effects of (poly)phenolics
against the aforementioned chronic diseases are well demonstrated in human cell culture and
animal models (Scalbert et al., 2005). However, dietary (poly)phenolics undergo extensive
modifications after ingestion: (1) they are usually present in plasma at very low concentrations
(nM levels) and as phase II metabolites rather than parent compounds from the dietary source;
and (2) both the parent compounds and metabolites which reach the colon are degraded by local
flora to smaller phenolics and aromatic catabolites and can be absorbed into the blood. Thus,
more well-controlled human intervention trials and in vitro mechanistic studies are necessary to
convince the scientific community of the protective effects and roles in the health benefits of
plant-based diets (Del Rio et al., 2013).

22
2.3.2 The Role of Natural Antioxidants in Foods
Antioxidants naturally occur in almost all agri-food material, but they are minor
components compared to the macronutrients: fats, proteins and carbohydrates. After
consumption, as discussed above, they play a protective role in supporting the human redox
defense system against ROS and thereby help retard oxidative stress-induced pathological
conditions. Likewise, when present in foods, antioxidants protect against the oxidation of food
components, especially unsaturated lipids during food processing and storage. Unsaturated fatty
acid-containing triacylglycerols are vulnerable to oxidation and result in food deterioration. This
leads to an attempt to correlate in vitro antioxidant capacity with projected capabilities of
antioxidants to perform in food systems. The antioxidant capacity of foods can be affected by
many factors, such as the physical location of antioxidants in the food systems, interactions with
other food components, and the overall food environment (e.g., pH, ionic strength,
hydrophilic/lipophilic balance) (Decker et al., 2005); therefore, measuring this activity is much
easier than assessing their possible effects in vivo, after consumption. On the other hand, some
natural antioxidants possess colors (e.g., anthocyanins), tastes (e.g., PACs) and/or odors, which
can negatively influence the overall sensory quality of these antioxidant-containing foods.
Some of the most well characterized antioxidant reactions in foods are enzymatic oxidation
of (poly)phenolics. This process involves monophenol and diphenol oxidase activities, which
result in hydroxylation to the ortho-position adjacent to an existing hydroxyl group of the
phenolic substrate and oxidation of ortho-dihydroxybenzenes to ortho-benzoquinones,
respectively (Oliveira, Ferreira, de Freitas, & Silva, 2011). The enzymatic oxidation of
(poly)phenolics can be favorable in some situations, such as in tea fermentation, but can also
cause deterioration in food quality such as the browning of apples. A strategy taken (e.g., thermal

23
processing) to inactivate these enzymes and protect the foodstuff would also significantly affect
the content and chemistry of the antioxidants and other components contained therein. Arts, van
de Putte, and Hollman (2000) compared the levels of catechins in fresh as well as processed
fruits and vegetables: a 25 to 60% decrease in catechin levels of the prepared foods and marked
decreases in industrial canned foods were noted when compared to their raw counterparts.
2.4 Phenolic and Polyphenolic Antioxidants
Any compound containing a hydroxy-substituted aromatic ring is a phenolic compound.
Polyphenols are characterized by possessing large multiples of phenolic-structural units. They
are ubiquitously distributed throughout the plant kingdom as secondary metabolites (Bravo, 1998)
and have become a magnet of human nutrition research due to their potent antioxidant activity.
There is accumulated evidence revealing that consumption of a (poly)phenolic-rich diet can
provide relief from certain physical ailments and prevention against oxidative stress-induced
diseases in humans, including aforementioned cardiovascular diseases and neurodegenerative
disorders. Therefore, it is not surprising that the extraction and analysis of phenolic compounds
from plants and other food sources have been extensively studied (Naczk & Shahidi, 2006; Dai
& Mumper, 2010).
2.4.1 Phenolics in Plants: Their Occurrence and Biosynthesis
Phenolics generally concentrate in the outer layers of plants such as the peel, shell, and hull
to protect inner materials. Many phenolic compounds and mixtures thereof are prevalent in a
wide variety of fruits, vegetables, grains, and other plant products (Bravo, 1998; Shahidi, 2000;
Naczk & Shahidi, 2006). Amongst the wide range of phenolic compounds, dietary phenolics are
24
mainly comprised of phenolic acids, flavonoids, and phenolic polymers (e.g., PACs) (King &
Young, 1999). Table 2.1 summarizes the current classification of dietary phenolics, including
examples of food sources. Phenolic acids (e.g., p-hydroxybenzoic acid and vanillic acid) can be
present in free forms, but the more common occurrence is their corresponding methyl and ethyl
esters and glycosides, which exist in both free and bound forms (Bravo, 1998). Hydroxycinnamic
acids (e.g., p-coumaric and ferulic acids) are bound to cell wall polysaccharides through covalent
linkages (Bravo, 1998). In graminaceous plants, for instance, p-coumaric acid and ferulic acid
are bound to cell walls through ester-linkages between their carboxylic groups and arabinoxylans
(Hartley, Morrison, Himmelsbach, & Borneman, 1990). Flavonoids in living plants are generally
present in bound forms with one or more sugar residues (Bravo, 1998; Hollman & Arts, 2000). In
the case of flavan-3-ols (e.g., catechin, epicatechin, and gallocatechin), free monomers are their
common form (Bravo, 1998).
In plants, phenolic compounds are synthesized most commonly from the amino acid
L-phenylalanine, and in fewer cases, L-tyrosine (Shahidi, 2000; Crozier, Jaganath, & Clifford,
2009). Several simple phenylpropanoids with the basic C6 – C3 carbon skeleton (i.e., denoting a
phenolic ring attached to a three-carbon side chain) of phenylalanine such as p-coumaric, caffeic,
ferulic, and sinapic acids, are produced from trans-cinnamic acid via a series of hydroxylation
(hydroxylase activity) and methoxylation (O-methyl transferase activity) reactions. Loss of a
two-carbon moiety from the trans-cinnamic acid produces benzoic acid derivatives such as
p-hydroxybenzoic acids, protocatechuic acids, and vanillic acid. An illustration of the
biosynthesis pathways of these phenylpropanoids is given in Figure 2.1(A). The substrates
involved in the synthesis of flavonoids, isoflavonoids and stilbenes are malonyl CoA and
p-coumaroyl CoA. Chalcone synthase (CHS) catalyzes the stepwise Claisen condensation of

25
three acetate units from malonyl CoA with a p-coumaroyl CoA to yield tetrahydroxychalcone,
which further leads to the production of flavonoids and isoflavonoids. Aldol condensation of
three molecules of malonyl CoA with one molecule of p-coumaroyl CoA via the action of
trihydroxystilbene synthase brings forth stilbenes (e.g., trans-resveratrol). The biosynthesis
pathways of flavonoids, isoflavonoids and stilbenes are depicted in Figure 2.1(B).
Phenolic Acids
Benzoic and hydroxycinnamic acids are two major groups of naturally-occurring phenolic
acids (Teixeira et al., 2013). Benzoic acids are phenolic compounds with a C6 – C1 structure (e.g.,
p-hydroxybenzoic acid, protocatechuic acid, and vanillic acid) that contain one carboxylic acid
functional group. Hydroxycinnamic acids (e.g., p-coumaric acid, caffeic acid, ferulic acid, and
sinapic acid) are the most important phenylpropanoids consisting of a C6 – C3 skeleton (Bravo,
1998; Crozier, Jaganath, & Clifford, 2009; Teixeira et al., 2013). As depicted in Figure 2.1(A),
phenolic acids of the benzoic and hydroxycinnamic acid families are synthesized from
L-phenylalanine (or L-tyrosine) in plants. This reaction pathway is commonly referred to as
phenylpropanoid metabolism. Basic carbon skeletons and structures of benzoic and
hydroxycinnamic acid families are given in Table 2.2. In plants, the common occurrences of
hydroxycinnamic acids are esters of hydroxyacids such as quinic, shikimic, or tartaric acid
(Herrmann, 1989; Crozier, Jaganath, & Clifford, 2009; Teixeira et al., 2013). Other conjugated
forms of hydroxycinnamic acids include amides (e.g., with amino acids and peptides), esters of
sugars, and glycosides (Teixeira et al., 2013).

26
Coumarins and Stilbenes
Coumarin (1,2-benzopyrone) shares a similar C6 – C3 skeleton (Table 2.2) to
trans-cinnamic acid (3-phenyl-2-propenoic acid), but it belongs to the benzopyrone family and
contains a benzene ring joined to a pyrone nucleus (Jain & Joshi, 2012). It is a natural substance
occurring in many plants and synthesized from trans-cinnamic acid via ortho-hydroxylation,
trans–cis isomerization, and esterification (Jain & Joshi, 2012). Coumarin derivatives have
attracted increased attention recently due to their anticarcinogenic and antithrombotic activities
(Jain & Joshi, 2012; Lacy & O'Kennedy, 2004). Coumarins, especially aesculetin, are potent
inhibitors of cell growth in various carcinoma cell lines (Lacy & O'Kennedy, 2004).
Stilbenes are phytoallexins with a C6 – C2 – C6 structure (Table 2.2) present in plants in
response to disease, injury, and stress. Red wine and peanuts (Arachis hypogaea L.) are dietary
sources of trans-resveratrol (3,5,4′-trihydroxystilbene) (Crozier, Jaganath, & Clifford, 2009).
Though occurring at much lower concentrations in plants compared to trans-resveratrol,
trans-piceatannol (3,3′,4,5′-tetrahydroxystilbene) can be easily induced in the calluses of A.
hypogaea or other related peanut tissues in a controlled environment (Ku, Chang, Cheng, & Lien,
2005). Piceid is trans-resveratrol-3-O-glucoside found in pistachio nuts (Pistacia vera),
Polygonum cuspidatum (Japanese knotweed or Mexican bamboo) (Crozier, Jaganath, & Clifford,
2009), and grape juices (Romero-Pérez, Ibern-Gómez, Lamuela-Raventós, & De La
Torre-Boronat, 1999).
Flavonoids
Flavonoids are distributed mostly as glycosides in plants, with some classes consisting of up
to 380 variations in their chemical structure (Bravo, 1998). Flavonoids possess a basic core

27
structure of diphenylpropane (C6 – C3 – C6) that consists of two aromatic rings connected by a
three-carbon bridge (Bravo, 1998; Crozier, Jaganath, & Clifford, 2009). Table 2.2 shows the
basic skeleton and system employed for the carbon numbering of a flavonoid nucleus. The
altered substitution and saturation divide flavonoids into several sub-classes, most notably
flavones, flavonols, flavanones, flavanonols, flavan-3-ols, and isoflavones. The basic skeletons
of above flavonoids/isoflavonoids are also illustrated in Table 2.2. There are varying
arrangements of multiple hydroxyl- and methoxy-group substituents present in the structures of
flavonoids along with the basic skeleton. Hydroxylation usually occurs at the C-4′ position of the
B-ring and C-5, C-7 positions of the A-ring (Crozier, Jaganath, & Clifford, 2009).
Flavan-3-ols are monomeric units for PACs and are characterized by a saturated C3 element
on the heterocyclic C-ring with a hydroxy or galloyl group attached at the C-3 position. Four
isomers are produced by two chiral centers at C-2 and C-3 positions. (+)-Catechin and
(−)-epicatechin are the most common diastereoisomeric pair found in nature, while (−)-catechin
and (+)-epicatechin are somewhat rare (Crozier, Jaganath, & Clifford, 2009). As most
structurally complex subclass of flavonoids, the simple monomers can further form
(epi)gallocatechin by hydroxylation at the C-5′ position of the B-ring and give (epi)catechin
gallate by esterification with gallic acid at the C-3 position of the C-ring.
(Epi)gallocatehin-3-gallate results from the esterification of (epi)gallocatehin with gallic acid.
Hence, these compounds possess hydroxy groups at the C-3′, C-4′, and C-5′ positions of the
B-ring and a gallate moiety esterified at the C-3 position of the C-ring. The structures of above
flavan-3-ols are depicted in Figure 2.2.

28
Phenolic Polymers
Tannins are highly hydroxylated polyphenolic compounds of intermediate to high molecular
weights ranging from 500 to more than 30,000 Da (Serrano et al., 2009). The term “tannin” was
first introduced in 1796 and they were so-named because of their capacity to transform animal
hides into leather by forming stable tannin-protein complexes with skin collagen (Bravo, 1998;
Serrano et al., 2009). The astringency resulting from consumption of tannin-rich foods is caused
by such interaction between tannins and salivary proteins. Tannins are classified into two major
groups based on their inherent chemical constituents: hydrolyzable and condensed tannins.
The hydrolyzable tannins consist of gallic acid or ellagic acid esterified with a polyol
(generally D-glucose) central core; whereas, flavan-3-ol monomers compose of condensed
tannins or proanthocyanidins (PACs) (Bravo, 1998; Serrano et al., 2009). Hydrolyzable tannins
can be further segregated into gallotannins and ellagitannins. Gallotannins contain gallic acid
subunits only. Ellagitannins can be heterogeneous polymers of both ellagic and gallic acid
(Serrano et al., 2009). Unlike gallotannins where their galloyl groups can be linked by depside
bonds to form high-molecular-weight polymers, the galloyl groups of ellagitannins are linked
through C – C bonds via oxidative condensation reactions (Mueller-Harvey, 2001). Hydrolyzable
tannins easily undergo hydrolytic dissociation in weak acid or alkali to their individual
monomeric units (Bravo, 1998).
PACs are oligomers and polymers able to reach degrees of polymerization (DP) of over 50.
As mentioned above, the monomeric constituent is a flavan-3-ol (e.g., catechin, epicatechin, etc.)
with oxidative condensation between C-4 position of the heterocyclic C-ring and C-6 or C-8
position of the A-ring of adjacent units (Bravo, 1998; Crozier, Jaganath, & Clifford, 2009;
Serrano et al., 2009). These PACs are referred to as B-type PACs. In some cases, an additional

29
C2–O–C7 ether linkage can be found and these PACs are often called A-type PACs. The linkage
possible of A- and B-type PACs are depicted in Figure 2.3. PACs are usually subdivided as
procyanidins, prodelphinidins and propelargonidins according to the composition of their
flavan-3-ol subunits. Procyanidins formed exclusively from (epi)catechins; whereas,
prodelphinidins contain (epi)gallocatehin constituents. PACs, containing (-)-epiafzelechin and
(+)-afzelechin, are called propelargonidins (Crozier, Jaganath, & Clifford, 2009; Serrano et al.,
2009).
2.4.2 Phenolic Compounds Found in Peanuts and Peanut Skins (PS)
Peanuts
Limited quantities of isoflavones have been detected in peanuts, including daidzein
(52–1753 μg/100 g d.w.), genistein (13–227 μg/100 g d.w.), and biochanin A (37–137 μg/100 g
d.w.) (Chukwumah et al., 2007a). The contents, however, vary depending on the extraction
medium and the sample preparation techniques employed in analyses. Moreover, isoflavone
levels can be significantly increased with thermal processing by releasing corresponding bound
conjugates. According to Chukwumah et al. (2007b), boiled peanuts showed higher isoflavone
content compared to raw peanuts, with increases in biochanin A and genistein of 200 and 400%,
respectively. The only other flavonoid found in peanuts to date is flavonol dihydroquercetin
(taxifolin), which is present in Spanish peanuts in limited amounts (Pratt & Miller, 1984).
trans-Resveratrol is not expected to have a significant effect on the antioxidant activity of
peanuts because of the small magnitude detected in raw peanut kernel (0.01–2 μg/g) (Sobolev &
Cole, 1999; Sanders, McMichael & Hendrix, 2000; Tokuşoğlu, Ünal, & Yemiş, 2005).
Commercial processing elicits increased trans-resveratrol production in the following order:

30
boiling > peanut butter processing > dry roasting) (Sobolev & Cole, 1999), but the levels of
trans-resveratrol obtained from such processes are limited. In comparison, peanut roots contain
0.13-1.33 mg/g of trans-resveratrol (Chen, Wu, & Chiou, 2002), making the roots a much better
source.
The total phenolics content of peanuts with skin are higher compared to most tree nuts, with
the exception of pistachios, pecans, and walnuts (Kornsteiner, Wagner, & Elmadfa, 2006). Of the
little compositional data available on peanut phenolic profiles, bound phenolics are thought to be
dominant, as demonstrated by an 86% increase in TRAP values post alkaline hydrolysis
(Pellegrini et al., 2006). Phenolic acids and their esters have been tentatively identified in raw
and roasted peanuts, including p-coumaric acid, p-coumaric acid esters, and possibly
p-hydroxybenzoic acid esters (Talcott et al., 2005). Fajardo and coworkers (1995) demonstrated
a stress-elicited synthesis of free and bound phenolics in peanuts where p-coumaric and ferulic
acid were the major compounds identified. Therefore, p-coumaric and ferulic acids may be
contributing factors to antioxidant activity of peanuts and potential health benefits of their
consumption.
Peanut Skins (PS)
Besides the kernels, PS, the other edible part of peanuts, have attracted attention because they
are a rich, inexpensive source of potentially health-promoting phenolics. As mentioned before,
phenolic compounds typically concentrate themselves on the outer layers of plants such as the
peel, shell, and hull to protect the inner core materials. Nepote, Grosso, and Guzman (2002)
reported a content of ~159 mg total phenolics/g defatted dry skin, which also exhibited a marked
antioxidant activity as demonstrated by its capacity to inhibit the oxidation of sunflower oil. A

31
study by Yu et al. (2005 & 2006) revealed that PS phenolics are abundant not only in quantity
but also in type, which primarily include free-, esterified- and bound-phenolic acids (i.e., caffeic,
chlorogenic, ferulic, and p-coumaric acids), flavan-3-ols (i.e., epigallocatechin, catechin gallate,
and epicatechin gallate) and their polymers (the proanthocyanidins, PACs), and stilbenes (i.e.,
trans-resveratrol).
Free phenolic acids are not the predominant phenolics in PS (Yu, Ahmedna, Goktepe, & Dai,
2006); the PACs comprise ~17% by weight of PS (Karchesy & Hemingway, 1986). Six A-type
PAC dimers were identified in PS (Lou et al., 1999) and found to inhibit the inflammatory
pathway mediated by hyaluronidase-induced release of histamine. A further study by Lou et al.
(2004) led to isolation of five oligomeric PACs with potential free radical-scavenging activity
from the water-soluble fraction of PS. Although A-type linkages are much more abundant, both
A- and B-type PACs exist in PS. The degree of polymerization (DP) identified in PS was up to
12 bound by A-type linkages; whereas, B-type structures were detected with a DP of up to six
(Monagas et al., 2009). PACs are polymers of flavonoids and their phenolic nature makes them
excellent antioxidant agents.
2.4.3 The Effect of Processing and Extraction on Phenolics Content of Peanut Skins (PS)
Mild heat treatment was able to break some of the covalent bounds of phenolic acids with
insoluble polymers (Peleg, Naim, Rouseff, & Zehavi, 1991) and other cell wall components such
as arabinoxylans (Hartley, Morrison, Himmelsbach, & Borneman, 1990), liberating
low-molecular-weight antioxidant compounds from the repeating subunits of
high-molecular-weight polymers (Jeong et al., 2004). Lee et al. (2006) reported that after heat
treatment at 150 °C for 60 min, the TPC value of peanut hulls increased from 73 to 90 μM tannic

32
acid equivalents. PS roasted at 175 °C for 5 min were found to contain a higher TPC than raw PS,
especially when recovered by aqueous ethanolic extraction (Yu, Ahmedna, & Goktepe, 2005). Yu
and coworkers (2006) reported a significant influence of the skin removal methods on the PACs
content of PS. Dry heat, like that found in dry roasting of red-skin peanuts, would increase
A-type dimers and B-type trimers compared to directly peeled PS due to monomeric
polymerization or the degradation of trimers and tetramers. Polymerization of monomers and
B-type dimers is a plausible mechanism by which increased B-type trimer levels were detected.
In addition to processing, the extraction conditions employed such as choice of solvent
system, material:solvent ratio, particle size distribution of PS, extraction times, number of
extractions, and temperature (Nepote, Grosso, & Guzmán, 2005; Dai & Mumper, 2010) impact
the efficiency of extraction and thereby result in different recoveries of phenolics from the source
material. According to Nepote, Grosso, and Guzmán (2005) the optimum extraction conditions
consist of 70% (v/v) ethanol, unground PS, a solvent/solid ratio of 20 mL/g, 10 min of shaking,
and three extractions yielding a 118 mg phenol equivalents/g recovery of total phenolics. It was
reported by Nepote, Grosso, and Guzmán (2002) that 159 mg phenol equivalents/g of TPC was
recovered from dry blanched PS by 24 h maceration with methanol at a material to solvent ratio
of 1:10 (w/v). The extraction was performed 2× at room temperature in a dark room. However,
the quantities of total phenolics are difficult to compare amongst that reported in the literature
because sample source, sample preparation manner, and extraction techniques are quite varied.
2.5 Extraction of Ester and Glycoside Bound Phenolic Compounds
As mentioned above, the more common occurrence for phenolic acids (i.e.,
p-hydroxybenzoic acid and vanillic acid) is their corresponding methyl and ethyl esters and

33
glycosides which exist in free and/or bound forms (Bravo, 1998). Flavonoids found in living
plants are generally in bound forms with one or more sugar residues (Bravo, 1998; Hollman &
Arts, 2000). Identification of esterified phenolic derivatives is extremely difficulty due to the
nearly uniform UV spectra with their unesterifed counterpart. The chemical characteristics of the
new chromophore generated via esterification are not markedly different from its precursor.
Sometimes there are, however, minor bathochromic shifts in the chromophoric structure such as
that present in the C–O bond of caffeoyl tartrate (Robbins, 2003). One strategy to simplify and
specify the analysis is using acid and/or base hydrolysis to convert the bound derivatives to a
carboxylic acid. It was reported that the base hydrolysis provided phenolic acids liberated from
soluble esters while phenolic acids bound to soluble glycosides were released by followed acid
hydrolysis (Weidner, Amarowicz, Karamać, & Dabrowski, 1999; Amarowicz & Weidner, 2001).
These liberated aglycones can be easily identified using high-performance liquid
chromatography (HPLC) with diode-array detection (DAD). Likewise, the large variety of
glycosides makes determination of individual flavonoid glycosides in foods formidable (Hertog,
Peter, Hollman, & Venema, 1992). Therefore, flavonoids are usually analyzed after hydrolysis
off their glycosides; the resulting aglycones are further confirmed by photodiode array detection
or mass spectrometry (Hertog, Peter, Hollman, & Venema, 1992; Hollman & Arts, 2000; Merken
& Beecher, 2000). The HPLC analysis of flavonoids in peanuts and other legume seeds
subsequent an acid hydrolysis procedure was described by Wang’s group (2008).
Likewise, certain percentage of PACs is “unextractable” due to confined in vacuoles or
bound to cell wall material through hydrogen bonding and hydrophobic interactions (Pinelo,
Arnous, & Meyer, 2006; White, Howard, & Prior, 2010). Hence, the PACs content has been
underestimated because of the bound linkage between PACs and cell wall material which cannot

34
be broken by normal extraction methods (Arranz, Saura-Calixto, Shaha, & Kroon, 2009; White,
Howard, & Prior, 2010). In order to liberate these bound derivatives, acid or base hydrolysis was
applied after normal extraction (Arranz, Saura-Calixto, Shaha, & Kroon, 2009; White, Howard,
& Prior, 2010). However, alkaline conditions can lead to cleavage of C–C interflavan bonds
between the monomeric flavan-3-ol constituents; in addition, the A-ring of flavan-3-ols can be
broken by prolonged treatment (White, Howard, & Prior, 2010).
2.6 Purification, Fractionation and Analysis of Phenolic Compounds
The concentration of the phenolic compounds in the crude plant extract could be low due to
the large constitution of carbohydrates and/or lipophilic compounds, which deter simple
extraction. Therefore, sequential extraction, liquid-liquid partitioning and solid phase extraction
(SPE) based on polarity and acidity, are commonly used techniques to obtain polyphenol
concentrated fractions before analysis (Robbins, 2003; Dai & Mumper, 2010). Lipophilic
compounds can be washed away by using non-polar solvents (i.e., hexane, dichloromethane, and
chloroform, etc.); whereas, SPE is often applied to remove the polar non-phenolic substances
such as sugars and organic acids. Typically, phenolic components are retained quantitatively on
the SPE cartridge (i.e., Amberlite XAD-16), while interfering components are washed off with
water (Berardini, Knödler, Schieber, & Carle, 2005; Zhang et al., 2008). The retained
polyphenols are eluted from the sorbent cartridge using suitable organic solvents (i.e., methanol,
ethanol, etc.).
Among the many methodologies available for the selective separation and analysis of
phenolic compounds, reversed-phase (RP)-HPLC equipped with a C18 column and coupled with
UV-Vis photodiode array (PDA) detection is the most widely adopted and used approach
35
(Robbins, 2003). Phenolic acids and flavonoids show characteristic UV-range absorbance
patterns from 190 to 380 nm (Merken & Beecher, 2000; Robbins, 2003). In UV/Vis diode array
detection (DAD), four groups of phenolic compounds are distinguished, namely hydroxybenzoic
acids (255 nm), flavan-3-ols and polymers (280 nm), hydroxycinnamic acids (320 nm) and other
flavonoids (360 nm). The inherent differences in UV-spectra exhibited by the two phenolic acid
families provides for their selective chromatographic identification. Nevertheless, compared to
UV detection, fluorescence detection is more commonly employed for PAC analysis because of
the increased selectivity and decreased interference from other absorbing species (Hümmer &
Schreier, 2008). The use of mass spectrometric detection is an emerging trend, which does not
require complete chromatographic separation and provides more information about structures of
phenolic compounds (Robbins, 2003; Dai & Mumper, 2010).
Because a greater polarity is associated with an increased DP, theoretically PACs can be
fractionated by reversed-phase (RP) or normal-phase (NP) high-performance liquid
chromatography (HPLC) in an order of ascending molecular mass (Hümmer & Schreier, 2008).
However, the resolution of PACs is limited to tetramers on C18 columns by RP-HPLC. The first
successful separation of PACs was achieved on SiO2 thin layer plates according to their DP (Lea
& Arnold, 1978). Based on this thin layer chromatography method, a NP-HPLC gradient of
CH2Cl2 and CH3OH with traces of aqueous formic acid (1:1, v/v) was developed by Rigaud et al.
(1993), resulting in the separation of PACs up to a DP of five in cacao bean extract.
Hammerstone et al. (1999) identified PAC decamers in cocoa by using a gradient of similar
composition, but by replacing the formic acid with acetic acid. In the above cases, chlorinated
solvents were employed in the mobile phase compositions; however, these solvents are
environmentally unfriendly and can cause health problems from exposure in the workplace. A

36
better separation of PACs in cacao with a DP up to 14 was achieved by Kelm et al. (2006) using
a diol stationary phase with a relatively safe binary mobile phase of A (CH3CN:CH3COOH, 99:1,
v/v) and B (CH3OH:H2O:CH3COOH, 95:4:1, v/v/v).
The PAC molecules eluted via HPLC can be further ionized by an ion generator such as
electrospray ionization (ESI), and these ions are subsequently separated according to their m/z
ratio (Hümmer & Schreier, 2008). The HPLC-MSn methods have been widely applied in the
analysis of PACs in a variety of food matrices. Apropos PS monomers (catechin and
(epi)catechin), as well as A- and B-type PACs through dimers to tetramers were identified and
quantified by Yu’s group (2006) with a RP-HPLC/ESI-MS system. Recently, Constanza et al.
(2012) reported the separation and identification of PACs through monomers to hexamers in PS
using NP-HPLC/ESI-MS. Analyzing A-type PACs in PS, Appeldoorn and coworkers (2009)
identified 83 PAC species with DPs up to seven via a combination of NP-HPLC and
RP-HPLC/ESI-MS2. The fractions throughout NP-HPLC was further separated and characterized
by RP-HPLC-MS2. PS PACs up to nonamer were separated by NP-HPLC and characterized
using RP-HPLC/ESI-MSn in Sarnoski’s study (2012).
2.7 Quantification of Phenolic Compounds
The nature of the sample and the purpose of the study generally determine the selection of
analytical method for phenolic compounds (Dai & Mumper, 2010). The large variety of type,
number and content of phenolic compounds in plants and even in different tissues of a single
plant often imposes limits to the measurement (Robards, 2003; Naczk & Shahidi, 2006). For
instance, traditional colorimetric methods depending on an absorbing wavelength may cause
over-estimation of phenolic contents due to the overlapping of spectral responses from the

37
interference of UV-absorbing substances (i.e., proteins, nucleic acids and amino acids). Also, the
complexity of plant phenolic constitutions makes the selection of a reference standard a difficult
task. Despite all these disadvantages, spectrophotometric assays are rapid, simple and
reproducible and widely used for quantification of phenolic compounds. A number of methods
based on different principles to determine different phenolic groups have been developed,
including the Folin–Ciocalteu assay for determination of total phenolics content (TPC)
(Singleton & Rossi, 1965), as well as the vanillin (Price, Van Scoyoc, & Butler, 1978),
dimethylaminocinnamaldehyde (DMAC) assay (McMurrough & McDowell, 1978) and
proanthocyanidin assays (acid butanol assay) (Porter, Hrtstich, & Chan, 1986) for the estimation
of total proanthocyanidins (TPAC) content.
The most widely applied technique now for both separation and quantification of phenolic
compounds is HPLC, which is compatible with many classes of phenolics including
anthocyanins, proanthocyanidins, hydrolysable tannins, flavonols, flavan-3-ols, flavanones,
flavones, and phenolic acids from different plant extracts and food samples (Naczk & Shahidi,
2006; Dai & Mumper, 2010). All phenolic components together with their possible derivatives
and degradation products can be simultaneously determined by HPLC. Although RP C18 columns
are most often employed in phenolic analysis (Robbins, 2003), its resolution of PACs is limited
to tetramers (Hümmer & Schreier, 2008). In contrast, much better separation of PACs with a DP
up to 14 was achieved on a diol stationary phase (Kelm et al., 2006). However, it’s worthy to
mention the lack of complete elution of highly polymerized PACs on a silica-based NP column
leads to overlapping chromatograms (Naczk & Shahidi, 2006; Hümmer & Schreier, 2008). The
applications of both RP- and NP-HPLC, incidentally, become an emerging trend in phenolic
analysis because of the improved separation with multidimensional techniques. A comprehensive

38
two-dimensional liquid chromatographic (LC × LC) technique was described by Montero et al.
(2013), whereby both hydrophilic interaction liquid chromatography (HILIC) and RP-HPLC
were applied as separation stages; this approach showed great potential in profiling the phenolic
compounds of complex food systems.
The Total Phenolics Content (TPC) with Folin & Ciocalteu’s Phenol Reagent
Folin & Ciocalteu’s phenol reagent was used to the assessment of antioxidant contents in
wine by Singleton and Rossi (1965) and resulted in the well-known total phenolics content (TPC)
assay. The mechanism behind the TPC assay involves the reduction of the molybdenum
component in the phosphotungstic-phosphomolybdic complexing reagent by electron transfer
from phenolic compounds, which leading to the formation of blue complexes {possibly
(PMoW11O40)4−} that is measured at 745 to 765 nm according to the following reaction scheme:
Mo6+ (yellow) + ArOH → Mo5+ (blue at 750 nm) + [ArOH] •+
whereby, ArOH represents the phenolic antioxidants. However, the Folin & Ciocalteu’s phenol
reagent is vulnerable to a great many interferences, particularly any readily reducible component
present within the assay mixture. In the case of wine and most fruits, ascorbic acid is considered
as the major interfering factor (Singleton, Orthofer, & Lamuela-Raventós, 1999). In the TPC
assay, mixtures of excess phenol reagent and a diluted sample or a reference standard (usually
gallic acid), as well as alkaline media of pH about 10, are involved in the procedure. The blue
color of resultant complex is developed over 30 to 60 min. The reaction can be accelerated by
increased the alkalinity and/or temperature. However, care should be taken as the precipitation of

39
the phenol reagent may occur where a dense, white, crystalline material is formed by excessive
heat (above 60 °C), alkalinity (above pH 10-11), or the quantity of reagent in the assay (above 5
mL/100 mL) (Rosenblatt & Peluso, 1941).
Total PACs (TPAC) Content with Dimethylaminocinnamaldehyde (DMAC)
Of different conventional methods to determine total PACs content, the PAC assay (acid
butanol assay), dimethylaminocinnamaldehyde (DMAC) assay and vanillin assay are the most
common specific analyses that involve particular structure properties of flavan-3-ols and PACs
(Hümmer & Schreier, 2008). In the DMAC assay, the aromatic aldehyde (DMAC) reacts with
specific compounds containing meta-oriented di- or trihydroxy substituted benzene rings such as
the 5,7-dihydroxy A-ring of catechin and epicatechin, resulting in a green chromophore
[Figure 2.4(A)] with maximum absorbance at approximately 640 nm (McMurrough &
McDowell, 1978). The interference from anthocyanidins is effectively eliminated by this
wavelength, which is a problem in the butanol–HCl and the vanillin assays (Payne et al., 2010;
Wallace & Giusti, 2010). In addition, structural properties, including a single bond between C2
and C3 and the lack of a carbonyl at C4, are also required for a positive reaction (Payne et al.,
2010). Therefore, compared to the acid–butanol and the vanillin assays, DMAC assay shows
higher specificity and accuracy for PACs without the reaction with hydroxycinnamic acids,
hydroxybenzoic acids, flavones, and flavonols (Krueger, Reed, Feliciano, & Howell, 2013).
However, The DMAC assay is more suitable for samples containing low-molecular-weight
PAC oligomers for which the structure and reaction kinetics of the monomer or dimer standards
are better matched. Therefore, quantification error exists when MS analyses reveal the presence
of higher polymerized PACs (i.e., a DP ≥ 4) (Krueger, Reed, Feliciano, & Howell, 2013).

40
Moreover, denser color is developed by monomers (catechin and epicatechin) compared to
dimers, indicating the A-ring involved in intermonomer linkage is no longer available for the
DMAC reaction (McMurrough & McDowell, 1978). It further turns out the reaction only takes
place at the C8 terminal unit of PACs and thereby the response would decrease along with the
increase of DP. As polymerization of PACs, more C8 sites would participate in the interflavan
linkages and less DMAC reactive sites would be present (Krueger, Reed, Feliciano, & Howell,
2013).
2.8 Methods to Determine Total Antioxidant Capacity (TAC) of Phenolic Extracts
Because the antioxidant activity is a cooperative action in a complex sample, it’s more
meaningful to measure the integrated total antioxidant capacity (TAC) than study each phenolic
antioxidant individually (Dai & Mumper, 2010). Generally, antioxidant assays can be roughly
divided into two classes based on the antioxidant reaction involved: hydrogen atom transfer
(HAT) reaction based assays and electron transfer (ET) reaction based assays (Huang, Ou, &
Prior, 2005). In HAT-based assays, the free radical takes a hydrogen atom from an antioxidant
compound while the antioxidant becomes a relative stable radical itself, which measures the
capacity of an antioxidant to quench free radicals by hydrogen donation. Oxygen radical
absorbance capacity (ORAC) and total radical-trapping antioxidant parameter (TRAP) are
well-known HAT-based assays. In ET-based assays, the antioxidant donates an electron to the
free radical and itself becomes relative stable radical species. A variety of assays includes trolox
equivalent antioxidant capacity (TEAC), ferric ion reducing antioxidant power (FRAP) and
Folin–Ciocalteu assay as a measurement of total phenolics content are ET-based assays.

41
HAT: ROO• + ArOH → ROOH + ArO•
ET: ROO• + ArOH → ROOH + [ArOH]•+
whereby, ArOH represents the phenolic compound and ArO• is the stable phenoxy radical.
2.8.1 Oxygen Radical Absorbance Capacity (ORACFL) Assay
The oxygen radical absorbance capacity (ORAC) assay was developed by Dr. Alexander N.
Glazer in the early 1990s to determine ROS in biological systems (Glazer, 1990). The ORAC
assay was adopted by Cao et al. (1993) for the assessment of antioxidant species in human
plasma, which basically measures free radical-scavenging activity against the peroxyl radical
induced by 2,2-azobis(2-amidinopropane) dihydrochloride (AAPH) [Figure 2.4(B)]. The
antioxidant activity is determined by the ability of hydrogen donation and can be easily
quantitated by the decay of fluorescent probe. Ou et al. (2001) improved the method and named
it the ORACFL assay since then, where a more stable and reproducible fluorescent probe,
fluorescein (FL, 3′,6′-dihydroxyspiro[isobenzofuran-1[3H],9'[9H]-xanthen]-3-one), is used.
Briefly, radicals such as AAPH can destroy fluorescein and cause degradation of
fluorescence. In the presence of antioxidant, the oxidation of fluorescent probe induced by
AAPH radical is inhibited and fluorescence is thereby maintained for longer period. The radical
scavenging capacity is then determined by the area of a degradation curve originating from
continuous fluorescence reading of a sample in a multiple-welled fluorometer for a couple of
hours. The AAPH scavenging activity is expressed by a standard curve built on different
concentrations of 6-hydroxy-2,5,7,8-tetramethylchroman-2-carboxylic acid (Trolox, a
water-soluble vitamin E analogue). In short, data analysis from the ORACFL assay is achieved by
42
(1) calculating of the area under the kinetic curve (AUC) and net AUC (AUCsample - AUCblank), (2)
obtaining a standard curve by plotting the concentration of Trolox and the AUC (3) calculating
the Trolox equivalents of a sample using the standard curve.
2.8.2 Ferric Reducing Antioxidant Power (FRAP) Assay
The FRAP assay (Benzie & Strain, 1996) is a simple method to determine the reduction of
ferric-tripyridyltriazine complex {Fe(III)–TPTZ}. In an acidic medium, the ferric
tripyridyltriazine {Fe(III)-TPTZ} complex is reduced to ferrous tripyridyltriazine {Fe(II)–TPTZ}
by a reductant/antioxidant, such as a phenolic compound, with an appropriate redox potential.
The resultant Fe(II)–TPTZ chromophore yields an intense blue color with a wavelength
maximum of 593 nm [Figure 2.4(C)]. Unfortunately, the FRAP assay only detects compounds
with redox potentials of < 0.7 V (Prior, Wu, & Schaich, 2005), and is indicative of the
antioxidant capacity of converting radicals to stable products by electron donation.
Unfortunately the acidic pH of the FRAP assay that is necessary to maintain iron solubility,
lowers the ionization potential of the reactants and increases the redox potential of the system
(Prior et al., 2005). An additional disadvantage of the FRAP assay is the exclusion of some
polyphenols that require times for reaction that exceed 4 min (Prior, Wu, & Schaich, 2005). A
slowly increasing FRAP value was found in phenolics such as caffeic acid, tannic acid, ferulic
acid, trans-resveratrol, and quercetin even after several hours of reaction (Pulido, Bravo, &
Saura-Calixto, 2000).

43
2.9 Dietary Fiber (DF) and Health Benefits Associated with Dietary Polyphenols
DF is the indigestible portions of plant foods, including two main components of soluble
and insoluble fibers. Soluble fibers can be fermented by the florae in the colon, generating
physiologically active byproducts such as short chain fatty acids; while insoluble fiber may only
partially fermented in the colon but provide bulking to ease defecation. The high intake of DF
lowers blood pressure and cholesterol levels, resulting in the reduced risk of coronary heart
disease, stroke, hypertension, diabetes and obesity (Anderson et al., 2009). Unfortunately, the
average fiber consumption amongst adults in the U.S. is ~15 g a day instead of the recommended
25 to 30 g.
Polyphenols and DF are two well-documented dietary factors in the prevention of chronic
diseases, but are usually addressed as separate compounds acting independently in disease
prevention. A study conducted by Saura-Calixto demonstrated a synergistic function of DF and
dietary polyphenols, mainly in the development of an antioxidant environment in the colon
(Saura-Calixto, 2011). According to the study, DF acts as transportation for dietary polyphenols
and carries them to the colon where they are released by the action of the florae and produce
metabolites with potential health benefits. Nonextractable polyphenols (NEPP), largely
consisting of PACs, as well as individual ferulic acid, caffeic acid, hesperidin, naringenin,
catechin, epicatechin, ellagic acid, gallic acid derivatives, and p-hydroxybenzoic acid are major
antioxidants associated with DF. Prevention effects with consumption of DF-associated NEPP on
cardiovascular diseases and also on the risk colon cancer have been revealed in a great deal of in
vivo studies (Saura-Calixto, 2011).

44
DF Profile of PS and Fiber Analysis
Little information is currently available on the fiber content of PS. Shimizu-Ibuka et al.
(2009) studied the hypocholesterolemic effect of PS where they used a commercial roasted PS
which contained ~45% of TDF and only 2.2% in PS was soluble DF. The determination of total
DF content in food is usually accomplished by a combination of enzymatic and gravimetric
methods (Figure 2.5) as described in AOAC Official Method 991.43 (AOAC, 2005). Sample is
first digested by α-amylase to break long chain carbohydrates. Protease and amyloglucosidase
are used subsequently to hydrolyze proteins and amylopectins, respectively. After precipitation
by ethanol, the residue is filtered and washed. Oven dried residues are weighed. The TDF content
was calculated by subtracting the mass of the crude protein, ash, and blank from the mass of the
filtered and dried residues. Therefore, half of the samples are subjected to protein analysis while
the others are ashed.
Residue Mass (R) = W2 – W1 (mg)
Ash Mass (A) = W3 – W1 (mg)
Blank Mass (B) = Rblank – Ablank – Pblank (mg)
where, the blank containing only MES-TRIS buffer was processed identically as the samples. So
in the above equation, Rblank is the residue mass of the blank, Pblank is the crude protein mass of
the blank, and Ablank is the ash mass of the blank. Proteins in the blank originated from enzymes
used to digest protein and carbohydrate.

45
g TDF/100-g sample = (Rsample – Asample – Psample – B)/sample mass (mg) × 100
where, Rsample is the residue mass of the sample Psample is the crude protein mass of the sample,
and Asample is the ash mass of the sample, all in mg.
References
Anderson, J. W.; Baird, P.; Davis, R. H., Jr.; Ferreri, S.; Knudtson, M.; Koraym, A.; et al. Health
benefits of dietary fiber. Nutr Rev. 2009, 67, 188–205.
AOAC. Official Methods of Analysis of AOAC INTERNATIONAL (18th ed.). 2005.
Gaithersburg, MD: AOAC INTERNATIONAL.
Appeldoorn, M. M.; Vincken, J. P.; Sanders, M.; Hollman, P. C. H.; Gruppen, H. Combined
normal-phase and reversed-phase liquid chromatography/ESI-MS as a tool to determine the
molecular diversity of A-type procyanidins in peanut skins. J. Agric. Food Chem. 2009, 57,
6007–6013.
Arts, I. C. W.; van de Putte, B.; Hollman, P. C. H. Catechin contents of foods commonly
consumed in the Netherlands. 1. Fruits, vegetables, staple foods, and processed foods. J.
Agric. Food Chem. 2000, 48, 1746–1751.
Barberger-Gateau, P.; Raffaitin, C.; Letenneur, L.; Berr, C.; Tzourio, C.; Dartigues, J. F.;
Alperovitch, A. Dietary patterns and risk of dementia: the three-city cohort study. Neurology.
2007, 69, 1921–1930.
Baron, C. P. Protein oxidation in foods and its Prevention. In Food Oxidants and Antioxidants
Chemical Biological and Functional Properties; Bartosz, B., Ed.; CRC Press: Boca Raton,
FL, 2014; pp. 115–136.

46
Benzie, I. F. F.; Strain, J. J. The ferric reducing ability of plasma (FRAP) as a measure of
“antioxidant power”: The FRAP assay. Anal. Biochem. 1996, 239, 70–76.
Berardini, N.; Knödler, M.; Schieber, A.; Carle, S. Utilization of mango peels as a source of
pectin and polyphenolics. Innovat Food Sci Emerg Technol. 2005, 6, 442–452.
Birben, E.; Sahiner, U. M.; Sackesen, C.; Erzurum, S.; Kalayci, O. Oxidative stress and
antioxidant defense. World Allergy Organ J. 2012, 5, 9–19.
Bravo, L. Polyphenols: chemistry, dietary sources, metabolism, and nutritional significance. Nutr.
Rev. 1998, 56, 317–333.
Butterfield, D. A.; Castegna, A.; Drake, J.; Scapagnini, G.; Calabrese, V. Vitamin E and
neurodegenerative disorders associated with oxidative stress. Nutr Neurosci. 2002, 5,
229–239.
Cao, G.; Alessio, H. M.; Cutler, R. G. Oxygen-radical absorbance capacity assay for antioxidants.
Free Rad. Biol. Med. 1993, 14, 303–311.
Cencioni, C.; Spallotta, F.; Martelli, F.; Valente, S.; Mai, A.; Zeiher, A. M.; et al. Oxidative stress
and epigenetic regulation in ageing and age-related diseases. Int J Mol Sci. 2013, 14,
17643–17663.
Chukwumah, Y. C.; Walker, L. T.; Verghese, M.; Bokanga, M.; Ogutu, S.; Alphonse, K.
Comparison of extraction methods for the quantification of selected phytochemicals in
peanuts (Arachis hypogea). J. Agric. Food Chem. 2007a, 55, 285–290.
Chukwumah, Y.; Walker, L.; Vogler, B.; Verghese, M. Changes in the phytochemical composition
and profile of raw, boiled and roasted peanuts. J. Agric. Food Chem. 2007b, 55, 9266–9273.
Constanza K. E.; White B. L.; Davis J. P.; Sanders, T. H.; Dean, L. L. Value-added processing of
peanut skins: antioxidant capacity, total phenolics, and procyanidin content of spray dried

47
extracts. J. Agric. Food Chem. 2012, 60, 10776–10783.
Crozier, A.; Jaganath, I. B.; Clifford, M. N. Dietary phenolics: chemistry, bioavailability and
effects on health. Nat. Prod. Rep. 2009, 26, 1001–1043.
Dai, J.; Mumper, R. J. Plant phenolics: extraction, analysis and their antioxidant and anticancer
properties. Molecules. 2010, 15, 7313–7352.
Del Rio, D.; Rodriguez-Mateos, A.; Spencer, J. P.; Tognolini, M.; Borges, G.; Crozier, A. Dietary
(poly)phenolics in human health: structures, bioavailability, and evidence of protective
effects against chronic diseases. Antioxid. Redox Signal. 2013, 18, 1818–1892.
Dhalla, N. S.; Temsah, R. M.; Netticadan, T. Role of oxidative stress in cardiovascular diseases. J
Hypertens. 2000, 18, 655–673.
Dix, T. A.; Aikens, J. Mechanisms and biological relevance of lipid peroxidation initiation. Chem
Res Toxicol. 1993, 6, 2–18.
Eskin, N. A. M.; Przybylski, R. Antioxidants and shelf life of foods. In Food Shelf Life Stability:
Chemical, Biochemical, and Microbiological changes; Eskin, N. A. M., Robinson, D. S.,
Eds.; CRC Press: Boca Raton, FL, 2001; pp. 175–209.
Fairweather-Tait, S.; Bao, Y.; Broadley, M.; Collings, R.; Ford, D.; Hesketh, J.; Hurst, R.
Selenium in human health and disease. Antioxid. Redox Signal. 2010, 14, 1337–1383.
Fajardo, J. E.; Waniska, R. D.; Cuero, R. G.; Pettit, R. E. Phenolic compounds in peanut seeds:
enhanced elicitation by chitosan and effects on growth and aflatoxin B1 production by
Aspergillus flavus. Food Biotechnol. 1995, 9, 59–78
Finkel, T. Signal transduction by reactive oxygen species. J Cell Biol. 2011, 194, 7–15.
Flora, S. J. Structural, chemical and biological aspects of antioxidants for strategies against metal
and metalloid exposure. Oxid. Med. Cell. Longev. 2009, 2, 191–206.
48
Forman, H. J.; Torres, M. Reactive oxygen species and cell signaling: respiratory burst in
macrophage signaling. Am J Resp Crit Care. 2002, 166, S4–S8.
Frankel, E. N. Lipid oxidation: mechanisms, products and biological significance. J Am Oil
Chem Soc. 1984, 61, 1908–1917.
Galli, F.; Azzi, A. Present trends in vitamin E research. Biofactors. 2010, 36, 33–42.
Girrotti, A. W. Lipid hydroperoxide generation, turnover, and effector action in biological
systems. J. Lipid Res. 1998, 39, 1529–1542.
Giulivi, C.; Traaseth, N. J.; Davies, K. J. A. Tyrosine oxidation products: analysis and biological
relevance. Amino Acids. 2003, 25, 227–232.
Glazer, A. N. Phycoerythrin fluorescence-based assay for reactive oxygen species. Meth.
Enzymol. 1990, 186, 161–168.
Griendling, K. K.; Fitzgerald, G. A. Oxidative stress and cardiovascular injury part I: basic
mechanisms and in vivo monitoring of ROS. Circulation. 2003a, 108, 1912–1916.
Griendling, K. K., Fitzgerald, G. A. Oxidative stress and cardiovascular injury part II: animal and
human studies. Circulation. 2003b, 108, 2034–2040.
Hammerstone, J. F.; Lazarus, A. S.; Mitchell, A. E.; Rucker, R.; Schmitz, H. H. Identification of
procyanidins in cocoa (theobroma cacao) and chocolate using high-performance liquid
chromatography/mass spectrometry. J. Agric. Food Chem. 1999, 47, 490-496.
Harman, D. Aging: a theory based on free radical and radiation chemistry. J Gerontol. 1957, 2,
298–500.
Hartley, R. D.; Morrison, W. H. III; Himmelsbach, D. S.; Borneman, W. S. Cross-linking of cell
wall phenolic arabinoxylans in graminaceous plants. Phytochemistry. 1990, 29, 3701–3709.

49
He, F. J.; Nowson, C. A.; Lucas, M.; MacGregor, G. A. Increased consumption of fruit and
vegetables is related to a reduced risk of coronary heart disease: meta-analysis of cohort
studies. J. Hum Hypertens. 2007, 21, 717–728.
Hensley, K.; Robinson, K. A.; Gabbita, S. P.; Salsman, S.; Floyd, R. A. Reactive oxygen species,
cell signaling, and cell injury. Free Radical Bio Med. 2000, 28, 1456–1462.
Herrmann, K. Occurrence and content of hydroxycinnamic and hydroxybenzoic acid compounds
in foods. Crit. Rev. Food Sci. Nutr. 1989, 28, 315–347.
Hollman, P. C. H.; Arts, I. C. W. Flavonols, flavones and flavanols—nature, occurrence and
dietary burden. J. Food. Sci. Agric. 2000, 80, 1081–1093.
Huang, D.; Ou, B.; Prior, R.L. The chemistry behind antioxidant capacity assays. J. Agric. Food
Chem. 2005, 53, 1841–1856.
Hümmer, W.; Schreier, P. Analysis of proanthocyanidins. Mol. Nutr. Food Res. 2008, 52,
1381–1398.
Jain, P. K.; Joshi, H. Coumarin: chemical and pharmacological profile. J. Appl Pharm Sci. 2012,
2, 236–240.
Jeong, S-M.; Kim, S-Y.; Kim, D-R.; Jo, S-C.; Nam, K. C.; Ahn, D. U.; Lee, S-C. Effect of heat
treatment on the antioxidant activity of extracts from citrus peels. J. Agric. Food Chem. 2004,
52, 3389–3393.
Jomova, K.; Vondrakova, D.; Lawson, M.; Valko, M. Metals, oxidative stress and
neurodegenerative disorders. Mol. Cell. Biochem. 2010, 345, 91–104.
Kanner, J.; German, J. B.; Kinsella, J. E. Initiation of lipid peroxidation in biological systems.
Crit Rev Food Sci. 1987, 25, 319–364.

50
Karchesy, J. J.; Hemingway, R. W. Condensed tannins: (4β→8; 2β→O→7)-linked procyanidins
in Arachis hypogea L. J. Agric. Food Chem. 1986, 34, 966–970.
Kelm, M. A.; Johnson, J. C.; Robbins, R. J.; Hammerstone, J. F.; Schmitz, H. H.
High-performance liquid chromatography separation and purification of cacao (Theobroma
cacao L.) procyanidins according to degree of polymerization using a diol stationary phase. J.
Agric. Food Chem. 2006, 54, 1571–1576.
King, A.; Young, G. Characteristics and occurrence of phenolic phytochemicals. J. Am. Diet.
Assoc. 1999, 99, 213–218.
Kline, K.; Lawson, K. A.; Yu, W.; Sanders, B. G. Vitamin E and cancer. Vitam. Horm. 2007, 76,
435–461.
Kołakowska, A.; Bartosz, B. Oxidation of food components: an introduction. In Food Oxidants
and Antioxidants Chemical Biological and Functional Properties; Bartosz, B., Ed.; CRC
Press: Boca Raton, FL, 2014; pp. 1–20.
Kornsteiner, M.; Wagner, K. H.; Elmadfa, I. Tocopherols and total phenolics of 10 different nut
types. Food Chem. 2006, 98, 381-387.
Krueger, C. G.; Reed, J. D.; Feliciano, R. P.; Howell, A. B. Quantifying and characterizing
proanthocyanidins in cranberries in relation to urinary tract health. Anal. Bioanal. Chem.
2013, 405, 4385–4395.
Kryston, T. B.; Georgiev, A. B.; Pissis, P.; Georgakilas, A. G. Role of oxidative stress and DNA
damage in human carcinogenesis. Mutat Res. 2011, 711, 193–201
Ku, K. L.; Chang, P. S.; Cheng, Y. C.; Lien, C. Y. Production of stilbenoids from the callus of
Arachis hypogaea: a novel source of the anticancer compound piceatannol. J. Agric. Food
Chem. 2005, 53, 3877–3881.

51
Lacy, A.; O'Kennedy, R. Studies on coumarins and coumarin-related compounds to determine
their therapeutic role in the treatment of cancer. Curr. Pharm. Design. 2004, 10, 3797–3811.
Lea, A. G. H.; Arnold, G. M. The phenolics of ciders: Bitterness and astringency. J. Sci. Food
Agric. 1978, 29, 478 –483.
Lee, S-C.; Jeong, S-M.; Kim, S-Y.; Park, H-R.; Nam, K. C.; Ahn, D. U. Effect of far-infrared
radiation and heat treatment on the antioxidant activity of water extracts from peanut hulls.
Food Chem. 2006, 94, 489–493.
Lou, H.; Yamazaki, Y.; Sasaki, T.; Uchida, M.; Tanaka, H.; Oka, S. A-type proanthocyanidins
from peanut skin. Phytochemistry. 1999, 51, 297–308.
Lou, H.; Yuan, H.; Ma, B.; Ren, D.; Ji, M.; Oka, S. Polyphenols from peanut skins and their free
radical-scavenging effects. Phytochemistry. 2004, 65, 2391–2399.
Lund, M. N.; Heinonen, M.; Baron, C. P.; Estévez, M. Protein oxidation in muscle foods: a
review. Mol Nutr Food Res. 2011, 55, 83–95.
Márquez-Ruiz, C.; Holgado, F.; Velasco, J. Mechanisms of oxidation in food lipids. In Food
Oxidants and Antioxidants Chemical Biological and Functional Properties; Bartosz, B., Ed.;
CRC Press: Boca Raton, FL, 2014; pp. 79–114.
McMurrough, I.; McDowell, J. Chromatographic separation and automated analysis of flavanols.
Anal. Biochem. 1978, 91, 92–100.
Merken, H. M.; Beecher, G. R. Measurement of food flavonoids by high-performance liquid
chromatography. J. Agric. Food Chem. 2000, 48, 577–599.
Monagas, M.; Garrido, I.; Aguilar, R. L.; Cordoves, M. C. G.; Rybarczyk, A.; Amarowicz, R.;
Bartome, B. Comparative flavon-3-ol profile and antioxidant capacity of roasted peanut,
hazelnut, and almond skins. J. Agric. Food Chem. 2009, 57, 10590–10599.

52
Montero, L.; Herrero, M.; Ibáñez, E.; Cifuentes, A. Profiling of phenolic compounds from
different apple varieties using comprehensive two-dimensional liquid chromatography. J.
Chromatogr. A. 2013, 1313, 275–283.
Mueller-Harvey, I. Analysis of hydrolysable tannins: a review. Anim. Feed Sci. Tech. 2001, 91,
3–20.
Naczk, M.; Shahidi, F. Phenolics in cereals, fruits and vegetables: occurrence, extraction and
analysis. J. Pharm. Biomed. Anal. 2006, 41, 1523–1542.
Nawar, W. W. Lipids. In Food Chemistry, 3rd ed.; Fennema, O. R., Ed.; CRC Press: Boca Raton,
FL, 1996; pp. 225–235.
Nepote, V.; Grosso, N. R.; Guzmán, C. A. Optimization of extraction of phenolic antioxidants
from peanut skins. J. Sci. Food Agr. 2005, 85, 33–38.
Nepote, V.; Grosso, N. R.; Guzman, C. A. Extraction of antioxidant components from peanut
skins. Grasas Aceites. 2002, 53, 391–395.
Oliveira, C. M.; Ferreira, A. C. S.; de Freitas, V.; Silva, A. M. S. Oxidation mechanisms
occurring in wines. Food Res Int. 2011, 44, 1115–1126.
Ou, B.; Hampsch-Woodhill, M.; Prior, R. L. Development and validation of an improved oxygen
radical absorbance capacity assay using fluorescein as the fluorescent probe. J. Agric. Food
Chem. 2001, 49, 4619–4626.
Rigaud, J.; Escribano-Bailon, M. T.; Prieur, C.; Souquet, J-M.; Cheynier, V. Normal-phase
high-performance liquid chromatographic separation of procyanidins from cocoa beans and
grape seeds. J. Chromatogr. A. 1993, 654, 255–260.
Robards, K. Strategies for the determination of bioactive phenols in plants, fruit and vegetables.
J. Chromatogr. A. 2003, 1000, 657–691.

53
Pala F. B.; Gurkan H. The role of free radicals in ethiopathogenesis of diseases. Adv Mol Biol.
2008, 1, 1–9.
Payne, M. J.; Hurst, W. J.; Stuart, D. A.; Ou, B.; Fan, E.; Ji, H.; Kou, Y. Determination of total
procyanidins in selected chocolate and confectionery products using DMAC. J AOAC Int.
2010, 93, 89–96.
Peleg, H.; Naim, M.; Rouseff, R. L.; Zehavi, U. Distribution of bound and free phenolic acids in
oranges (Citrus sinensis) and grapefruits (Citrus paradisi). J. Sci. Food Agr. 1991, 57,
417–426.
Pellegrini, N.; Serafini, M.; Salvatore, S.; Del Rio, D.; Bianchi, M.; Brighenti, F. Total
antioxidant capacity of spices, dried fruits, nuts, pulses, cereals and sweets consumed in Italy
assessed by three different in vitro assays. Mol. Nutr. Food Res. 2006, 50, 1030–1038.
Porter, L .J.; Hrstich, L. N.; Chan, B. G. The conversion of procyanidins and prodelphinidins to
cyanidin and delphinidin. Phytochemistry. 1986, 25, 223–230.
Pratt, D. E.; Miller, E. E. A flavonoid antioxidant in Spanish peanuts. J. Am. Oil Chem. Soc. 1984,
61, 1064–1067.
Price, M. L.; Scoyoc, S. V.; Butler, L. G. A critical evaluation of the vanillin reaction as an assay
for tannin in sorghum grain. J. Agric. Food Chem. 1978, 26, 1214−1218.
Prior, R. L.; Cao, G. In vivo total antioxidant capacity: comparison of different analytical
methods. Free Radic. Biol. Med. 1999, 27, 1173–1181.
Prior, R. L.; Wu, X.; Schaich, K. Standardized methods for the determination of antioxidant
capacity and phenolics in foods and dietary supplements. J. Agric. Food Chem. 2005, 53,
4290–4302.

54
Pulido, R.; Bravo, L.; Saura-Calixto, F. Antioxidant activity of dietary polyphenols as determined
by a modified ferric reducing/antioxidant power assay. J. Agric. Food Chem. 2000, 48,
3396–3402.
Rains, J. L.; Jain, S. K. Oxidative stress, insulin signaling, and diabetes. Free Radic Biol Med.
2011, 50, 567–575.
Riboli, E.; Norat, T. Epidemiologic evidence of the protective effect of fruit and vegetables on
cancer risk. Am J Clin Nutr. 2003, 78, 559S–569S.
Robbins, R. J. Phenolic acids in foods: an overview of analytical methodology. J. Agric. Food
Chem. 2003, 51, 2866–2887.
Romero-Pérez, A. I.; Ibern-Gómez, M.; Lamuela-Raventós, R. M.; De La Torre-Boronat, M. C.
Piceid, the major resveratrol derivative in grape juices. J. Agric. Food Chem. 1999, 47,
1533–1536.
Rosenblatt, M.; Peluso, J. V. Determination of tannins by photocolorimeter. J. Assoc. Offic. Agric.
Chem. 1941, 24, 170–181.
Sarnoski, P. J.; Johnson, J. V.; Reed, K. A.; Tanko, J. M.; O’Keefe, S. F. Separation and
characterization of proanthocyanidins in Virginia type peanut skins by LC-MSn. Food Chem.
2012, 131, 927–939.
Saura-Calixto, F. Dietary fiber as a carrier of dietary antioxidants: an essential physiological
function. J. Agric. Food Chem. 2011, 59, 43–49.
Scalbert, A.; Manach, C.; Morand, C.; Remesy, C.; Jimenez, L. Dietary polyphenols and the
prevention of diseases. Crit. Rev. Food Sci. Nutr. 2005, 45, 287-306.
Serrano, J.; Puupponen-Pimi, R.; Dauer, A.; Aura, A-M.; Saura-Calixto, F. Tannins: Current
knowledge of food sources, intake, bioavailability and biological effects. Mol. Nutr. Food

55
Res. 2009, 53, S310–S329.
Sevanian, A.; Hochstein, P. Mechanisms and consequences of lipid peroxidation in biological
systems. Annu Rev Nutr. 1985, 5, 365–390.
Shahidi, F. Antioxidants in food and food antioxidants. Nahrung. 2000, 44, 158–163.
Shimizu-Ibuka, A.; Udagawa, H.; Kobayashi-Hattori, K.; Mura, K.; Tokue, C.; Takita, T.; Arai, S.
Hypocholesterolemic effect of peanut skin and its fractions: a case record of rats fed on a
high-cholesterol diet. Biosci. Biotech. Biochem. 2009, 73, 205–208.
Sies, H. Oxidative stress: oxidants and antioxidants. Exp Physiol. 1997, 82, 291–295.
Singleton, V. L.; Orthofer, R.; Lamuela-Raventós, R. M. Analysis of total phenols and other
oxidation substrates and antioxidants by means of the Folin-Ciocalteu reagent. Meth.
Enzymol. 1999, 299, 152–178.
Singleton, V. L.; Rossi, J. A. Colorimetry of total phenolics with phosphomolybdic
phosphotungstic acid reagents. Am. J. Enol. Vitic. 1965, 16, 144–158.
Srinivasan, S.; Xiong, Y. L. Gelation of beef heart surimi as affected by antioxidants. J Food Sci.
1996, 61, 707–711.
Stadtman, E. R.; Levine, R. L. Free radical-mediated oxidation of free amino acids and amino
acid residues in proteins. Amino Acids. 2003, 25, 207–218.
Stadtman, E. R.; Levine, R. L. Protein oxidation. Ann NY Acad Sci. 2000, 899, 191–208.
Talcott, S. T.; Passeretti, S.; Duncan, C. E.; Gorbet, D. W. Polyphenolic content and sensory
properties of normal and high oleic acid peanuts. Food Chem. 2005, 90, 379–388.
Teixeira, J.; Gaspar, A.; Garrido, E. M.; Garrido, J.; Borges, F. Hydroxycinnamic acid
antioxidants: an electrochemical overview. BioMed Res. Int. 2013, 2013, Article ID 251754.

56
Venskutonis, P. R. Natural antioxidants in food systems. In Food Oxidants and Antioxidants
Chemical Biological and Functional Properties; Bartosz, B., Ed.; CRC Press: Boca Raton,
FL, 2014; pp. 235–302.
Wallace, T. C.; Giusti, M. M. Evaluation of parameters that affect the
4-dimethylaminocinnamaldehyde assay for flavanols and proanthocyanidins. J Food Sci.
2010, 75, C619–C625.
Waris, G.; Ahsan, H. Reactive oxygen species: role in the development of cancer and various
chronic conditions. J Carcinog. 2006, 5, 1–8.
Winterbourn, C. C.; Hampton, M. B. Thiol chemistry and specificity in redox signaling. Free
Radical Bio Med. 2008, 45, 549–561.
Xiong, Y. L. Protein oxidation and implications for muscle food quality. In Antioxidants in
Muscle Foods: Nutritional Strategies to Improve Quality; Decker, E., Faustman, C.,
Lopez-Bote, C. J. Eds.; John Wiley & Sons, Inc.: Hoboken, NJ, 2000; pp. 85–111.
Yu, J.; Ahmedna, M.; Goktepe, I. Effects of processing methods and extraction solvents on
concentration and antioxidant activity of peanut skin phenolics. Food Chem. 2005, 90,
199–206.
Yu, J.; Ahmedna, M.; Goktepe, I.; Dai, J. Peanut skin procyanidins: composition and antioxidant
activities as affected by processing. J. Food. Compos. Anal. 2006, 19, 364–371.
Zhang, Y.; Seeram, N. P.; Lee, R.; Feng, L.; Heber, D. Isolation and identification of strawberry
phenolics with antioxidant and human cancer cell antiproliferative properties. J. Agric. Food
Chem. 2008, 56, 670–675.

57
Table 2.1 Classification of major dietary phenolics and related food sources (Adapted from King & Young, 1999). Class & subclass Phytochemicals Food sources
Flavonoids
Flavonols Quercetin, kaempferol, myricetin
Olives, onions, apples, tea, broccoli
Flavanonols Taxifolin Red onions
Flavones Apigenin, luteolin Olives, Celery, Broccoli
Flavanones Eriodictyol, hesperetin, naringenin
Citrus fruits
Flavanols Catechin, Epicatechin, Epigallocatechin
Tea, cocoa, chocolate, apples, grapes
Isoflavones Genistein, daidzein Soybeans, tofu, soy milk
Phenolic acids
Hydroxybenzoic acid
Ellagic acids, gallic acids, p-hydroxybenzoic acids, protocatechuic acids
Raspberry, strawberry, grapes
Hydroxycinnamic acid
Caffeic acids, ferulic acids
Apples, pears, citrus fruits, some vegetables, whole grains, coffee
Tannins
Condensed tannins Procyanidins and proanthocyanidins (PACs)
Cranberry, cocoa, apples, strawberries, grapes, red wine, peanuts, tea, chocolate
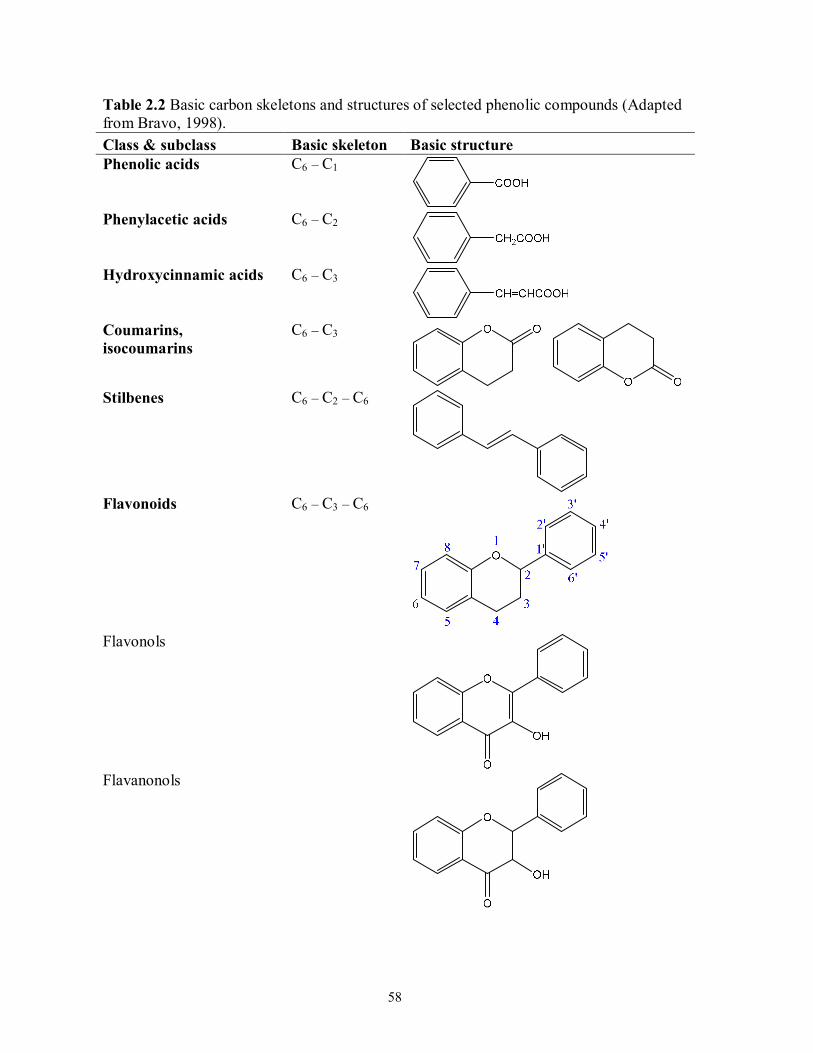
58
Table 2.2 Basic carbon skeletons and structures of selected phenolic compounds (Adapted from Bravo, 1998). Class & subclass Basic skeleton Basic structure Phenolic acids C6 – C1
Phenylacetic acids C6 – C2
Hydroxycinnamic acids C6 – C3
Coumarins, isocoumarins
C6 – C3
Stilbenes C6 – C2 – C6
Flavonoids C6 – C3 – C6
Flavonols
Flavanonols

59
Flavones
Flavanones
Flavanols
Isoflavones
Biflavonoids (C6 – C3 – C6)2 Condensed Tannins (C6 – C3 – C6)n

60
Figure 2.1 Biosynthesis of phenolic compounds: (A) Biosynthesis of phenylpropanoids and
phenolic acids and (B) Biosynthesis of flavonoids (Adapted from Shahidi, 2000).
Abbreviations are as follows: PAL = Phenylalanine ammonia lyase; TAL = Tyrosine
ammonia lyase.

61
(A)
PhenylalaninePAL
–NH3
trans-Cinnamic acid
p-Coumaric acid
–C2
Benzoic acid
–C2
p-Hydroxybenzoic acid
Hydroxylase
P450 Monooxygenase
Tyrosine–NH3
TAL
Caffeic acid
O-Methyl transferase
Sinapic acid Ferulic acid
Hydroxylase
O-Methyl transferase
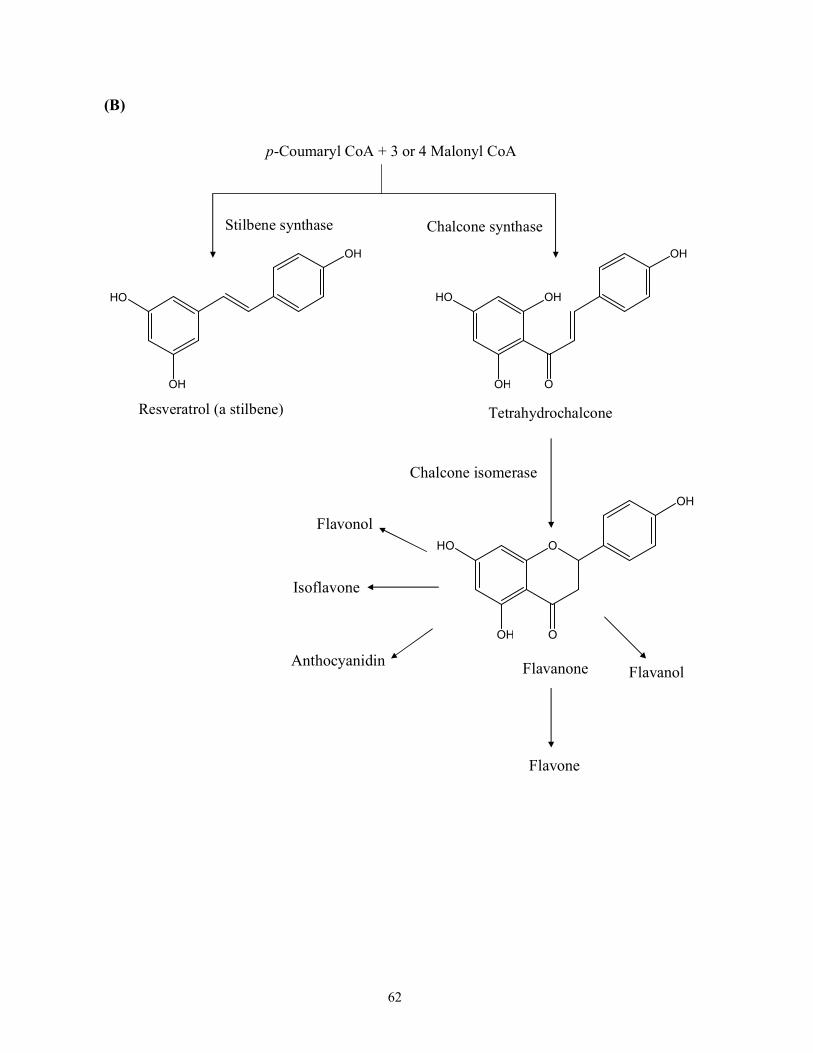
62
(B)
p-Coumaryl CoA + 3 or 4 Malonyl CoA
Stilbene synthase Chalcone synthase
OH
HO
OH
Resveratrol (a stilbene)
O
HO OH
OH
OH
Tetrahydrochalcone
O
O
HO
OH
OH
Flavanone
Flavonol
Isoflavone
Anthocyanidin
Flavone
Flavanol
Chalcone isomerase

63
R2
OH
HO OR1
OH
OH
R3
Flavanol R1 R2 R3 Catechin H OH H Epicatechin (EC) H H OH Gallocatechin (GC) OH OH H Epigallocatechin (EGC) OH H OH Gallocatechin gallate (GCG) OH
O-Gallate
H
Epicgallocatechin gallate (EGCG)
OH H
O-Gallate
Figure 2.2 Chemical structures of flavan-3-ols.
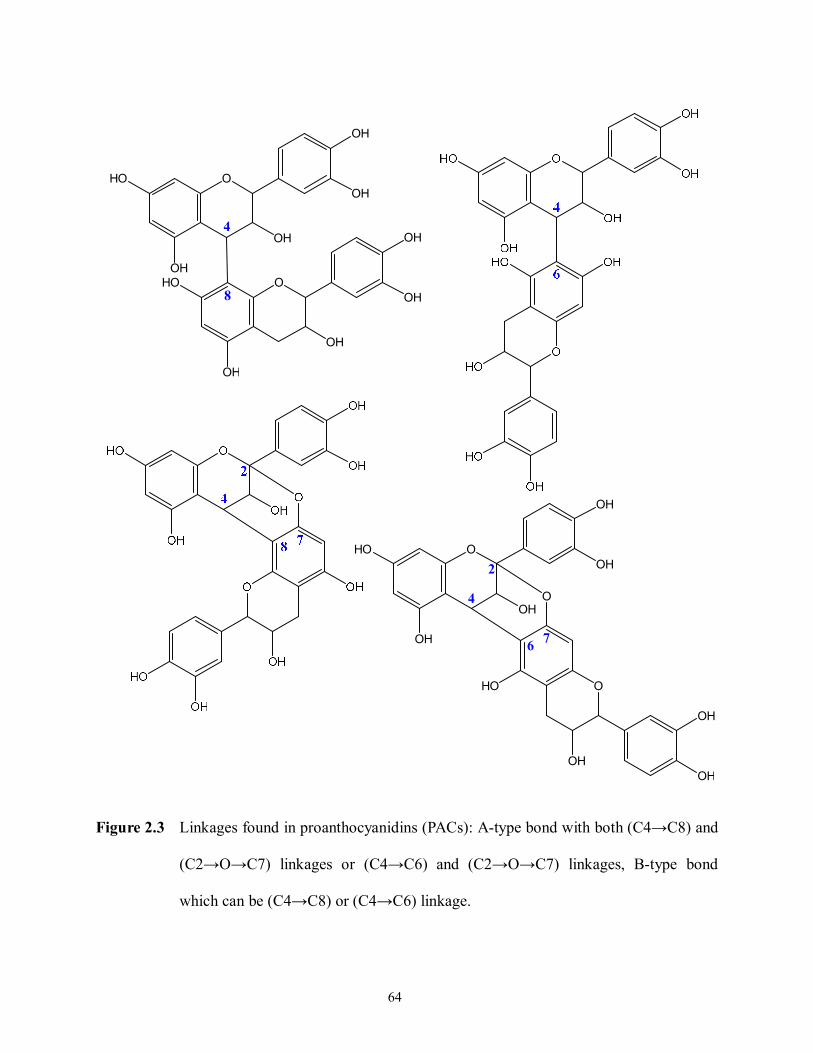
64
Figure 2.3 Linkages found in proanthocyanidins (PACs): A-type bond with both (C4→C8) and
(C2→O→C7) linkages or (C4→C6) and (C2→O→C7) linkages, B-type bond
which can be (C4→C8) or (C4→C6) linkage.
OH
OH
HO OOH
OH
OH
OH
HO OOH
OH4
8
OH
HO OOH
OH
OOH
O
OH
HO
OH
OH
6
4
2
7

65
Figure 2.4 Proposed mechanisms for (A) Dimethylaminocinnamaldehyde (DMAC) assay
(Adapted from Wallace & Giusti, 2010), (B) Oxygen radical absorbance capacity
(ORACFL) assay, and (C) Ferric Reducing Antioxidant Power (FRAP) assay
(Adapted from Huang, Ou, & Prior, 2005). Abbreviations are as follows: ArOH,
antioxidant; ArO•, phenoxyl radical; ROO•, peroxyl radical; ROOH, hydroperoxide.

66
(A)
+ H+
– H2O+ (Epi)catechin
DMAC-(Epi)catechin Complex (green at 640 nm)
DMAC

67
(B)
+ ROO• ROOH +
+ ROO• + ArOH ROOH + ArO• +
Dehydrofluorescin (no signal at 520 nm)
Fluorescein (emission at 520 nm)
Fluorescein
Fluorescein

68
(C)
Fe2+-TPTZ (blue at 593 nm)
Fe3+-TPTZ (colorless)
ArOH[ArOH]•+

69
Figure 2.5 The flowchart of total dietary fiber (TDF) assay. Adapted from AOAC Official
Method 991.43 (AOAC, 2005).
Heat Stable, α-Amylase, incubation at pH 6.0 at 95 oC (15 min)
Protease, incubation at pH 7.5 at 60 oC (30 min)
Amyloglucosidase, incubation at pH 4.5 at 60 oC (30 min)
Ethanol Precipitation
Alcohol and Acetone Washes
Drying
Kjeldahl Protein Determination Ash Determination, 5 hour at 525 oC
Calculation of Total Dietary Fiber
70
CHAPTER 3
EFFECT OF PEANUT SKINS INCORPORATION ON THE COLOR, TEXTURE,
AND TOTAL PHENOLICS CONTENT OF PEANUT BUTTERS
Ma, Y.; Kerr, W. L.; Cavender, G. A.; Swanson, R. B.; Hargrove, J. L.; Pegg, R. B. Journal of Food Process Engineering. 2013, 36, 316–328. Reprinted here with permission of Publisher (John Wiley and Sons).

71
Abstract
The impact of incorporating ground dry-blanched or roasted peanut skins (PS, three types: light-,
medium- and dark-roasted) into peanut butter as a functional food ingredient was examined. A
desirable grind size for the PS of less than 300 mm was achieved in most cases by milling the
skins with the sugar. Adding ground PS to peanut butter at 1.25, 2.5, 3.75 and 5.0% (w/w)
resulted in a concentration-dependent change in the Commission Internationale de l’Éclairage L*
C* h values. Peanut butters formulated with medium- and dark-roasted PS showed an increase in
hardness, and were generally more adhesive than those without PS or with dry-blanched PS. A
marked change in spreadability was found with greater than 2.5% added PS. Incorporation of
dry-blanched PS, especially at levels below 3.75%, produced the fewest alterations in physical
properties of the peanut butters compared with the control. Importantly, a
concentrationdependent increase in the total phenolics content (TPC) was evident with PS
fortification. Dry-blanched PS had a TPC of ~166 mg (+)-catechin equivalents/g extract and
yielded peanut butters with a 32, 33 and 38% higher TPC than found with light-, medium- and
dark-roasted skin incorporation, respectively. Correspondingly, dry-blanched PS addition at 1.25,
2.5, 3.75 and 5.0% (w/w) resulted in an increase in the TPC by 86, 357, 533 and 714%,
respectively, compared with peanut butters without PS fortification.

72
3.1 Introduction
As demonstrated by George Washington Carver more than a century ago, peanuts (Arachis
hypogaea L.) are a valuable cash crop to the southern U.S.A. Revenue generated from the peanut
crop in the U.S.A. alone has averaged $1 billion annually from 1996 to 2001 (Dohlman, Young,
Hoffman, & Mcbride, 2004). Peanuts are consumed in many parts of the world with China, India
and the U.S.A. accounting for roughly two-thirds of the world’s peanut production (United States
Department of Agriculture [USDA 2011]). While in many countries the argest portion of the crop
is destined for oil production, the major products made from peanuts in the U.S.A. are peanut
butter, salted peanuts, confections and roasted peanuts in-the-shell (Carley, 1983). Peanut butter
is considered the most important peanut-based product, with more than half of the U.S. crop used
for its manufacture (Woodroof, 1983). The volume of edible peanuts utilized for peanut butter
significantly increased from 400 million pounds in the early 1950s (Woodroof 1983) to over
1,000 million pounds in 2008 (USDA 2008–2009). According to the USDA data for the years
2008–2011 (USDA 2008–2012), the quantity of commercially-processed shelled edible-grade
peanuts utilized in the production of peanut butter products has increased from ~1,000 to ~1,200
million pounds. These values reflect 65 and 60% of the total edible peanut usage in the U.S.A.,
respectively.
The profile of oil and protein in peanut kernels makes peanut butter a highly nutritious
end-product (Knauft, Moore & Gorbet, 1993; Andersen, Hill, Gorbet & Brodbeck, 1998),
especially in the form of sandwiches where the wheat flour of bread complements the limiting
amino acids of peanuts. The appealing flavor, convenience of use and excellent shelf life of
peanut butter contribute greatly to its popularity. According to the American Peanut Council,
peanut butter ranks as one of the favorite foods of American households (Jolly et al. 2005).

73
Owing to both its nutrient profile and palatability, peanut butter is nutritious for growing children;
it is often taken to schools for lunch or has been formulated in other lunch-based foodstuffs
(Woodroof, 1983).
Peanut butter is relatively simple to manufacture: it involves the steps of shelling, dry
roasting, blanching and grinding the peanuts into a paste (Woodroof, 1983). Shelled peanuts,
generally from Runner varieties, are first subjected to a uniform roasting to develop the
characteristic peanut flavor. The generated flavor and color characteristics will directly impact
the palatability of the resultant peanut butter. After a quick cooling, peanut skins (PS) are
removed via dry blanching before the meats are ground to the desired texture (i.e., smooth or
chunky formulation). Additional ingredients, such as salt, sugar and stabilizer, may be added in
order to improve consumer appeal. Stabilizers (i.e., hydrogenated cottonseed, canola, soybean,
palm oils or a mixture therefrom) help to prevent the separation of the oil and solid fractions. As
the peanut butter cools after processing, either naturally or by shock chilling, the drop in
temperature initiates the process of crystallization of the stabilizer leading to entrapment of oil
and prevention of its migration to the surface of the product. The tempering period of freshly
prepared peanut butter is important to allow for proper formation of the crystal network.
In the U.S.A., the Food and Drug Administration (FDA) has established a legal standard of
identity (21 CFR § 164.150) in the Code of Federal Regulations (CFR): it states that for a
product to be called “peanut butter,” it must contain no less than 90% peanuts by weight and no
more than 55% fat; otherwise, it will be referred to as a peanut spread (Merrill & Collier, 1974;
FDA 2009). The remaining 10% may consist of salt, sweetener for the enhancement of flavor,
emulsifier and/or stabilizer. In 2012, market products labeled as peanut butters can be procured,
which contain additives and flavorings such as dark chocolate, cinnamon and raisins, maple

74
syrup, and honey, even though they violate the FDA’s standard of identity.
A by-product of the peanut industry is the skins. Most skins are dumped in landfills, whereas
only a small quantity is added to animal feed (Sobolev & Cole, 2004). In 1999/2000, over
750,000 tons of PS were generated worldwide based on an estimated 29.1 million tons
production of peanuts with an average skin content of 2.6%. In the U.S.A., the total volume of
commercially processed shelled ediblegrade peanuts was roughly 2,000 million pounds during
2011 (USDA 2011–2012); hence, ca. 52 million pounds of PS were generated. PS are only now
being recognized as extremely rich in polyphenols and fiber, and therefore with potential as a
functional food ingredient. Nepote et al. (2002) reported a content of ca. 159 mg total
phenolics/g defatted dry skin, which also had a marked antioxidant activity, as demonstrated by
its capacity to inhibit oxidation of sunflower oil. A study conducted by Yu, Ahmedna, and
Goktepe (2005) revealed that the phenolics from PS are abundant not only in the quantity but
also in the variety of phenolics, which primarily include phenolic acids (e.g., caffeic, chlorogenic,
ferulic, and coumaric acids), flavonoids {e.g., (epi)catechins and epigallocatechin (EGC),
catechin gallate (CG), and epicatechin gallate (ECG)}, and stilbene (e.g., trans-resveratrol).
An increased awareness of the potential role of antioxidants in health promotion and disease
prevention has led to a demand for antioxidant-enriched foods. PS are a concentrated source of
phenolics; hence, their incorporation into foods would effectively enhance the antioxidant
capacity without significantly increasing the cost of the finished product. Despite the tremendous
potential benefit of PS, allergy-based issues because of possible protein residue on the skins, and
processing challenges, for the most part, have prevented PS utilization as a functional food
ingredient in value-added products. Quite interesting is that the proanthocyanidins in PS have
demonstrated anti-allergic effects both in vitro and in vivo: these are attributed to the formation

75
of indigestible complexes (i.e., PS covalently bound to peanut allergens, Chung & Reed, 2012),
the lowering of serum IgE and IgG1 levels (Takano et al., 2007), and the inhibition of
degranulation induced by antigen stimulation of rat basophilic leukemia (RBL-2H3) cells
(Tomochika et al., 2011).
The archetypal texture of peanut butter is characterized by optimum levels of firmness, high
cohesiveness and spreadability, as well as sufficient adhesiveness. The variety of peanut,
processing conditions and added ingredients can significantly impact the textural properties of
peanut butters. As reported by Crippen et al. (1989) grind size, sucrose and salt levels affect
sensory smoothness, hardness, spreadability, adhesiveness and cohesiveness of peanut butters.
Reduced fat products are referred to as a peanut spread, not a peanut butter, because they only
contain roughly 60% peanuts and do not adhere to the USDA standard of identity for peanut
butter (Anon., 2002). Soy protein and corn syrup solids are often added to substitute for the
missing peanuts. Most times, this results in undesirable textural and sensory properties as
exhibited by a lesser desirable peanut flavor, increased grittiness and a sweeter taste.
Incorporation of PS into peanut butter will maintain the standard identity of the product and
should increase the product’s fiber content and antioxidant activity, diversify the existing market,
and provide economic returns for this by-product. Sensory acceptance of the reformulated peanut
butters with PS was confirmed by Sanders et al. (2011); the authors noted that consumers
showed a preference for food products with claims associated with high phenolics. Any
alterations in textural and physical properties, important to sensory properties and processing
aspects, have yet to be reported for peanut butter with added PS.
The main objectives of the present study are (1) to formulate peanut butters fortified with
varying levels of PS (both dry-blanched and roasted), while maintaining the product’s standard

76
of identity; (2) to assess the effect of PS incorporation on the physical attributes of the finished
products compared with the peanut butter void of PS; and (3) to determine the impact on the total
phenolics content (TPC) and potential antioxidant activity of the PS-containing peanut butters.
3.2 Materials and Methods
Materials
Dry-blanched PS were provided by Sylvester Blanching, a division of Universal Blanchers,
LLC (Sylvester, GA). Roasted PS (light, medium and dark) were a gift from the Golden Peanut
Company, LLC (Alpharetta, GA). Peanut paste, flour salt and hydrogenated vegetable oil (i.e.,
stabilizer) were supplied by Seabrook Ingredients, Inc. (Edenton, NC). Domino-premium pure
cane granulated sugar and Bakers & Chefs refined, bleached and deodorized (RBD) peanut oil
were purchased from Sam’s Club (Athens, GA). All solvents and reagents were of analytical
American Chemical Society [ACS] grade, unless otherwise specified. Methanol, ethanol (95%),
and hexanes were purchased from VWR International (Suwanee, GA). Folin & Ciocalteu’s
phenol reagent and (+)- catechin were acquired from the Sigma-Aldrich Chemical Co. (St. Louis,
MO).
Physical Methods
Peanut Butter Processing
Seventeen formulations of peanut butter (~45% total fat) were prepared; the details are
provided in Table 3.1. For each formulation, PS and sugar were ground together at different
ratios prior to inclusion into the product using an electrically-driven stone grinder (Super
Masscolloider CA6-3, Masuko Sangyo Co., Ltd., Kawaguchi City, Saitama, Japan) fitted with a

77
BA6-80 grit stone assembly. More specifically, 22.9, 45.8, 68.7 and 91.6 g of dry-blanched PS
were ground in the masscolloider with 195 g of sugar; the PS–sugar powders, after sieving (see
details later) were then added to peanut butter formulations to achieve PS addition levels of 1.25,
2.5, 3.75 and 5.0% PS. After grinding, the PS–sugar mixtures were sieved through a no. 20 mesh
screen using a vibratory separator (Model LS18S3333, Sweco Inc., Florence, KY). Particles too
large to pass through the screen were subsequently re-ground.
Commercial peanut paste, taken from a 4 °C cooler, was first softened in a steam cabinet
(Model SB 24.24, Pyramid Food Processing Equipment Manufacturing Inc., Tewksbury, MA),
and then warmed to ~60 °C in a 19-L steam kettle (Dover Corporation, Elk Grove Village, IL) to
facilitate portioning. RBD peanut oil, flour salt (~300 mm i.d.) and ground PS–sugar mixtures
(see Table 3.1 for quantities) were added to the portioned peanut paste. The contents were mixed
in a jacketed food processor (Model R10, Robot Coupe USA, Inc., Jackson, MS) under a 60-kPa
vacuum to prevent the incorporation of air. For all trials, the vacuum was produced by a Welch
vacuum pump 8910A (Welch Vacuum Technology, Inc., Skokie, IL) and the heat generated by
circulating a 76.5 °C propylene glycol solution through the jacket of the food processor with a
temperature-controlled bath (Neslab Instruments, Inc., Newington, NH). Stabilizer was added
after the temperature of the mixture reached 70 °C; the product was blended for an additional 5
min, after which, the hot peanut butter (~450 g) was poured into 500-mL home canning jars
(Hearthmark, LLC, Daleville, IN). After the capped peanut butters had cooled to room
temperature, they were placed in storage at 4 °C until the time of analysis. Each batch comprised
3 kg of the final product.

78
Particle Size Distribution of Ground Peanut Skins (PS)
PS-sugar mixtures were placed in separate Petri dishes and were washed with deionized
water to remove the sugar. The isolated ground skins were then immersed in 95% (v/v) ethanol
and a picture was taken using a Leica MZ6 Stereomicroscope (Leica Biosystems Richmond, Inc.,
Richmond, IL). Microscopy images of the ground PS samples were analyzed by ImageJ (v. 1.44,
U.S. National Institutes of Health, Bethesda, MD) to obtain a distribution of particle sizes, and
then expressed as Feret’s diameter.
Color Analysis of Peanut Butters
Peanut butter samples were removed from refrigerated storage and equilibrated to room
temperature (~22 °C) for 24 h before analyzing. Samples of each formulation were then
transferred to glass Petri dishes (55 mm i.d. × 17 mm, Fisher Scientific Ltd., Suwanee, GA), and
carefully packed and leveled to prevent air pockets. A colorimeter with a 2-degree observer angle
(Model CR-410, Konica Minolta Sensing Americas, Inc., Ramsey, NJ) was employed to assess
color using the Commission Internationale de l’Éclairage L* C* h system, which represents a
color space expressed in cylindrical coordinates. Prior to measurement, the colorimeter was
calibrated with a white D65 standard (Y = 94.7, x = 0.3156, and y = 0.3319) provided by the
manufacturer. L* indicates lightness (0 to 100) and is the same as the L* of the L* a* b* color
space, C* is chroma {0 to 100; C* = [(a*)2 + (b*)2)½]}, which measures the color saturation or
purity, and h is hue angle [h = arctan (b*/a*)] that indicates the primary color (0 to 360°). All
measurements were made from the bottom side of the Petri dishes to prevent equipment fouling.
Color was measured four times for each sample and mean values are reported. Prior to each
replication, the colorimeter was recalibrated against a white standard tile provided by the

79
manufacturer.
Texture Analysis of Peanut Butters
Each peanut butter formulation was subjected to a modified texture profile analysis according
to Ahmed and Ali (1986) using a texture analyzer (Model TA-XT2i, Stable Microsystems Ltd.,
Godalming, Surrey, U.K.) fitted with a 5-kg load cell and a 25-mm cylindrical probe (TA-3) with
rounded edges to prevent shearing. Small Petri dishes (60 × 15 mm) were filled with peanut
butter and leveled by scraping a straight edge across the top of the dish. Each Petri dish was
secured in place and penetrated twice by the probe to a depth of 4 mm. The crosshead speed was
set at 0.8 mm/s during both the compression and return cycles with a 5-s pause between
compressions. Data were collected and analyzed with the Texture Expert Exceed software
package (v. 2.61, Stable Microsystems). Parameters of hardness, cohesiveness, gumminess and
adhesiveness were acquired from the analysis of the force–time plots after Pons and Fiszman
(1996).
Instrumental Spreadability Evaluation of Peanut Butters
Spreadability of peanut butters was assessed using the texture analyzer described earlier, but
fitted with a conical spreadability rig (Model HDP/SR, Stable Microsystems). Samples of each
peanut butter formulation were tightly packed into individual sample cones to exclude air
pockets and then leveled off with a spatula to give a uniform upper surface. The downward
crosshead speed was set at 3.0 mm/s, and each sample was penetrated to the full depth of the
cone. Firmness and work of shear were determined by analysis of the force–time plot, with the
former being obtained from the maximum force (g) and the latter being the area of the positive

80
region of the curve expressed in g•s (Raju & Pal, 2009).
Chemical Methods
Phenolic Extraction
Extraction of phenolics from PS and fortified peanut butters was carried out according to
Amarowicz et al. (2004) with slight modification. In brief, samples were placed in Whatman
cellulose extraction thimbles (43 mm i.d. × 123 mm e.l., VWR International, Suwanee, GA),
covered with a plug of glass wool and defatted in a Soxhlet extraction apparatus under reflux for
12–14 h with hexanes. Defatted PS and peanut butters were transferred to 125-mL Erlenmeyer
flasks at a mass-tosolvent ratio of 1:10 (w/v) with 80% (v/v) acetone. Extractions were
performed in a gyratory water bath shaker (Model G76, New Brunswick Scientific Company,
Inc., New Brunswick, NJ) set at 150 rpm and a temperature of 45 °C for 30 min. The slurry was
then filtered by gravity through fluted P8 filter paper (Fisher Scientific). The extraction process
was repeated twice as described earlier. All filtrates were pooled and acetone was evaporated
with a Büchi Rotavapor R-210 using a V-700 vacuum pump connected to a V-850 vacuum
controller (Büchi Corporation, New Castle, DE) at 45 °C. Aqueous residue was frozen and then
lyophilized in a FreeZone 2.5-L bench-top freeze dryer (Labconco Corporation, Kansas City,
MO) to ensure all traces of moisture were removed and then stored in amber glass bottles at
–20 °C until further analyzed.
Preparation of Polyphenolic Extracts (PPEs)
About 3 g of each crude peanut butter extract was dispersed in 10 mL of deionized water,
sonicated to facilitate dissolution, and then applied to the top of a chromatographic column (30

81
mm i.d. × 340 mm e.l., Kontes Glass Inc., Vineland, NJ) packed with Amberlite XAD-16 [(bead
size: 20-60 mesh), Sigma-Aldrich] and washed with ~1000 mL of deionized water to remove
sugars and organic acids. After the first 800 mL, the Brix reading of the eluent was checked
using a digital PAL-1 pocket refractometer (Model 3810, Atago U.S.A., Inc., Bellevue, WA) until
a zero value was reached. The polyphenolic extract (PPE) was then eluted from the column with
anhydrous methanol (~300 mL) as the mobile phase. Methanol was evaporated using the Büchi
Rotavapor as described earlier. The PPE was lyophilized via the bench-top freeze dryer to ensure
all traces of moisture were removed and then stored in amber glass bottles at –20 °C until used
further.
Total Phenolics Content (TPC)
The TPC value of each extract was determined spectrophotometrically using the classical
Folin–Ciocalteu assay (Singleton & Rossi, 1965). Briefly, 1.0 mL of a methanolic solution of
each extract was pipetted into a test tube followed by the addition of 7.5 mL of deionized water,
0.5 mL of 2 N Folin & Ciocalteu’s phenol reagent, and 1.0 mL of a saturated Na2CO3 solution.
The contents were vortexed for 15 s followed by a 60-min resting period at room temperature to
allow for optimal color development. Absorbance readings of samples were taken at λmax = 750
nm with an Agilent 8453 UV-visible spectrophotometer (Agilent Technologies, Wilmington, DE).
Quantification was based on a standard curve generated with (+)-catechin. Sample TPCs were
expressed as mg (+)-catechin equivalents/g PS [dry weight (d.w.)] or 100 g peanut butter [fresh
weight (f.w.)].

82
Statistical Analysis
Extractions were performed in triplicate from different batches of PS for each type and from
formulated peanut butters. All physical and chemical measurements were replicated a minimum
of three times. Results were then expressed as means ± standard deviations reported for each data
grouping. Data were analyzed by a one-way analysis of variance (ANOVA) statistical model
using the statistical analysis system (SAS, v. 9.3, SAS Institute Inc., Cary, NC). When
significance was determined at P < 0.05, data for each treatment across the processing method
were subjected to Tukey’s Studentized Range test to segregate treatment means.
3.3 Results and Discussion
Particle Size Distribution of Ground PS
A distribution of particle sizes represented by Feret’s diameters (i.e., the maximum caliper,
measured from the longest distance between any two points along the selection boundary) for
ground PS preparations is depicted in Figure 3.1. The particle size distributions of PS samples
ranged from 9 to 2,140 μm for dry-blanched PS ground with granulated sugar at a ratio of
45.8:195 (w/w). Noteworthy is that particle sizes greater than 400 μm comprised less than 1% of
the PS-sugar mixture. The distribution range was similar when the PS-sugar ratio increased to
91.6:195 (w/w). For ground dry-blanched PS, greater than 75% of the particles had a size
ranging from 9 to 147 μm. The particle size distribution for dark roasted PS showed a distinct
difference from that of dry-blanched ones, ranging from 27 to 1,441 μm. Greater than 80% of the
dark roasted PS particles were within 27 to 269 μm. Distribution of the light-roasted skins
approximated that of the dry blanched skins.

83
One challenge in the peanut butter industry is that added salt and sugar are insoluble in the
low moisture conditions, and may lead to large gritty particles in the final product (Woodroof,
1983). To avoid such grittiness, powder sugar and pulverized salt (i.e., flour salt) are generally
employed during peanut butter manufacturing. Based on similar concerns, the PS used in this
study were ground with granulated sugar to a very fine particle size to prevent a gritty mouthfeel.
We found that efficient grinding of PS to the appropriate size range could best be attained by
simultaneously grinding granulated sugar and PS together.
Color Analysis
The data from the color measurements are presented in Table 3.2. Significant differences in
color were found for both type and level of PS incorporated. In the L* C* h system used, L*
varies from 0 to 100 (black to white) and C* from 0 to 100 (neutral grey to color purity). A hue
angle (h) of 0° would correspond to a red color while 90° would correspond to yellow. Peanut
butter without added PS was closer to yellow than other samples (h = 71.6°), was slightly lighter
(L* = 68.6) and had the highest color saturation (C* = 33.7). Except for 1.25% light-roasted PS,
all other formulations led to a darker color in the ensuing peanut butters. Increasing PS levels
also produced darker peanut butters. Dry blanched formulations were most similar in color to the
control, with L* ranging from 66.2 to 63.3 as compared to 68.6 for the no-PS control. As could
be expected, samples that incorporated darker-roasted PS were somewhat darker. For example,
L* for light-roasted PS peanut butter ranged from 68.6 to 62.4, while that for dark-roasted PS
peanut butter ranged from 67.4 to 61.1 In general, samples with added PS had a smaller hue
angle, and again darker roasted PS led to the greatest change. The hue angle for the control was
71.6°, for dry-blanched PS 70.6 to 68.6°, for light-roasted PS 71.9 to 68.3°, for medium-roasted

84
PS 71.9 to 67.6°, and for dark-roasted PS 72.0 to 67.9°. All of these reflect a change from an
orange-brown color to one with slightly more of a red hue. At the same time, color purity
decreased with added PS. C* for the control was 33.7, for dry-blanched PS 32.4 to 29.1, for
light-roasted PS 31.2 to 26.6, for medium-roasted PS 31.1 to 24.4, and for dark-roasted PS 30.7
to 24.3.
Increasing levels of PS had a similar effect on color. In general, increasing PS from 1.25 to
5.0% led to darker samples, with slightly more red hue, and lesser color purity. As an example,
L* for the dark-roasted PS peanut butter varied from 68.6, 67.4, 65.2, 62.0 and 61.1 for peanut
butter with 0, 1.25, 2.5, 3.75, and 5.0% of PS incorporation, respectively. For dark-roasted PS, h
ranged from 71.6 to 67.9° for 0 and 5% PS samples. Chroma values decreased in order from 33.7,
30.7, 28.2, 25.7 and 24.3 for peanut butter with 0, 1.25, 2.5, 3.75 and 5.0% dark roasted PS.
Although differences in color were not large, overall samples with darker and higher levels of PS
were slightly darker, brown in appearance and exhibited less color purity.
Two thermal treatments are involved in the manufacture of peanut butter, namely roasting for
flavor development and dry blanching for PS removal. During the heat treatment, peanuts
gradually render the characteristic golden brown color resulting from sugar-amino acid reactions
with the production of melanoidins (Hodge, 1953). A higher heating temperature and longer
roasting time will lead to further generation of melanoidins and thereby intensify the brown color
in peanuts. In addition, at relatively high temperatures, sugar caramelization can contribute to the
browning reaction of peanuts. Tannins and catechol-type compounds contribute toward the color
noted in raw PS (Sobolev & Cole, 2004). Because PS contain ca. 16 to 18% crude protein,
similar browning reactions are expected in PS during thermal processing (Sobolev & Cole, 2004).
Therefore, incorporation of PS into peanut butter would be expected to change the color of the

85
resultant products through mixing of components with slightly different color. Thus, the
darkest-color roasted PS would cause the greatest change in color of the formulated peanut
butters, while dry-blanched-only or light-roasted PS would cause the least change. For instance,
the dark-roasted PS were initially a dark-chocolate brown, and when added to the peanut butter
created a darker, browner peanut butter. In contrast, dry-blanched PS were the lightest in color
and had more of a golden-yellow hue. In general, incorporation of dry blanched PS into the
peanut butters lead to the least change in the color parameters. One additional factor should be
noted in that the PS and the lipid phase of peanut butter have different refractive indices.
Consequently, the absorption of oil into the PS would increase the light scattering in formulated
peanut butters and change the manner in which color is reflected to the observer.
Texture Analysis
The aggregate data from the texture analysis are presented in Table 3.3. Except for
gumminess, all other investigated textural parameters were significantly impacted by the PS
incorporation. Peanut butters formulated with medium- and dark-roasted PS exhibited an
increase in hardness. For example, while the no-PS control peanut butter had a hardness of 127
g-force, dark roasted-PS peanut butter had a hardness between 215 and 237 g. Peanut butters
containing roasted PS were generally more adhesive than those without or with dry-blanched PS.
Addition of dry-blanched PS (greater than 2.5%) demonstrated, unexpectedly, a decrease in
adhesiveness. All PS addition affected a decrease in the product’s cohesiveness. None of the
parameters examined for texture varied in a concentration-dependent manner. While the control
peanut butter had an adhesiveness of –545 g•s, that for dark roasted-PS peanut butter ranged
from –674 to –701 g•s. The control peanut butter was slightly more cohesive (1.6) as compared

86
to samples with incorporated PS (0.9–1.3).
For viscoelastic semisolid materials, an apparent increase in hardness may arise from a
greater elastic component or an increase in viscosity, as both resist instantaneous compression.
PS, therefore, can be considered as the elastic component incorporated into peanut butters, and
this resulted in an increase of the elastic modulus. Alternatively, the PS particles may increase the
resistance to flow for any viscous element of the peanut butter. Crippen et al. (1989) reported
that a coarse grind size of peanut paste brought about significantly (P < 0.05) greater
instrumental hardness than that of medium and fine grinds. Similarly, the size distribution of
ground-roasted PS was coarser and the particles were more uniform in size compared to ground
dry-blanched PS. Thus, the incorporation of roasted PS would be expected to harden the resultant
peanut butters. When the texture analyzer’s plunger compressed the sample, larger particles with
a greater surface area should provide more resistance, thereby leading to an increased apparent
hardness. The decrease in cohesiveness may be related to the disruption of the continuous oil
phase in peanut butters after PS incorporation with oil–PS interfaces being more easily separated
than those in oil-filled regions. Gumminess is defined as the energy involved to disintegrate a
semisolid food to a state of readiness for swallowing and is calculated from hardness and
cohesiveness measurements (Pons & Fiszman, 1996). Thus, the incorporation of PS might not
change the energy required by disintegration due to increased hardness offset by decreased
cohesiveness in the resultant peanut butters.
In this work, as a consequence of roasted PS incorporation, peanut butters were slightly
more adhesive. Syarief et al. (1985) implied that increased adhesiveness and mouth-coating were
inversely related to the ease of swallowing peanut butter impairing the sensory impression of the
product, and How and Young (1985) reported that a majority of consumers dislike sticky and

87
overly adhesive peanut butter. Thus it would be expected that our samples would be more
difficult to swallow, resulting in decreased sensory scores. However, in some food products,
sensory adhesiveness does not correlate that well with instrumental adhesiveness (Truong, Walter,
& Hamann, 1997). Sensory adhesiveness is evaluated in the mouth using a lateral force as well
as a vertical force in the presence of saliva, while the measurement of instrumental adhesiveness
employs a plunger that applies a vertical force. In addition, a metal plate is used to simulate the
human palate and the measurements are also determined in the absence of saliva.
Spreadability
The firmness and spreadability data are given in Table 3.4. Firmness did not significantly
increase with PS addition at levels below 3.75%. Only the peanut butters containing 5.0%
dry-blanched PS, light-roasted PS above 2.5%, and 5.0% medium-roasted PS showed an increase
in firmness. A negative correlation between firmness and spreadability was reported in creamery
butters and peanut butters investigated by Syarief et al. (1985). The measurements of firmness
conflict somewhat with the hardness (Table 3.3), but are likely due to the differences in the
probes employed and their geometry. In the texture assay a 25 mm cylindrical probe was used,
resulting in the measurement of forces primarily due to compression, while the cone rig used for
spreadability analysis (employing both a positive and a negative cone) resulted in measurement
of forces generated from the penetration and spreading of the sample. The latter incorporated a
combination of shear and compression; the sample extruded through the annular space as the
cones came closer together. The forces are generated from the puncture, and then a combination
of shear and compression are needed to penetrate and spread the sample. We believe this latter
geometry to result in the surface areas of distributed particles playing a less important role in the

88
determination of apparent hardness.
Spreadability, as measured by work of shear, decreased for some samples and increased for
others. Peanut butter with 1.25% or 3.75% dry-blanched PS, 1.25% medium-roasted PS, or 5.0%
dark-roasted PS took less work to spread than that of the control. Samples with greater than
3.75% dry-blanched, light-roasted or medium-roasted PS took more work to spread. In general,
the work to spread increased with PS concentration for dry-blanched, light-roasted, and
medium-roasted PS peanut butter, while it decreased with concentration for dark roasted-PS
peanut butter. As seen in Table 3.3, peanut butter with dark-roasted PS was also harder and less
cohesive than the control, dry-blanched or light-roasted PS peanut butter. As previously noted,
hardness is measured primarily under compression. For the spreadability rig, the work is
determined much more by shear force. The fact that layers of dark-roasted PS peanut butter can
more easily move past each other may be related to the lower cohesiveness of these samples.
Total Phenolics Content (TPC)
The TPC, expressed as mg (+)-catechin equivalents/g PS (d.w.) or 100 g peanut butter (f.w.)
are depicted in Figure 3.2. The classical method of Singleton and Rossi (1965) using Folin &
Ciocalteu’s phenol reagent was employed in this work to determine the TPC in PS and peanut
butter acetonic extracts. Dry-blanched PS possessed the highest TPC of 166 mg catechin eq./g,
which was 32, 33, and 38% higher than that for light-, medium-, and dark-roasted skins,
respectively. Although dry-blanched PS exhibited the greatest TPC, all four PS types effectively
increased the TPC of the formulated peanut butters in a concentration-dependent manner. Using
dry-blanched PS as an example, the TPC increased by 86, 357, 533, and 714%, respectively after
incorporating PS into peanut butter at 1.25, 2.5, 3.75, and 5.0% (w/w) addition levels, when
89
compared to the peanut butter devoid of PS.
Phenolic compounds are secondary metabolites in plants and they generally concentrate in
the outer layers such as the peel, shell, and hull to protect inner matter. A large number of
intrinsic and extrinsic factors greatly influence the types and levels of phenolics in plants; these
include genetic types, environmental conditions, germination, ripening, processing, and storage
(Bravo, 1998). In the case of peanut hulls, the TPC varied markedly with maturity (Yen, Duh, &
Tsai, 1993) and choice of cultivars (Yen & Duh, 1995). Mild heat treatment was able to break
some of the covalent bounds of phenolic acids with insoluble polymers (Peleg, Naim, Rouseff, &
Zehavi, 1991) and other cell wall components such as arabinoxylans (Hartley, Morrison,
Himmelsbach, & Borneman, 1990), liberating low-molecular-weight antioxidant compounds
from the repeating subunits of high-molecular-weight polymers (Jeong et al., 2004). Lee et al.
(2006) reported that after far-infrared radiation treatment at 150 °C for 60 min, the TPC value of
peanut hulls increased from 73 to 90 μM tannic acid equivalents. PS roasted at 175 °C for 5 min
were found to contain a higher TPC than raw PS, especially when recovered by water and
ethanol extraction (Yu, Ahmedna, & Goktepe, 2005). In addition to processing, the extraction
conditions employed such as choice of solvent system, material:solvent ratio, particle size
distribution of PS, extraction times, number of extractions, and temperature (Nepote, Grosso, &
Guzman, 2005; Dai & Mumper, 2010) impact the efficiency of extraction and thereby result in
different recoveries of phenolics from the source material. According to Nepote et al. (2005) the
optimum extraction conditions consist of 70% (v/v) ethanol, unground PS, a solvent/solid ratio
of 20 mL/g, 10 min of shaking, and three extractions yielding a 118 mg phenol equivalents/g
recovery of total phenolics.

90
The TPC data for dry-blanched PS from this study were close to that reported by Nepote et
al. (2002), where the TPC was 159 mg phenol equivalents/g recovered from dry blanched PS by
24 h maceration with methanol at a material to solvent ratio of 1:10 (w/v). The extraction was
performed 2× at room temperature in subdued lighting. A much higher TPC value of 280 mg/g
was detected by Francisco and Resurreccion (2009) in Runner PS processed at 135 °C for 5 min.
The phenolics were recovered from PS by 3 × 10-min extractions at room temperature. Seventy
percent (v/v) ethanol was applied as the extraction solvent at the sample/solvent ratio of 1: 20
(w/v). This protocol was carefully followed, but we were unable to reproduce the finding and to
validate the result. None of these treatments are adopted by the peanut industry where dry
blanching of PS is fulfilled by heating only at ~138 °C for up to 25 min. The roasted PS are
produced by heating the shelled peanuts to ~160 °C for 40 to 60 min (Woodroof, 1983). The
quantities of total phenolics are difficult to compare amongst that reported in the literature
because sample source, sample preparation manner, and extraction techniques are quite varied.
Though the findings of this work did not display the highest TPC value ever reported for PS, this
investigation supports the employment of PS as a potential source of phenolics which can
significantly increase the TPC of fortified peanut butters.
3.4 Conclusions
Simultaneous grinding of PS with sugar can produce powders with desirable grind sizes of an
appropriate range for incorporation into peanut butters (less than 300 μm). Incorporation of
ground PS also impacts the physical properties of resultant peanut butters with the extent
depending on the type of skins used. In some cases a concentration-dependent relationship was
found. In general, the addition of PS decreases the cohesiveness of the resultant peanut butters,

91
and in the case of medium- and dark-roasted PS increases both hardness and adhesiveness.
Further, while there was poor correlation between hardness values and firmness values
(measured by a spreadability rig), increases in firmness are good predictors of poor spreadability.
Additionally, peanut butters formulated with PS show decreases in lightness and color saturation
relative to those devoid of PS, with levels greater than 2.5% also decreasing the hue angle.
In general, dry blanched PS caused the least overall change to the physical properties of
peanut butter at a given level of incorporation. Further, these peanut butters also have higher
levels of potentially healthful phenolic compounds. Thus, given a similar price structure as
non-fortified peanut butters, it is expected that these formulations hold the most promise as a
functional food. Hence, the findings of this study have paved a way for the utilization of a
low-valued industrial by-product (i.e., PS) as an ingredient in functional food formulations which
improve an existing product and allow diversification of the brands available in the market.
Acknowledgments
This research was supported by a grant funded by the Georgia Food Industry Partnership and
is greatly appreciated. Thanks are extended to the following: Rick Boyce at Seabrook Ingredients,
a division of Universal Blanchers, LLC, for the peanut paste, flour salt, and stabilizer; Bruce
Kotz at Golden Peanut Corporation, LLC, for the light, medium, and dark roasted PS; Bill Paulk
at Sylvester Blanching, a division of Universal Blanchers, LLC, for the dry blanched peanuts
skins; and John T. Powell, President of the Peanut Institute Inc., Albany, GA.
References
Ahmed, E. M.; ALI, T. Textural quality of peanut butter as influenced by peanut seed and oil

92
contents. Peanut Sci. 1986, 13, 18–20.
Amarowicz, R.; Troszyńska, A.; Baryłko-Pikielna, N.; Shahidi, F. Polyphenolics extracts from
legume seeds: correlations between total antioxidant activity, total phenolics content, tannins
content and astringency. J. Food Lipids. 2004, 11, 278–286.
Andersen, P. C.; Hill, K.; Gorbet, D. W.; Brodbeck, B. V. Fatty acid and amino acid profiles of
selected peanut cultivars and breeding lines. J. Food Compos. Anal. 1998, 11, 100–111.
Anonymous. A better butter? New research shows peanut butter is good for you. (Don’t tell the
kids.). Consumer Rep. 2002, 67, 24–26.
Bravo, L. Polyphenols: chemistry, dietary sources, metabolism, and nutritional significance. Nutr.
Rev. 1998, 56, 317–333.
Carley, D. H. Production and marketing of peanuts in the United States. In Peanuts: Production,
Processing, Products, 3rd ed.; Woodroof, J. G., Ed.; AVI Publishing Company, Inc.: Westport,
CT, 1983; pp. 19–32.
Chung, S-Y.; Reed, S. Removing peanut allergens by tannic acid. Food Chem. 2012, 134,
1468–1473.
Crippen, K. L.; Hamann, D. D.; Young, C. T. Effects of grind size, sucrose concentration and salt
concentration on peanut butter texture. J. Texture Stud. 1989, 20, 29–41.
Dai, J.; Mumper, R. J. Plant phenolics: extraction, analysis and their antioxidant and anticancer
properties. Molecules. 2010, 15, 7313–7352.
Dohlman, E.; Young, E.; Hoffman, L.; Mcbride, W. U.S. peanut sector adapts to major policy
changes. Amber Waves. 2004, 2, 31–37.
Francisco, M. L. L. D.; Resurreccion, A. V. A. Total phenolics and antioxidant capacity of
heat-treated peanut skins. J. Food Compos. Anal. 2009, 22, 16–24.

93
Hartley, R. D.; Morrison, W. H. III; Himmelsbach, D. S.; Borneman, W. S. Cross-linking of cell
wall phenolic arabinoxylans in graminaceous plants. Phytochemistry. 1990, 29, 3701–3709.
Hodge, J. E. Chemistry of browning reactions in model systems. J. Agric. Food Chem. 1953, 1,
928–943.
How, J. S. L.; Young, C. T. Factors affecting peanut butter preference. J. Am. Oil Chem. Soc.
1985, 62, 538–540.
Jeong, S-M.; Kim, S-Y.; Kim, D-R.; Jo, S-C.; Nam, K. C.; Ahn, D. U.; Lee, S-C. Effect of heat
treatment on the antioxidant activity of extracts from citrus peels. J. Agric. Food Chem. 2004,
52, 3389–3393.
Jolly, C. M.; Hinds; M. J., Lindo; P., Ligeon, C.; Weiss, H. Consumers acceptance of peanut
butter and products containing peanut butter in two southeastern states in the U.S. Journal of
International Food and Agribusiness Marketing. 2005, 17, 87–105.
Knauft, D. A.; Moore, K. M.; Gorbet, D.W. Further studies on the inheritance of fatty acid
composition in peanut. Pean Sci. 1993, 20, 74–76.
Lee, S-C.; Jeong, S-M.; Kim, S-Y.; Park, H-R.; Nam, K. C.; Ahn, D. U. Effect of far-infrared
radiation and heat treatment on the antioxidant activity of water extracts from peanut hulls.
Food Chem. 2006, 94, 489–493.
Merrill, R. A.; Collier, E. M. JR. “Like mother used to make”: an analysis of FDA food standards
of identity. Columbia Law Rev. 1974, 74, 561–621.
Nepote, V.; Grosso, N. R.; Guzmán, C. A. Optimization of extraction of phenolic antioxidants
from peanut skins. J. Sci. Food Agr. 2005, 85, 33–38.
Nepote, V., Grosso, N. R., & Guzmán, C. A. Extraction of antioxidant components from peanut
skins. Grasas Aceites. 2002, 54, 391–395.

94
Peleg, H., Naim, M., Rouseff, R. L., & Zehavi, U. Distribution of bound and free phenolic acids
in oranges (Citrus sinensis) and grapefruits (Citrus paradisi). J. Sci. Food Agr. 1991, 57,
417–426.
Pons, M.; Fiszman, S. M. Instrumental texture profile analysis with particular reference to gelled
systems. J. Texture Stud. 1996, 27, 597–624.
Raju, P. N.; Pal, D. The physico-chemical, sensory, and textural properties of misti dahi prepared
from reduced fat buffalo milk. Food Bioprocess Technol. 2009, 2, 101–108.
Sanders, C. T., III; DeMasie, C. L.; Kerr, W. L.; Hargrove, J. L.; Pegg, R. B.; Swanson, R. B.
Peanut skins-fortified peanut butters: effects on consumer acceptability and quality
characteristics. J. Food Sci. 2013, submitted.
Singleton, V. L.; Rossi, J. A. JR. Colorimetry of total phenolics with phosphomolybdic
phosphotungstic acid reagents. Am. J. Enol. Vitic. 1965, 16, 144–158.
Sobolev, V. S.; Cole, R. J. Note on utilisation of peanut seed testa. J. Sci. Food Agr. 2004, 84,
105–111.
Syarief, H.; Hamann, D. D.; Geisbrecht, F. G.; Young, C. T.; Monroe, R. J. Interdependency and
underlying dimensions of sensory textural characteristics of selected foods. J. Texture Stud.
1985, 16, 29–52.
Takano, F.; Takata, T.; Yoshihara, A.; Nakamura, Y.; Arima, Y.; Ohta, T. Aqueous extract of
peanut skin and its main constituent procyanidin A1 suppress serum IgE and IgG1 levels in
mice-immunized with ovalbumin. Biol. Pharm. Bull. 2007, 30, 922–927.
Tomochika, K.; Shimizu-Ibuka, A.; Tamura, T.; Mura, K.; Abe, N.; Onose, J-I.; Arai, S. Effects
of peanut-skin procyanidin A1 on degranulation of RBL-2H3 cells. Biosci. Biotechnol.
Biochem. 2011, 75, 1644–1648.

95
Truong, V. D.; Walter, W. M. JR.; Hamann, D. D. Relationship between instrumental and sensory
parameters of cooked sweetpotato texture. J. Texture Stud. 1997, 28, 163–185.
United States Department of Agriculture (USDA). 2008–2012. Peanut stocks and processing.
National Agricultural Statistics Service, Washington, DC.
United States Department of Agriculture (USDA). 2011. Peanut area, yield, and production. In
World Agricultural Production. Foreign Agricultural Service, Washington, DC.
United States Food and Drug Administration (FDA). 2009. Food standard innovations: peanut
butter’s sticky standard. http://www.fda.gov/AboutFDA/WhatWeDo/History/Product
Regulation/ucm132911.htm (accessed July 20th, 2014).
United States Food and Drug Administration (FDA). 2003. Qualified health claims: letter of
enforcement discretion – nuts and coronary heart disease. (Docket No 02P-0505).
http://www.fda.gov/food/ingredientspackaginglabeling/labelingnutrition/ucm072926.htm
(accessed July 20th, 2014)
Woodroof, J. G. Peanut butter. In Peanuts: Production, Processing, Products, 3rd Ed.; Woodroof,
J. G., Ed.; AVI Publishing Company, Inc.: Westport, CT, 1983; pp. 181–227.
Yen, G. C.; Duh, P. D. Antioxidant activity of methanolic extracts of peanut hulls from various
cultivars. J. Am. Oil. Chem. Soc. 1995, 72, 1065–1067.
Yen, G. C.; Duh, P. D.; TSAI, C. L. Relationship between antioxidant activity and maturity of
peanut hulls. J. Agric. Food Chem. 1993, 41, 67–70.
Yu, J.; Ahmedna, M.; Goktepe, I. Effects of processing methods and extraction solvents on
concentration and antioxidant activity of peanut skin phenolics. Food Chem. 2005, 90,
199–206.

96
Table 3.1 Peanut butter formulations1.
Peanut Skin Type
Formulation (%)
Lipid Content in Skins
Lipid Content in Peanut Paste
Skins2 Sucrose RBD Peanut Oil3 Flour Salt Stabilizer4 Peanut
Paste
Control 0 50.0 0 6.5 0 1.5 2.0 90.0 Dry-blanched (DB)
18.1 50.0 1.25 6.5 0.49 1.5 2.0 88.75 2.5 6.5 0.97 1.5 2.0 87.5 3.75 6.5 1.46 1.5 2.0 86.25 5.0 6.5 1.95 1.5 2.0 85.0
Light-roasted (LR)
27.0 50.0 1.25 6.5 0.39 1.5 2.0 88.75 2.5 6.5 0.79 1.5 2.0 87.5 3.75 6.5 1.18 1.5 2.0 86.25 5.0 6.5 1.57 1.5 2.0 85.0
Medium-roasted (MR)
29.0 50.0 1.25 6.5 0.37 1.5 2.0 88.75 2.5 6.5 0.74 1.5 2.0 87.5 3.75 6.5 1.11 1.5 2.0 86.25 5.0 6.5 1.48 1.5 2.0 85.0
Dark-roasted (DR)
26.9 50.0 1.25 6.5 0.39 1.5 2.0 88.75 2.5 6.5 0.79 1.5 2.0 87.5 3.75 6.5 1.18 1.5 2.0 86.25 5.0 6.5 1.58 1.5 2.0 85.0
1Each formulation was prepared in three different batches. 2Skins were ground in the masscolloider with sugar at different ratios: for dry blanched, 22.9, 45.8, 68.7 and 91.6 g of PS were ground with 195 g of sucrose; for light roasted, 25.7, 51.4, 77.1 and 102.8 g of PS were ground with 195 g of sucrose; for medium roasted, 26.4, 52.9, 79.3 and 105.7 g of PS were ground with 195 g of sucrose; for dark roasted, 25.7, 51.3, 77.0 and 102.6 g of PS were ground with 195 g of sugar. All formulations resulted in peanut butters containing 1.25, 2.5, 3.75 and 5.0% of PS, respectively. 3Refined, bleached, deodorized peanut oil was added to balance the lipid level of each formulation at 45% fat. 4The stabilizer comprised hydrogenated rapeseed and cottonseed oils.

97
Table 3.2 Color analysis of formulated peanut butters.
Formulation Peanut Skins (%) L* C* h
Control 0 68.6 ± 0.14a 33.7 ± 0.17a 71.6 ± 0.13b
DB
1.25 66.2 ± 0.12c,d 32.4 ± 0.08b 70.6 ± 0.04d 2.5 65.7 ± 0.13c,d 30.8 ± 0.17c,d 70.0 ± 0.03e 3.75 64.1 ± 0.33e 30.4 ± 0.22d 69.0 ± 0.01f,g 5.0 63.3 ± 0.06e,f 29.1 ± 0.39e 68.6 ± 0.09h,i
LR
1.25 68.6 ± 0.27a 31.2 ± 0.07c 71.9 ± 0.05a,b 2.5 65.2 ± 0.06d 29.1 ± 0.35e 71.2 ± 0.19c 3.75 63.8 ± 0.57e 27.7 ± 0.41g 68.9 ± 0.22g,h 5.0 62.4 ± 0.16f,g 26.6 ± 0.34h 68.3 ± 0.26i
MR
1.25 66.4 ± 0.49b,c 31.1 ± 0.18c 71.9 ± 0.23a,b 2.5 65.3 ± 0.46d 28.4 ± 0.09f 70.6 ± 0.14d 3.75 63.2 ± 0.16e,f 26.9 ± 0.15h 69.4 ± 0.17f 5.0 61.6 ± 0.42g,h 24.4 ± 0.16j 67.6 ± 0.02j
DR
1.25 67.4 ± 0.38b 30.7 ± 0.46c,d 72.0 ± 0.14a 2.5 65.2 ± 0.91d 28.2 ± 0.38f,g 70.2 ± 0.15d,e 3.75 62.0 ± 0.58g,h 25.7 ± 0.32i 67.9 ± 0.18j 5.0 61.1 ± 0.67h 24.3 ± 0.09j 67.9 ± 0.07j
1A Konica Minolta colorimeter (Model CR-410) was employed to assess color where L* is lightness, C* is chroma {C* = [(a*)2 + (b*)2)½]} and h is hue angle {h = arctan (b*/a*)}. The means ± standard deviations are reported based on four samplings. Values within a given column followed by the same letters are not significantly different (P > 0.05).

98
Table 3.3 Textural properties of formulated peanut butters1.
Formulation (PS addition %) Textural Objective Measure Hardness (g) Adhesiveness (g•s) Cohesiveness Gumminess
Control 0 127 ± 12.2e -545 ± 20.5b,c 1.6 ± 0.24a 203 ± 10.7a,b,c
DB
1.25 157 ± 10.6c,d,e -515 ± 30.6a,b 1.1 ± 0.06b,c,d 169 ± 8.3c,d 2.5 195 ± 14.4a,b,c,d -599 ± 34.0b,c,d 1.0 ± 0.10b,c,d 196 ± 8.1a,b,c,d 3.75 130 ± 10.4e -400 ± 58.3a 1.3 ± 0.11b 169 ± 19.3c,d 5.0 169 ± 22.8b,c,d,e -400 ± 57.6a 0.9 ± 0.19d 148 ± 24.4d
LR
1.25 145 ± 10.4d,e -687 ± 6.2d,e,f 1.3 ± 0.08b,c 183 ± 9.3b,c,d 2.5 154 ± 24.0c,d,e -581 ± 24.5b,c,d 1.1 ± 0.11b,c,d 174 ± 18.7c,d 3.75 202 ± 13.4a,b,c,d -664 ± 39.6c,d,e,f 1.1 ± 0.07b,c,d 212 ± 10.4a,b,c 5.0 202 ± 26.2a,b,c,d -702 ± 79.5d,e,f 1.0 ± 0.09b,c,d 208 ± 11.4a,b,c
MR
1.25 234 ± 29.9a -661 ± 28.6c,d,e,f 0.9 ± 0.16d 219 ± 25.0a,b,c 2.5 223 ± 21.5a,b -737 ± 47.7e,f 1.0 ± 0.10b,c,d 225 ± 12.8a,b 3.75 203 ± 17.9a,b,c,d -612 ± 50.8b,c,d,e 1.0 ± 0.07b,c,d 201 ± 3.8a,b,c 5.0 210 ± 38.1a,b,c -668 ± 67.1c,d,e,f 1.0 ± 0.02b,c,d 214 ± 36.5a,b,c
DR
1.25 226 ± 29.5a,b -696 ± 58.0d,e,f 1.0 ± 0.07b,c,d 236 ± 26.0a 2.5 216 ± 34.7a,b,c -701 ± 69.3d,e,f 1.1 ± 0.13b,c,d 241 ± 18.7a 3.75 237 ± 29.5a -786 ± 55.9f 1.0 ± 0.05b,c,d 237 ± 31.3a 5.0 215 ± 45.6a,b,c -674 ± 45.2d,e,f 1.1 ± 0.14b,c,d 225 ± 25.7a,b
1Means ± standard deviations are reported based on four samplings. Values within a given column followed by the same letters are not significantly different (P > 0.05).

99
Table 3.4 Firmness and spreadability of formulated peanut butters1.
Formulation (PS addition %) Textural Objective Measure
Firmness (g) Work of Shear (g•s) Control 0 2420 ± 91c,d 2040 ± 86d,e,f
DB
1.25 2150 ± 44f,g 1770 ± 32h 2.5 2420 ± 94d 2090 ± 125d,e 3.75 2220 ± 75e,f 1810 ± 64g,h 5.0 2990 ± 116a 2730 ± 109a
LR
1.25 2380 ± 59d,e 2030 ± 81d,e,f 2.5 2390 ± 32d,e 2030 ± 88d,e,f 3.75 2630 ± 19b 2301 ± 42b,c 5.0 2680 ± 39b 2430 ± 93b
MR
1.25 2010 ± 71g 1740 ± 69h 2.5 2160 ± 69f,g 1900 ± 100e,f,g,h 3.75 2140 ± 114f,g 2350 ± 100b,c 5.0 2600± 38b,c 2340 ± 40b,c
DR
1.25 2350 ± 21d,e 2150 ± 68c,d 2.5 2110 ± 78f,g 1920 ± 99e,f,g,h 3.75 2170 ± 57f,g 1990 ± 39d,e,f,g 5.0 2080 ± 37f,g 1880 ± 54f,g,h
1Means ± standard deviations are reported based on four samplings. Values within a given column followed by the same letters are not significantly different (P > 0.05).

100
Figure Captions
Figure 3.1 Particle size distribution histograms of ground peanut skins (PS). (A) on left, 45.8 g
of dry blanched PS ground with 195 g of sugar & on right, 91.6 g of dry blanched
PS ground with 195 g of sugar; (B) on left, 51.4 g of light roasted PS ground with
195 g of sugar & on right, 102.8 g of light roasted PS ground with 195 g of sugar;
and (C) on left, 51.3 g of dark roasted PS ground with 195 g of sugar & on right,
102.6 g of dark roasted PS ground with 195 g of sugar.
Figure 3.2 Total phenolics content (TPC) of peanut skins (A) and peanut butters (B). Means (n
= 3) without a common letter differ significantly (P < 0.05).

101
Figure 3.1
Feret Diameter (µm)
0 500 1000 1500 2000
Dis
tribu
tion
Perc
enta
ge
0
5
10
15
20
25
30A
Feret Diameter (µm)
0 200 400 600 800 1000 1200 1400 1600
Dis
tribu
tion
Perc
enta
ge
0
10
20
30
40
Feret Diameter (µm)
0 200 400 600 800 1000 1200 1400
Dis
tribu
tion
Perc
enta
ge
0
10
20
30
C
Feret Diameter (µm)
0 200 400 600 800 1000 1200 1400
Dis
tribu
tion
Perc
enta
ge
0
5
10
15
20
25
Feret Diameter (µm)
0 200 400 600 800 1000 1200 1400
Dis
tribu
tion
Perc
enta
ge
0
10
20
30
40
Feret Diameter (µm)
0 200 400 600 800 1000 1200 1400 1600
Dis
tribu
tion
Perc
enta
ge
0
10
20
30
B

102
Type of Peanut Skins (PS) Examined
Tota
l Phe
nolic
s Con
tent
(TPC
){m
g (+
)-ca
tech
in e
q./g
pea
nut s
kins
, d.w
.}
0
20
40
60
80
100
120
140
160
180
200 Dry Blan
ched
Light R
oaste
d
Medium
Roaste
d
Dark Roa
sted
a
b bb
A
Tota
l Phe
nolic
Con
tent
(TPC
){m
g (+
)-ca
tech
in e
q./1
00 g
pea
nut b
utte
r, f.w
.}
Formulated Peanut Butters0
50
100
150
200
250
300
350
No S
kins
Dry B
lanch
ed
Ligh
t Roa
sted
Dark
Roa
sted
Med
ium
Roa
sted
h
a
bb
c
b
c
ddde
gg
ef
gg
f
d
B
Figure 3.2

103
CHAPTER 4
PEANUT SKINS-FORTIFIED PEANUT BUTTERS: EFFECT OF PROCESSING ON
THE PHENOLICS CONTENT, FIBER CONTENT AND ANTIOXIDANT ACTIVITY
Ma, Y.; Kerr, W. L.; Swanson, R. B.; Hargrove, J. L.; Pegg, R. B. Food Chemistry. 2014, 145, 883–891. Reprinted here with permission of publisher (Elsevier).
104
Abstract
Incorporation of ground peanut skins (PS) into peanut butter (PB) at 1.25, 2.5, 3.75, and 5.0%
(w/w) resulted in a marked concentration-dependent increase in both TPC and antioxidant
activity. Using dry-blanched PS to illustrate, the TPC increased by 86, 357, 533, and 714%,
respectively, compared to the PB control devoid of PS; the TPACs rose by 633, 1933, 3500, and
5033%, respectively. NP-HPLC detection confirmed that the increase in the phenolics content
was attributed to the endogenous PACs of the PS, which were characterized as dimers to
nonamers by NP-HPLC/ESI-MS. FRAP values increased correspondingly by 62, 387, 747, and
829%, while H-ORACFL values grew by 53, 247, 382, and 415%, respectively. The DF content
of dry-blanched PS was ~55%, with 89-93% being insoluble fiber. Data revealed that PS addition
enhances the antioxidant capacity of the PB, permits a “good source of fiber” claim, and offers
diversification in the market’s product line.

105
4.1 Introduction
As demonstrated by George Washington Carver more than a century ago, peanuts (Arachis
hypogaea L.) are a valuable cash crop to the southern United States. China, India and the U.S.A.
account for ~2/3 of the world’s peanut production. In 2012 the U.S. peanut production reached
6.7 billion pounds nationwide, generating a farm gate value of $2.3 billion (USDA 2013). The
potential health benefits associated with eating peanuts are well documented, notably the
prevention against cardiovascular disease, type-2 diabetes, cancer, and other degenerative
diseases (Awad, Chan, Downie, & Fink, 2000; Jiang et al., 2002; Isanga & Zhang, 2007;
Kris-Etherton, Hu, Ros, & Sabaté, 2008). Peanut lipids have largely contributed to these benefits;
they possess zero trans-fatty acids (Sanders, 2001) and are rich in monounsaturated fatty acids
(MUFAs), polyunsaturated fatty acids (PUFAs) (Mercer, Wynne, & Young, 1990) and
phytosterols (Shin, Pegg, Phillips, & Eitenmiller, 2010). Additional beneficial nutrients
endogenous to peanuts include vitamin E, L-arginine, soluble and insoluble fiber, as well as
water- and lipid-soluble phenolic antioxidants (Kris-Etherton et al., 1999; Isanga & Zhang, 2007;
Shin et al., 2009). The nutrients act synergistically with the numerous protective bioactives
making the peanut a desirable nutrient-dense plant-based food (Kris-Etherton, Hu, Ros, & Sabaté,
2008).
Besides the kernels, peanut skins (PS), as the other edible part of peanuts, have attracted
attention because they are a rich, inexpensive source of potentially health-promoting phenolics
and dietary fiber (DF). Phenolic compounds typically concentrate themselves on the outer layers
of plants such as the peel, shell, and hull to protect the inner core materials. Nepote, Grosso, and
Guzman (2002) reported a content of ~159 mg total phenolics/g defatted dry skin, which also
exhibited a marked antioxidant activity as demonstrated by its capacity to inhibit the oxidation of

106
sunflower oil. A study by Yu, Ahmedna, and Goktepe (2005) revealed that PS phenolics are
abundant not only in quantity but also in type, which primarily include phenolic acids (e.g.,
caffeic, chlorogenic, ferulic, and coumaric acids), flavonoids {e.g., (epi)catechins and
epigallocatechin (EGC), catechin gallate (CG), and epicatechin gallate (ECG)}, and stilbene (e.g.,
trans-resveratrol). Free phenolic acids are not the predominant phenolics in PS (Yu, Ahmedna,
Goktepe, & Dai, 2006); the PACs comprise ~17% by weight of PS (Karchesy & Hemingway,
1986). Six A-type PAC dimers were identified in PS (Lou et al., 1999) and found to inhibit the
inflammatory pathway mediated by hyaluronidase-induced release of histamine. A further study
by Lou et al. (2004) led to isolation of five oligomeric PACs with potential free
radical-scavenging activity from the water-soluble fraction of PS.
PACs are complex flavonoid polymers; their phenolic nature makes them excellent
candidates as food antioxidants. The health benefits associated with PACs have been documented
in terms of antioxidation, anti-carcinogenesis, and cardiovascular disease prevention
(Santos-Buelga & Scalbert, 2000). On the other hand, the anti-nutritional effects associated with
PACs, notably inhibition on protein digestibility, are clear in animals consuming large amounts
of PACs, but have no established nutritional significance in humans (Santos-Buelga & Scalbert,
2000). In the gut, PACs trigger adaptative responses, such as increasing the secretion of various
endogenous proteins (especially salivary proline-rich proteins) and biliary acids, which can
improve the absorption and utilization of ingested proteins. Moreover, tannins bound to proteins
have been shown to retain their antioxidant activity and may provide persistent antioxidant
activity in the gastrointestinal tract when consumed (Riedl et al., 2002).
PS are also rich in DF: the total dietary fiber (TDF) comprises ~45% weight of roasted PS, of
which roughly 2.2% is soluble fiber (Shimizu-Ibuka et al., 2009). A high daily intake of DF helps

107
lower blood pressure and cholesterol levels, resulting in the reduced risk of coronary heart
disease, stroke, hypertension, diabetes and obesity (Anderson et al., 2009). Unfortunately, the
average fiber consumption among adults in the U.S. is ~15 g a day instead of the recommended
25-30 g. Polyphenols and DF are two well-documented dietary factors in the prevention of
chronic diseases, but are usually addressed as separate compounds acting independently in
disease prevention. A 2011 study by Saura-Calixto demonstrated a synergistic function of DF and
dietary antioxidants, mainly in the development of an antioxidant environment in the colon.
PS have been used in traditional Chinese medicine for the treatment of chronic hemorrhage
and bronchitis (Lou et al., 1999). In contrast, the value of PS in the western world has not been
recognized until only recently. As a major waste of peanut processing, most PS are dumped but a
small quantity is added to animal feed. In 1999/2000, over 750,000 tons of PS were generated
worldwide based on an estimated 29.1 million tons production of peanuts. The red skin of
peanuts comprises 2.0-3.5 weight percent of the kernels. In the United States, the total volume of
commercially processed shelled edible-grade peanuts used in primary products was roughly
2,000 million pounds during 2011 (USDA 2010–2012); hence, 40 to 70 million pounds of PS
were generated.
An increased awareness of the role of dietary antioxidants and fiber in health promotion and
disease prevention has led to a high demand for antioxidant and fiber-enriched functional foods.
PS are a concentrated source of DF and phenolics; thus, their incorporation into a variety of
foods would effectively enhance the fiber content and antioxidant capacity of the resultant
product and further provide an inexpensive and abundant source of these dietary bioactives.
Despite the tremendous potential benefit of PS as an alternative source of antioxidants and DF,
their utilization as a functional food ingredient in value-added products is lacking.

108
The objectives of the current study are (i) to assess the effect of processing on the phenolics
content (TPC and TPAC content) and antioxidant activity of PS and in value-added peanut
butters fortified with PS; (ii) to determine the increased fiber content after incorporating PS into
the peanut butter prototypes; and (iii) to characterize the phenolics in PS and the PS-fortified
peanut butters.
4.2 Materials and Methods
Materials
Dry-blanched PS were provided by Universal Blanchers, LLC (Sylvester, GA). Roasted PS
(light, medium, and dark) were a gift from the Golden Peanut Company, LLC (Alpharetta, GA).
Peanut paste, flour salt, and hydrogenated vegetable oil (i.e., stabilizer) were supplied by
Seabrook Ingredients, Inc. (Edenton, NC). Domino premium pure cane granulated sugar and
peanut oil with zero trans-fat were purchased from Sam’s Club (Athens, GA). All solvents and
reagents were of analytical (ACS) grade, unless otherwise specified. Methanol, ethanol (95%)
and hexanes were purchased from VWR International (Suwanee, GA). Folin & Ciocalteu’s
phenol reagent and a TDF assay kit (Cat No. TDF100A-1KT) were acquired from the
Sigma-Aldrich Chemical Co. (St. Louis, MO).
Peanut Butter Processing
Seventeen formulations of peanut butter (~45% total fat) were prepared; the details are
described by Ma et al. (2013). To facilitate incorporation, PS and sugar (195 g) were ground
together at different ratios prior to inclusion into the prototypes using an electrically-driven stone
grinder (Super Masscolloider CA6-3, Masuko Sangyo Co., Ltd, Kawaguchi-City, Saitama, Japan)

109
fitted with a BA6-80 grit stone assembly. More specifically, 22.9, 45.8, 68.7, and 91.6 g of
dry-blanched PS were ground with 195 g of sugar; the PS-sugar powders after sieving were then
added to peanut butter formulations to achieve PS addition levels of 1.25, 2.5, 3.75, and 5.0% PS.
Fortified peanut butters were placed in storage at 4 °C until analyzed.
Extraction of Phenolics
Phenolic compounds were extracted from both PS and PS-fortified peanut. Samples were
placed in cellulose extraction thimbles (43 mm i.d. × 123 mm e.l., VWR International, Suwanee,
GA), covered with a plug of glass wool and defatted in a Soxhlet extraction apparatus under
reflux for 12 to 14 h with hexanes. Defatted PS and peanut butters were transferred to 125-mL
Erlenmeyer flasks at a mass-to-solvent ratio of 1:10 (w/v) with 80% (v/v) aqueous acetone.
Extractions were performed in a gyrotary water bath shaker (Model G76, New Brunswick
Scientific Company, Inc., New Brunswick, NJ) set at 150 rpm and a temperature of 45 °C for 30
min. The slurry was then filtered by gravity through P8 filter paper (Fisher Scientific Co.,
Suwanee, GA). The extraction process was repeated 2× as described above. All filtrates were
pooled and acetone was evaporated with a Büchi Rotavapor R-210 using a V-700 vacuum pump
connected to a V-850 vacuum controller (Büchi Corporation, New Castle, DE) at 45 °C. The
aqueous residue was frozen and then lyophilized in a FreeZone® 2.5-L bench-top freeze dryer
(Labconco Corporation, Kansas City, MO) to ensure all traces of moisture were removed and
then stored in amber-glass bottles at -20 °C until further analyzed.
Preparation of Desugared Peanut Butter Extracts
The method described by Srivastava et al. (2010) for preparing a polyphenolic extract from
110
blackberries was adapted for peanut butter. Roughly 3 g of each crude peanut butter extract were
dispersed in 10 mL of deionized water, sonicated to facilitate dissolution, and then applied to the
top of a chromatographic column (30 mm i.d. × 340 mm e.l., Kontes Glass Inc., Vineland, NJ)
packed with Amberlite XAD-16 [(bead size: 20-60 mesh), Sigma-Aldrich] and washed with
~1000 mL of deionized water to remove sugars and organic acids. After the first 800 mL, the
Brix reading of the eluent was checked using a digital PAL-1 pocket refractometer (Model 3810,
ATAGO U.S.A., Inc., Bellevue, WA) until a zero value was reached. The desugared extract was
then eluted from the column with anhydrous methanol (~300 mL) as the mobile phase. Methanol
was evaporated using the Büchi Rotavapor as described above. The extract was lyophilized via
the bench-top freeze dryer to ensure all traces of moisture were removed and then stored in
amber-glass bottles at -20 °C until used further.
Total Phenolics Content (TPC)
The TPC value of each extract was determined spectrophotometrically using the classical
Folin–Ciocalteu assay (Singleton & Rossi, 1965). Briefly, 1 mL of a methanolic solution of each
extract was pipetted into a test tube followed by the addition of 7.5 mL of deionized water, 0.5
mL of 2 N Folin & Ciocalteu’s phenol reagent, and 1.0 mL of a saturated Na2CO3 solution. The
contents were vortexed for 15 s followed by a 60-min quiescent period at room temperature to
allow for optimal color development. Absorbance readings of samples were measured at λmax =
750 nm with the Agilent 8453 UV-visible spectrophotometer (Agilent Technologies, Inc.,
Wilmington, DE). Quantification was based on the standard curve generated with the
(+)-catechin. Sample TPCs were expressed as milligrams (+)-catechin equivalents/g PS (d.w.) or
100-g peanut butter (f.w.).

111
Total PACs (TPAC) Content
The TPAC content was assessed by the 4-dimethylaminocinnamaldehyde (DMAC) assay
taught by Payne et al. (2010). Briefly, 50 µL of methanol and 50 µL of standard solutions
(procyanidin B2; i.e., (-)-epicatechin-(4β→8)-(-)-epicatechin) or 50 µL of test samples, dissolved
in methanol, were respectively added to a COSTAR® 96-well clear, non-sterile, non-treated
microtiter assay plate and then mixed with 250 µL of the DMAC solution. This reagent was
prepared fresh each day by dissolving 30 mg of DMAC in 30 mL of 1:9 (v/v) HCl and reagent
alcohol. Absorbance readings were recorded with a FLUOstar Omega microplate reader (BMG
LABTECH Inc., Cary, NC). Assay conditions comprised bottom scanning every 1 min over 12
min at λmax = 640 nm at an incubation temperature of 25 °C. The plate was shaken for 3 s before
measurement. The maximum absorbance during 12-min readings was used for calculation. TPAC
contents were expressed as mg procyanidin B2 equivalents/g PS (d.w.) or 100-g peanut butter
(f.w.).
Ferric Reducing Antioxidant Power Assay (FRAP)
The FRAP value of each extract was determined according to Pulido, Bravo, and
Saura-Calixto (2000) with slight modifications. Briefly, the FRAP reagent was prepared fresh
each day by combining 2.5 mL of a 10 mM TPTZ [2,4,6-tri(2-pyridyl)-s-triazine] solution in 40
mM HCl, 2.5 mL of 20 mM FeCl3•6H2O and 25 mL of acetate buffer (0.3 M, pH 3.6). The FRAP
reagent was kept warm at 37 °C in a 5-L Isotemp® digital-control water bath (Model 205, Fisher
Scientific) until dispensed. Two hundred μL of the warmed FRAP reagent was mixed with 20 μL
of deionized water and 6.66 μL of a test sample or the reagent blank (5% ethanol for PS and 5%
methanol for peanut butter extracts) in a prewarmed COSTAR® 96-well clear, non-sterile,

112
non-treated microtiter assay plate. The measurement was carried out with the BMG LABTECH
plate reader set at 37 °C. Absorbance readings were recorded by bottom scanning every 20 s over
4 min at λmax = 593 nm. The plate was shaken before each cycle. The 4-min readings were used
for calculation of FRAP values, which were expressed as mmol Fe2+ equivalents/100-g PS (d.w.)
or µmol Fe2+ equivalents/100-g peanut butter (f.w.).
Hydrophilic-Oxygen Radical Absorbance Capacity (H-ORACFL) Assay
The radical-scavenging capacity of each extract was determined by the H-ORACFL assay
developed by Cao, Alessio, and Culter (1993). Briefly, Trolox standard aliquots with
concentrations of 12.5, 25, 50, 80 and 100 μM were prepared. Fluorescein and
2,2′-azobis(2-amidinopropane) dihydrochloride (AAPH) were warmed at 37 °C in the 5-L
Isotemp® water bath until further use. Twenty μL of sample, standards and reagent blank (5%
ethanol for PS or 5% methanol for peanut butter extracts) were respectively added to a
prewarmed COSTAR® 96-well clear, non-sterile, non-treated microtiter assay plate. After
inserting the plate into the BMG LABTECH plate reader set at 37 °C, 200 μL of 9.57 × 10⁻⁸ M
fluorescein and 20 μL of 80 μM AAPH were pumped into each well. Fluorescence intensity was
recorded by bottom scanning for ~3 h at a λex = 485 nm and an λem = 520 nm. The plate was
shaken before each cycle. Data reduction was achieved by (i) calculating of the area under the
kinetic curve (AUC) and net AUC (AUCsample − AUCblank), (ii) constructing a standard curve by
plotting the concentration of Trolox against the AUC, and (iii) determining the Trolox
equivalents of a sample using the standard curve.

113
Fiber Analysis
Total Dietary Fiber (TDF)
The TDF content was determined on duplicate samples of dried and defatted PS and peanut
butters (also desugared) from three batches according to AOAC Official Method 991.43 (AOAC,
2005). Porcelain crucibles, that had been soaked in 10% HCl, rinsed well 3× with deionized
water, and fired in a 45.3-L capacity Thermo Scientific Thermolyne tabletop muffle furnace
(Fisher Scientific) overnight at 700 °C, were placed in a desiccator until used. To each crucible
~1 g of Celite was added, followed by drying at 130 °C in a forced-air convection oven to a
constant mass (W1). Finely ground samples (~1.000 ± 0.005 g) accurate to 0.1 mg and a blank
(containing only MES-TRIS buffer {0.05 M of 2-(N-morpholino)ethanesulfonic acid and 0.05 M
Tris(hydroxymethyl)aminomethane, pH 8.2}) were gelatinized in the presence of heat-stable
α-amylase at 95 °C to hydrolyze the α(1→4) bonds of large α-linked polysaccharides, such as
starch, yielding glucose and maltose. The subsequent enzymatic digestions with protease and
amyloglucosidase at 60 °C were performed to degrade proteins and cleave α(1→6) glycosidic
linkages, respectively. The final digests (samples and blank) were treated with 95% (v/v) ethanol
to precipitate DF and remove depolymerized protein and glucose. The residues were filtered and
sequentially washed with 78% (v/v) ethanol, 95% (v/v) ethanol, and acetone. After drying at
105 °C in the forced-air convection oven overnight, the residues plus Celite and crucible were
weighed; the mass was recorded as W2. One duplicate was subjected to Kjeldahl nitrogen
analysis as specified in the AOAC Method 960.52 (AOAC, 2005) for crude protein (P)
determination using N × 5.46 as the conversion factor. The other was placed in the muffle
furnace at 525 °C overnight for ash determination (W3). The TDF content was calculated by
subtracting the mass of the crude protein, ash, and blank from the mass of the filtered and dried

114
residues.
Residue Mass (R) = W2 – W1 (mg)
Ash Mass (A) = W3 – W1 (mg)
Blank Mass (B) = Rblank – Ablank – Pblank (mg)
where, the blank containing only MES-TRIS buffer was processed identically as the samples. So
in the above equation, Rblank is the residue mass of the blank, Pblank is the crude protein mass of
the blank, and Ablank is the ash mass of the blank. Proteins in the blank originated from enzymes
used to digest protein and carbohydrate.
g TDF/100-g sample = (Rsample – Asample – Psample – B)/sample mass (mg) × 100
where, Rsample is the residue mass of the sample Psample is the crude protein mass of the sample,
and Asample is the ash mass of the sample, all in mg.
Insoluble Dietary Fiber (IDF) and Soluble Dietary Fiber (SDF) Contents
The IDF enzyme digests were filtered and residues were washed 2× with 10 mL of 70 °C
deionized water. Water filtrates were combined and used for the SDF analysis. The water-washed
residues were further washed with 78% (v/v) ethanol, 95% (v/v) ethanol and acetone. The mass
was recorded after oven-drying at 105 °C. The water filtrates were precipitated with 95% (v/v)
ethanol, filtered and dried. Both SDF and IDF residues were corrected for the contents of crude
protein, ash and blank, as was the case in TDF analysis.
Normal Phase High-Performance Liquid Chromatography Electrospray Ionization Mass
Spectrometry (NP-HPLC/ESI-MS)
The flavan-3-ols and PACs in the extracts of PS and peanut butters were separated by
115
NP-HPLC based on their degree of polymerization (DP). An Agilent 1200 Series HPLC was
employed and conditions of separation involved a PrincetonSPHER DIOL column (250 mm ×
4.6 mm, 5-μm particle size, 60 Å; Princeton Chromatography, Inc., Cranbury, NJ) equipped with
a guard cartridge/holder system; a thermostatted column compartment set at 30 °C; a binary
mobile phase of A (CH3CN: CH3COOH, 98:2, v/v) and B (CH3OH:H2O:CH3COOH, 95:3:2,
v/v/v); a 1 mL/min flow rate for 0-35 min of 0-40% B, held for 5 min, 40-45 min of 40-0% B,
and then an additional 5 min hold to re-equilibrate the system; 20 μL injection; and fluorescence
detection with λex and λem set at 276 and 316 nm, respectively. All test samples and PAC
standards (i.e., flavan-3-ol monomers, dimers, trimers, and tetramers only) were dissolved in
anhydrous CH3OH (20 mg/mL), diluted with mobile phase A at a 1:9 (v/v) ratio, and passed
through a 0.45-μm PTFE syringe filter prior to injection. Tentative identification of separated
components was made by retention time mapping with authenticated standards prior to ESI-MS
analysis.
NP-HPLC/ESI-MS analyses of the phenolics were carried out on an Agilent 1100 HPLC
system, with the same chromatography conditions as described above, combined with a Bruker
Esquire 3000plus ion trap mass spectrometer (Bruker Daltonics Inc., Billerica, MA) which was
equipped with an ESI source. Instrument control and data acquisition were performed with
Esquire 5.3 software. The HPLC eluent flowed directly into the mass spectrometer via a flow
splitter delivering roughly 100 μL/min. The ESI mass detector was employed in the negative-ion
mode with a skimmer voltage of -40 V and a capillary exit voltage of -241 V. The voltage applied
to the capillary tip was 4.0 kV. Nitrogen was used as the nebulizing gas at a pressure of 10 psi, a
dry gas flow rate of 6 L/min and a dry gas temperature of 280 °C. A full scan was performed
over the mass range of 200-3000 Da at a rate of 13,000 m/z per second. Each mass spectrum

116
generated was based on an average of five scans.
Statistical Analysis
All colorimetric and fluorescence assay measurements were repeated a minimum of three
times. The TDF assay was carried out in duplicate. The results were expressed as mean ±
standard deviation. Data for TPCs, TPAC contents, FRAP values, H-ORACFL values, and TDF
contents were analyzed by a one-way analysis of variance (ANOVA) using the General Linear
Model (SAS, version 9.3, SAS Institute, Inc., Cary, NC) to determine significant differences at
the 95% confidence interval (α=0.05). Tukey’s studentized range test was used to segregate
treatment means.
4.3 Results and Discussion
Total Phenolics Content (TPC)
In this study, the classical method of Singleton and Rossi (1965) using Folin & Ciocalteu’s
phenol reagent was employed to determine the TPC in acetonic extracts of defatted PS and
PS-fortified peanut butters (with further chromatography on the Amberlite XAD-16 column).
The findings are listed in Table 4.1 and expressed as mg (+)-catechin equivalents/g PS (d.w.) or
100-g peanut butter (f.w.). The greatest TPC of ~166 mg (+)-catechin eq./g was found in the
dry-blanched PS; this result was 33%, 34% and 38% higher than that for light-, medium-, and
dark-roasted skins, respectively. Even though dry-blanched PS exhibited the highest TPC, all
four PS types effectively increased the phenolics content of the formulated peanut butters in a
concentration-dependent manner. After adding dry-blanched PS to peanut butter at 1.25, 2.5, 3.75,
and 5.0% (w/w), the TPCs grew by 86, 357, 533, and 714%, respectively, relative to the peanut

117
butter devoid of PS. Interesting was the fact that at fortified levels below 3.75%, peanut butters
formulated with dry-blanched PS showed no overall significant difference compared to those
containing roasted PS.
Phenolic compounds are secondary metabolites in plants that generally concentrate in the
outer layers of plants such as peel, shell and hull to protect inner core materials. A large number
of intrinsic and extrinsic factors, such as genetics, environmental conditions, germination,
ripening, processing and storage, influence the types and levels of phenolics found in plants.
Mild heat treatment can break some covalent bounds of phenolic acids with insoluble polymers
and other cell wall components such as arabinoxylans, thereby liberating low-molecular-weight
antioxidant compounds from the repeating subunits (e.g., flavan-3-ols) of high-molecular-weight
oligomers (Jeong et al., 2004). PS roasted at 175 °C for 5 min were found to contain a higher
TPC than raw PS, especially when recovered by aqueous and ethanolic extraction (Yu, Ahmedna,
& Goktepe 2005). In addition to processing, the extraction conditions employed like choice of
solvent system, material-to-solvent ratio, particle size distribution of the PS, extraction time,
number of extractions, and temperature (Nepote, Grosso, & Guzmán, 2005) all impact the
efficiency of bioactive recovery and thereby result in different removal of phenolics from the
source material.
Our TPC data for dry-blanched PS was similar to that reported by Nepote, Grosso, and
Guzman (2002) where the TPC was ~159 mg phenol equivalents/g recovered from blanched PS
by 24-h maceration with methanol at a material-to-solvent ratio of 1:10 (w/v); the extraction was
performed 2× at room temperature in the dark. Using a microwave-assisted system to extract
phenolic antioxidants from PS, Ballard, Mallikarjunan, Zhou and O’Keefe (2010) reported a
comparable TPC result of 144 mg gallic acid equivalents/g skin under optimized conditions.

118
Francisco and Resurreccion (2009) reported a markedly greater TPC value of 280 mg/g in
Runner PS processed at 135 °C for 5 min. The phenolics were recovered from PS by 3 × 10-min
extractions at room temperature. Ethanol (70%, v/v) was the extractant used at a
material-to-solvent ratio of 1:20 (w/v). We carefully followed the reported methodology but
could neither reproduce the finding nor validate the result.
None of the treatment conditions described above are adopted by the peanut industry. Dry
blanching of raw peanuts, to remove the seed coat (i.e., testa) from the kernel, is achieved by
transporting peanuts on a belt through a low-temperature heating zone (at a maximum of 96 °C)
for ~45 min. Roasted PS, on the other hand, are a by-product of fluidized bed heating of raw
peanuts. For light-roasted PS, the skins are subjected to fluidized bed heating at 124 °C for 10
min followed by 168 °C for an additional 10 min. For dark-roasted PS, the initial thermal
processing is the same, but the final temperature in the last 10 min is 182 °C; medium-roasted PS
are subjected to a final temperature between 168 and 182 °C. TPC values from the literature are
difficult to compare against one another, because the sample source, manner of preparation, and
extraction techniques applied are quite varied. Though our work did not show the highest TPC
value ever reported for PS, it analyzed PS generated by the peanut industry as such. Moreover,
this investigation supports the employment of PS in a functional food (i.e., peanut butter) as a
potential source of antioxidant-rich phenolics.
Profile of PACs Determined by the DMAC Assay and NP-HPLC/ESI-MS
The TPAC contents, expressed as mg procyanidin B2 equivalents/g PS (d.w.) or 100-g peanut
butter (f.w.), are depicted in Figure 4.1(A) and 4.2(A), respectively. Dry-blanched PS possessed
the highest TPAC content of 84 mg/g which was 42, 47, and 62% higher (P < 0.05) than the

119
light-, medium-, and dark-roasted skins. All four PS types effectively (P < 0.05) increased the
PACs content of the formulated peanut butters in a step-wise, concentration-dependent manner.
Using dry-blanched PS as an example, the TPAC contents rose by 633, 1933, 3500, and 5033%,
respectively, after adding PS into peanut butter at 1.25, 2.5, 3.75, and 5.0% (w/w), compared to
the peanut butter control devoid of PS. A significant difference in the TPAC content of
dry-blanched PS- and roasted PS-fortified peanut butters was not evident until the PS
incorporation level reached 5.0%. Based on NP-HPLC/ESI-MS, most PAC oligomers were
barely evident in peanut butters devoid of PS, expect for DP2 (i.e., a dimer represented by a
degree of polymerization of 2) with an A-type linkage. In contrast, a wide variety of PACs (with
DPs from 2 to 9 possessing both A- and B-linkages) were found in the acetonic extracts of PS as
well as those from PS-fortified peanut butters (with further chromatography on the Amberlite
XAD-16 column). Addition of PS contributed to the enhanced PAC profile in the formulated
peanut butters, not only in quantity but also in type (Table 4.3).
PACs, also known as condensed tannins, are oligomeric and polymeric end products of the
flavonoid biosynthetic pathway consisting of flavan-3-ol (i.e., (+)-catechin and (-)-epicatechin)
monomers and their galloyl derivatives. B-type PAC dimers are linked via (C4→C8) or (C4→C6)
bonds, whereas A-type dimers contain an additional (C2→O→C7) linkage. The DMAC assay is
considered as a rapid method to quantify the PACs content and can effectively exclude
interference from other sample components. The reaction of charge delocalization on the DMAC
molecule is specific for phenolic compounds where meta-oriented di- or tri-hydroxyphenols are
found, such as in PACs (Krueger, Reed, Feliciano, & Howell, 2013). As stated above, our data
revealed the highest TPC was present in dry-blanched PS at 166 mg (+)-catechin/g skin. The
TPC value was not significantly different from roasted PS that showed ~123±2.6 mg/g.

120
Therefore, > 50% of the TPC found in PS was PACs based on this projection. A number of
studies have reported that PACs are the major phenolic constituent in PS. According to Karchesy
and Hemingway (1986), ~17% of the PS by weight is PACs, of which 50% were
low-molecular-weight oligomers. The accurate quantification of PACs using the procyanidin B2
standard is somewhat impaired by an ascending DP. The DMAC assay is more suitable for
samples containing low-molecular-weight PAC oligomers for which the structure and reaction
kinetics of the B2 dimer standard are better matched. Therefore, quantification error exists when
MS analyses reveal the presence of higher polymerized PACs (i.e., a DP ≥ 4) (Krueger, Reed,
Feliciano, & Howell, 2013) in PS and their fortified peanut butters.
Six A-type PAC dimers and five oligomeric PACs with both A- and B-type linkages were
isolated and characterized by Lou’s group (1999 & 2004). A higher degree of polymerized PAC
trimers, tetramers, and oligomers together with B-type PAC dimers were identified in PS by
Lazarus, Adamson, Hammerstone, and Schmitz (1999). According to LC-MS data reported by
Yu, Ahmedna, Goktepe, and Dai (2006), the PACs were mainly of the A-type, including dimers,
trimers and tetramers; they also showed much greater concentrations compared to other
phenolics in the PS, such as free phenolic acids.
Yu and coworkers (2006) reported a significant influence of the skin removal methods on the
PACs content of PS. Dry heat, like in roasting, would increase A-type dimers and B-type trimers
compared to directly peeled PS; whereas, wet blanching would leach out most A- and B-type
PACs due to the high solubility of these compounds in hot water. The increased A-type dimers
might arise from monomeric polymerization or the degradation of trimers and tetramers.
Polymerization of monomers and B-type dimers is a plausible mechanism by which increased
B-type trimers were detected. In our study, all four types of PS were treated with dry heat of

121
some sort. The highest PACs content of dry-blanched PS might result from the more optimal
processing conditions (i.e., temperature and time) for monomeric polymerization and/or
oligomer (n > 4) degradation.
Ferric Reducing Antioxidant Power Assay (FRAP)
In acidic medium the ferric tripyridyltriazine {Fe(III)−TPTZ} complex is reduced to ferrous
tripyridyltriazine {Fe(II)−TPTZ} by a reductant/antioxidant, such as a phenolic compound, with
an appropriate redox potential. The resultant Fe(II)−TPTZ chromophore yields an intense blue
color with a wavelength maximum of 593 nm. Unfortunately, the FRAP assay only detects
compounds with redox potentials of < 0.7 V (Prior, Wu, & Schaich, 2005), and is indicative of
the antioxidant capacity of converting radicals to stable products by electron donation (i.e., via a
single-electron transfer {SET} and not a hydrogen-atom transfer {HAT} mechanism). The
dry-blanched PS possessed the highest FRAP value [Figure 4.1(B)], which was 66, 55, and 38%
greater (P < 0.05) than the light-, medium-, and dark-roasted PS, respectively. After incorporation
of dry-blanched PS, the FRAP values rose by 62, 387, 747, and 829%, respectively, in the peanut
butter prototypes at 1.25, 2.5, 3.75, and 5.0% (w/w) compared to the peanut butter control devoid
of PS [Figure 4.2(B)]. Corresponding to their highest TPC and TPAC contents, dry-blanched PS
exhibited the greatest FRAP value, as predicted. Interestingly, this superiority was not
demonstrated in PS-fortified peanut butters when the addition level was below 3.75%.
In their review, Prior, Wu, and Schaich (2005) reported that the number of hydroxy
constituents on aromatic residues correlates positively with reducing power. The high FRAP
value found in dry-blanched PS is most likely due to these skins possessing the greatest TPAC
content; condensed tannins are more hydroxylated than phenolic acids on an equimolar basis.

122
The inability of the FRAP assay to detect compounds that function by HAT narrowed down
electron donation to be a possible mechanism contributing toward the potent antioxidant
activities observed for phenolics, especially PACs present in PS. Even though the acidic pH of
the FRAP assay is necessary to maintain iron solubility, it lowers the ionization potential of the
reactants and increases the redox potential of the system (Prior, Wu, & Schaich, 2005). An
additional disadvantage of the FRAP assay is the exclusion of some polyphenols that require
longer times for reaction, for example, > 4 min (Prior, Wu, & Schaich, 2005). A slowly
increasing FRAP value was found in phenolics such as caffeic acid, tannic acid, ferulic acid,
trans-resveratrol, and quercetin even after several hours of reaction (Pulido, Bravo, &
Saura-Calixto, 2000).
Hydrophilic-Oxygen Radical Absorbance Capacity (H-ORACFL) Assay
In Figure 4.1(C) and 4.2(C), the H-ORACFL values of PS and peanut butters were expressed
as Trolox equivalents (TE)/g PS d.w. or g peanut butter f.w., respectively. Briefly, the H-ORACFL
assay measures the antioxidant scavenging activity against the peroxyl radical induced by AAPH
at 37 °C. Generated peroxyl radicals react with a fluorescent probe and form an oxidized
nonfluorescent reaction product, which is quantitated by monitoring real-time fluorescence. In
the presence of an antioxidant species, the oxidation of the fluorescent probe is inhibited: the
antioxidant acts as the first defense in quenching the peroxyl radicals resulting in a longer
observed period of fluorescence (Prior, Wu, & Schaich, 2005). The greater the H-ORACFL value
denotes an increased efficacy of HAT by the antioxidant or antioxidant constituents within a
specific matrix (e.g., an acetonic phenolic extract). The dry-blanched PS exhibited the highest
H-ORACFL value compared to roasted PS, and was 10, 25, and 23% greater (P < 0.05) than the

123
light-, medium-, and dark-roasted PS, respectively. Incorporation of dry-blanched PS increased
the H-ORACFL values by 53, 247, 382, and 415%, respectively, in the formulated peanut butters
at 1.25, 2.5, 3.75, and 5.0% (w/w) compared to peanut butter devoid of PS. Peanut butter
fortified with dry-blanched PS showed significant higher radical-scavenging capacity than those
with roasted PS, but only when the incorporation level reached 3.75%.
PS have been shown efficacious in scavenging free radicals and inhibiting edible oil
oxidation. The radical-scavenging capacity of 2,2-diphenyl-1-picrylhydrazyl radical (DPPH•) has
been well demonstrated (Nepote, Grosso, & Guzman, 2002; Lou et al., 2004; Win et al., 2011).
Nepote, Grosso, and Guzman (2002) reported a marked antioxidant activity of PS extracts, as
demonstrated by their capacity to inhibit oxidation of sunflower oil. Compared to raw peanut
kernels, PS and hull methanolic extracts were more effective in the inhibition of linoleic acid
peroxidation (Win et al., 2011). ABTS+•, 2,2′-azino-bis(3-ethylbenzothiazoline-6-sulfonic acid)
radical cation, quenching by the phenolics of PS has also been documented (Yu, Ahmedna, &
Goktepe, 2005; Francisco & Resurreccion, 2009). Despite only moderate and low antioxidant
activity in lard and rapeseed oil when compared to extracts from Labiatae plants, PS exhibited
comparable activities in free radical-scavenging with other natural oxidants and satisfactory
reducing power (Hoang et al., 2008).
Davis, Dean, Price, and Sanders (2010) revealed a positive relationship between mild heat
treatment and H-ORACFL values of PS. The H-ORACFL values of roasting PS at 166 °C from 0
to 77 min ranged from 1.52 to 2.10 mmol TE/g PS. The maximum radical-scavenging capacity
was determined at 7-min roasting and then declined with an extended heating period. This was
similar to our observations, where the H-ORACFL values for dry-blanched and roasted skins
ranged from 1.96 to 2.42 mmol TE/g PS. Dry-blanched PS experience a less severe thermal
124
treatment compared to roasted counterparts and would predictably exhibit higher H-ORACFL
values. Correspondingly, addition of dry-blanched PS into the peanut butter matrix resulted in a
product with a tremendous increase in radical-scavenging capacity. Our data clearly
demonstrates the free radical-scavenging effects of PS and that this activity is retained in the
formulated peanut butters.
Fiber Analysis
The fiber contents of PS and peanut butters are presented in Table 4.2. Briefly, the TDF
contents were ~55% in dry-blanched PS, 43% in light- and medium-roasted PS, and 45% in
dark-roasted PS with 89-93% of this being IDF and 7-9% being SDF. The TDF content of the
peanut butter control was ~2.3 g per serving (28.5 g). The 5.0% addition of ground dry-blanched
PS enhanced the fiber content to ~2.9 g per serving, thereby permitting a “good source of fiber”
claim to be made according to US FDA food labeling regulations. Even though dry-blanched PS
indicated the highest content of IDF relative to roasted analogs, the superiority was not evident in
PS-fortified peanut butters even at the 5.0% incorporation level.
Little information is available about the fiber content of PS. Shimizu-Ibuka et al. (2009)
studied the hypocholesterolemic effect of PS and employed a commercial roasted PS which
contained ~45% TDF, of which only 2.2% was SDF. As early as 1981, Collins and Post explored
the use of peanut hull flour as a potential source of DF. The flour was prepared from either
Virginia- or Runner-type peanuts containing ~47% crude fiber and relatively large amounts
cellulose, hemicellulose, and lignin. Collins, Kalantari, and Post (1982) developed a series of
wheat breads containing 0, 4, and 8% peanut hull flour, respectively, in an attempt to increase the
DF content. Correspondingly, the neutral detergent fiber content of the breads increased from 4

125
to 6.7%. Breads containing 4% peanut hull flour were more acceptable than those at 8%; the
flour made from peanut hull could be a potential source of DF.
Likewise, our results demonstrated a positive relationship between TDF content in the peanut
butters and the step-wise addition of PS. Consumer acceptability of PS-fortified peanut butters
was conducted by Sanders et al. (2013), who reported that with incorporation at the 2.5% level,
PS addition – regardless of heat treatment – yielded peanut butters that equaled the control in
acceptability. When PS were added at the 5.0% level, peanut butters containing the dry-blanched
PS were most acceptable, equaling the acceptability of the formulations with 2.5% roasted PS.
The increased TDF content was not an impediment to consumer acceptability. As the major
by-product of the peanut industry, PS have great potential for their utilization as a source of DF
in functional foods.
Correlation of PS Incorporation with TPC, Free-radical-Scavenging Activity and TDF
Content
Using dry-blanched PS as an example, the correlation coefficients showing the relationships
between PS incorporation, TPC, H-ORACFL value, and TDF content are presented in Figure 4.3.
The proportional increase of TPC, free radical-scavenging activity, and TDF content with PS
addition indicated strong positive correlations (R2 ≥ 0.95) of those functional properties with the
PS level in peanut butters. PS addition affected an increase in the TPC, especially TPACs, in
peanut butters and thereby resulted in improved radical-scavenging/antioxidant performance. A
strong correlation (R2 ~0.98) between the TPC and ABTS+• radical-scavenging capacity was
reported in PS by Yu, Ahmedna, and Goktepe (2005). Similarly, an R2 of ~0.84 between the TPC
and DPPH• radical-scavenging capacity was reported in PS by Win et al. (2011). The

126
contribution of PS to the TPC, H-ORACFL value, and TDF content in the formulated peanut
butters of this study suggests that a serving of a PS value-added food is a good source of DF and
may provide antioxidant benefits.
4.4 Conclusions
PS possess a wealth of natural antioxidants with marked radical-scavenging activity and a
high content of DF, as determined in this study using selected in vitro assays. Although
dry-blanched PS exhibited the greatest enhancement, all four PS types effectively increased the
phenolics content, antioxidant capacity and the fiber content of the fabricated peanut butters in a
concentration-dependent manner while maintaining the US FDA’s standard of identity for peanut
butter. Moreover, the improved TPCs in the PS-fortified peanut butters were largely attributed to
the PACs, as demonstrated by the DMAC assay and NP-HPLC/ESI-MS.
The findings from a consumer acceptability study on the PS-fortified peanut butters
performed by researchers of our team but communicated in an independent publication indicate a
high acceptability at 2.5% level of PS incorporation. According to our findings, when
incorporated at the 2.5% level, increases in DF and phenolics content did not differ significantly
with PS type. Given a similar price structure as non-fortified peanut butters, these formulations
hold great promise as a functional food. In other words, the findings from this study have paved
the way for better utilization of a low-valued industrial by-product (i.e., PS) as an ingredient in
functional food formulations that can improve an existing product and allow diversification of
established brands available in the market.

127
Acknowledgements
This research was supported by a grant funded by the Georgia Food Industry Partnership and
is greatly appreciated. Thanks are extended to the following: Rick Boyce at Seabrook Ingredients,
a division of Universal Blanchers, LLC, for the peanut paste, flour salt, and stabilizer; Bruce A.
Kotz at Golden Peanut Corporation, LLC, for the light, medium, and dark roasted PS; Bill Paulk
at Sylvester Blanching, a division of Universal Blanchers, LLC, for the dry-blanched PS;
Agnieszka Kosińska of the Institute of Animal Reproduction and Food Research of the Polish
Academy of Sciences for her assistance with setting up the NP-HPLC analyses; and John T.
Powell, President of the Peanut Institute Inc., Albany, GA.
References
Anderson, J. W.; Baird, P.; Davis, R. H. Jr.; Ferreri, S.; Knudtson, M.; Koraym, A.; Waters, V.;
Williams, C. L. Health benefits of dietary fiber. Nutr. Rev. 2009, 67, 188–205.
AOAC. Official Methods of Analysis of AOAC INTERNATIONAL (18th ed.). 2005.
Gaithersburg, MD: AOAC INTERNATIONAL.
Awad, A. B.; Chan, K. C.; Downie, A. C.; Fink, C. S. Peanuts as a source of B-sitosterol, a sterol
with anticancer properties. Nutr. Cancer. 2000, 36, 238–241.
Ballard, T. S.; Mallikarjunan, P.; Zhou, K.; O’Keefe, S. Microwave-assisted extraction of
phenolic antioxidant compounds from peanut skins. Food Chem. 2010, 120, 1185–1192.
Cao, G.; Alessio, H. M.; Cutler, R. G. Oxygen-radical absorbance capacity assay for antioxidants.
Free Rad. Biol. Med. 1993, 14, 303–311.
Collins, J. L.; Kalantari, S. M.; Post, A. R. Peanut hull flour as a dietary fiber in wheat bread. J.
Food Sci. 1982, 47, 1899–1902, 1920.

128
Collins, J. L.; Post, A. R. Peanut hull flour as a potential source of dietary fiber. J. Food Sci.
1981, 46, 445–448, 451.
Davis, J. P.; Dean, L. L.; Price K. M.; Sanders T. H Roast effects on the hydrophilic and
lipophilic antioxidant capacities of peanut flours, blanched peanut seed and peanut skins.
Food Chem. 2010, 119, 539–547.
Francisco, M. L. L. D.; Resurreccion, A. V. A. Total phenolics and antioxidant capacity of
heat-treated peanut skins. J. Food Compos. Anal. 2009, 22, 16–24.
Hoang, V. H.; Apoštolová, P.; Dostálová, J.; Pudil, F.; Pokorný, J. Antioxidant activity of peanut
skin extracts from conventional and high-oleic peanuts. Czech J. Food Sci. 2008, 26,
447–457.
Isanga, J.; Zhang, G-N. Biologically active components and nutraceuticals in peanuts and related
products. Food Rev Int. 2007, 23, 123–140.
Jiang, R.; Manson, J. E.; Stampfer, M. J.; Liu, S.; Willett, W. C.; Hu, F. B. Nut and peanut butter
consumption and risk of type 2 diabetes in women. J. Amer. Med. Assoc. 2002, 288,
2554–2560.
Jeong, S-M.; Kim, S-Y.; Kim, D-R.; Jo, S-C.; Nam, K. C.; Ahn, D. U.; Lee, S-C. Effect of heat
treatment on the antioxidant activity of extracts from citrus peels. J. Agric. Food Chem. 2004,
52, 3389–3393.
Karchesy, J. J.; Hemingway, R. W. Condensed tannins: (4β→8; 2β→O→7)-linked procyanidins
in Arachis hypogea L. J. Agric. Food Chem. 1986, 34, 966–970.
Kris-Etherton, P. M.; Hu, F. B.; Ros, E.; Sabaté, J. The role of tree nuts and peanuts in the
prevention of coronary heart disease: multiple potential mechanisms. J. Nutr. 2008, 138,
1746S–1751S.

129
Kris-Etherton, P. M.; Yu-Poth, S.; Sabaté J.; Ratcliffe, H. E.; Zhao, G.; Etherton, T. D. Nuts and
their bioactive constituents: effects on serum lipids and other factors that affect disease risk.
Am. J. clin. Nutr. 1999, 70, 504S–511S.
Krueger, C. G.; Reed, J. D.; Feliciano, R. P.; Howell, A. B. Quantifying and characterizing
proanthocyanidins in cranberries in relation to urinary tract health. Anal. Bioanal. Chem.
2013, 405, 4385–4395.
Lazarus, S. A.; Adamson, G. E.; Hammerstone, J. F.; Schmitz, H. H. High-performance
chromatography/mass spectrometry analysis of proanthocyanidins in foods and beverages. J.
Agric. Food Chem. 1999, 47, 3693–3701.
Lou, H.; Yamazaki, Y.; Sasaki, T.; Uchida, M.; Tanaka, H.; Oka, S. A-type procyanidins from
peanut skin. Phytochemistry. 1999, 51, 297–308.
Lou, H., Yuan, H., Ma, B., Ren, D., Ji, M., & Oka, S. Polyphenols from peanut skins and their
free radical-scavenging effects. Phytochemistry. 2004, 65, 2391–2399.
Ma, Y.; Kerr, W. L.; Cavender, G. A.; Swanson, R. B.; Hargrove, J. L.; Pegg, R. B. Effect of
peanut skin incorporation on the color, texture and total phenolics content of peanut butters. J.
Food Process Eng. 2013, 36, 316–328.
Mercer, L. C.; Wynne, J. C.; Young, C. T. Inheritance of fatty acid content in peanut oil. Pean Sci.
1990, 17, 17–21.
Nepote, V.; Grosso, N. R.; Guzmán, C. A. Optimization of extraction of phenolic antioxidants
from peanut skins. J. Sci. Food Agr. 2005, 85, 33–38.
Nepote, V.; Grosso, N. R.; Guzman, C. A. Extraction of antioxidant components from peanut
skins. Grasas Aceites. 2002, 53, 391–395.
130
Payne, M. J.; Hurst, W. J.; Stuart, D. A.; Ou, B.; Fan, E.; Ji, H.; Kou, Y. Determination of total
procyanidins in selected chocolate and confectionery products using DMAC. J AOAC Int.
2010, 93, 89–96.
Prior, R. L.; Wu, X.; Schaich, K. Standardized methods for the determination of antioxidant
capacity and phenolics in foods and dietary supplements. J. Agric. Food Chem. 2005, 53,
4290–4302.
Pulido, R.; Bravo, L.; Saura-Calixto, F. Antioxidant activity of dietary polyphenols as determined
by a modified ferric reducing/antioxidant power assay. J. Agric. Food Chem. 2000, 48,
3396–3402.
Riedl, K. M.; Carando, S.; Alessio, H. M.; McCarthy, M.; Hagerman, A. E. Antioxidant activity
of tannins and tannin-protein complexes: assessment in vitro and in vivo. In Free Radicals in
Food: Chemistry, Nutrition, and Health Effects; Morello, M. J.; Shahidi, F.; Ho, C-T., Eds.;
American Chemical Society: Washington, DC, 2002; pp. 188–200.
Sanders, T. H. Non-detectable levels of trans-fatty acids in peanut butter. J. Agric. Food Chem.
2001, 48, 1243–1246.
Sanders, C. T., III; DeMasie, C. L.; Kerr, W. L.; Hargrove, J. L.; Pegg, R. B.; Swanson, R. B.
Peanut skins-fortified peanut butters: effects on consumer acceptability and quality
characteristics. J. Food Sci. 2013, submitted.
Santos-Buelga, C.; Scalbert, A. Proanthocyanidins and tannin-like compounds – nature,
occurrence, dietary intake and effects on nutrition and health. J. Sci. Food Agr. 2000, 80,
1094–1117.
Sarnoski, P. J.; Johnson, J. V.; Reed, K. A.; Tanko, J. M.; O’Keefe, S. F. Separation and
characterization of proanthocyanidins in Virginia type peanut skins by LC-MSn. Food Chem.

131
2012, 131, 927–939.
Saura-Calixto, F. Dietary fiber as a carrier of dietary antioxidants: an essential physiological
function. J. Agric. Food Chem. 2011, 59, 43–49.
Shimizu-Ibuka, A.; Udagawa, H.; Kobayashi-Hattori, K.; Mura, K.; Tokue, C.; Takita, T.; Arai, S.
Hypocholesterolemic effect of peanut skin and its fractions: a case record of rats fed on a
high-cholesterol diet. Biosci. Biotech. Biochem. 2009, 73, 205–208.
Shin, E-C.; Huang, Y-Z.; Pegg, R. B.; Phillips, R. D.; Eitenmiller, R. R. Commercial Runner
peanut cultivars in the United States: tocopherol composition. J. Agric. Food Chem. 2009, 57,
10289–10295.
Shin, E-C.; Pegg, R. B.; Phillips, R. D.; Eitenmiller, R. R. Commercial peanut (Arachis
hypogaea L.) cultivars in the United States: phytosterol composition. J. Agric. Food Chem.
2010, 58, 9137–9146.
Singleton,V.L.;Rossi, J. A. Colorimetry of total phenolics with phosphomolybdicphosphotungstic
acid reagents. Am. J. Enol. Vitic. 1965, 16, 144–158.
Srivastava, A.; Greenspan, P.; Hartle, D. K.; Hargrove, J. L.; Amarowicz, R.; Pegg, R. B.
Antioxidant and anti-inflammatory activities of polyphenolics from southeastern U.S. range
blackberry cultivars. J J. Agric. Food Chem. 2010, 58, 6102–6109.
United States Department of Agriculture (USDA). 2010–2013. Peanut stocks and processing.
National Agricultural Statistics Service, Washington, DC.
Win, M. M.; Abdul-Hamid, A.; Baharin, B. S.; Anwar, F.; Sabu, M. C.; Pak-Dek, M. S. Phenolic
compounds and antioxidant activity of peanut’s skin, hull, raw kernel and roasted kernel flour.
Pak J. Bot. 2011, 43, 1635–1642.
Yu, J.; Ahmedna, M.; Goktepe, I. Effects of processing methods and extraction solvents on

132
concentration and antioxidant activity of peanut skin phenolics. Food Chem. 2005, 90,
199–206.
Yu, J.; Ahmedna, M.; Goktepe, I.; Dai, J. Peanut skin procyanidins: composition and antioxidant
activities as affected by processing. J. Food. Compos. Anal. 2006, 19, 364–371.
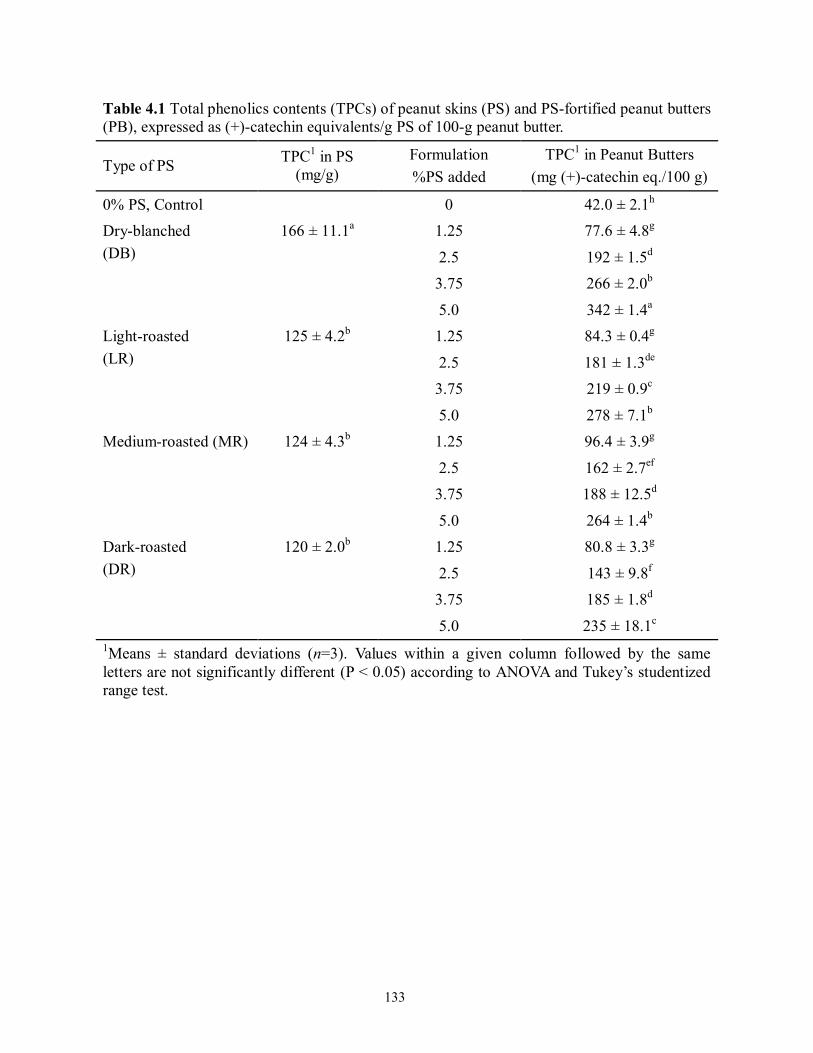
133
Table 4.1 Total phenolics contents (TPCs) of peanut skins (PS) and PS-fortified peanut butters (PB), expressed as (+)-catechin equivalents/g PS of 100-g peanut butter.
Type of PS TPC1 in PS (mg/g)
Formulation %PS added
TPC1 in Peanut Butters (mg (+)-catechin eq./100 g)
0% PS, Control 0 42.0 ± 2.1h Dry-blanched (DB)
166 ± 11.1a 1.25 77.6 ± 4.8g
2.5 192 ± 1.5d 3.75 266 ± 2.0b
5.0 342 ± 1.4a Light-roasted (LR)
125 ± 4.2b 1.25 84.3 ± 0.4g
2.5 181 ± 1.3de
3.75 219 ± 0.9c
5.0 278 ± 7.1b Medium-roasted (MR) 124 ± 4.3b 1.25 96.4 ± 3.9g
2.5 162 ± 2.7ef 3.75 188 ± 12.5d
5.0 264 ± 1.4b
Dark-roasted (DR)
120 ± 2.0b 1.25 80.8 ± 3.3g
2.5 143 ± 9.8f 3.75 185 ± 1.8d
5.0 235 ± 18.1c 1Means ± standard deviations (n=3). Values within a given column followed by the same letters are not significantly different (P < 0.05) according to ANOVA and Tukey’s studentized range test.
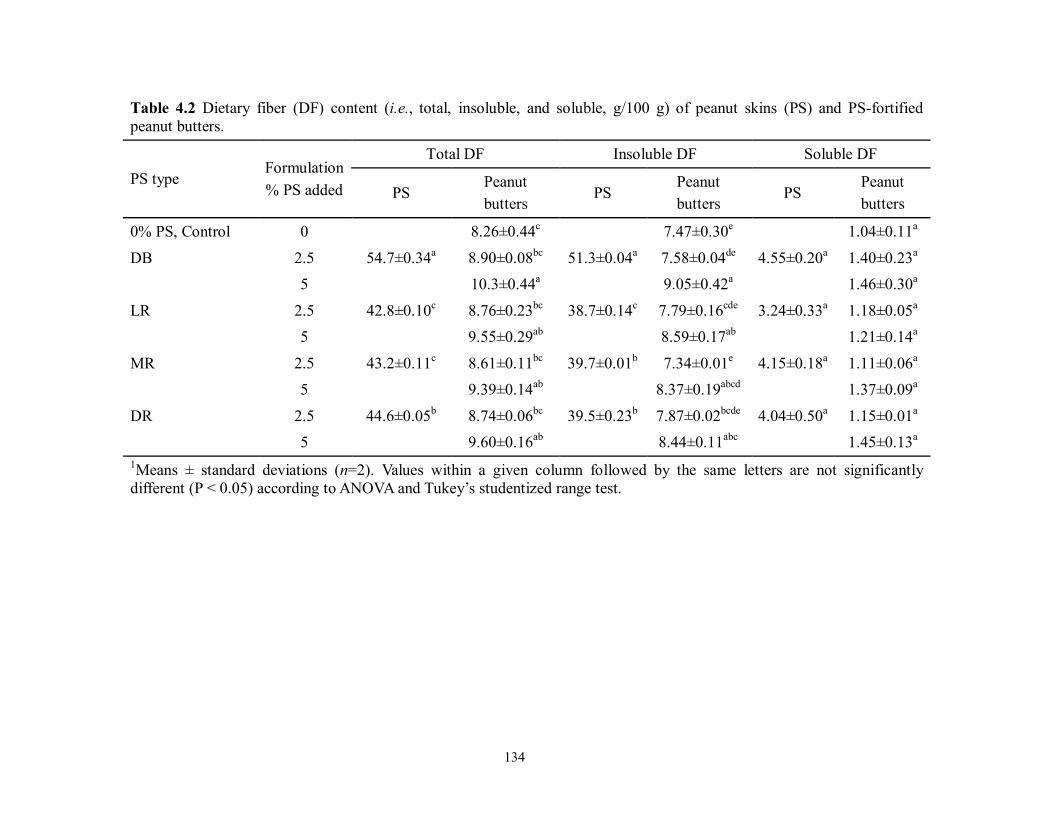
134
Table 4.2 Dietary fiber (DF) content (i.e., total, insoluble, and soluble, g/100 g) of peanut skins (PS) and PS-fortified peanut butters.
PS type Formulation % PS added
Total DF Insoluble DF Soluble DF
PS Peanut butters
PS Peanut butters
PS Peanut butters
0% PS, Control 0 8.26±0.44c 7.47±0.30e 1.04±0.11a
DB 2.5 54.7±0.34a 8.90±0.08bc 51.3±0.04a 7.58±0.04de 4.55±0.20a 1.40±0.23a 5 10.3±0.44a 9.05±0.42a 1.46±0.30a
LR 2.5 42.8±0.10c 8.76±0.23bc 38.7±0.14c 7.79±0.16cde 3.24±0.33a 1.18±0.05a
5 9.55±0.29ab 8.59±0.17ab 1.21±0.14a
MR 2.5 43.2±0.11c 8.61±0.11bc 39.7±0.01b 7.34±0.01e 4.15±0.18a 1.11±0.06a 5 9.39±0.14ab 8.37±0.19abcd 1.37±0.09a
DR 2.5 44.6±0.05b 8.74±0.06bc 39.5±0.23b 7.87±0.02bcde 4.04±0.50a 1.15±0.01a 5 9.60±0.16ab 8.44±0.11abc 1.45±0.13a
1Means ± standard deviations (n=2). Values within a given column followed by the same letters are not significantly different (P < 0.05) according to ANOVA and Tukey’s studentized range test.
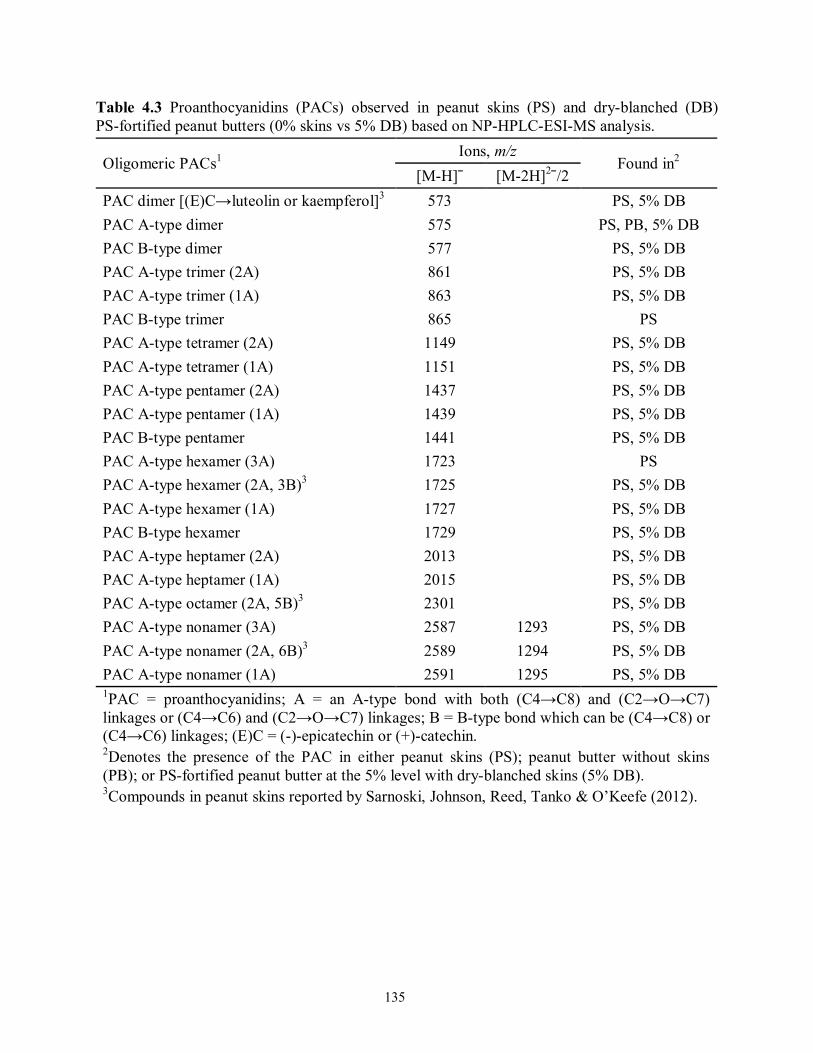
135
Table 4.3 Proanthocyanidins (PACs) observed in peanut skins (PS) and dry-blanched (DB) PS-fortified peanut butters (0% skins vs 5% DB) based on NP-HPLC-ESI-MS analysis.
Oligomeric PACs1 Ions, m/z
Found in2 [M-H]ˉ [M-2H]2ˉ/2
PAC dimer [(E)C→luteolin or kaempferol]3 573 PS, 5% DB PAC A-type dimer 575 PS, PB, 5% DB PAC B-type dimer 577 PS, 5% DB PAC A-type trimer (2A) 861 PS, 5% DB PAC A-type trimer (1A) 863 PS, 5% DB PAC B-type trimer 865 PS PAC A-type tetramer (2A) 1149 PS, 5% DB PAC A-type tetramer (1A) 1151 PS, 5% DB PAC A-type pentamer (2A) 1437 PS, 5% DB PAC A-type pentamer (1A) 1439 PS, 5% DB PAC B-type pentamer 1441 PS, 5% DB PAC A-type hexamer (3A) 1723 PS PAC A-type hexamer (2A, 3B)3 1725 PS, 5% DB PAC A-type hexamer (1A) 1727 PS, 5% DB PAC B-type hexamer 1729 PS, 5% DB PAC A-type heptamer (2A) 2013 PS, 5% DB PAC A-type heptamer (1A) 2015 PS, 5% DB PAC A-type octamer (2A, 5B)3 2301 PS, 5% DB PAC A-type nonamer (3A) 2587 1293 PS, 5% DB PAC A-type nonamer (2A, 6B)3 2589 1294 PS, 5% DB PAC A-type nonamer (1A) 2591 1295 PS, 5% DB 1PAC = proanthocyanidins; A = an A-type bond with both (C4→C8) and (C2→O→C7) linkages or (C4→C6) and (C2→O→C7) linkages; B = B-type bond which can be (C4→C8) or (C4→C6) linkages; (E)C = (-)-epicatechin or (+)-catechin. 2Denotes the presence of the PAC in either peanut skins (PS); peanut butter without skins (PB); or PS-fortified peanut butter at the 5% level with dry-blanched skins (5% DB). 3Compounds in peanut skins reported by Sarnoski, Johnson, Reed, Tanko & O’Keefe (2012).

136
Figure Captions
Figure 4.1 Total proanthocyanidins (TPAC) contents (A), ferric reducing antioxidant power
(FRAP) values (B), and hydrophilic-oxygen radical absorbance capacity
(H-ORACFL) values (C) of peanut skins (PS). Abbreviations for the type of PS
examined are as follows: DB, dry-blanched; LR, light-roasted; MR,
medium-roasted; and DR, dark-roasted. Means (n=3) without a common letter differ
significantly (P < 0.05) according to a one-way ANOVA and Tukey’s studentized
range test.
Figure 4.2 Total proanthocyanidins (TPAC) contents (A), ferric reducing antioxidant power
(FRAP) values (B), and hydrophilic-oxygen radical absorbance capacity
(H-ORACFL) values (C) of peanut skins (PS)-fortified peanut butters. A set of
clustered bars on the y-axis depicts the concentration for the identified PS type (i.e.,
DB, LR, MR, or DR); within each cluster, PS-fortification levels increased (i.e.,
1.25, 2.5, 3.75, 5.0%) from the lowest to highest bar. The formulated peanut butter
sample (0% PS) depicted as a single bar was the control. See the caption of Fig. 1
for details concerning the abbreviations employed and statistical treatment of the
data.
Figure 4.3 Positive linear correlations between total phenolics contents (TPCs, A),
hydrophilic-oxygen radical absorbance capacity (H-ORACFL) values (B), and total
dietary fiber (TDF) contents (C) to peanut skins (PS) incorporation.

137
Type of Peanut Skins (PS) Examined
H-O
RA
CFL
Val
ues
(mm
ol T
rolo
x eq
./g P
S, d
.w.)
0.0
0.5
1.0
1.5
2.0
2.5
FRA
P V
alue
s(m
mol
Fe2+
eq.
/100
-g P
S, d
.w.)
0
20
40
60
80
100
Tot
al P
roan
thoc
yani
dins
, TPA
C(m
g pr
ocya
nidi
n B
2/g
PS, d
.w.)
0
20
40
60
80
DB
LR MRDR
a
b bb
DBa
LRb
MRb
DRb
DBa
MRb
DRb
LRab
A
B
C
Figure 4.1

138
H-ORACFLValues (µmol Trolox eq./g PB, f.w.)0 10 20 30 40 50 60
Form
ulat
ed P
eanu
t But
ters 0% PS; Control
DB
LR
DR
MR
ha
b,c,d
b,c,d
b,c
a,bd,e,f
g,h
c,d,eg,h
e,f
c,d,ee,fg
fgg
FRAP Values (µmol Fe2+ eq./100-g PB, f.w.)0 200 400 600 800 1000
Form
ulat
ed P
eanu
t But
ters
Total Proanthocyanidins, TPAC(mg procyanidin B2/100-g PB, f.w.)
0 20 40 60 80 100 120 140 160 180
Form
ulat
ed P
eanu
t But
ters j
DB
LR
MR
DR
h,ie,f
ba
0% PS; Control
bd
eh,i
hd
bf,g
ce,f
gi
k 0% PS; ControlDB
j
bg
c
ce
gj
afi
d,e
jh f
d
LR
MR
DR
A
B
C
Figure 4.2
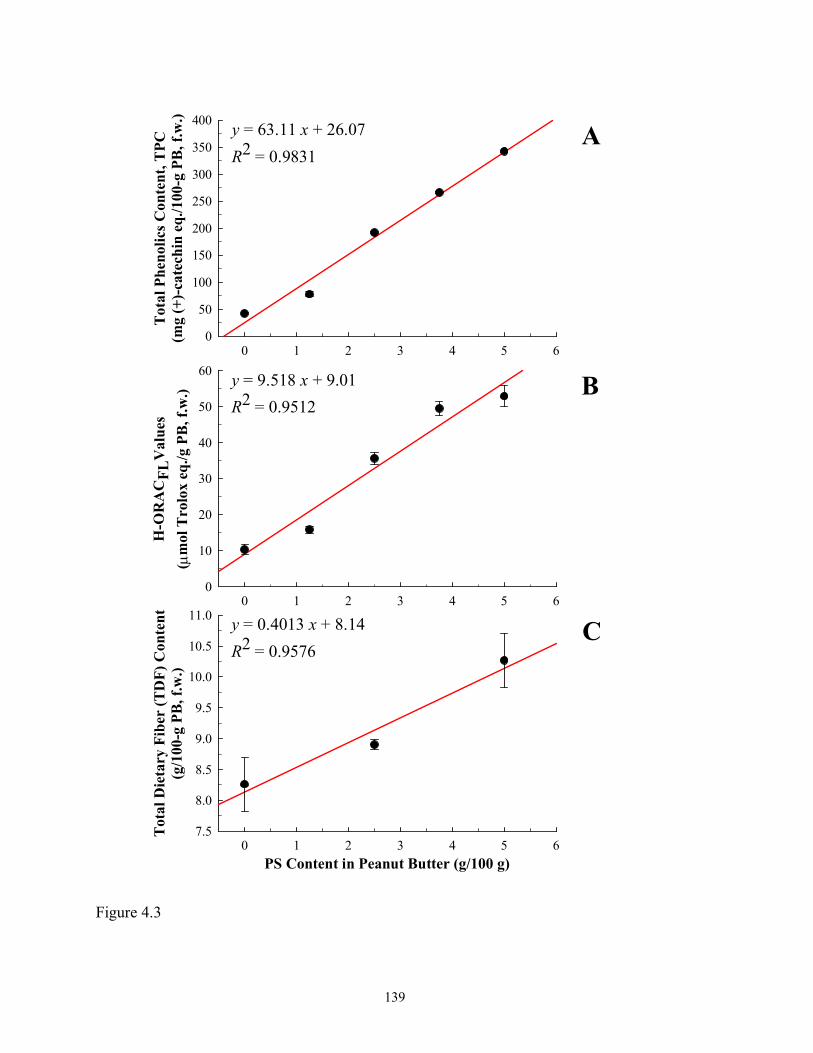
139
0 1 2 3 4 5 6
H-O
RA
CFL
Val
ues
( µm
ol T
rolo
x eq
./g P
B, f
.w.)
0
10
20
30
40
50
60 y = 9.518 x + 9.01R2 = 0.9512
PS Content in Peanut Butter (g/100 g)0 1 2 3 4 5 6
Tot
al D
ieta
ry F
iber
(TD
F) C
onte
nt(g
/100
-g P
B, f
.w.)
7.5
8.0
8.5
9.0
9.5
10.0
10.5
11.0 y = 0.4013 x + 8.14R2 = 0.9576
0 1 2 3 4 5 6
Tot
al P
heno
lics C
onte
nt, T
PC(m
g (+
)-ca
tech
in e
q./1
00-g
PB
, f.w
.)
0
50
100
150
200
250
300
350
400 y = 63.11 x + 26.07R2 = 0.9831
A
B
C
Figure 4.3

140
CHAPTER 5
SEPARATION AND CHARACTERIZATION OF FREE PHENOLIC
COMPOUNDS FROM DRY-BLANCHED PEANUT SKINS BY LIQUID
CHROMATOGRAPHY-ELECTROSPRAY IONIZATION MASS
SPECTROMETRY
Ma, Y.; Kosińska-Cagnazzo, A.; Kerr, W. L.; Amarowicz, R.; Swanson, R. B.; Pegg, R. B. Journal of Chromatography A. 2014, available on line. Reprinted here with permission of publisher (Elsevier).
141
Abstract
A large variety of phenolic compounds, including phenolic acids (hydroxybenzoic acids,
hydroxycinnamic acids, and their esters), stilbenes (trans-resveratrol and trans-piceatannol),
flavan-3-ols (e.g., (-)-epicatechin, (+)-catechin, and their polymers {the proanthocyanidins,
PACs}), other flavonoids (e.g., isoflavones, flavanols, and flavones, etc.) and biflavonoids (e.g.,
morelloflavone), were identified in dry-blanched peanut skins (PS) by this study.
High-performance liquid chromatography (HPLC) coupled with electrospray ionization mass
spectrometry (ESI-MSn) was applied to separate and identify the phenolic constituents.
Reversed-phase HPLC was employed to separate free phenolic compounds as well as PAC
monomers, dimers, and trimers. PACs with a degree of polymerization (DP) of > 4 were
chromatographed via hydrophilic interaction liquid chromatography (HILIC). Tentative
identification of the separated phenolics was based solely on molecular ions and MSn
fragmentation patterns acquired by ESI-MS in the negative-ion mode. The connection sequence
of PAC oligomers (DP < 5) could be deduced mainly through characteristic quinone methide
(QM) cleavage ions. When the DP reached 6, only a proportion of the flavan-3-ols could be
ascertained in the PACs because of the extremely complicated fragmentation patterns involved.
The identification of free phenolic acids, stilbenes, and flavonoids was achieved by commercial
standards and also by published literature data. Quantification was performed based on peak
areas of the UV (free phenolic compounds) or fluorescence (PACs) signals from the HPLC
chromatograms and calibration curves of commercial standards. Overall, PS contain significantly
more PACs compared to free phenolic compounds.

142
5.1 Introduction
Phenolic compounds are ubiquitous in plants and have been classified as secondary
metabolites (Bravo, 1998). Amongst the wide variety of phenolic compounds, phenolics of a
dietary nature for humans typically include phenolic acids, flavonoids, and phenolic polymers
(i.e., tannins) (King & Young, 1999). Phenolic acids (e.g., p-hydroxybenzoic acid and vanillic
acid) can be present free; however, their common occurrence is in the form of methyl and ethyl
esters, as well as glycosides being free and/or bound (Bravo, 1998). Hydroxycinnamic acids are
mostly bound to cell wall polysaccharides through covalent linkages (Bravo, 1998). To illustrate,
p-coumaric and ferulic acids are bound in graminaceous cell walls through ester-linkages
between their carboxylic groups and arabinoxylans (Hartley, Morrison, Himmelsbach, &
Borneman, 1990). In plants, the common occurrences of hydroxycinnamic acids are as esters of
hydroxyacids like quinic, shikimic, or tartaric acid (Herrmann, 1989; Crozier, Jaganath, &
Clifford, 2009; Teixeira et al., 2013). Other conjugated forms of hydroxycinnamic acids include
amides (e.g., with L-amino acids and peptides), esters of sugars, and glycosides (Teixeira et al.,
2013). The majority of flavonoids found in unpicked plants is generally in bound forms with one
or more sugar residues attached (Bravo, 1998; Hollman & Arts, 2000; Crozier, Jaganath, &
Clifford, 2009). As for flavan-3-ols (e.g., catechin, epicatechin, and gallocatechin) however, free
monomers are also their common occurrence (Bravo, 1998). Mild heat treatment was found
effective to cleave some of the covalent bonds of phenolic acids with insoluble polymers, and
other cell wall components such as arabinoxylans in citrus peels thereby liberating
low-molecular-weight antioxidant compounds from the repeating subunits of
high-molecular-weight polymers (Jeong et al., 2004). These released compounds were further
identified using gas chromatography-mass spectrometry (MS) analysis.

143
Peanut skins (PS) are the outer seed coat of the peanut cotyledon, and are often removed
from peanuts before processing into products such as peanut butter. They are relatively high in
proanthocyanidins (PACs). PACs are oligomers and polymers of flavan-3-ols, which are
primarily linked by C4→C8 bonds or less common C4→C6 bonds (B-type), whereas A-type
dimers contain an additional (C2→O→C7) linkage. Despite the presence of some monomeric
phenolic compounds, PACs comprise ~17% by weight of PS (Karchesy & Hemingway, 1986),
and are the predominant phenolic component in PS (Yu, Ahmedna, Goktepe, & Dai, 2006). Six
A-type PAC dimers identified in PS (Lou et al., 1999) were found with activity to inhibit the
inflammatory pathway mediated by hyaluronidase-induced release of histamine. A further study
by Lou’s group (2004) led to the isolation of five PAC oligomers from the water-soluble fraction
of PS with potential free-radical scavenging activity. Although A-type linkages are much more
abundant, both A- and B-type PACs exist in PS. The degree of polymerization (DP) identified in
PS was up to 12 bound by A-type linkages; whereas, B-type structures were detected with a DP
of up to only six (Monagas et al., 2009).
Because a greater polarity is associated with an increased DP, theoretically PACs can be
fractionated by reversed-phase (RP) or normal-phase (NP) high-performance liquid
chromatography (HPLC) in an order of ascending molecular mass (Hümmer & Schreier, 2008).
However, the resolution of PACs is limited to tetramers on C18 columns by RP-HPLC. The first
successful separation of PACs was achieved on SiO2 thin layer plates according to their DP (Lea
& Arnold, 1978). Based on this thin layer chromatography method, a NP-HPLC gradient of
CH2Cl2 and CH3OH with traces of aqueous formic acid (1:1, v/v) was developed by Rigaud et al.
(1993), resulting in the separation of PACs up to a DP of five in a cacao bean extract.
Hammerstone et al. (1999) identified PAC decamers in cocoa by using a gradient of similar

144
composition, but by replacing the formic acid with acetic acid. In the above cases, chlorinated
solvents were employed in the mobile phase compositions; these solvents are environmentally
unfriendly and can cause health problems from their exposure in the workplace. A better
separation of PACs in cacao with a DP up to 14 was achieved by Kelm et al. (2006) using a diol
stationary phase with a relatively safe binary mobile phase of A (CH3CN:CH3COOH, 99:1, v/v)
and B (CH3OH:H2O:CH3COOH, 95:4:1, v/v/v).
The PAC molecules eluted via HPLC can be further ionized by an ion generator such as
electrospray ionization (ESI), and these ions are subsequently separated according to their m/z
ratio (Hümmer & Schreier, 2008). The HPLC-MSn methods have been widely applied in the
analysis of PACs in a variety of food matrices. Apropos PS: monomer (catechin and epicatechin),
as well as A- and B-type PACs through dimers to tetramers were identified and quantified by
Yu’s group (2006) with a RP-HPLC-ESI-MS system. Recently, Constanza et al. (2012) reported
the separation and identification of PACs through monomers to hexamers in PS using
NP-HPLC-ESI-MS. Analyzing A-type PACs in PS, Appeldoorn et al. (2009) identified 83 PAC
species with DPs up to seven via a combination of NP-HPLC and RP-HPLC-ESI-MS2. The
fractions throughout NP-HPLC were further separated and characterized by RP-HPLC-MS2. PS
PACs up to nonamer were separated by NP-HPLC and characterized using RP-HPLC-ESI-MSn
in Sarnoski’s study (2012). Such applications of both RP-HPLC and NP-HPLC, incidentally,
become an emerging trend in phenolic analysis because of the improved separation with
multidimensional techniques (Montero, Herrero, Ibáñez, & Cifuentes, 2013).
According to Yu et al. (2005 & 2006), the phenolics from PS are abundant not only in
quantity but also in variety, which primarily includes phenolic acids (e.g., caffeic, chlorogenic,
ferulic, and coumaric acids), flavan-3-ols (e.g., (epi)catechin, epigallocatechin, catechin gallate,

145
and epicatechin gallate), stilbene (e.g., trans-resveratrol), and PACs. However, only limited
information can be found in the literature regarding phenolic profiles of PS from simple phenolic
compounds to polymerized PACs using the combination technique of HPLC (both RP and HILIC)
and MSn. The objectives of the present study were as follows: (1) to assess the free phenolic
compounds of the crude dry-blanched PS extracts using RP-HPLC-ESI-MSn and (2) to assess the
PACs profile of crude dry-blanched PS extracts using HILIC-ESI-MSn.
5.2 Methods and Materials
Materials
Dry-blanched PS were a gift from Universal Blanchers, LLC (Sylvester, GA). All solvents
and reagents were of analytical (ACS) grade, unless otherwise specified. Methanol, ethanol
(95%), and hexanes were purchased from VWR International (Suwanee, GA). Procyanidin B2
was obtained from Indofine Chemical Company, Inc. (Hillsborough, NJ) and the PAC standards
with a DP of 2 thru 10 were bought from Planta Analytica (Danbury, CT). (-)-Epiafzelechin was
acquired from BOC Science (Shirley, NJ), while all other standards were purchased from either
VWR International (Suwanee, GA) or the Sigma-Aldrich Chemical Co. (St. Louis, MO),
depending on stock.
Extraction of Phenolics
Extraction of phenolic compounds from PS was carried out according to Amarowicz et al.
(2004) with slight modifications. The extraction was performed in triplicate. In brief, samples
were placed in Whatman cellulose extraction thimbles (43 mm i.d. × 123 mm e.l., VWR
International, Suwanee, GA), covered with a plug of glass wool and defatted in a Soxhlet

146
extraction apparatus under reflux for 12 h with hexanes. Defatted PS were transferred to 125-mL
Erlenmeyer flasks at a mass-to-solvent ratio of 1:10 (w/v) with 80% (v/v) acetone. Extractions
were performed in a gyrotary water bath shaker (Model G76, New Brunswick Scientific
Company, Inc., New Brunswick, NJ) set at 150 rpm and a temperature of 45 °C for 30 min. The
slurry was then filtered by gravity through fluted P8 filter paper (Thermo Fisher Scientific, Inc.,
Suwanee, GA). The extraction process was further repeated 2× as described above. All filtrates
were pooled and acetone was evaporated with a Büchi Rotavapor R-210 using a V-700 vacuum
pump connected to a V-850 vacuum controller (Büchi Corporation, New Castle, DE) at 45 °C.
The aqueous residue was frozen and then lyophilized in a FreeZone® 2.5-L bench-top freeze
dryer (Labconco Corporation, Kansas City, MO) to ensure all traces of moisture were removed
and then stored in amber-glass bottles at -20 °C until further analyzed.
Preparation of the Free Phenolic Fraction from the Crude Extracts
Free phenolic compounds were separated from the crude extracts as taught by Weidner et al.
(1999). Briefly, 0.4 g of the crude extract was dissolved in 20 mL of deionized water, which was
acidified with 6 M HCl to pH 2.0. Subsequently, the free phenolic compounds were extracted
into 20-mL diethyl ether using a separatory funnel. After extraction 5×, the pooled organic phase
was evaporated with a Büchi Rotavapor R-210 using a V-700 vacuum pump connected to a
V-850 vacuum controller (Büchi Corporation, New Castle, DE) at 45 °C. All triplicate extracts
from dry-blanched PS were subjected to the above procedure individually. The dry residues
obtained in this manner were re-dissolved in 2 mL of 80% (v/v) aqueous methanol and filtered
through a non-sterile, 13-mm diameter, 0.2-μm regenerated cellulose filter membrane
(Phenomenex Inc., Torrance, CA) before injection onto the C18 column.
147
Reversed-phase High-performance Liquid Chromatography Electrospray Ionization Mass
Spectrometry (RP-HPLC-ESI-MSn)
An Agilent 1200 Series HPLC system consisting of a quaternary pump with degasser,
autosampler, thermostatted column compartment, UV/Vis diode array detection (DAD) with
standard flow cell, and 3D ChemStation software (Agilent Technologies) was used for the
chromatography. A reversed-phase Luna C18 column (4.6 × 250 mm, 5-μm particle size;
Phenomenex Inc., Torrance, CA) was utilized. A gradient elution consisting of mobile phase A
(H2O:CH3CN:CH3COOH; 93:5:2, v/v/v) and mobile phase B (H2O:CH3CN:CH3COOH; 58:40:2,
v/v/v) from 0 to 100% B over a 50-min period at a flow rate of 1 mL/min was employed. Before
subsequent injections, the system was re-equilibrated for 30 min using 100% A. The injection
volume was 20 μL. Detection wavelengths employed were 255 nm (hydroxybenzoic acids), 280
nm {(+)-catechin, (-)-epicatechin, and PACs}, 320 nm (trans-cinnamic acids), and 360 nm
(flavonoids). Tentative identification of separated components was achieved by matching UV
spectra and retention time (RT) mapping with commercial standards. For quantification,
calibration curves were constructed for each standard to confirm linearity based on the UV signal
as well as for the determination of response factors.
RP-HPLC-ESI-MSn analyses of the phenolics were carried out on an Agilent 1100 HPLC
system, with the same chromatography conditions as described above, combined with a Bruker
Esquire 3000plus ion-trap mass spectrometer (Bruker Daltonics Inc., Billerica, MA), which was
equipped with an ESI source. Instrument control and data acquisition were performed with
Bruker Daltonics Esquire 5.3 software. The HPLC eluent flowed directly into the mass
spectrometer via a flow splitter delivering roughly 100 μL/min. Mass spectra were acquired in
the negative-ion mode with smart settings for a target mass at 800 m/z, compound stability at

148
100%, and the trap drive level at 100%. The voltage applied to the capillary was 4.0 kV with an
end plate offset of -500 V. Nitrogen was used as the nebulizing gas at a pressure of 10 psi, a dry
gas flow rate of 6 L/min, and a dry gas temperature of 280 °C. The phenolic compounds were
fragmented using the auto-MS2 mode with the following precursor-ion selection parameters: two
precursor ions, threshold abs of 10,000, threshold rel of 5.0%, ion excluded after two spectra, ion
excluded after two spectra, and exclusion release after 0.5 min. All collision-induced dissociation
mass spectra were obtained with helium as the collision gas at a fragmentation voltage of 1 V
after isolation of the desired precursor ion. Full scan was performed over the mass range of 100
to 1,000 m/z at a rate of 13,000 m/z per s under standard–normal scan mode. The ion-current
control target was 50,000 with a maximum accumulation time of 50 ms. Each mass spectrum
generated was based on an average of ten scans. Precursor ions of interest were further subjected
to auto-MSn under the same conditions as described above.
Hydrophilic Interaction Liquid Chromatography Electrospray Ionization Mass
Spectrometry (HILIC-ESI-MSn)
The PACs in the crude extracts of PS were separated based on their degree of polymerization
(DP) according to Kelm et al. (2006) with modifications. An Agilent 1200 Series HPLC was
employed and conditions of separation involved a PrincetonSPHER DIOL column (250 mm ×
4.6 mm, 5-μm particle size, 60 Å; Princeton Chromatography, Inc., Cranbury, NJ) equipped with
a guard cartridge/holder system; a thermostatted column compartment set at 30 °C; a binary
mobile phase of A (CH3CN:CH3COOH, 98:2, v/v) and B (CH3OH:H2O:CH3COOH, 95:3:2,
v/v/v); a 1 mL/min flow rate for 0 to 35 min of 0 to 40% B, held for 5 min, 40 to 45 min of 40 to
0% B, and then an additional 5 min hold to re-equilibrate the system; 20 μL injection; and

149
fluorescence detection with λex and λem set at 276 and 316 nm, respectively. All test samples and
PAC standards (i.e., flavan-3-ol monomers, dimers, trimers, and tetramers only) were dissolved
in anhydrous CH3OH (20 mg/mL), diluted with mobile phase A at a 1:9 (v/v) ratio, and passed
through a non-sterile, 13-mm diameter, 0.45-μm PTFE syringe filter (Thermo Fisher Scientific,
Inc., Suwanee, GA) prior to injection. Tentative identification of the separated components was
made by RT mapping with authenticated standards prior to ESI-MS2 analyses.
HILIC-ESI-MS2 analyses of the PACs were carried out on an Agilent 1100 HPLC system,
with the same chromatography conditions as described above, combined with a Bruker Esquire
3000plus ion-trap mass spectrometer (Bruker Daltonics Inc., Billerica, MA), which was equipped
with an ESI source using the same conditions as described for RP-HPLC-ESI-MSn except: (i) the
smart setting for a target mass was set to 2,000 m/z; (ii) full scan was performed over the mass
range of 200 to 3,000 m/z; (iii) each mass spectrum generated was based on an average of five
scans; and (iv) active exclusion was employed after three consecutive fragmentation spectra.
Statistical Analysis
For each quantified phenolic compound, the mean and standard deviation was calculated
from the measurements of triplicate extractions.
5.3 Results and Discussion
Phenolic acids and flavonoids show characteristic UV-range absorbance patterns from 190 to
380 nm (Merken & Beecher, 2000; Robbins, 2003). By UV/Vis diode array detection (DAD),
four groups of phenolic compounds were distinguished, namely hydroxybenzoic acids (255 nm),
flavan-3-ols and polymers (280 nm), trans-cinnamic acids (320 nm) and other flavonoids (360

150
nm). These compounds were subsequently introduced into the ESI mass spectrometer and
analyzed based on their m/z charge. The confirmed identification was fulfilled by matching RTs
and/or spectral data with those of commercial standards, when available; tentative identification
was based on mass spectra. The equivocality in some identifications resulted from the presence
of stereoisomers, which are impossible to distinguish solely by MS. Typically, the cleavage of a
characteristic functional group from a compound in MSn analysis brings about a corresponding
change in mass. For example, glucuronide and acetyl-glucosides possess a characteristic mass
loss of 176 u and 204 u, respectively. p-Coumaroyl, caffeoyl, feruloyl, vanilloyl, and sinapoyl
groups provide mass losses of 146, 162, 176, 150, and 206 u, respectively. Loss of tartaric acid
and a pentose moiety would result in a mass loss of 132 u. Identification of compound classes
eluted by both RP-HPLC-MSn (Table 5.1) and HILIC-MSn (Table 5.2) are discussed below.
Figure 5.1 depicts the chemical structures of the phenolic monomeric aglycones detected in PS.
Free Phenolic Acids and Their Esters
Hydroxybenzoic Acids
Protocatechuic acid (compound R-4) with a maximum UV absorption at 260 nm yielded a
molecular ion [M – H]‾ at m/z 153 in the negative-ion mode and a fragment ion at m/z 109 [M –
H – 44]‾ through loss of a CO2 group from the carboxylic acid moiety. Compound R-8 gave a [M
– H]‾ at m/z 137. Though no significant MS2 fragment ion was observed for this compound, it
was confirmed by the p-hydroxybenzoic acid standard via RT and UV spectral matching (λmax =
256 nm).
151
Caffeic Acid and Its Tartaric Acid Esters
Caffeic acid (compound R-9) yielded a [M – H]‾ at m/z 179 and a prominent fragment at m/z
135 [M – H – 44]‾ through loss of a CO2 group. Compound R-5 is likely its tartaric acid ester
named caffeoyltartaric acid (caftaric acid), providing a [M – H]‾ at m/z 311. Further dissociation
fragments of the molecular ion were present at m/z 179 [M – H – 132 (tartaric acid residue)]‾ and
149 [M – H – 162 (caffeoyl)]‾. Compounds R-41 and R-59 are likely dicaffeoyltartaric acid
(chicoric acid) isomers, giving a [M – H]‾ at m/z 473. This precursor ion dissociated further into
product ions at m/z 311 [M – H – 162 (caffeoyl)]‾ and 293 [M – H – 162 (caffeoyl) – 18 (H2O)]‾.
The MS3 fragments of the product ion at m/z 311 were present at m/z 179 [caffeic acid – H]‾ via
loss of a tartaric acid moiety, 149 [tartaric acid – H]‾ via loss of a caffeoyl residue, and 135
[caffeic acid – H – 44]‾ via loss of a CO2 group from the deprotonated caffeic acid
(decarboxylated ion).
p-Coumaric Acid and Its Tartaric Acid Esters
The molecular ions generated by coumaric acids were present at m/z 163. The prominent
fragment at m/z 119 was formed through losing a CO2 group from the carboxylic acid moiety.
They were then assigned as p-coumaric acid (compound R-31) and o-coumaric acid (compound
R-47) by RT matching of commercial standards. p-Coumaric acid displayed a maximum UV
absorption band at 310 nm. Compounds R-14 and R-15 are tentatively identified as p-coumaric
acid esters named cis-coutaric acid (p-coumaroyltartaric acid) and trans-coutaric acid,
respectively, because of the [M – H]‾ at m/z 295 and the [p-coumaric acid – H]‾ fragment at m/z
163. The loss of 132 u is likely due to the cleavage of a tartaric acid moiety. Its decarboxylated
ion [p-coumaric acid – H – 44 (CO2)]‾ at m/z 119 was present in the MS3 spectra. The

152
identification was further supported by UV spectra: cis-coutaric acid exhibited λmax at 314 and
234 nm; whereas, trans-coutaric acid showed λmax at 316 and 234 nm (Mozetič, Tomažič, Škvarč,
& Trebše, 2006). Compounds R-20 and R-39 yielded the same molecular and fragment ions as
compounds R-14 and R-15 did but eluted later from the column. Compound R-20 could be
p-coumaroyl-O-pentoside, whereas compound R-39 is probably o-coumaroyl-O-pentoside. The
loss of 132 u herein might result from a pentose moiety.
Compound R-18 is conceivably p-comaroylnictotinoyltartaric acid with a [M – H]‾ at m/z
400. As seen in Figure 5.3(A), the MS2 dissociation of the molecular ion resulted in a product
ion at m/z 277, which was assigned as [M – H – 106 (nictotinoyl) – 18 (H2O)]‾. In the MS3
experiment [Figure 5.3(B)], this product ion dissociated further into secondary product ions at
m/z 259 by loss of a H2O molecule, 233 by loss of a CO2 group, 203 by loss of C2H2O3, and 163
corresponding to a deprotonated p-coumaric acid by loss of C4H2O4. The MS4 [277→203]
experiment yielded characteristic fragments at m/z 147 and 119 corresponding to a p-coumaroyl
residue and a [p-coumaric acid – H – 44 (CO2)]‾ ion, respectively. The proposed candidate of
compound R-65 is di-p-coumaroyltartaric acid. It displayed a molecular ion at m/z 441 and a
prominent ion at m/z 277 [M – H – 146 (coumaroyl) – 18 (H2O)]‾ [Figure 5.3(A)], which further
dissociated to deprotonated p-coumaric acid (m/z 163) and its decarboxylated ion (m/z 119) in the
MS3 experiment. The CID fragmentation pattern of di-p-coumaroyltartaric acid by ESI-MS was
illustrated by Ribas-Agustí et al. (2011). Similarly, compounds R-49, R-62, and R-63 are
tentatively identified as p-coumaroyltartaric acid ether-linked formononetin, trans-resveratrol,
and piceid, respectively. The proposed structures and fragmentation pathways are depicted in
Figure 5.3. Nevertheless, further analyses are required to support the purported identifications.
Compound R-84 is an unknown p-coumaroyltartaric acid derivative which gave a [M – H]‾ at

153
m/z 649 and fragment ions at m/z 503 [M – H – 146 (p-coumaroyl)]‾, 485 [M – H – 146
(p-coumaroyl) – 18 (H2O)]‾, 277 [M – H – 354 (unknown residue) – 18 (H2O)]‾, and 203 [M – H
– 354 (unknown residue) – 18 (H2O) – 74 (C2H2O3)]‾.
Compound R-51, which gave a [M – H]‾ at m/z 415, is tentatively identified as
p-coumaroyl-p-hydroxybenzoyltartaric acid. Further fragment ions were present at m/z 277 [M –
H – 120 (hydroxybenzoyl) – 18 (H2O)]‾, 251 [M – H – 146 (p-coumaroyl) – 18 (H2O)]‾, 163
[p-coumaric acid – H]‾ and 137 [hydroxybenzoic acid – H]‾. The deprotonated hydroxybenzoic
acid (m/z 137) was also observed in the MS3 spectra. Compound R-57 is likely
p-coumaroylvanilloyltartaric acid, showing a [M – H]‾ at m/z 445 and further dissociation ions at
m/z 281 [M – H – 146 (p-coumaroyl) – 18 (H2O)]‾, 277 [M – H – 150 (vanilloyl) – 18 (H2O)]‾,
192 [M – H – 146 (p-coumaroyl) – 18 (H2O) – 74 (C2H2O3) – 15 (CH3)]‾ and 167 [vanillic acid –
H]‾. The MS3 fragmentation of the product ion at m/z 281 also yielded the deprotonated vanillic
acid at m/z 167.
p-Coumaroylcaffeoyltartaric acid (compound R-52) gave a [M – H]‾ at m/z 457 and
fragment ions at m/z 311 [M – H – 146 (p-coumaroyl)]‾, 295 [M – H – 162 (caffeoyl)]‾, 277 [M –
H – 162 (caffeoyl) – 18 (H2O)]‾, 179 [M – H –146 (p-coumaroyl) – 132 (tartaric acid residue)]‾
and 163 [M – H – 162 (caffeoyl) – 132 (tartaric acid residue)]‾. The MS3 fragment of the product
ion at m/z 295 was present at m/z 163 corresponding to a deprotonated p-coumaric acid. The
further MS4 dissociation of the deprotonated p-coumaric acid yielded a typical decarboxylated
ion at m/z 119. This CID fragmentation pattern of p-coumaroylcaffeoyltartaric acid was very
close to that described by Ribas-Agustí et al. (2011). Compounds R-67 and R-74 are
p-coumaroylsinapoyltartaric acid isomers showing [M – H]‾ at m/z 501 and fragment ions at m/z
337 [M – H – 146 (p-coumaroyl) – 18 (H2O)]‾, 307 [M – H – 146 (p-coumaroyl) – 18 (H2O) – 30

154
(2CH3)]‾, 277 [M – H – 206 (sinapoyl) – 18 (H2O)]‾ and 203 [M – H – 206 (sinapoyl) – 18 (H2O)
– 74 (C2H2O3)]‾. The MS3 fragmentation of the product ion at m/z 337 produced deprotonated
sinapic acid (m/z 223) and its decarboxylated ion (m/z 179). This identification was further
supported by the MS4 spectra where a deprotonated sinapic acid (m/z 223), a sinapoyl residue
(m/z 207), and a decarboxylated ion of the deprotonated sinapic acid (m/z 179) were present.
Compounds R-68, R-73 and R-77 which provided [M – H]‾ at m/z 471 and fragment ions at m/z
307 [M – H – 146 (p-coumaroyl) – 18 (H2O)]‾, 277 [M – H – 176 (feruloyl) – 18 (H2O)]‾ and
203 [M – H – 176 (feruloyl) – 18 (H2O) – 74 (C2H2O3)]‾ are tentatively identified as
p-coumaroylferuloyltartaric acid. The MS3 fragmentation of the product ion at m/z 307 yielded
deprotonated ferulic acid (m/z 193). The fragment ions corresponding to a feruloyl residue (m/z
177) and a decarboxylated ion [ferulic acid – H – 44 (CO2)]‾ (m/z 149) were present in the MS4
spectra.
Ferulic Acid and Its Esters
The proposed candidate for compound R-17 is feruloyltartaric acid (fertaric acid) with a
molecular ion at m/z 325 and a prominent fragment at m/z 193 [M – H – 132 (tartaric acid
residue)]‾ corresponding to deprotonated ferulic acid, which dissociated further into secondary
product ions at m/z 178 [ferulic acid – H – 15 (CH3)]–•, 149 [ferulic acid – H – 44 (CO2)]–, and
134 [ferulic acid – H – 44 (CO2) – 15 (CH3)]–• by MS3 fragmentation. Compound R-19 is likely
feruloyl aspartate with a molecular ion at m/z 308 and a prominent fragment m/z of 193
corresponding to a deprotonated ferulic acid. The 115 u loss is characteristic for an aspartate
moiety. Other fragment ions observed were at m/z 178 [ferulic acid – H – 15 (CH3)]–•, 149
[ferulic acid – H – 44 (CO2)]–, and 132 [M – H – 176 (feruloyl)]–. Compound R-79 resulted in a

155
[M – H]‾ at m/z 355 and fragment ions at m/z 220 [M – H – 135]‾, 219 [M – H – 135 – H]‾, 193
[M – H – 162 (caffeoyl)]‾ and 135 [caffeic acid – H – 44 (CO2)]‾, which is tentatively identified
as 4-O-caffeoylferulic acid. Compound R-81 is likely an unknown ferulic acid derivative because
of its MS3 [403→311] fragments at m/z 193 [ferulic acid – H]– and 149 [ferulic acid – H – 44
(CO2)]–.
Compound R-71 is likely feruloylsinapoyltartaric acid, yielding a [M – H]‾ at m/z 531 and
fragment ions at m/z 337 [M – H – 176 (feruloyl) – 18 (H2O)]‾, 307 [M – H – 206 (sinapoyl) –
18 (H2O)]‾, and 233 [M – H – 206 (sinapoyl) – 18 (H2O) – 74 (C2H2O3)]‾. Deprotonated ferulic
acid (m/z 193) and its decarboxylated ion (m/z 149) were revealed by MS3 fragmentation of the
product ion at m/z 307. MS4 dissociation gave ions at m/z 193 [ferulic acid – H]‾ and m/z 162
[177 (feruloyl) – 15 (CH3)]‾•. Feruloylcaffeoyltartaric acid (compound R-72) was observed with
a molecular ion at m/z 487. The fragment ions were present at m/z 325 [M – H – 162 (caffeoyl)]‾,
307 [M – H – 162 (caffeoyl) – 18 (H2O)]‾, 293 [M – H – 176 (feruloyl) – 18 (H2O)]‾, 193 [M –
H – 162 (caffeoyl) – 132 (tartaric acid residue)]‾, and 179 [M – H – 176 (feruloyl) – 132 (tartaric
acid residue)]‾. The further MS3 dissociation of the product ion at m/z 325 revealed deprotonated
ferulic acid at m/z 193 and its decarboxylated ion at m/z 149. Compound R-88 yielded a [M – H]‾
at m/z 681 and fragment ions at m/z 307 [M – H – 356 (unknown residue) – 18 (H2O)]‾, 251 [M –
H – 356 (unknown residue) – 74 (C2H2O3)]‾, 233 [M – H – 356 (unknown residue) – 18 (H2O) –
74 (C2H2O3)]‾, and 193 [ferulic acid – H]‾, which therefore is conceivably a feruloyltartaric acid
derivative.
Coumarin
Compound R-44 is tentatively identified as dihydroxycoumarin, such as aesculetin. The
156
molecular ion [M – H]‾ was present at m/z 177 and further dissociation ions at m/z 149 [M – H –
28 (CO)]‾, 133 [M – H – 44 (CO2)]‾, and 105 [M – H – 28 (CO) – 44 (CO2)]‾ were observed.
5.3.2 Catechins and Proanthocyanidins (PACs)
Monomers to Trimers
PACs, also known as condensed tannins, are oligomeric and polymeric end products of the
flavonoid biosynthetic pathway consisting of flavan-3-ol monomers (i.e., (+)-catechin and
(-)-epicatechin) and their galloyl derivatives. The presence of each A-type bond will result in a
2-u decrease in the mass of PACs. Quinone methide fission (QM), retro-Diels-Alder fission
(RDA), and heterocyclic ring fission (HRF) are three well-described fragmentation mechanisms
of PACs (Gu et al., 2003). The types of PAC inter-monomeric linkages and QM fragmentation
patterns employed to determine positions of A-type linkages are illustrated in Figure 5.2.
Compounds R-7 and R-16 are identified as (+)-catechin and (-)-epicatechin, respectively,
which were confirmed by RT matching with commercial standards. Classic fragments of [M –
H]‾ at m/z 289 were observed at m/z 245 [M – H – 44]‾ by loss of a –CH2–CHOH– group or
neutral loss of CO2, 205 [M – H – 84]‾ by loss of C4H4O2 from the A-ring, and 179 [M – H –
110]‾ by loss of C6H6O2 (B-ring). The fragmentation mechanisms of (epi)catechin are described
in detail by Bravo et al. (2006).
Compounds R-1, R-6, R-13, R-21, and N-3 are probably PAC B-type dimers with a [M – H]‾
at m/z 577; whereas, compounds R-12, R-23, R-25, R-27, R-34, R-37, R-38, R-43, R-46, and
N-2 are likely PAC A-type dimers with a [M – H]‾ at m/z 575. In the negative-ion mode, an
A-type dimer would reveal a product ion at m/z 449 [M – H – 126]‾ by loss of a phloroglucinol
moiety (C6H6O3) from the top unit through HRF fragmentation. The product ion at m/z 423 [M –
157
H – 152]‾ is formed through RDA fragmentation of the base unit resulting in loss of a C8H8O3
moiety. Generally, the top unit is the favored site for RDA, but fission can occur at the base unit
when blocked by A-type bonds (Gu et al., 2003). QM cleavage fragments of A-type dimers were
present at m/z 289 [MT – H (290 – H)]‾ (QM cleavage at the terminal {T} unit) and 285 [ME –
5H (290 – 5H)]‾ (QM at the extension {E} unit). In a similar manner, product ions at m/z 451 [M
– H – 126 (C6H6O3)]‾, 425 [M – H – 152 (C8H8O3)]‾, 289 [MT – H (290 – H)]‾, and 287 [ME –
3H (290 – 3H)]‾ were generated via the fragmentation of the deprotonated B-type dimer. The
fragment ion at m/z 407 was produced by further loss of a H2O moiety from the product ion at
m/z 425. The acquired data and characteristic MS2 fragmentation patterns in the present work are
consistent with findings reported in previous studies (Gu et al., 2003; Appeldoorn et al., 2009;
Sarnoski et al., 2012). As for PAC A-type dimers, a molecular ion at m/z 597 was also observed,
which corresponds to [(M – H) + Na – H]‾.
Compounds R-2, R-3, R-10, R-11, R-24, R-26, R-29, R-30, R-32, R-33, R-36, and N-5 to
N-9 (m/z 863) are likely PAC A-type trimers with 1 A-bond; whereas, compounds R-35, R-42,
R-45, and N-4 (m/z 861) are probably PAC A-type trimers with 2 A-bonds. Though lack of MS2
fragmentation information, B-type trimers with a [M – H]‾ at m/z 865 were also observed in the
PS crude extract (compound N-10). Theoretically, PAC polymers (n ≥ 3) were dissociated in a
similar manner as to the dimers. There are two types of A-type trimers possible: both generate
the molecular ion at m/z 863, but with different QM diagnostic ions caused by varied positions of
the A-bonds. QM cleavage between the top and middle units produces ions at m/z 575 [MT – H
(576 – H)]‾ and 287 [ME – 3H (290 – 3H)]‾, indicating that the A-type linkage falls between the
middle and the base unit. The HRF and RDA fragmentation of the top unit yield product ions at
m/z 737 [M – H – 126 (C6H6O3)]‾ and 711 [M – H – 152 (C8H8O3)]‾, respectively. The HRF

158
fragmentation of the middle unit gives a product ion at m/z 449. When the A-type linkage is
located between the top and the middle units, QM cleavage ions are present at m/z 289 [MT – H
(290 – H)]‾ and 573 [ME – 3H (576 – 3H)]‾. In this case, the fragment ion at m/z 711 is formed
by RDA of the middle unit. The HRF fragmentation of the middle unit generates product ions at
m/z 451 and 411. Yet, these two types of trimers containing the same number of A-type bonds
were not well separated throughout the HPLC analysis. Mostly, two series of fragments were
observed in one mass spectrum. The HRF fragment ion of [M – H]‾ at m/z 861 was present at m/z
735 [M – H – 126 (C6H6O3)]‾ and the RDA fragmentation of the base unit generated a product
ion at m/z 709 [M – H – 152 (C8H8O3)]‾. The QM cleavage between the top and the middle units
resulted in fragment ions at m/z 575 [MT – H (576 – H)]‾ and 285 [ME – 5H (290 – 5H)]‾;
whereas, ions at m/z 289 [MT – H (290 – H)]‾ and 571 [ME – 5H (576 – 5H)]‾ were yielded when
QM cleavage occurred between the middle and the base unit. The product ion at m/z 449 was
formed by fragmentation of the QM ion at m/z 575 and the HRF ion at m/z 735 via the
mechanism of HRF (Gu et al., 2003).
PACs Containing Luteolin or Kaempferol Units
Compounds with molecular ions at m/z 573 (i.e., compounds R-48, R-50, and compound
N-1) and 859 (compound R-22) are tentatively identified as a PAC dimer and A-type trimer
containing a luteolin or kaempferol unit. These are novel PACs reported by Sarnoski et al. (2012).
The fragment ions at m/z 447 and 421 were produced through HRF and RDA cleavages,
respectively, at the top (epi)catechin unit of the dimer. Even though there is no confirmatory data
available, luteolin was the better candidate supported by subsequent MS4 fragmentation. In the
case of this dimer, the QM cleavage was likely blocked by the carbonyl group on the C-ring of

159
the base luteolin or kaempferol unit. The diagnostic ions at m/z 289 and 283 might have been
generated by direct cleavage of the interflavan bond, as noted in Sarnoski’s study (2012). The
proposed structure and fragmentation routes of this PAC dimer are depicted in Figure 5.4(A).
Unfortunately, no significant MS2 fragment was observed for the A-type trimer (m/z 859).
Propelargonidins
Compound R-55 (m/z 559) and compound R-53 (m/z 845) are likely a PAC dimer and trimer
with an (epi)afzelechin top unit connected to a subsequent (epi)catechin unit through an A-type
linkage; such a compound is referred to as a propelargonidin. The HRF and RDA fragment ions
of this dimer were revealed at m/z 433 [M – H – 126 (C6H6O3)]‾ and 407 [M – H – 152
(C8H8O3)]‾, respectively. Likewise, fragments at m/z 719 [M – H – 126 (C6H6O3)]‾ and 693 [M –
H – 152 (C8H8O3)]‾ were formed from the trimer via the HRF and RDA mechanisms,
respectively. The QM cleavage of the dimer resulted in diagnostic ions at m/z 289 [MT – H (290
– H)]‾ and 269 [ME – 5H (274 – 5H)]‾; whereas, the QM cleavage of the trimer gave diagnostic
ions at m/z 289, 575 [MT – H]‾ and 269, 555 [ME – 5H]‾, indicating the occurrence of two A-type
linkages. The fragmentation pathways of these two PAC oligomers have been well described by
Appeldoorn et al. (2009).
Prodelphinidin and Prorobinetidin
The molecular ion [M – H]‾ of m/z 591 (compound R-28) was formed by a prodelphinidin
A-type dimer [Figure 5.4(B)]. The HRF fragmentation of the top (epi)catechin unit yielded a
product ion at m/z 465 [M – H – 126 (C6H6O3)]‾. The ion at m/z 423 [M – H – 168 (C8H8O4)]‾
was produced by RDA fragmentation of the base (epi)gallocatechin unit. QM cleavage ions were
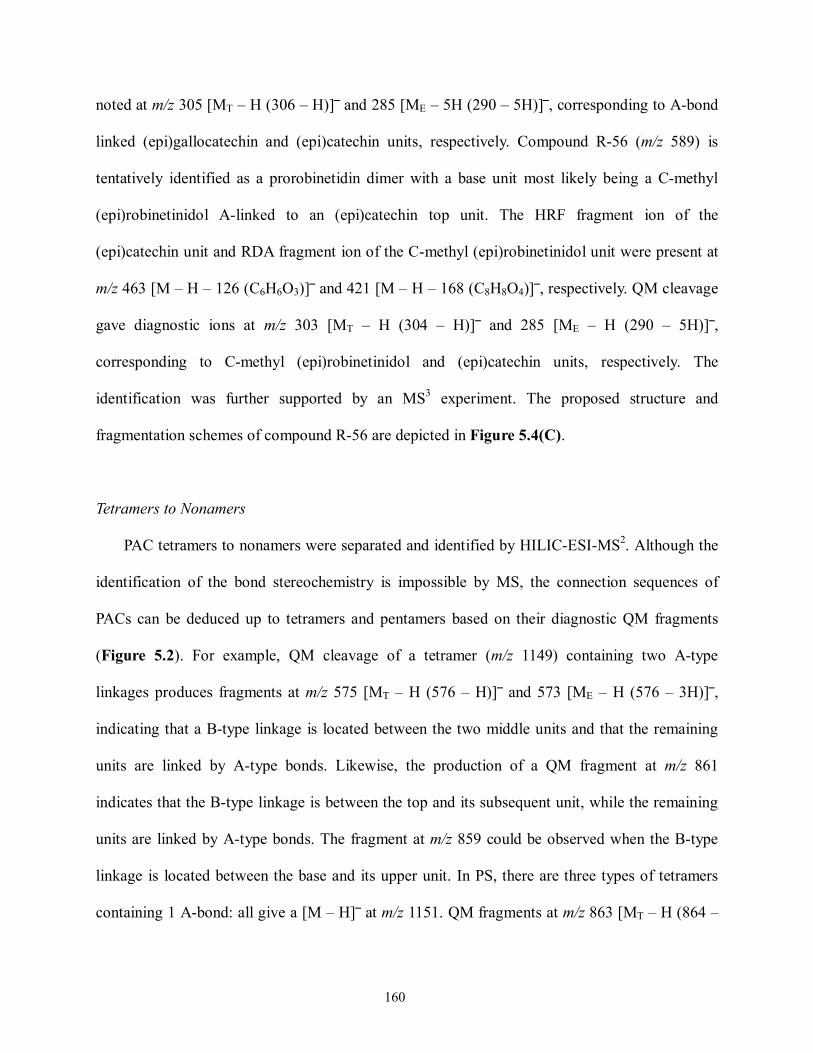
160
noted at m/z 305 [MT – H (306 – H)]‾ and 285 [ME – 5H (290 – 5H)]‾, corresponding to A-bond
linked (epi)gallocatechin and (epi)catechin units, respectively. Compound R-56 (m/z 589) is
tentatively identified as a prorobinetidin dimer with a base unit most likely being a C-methyl
(epi)robinetinidol A-linked to an (epi)catechin top unit. The HRF fragment ion of the
(epi)catechin unit and RDA fragment ion of the C-methyl (epi)robinetinidol unit were present at
m/z 463 [M – H – 126 (C6H6O3)]‾ and 421 [M – H – 168 (C8H8O4)]‾, respectively. QM cleavage
gave diagnostic ions at m/z 303 [MT – H (304 – H)]‾ and 285 [ME – H (290 – 5H)]‾,
corresponding to C-methyl (epi)robinetinidol and (epi)catechin units, respectively. The
identification was further supported by an MS3 experiment. The proposed structure and
fragmentation schemes of compound R-56 are depicted in Figure 5.4(C).
Tetramers to Nonamers
PAC tetramers to nonamers were separated and identified by HILIC-ESI-MS2. Although the
identification of the bond stereochemistry is impossible by MS, the connection sequences of
PACs can be deduced up to tetramers and pentamers based on their diagnostic QM fragments
(Figure 5.2). For example, QM cleavage of a tetramer (m/z 1149) containing two A-type
linkages produces fragments at m/z 575 [MT – H (576 – H)]‾ and 573 [ME – H (576 – 3H)]‾,
indicating that a B-type linkage is located between the two middle units and that the remaining
units are linked by A-type bonds. Likewise, the production of a QM fragment at m/z 861
indicates that the B-type linkage is between the top and its subsequent unit, while the remaining
units are linked by A-type bonds. The fragment at m/z 859 could be observed when the B-type
linkage is located between the base and its upper unit. In PS, there are three types of tetramers
containing 1 A-bond: all give a [M – H]‾ at m/z 1151. QM fragments at m/z 863 [MT – H (864 –

161
H)]‾ and 575 [MT – H (576 – H)]‾ and/or [ME – H (578 – 3H)]‾ indicate that the A-type linkage
lies between the base and its upper unit. The A-type linkage between the top and its subsequent
unit gives rise to QM fragments at m/z 577 [MT – H (578 – H)]‾, 861 [ME – 3H (864 – 3H)]‾ and
573 [ME – 3H (576 – 3H)]‾. When the A-type linkage locates itself between two middle units,
QM cleavage generates diagnostic ions at m/z 863 [MT – H (864 – H)]‾ and 861 [ME – 3H (864 –
3H)]‾. More details about the QM diagnostic ions employed for PAC sequence identifications
were discussed by Gu et al. (2003). Noteworthy is that some polymers with the same DP,
especially with the same number of A-bonds, co-elute together throughout HILIC, resulting in
overlapping mass spectra due to a similar polarity. The identifications reached in this work were,
therefore, made very cautiously based on the characteristic fragmentation patterns of each
sequence.
It would be inconclusive to deduce the connection sequence when the DP reaches 6 due to
the complexity of the MS2 fragmentation patterns. The proportion of flavan-3-ol constituents
were deduced chiefly by their [M – H]‾ or [M – 2H]2‾ ions. QM cleavage at the extension units
generates fragments with similar structures (Gu et al., 2003). In our study, the major ions were
displayed at m/z 573 + 288n. The further HRF of 573 + 288n ions resulted in m/z 735 + 288n
ions. To clarify, the cleavage of a hexamer (m/z 1725) gave smaller 573 + 288n ions at m/z 1437
(n = 3), 1149 (n = 2), and 861 (n = 1). The HRF fragments of ions at m/z 1437 and 861 were
present at m/z 1311 and 735, respectively. The cleavage of a heptamer and an octamer gave
major fragments at m/z 1725 (n = 4) and 2013 (n = 5), respectively. An octamer containing 3
A-bonds with a [M – H]‾ at m/z 2299 is a novel PAC compound first reported in PS.

162
Stilbenes
Compounds R-60 and R-61 are tentatively identified as trans-resveratrol and
trans-piceatannol, respectively. The molecular ion [M – H]‾ of compound R-60 was present at
m/z 227, while the fragments of [M – H]‾ were present at 209 [M – H – 18 (H2O)]‾, 185 [M – H
– 42 (CHCOH)]‾, and 143 [M – H – 42 (CHCOH) – 42 (C2H2O)]‾. The identification was further
confirmed by a commercial standard of trans-resveratrol by means of RT matching and UV
spectral analysis (λmax = 306 nm). Compound R-61 revealed a molecular ion at m/z 243. The
fragments ions were found at m/z 225 [M – H – 18 (H2O)]‾, 201 [M – H – 42 (CHCOH)]‾, 199
[M – H – 42 (CHCOH) – 2H]‾, and 159 [M – H – 42 (CHCOH) – 42 (C2H2O) or M – H – 42
(CHCOH) – 2H – 40 (C2O)]‾. This is the collision-induced dissociation fragmentation of [M –
H]‾ when the deprotonation reaction occurs on the catechol moiety of trans-piceatannol. This,
together with the other fragmentation mechanisms of trans-resveratrol and trans-piceatannol,
have been elucidated by Stella et al. (2008). Similar MS2 fragmentation patterns of
trans-resveratrol and trans-piceatannol in peanuts were reported in Ku’s study (2005).
Flavonoids
The substitution pattern and subclass of the flavonoid largely dictate its fragmentation routes
(Cuyckens & Claeys, 2004). Generally compared to flavones, more MSn fragmentation schemes
are proposed for flavonols because of the additional hydroxyl group in position 3. ijA‾ and ijB‾
ions are diagnostic fragments for flavonoid identification and generated by retro Diels-Alder
(RDA) cleavage in the C-ring. The A‾ and B‾ are product ions in the negative-ion mode
consisting of intact A- and B-rings, while the superscripts i and j indicate the positions in the
C-ring where two C–C bonds have been ruptured. Besides RDA cleavage in the C-ring, the

163
losses of neutral molecules such as H2O (18 u), CO (28 u), CO2 (44 u), C2H2O (42 u), and C3O2
(68 u) can be characteristic in the negative-ion mode. The fragmentation of flavone, flavonol,
and flavanone aglycones in the negative-ion mode by ESI-trap MS are well-demonstrated by
Fabre et al. (2001). The successive loss of CH3• groups and then CO (28 u) or CHO• (29 u) are
predominant for methoxylated flavonoids (Justesen, 2001). Nevertheless, the exact position of
the methoxy moiety could not be defined without more intricate standards or NMR analysis.
(Cuyckens & Claeys, 2004).
Isoflavones
Compound R-58 is conceivably a methyl flavonoid (300 u) hexoside with a molecular ion
[M – H]‾ at m/z 461 and fragment ions at m/z 299 [M – H – 162 (hexoside)]‾ and 284 [M – H –
162 (hexoside) – 15 (CH3)]‾•. The most likely candidate is 3′,5,7-trihydroxyisoflavone-
4′-methoxy-3′-O-β-glucopyranoside, which has been found in PS by NMR analysis (Lou et al.,
2001). Compound R-64 is probably biochanin A, where a molecular ion at m/z 283 and a
prominent fragment at m/z 268 [M – H – 15 (CH3)]‾• were observed. Biochanin A is an
O-methylated isoflavone that has long been reported in peanuts (Chukwumah et al., 2007).
Flavanones
The identification of compound R-66 is confirmed by an eriodictyol standard with RT
matching. The compound gave a [M – H]‾ at m/z 287 and RDA diagnostic ions of 1,3A‾ (m/z 151),
1,3B‾ (m/z 135), and 1,4A‾ (m/z 125). After further CO2 loss, the 1,3A‾ ion provided an ion at m/z
107 noted as 1,3A‾ – CO2. Compound R-78 is tentatively identified as eriodictyol methyl ether
such as homoeriodictyol (eriodictyol 3′-methyl ether). Its molecular ion [M – H]‾ was present at

164
m/z 301 and further dissociation ions were observed at m/z 286 [M – H – 15 (CH3)]‾• and 151 as
a 1,3A‾ fragment.
Flavones
Compound R-69 is identified as luteolin giving a [M – H]‾ at m/z 285. Its further
dissociation ions were present at m/z 267 [M – H – 18 (H2O)]‾, 257 [M – H – 28 (CO)]‾, 241 [M
– H – 44 (CO2)]‾, 217 [M – H – 68 (C3O2)]‾, 213 [M – H – 44 (CO2) – 28 (CO)]‾, 199 [M – H –
42 (C2H2O) – 44 (CO2)]‾, and 175 [M – H – 68 (C3O2) – 42 (C2H2O)]‾. The 1,3A‾ RDA
diagnostic ion was observed at m/z of 151. The identification was further confirmed by RT
matching with a luteolin standard. Based on the identification of luteolin, compound R-83 is
conceivably a luteolin methyl ether such as diosmetin (luteolin 4′-methyl ether), with a molecular
ion [M – H]‾ of m/z 299, and fragment ions at m/z 284 [M – H – 15 (CH3)]‾• and 256 [M – H –
15 (CH3) – 28 (CO)]‾•. The 1,3A‾ ion at m/z 151 was present in the MS3 spectra. The
identification is further supported by its UV spectra of 254(sh), 266, and 348 nm (Brad & Chen,
2013).
Compound R-80 is likely a dimethyl flavone, probably cirsiliol, giving a [M – H]‾ at m/z 329.
Its MS2 fragment ions were found at m/z 314 [M – H – 15 (CH3)]‾• and 299 [M – H – 30
(2CH3)]‾. The MS3 dissociation of the product ion at m/z 314 generated secondary product ions
at m/z 299 via loss of CH3•, 285 via loss of CHO•, and 271 via loss of CH3
• and CO. The RDA
diagnostic ions present in the MS3 spectra were at m/z 177 noted as –CH31,2A‾• and 165 noted as
–CH31,3A‾•. A commercial standard and more analyses are warranted for definitive confirmation.
Flavonols and Flavanonols
Compound R-70 is identified as quercetin with a [M – H]‾ of m/z 301 and characteristic

165
fragments of 1,2A‾ (m/z 179), 1,2A‾ – CO (m/z 151), and 1,2A‾ – CO – CO2 (m/z 107). The
identification was further confirmed by a commercial standard (λmax = 256 and 370 nm).
Quercetin glucuronide (compound R-40) produced a [M – H]‾ of m/z 477 and a prominent
fragment at m/z 301 [M – H – 176]‾ by loss of a glucuronide moiety. The MS3 fragmentation of
the product ion at m/z 301 gave rise to RDA diagnostic ions at m/z 179 assigned to a 1,2A‾
fragment and 151 attributed to a 1,2A‾ – CO fragment. Compound R-85 is likely isorhamnetin
with a [M – H]‾ of m/z 315 and a fragment ion at m/z 300 [M – H – 15 (CH3)]‾•. The MS3
fragments of the product ion at m/z 315 were present at m/z 300 via loss of a CH3•, 271 via loss
of a CH3• and a further HCO• group, and 256 via loss of CH3
• and CO2. The 1,3A‾ ion at m/z 151
produced in the MS3 experiment is a diagnostic ion for isorhamnetin in the ESI-MS analysis [36].
Compound R-54 is conceivably isorhamnetin acetyl-glucoside showing a [M – H]‾ at m/z 519
and a prominent fragment at m/z 315 [M – H – 204]‾ by loss of an acetyl-glucoside. The MS3
dissociation ions of the product ion at m/z 315 were present at m/z 300 by loss of a CH3•, 271 by
loss of a CH3• and a further CHO•, 255 by loss of H2O and C2H2O, and 151 attributed to a 1,3A‾
fragment. Isorhamnetin glycosides have been detected in PS according to a NMR study
conducted by Lou’s group (2001).
Compounds R-86 and R-87 are likely dimethyl ethers of 304 u flavonoids giving a
molecular ion [M – H]‾ at m/z 331 and fragment ions at m/z 316 [M – H – 15 (CH3)]‾• and 301
[M – H – 30 (2CH3)]‾. Compound R-86 is probably dihydrorobinetin dimethyl ether based on
subsequent MS3 [331→316] fragment ions at m/z 301 by loss of a CH3 group likely from the
B-ring, 257 by loss of CH3• and CO2, and 177 via loss of the B-ring. The RDA diagnostic ions
observed in the MS3 spectra were present at m/z 164 attributed to a 1,2A‾ fragment, and 136 via
loss of CH3• on the B-ring and RDA cleavage of 1 and 2 bonds (noted as –CH3
1,2B‾•). Therefore,

166
the two methyl groups were undoubtedly distributed on the A-ring and B-ring respectively; that
is likely, 7,3′-dimethyl dihydrorobinetin. The proposed candidate for compound R-87 is
3′,4′-dimethyl dihydroquercetin; the RDA diagnostic ions produced by the MS3[331→316]
experiment were present at m/z 151 assigned to a 1,3A‾ fragment, and 125 attributed to a 1,4A‾
fragment. However, commercial standards and NMR analyses are warranted for a final
determination.
Biflavonoids
In addition to neutral losses of H2O (18 u), CO (28 u), CO2 (44 u), C2H2O (42 u), and C3O2
(68 u), a similar nomenclature of fragmentation was adopted as for flavonoids. ijA‾ and ijB‾ ions
are RDA fragments produced by cleavage of two C–C bonds in the C-ring. The flavonoid, whose
C-ring is attached to the A-ring of the other flavonoid, is denoted as ‘Part I’ and the other
flavonoid is referred to as ‘Part II.’
Compound R-75 is likely a daphnodorin H-type biflavonoid composed of eriodictyol (Part I)
and C-methyl (epi)robinetinidol (Part II) units. It gave a [M – H]‾ at m/z 587 and fragment ions
at m/z 569 [M – H – 18 (H2O)]‾, 461 assigned to a 1,4IB‾ fragment, and 419 attributed to a 1,3IIA‾
fragment. The direct cleavage of the interflavan bond yielded fragments at m/z 285 [eriodictyol
unit (288 – 3H)]‾ and 301 [C-methyl (epi)robinetinidol unit (304 – 3H)]‾. The proposed
candidate of compound R-76 is a 3,8-linked biflavonoid composed of homoeriodictyol (C-3)
(Part I) and eriodictyol (C-8) (Part II) units. This compound revealed a molecular ion at m/z 587
and fragment ions at m/z 569 [M – H – 18 (H2O)]‾, 525 [M – H – 18 (H2O) – 44 (CO2)]‾, 464 [M
– H – 123 (B-ring)]‾, 435 assigned to a 1,3IB‾ fragment, 419 noted as –CH31,3IB‾•, 311 [1,3IB –
123 (B-ring)]‾, and 175 [1,3IB – 1,3IIB – 123 (B-ring)]‾. This identification is further supported by

167
the MS3 experiment. Yet, further analyses are required to confirm the above identifications
unequivocally. Compound R-82 is conceivably another biflavonoid characterized by 3,8-linked
flavonoid monomers. The tentative candidate is a biflavonoid containing naringenin (C3) linked
to luteolin (C8), namely morelloflavone. This compound gave a molecular ion of m/z 555.
Further fragment ions of [M – H]‾ were present at m/z 493 [M – H – 18 (H2O) – 44 (CO2)]‾, 445
[M – H – 68 (C3O2) – 42 (C2H2O)]‾, 433 assigned to a 1,2IIA‾ fragment, 389 probably attributed
to a 1,2IIA‾ – C2H4O fragment, and 283 [1,3IB – 1,2IIB]‾. The prominent ion at m/z 403 was a
1,3IB‾ fragment. The proposed structures and fragmentation schemes of above three biflavonoids
are illustrated in Figure 5.5(A), (B), and (C), respectively.
Quantification
Phenolic compounds were quantified based on peak areas of the UV (free phenolic
compounds) or fluorescence (PACs) signals from the HPLC chromatograms and calibration
curves of commercial standards; the mean phenolic contents are reported in Tables 5.3 and 5.4.
Compared to UV detection, fluorescence detection is more commonly employed for PAC
analysis because of the increased selectivity and decreased interference from other absorbing
species (Hümmer & Schreier, 2008).
All values are expressed in mg respective phenolic compound/100-g dry weight (d.w.) of PS
for the free phenolic compounds, and /g d.w. for the PACs. p-Coumaroyl derivatives, most
notably tartaric acid esters, are extremely dominant in the non-PAC phenolics profile, and
constituted a 73% proportion of the free phenolic compounds. Unfortunately, quantification of
selected compounds was not possible due to co-elution with major p-coumaroyl derivatives. To
illustrate, the UV peak of eriodictoyl was shielded by a band from di-p-coumaroyltartaric acid.

168
Quercetin and its methyl ether (isorhamnetin) are detected in PS primarily as flavonoid
aglycones and account for ~6% of the total non-tannin constituents. As aforementioned, PACs
possess the lion’s share of the phenolics in PS. The PAC content comprises 99.4% of the total
phenolics, as established by both RP-HPLC and HILIC. The total PAC content of 91.8 mg/g
dry-blanched PS, d.w., ± 2.56 analyzed by HILIC is close to the reported value in our previous
study of 84.3 mg/g dry-blanched PS, d.w., ± 1.68, where the 4-(dimethylamino)cinnamaldehyde
(DMAC) colorimetric assay was used for quantification (Ma et al., 2014). Trimers, tetramers,
hexamers, and heptamers are the most abundant PACs and account for ~75.8% of the total
content.
Noteworthy is that the quantification can be easily affected by many factors involved in the
details of the extraction and fractionation protocols selected. A certain percentage of phenolics,
including the PACs, are “unextractable” because these constituents are bound to cell wall
material such as polysaccharides via hydrogen bonding and hydrophobic interactions (Pinelo,
Arnous, & Meyer, 2006). As such, the true phenolics content has been underestimated because of
the bound linkages between phenolics and cell wall material that cannot be disrupted by usual
extraction procedures. Moreover, PACs can be modified by thermal treatment. Yu et al. (2006)
reported a significant influence of the skin removal methods on the PACs content of PS. Dry heat,
like that found in dry roasting of red-skin peanuts, would increase A-type dimers and B-type
trimers compared to directly peeled PS due to monomeric polymerization or the degradation of
trimers and tetramers. Polymerization of monomers and B-type dimers is a plausible mechanism
by which increased B-type trimer levels were detected.
169
5.4 Conclusions
A large number and variety of phenolic compounds were separated and detected in PS by
HPLC-ESI-MSn, including PACs (monomers to nonamers), free phenolic acids and their esters,
stilbenes, flavonoids, and biflavonoids. The novel compounds determined in this study were
identified chiefly by their mass spectra and observed fragmentation pathways. The identification
is still somewhat tentative due to a lack of commercial standards. The quantification was
accomplished by a combination of RP-HPLC and HILIC with UV and fluorescence detection,
respectively. Overall, PS contain significantly more PACs compared to free phenolic compounds.
p-Coumaroyl derivatives account for roughly ¾ of the non-PAC phenolics found in PS. We
believe that the findings reported here will greatly enrich the phenolics database of PS. PS
provide an abundant and inexpensive source of natural antioxidants, especially p-coumaroyl
species and PACs.
Acknowledgements
This research was supported by a grant funded by the Georgia Food Industry Partnership and
is greatly appreciated. Use of the Proteomics and Mass Spectrometry (PAMS) core facility under
the direction of Dr. Dennis Phillips of UGA’s Department of Chemistry is greatly appreciated.
Thanks are also extended to Bill Paulk at Sylvester Blanching, a division of Universal Blanchers,
LLC, for the dry-blanched PS and John T. Powell, President of the Peanut Institute Inc., Albany,
GA.
References
Amarowicz, R.; Troszyńska, A.; Baryłko-Pikielna, N.; Shahidi, F. Polyphenolics extracts from

170
legume seeds: correlations between total antioxidant activity, total phenolics content, tannins
content and astringency. J. Food Lipids. 2004, 11, 278–286.
Appeldoorn, M. M.; Vincken, J. P.; Sanders, M.; Hollman, P. C. H.; Gruppen, H. Combined
normal-phase and reversed-phase liquid chromatography/ESI-MS as a tool to determine the
molecular diversity of A-type procyanidins in peanut skins. J. Agric. Food Chem. 2009, 57,
6007–6013.
Brad, K.; Chen C. Physicochemical properties of diosmetin and lecithin complex. Trop. J. Pharm.
Res. 2013, 12, 453–456.
Bravo, L. Polyphenols: chemistry, dietary sources, metabolism, and nutritional significance. Nutr.
Rev. 1998, 56, 317–333.
Bravo, M. N.; Silva, S.; Coelho, A. V.; Boas, L. V.; Bronze, M. R. Analysis of phenolic
compounds in Muscatel wines produced in Portugal. Anal. Chim. Acta. 2006, 563, 84–92.
Chukwumah, Y. C.; Walker, L. T.; Verghese, M.; Bokanga, M.; Ogutu, S.; Alphonse, K.
Comparison of extraction methods for the quantification of selected phytochemicals in
peanuts (Arachis hypogaea). J. Agric. Food Chem. 2007, 55, 285–290.
Constanza K. E.; White B. L.; Davis J. P.; Sanders, T. H.; Dean, L. L. Value-added processing of
peanut skins: antioxidant capacity, total phenolics, and procyanidin content of spray dried
extracts. J. Agric. Food Chem. 2012, 60, 10776–10783.
Crozier, A.; Jaganath, I. B.; Clifford, M. N. Dietary phenolics: chemistry, bioavailability and
effects on health. Nat. Prod. Rep. 2009, 26, 1001–1043.
Cuyckens, F.; Claeys, M. Mass spectrometry in the structural analysis of flavonoids, J. Mass
Spectrom. 2004, 39, 1–15.

171
Fabre, N.; Rustan, I.; de Hoffmann, E.; Quetin-Leclercq, J. Determination of flavone, flavonol,
and flavanone aglycones by negative ion liquid chromatography electrospray ion trap mass
spectrometry. J. Am. Soc. Mass Spectrom. 2001, 12, 707–715.
Gu, L.; Kelm, M. A.; Hammerstone, J. F.; Zhang, Z.; Beecher, G.; Holden, J.; Haytowitz, D.;
Prior, R. L. Liquid chromatographic/electrospray ionization mass spectrometric studies of
proanthocyanidins in foods. J. Mass Spectrom. 2003, 38, 1272–1280.
Hammerstone, J. F.; Lazarus, S. A.; Mitchell, A. E.; Rucker, R.; Schmitz, H. H. Identification of
procyanidins in cocoa (Theobroma cacao) and chocolate using high-performance liquid
chromatography/mass spectrometry. J. Agric. Food Chem. 1999, 47, 490–496.
Hartley, R. D.; Morrison, W. H. III; Himmelsbach, D. S.; Borneman, W. S. Cross-linking of cell
wall phenolic arabinoxylans in graminaceous plants. Phytochemistry. 1990, 29, 3701–3709.
Herrmann, K. Occurrence and content of hydroxycinnamic and hydroxybenzoic acid compounds
in foods. Crit. Rev. Food Sci. Nutr. 1989, 28, 315–347.
Hollman, P. C. H.; Arts, I. C. W. Flavonols, flavones and flavanols—nature, occurrence and
dietary burden. J. Food. Sci. Agric. 2000, 80, 1081–1093.
Hümmer, W.; Schreier, P. Analysis of proanthocyanidins. Mol. Nutr. Food Res. 2008, 52,
1381–1398.
Jeong, S-M.; Kim, S-Y.; Kim, D-R.; Jo, S-C.; Nam, K. C.; Ahn, D. U.; Lee, S-C. Effect of heat
treatment on the antioxidant activity of extracts from citrus peels. J. Agric. Food Chem. 2004,
52, 3389–3393.
Justesen, U.. Collision-induced fragmentation of deprotonated methoxylated flavonoids, obtained
by electrospray ionization mass spectrometry. J. Mass Spectrom. 2001, 36, 169–178.

172
Karchesy, J. J.; Hemingway, R. W. Condensed tannins: (4β→8; 2β→O→7)-linked procyanidins
in Arachis hypogea L. J. Agric. Food Chem. 1986, 34, 966–970.
Kelm, M. A.; Johnson, J. C.; Robbins, R. J.; Hammerstone, J. F.; Schmitz, H. H.
High-performance liquid chromatography separation and purification of cacao (Theobroma
cacao L.) procyanidins according to degree of polymerization using a diol stationary phase.
J. Agric. Food Chem. 2006, 54, 1571–1576.
King, A.; Young, G. Characteristics and occurrence of phenolic phytochemicals. J. Am. Diet.
Assoc. 1999, 99, 213–218.
Ku, K-L.; Chang, P-S.; Cheng, Y-C.; Lien, C-Y. Production of stilbenoids from the callus of
Arachis hypogaea: a novel source of the anticancer compound piceatannol. J. Agric. Food
Chem. 2005, 53, 3877–3881.
Lea, A. G. H.; Arnold, G. M. The phenolics of ciders: bitterness and astringency. J. Sci. Food
Agric. 1978, 29, 478 –483.
Lou, H.; Yamazaki, Y.; Sasaki, T.; Uchida, M.; Tanaka, H.; Oka, S. A-type proanthocyanidins
from peanut skin. Phytochemistry. 1999, 51, 297–308.
Lou, H.; Yuan, H.; Ma, B.; Ren, D.; Ji, M.; Oka, S. Polyphenols from peanut skins and their free
radical-scavenging effects. Phytochemistry. 2004, 65, 2391–2399.
Lou, H.; Yuan, H.; Yamazaki, Y.; Sasaki, T.; Oka, S. Alkaloids and flavonoids from peanut skins.
Planta Med. 2001, 67, 345–349.
Ma, Y.; Kerr, W. L.; Swanson, R. B.; Hargrove, J. L.; Pegg, R. B. Peanut skins-fortified peanut
butters: effect of processing on the phenolics content, fibre content and antioxidant activity.
Food Chem. 2014, 145, 883–891.

173
Merken, H. M.; Beecher, G. R. Measurement of food flavonoids by high-performance liquid
chromatography. J. Agric. Food Chem. 2000, 48, 577–599.
Monagas, M.; Garrido, I.; Aguilar, R. L.; Cordoves, M. C. G.; Rybarczyk, A.; Amarowicz, R.;
Bartome, B. Comparative flavon-3-ol profile and antioxidant capacity of roasted peanut,
hazelnut, and almond skins. J. Agric. Food Chem. 2009, 57, 10590–10599.
Montero, L.; Herrero, M.; Ibáñez, E.; Cifuentes, A. Profiling of phenolic compounds from
different apple varieties using comprehensive two-dimensional liquid chromatography. J.
Chromatogr. A. 2013, 1313, 275–283.
Mozetič, B.; Tomažič, I.; Škvarč, A.; Trebše, P. Determination of polyphenols in white grape
berries cv. Rebula. Acta Chim. Slov. 2006, 53, 58–64.
Pinelo, M.; Arnous, A.; Meyer, A. S. Upgrading of grape skins: significance of plant cell-wall
structural components and extraction techniques for phenol release. Trends Food Sci. Tech.
2006, 17, 579–590.
Ribas-Agustí, A.; Gratacós-Cubarsí, M.; Sárraga, C.;. García-Regueiro, J-A.; Castellari, M.
Analysis of eleven phenolic compounds including novel p-coumaroyl derivatives in lettuce
(Lactuca sativa L.) by ultra-high-performance liquid chromatography with photodiode array
and mass spectrometry detection. Phytochem. Anal. 2011, 22, 555–563.
Rigaud, J.; Escribano-Bailon, M. T.; Prieur, C.; Souquet, J-M.; Cheynier, V. Normal-phase
high-performance liquid chromatographic separation of procyanidins from cocoa beans and
grape seeds. J. Chromatogr. A. 1993, 654, 255–260.
Robbins, R. J. Phenolic acids in foods: an overview of analytical methodology. J. Agric. Food
Chem. 2003, 51, 2866–2887.
174
Sarnoski, P. J.; Johnson, J. V.; Reed, K. A.; Tanko, J. M.; O’Keefe, S. F. Separation and
characterization of proanthocyanidins in Virginia type peanut skins by LC-MSn. Food Chem.
2012, 131, 927–939.
Stella, L.; De Rosso, M.; Panighel, A.; Vedova, A. D.; Flamini, R.; Traldi, P. Collisionally
induced fragmentation of [M – H]‾ species of resveratrol and piceatannol investigated by
deuterium labelling and accurate mass measurements. Rapid Commun. Mass Spectrom. 2008,
22, 3867–3872.
Teixeira, J.; Gaspar, A.; Garrido, E. M.; Garrido, J.; Borges, F. Hydroxycinnamic acid
antioxidants: an electrochemical overview. BioMed Res. Int. 2013, 2013, Article ID 251754.
Weidner, S.; Amarowicz, R.; Karamać, M.; Dąbrowski, G. Phenolic acids in caryopses of two
cultivars of wheat, rye and triticale that display different resistance to pre-harvest sprouting,
Eur. Food Res. Technol. 1999, 210, 109–113.
Yu, J.; Ahmedna, M.; Goktepe, I. Effects of processing methods and extraction solvents on
concentration and antioxidant activity of peanut skin phenolics. Food Chem. 2005, 90,
199–206.
Yu, J.; Ahmedna, M.; Goktepe, I.; Dai, J. Peanut skin procyanidins: composition and antioxidant
activities as affected by processing. J. Food. Compos. Anal. 2006, 19, 364–371.

175
Table 5.1 Tentative identification of phenolic compounds in dry-blanched peanut skins (PS) by C18 RP-HPLC-ESI-MSn. Cmpd No.
Tentative identificationa UV λmax (nm)b
RTc (min)
[M – H]‾ Product ionsd
R-1 PAC B-type dimer [(E)C→B→(E)C] 234, 280 4.3 577 559, 451, 425, 407, 289, 287 R-2 PAC A-type trimer [(E)C→B→(E)C→A→(E)C] 4.2 863 737, 711, 693, 575, 559, 449, 287 R-3 PAC A-type trimer [(E)C→A→(E)C→B→(E)C] 4.2 863 737, 711, 693, 573, 451, 411, 289 R-4 Protocatechuic acid 260, 294 10.0 153 109 R-5 Caffeoyltartaric acid (Caftaric acid) 244,
302sh, 328
11.7 311 179, 149
R-6 PAC B-type dimer [(E)C→B→(E)C] 12.1 577 559, 451, 425, 407, 289, 287 R-7 (+)-Catechin 234, 280 13.3 289 245, 205, 179 R-8 p-Hydroxybenzoic acid 256 13.5 137 R-9 Caffeic acid 14.5 179 135 R-10 PAC A-type trimer [(E)C→B→(E)C→A→(E)C] 14.9 863 737, 711, 693, 575, 559, 449, 287 R-11 PAC A-type trimer [(E)C→A→(E)C→B→(E)C] 14.9 863 737, 711, 693, 573, 451, 411, 289 R-12 PAC A-type dimer [(E)C→A→(E)C] 15.2 575 557, 449, 423, 407, 289, 285 R-13 PAC B-type dimer [(E)C→B→(E)C] 17.0 577 559, 451, 425, 407, 289, 287 R-14 cis-p-Coumaroyltartaric acid (cis-Coutaric acid) 234, 314 15.5 295 163 MS3[295→163]: 119 R-15 tans-p-Coumaroyltartaric acid (trans-Coutaric acid) 234, 316 16.9 295 163 MS3[295→163]: 119 R-16 (-)-Epicatechin 17.1 289 245, 205, 179 R-17 Feruloyltartaric acid (Fertaric acid) 17.3 325 193 MS3[325→193]: 178, 149, 134 R-18 p-Coumaroylnicotinoyltartaric acid 17.7 400 277 MS3[400→277]: 259, 233, 203,
163 MS4[277→203]: 175, 147, 119 R-19 Feruloyl asparate 18.9 308 193, 178, 149, 132 R-20 p-Coumaroyl-O-pentoside 234, 314 19.3 295 163

176
MS3[295→163]: 119 R-21 PAC B-type dimer [(E)C→B→(E)C] 234, 280 19.9 577 559, 451, 425, 407, 289, 287 R-22 PAC A-type trimer 20.1 859
[(E)C→B→(E)C→A→Luteolin or Kaempferol] R-23 PAC A-type dimer [(E)C→A→(E)C] 234, 280 20.3 575 557, 449, 423, 407, 289, 285 R-24 PAC A-type trimer [(E)C→B→(E)C→A→(E)C] 234, 280 20.9 863 737, 711, 693, 575, 559, 449, 287 R-25 PAC A-type dimer [(E)C→A→(E)C] 234, 280 22.0 575 557, 449, 423, 407, 289, 285 R-26 PAC A-type trimer [(E)C→A→(E)C→B→(E)C] 234, 280 22.5 863 737, 711, 693, 573, 451, 411, 289 R-27 PAC A-type dimer [(E)C→A→(E)C] 234, 280 23.1 575 557, 449, 423, 407, 289, 285 R-28 Prodelphinidin A-type dimer [(E)C→A→(E)GC] 234, 280 23.2 591 573, 465, 423, 305, 285 R-29 PAC A-type trimer [(E)C→B→(E)C→A→(E)C] 234, 280 23.4 863 737, 711, 693, 575, 559, 449, 287 R-30 PAC A-type trimer [(E)C→A→(E)C→B→(E)C] 234, 280 23.6 863 737, 711, 693, 573, 451, 411, 289 R-31 p-Coumaric acid 234, 310 23.9 163 119 R-32 PAC A-type trimer [(E)C→B→(E)C→A→(E)C] 234, 280 23.7 863 737, 711, 693, 575, 559, 449, 287 R-33 PAC A-type trimer [(E)C→A→(E)C→B→(E)C] 234, 280 23.7 863 737, 711, 693, 573, 451, 411, 289 R-34 PAC A-type dimer [(E)C→A→(E)C] 234, 280 24.0 575 557, 449, 423, 407, 289, 285 R-35 PAC A-type trimer [(E)C→A→(E)C→A→(E)C] 234, 280 24.6 861 735, 709, 693, 575, 571, 449, 289,
285 R-36 PAC A-type trimer [(E)C→B→(E)C→A→(E)C] 234, 280 25.6 863 737, 711, 693, 575, 559, 449, 287 R-37 PAC A-type dimer [(E)C→A→(E)C] 234, 280 25.8 575 557, 449, 423, 407, 289, 285 R-38 PAC A-type dimer [(E)C→A→(E)C] 234, 280 26.1 597 445 R-39 o-Coumaroyl-O-pentoside 26.2 295 163 MS3[295→163]: 119 R-40 Quercetin glucuronide 26.2 477 301, 179, 151 MS3[477→301]: 179, 151 R-41 Dicaffeoyltartaric acid (Chicoric acid) 246,
304sh, 328
26.8 473 311, 293, 179, 149, 135 MS3[473→311]: 179, 149, 135
R-42 PAC A-type trimer [(E)C→A→(E)C→A→(E)C] 234, 280 27.5 861 735, 709, 693, 575, 571, 449, 289, 285
R-43 PAC A-type dimer [(E)C→A→(E)C] 234, 280 27.8 575 557, 449, 423, 407, 289, 285

177
R-44 Dihydroxycoumarin 27.6 177 149, 133, 105, 107 R-45 PAC A-type trimer [(E)C→A→(E)C→A→(E)C] 234, 280 28.0 861 735, 709, 693, 575, 571, 449, 289,
285 R-46 PAC A-type dimer [(E)C→A→(E)C] 234, 280 29.0 575 557, 449, 423, 407, 289, 285 R-47 o-Coumaric acid 29.3 163 119 R-48 PAC dimer 30.4 573 555, 529, 447, 421, 323, 289, 283
[(E)C (C4)→Luteolin or Kaempferol (C8) or (C6)] MS3[573→447]: 429, 325, 285,
243 MS4[447→285]: 285, 267, 243,
241, 217, 213, 199, 177 R-49 Formononetin-7-O-p-coumaroyltartaric acid 30.7 545 527, 399, 277, 259, 203, 163 MS3[545→277]: 259, 233, 203,
175, 163, 147 MS4[277→203]: 175, 147, 119 R-50 PAC dimer 31.5 573 555, 529, 511, 447, 421, 323, 289,
283 [(E)C (C4)→Luteolin or Kaempferol (C8) or (C6)] MS3[573→447]: 429, 325, 285,
243, 175 MS4[447→285]: 285, 241, 243,
217, 213, 199, 177 R-51 p-Coumaroyl-p-hydroxybenzoyltartaric acid 31.6 415 277, 251, 203, 163, 137 MS3[415→251]: 207, 137, 131 R-52 p-Coumaroylcaffeoyltartaric acid 234, 318 32.0 457 311, 295, 277, 179, 163 MS3[457→295]: 163 MS4[295→163]: 119 R-53 Propelargonidin A-type trimer
[(E)Afz→A→(E)C→A→(E)C] 32.5 845 719, 693, 575, 555, 449, 433, 289,
269 R-54 Quercetin methyl ether (Isorhamnetin)
acetyl-glucoside 32.9 519 315, 300
MS3[519→315]: 315, 300, 272, 255, 151
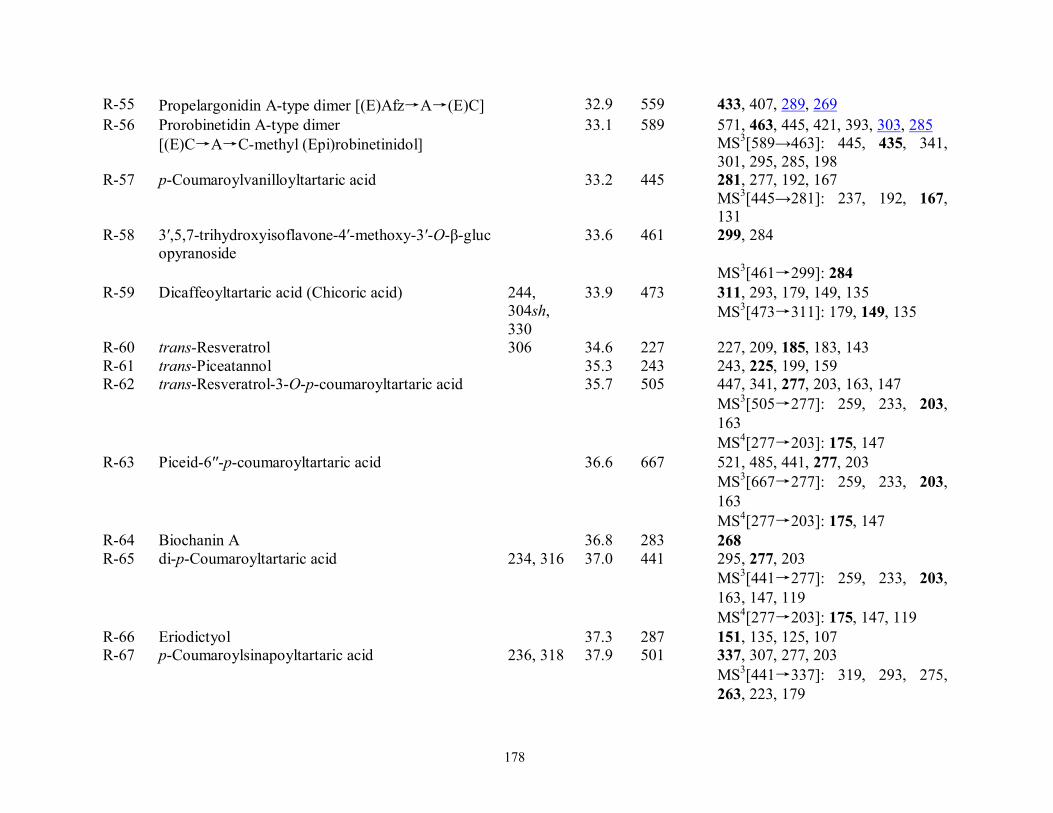
178
R-55 Propelargonidin A-type dimer [(E)Afz→A→(E)C] 32.9 559 433, 407, 289, 269 R-56 Prorobinetidin A-type dimer
[(E)C→A→C-methyl (Epi)robinetinidol] 33.1 589 571, 463, 445, 421, 393, 303, 285
MS3[589→463]: 445, 435, 341, 301, 295, 285, 198
R-57 p-Coumaroylvanilloyltartaric acid 33.2 445 281, 277, 192, 167 MS3[445→281]: 237, 192, 167,
131 R-58 3′,5,7-trihydroxyisoflavone-4′-methoxy-3′-O-β-gluc
opyranoside 33.6 461 299, 284
MS3[461→299]: 284 R-59 Dicaffeoyltartaric acid (Chicoric acid) 244,
304sh, 330
33.9 473 311, 293, 179, 149, 135 MS3[473→311]: 179, 149, 135
R-60 trans-Resveratrol 306 34.6 227 227, 209, 185, 183, 143 R-61 trans-Piceatannol 35.3 243 243, 225, 199, 159 R-62 trans-Resveratrol-3-O-p-coumaroyltartaric acid 35.7 505 447, 341, 277, 203, 163, 147 MS3[505→277]: 259, 233, 203,
163 MS4[277→203]: 175, 147 R-63 Piceid-6′′-p-coumaroyltartaric acid 36.6 667 521, 485, 441, 277, 203 MS3[667→277]: 259, 233, 203,
163 MS4[277→203]: 175, 147 R-64 Biochanin A 36.8 283 268 R-65 di-p-Coumaroyltartaric acid 234, 316 37.0 441 295, 277, 203 MS3[441→277]: 259, 233, 203,
163, 147, 119 MS4[277→203]: 175, 147, 119 R-66 Eriodictyol 37.3 287 151, 135, 125, 107 R-67 p-Coumaroylsinapoyltartaric acid 236, 318 37.9 501 337, 307, 277, 203 MS3[441→337]: 319, 293, 275,
263, 223, 179

179
MS4[337→263]: 248, 235, 223, 207, 192, 179
R-68 p-Coumaroylferuloyltartaric acid 236, 318 38.6 471 307, 277, 203 MS3[471→307]: 289, 263, 233,
193 MS4[307→233]: 218, 205, 177,
149 R-69 Luteolin 38.9 285 285, 267, 257, 241, 217, 213, 199,
175, 151 R-70 Quercetin 256, 370 39.0 301 301, 257, 179, 151, 107 R-71 Feruloylsinapoyltartaric acid 39.2 531 337, 307, 233 MS3[531→307]: 289, 263, 233,
193, 149 MS4[307→233]: 218, 205, 193,
162 R-72 Feruloylcaffeoyltartaric acid 39.3 487 325, 307, 293, 193, 179 MS3[487→325]: 193, 149 R-73 p-Coumaroylferuloyltartaric acid 314 39.9 471 307, 277, 203 MS3[471→307]: 289, 263, 233,
193 MS4[307→233]: 218, 205, 177,
149 R-74 p-Coumaroylsinapoyltartaric acid 318 40.1 501 337, 307, 277, 233, 203 MS3[441→337]: 319, 293, 275,
263, 223, 179 MS4[337→263]: 248, 235, 223,
207, 192, 179 R-75 Biflavonoid
[Eriodictyol→C-methyl (Epi)robinetinidol] 41.4 587 569, 551, 461, 419, 301, 285
MS3[587→461]: 443, 301, 285, 293, 198
R-76 Biflavonoid 41.9 587 569, 525, 464, 435, 419, 375, 311,

180
[Homoeriodictyol (C3)→Eriodictyol (C8)] 313, 175 MS3[587→464]: 355, 311, 301,
194 R-77 p-Coumaroylferuloyltartaric acid 240, 320 44.1 471 307, 277, 233, 203 MS3[471→307]: 289, 263, 233,
193 MS4[307→233]: 218, 205, 177,
149 R-78 Homoeriodictyol 44.3 301 301, 286, 151 R-79 4-O-Caffeoylferulic acid 44.6 355 338, 220, 219, 193, 135 R-80 Cirsiliol 44.7 329 314, 299 MS3[329→314]: 299, 285, 271,
177, 165 R-81 Ferulic acid derivative 45.1 403 329, 311, 211 MS3[403→311]: 293, 249, 211,
193, 171, 149 R-82 Morelloflavone [Naringenin (C3)→Luteolin (C8)] 45.7 555 493, 445, 433, 403, 389, 283 R-83 Luteolin methyl ether (Diosmetin) 254sh,
266, 348 46.8 299 299, 284
MS3 [299→284]: 284, 256, 216, 151
R-84 p-Coumaroyltartaric acid derivative 47.5 649 503, 485, 277, 203 MS3[649→277]: 259, 233, 203,
163 MS4[277→203]: 175, 147 R-85 Quercetin methyl ether (Isorhamnetin) 256, 372 47.6 315 315, 300 MS3 [315→300]: 300, 271, 256,
151 R-86 Dihydrorobinetin 7,3′-dimethyl ether 47.9 331 316, 301, 211, 136, 124 MS3 [331→316]: 301, 257, 177,
164, 136 R-87 Dihydroquercetin 3′,4′-dimethyl ether 48.1 331 316, 301, 125 MS3 [331→316]: 301, 257, 151,

181
125 R-88 Feruloyltartaric acid derivative 48.7 681 351, 329, 307, 251, 233, 193 MS3 [681→329]: 311, 293, 229,
211, 171, 125 a The A represents an A-type bond with both (C4→C8) and (C2→O→C7) linkages or (C4→C6) and (C2→O→C7) linkages, B represents a B-type bond which can be (C4→C8) or (C4→C6) linkage; (E)C represents (epi)catechin, (E)GC represents (epi)gallocatechin and (E)Afz represents (epi)afzelechin.
b sh, shoulder in the spectrum. c Retention time (RT) in total ion chromatograms.
d The most abundant ions observed in mass spectra are shown in bold; quinone methide (QM) fission diagnostic ions are underlined.

182
Table 5.2 Tentative identification of proanthocyanidins (PACs) in dry-blanched peanut skins (PS) by HILIC-ESI-MS/MSa. Cmpd No.
Oligomeric PACsb RTc (min)
Ions, m/z Product ionsd [M – H]ˉ [M – 2H]2ˉ/2
N-1 PAC dimer 5.5 573 555, 529, 447, 421, 405, 289, 283 [(E)C (C4)→Luteolin or Kaempferol (C8) or (C6)]
N-2 PAC A-type dimer [(E)C→A→(E)C] 6.4– 6.8
575 449, 423, 407, 289, 285
N-3 PAC B-type dimer [(E)C→B→(E)C] 7.6 577 451, 425, 407, 289, 287 N-4 PAC A-type trimer [(E)C→A→(E)C→A→(E)C] 8.1 861 735, 709, 693, 575, 571, 449,
289, 285 N-5 PAC A-type trimer [(E)C→A→(E)C→B→(E)C] 8.5 863 737, 711, 573, 451, 411, 289 N-6 PAC A-type trimer [(E)C→B→(E)C→A→(E)C] 8.8 863 737, 711, 693, 575, 559, 449,
287 N-7 PAC A-type trimer [(E)C→B→(E)C→A→(E)C] 9.0 863 737, 711, 693, 575, 559, 449,
287 N-8 PAC A-type trimer [(E)C→B→(E)C→A→(E)C] 9.2 863 737, 711, 693, 575, 559, 449,
287 N-9 PAC A-type trimer [(E)C→A→(E)C→B→(E)C] 9.3 863 737, 711, 573, 451, 411, 289 N-10 PAC B-type trimer [(E)C→B→(E)C→B→(E)C] 10.1 865
N-11 PAC A-type tetramer 10.4 1149 997, 979, 861, 845, 449 [(E)C→B→(E)C→A→(E)C→A→(E)C]
N-12 PAC A-type tetramer 10.5 1149 997, 979, 859 [(E)C→A→(E)C→A→(E)C→B→(E)C]
N-13 PAC A-type tetramer 10.4–10.6
1149 997, 979, 573, 575 [(E)C→A→(E)C→B→(E)C→A→(E)C]
N-14 PAC A-type tetramer 11.2 1149 997, 979, 861, 845 [(E)C→B→(E)C→A→(E)C→A→(E)C]
N-15 PAC A-type tetramer 11.2 1149 997, 979, 573, 575 [(E)C→A→(E)C→B→(E)C→A→(E)C]
N-16 PAC A-type tetramer 11.3 1149 997, 979, 859 [(E)C→A→(E)C→A→(E)C→B→(E)C]
N-17 PAC A-type tetramer 11.3 1151 863, 861, 573, 411
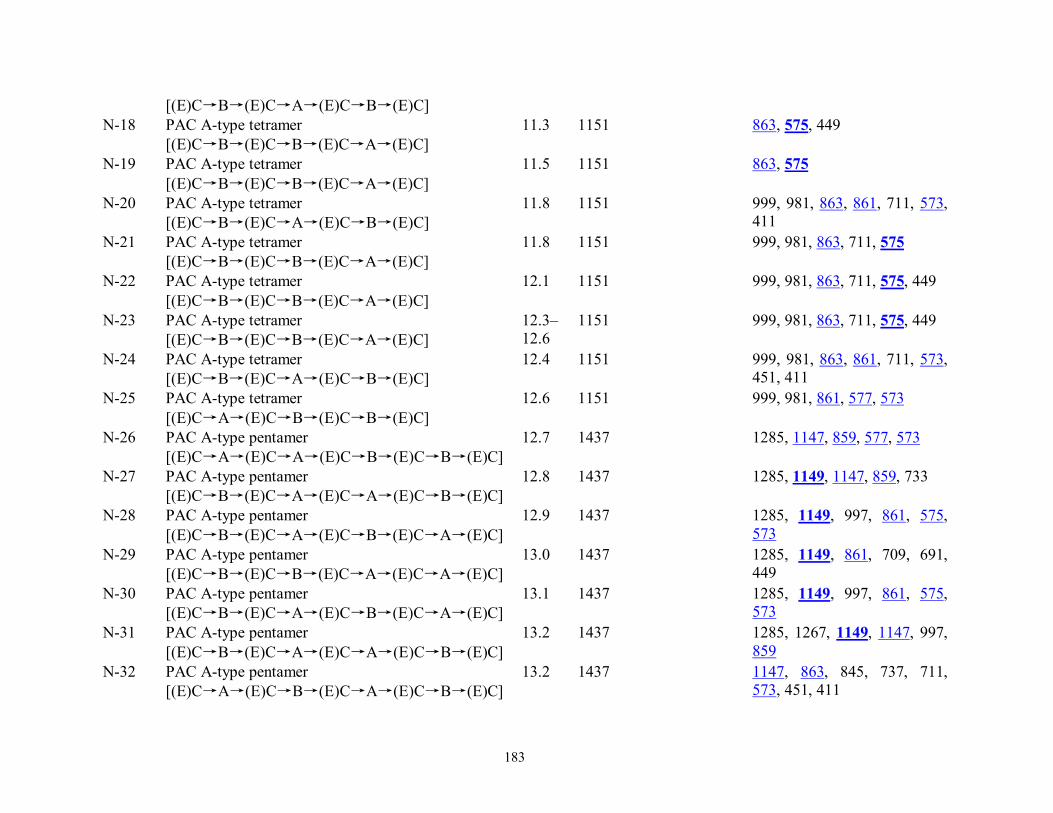
183
[(E)C→B→(E)C→A→(E)C→B→(E)C] N-18 PAC A-type tetramer 11.3 1151 863, 575, 449
[(E)C→B→(E)C→B→(E)C→A→(E)C] N-19 PAC A-type tetramer 11.5 1151 863, 575
[(E)C→B→(E)C→B→(E)C→A→(E)C] N-20 PAC A-type tetramer 11.8 1151 999, 981, 863, 861, 711, 573,
411 [(E)C→B→(E)C→A→(E)C→B→(E)C] N-21 PAC A-type tetramer 11.8 1151 999, 981, 863, 711, 575
[(E)C→B→(E)C→B→(E)C→A→(E)C] N-22 PAC A-type tetramer 12.1 1151 999, 981, 863, 711, 575, 449
[(E)C→B→(E)C→B→(E)C→A→(E)C] N-23 PAC A-type tetramer 12.3–
12.6 1151 999, 981, 863, 711, 575, 449
[(E)C→B→(E)C→B→(E)C→A→(E)C] N-24 PAC A-type tetramer 12.4 1151 999, 981, 863, 861, 711, 573,
451, 411 [(E)C→B→(E)C→A→(E)C→B→(E)C] N-25 PAC A-type tetramer 12.6 1151 999, 981, 861, 577, 573
[(E)C→A→(E)C→B→(E)C→B→(E)C] N-26 PAC A-type pentamer 12.7 1437 1285, 1147, 859, 577, 573 [(E)C→A→(E)C→A→(E)C→B→(E)C→B→(E)C] N-27 PAC A-type pentamer 12.8 1437 1285, 1149, 1147, 859, 733 [(E)C→B→(E)C→A→(E)C→A→(E)C→B→(E)C] N-28 PAC A-type pentamer 12.9 1437 1285, 1149, 997, 861, 575,
573 [(E)C→B→(E)C→A→(E)C→B→(E)C→A→(E)C] N-29 PAC A-type pentamer 13.0 1437 1285, 1149, 861, 709, 691,
449 [(E)C→B→(E)C→B→(E)C→A→(E)C→A→(E)C] N-30 PAC A-type pentamer 13.1 1437 1285, 1149, 997, 861, 575,
573 [(E)C→B→(E)C→A→(E)C→B→(E)C→A→(E)C] N-31 PAC A-type pentamer 13.2 1437 1285, 1267, 1149, 1147, 997,
859 [(E)C→B→(E)C→A→(E)C→A→(E)C→B→(E)C] N-32 PAC A-type pentamer 13.2 1437 1147, 863, 845, 737, 711,
573, 451, 411 [(E)C→A→(E)C→B→(E)C→A→(E)C→B→(E)C]

184
N-33 PAC A-type pentamer 13.3 1437 1285, 1267, 863, 861, 845, 575, 573, 449 [(E)C→A→(E)C→B→(E)C→B→(E)C→A→(E)C]
N-34 PAC A-type pentamer 13.3 1437 1285, 1267, 1149, 859 [(E)C→B→(E)C→A→(E)C→A→(E)C→B→(E)C] N-35 PAC A-type pentamer 13.4–
13.6 1437 1285, 1149, 861, 735, 709,
691, 575, 573, 449 [(E)C→B→(E)C→A→(E)C→B→(E)C→A→(E)C] N-36 PAC A-type pentamer 13.8 1437 1285, 1149, 861, 735, 709,
575 [(E)C→B→(E)C→A→(E)C→B→(E)C→A→(E)C] N-37 PAC A-type pentamer 13.9 1437 1285, 1149, 861, 575, 573 [(E)C→B→(E)C→A→(E)C→B→(E)C→A→(E)C] N-38 PAC A-type pentamer 14.2 1437 1285, 1149, 861, 575, 573 [(E)C→B→(E)C→A→(E)C→B→(E)C→A→(E)C] N-39 PAC A-type pentamer 14.3 1437 1285, 1149, 861, 709, 575,
449 [(E)C→B→(E)C→A→(E)C→B→(E)C→A→(E)C] N-40 PAC A-type pentamer 14.4 1437 1285, 1267, 1147, 863, 573 [(E)C→A→(E)C→B→(E)C→A→(E)C→B→(E)C] N-41 PAC A-type pentamer 14.5 1439 1313, 1151, 1149, 1025, 997,
863, 575, 573 [(E)C→B→(E)C→B→(E)C→A→(E)C→B→(E)C] N-42 PAC A-type pentamer 15.0 1439 1313, 1287, 1151, 1149,
1025, 861, 577, 575, 573 [(E)C→B→(E)C→A→(E)C→B→(E)C→B→(E)C] N-43 PAC A-type pentamer 15.1 1439 1313, 1287, 1269, 865, 861,
577, 573 [(E)C→A→(E)C→B→(E)C→B→(E)C→B→(E)C] N-44 PAC A-type pentamer 15.1 1439 1313, 1287, 1269, 1151, 863,
711, 575, 449 [(E)C→B→(E)C→B→(E)C→B→(E)C→A→(E)C] N-45 PAC A-type pentamer 15.2 1439 1313, 1287, 1269, 1151,
1149, 863, 575, 411 [(E)C→B→(E)C→B→(E)C→A→(E)C→B→(E)C] N-46 PAC A-type pentamer 15.2–
15.3 1439 1313, 1287, 1151, 1149, 861,
577, 575, 573 [(E)C→B→(E)C→A→(E)C→B→(E)C→B→(E)C] N-47 PAC A-type pentamer 15.4 1439 1313, 1287, 1151, 1149, 863,
575, 573 [(E)C→B→(E)C→B→(E)C→A→(E)C→B→(E)C] N-48 PAC B-type pentamer 15.6 1441
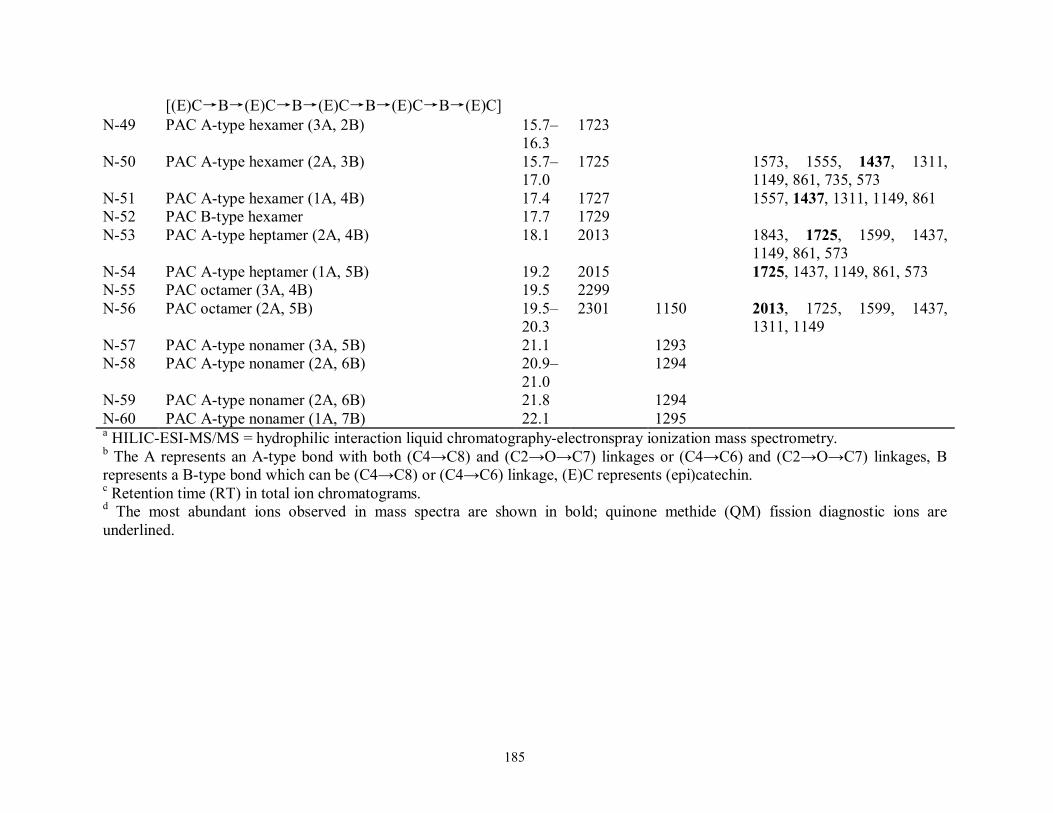
185
[(E)C→B→(E)C→B→(E)C→B→(E)C→B→(E)C] N-49 PAC A-type hexamer (3A, 2B) 15.7–
16.3 1723
N-50 PAC A-type hexamer (2A, 3B) 15.7–17.0
1725 1573, 1555, 1437, 1311, 1149, 861, 735, 573
N-51 PAC A-type hexamer (1A, 4B) 17.4 1727 1557, 1437, 1311, 1149, 861 N-52 PAC B-type hexamer 17.7 1729 N-53 PAC A-type heptamer (2A, 4B) 18.1 2013 1843, 1725, 1599, 1437,
1149, 861, 573 N-54 PAC A-type heptamer (1A, 5B) 19.2 2015 1725, 1437, 1149, 861, 573 N-55 PAC octamer (3A, 4B) 19.5 2299 N-56 PAC octamer (2A, 5B) 19.5–
20.3 2301 1150 2013, 1725, 1599, 1437,
1311, 1149 N-57 PAC A-type nonamer (3A, 5B) 21.1 1293 N-58 PAC A-type nonamer (2A, 6B) 20.9–
21.0 1294
N-59 PAC A-type nonamer (2A, 6B) 21.8 1294 N-60 PAC A-type nonamer (1A, 7B) 22.1 1295 a HILIC-ESI-MS/MS = hydrophilic interaction liquid chromatography-electronspray ionization mass spectrometry. b The A represents an A-type bond with both (C4→C8) and (C2→O→C7) linkages or (C4→C6) and (C2→O→C7) linkages, B represents a B-type bond which can be (C4→C8) or (C4→C6) linkage, (E)C represents (epi)catechin. c Retention time (RT) in total ion chromatograms. d The most abundant ions observed in mass spectra are shown in bold; quinone methide (QM) fission diagnostic ions are underlined.

186
Table 5.3 Content of selected phenolics quantified in dry-blanched peanut skins (PS) by C18 RP-HPLC.
Free phenolic compoundsa Quantification λ (nm) Contentb (mg/100 g)
Protocatechuic acid 260 3.43 ± 0.04
p-Hydroxybenzoic acid 255 1.03 ± 0.06
Caftaric acid 320 1.51 ± 0.12 cis-Coutaric acid 320 10.1 ± 0.52
trans-Coutaric acid 320 2.11 ± 0.08 p-Coumaroyl-O-pentoside 320 5.52 ± 0.23
p-Coumaric acid 320 0.53 ± 0.06 Chicoric acid 320 3.44 ± 0.12
p-Coumaroylcaffeoyltartaric acid 320 2.26 ± 0.13 Chicoric acid 320 3.12 ± 0.13
di-p-Coumaroyltartaric acid 320 13.8 ± 1.53 p-Coumaroylsinapoyltartaric acid 320 6.32 ± 0.94
p-Coumaroylferuloyltartaric acid 320 5.87 ± 0.71 trans-Resveratrol 320 0.36 ± 0.05
Quercetin 360 2.11 ± 0.27
Isorhamnetin 360 1.51 ± 0.02
Diosmetin 360 0.40 ± 0.01 a Caftaric acid and chicoric acids are quantified as caffeic acid equivalents; coutaric acids and other p-coumaroyl derivatives are quantified using p-coumaric acid equivalents; isorhamnetin and diosmetin are quantified using corresponding flavonoid aglycone equivalents. b Values are means of triplicate analyses ± standard deviation. Findings are reported as mg respective phenolic/100-g dry weight (d.w.) of dry-blanched PS.
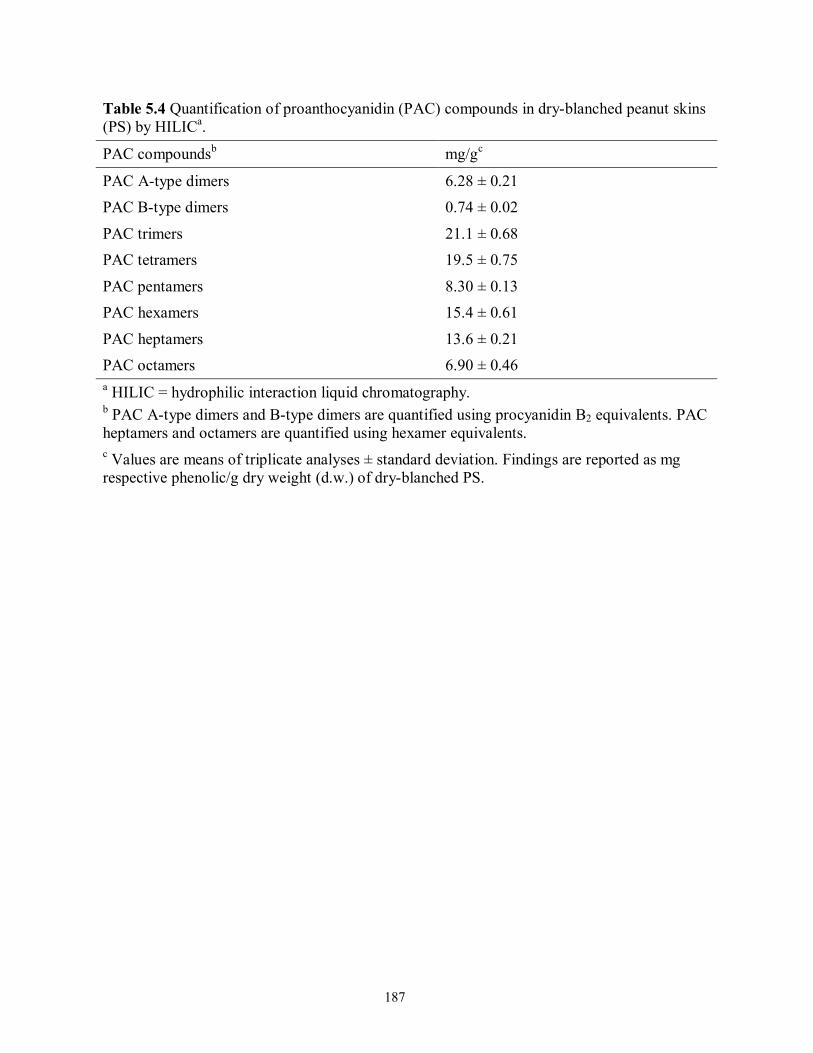
187
Table 5.4 Quantification of proanthocyanidin (PAC) compounds in dry-blanched peanut skins (PS) by HILICa.
PAC compoundsb mg/gc
PAC A-type dimers 6.28 ± 0.21
PAC B-type dimers 0.74 ± 0.02
PAC trimers 21.1 ± 0.68 PAC tetramers 19.5 ± 0.75
PAC pentamers 8.30 ± 0.13 PAC hexamers 15.4 ± 0.61
PAC heptamers 13.6 ± 0.21 PAC octamers 6.90 ± 0.46 a HILIC = hydrophilic interaction liquid chromatography. b PAC A-type dimers and B-type dimers are quantified using procyanidin B2 equivalents. PAC heptamers and octamers are quantified using hexamer equivalents. c Values are means of triplicate analyses ± standard deviation. Findings are reported as mg respective phenolic/g dry weight (d.w.) of dry-blanched PS.
188
Figures Captions
Figure 5.1 Structures of monomeric phenolic aglycones found in dry-blanched peanut skins
(PS).
Figure 5.2 Linkages found in proanthocyanidins (PACs) and quinone methide (QM) cleavage
of dimers to tetramers to identify the connection sequence. E represents the
extension units and T the terminal unit of the PAC oligomers. A-type bond with
both (C4→C8) and (C2→O→C7) linkages or (C4→C6) and (C2→O→C7)
linkages, B-type bond which can be (C4→C8) or (C4→C6) linkage.
Figure 5.3 Tentative structures and fragmentation schemes (A is MS2 and B is MS3) of
p-Coumaroyltartaric acid ester-linked nictotinoyl (R-18, m/z 400); Formononentin
(R-49, m/z 545); trans-Resveratrol (R-62, m/z 505); Piceid (R-63, m/z 667); and a
second p-Coumaroyl moiety (R-65, m/z 441). See Table 5.1 for formal
designations.
Figure 5.4 Tentative structures and fragmentation schemes of (A) PAC dimer [(E)C
(C4)→Luteolin or Kaempferol (C8) or (C6)] (R-48 and R-50, m/z 573); (B)
Prodelphinidin A-type dimer [(E)C→A→(E)GC] (R-28, m/z 591); and (C)
Prorobinetidin A-type dimer [(E)C→A→C-methyl (Epi)robinetinidol] (R-56, m/z
589). See Table 5.1 for formal designations.
Figure 5.5 Tentative structures and fragmentation schemes of (A) Biflavonoid
[Eriodictyol→C-methyl Robinetinidol] (R-75, m/z 587); (B) Biflavonoid
[Homoeriodictyol (C3)→Eriodictyol (C8)] (R-76, m/z 587); and (C)
Morelloflavone [Naringenin (C3)→Luteolin (C8)] (R-82, m/z 555). See Table 5.1
for formal designations.

189
Figure 5.1
Hydoxybenzoic acids R
p-Hydroxybenzoic acid H
Protocatechuic acid OH
Vanillic acid OCH3
Hydroxycinnamic acids R1 R2 R3
p-Coumaric acid H H H
o-Coumaric acid H H OH
Caffeic acid OH H H
Ferulic acid OCH3 H H
Sinapic acid OCH3 OCH3 H
Dihydroxycoumarin
Aesculetin Stilbenes R
trans-Resveratrol H
trans-Piceatannol OH

190
\
Figure 5.1 Continued
Isoflavones R1 R2 R3
Biochanin A OH OCH3 H
Formononetin H OCH3 H
3′,5,7-Trihydroxy-4′-methoxyisoflavone OH OCH3 OH
Flavanonols R1 R2 R3 R4 R5 R6
Dihydrorobinetin-7,3′-dimethyl ether OCH3 H OH OCH3 OH OH
Dihydroquercetin-3′,4′-dimethyl ether OH OH OH OCH3 OCH3 H
Flavanones
Naringenin OH OH H H OH H
Eriodictyol OH OH H OH OH H
Homoeriodictyol OH OH H OCH3 OH H

191
Figure 5.1 Continued
Flavones R1 R2 R3 R4 R5 R6
Luteolin OH H OH H OH OH
Diosmetin OH H OH H OH OCH3
Cirsiliol OCH3 OCH3 OH H OH OH
Flavonol
Quercetin OH H OH OH OH OH
Isorhamnetin OH H OH OH OCH3 OH
Kaempferol OH H OH OH H OH
Flavan-3-ols R1 R2 R3 R4 R5 R6
Catechin H OH OH H OH H
Epicatechin H OH H OH OH H
Afzelechin H OH OH H H H
Epiafzelechin H OH H OH H H
Gallocatechin H OH OH H OH OH
Epigallocatechin H OH H OH OH OH
C-methyl Robinetinidol CH3 H OH H OH OH
C-methyl Epirobinetinidol CH3 H H OH OH OH

192
E
T
Figure 5.2
OH
OH
HO OOH
OH
OHO
OH
HO
HO OH
4
6

193
E
T
Figure 5.2 Continued
OH
HO OOH
OH
OOH
O
OH
HO
OH
OH
6
4
2
7

194
E T E T
E T E E T E T E E
287 289 285 289
287 575 573 289 285 575
571 289
E E T E E E T E E E T E
E E T E E E T E E E T E
287 863
575 575
287 863
861 289 861 289
573 577
573 575 861 287 859 289
Figure 5.2 Continued

195
Mass-to-charge ratio (m/z)
Ion
sign
al in
tens
ity
0
5000
10000
15000
20000203
233
259163
B (MS3)
Mass-to-charge ratio (m/z)
Ion
sign
al in
tens
ity
0
100000
200000
300000
400000
500000
295
277
203
Compound R No. 18 Nictotinoyl 49 Formononentin 62 trans-Resveratrol 63 Piceid 65 p-Coumaroyl
A (MS2)
Figure 5.3

196
Ion
sign
al in
tens
ity
0
2000
4000
6000
8000
10000
12000
447
283
289421
529
555
HRF
RDA323
[M - H - H2O]−
[M - H - CO2]−
A
Mass-to-charge ratio (m/z)
Figure 5.4 (A)
OH
OH
HO OOH
OH
OOH
HO OOH
OH
447
421
289
283
HRF
RDA
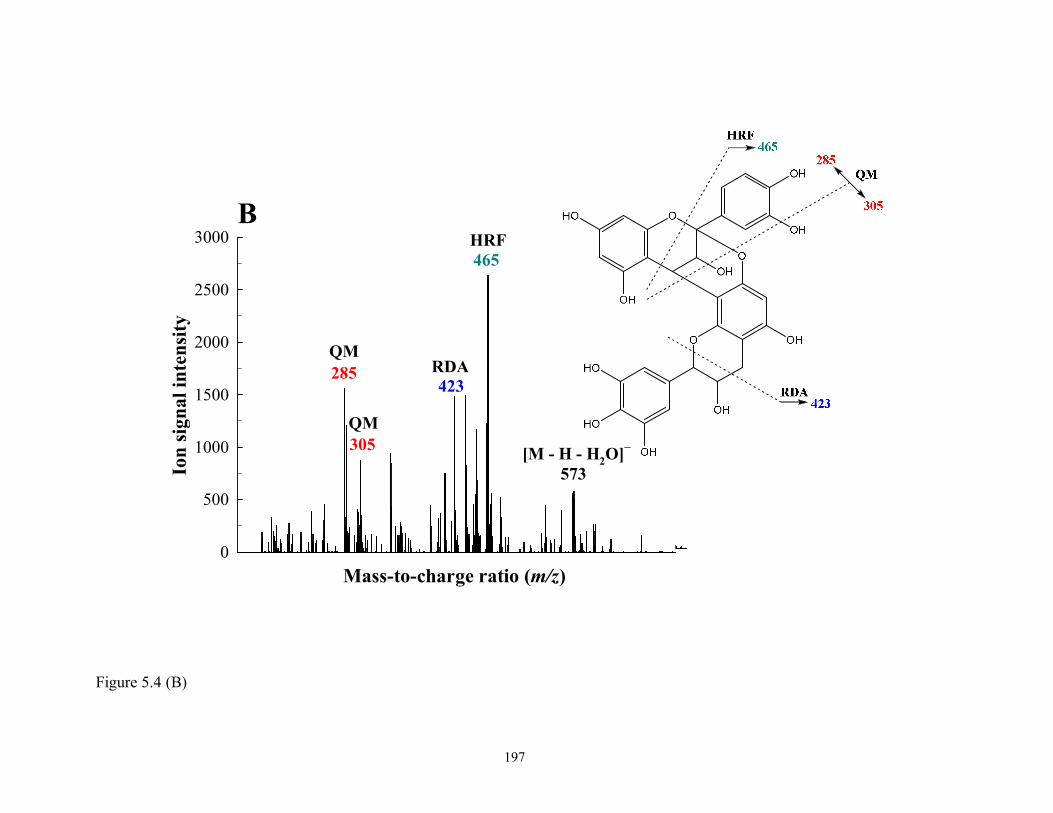
197
Mass-to-charge ratio (m/z)
Ion
sign
al in
tens
ity
0
10000
20000
30000
40000
50000
60000
463
285
421
303 571
HRF
RDA
QM
QM [M - H - H2O]−
C
Mass-to-charge ratio (m/z)
Ion
sign
al in
tens
ity
0
500
1000
1500
2000
2500
3000465
573
423285
305
HRF
RDAQM
QM
[M - H - H2O]−
B
Figure 5.4 (B)

198
Mass-to-charge ratio (m/z)
Ion
sign
al in
tens
ity
0
10000
20000
30000
40000
50000
60000
463
285
421
303 571
HRF
RDA
QM
QM [M - H - H2O]−
C
Figure 5.4 (C)

199
Mass-to-charge ratio (m/z)
Ion
sign
al in
tens
ity
0
2000
4000
6000
8000
10000
12000
14000
16000
18000
569
461
419285
301551
[1,4IB]−
[1,3IIA]−
A
Figure 5.5 (A)

200
Mass-to-charge ratio (m/z)
Ion
sign
al in
tens
ity
0
500
1000
1500
2000
2500
3000569
525
464
419
[M - H - B-ring ]−
175
[-CH31,3IB]−
375311
B
[1,3IB - B-ring]−
Figure 5.5 (B)
O
HO O
OH
464
O
O
HO
OH
OH
I
II
OCH3
OH
OH
[1,3IB]-
[1,3IIB]-
A
B
A
B
435-CH3
419

201
Mass-to-charge ratio (m/z)
Ion
sign
al in
tens
ity
0
2000
4000
6000
8000
10000403
433
283
493445
[1,3IB]−
[1,2IIA]−
389
[1,3IB -1,2IIB]−
C
Figure 5.5 (C)
202
CHAPTER 6
SEPARATION AND CHARACTERIZATION OF ESTER AND
GLYCOSIDE-BOUND PHENOLIC COMPOUNDS FROM DRY-BLANCHED
PEANUT SKINS BY LIQUID CHROMATOGRAPHY-ELECTROSPRAY
IONIZATION MASS SPECTROMETRY
Ma, Y.; Kosińska-Cagnazzo, A.; Kerr, W. L.; Amarowicz, R.; Swanson, R. B.; Pegg, R. B. To be submitted to the Journal of Agricultural and Food Chemistry, 2014.

203
Abstract
A large variety of phenolic compounds, including phenolic acids (hydroxybenzoic acids, ethyl
protocatechuate, hydroxycinnamic acids, as well as phenylacetic acid and phenyllactic acid),
stilbenes (trans-piceatannol and trans-3,3′,5,5′-tetrahydroxy-4′-methoxystilbene), flavan-3-ols
(e.g., (–)-epicatechin, (+)-catechin, (–)-epiafzelechin, and their polymers {the proanthocyanidins,
PACs}), other flavonoids (e.g., isoflavones, flavanols, and flavones) and biflavonoids, were
identified in dry-blanched peanut skins (PS). Reversed-phase high-performance liquid
chromatography (RP-HPLC) coupled with electrospray ionization tandem mass spectrometry
(ESI-MSn) was applied to separate and identify the phenolic constituents. Tentative identification
of the separated phenolics was based on molecular ions and MSn fragmentation patterns acquired
by ESI-MS in the negative-ion mode. Identification of free phenolic acids, stilbenes, and
flavonoids was also achieved by commercial standards and by published literature data.
Quantification was performed based on peak areas of the UV signals from the HPLC
chromatograms and calibration curves of the commercial standards. The flavonoids of PS exist
mostly in glycoside-bound forms, but the agylcone can be easily released upon acid hydrolysis.
PS contain significantly more PACs compared to free phenolic compounds. PAC monomers to
tetramers constituted 92.0% of ester bound phenolic compounds. The PAC monomer
{(+)-catechin} and dimers are primary phenolics released from glycosides and account for 31.7%
and 59.1%, respectively, of total glycoside-bound phenolic compounds.

204
6.1 Introduction
Phenolic compounds are secondary metabolites ubiquitously found in plants (Bravo, 1998).
Amongst the plethora found in nature, phenolics in foodstuffs comprise primarily phenolic acids,
flavonoids, and tannins (King & Young, 1999). Free phenolic acids, such as p-hydroxybenzoic
acid and vanillic acid, can be present as such, but more common is their occurrence as analog
methyl and ethyl esters as well as glycosides, which can also exist in the free and bound forms
(Bravo, 1998). Hydroxycinnamic acids are typically bound to cell wall polysaccharides via
covalent linkages (Bravo, 1998). To illustrate, in graminaceous plants p-coumaric acid and
ferulic acid are bound to cell walls through an ester-linkage between their carboxylic groups and
arabinoxylans (Hartley, Morrison, Himmelsbach, & Borneman, 1990). Flavonoids present in
living plants are generally in bound forms with one or more sugar residues attached (Bravo, 1998;
Hollman & Arts, 2000; Crozier, Jaganath, & Clifford, 2009). As for flavan-3-ols (i.e.,
(–)-epicatechin, (+)-catechin, and gallocatechin), they exist chiefly as free monomers (Bravo,
1998). The diastereoisomeric pair of (+)-catechin and (−)-epicatechin are widespread in nature,
whereas relatively rare are the (−)-catechin and (+)-epicatechin forms (Crozier, Jaganath, &
Clifford, 2009).
Identification of esterified phenolic derivatives is extremely difficult due to the nearly
uniform UV spectra with their unesterifed counterpart. The chemical characteristics of the new
chromophore generated via esterification are not markedly different from its precursor.
Sometimes there are, however, minor bathochromic shifts in the chromophoric structure such as
that present in the C–O bond of caffeoyl tartrate (Robbins, 2003). One strategy to simplify and
specify the analysis is to employ acid and/or base hydrolysis to convert the ester derivatives to
their carboxylic acid analogs. It has been reported that alkaline hydrolysis yields phenolic

205
compounds liberated from soluble esters, if present, while phenolic compounds bound to
glycosides are released by a subsequent acid hydrolysis (Weidner, Amarowicz, Karamać, &
Dabrowski, 1999; Amarowicz & Weidner, 2001). The liberated aglycones are easily identified by
HPLC with diode-array detection (DAD). Likewise, the determination of individual flavonoid
glycosides present in foods is formidable, due to the numerous varieties that exist (Hertog, Peter,
Hollman, & Venema, 1992). Therefore, flavonoids are usually analyzed after hydrolysis of their
glycosides; the resulting aglycones are further confirmed by UV DAD detection or mass
spectrometry (Hertog, Peter, Hollman, & Venema, 1992; Hollman & Arts, 2000; Merken &
Beecher, 2000). The HPLC analysis of flavonoids in peanuts and other legume seeds after acid
hydrolysis was described by Wang’s group (2008).
Proanthocyanidins (PACs) are oligomers and polymers of flavan-3-ols, which are primarily
linked by C4→C8 bonds or less common C4→C6 bonds (B-type), whereas A-type dimers
contain an additional (C2→O→C7) linkage. Despite some free phenolic acids, procyanidins
comprised ~17% by weight in peanut skins (PS) (Karchesy & Hemingway, 1986) and are
predominant in the phenolic composition (Yu, Ahmedna, Goktepe, & Dai, 2006). Although
A-type linkages are much more abundant, both A- and B-type PACs occur in PS. The degree of
polymerization (DP) identified in PS was up to 12 units by A-type linkages, whereas B-type
structures were detected with a DP up to only 6 (Monagas et al., 2009). A certain percentage of
PACs are ‘unextractable’ because these PACs are bound to cell wall material such as
polysaccharides via covalent and hydrogen bonding as well as hydrophobic interactions (Pinelo,
Arnous, & Meyer, 2006; White, Howard, & Prior, 2010). Consequently, the PACs content in any
analytical determination is underestimated because of the bound PAC–cell wall material, which
is not disturbed by normal extraction protocols. In order to liberate these bound derivatives, acid

206
or base hydrolysis is required prior to conventional extraction (Arranz, Saura-Calixto, Shaha, &
Kroon, 2009; White, Howard, & Prior, 2010). Severe alkaline conditions can, nonetheless, lead
to cleavage of C–C interflavan bonds between the monomeric flavan-3-ol constituents. The
A-ring of flavan-3-ols can also be broken by prolonged alkaline treatment (White, Howard, &
Prior, 2010).
As previously reported, the phenolic compounds of PS include simple phenolic acids (e.g.,
caffeic, ferulic, and coumaric acids), flavan-3-ols (e.g., (epi)catechin, epigallocatechin, catechin
gallate, and epicatechin gallate), stilbenes (e.g., trans-resveratrol), and polymerized PACs (Yu,
Ahmedna, & Goktepe, 2005; Yu, Ahmedna, Goktepe, & Dai, 2006; Ma et al., 2014), but limited
information is available concerning the hydrolyzable phenolics and PACs of PS. Therefore, the
objectives of this study were to liberate soluble-ester and glycoside-bound phenolic compounds
from dry-blanched PS extracts using alkaline and acid hydrolyses and then to characterize them
by RP-HPLC-ESI-MSn.
6.2 Materials and Methods
Materials
Dry-blanched PS were a gift from Universal Blanchers, LLC (Sylvester, GA). All solvents
and reagents were of analytical (ACS) grade, unless otherwise specified. Methanol, ethanol
(95%), and hexanes were purchased from VWR International (Suwanee, GA). Procyanidin B2
was obtained from Indofine Chemical Company, Inc. (Hillsborough, NJ). (–)-Epiafzelechin was
acquired from BOC Science (Shirley, NJ), while all other phenolic standards were bought from
either VWR International (Suwanee, GA) or the Sigma-Aldrich Chemical Co. (St. Louis, MO).

207
Phenolic Extraction
Extraction of phenolics from PS was carried out according to Amarowicz et al. (2004) with
slight modification. The extraction was performed in triplicate. In brief, samples were first
placed in Whatman cellulose extraction thimbles (43 mm i.d. × 123 mm e.l., VWR International,
Suwanee, GA), covered with a plug of glass wool and defatted in a Soxhlet extraction apparatus
under reflux for 12 to 14 h with hexanes. Defatted PS were transferred to 125-mL Erlenmeyer
flasks at a mass-to-solvent ratio of 1:10 (w/v) with 80% (v/v) acetone. Extractions were
performed in triplicate in a gyrotary water bath shaker (Model G76, New Brunswick Scientific
Company, Inc., New Brunswick, NJ) set at 150 rpm and a temperature of 45 °C for 30 min. The
slurry was then filtered by gravity through fluted P8 filter paper (Fisher Scientific). The
extraction process was repeated 2× as described above. All filtrates were pooled and acetone was
evaporated with a Büchi Rotavapor R-210 using a V-700 vacuum pump connected to a V-850
vacuum controller (Büchi Corporation, New Castle, DE) at 45 °C. The aqueous residue was
frozen and then lyophilized in a FreeZone® 2.5-L bench-top freeze dryer (Labconco Corporation,
Kansas City, MO) to ensure all traces of moisture were removed, and then stored in amber-glass
bottles at –20 °C until further analyzed.
Hydrolysis of Phenolic Compounds from Crude Extracts
Phenolic compounds were fractionated into three classes (i.e., free, soluble-ester, and
glycoside-bound) from the acetonic PS extracts by the method described by Amarowicz &
Weidner (2001) with slight modifications. Briefly, a 400-mg portion of each crude extract was
dissolved in 20 mL of deionized water followed by acidification to pH 2 with 6 M HCl. Using a
separatory funnel, free phenolic compounds were then extracted into 20 mL of diethyl ether. The

208
extraction process was repeated 4× more; the ether layers were transferred intermittently to a
100-mL round-bottom flask and removed with a Büchi Rotavapor R-210 using a V-700 vacuum
pump connected to a V-850 vacuum controller (Büchi Corporation, New Castle, DE, USA) at
30 °C. Traces of water, when present, were removed from the contents in the round-bottom flask
by a nitrogen evaporator (N-EVAP™ 111 with an aluminum bead dry bath set at ~50 °C,
Organomation Associates, Inc., Berlin, MA, USA). This sediment is referred to as fraction 1 (F1),
and was characterized by Ma et al. (2014). The aqueous-phase residue in the separatory funnel
was then mixed with 20 mL of 2 M NaOH, hydrolyzed under a N2 atmosphere for 4 h at room
temperature, and then acidified to pH 2 with 6 M HCl. Using 30-mL aliquots of diethyl ether,
liberated phenolic compounds from soluble esters were extracted a total of 5×. The ether layers
were transferred intermittently to a 100-mL round-bottom flask and removed with the Rotavapor.
Traces of water, when present, were removed from the contents in the round-bottom flask by the
N-EVAP. This sediment is referred to as fraction 2 (F2). The aqueous-phase residue was then
finally combined with 15 mL of 6 M HCl and hydrolyzed under a N2 atmosphere for 1 h at
100 °C in a forced-air convection oven. Using 45-mL aliquots of diethyl ether, liberated phenolic
compounds from glycosides were extracted a total of 5×. The ether layers were transferred
intermittently to a 100-mL round-bottom flask and removed with the Rotavapor. Traces of water,
when present, were removed from the contents in the round-bottom flask by the N-EVAP. This
sediment is referred to as fraction 3 (F3).
Reversed-Phase High-Performance Liquid Chromatography Electrospray Ionization Mass
Spectrometry (RP-HPLC/ESI-MSn)
An Agilent 1200 Series HPLC system consisting of a quaternary pump with degasser,

209
autosampler, thermostatted column compartment, UV–vis diode array detection (DAD) with
standard flow cell, and 3D ChemStation software (Agilent Technologies, Santa Clara, CA, USA)
was employed for the chromatography. A reversed-phase Luna C18(2) column (4.6 × 250 mm,
5-μm particle size; Phenomenex, Torrance, CA, USA) was utilized. A gradient elution consisting
of mobile phase A (H2O/CH3CN/CH3COOH, 93:5:2, v/v/v) and mobile phase B
(H2O/CH3CN/CH3COOH, 58:40:2, v/v/v) from 0 to 100% B over a 50-min period at a flow rate
of 1 mL/min was employed. Before subsequent injections, the system was re-equilibrated for 30
min using 100% A. A 10-mg portion of the PS crude extract, F2 and F3 were dissolved in 5, 4,
and 2 mL of 80% (v/v) methanol, respectively, and then passed through a Phenex™-RC, 15 mm,
non-sterile, 0.2-μm syringe filter (Phenomenex Inc., Torrance, CA, USA) before determination
of their phenolics; the injection volume was 20 μL. Detection wavelengths employed were λ =
255 and 260 nm (hydroxybenzoic acids, as well as ellagic acid and ellagic acid derivatives), 280
nm ((+)-catechin, (–)-epicatechin, and PACs), 320 nm (phenolic acids notably of the
trans-cinnamic acid family), and 360 nm (flavonols and general flavonoids). Tentative
identification of separated components was made by matching UV–vis spectra and retention time
(tR) mapping with commercial standards. For quantification, calibration curves were constructed
for each standard to confirm linearity based on the UV–vis signal as well as for the determination
of response factors.
RP-HPLC-ESI-MSn analyses of the phenolics were performed on an Agilent 1100 HPLC
system, with the same chromatography conditions as described above, coupled with a Bruker
Esquire 3000plus ion-trap mass spectrometer (Bruker Daltonics Inc., Billerica, MA, USA), which
was equipped with an ESI source. Instrument control and data acquisition were performed with
Bruker Daltonics Esquire 5.3 software. The HPLC eluent flowed directly into the mass

210
spectrometer via a flow splitter delivering roughly 100 μL/min. Mass spectra were acquired in
the negative-ion mode with smart settings for a target mass at an m/z of 800, compound stability
at 100%, and the trap drive level at 100%. The voltage applied to the capillary was 4.0 kV with
an end plate offset of –500 V. Nitrogen was used as the nebulizing gas at a pressure of 10 psi, a
dry gas flow rate of 6 L/min, and a dry gas temperature of 280 °C. The phenolic compounds
were fragmented using the auto-MS2 mode with the following precursor-ion selection parameters:
two precursor ions, threshold abs of 10,000, threshold rel of 5.0%, ion excluded after two spectra,
and exclusion release after 0.5 min. All collision-induced dissociation mass spectra were
obtained with He as the collision gas at a fragmentation voltage of 1 V after isolation of the
desired precursor ion. A full scan was performed over the mass range of 100 to 1,000 m/z at a
rate of 13,000 m/z per second under standard–normal scan mode. The ion current control target
was 50,000 with a maximum accumulation time of 50 ms. Each mass spectrum generated was
based on an average of ten scans. Precursor ions of interest were further subjected to auto-MSn
under the same conditions as described above.
Statistical Analysis
For each quantified phenolic compound, the mean and standard deviation was calculated
from the measurements of triplicate extractions.
6.3 Results and Discussion
Hydrolysis
Alkaline and acid hydrolyses of the PS crude extract were performed prior to
chromatographic analysis in order to liberate phenolic aglycones from soluble esters and
glycosides, respectively. Even though the HPLC profile of hydrolyzed samples may not reflect

211
the structure of each phenolic ester and glycoside present in PS, hydrolysis does simplify the
identification of phenolic compounds and provides important information concerning the profile
of the individual aglycones. Moreover, it allowed further compounds to be detected via
chromatography. In the present study few phenolic species were isolated from the PS crude
phenolic extracts (CE1 of Table 6.1), unlike those first liberated via base and acid hydrolyses
followed by RP-HPLC separation and detection by ESI-MSn (Tables 6.2 & 6.3). Figure 6.1
depicts the chemical structures of the phenolic monomeric aglycones detected in PS.
Identification of Phenolic Compounds using RP-HPLC-ESI-MSn.
Prior to hydrolysis, only PACs and rutin were detectable in the PS crude phenolic extracts. In
contrast, a large variety of phenolic compounds, including PACs (monomer to pentamer),
hydroxybenzoic acids, trans-cinnamic acids, stilbenes, and flavonoids, were eluted in fractions
F2 (i.e., phenolics liberated from soluble esters) and F3 (i.e., phenolics liberated from
glycosides). Noteworthy is that flavonoids were liberated primarily from glycosides, and
recovered in F3.
Phenolic acids and flavonoids show characteristic UV range absorbance patterns from 190 to
380 nm (Merken & Beecher, 2000; Robbins, 2003). From UV–vis DAD, four groups of phenolic
compounds were characterized, namely hydroxybenzoic acids (255 and 260 nm), (+)-catechin,
(–)-epicatechin and their polymers (280 nm), hydroxycinnamic acids (320 nm) and flavonols
(360 nm). These compounds was subsequently introduced to the ESI mass spectrometer and
analyzed based on their m/z values. Tentative identification of separated compounds was based
on mass spectrometry alone; positive identification was achieved by the matching of tRs and
spectral data with those of commercial standards, when available. Possible misinterpretations of

212
spectra are due to the presence of stereoisomers, which are impossible to distinguish by mass
spectra. Typically, the cleavage of a distinctive moiety from a compound in MSn analysis brings
about a corresponding change in mass. To illustrate, rutinoside possesses a characteristic mass of
308 Da; so, loss of 18 and 15 Da typically indicates the cleavage of a H2O molecule and a CH3•
group, respectively. A-type PACs (m/z 575, 861, 863, 1151, 1149, 1437, 1725, etc.) display a
2-Da difference in [M – H]‾ from B-type polymers (m/z 577, 865, 1153, 1441, and 1729, etc.).
Quinone methide fission (QM), retro-Diels-Alder fission (RDA), and heterocyclic ring fission
(HRF) are three major fragmentation routes of PACs well-described in the literature (Gu et al.,
2003a).
ijA‾ and ijB‾ ions are diagnostic fragments for flavonoid identification and produced by the
RDA cleavage in the C-ring. A‾ and B‾ are product ions in the negative-ion mode consisting of
intact A- and B-rings, while the superscript i and j indicate the positions in the C-ring where two
C–C bonds have been broken. Besides RDA cleavage in the C-ring, losses of neutral molecules
such as H2O (18 Da), CO (28 Da), CO2 (44 Da), C2H2O (42 Da), and C3O2 (68 Da) can be
characteristic in the negative-ion mode. The fragmentations of flavone, flavonol, and flavanone
aglycones in the negative-ion mode by ESI trap mass spectrometry are well-demonstrated by
Fabre et al. (2001). The successive loss of CH3• and then CO (28 Da) or CHO• (29 Da) were
characteristic in methoxylated flavonoids (Justesen, 2001). However, the position of the methoxy
group must be identified by the comparison with commercial standards or by NMR analysis
(Cuyckens & Claeys, 2004). A similar nomenclature of fragmentation was adopted as for
flavonoids. ijA‾ and ijB‾ ions are RDA fragments produced by cleavage of two C–C bonds in the
C-ring. The flavonoid, whose C-ring is attached to the A-ring of the other flavonoid, is denoted
as ‘Part I’ and the other flavonoid is referred to as ‘Part II.’ Identification of compounds detected

213
in both PS crude extracts and each base- and acid-hydrolytic fraction is discussed as follows.
Crude PS extracts.
Proanthocyanidins (PACs)
Compounds providing a molecular ion [M – H]– at m/z 575 (compounds CE-1-13, 17, 21, 24,
26, and 27) and 577 (compounds CE-1-6 and 10) are likely PAC A- and B-type dimers,
respectively. In the negative-ion mode, A-type dimers yield product ions at m/z 449 [M – H –
126 (C6H6O3)]– and 423 [M – H – 152 (C8H8O3)]– via HRF fragmentation at the top unit and
RDA fragmentation at the base unit, respectively. Generally, the top unit is the favored site for
RDA, but fission can occur at the base unit when blocked by A-type bonds (Gu et al., 2003a).
QM ions were present at m/z 289 [MT – H (290 – H)]– (QM cleavage at the terminal {T} unit)
and 285 [ME – 5H (290 – 5H)]– (QM cleavage at the extension {E} unit). Likewise, product ions
at m/z 451 [M – H – 126 (C6H6O3)]–, 425 [M – H – 152 (C8H8O3)]–, 289 [MT – H (290 – H)]– and
287 [ME – 5H (290 – 5H)]– were present in the MS2 fragmentation of B-type dimer. The
fragment ion at m/z 407 was generated by further loss of a –H2O moiety from the ion at m/z 425.
These data and characteristic MS fragmentation patterns are consistent with the findings of
previous studies (Gu et al., 2003a; Appeldoorn et al., 2009; Sarnoski et al., 2012).
Molecular ions present at m/z 863 (compounds CE-1-1, 3, 4, 7, 8, 9, 11, 12, 18, 19, 22, and
23) and 865 (compound CE-1-2) were likely produced by PAC A- and B-type trimers,
respectively. Theoretically, PAC trimers dissociate in a similar way to dimers: there are two types
of A-type trimers both possessing a molecular ion at m/z 863, but with different QM diagnostic
ions caused by varied positions of the A-bond. QM cleavage between the top and middle units
produced ions at m/z 575 [MT – H (576 – H)]– and 287 [ME – 3H (290 – 3H)]–, indicating that the

214
A-type linkage is located between the middle and base units (compounds CE-1-1, 3, 7, 11, 18,
and 22). The HRF and RDA fragmentation of the top unit yielded product ions at m/z 737 [M – H
– 126 (C6H6O3)]– and 711 [M – H – 152 (C8H8O3)]–, respectively. The HRF fragmentation of the
middle unit gave a product ion at m/z 449. When the A-type linkage is located between the top
and middle units (compounds CE-1-4, 8, 9, 12, 19, and 23), QM cleavage ions are present at m/z
573 [ME – 3H (576 – 3H)]– and 289 [MT – H (290 – H)]–. In this case, the product ion at m/z 711
was formed by RDA fragmentation of the middle unit. The HRF fragmentation of the middle unit
yielded product ions at m/z 451 and 411. However, these two types of trimer, containing the same
number of A-type bond, were not well resolved by HPLC. Two series of fragments were
observed in one mass spectrum. HRF and RDA fragmentation of the B-type trimer gave rise to
dissociation ions at m/z 739 [M – H – 126 (C6H6O3)]– and 713 [M – H – 152 (C8H8O3)]–,
respectively. The HRF fragmentation of the middle unit resulted in a product ion at m/z 451. The
prominent fragment ion at m/z 695 was generated by further loss of a –H2O moiety from the
RDA ion at m/z 713. QM diagnostic ions were present at m/z 577 [MT – H (578 – H)]–, 575 [ME
– 3H (578 – 3H)]– and 287 [ME – 3H (290 – 3H)]–.
[M – 2H]2– at m/z 719 (compounds CE-1-5, 14, and 15) and 574 (compounds CE-1-16 and 20)
are doubly charged ions generated from a PAC A-type pentamer (m/z 1439) and a PAC A-type
tetramer (m/z 1149), respectively. Apropos the pentamer: the diagnostic QM ions present at m/z
863 [MT – H (864 – H)]–, 575 [ME – 3H (578 – 3H)]–, and 573 [ME – 3H (576 – 3H)]– indicate a
connection sequence such as (epi)catechin→B→(epi)catechin→B→(epi)catechin→
A→(epi)catechin→B→(epi)catechin, where A and B represent A- and B-type linkages,
respectively. The A-type pentamer gave rise to QM cleavage fragments at m/z 861 [ME – 3H (864
– 3H)]–, 577 [MT – H (578 – H)]–, and 575 [MT – H (576 – H)]–, being assigned to a sequence

215
such as (epi)catechin→B→(epi)catechin→A→(epi)catechin→B→(epi)catechin→B→(epi)cate-
chin. Vis-à-vis the tetramer: the QM fragment at m/z 859 [ME – 3H (862 – 3H)]– were observed
when the B-type linkage is located between the base and its upper unit (CE-1-16). The
production of a QM fragment at m/z 861 [MT – H (862 – H)]– indicates that the B-type linkage is
located between the top and its subsequent unit, while the remaining units are linked by A-type
bonds (compound CE-1-20).
Flavonoid.
A 316-Da O-methylated flavonoid with a rutinoside attached was determined as compound
CE-1-25. It yielded a [M – H]– at m/z 623 and fragment ions at m/z 315 [M – H – 308]– by loss of
rutinoside moiety and m/z 300 [M – H – 308 – 15]– by further loss of a CH3• group from the
deprotonated flavonoid aglycone. Although there is a wide range of candidates for 316-Da
O-methylated flavonoids such as rhamnetin, isorhamnetin, tamarixetin, and neptin, the
compound is likely to be isorhamnetin according to an NMR study reported by Lou’s group
(2001).
Ester-bound Phenolics
Phenylacetic Acid
Compound F-2-3 yielded a molecular ion at m/z 167 and a fragment ion at m/z 123 by loss of
a CO2 group from the carboxylic acid moiety. Among several candidates such as
3,4-dihydroxyphenylacetic acid (DOPAC), vanillic acid, orsellinic acid and homogentisic acid,
the most likely compound is DOPAC, as evidenced by tR matching with a commercial standard.
Compound F-2-6 is likely a derivative of DOPAC because of the fragment ion at m/z 167

216
corresponding to the deprotonated form of DOPAC and its decarboxylated ion at m/z 123.
Hydroxycinnamic Acids
Compound F-2-11 yielded a molecular ion at m/z 179 and its decarboxylated ion at m/z 135.
It is further confirmed as trans-caffeic acid by tR matching with a commercial standard.
Compound F-2-22 was identified as p-coumaric acid by the standard (λmax = 310 nm), resulting
in a [M – H]– at m/z 163 and a classic fragment at m/z 119 through neutral loss of CO2.
Compound F-2-25 displayed a maximum UV absorption band at 324 nm and was further
confirmed as ferulic acid by a commercial standard. It gave a [M – H]– at m/z 193 together with
fragment ions at m/z 178 [M – H – 15 (CH3)]–•, 149 [M – H – 44 (CO2)]– and 134 [M – H – 44
(CO2) – 15 (CH3)]–•.
Hydroxybenzoic acids, their esters and phenyllactic acid
Compounds F-2-4 and -7 both yielded a molecular ion at m/z 181. Further dissociation ions
of compound F-2-4 were present at m/z 163 [M – H – 18 (H2O)]–, 153 [M – H – 28 (CH2CH2)]–,
137 [M – H – 44 (C2H4O)]–, and 109 [M – H – 72 (COOCH2CH2)]–. The tentative candidate was
ethyl protocatechuate. This compound in peanut seed testa was identified by NMR analysis
performed by Huang et al. (2003). Compound F-2-7 gave fragment ions at m/z 163 [M – H – 18
(H2O)]– and 137 [M – H – 44 (CO2)]–, and is likely DL-3-(4-hydroxyphenyl)lactic acid.
Compound F-2-5 was confirmed by a commercial standard to be protocatechuic acid (λmax = 260
nm), producing a molecular ion at m/z 153 and a fragment ion at m/z 109 by loss of CO2 from the
carboxylic acid moiety. p-Hydroxybenzoic acid (compound F-2-9) was recovered in F2 and
showed a molecular ion at m/z 137. Although no significant MS2 fragments were observed, this

217
compound’s identity was further confirmed by tR matching with a commercial standard.
Procyanidins (Monomers to Tetramers)
Compounds F-2-1 and 2 are likely gallocatechin and a derivative, respectively. The
molecular ion [M – H]– of gallocatechin was present at m/z 305, which further fragmented to
product ions at m/z 261 [M – H – 44]– by loss of a –CH2–CHOH– group or neutral loss of CO2,
219 [M – H – 86]– by loss of a C4H4O2 from the A-ring plus 2H, and 179 [M – H – 126]–
attributed to a 1,4B– ion. The conjugate 1,4A– fragment at m/z 125 represents the intact A-ring with
two phenolic groups and is formed through a pathway as demonstrated by Miketova et al. (2006).
Compounds F-2-8, 10 and 12 are stereoisomers with the same molecular ions at m/z 289. Classic
fragments were observed at m/z 245 [M – H – 44]– by loss of a –CH2–CHOH– group or neutral
loss of CO2, 205 [M – H – 84]– by loss of C4H4O2 from the A-ring, and 179 [M – H – 110]– by
loss of C6H6O2 (B-ring). The fragmentation mechanisms of (epi)catechin were described by
Bravo et al. (2006). The compounds were further confirmed by commercial standards as
(–)-catechin (compound F-2-8), (+)-catechin (compound F-2-10) and (–)-epicatechin (compound
F-2-12), respectively. Compound F-2-13 was found to be (–)-epiafzelechin with a [M – H]– at
m/z 273, which dissociated further into ions at m/z 229 [M – H – 44]– by loss of a –CH2–CHOH–
group or neutral loss of CO2, 187 [M – H – 86]– by loss of C4H4O2 from A-ring plus 2H, and 137
[M – H – 136]– attributed to a 1,3A– ion. The identification was confirmed by tR matching with a
commercial standard.
Compounds F-2-19, 21, 26, 27, 28, 30 and 31 are probably PAC A-type dimers, yielding
molecular ions at m/z 575; whereas, compound F-2-20 is likely a PAC B-type dimer with a [M –
H]– at m/z 577. As aforementioned, PAC A-type trimers (m/z 863) can further be divided into two

218
categories according to the location of the A-bond. Compounds F-2-14, 29, 33, 36 and 44 are
likely PAC A-type trimers with an A-type linkage between the middle and bottom units. Trimers
with an A-type linkage between the top and middle units are candidates for compounds F-2-15
and 45. Compound F-2-42, yielding a [M – H]– at m/z 861, is likely a PAC trimer with two
A-type linkages. The HRF fragment ions of the top unit were present at m/z 735; whereas, the
RDA fragmentation of the base unit generated an ion at m/z 709. The QM cleavage between the
top and middle units gave ions at m/z 575 [MT – H (576 – H)]– and 285 [ME – 5H (290 – 5H)]–.
The QM cleavage between the middle and base unit produced ions at m/z 289 [MT – H (290 –
H)]– and 571 [ME – 5H (576 – 5H)]–. The fragment at m/z 449 was generated by fragmentation of
the QM ion at m/z 575 and HRF ion at m/z 735 via the mechanism of HRF (Gu et al., 2003a).
Compounds F-2-32, 38, 39, 43, and 46 are PAC A-type tetramers, displaying doubly charged
ions [M – 2H]2– at m/z 574. Noteworthy is that no significant fragments were observed for the
determination of the flavan-3-ol connection sequence. Compound F-2-47 yielded a [M – 2H]2– at
m/z 507. Though no significant MS2 fragments were evident, the proposed candidate is a PAC
A-type trimer with (epi)catechin gallate as its base unit.
Propelargonidin
Compound F-2-35 (m/z 559) is tentatively identified as a propelargonidin A-type dimer with
(epi)afzelechin as its base unit. HRF fragmentation of the (epi)catechin top unit and the RDA
fragmentation of the (epi)afzelechin base unit gave product ions at m/z 433 [M – H – 126
(C6H6O3)]– and 423 [M – H – 136 (C8H8O2)]–, respectively. Diagnostic ions at m/z 273 [MT – H
(274 – H)]– and 285 [ME – 5H (290 – 5H)]– were produced by QM fission. The fragmentation
pathways of a similar propelargonidin A-type dimer, only with an (epi)afzelechin as its top unit,

219
was well described by Appeldoorn et al. (2009).
Prodelphinidins
Compound F-2-16 is likely a prodelphinidin dimer containing a B-bond linked to
(epi)gallocatechin (top) and (epi)catechin (base) units. It yielded a [M – H]– of m/z 593 and
further fragments at m/z 467 [M – H – 126 (C6H6O3)]– by HRF at the top unit, 425 [M – H – 168
(C8H8O4)]– by RDA at the top unit, 303 [ME – 3H (306 – 3H)]–, and 289 [MT – H (290 – H)]–.
The fragmentation scheme of this B-type prodelphinidin dimer has been documented (Gu et al.,
2003b). Compound F-2-17 showed a [M – H]– at m/z 591 and is tentatively identified as a
prodelphinidin dimer containing an A-bond linked to (epi)gallocatechin (top) and (epi)catechin
(base) units. The HRF fragmentation of the (epi)gallocatechin unit and RDA fragmentation of the
(epi)catechin unit yielded product ions at m/z 465 [M – H – 126 (C6H6O3)]– and 439 [M – H –
152 (C8H8O3)]–, respectively. The QM cleavage ions were present at m/z 289 [MT – H (290 –
H)]– and 301 [ME – 5H (306 – 5H)]–. On the other hand, compound F-2-23 is a similar A-type
prodelphinidin dimer but with (epi)catechin as its top unit and (epi)gallocatechin as its base unit.
QM diagnostic ions were present at m/z 305 [MT – H (306 – H)]– and 285 [ME – 5H (289 – 5H)]–.
A product ion at m/z 423 [M – H – 168 (C8H8O4)]– was generated by the RDA fragment of the
base (epi)gallocatechin unit.
A molecular ion [M – H]– at m/z 605 was provided by compound F-2-18. It is likely a
prodelphinidin A-type dimer with a (epi)catechin top unit connected to a 5-O-methyl
(epi)gallocatechin. The HRF fragmentation of top (epi)catechin unit gave an anion at m/z 479 [M
– H – 126 (C6H6O3)]–. The 0,2IIA– fragment from the base methyl (epi)gallocatechin was present
at m/z 451 [M – H – 154 (C7H6O4)]–, which indicates that the methoxy group is attached to the 6
220
position on the A-ring. QM diagnostic ions were found at m/z 319 [MT – H (320 – H)]– and 285
[ME – 5H (290 – 5H)]–. The tentative structure and fragmentation pathways for compound
F-2-18 are depicted in Figure 6.2A. Similarly, the proposed candidates for compound F-2-41,
which yielded a [M – H]– at m/z 607, are a prodelphinidin B-type dimer containing a
(epi)catechin unit and a methyl (epi)gallocatechin unit or a prodelphinidin A-type dimer with two
(epi)gallocatechin units. Unfortunately, the identification cannot be unequivocally assigned
because of the lack of significant MS2 fragments.
Compound F-2-34 yielded a [M – H]– at m/z 877, which was tentatively identified as a
prodelphinidin trimer with a connection sequence of (epi)gallocatechin→A→(epi)catechin
→A→(epi)catechin; here, A represents an A-type linkage. The HRF fragment from the
(epi)gallocatechin top unit and the RDA fragment from the base (epi)catechin unit were present
at m/z 751 [M – H – 126 (C6H6O3)]– and 725 [M – H – 152 (C8H8O3)]–, respectively. An ion at
m/z 599 was generated by RDA fragmentation of the HRF ion at m/z 751. QM diagnostic ions
were present at m/z 575 [MT – H (576 – H)]–, 289 [MT – H (290 – H)]–, and m/z 301 [ME – 5H
(306 – 5H)]–, 587 [ME – H (592 – 5H)]–. HRF fragmentation of QM cleavage ions at m/z 587 and
575 yielded anions at m/z 461 and 449, respectively. The tentative structure and fragmentation
pathways for compound F-2-34 is depicted in Figure 6.2B. The tentative candidate for
compound F-2-40 is likely a prodelphinidin trimer containing a luteolin or kaempferol base unit.
Further fragmentation of [M – H]– at m/z 875 yielded ions at m/z 749 [M – H – 126 (C6H6O3)]–
and 723 [M – H – 152 (C8H8O3)]– by HRF and RDA fragmentation, respectively, indicating a top
(epi)catechin unit with a B-type linkage to the following (epi)gallocatechin unit. Unfortunately,
no significant diagnostic QM ions were observed in the mass spectra to further support the
assignment. The [M – 2H]2– at m/z 581 (compound F-2-48) was a doubly charged ion yielded by

221
a prodelphinidin tetramer with a molecular mass of 1164 Da. The diagnostic QM fragments were
present at m/z 877 [MT – H (878 – H)]–, 575 [MT – H (576 – H)]–, and m/z 873 [ME – 5H (878 –
5H)]–, 285 [ME – 5H (290 – 5H)]–, indicating a connection sequence of
(epi)catechin→A→(epi)gallocatechin→A→(epi)catechin→A→(epi)catechin. HRF of the QM
ions at m/z 877 and 575 gave further dissociation ions at m/z 751 and 449, respectively. The
proposed structure and fragmentation pathways for compound F-2-48 are shown in Figure 6.2 C.
Flavonoid
The proposed candidate for compound F-2-37 is myricetin, which was further confirmed by
tR matching with a commercial standard. Its [M – H]– at m/z 317 dissociated into fragments at
m/z 271 [M – H – 18 (H2O) – 28 (CO)]–, 243 [M – H – 18 (H2O) – 56 (2CO)]– and 227 [M – H –
18 (H2O) – 28 (CO) – 44 (CO2)]–. RDA diagnostic ions at m/z 179, 151, and 137 were noted as
1,2A–, 1,3A–, and 1,2B–, respectively.
Stilbene
Compound F-2-24 was tentatively identified as trans-piceatannol by a molecular ion [M –
H]– at m/z 243. Further fragment ions were present at m/z 225 [M – H – 18 (H2O)]–, 201 [M – H
– 42 (CHCOH)]–, 199 [M – H – 42 (CHCOH) – 2H]–, 175 [M – H – 68 (C3O2)]–, 173 [M – H –
42 (CHCOH) – 28 (CO)]– and 159 [M – H – 42 (CHCOH) – 42 (C2H2O) or M – H – 42
(CHCOH) – 2H – 40 (C2O)]–. This is the CID fragmentation of [M – H]– when the deprotonation
reaction occurs on the catechol moiety of trans-piceatannol. These fragmentation mechanisms
have been elucidated and described by Stella et al. (2008). Similar MS2 fragments for
trans-piceatannol in peanuts were reported by Ku et al. (2005).

222
Glycoside-bound Phenolics
Phenolic Acids
Compound F-3-3 with a molecular ion [M – H]– at m/z 167 and a fragment ion at m/z 123 is
likely DOPAC, as discussed for F2. Compound F-3-5 was identified as protocatechuic acid by its
[M – H]– at m/z 153 and the decarboxylated ion at m/z 109 [M – H – 44 (CO2)]–. Compound
F-3-6 may be a protocatechuic acid derivative: it yielded a [M – H]– at m/z 233 and a prominent
fragment ion at m/z 153, corresponding to deprotonated protocatechuic acid. Compound F-3-8,
giving a molecular ion at m/z 137, was identified as p-hydroxybenzoic acid by UV spectra (λmax
= 256 nm) and tR matching with a commercial standard.
Compound F-3-11 is confirmed as vanillic acid by UV spectra (λmax = 260 nm) and tR
matching with a commercial standard. It yielded a [M – H]– at m/z 167 and a fragment ion at m/z
123 by loss of CO2 from the carboxylic acid moiety. Other dissociation ions were present at m/z
152 [M – H – 15 (CH3)]–• and 108 [M – H – 44 (CO2) – 15 (CH3)]–•. F-3-22 is likely
homovanillic acid with a [M – H]– at m/z 181, which dissociated further into fragments at m/z
137 [M – H – 44 (CO2)]– and 122 [M – H – 44 (CO2)– 15 (CH3)]–•.
Proanthocyanidins (PAC) (Monomers to Dimers)
Compounds F-3-1 and F-3-2 are identified as gallocatechin and a derivative, as in F2.
Compound F-3-4 is likely methyl gallate, yielding a [M – H]– at m/z 183 and a fragment ion at
124 [M – H – 44 (CO2)– 15 (CH3)]–•. Compounds F-3-9 and F-3-14 are (+)-catechin and
(–)-epicatechin, respectively, as described for F2 and further confirmed by tR matching with
commercial standards. Compounds F-3-21, 23, 27, 32, 35, 36 and 40 are likely PAC A-type
dimers with molecular ions at m/z 575 and QM ions at m/z 289 [MT – H (290 – H)]– and 285 [ME
223
– 5H (290 – 5H)]–.
Propelargonidins
Compound F-3-24 (m/z 847) is likely a propelargonidin A-type trimer with a (epi)afzelechin
middle unit. QM cleavage ions were present at m/z 289 [MT – H (290 – H)]– and 557 [ME –
3H(560 – 3H)]–, indicating the presence of a B-type linkage between the middle (epi)afzelechin
unit and the base (epi)catechin unit. Compound F-3-52 yielded a [M – H]– at m/z 845 and was
tentatively identified as a propelargonidin trimer with one (epi)afzelechin top unit and two
A-type linkages. QM cleavage of this trimer resulted in fragments at m/z 289 [MT – H (290 –
H)]–, 575 [MT – H (576 – H)]– and 269 [ME – 5H (273 – 5H)]–, 555 [ME – 5H (560 – 5H)]–. The
fragmentation pathways for these two propelargonidin oligomers are well documented (Gu et al.,
2003a; Appeldoorn et al., 2009;).
Proanthocyanidins (PAC) Containing an Additional Phloroglucinol Unit.
Compounds F-3-10, 12, 15, 17, 18, 20, 25, 26, and 37 are likely A-type PAC dimers
containing an additional phloroglucinol unit, which was reported in cranberry by Foo et al.
(2000). These compounds yielded molecular ions at m/z 699, which dissociated further into
fragments at m/z 573 [M – H – 126]– by losing a phloroglucinol moiety (C6H6O3) from the top
(epi)catechin unit via the HRF function, 547 [M – H – 152]– by losing C8H8O3 from the base
(epi)catechin-phloroglucinol unit via the RDA function, and 531 [M – H – 168]– by losing
C8H8O4 from the base (epi)catechin-phloroglucinol unit. Product ions at m/z 411 and 287 were
generated by HRF fragmentation at the base (epi)catechin-phloroglucinol unit. A QM diagnostic
ion was present at m/z 285 [ME – 5H (290 – 5H)]–. Interesting is that the conjugate ion at m/z 413

224
was not observed. Our identification is further supported by the MS3 experiment. Compounds
F-3-28, 29, and 31 (m/z 657) appear to be generated by losing a C2H2O group (42 Da) from the
additional phloroglucinol unit of the above described PAC dimers. Compounds F-3-33 and 50
(m/z 547) are also likely fragments from the aforementioned dimers by RDA at the base
(epi)catechin-phloroglucinol unit. Furthermore, compounds F-3-39, 44, 48, and 51 (m/z 531) are
tentatively identified as fragments from this dimer after loss of C8H8O4 from the base
(epi)catechin-phloroglucinol unit. Such cleavages can be induced by heat and/or acid hydrolysis
applied to release phenolics bound to glycosides.
Compounds F-3-13, 16, and 19 are tentatively identified as a similar PAC dimer, but the top
(epi)catechin and the base (epi)catechin-phloroglucinol units are connected by a B-type linkage.
The [M – H]– was present at m/z 701. Diagnostic ions were evident at m/z 289 [MT – H (290 –
H)]– and 411 [MB – 3H (414 – 3H)]–, indicating a fragmentation pathway as described by
Sarnoski et al. (2012) whereby QM cleavage is blocked by a carbonyl group on the C-ring of the
base luteolin or kaempferol group. In the present study, the presence of an additional
phloroglucinol unit, which is connected to the C-ring of the base (epi)catechin unit, inhibits
QM fission. Our identification is further supported by the MS3 experiment. Compounds F-3-42
and 47 (m/z 549) are likely fragments from the aforementioned B-type dimers by RDA at the
base (epi)catechin-phloroglucinol unit.
The proposed candidate for compounds F-3-34 and 41 (m/z 683) is a PAC dimer with an
(epi)catechin unit connected to a (epi)afzelechin-phloroglucinol unit through an A-type bond.
HRF fragmentation ions of this dimer were present at m/z 557 [M – H – 126 (C6H6O3)]– and 411
[M – H – 272 (C15H12O5)]–, which were assigned to HRF at the top (epi)catechin unit and the
base (epi)afzelechin-phloroglucinol unit, respectively. Other product ions were observed at m/z

225
515 [M – H – 168]– by loss of C8H8O4 from the base (epi)afzelechin-phloroglucinol unit and 423
[M – H – 126 (C6H6O3) – 136 (C8H8O2)]– + 2H by combination of HRF (at the top (epi)catechin
unit) and RDA (at the base (epi)afzelechin-phloroglucinol unit) fragmentations. QM fission
resulted in fragments at m/z 397 [MT – H (398 – H)]– and 285 [ME – 5H (290 – 5H)]–. Our
assignment is further supported by the MS3 experiment. Compounds F-3-45, 66, and 69 (m/z 557)
are likely fragments from the aforementioned dimers by HRF at the top (epi)catechin unit.
Further dissociation ions were present at m/z 431 [M – H – 126 (C6H6O3)]– by loss of the
additional phloroglucinol group, 389 [M – H – 168 (C8H8O4)]– and 285 [M – H – 272
(C15H12O5)]– by HRF at the base (epi)afzelechin-phloroglucinol unit. These type of fragments
can be caused by heat and/or acid applied in deglycosylation. The proposed structures and
fragmentation pathways of the above three types of PACs containing an additional
phloroglucinol unit are depicted in Figure 6.3A, B, and C, respectively.
Proanthocyanidin (PAC) Containing a novel Flavan-3-ol Unit.
Compound F-3-38 is likely a PAC dimer with a catechin connected to a novel flavan-3-ol
unit through an A-type linkage. It yielded a [M – H]– at m/z 589, which further dissociated into
ions at m/z 463 [M – H – 126 (C6H6O3)]– by HRF at the top catechin unit and 453 [M – H – 136
(C8H8O2)]– by RDA at the base unit. QM diagnostic ions were present at m/z 303 [MT – H (304 –
H)]–, and 285 [ME – 5H (290 – 5H)]–. Our identification is further supported by the MS3
experiment; nevertheless, further analyses are necessary to support the assignment. The tentative
structure and fragmentation scheme are shown in Figure 6.4A. Compound F-3-74 is probably an
unknown PAC derivative due to the product ions at m/z 441 and 285, which could be assign to a
HRF ion and a QM ion, respectively.

226
Prorobinetidin and Prodelphinidin
As shown in Figure 6.4B, compounds F-3-55, 57, 62, 64 and 68 (m/z 589) are tentatively
identified as a prorobinetidin dimer with a base unit most likely being a C-methyl
(epi)robinetinidol A-linked to an (epi)catechin top unit. The HRF fragment ion of the
(epi)catechin unit and RDA fragment ion of the C-methyl (epi)robinetinidol unit were present at
m/z 463 [M – H – 126 (C6H6O3)]‾ and 421 [M – H – 168 (C8H8O4)]‾, respectively. QM cleavage
gave rise to diagnostic ions at m/z 303 [MT – H (304 – H)]‾ and 285 [ME – H (290 – 5H)]‾,
corresponding to C-methyl (epi)robinetinidol and (epi)catechin units, respectively. Our
identification was further supported by the MS3 experiment. The proposed candidate for
compound F-3-58 is a prodelphinidin B-type dimer, as discussed in F2.
Flavonols and Flavanonols
Compound F-3-7 yielded a molecular ion [M – H]– at m/z 301 and fragments at m/z 283 [M –
H – 18 (H2O)]–, 257 [M – H – 44 (CO2)]–, and 229 [M – H – 44 (CO2) – 28 (CO)]–. 1,2B– and
1,2A– ions were present at m/z 163 and 137, respectively. The likely candidate is robinetin.
Compound F-3-78 yielded a [M – H]– at m/z 343 which further dissociated into ions at m/z 328
[M – H – 15 (CH3)]–•, 313 [M – H – 30 (2CH3)]–, 299 [M – H – 15 (CH3) – 29 (HCO)]–, 285 [M
– H – 30 (2CH3) – 28 (CO)]–, and 135 attributed to a 1,3A– fragment. The proposed candidate is
3′,4′,5′-trimethylrobinetin.
Compound F-3-63 is identified as quercetin with a [M – H]– at m/z 301 that fragmented into
ions at m/z 273 [M – H – 28 (CO)]–, 257 [M – H – 44 (CO2)]–, and 229 [M – H – 44 (CO2) – 28
(CO)]–. The 1,2A– ion at m/z 179 further yielded ions at m/z 151 noted as 1,2A– – CO and 107
noted as 1,2A– – CO – CO2. This compound was further confirmed by UV spectra (λmax = 256 and

227
370 nm) and tR matching with a commercial standard. Compound F-3-77 is likely a quercetin
methyl ether such as isorhamnetin with a molecular ion [M – H]– at m/z 315 and a fragment at
m/z 300 [M – H – 15 (CH3)]–•. The MS3 fragments of the ion at m/z 315 were present at m/z 300
[M – H – 15 (CH3)]–•, 271 [M – H – 15 (CH3) – 29 (HCO)]–, and 256 [M – H – 44 (CO2) – 15
(CH3)]–•. The 1,3A– ion at m/z 151 is a diagnostic ion observed in CID fragmentation of
isorhamnetin by ESI-MS (Justesen, 2000 & 2001).
Compound F-3-75 is kaempferol, which gave a [M – H]– at m/z 285 and fragments at 257 [M
– H – 28 (CO)]–, 241 [M – H – 44 (CO2)]–, 229 [M – H – 56 (2CO)]–, 213 [M – H – 44 (CO2) –
28 (CO)]–, 199 [M – H – 42 (C2H2O) – 44 (CO2)]–, and 151 assigned to a 1,3A– fragment.
Identification of kaempferol was confirmed by its UV absorption spectrum and tR matching with
a commercial standard. Fabre et al. (2001) described the fragmentation pathways of kaempferol
by ESI-MS. Compound F-3-43 is tentatively identified as fisetin. Fragments produced from [M –
H]– at m/z 285 were present at m/z 257 [M – H – 28 (CO)]–, 241 [M – H – 44 (CO2)]–, 229 [M –
H – 56 (2CO)]–, 213 [M – H – 44 (CO2) – 28 (CO)]–, 177 [M – H – ring B]–. RDA cleavage at
the 1/2 position on the C-ring generated ions 1,2A– (m/z 163) and 1,2B– (m/z 121), which are
highly consistent with the dissociation routes described by Fabre et al. (2001). The loss of a CO
molecule from 1,2A– ion leads to a fragment at m/z 135 noted as 1,2A– – CO. Compound F-3-49
yielded a [M – H]– at m/z 317 and was identified as myricetin as described in F2.
Compound F-3-30 yielded a [M – H]– at m/z 303 that further fragmented into ions at m/z 285
[M – H – 18 (H2O)]–, 259 [M – H – 44 (CO2)]–, 241 [M – H – 18 (H2O) – 44 (CO2)]–, and 217
[M – H – 18 (H2O) – 68 (C3O2)]–. RDA cleavage at the 1/4 position on the C-ring gave rise to
ions 1,4B– (m/z 177) and 1,4A– (m/z 125). The proposed candidate is taxifolin.

228
Flavanones, Flavones, and Isoflavones
Compound F-3-65 is tentatively identified as hesperetin. It yielded a [M – H]– at m/z 301 and
further dissociation fragments at m/z 286 [M – H – 15 (CH3)]–•, 283 [M – H – 18 (H2O)]–, 257
[M – H – 15 (CH3) – 29 (HCO)]–, 242 [M – H – 44 (CO2) – 15 (CH3)]–•, and 215 [M – H – 42
(C2H2O) – 44 (CO2)]–. RDA diagnostic ions were present at m/z 164, 151 and 125, which were
ascribed to 1,2A–, 1,3A–, and 1,4A–, respectively. Further loss of CO2 from 1,3A– generated an ion at
m/z 107, noted as 1,3A– – CO2. It undergoes the similar fragmentation route of hesperetin as
reported by Justesen (2000). Compound F-3-71 (m/z 301) is likely homoeriodictyol, producing
RDA diagnostic ions at m/z 151 assigned to 1,3A–. Compound F-3-61 is likely isosakuranetin with
a [M – H]– at m/z 285 and further dissociation ions at m/z 270 [M – H – 15 (CH3)]–•, 243 [M – H
– 42 (C2H2O)]–, 226 [M – H – 44 (CO2) – 15 (CH3)]–•, and 199 [M – H – 42 (C2H2O) – 44
(CO2)]–. RDA cleavage at the 0/4 position of the C-ring after loss of CH3• gave a diagnostic ion
at m/z 164. This –CH30,4B–• ion lost a further CO molecule, leading to a fragment noted as
–CH30,4B–• – CO (m/z 136).
The proposed candidate of compound F-3-53 is 4′,3′,5,6-trihydroxy-7-methoxyflavone. It
yielded a [M – H]– at m/z 315 that dissociated further into fragments at 300 [M – H – 15 (CH3)]–•
and 191 [M – H – 109 (B-ring) – 15 (CH3)]–•. Compound F-3-74 is likely a flavone dimethyl
ether such as 3′,5,6-trihydroxy-4′,7-dimethoxyflavone, which gave a [M – H]– at m/z 329. It
dissociated further into fragments at m/z 314 [M – H – 15 (CH3)]–•, 299 [M – H – 30 (2CH3)]–,
and 191 [M – H – 15 (CH3) – 123 (B-ring)]–. Unfortunately, the actual position of the methoxy
group for the above two compounds cannot be confirmed without a commercial standard or
NMR analysis. Compound F-3-54 yielded a [M – H]– at m/z 283 and a prominent fragment at m/z
268 [M – H – 15 (CH3)]–•. The proposed candidate is genkwanin. An RDA diagnostic ion

229
–CH31,3A –• was present at m/z 151, with the identification being further confirmed by a UV λmax
at 338 nm (Skoula, Grayer, Kite & Veitch, 2008). Compound F-3-76 is likely a luteolin methyl
ether such as diosmetin with a [M – H]– at m/z 299 and a prominent fragment m/z 284 [M – H –
15 (CH3)]–•. MS3 [299→284] fragments were observed at m/z 256 [M – H – 15 (CH3) – 28
(CO)]–•, 240 [M – H – 15 (CH3) – 44 (CO2)]–•, 216 [M – H – 15 (CH3) – 68 (C3O2)]–•, and 151
attributed to a 1,3A– fragment. The identification is supported by its UV spectra of 254(sh), 266,
and 348 nm (Brad & Chen, 2013). The fragmentation pathways for diosmetin were described by
Justesen (2001).
Compound F-3-60 is likely biochanin A. It yielded a [M – H]– at m/z 283 and a prominent
fragment at m/z 268 [M – H – 15 (CH3)]–•. Further MS3 [283→268] fragmentation generated ions
at m/z 267 [M – H – 15 (CH3) – H]–•, 239 [M – H – 15 (CH3) – H – 28 (CO)]–, 224 [M – H – 15
(CH3) – H – 44 (CO2)]–, and 135 [A-ring fragment]–, which are consistent with the MS3 spectra
of biochanin A obtained by Kang et al. (2007). Biochanin A is an O-methylated isoflavone and it
has long been reported in peanuts (Chukwumah et al., 2007). Compound F-3-72 exhibited a [M –
H]– at m/z 299. Further fragment ions were observed at m/z 284 [M – H – 15 (CH3)]–•, 255 [M –
H – 15 (CH3) – 29 (CHO)]–, 177 [M – H – B-ring]–, and 151 attributed to a 1,3A– ion. Proposed
candidate is pratensein; that is, 3′,5,7-trihydroxyisoflavone-4′-methoxy-3′-O-β-glucopyranoside,
which has been found in peanut skin according to NMR (Lou et al., 2001).
Biflavonoid
Compounds F-3-46, 56, 59, and 67 are likely a daphnodorin H-type biflavonoid composed
of eriodictyol (Part I) and C-methyl (epi)robinetinidol (Part II) units. They gave a [M – H]‾ at
m/z 587 and fragment ions at m/z 569 [M – H – 18 (H2O)]‾, 461 assigned to a 1,4IB‾ fragment,

230
and 419 attributed to a 1,3IIA‾ fragment. The direct cleavage of the interflavan bond generated
fragments at m/z 285 [eriodictyol unit (288 – 3H)]‾ and 301 [C-methyl (epi)robinetinidol unit
(304 – 3H)]‾. This identification is further supported by the MS3 experiment; however, NMR
analysis is required to support the assignment. The tentative structure and fragmentation are
present in Figure 6.4C.
Stilbene.
Compound F-3-70 is tentatively identified as trans-3,3′,5,5′-tetrahydroxy-4′-methoxystilbene.
It yielded a [M – H]– at m/z 273 and further dissociation ions at m/z 258 [M – H – 15 (CH3)]–•,
163 [M – H – 68 (C3O2) – 42 (C2H2O)]–, 136 [M – H – 137 (C7H5O3)]–, and 109 [M – H – 165
(C9H9O3)]–.
Quantification.
Phenolic compounds were quantified based on peak areas of the observed UV signals from
the HPLC chromatograms and calibration curves of commercial standards. Mean phenolic
contents for the identified compounds are reported in Table 6.4. All values are expressed in mg
respective phenolic compound/100-g dry weight (d.w.) of PS.
Protocatechuic acid was determined to be the most dominant in the non-PAC phenolics
profile, and comprised 6.62% and 6.48% of the soluble-ester and glycoside-bound phenolic
compounds, respectively. Kaempferol, fisetin, quercetin, isorhamnetin (flavonols), genkwanin,
and dosmetin (flavones) are quantifiable flavonoids aglycones liberated from glycosides, and
account for 1.54% of the total glycoside-bound phenolic compounds. Quercetin and its methyl
ether (isorhamnetin) are primary flavonoid aglycones and constituted 57.1% of the total

231
recovered flavonoids aglycones. As aforementioned, PACs possess the lion’s share of the
phenolics in PS (Ma et al., 2014) and are the major phenolics released from esters and glycosides.
PAC monomers {(+)-catechin and (–)-epicatechin}, dimers, trimers, tetramers constituted 9.65%,
60.0%, 6.38%, and 15.9% of soluble-ester phenolic compounds, respectively. The PAC monomer
{(+)-catechin} and dimers are primary phenolics released from glycosides and account for 31.7%
and 59.1% of total glycoside-bound phenolic compounds.
It should be noted that the quantification can be easily affected by many factors involved in
the details of the extraction and fractionation protocols selected. As for flavonoids, strong acid
hydrolysis may degrade unstable aglycones, while on the other hand, some of the cell wall-bound
glycosides may not be hydrolyzed completely yielding inconsistent results (Hertog, Peter,
Hollman, & Venema, 1992; Nuutila, Kammiovirta & Oksman-Caldentey, 2002). The cleavage of
the C–C interflavan bond between monomeric flavan-3-ol constituents can result from severe
alkaline conditions (White, Howard, & Prior, 2010). This may possibly explain why a large
portion of PAC monomers and dimers were found in the profile of soluble-ester and
glycoside-bound phenolic compounds. According to our MS data, there are also a number of
fragments resulting from PACs containing an additional phloroglucinol unit due to heat and/or
acid treatment, which would lead to underestimation of their quantity. PACs can be modified by
thermal treatment. Yu et al. (2006) reported a significant influence of the skin removal methods
on the PACs content of PS. Dry heat, like that imparted during blanching of red-skin peanuts,
would increase A-type dimers and B-type trimers compared to directly peeled PS due to
monomeric polymerization or the degradation of trimers and tetramers.

232
6.4 Conclusions
In conclusion, a large variety of compounds were liberated from soluble esters and
glycosides in PS. They were further separated and detected by HPLC-ESI-MSn. Compounds
identified included PACs (monomers to tetramers), free phenolic acids (e.g., hydroxybenzoic
acids and trans-cinnamic acids), stilbenes, and flavonoids. To our knowledge this is the first
reporting of PACs in PS containing an additional phloroglucinol unit. Although further analytical
techniques are required for the final confirmation of some of the compounds identified, our data
enriches the phenolic database of PS and perhaps provides a justification as to why PS might be
considered as a valuable functional food ingredient.
Acknowledgements
This research was supported by a grant funded by the Georgia Food Industry Partnership and
is greatly appreciated. Use of the Proteomics and Mass Spectrometry (PAMS) core facility under
the direction of Dr. Dennis Phillips of UGA’s Department of Chemistry is acknowledged. Thanks
are also extended to Bill Paulk at Sylvester Blanching, a division of Universal Blanchers, LLC,
for the dry-blanched PS and John T. Powell, President of the Peanut Institute Inc., Albany, GA.
References
Amarowicz R.; Troszyńska A.; Baryłko-Pikielna N.; Shahidi F. Polyphenolics extracts from
legume seeds: correlation between total antioxidant activity, total phenolics content, tannins
content and astringency. J. Food Lipids. 2004, 11, 278–286.
Amarowicz, R.; Weidner, S. Content of phenolic acids in rye caryopses determined using
DAD-HPLC method. Czech. J. Food Sci. 2001, 19, 201−205.

233
Appeldoorn, M. M.; Vincken, J. P.; Sanders, M.; Hollman, P. C. H.; Gruppen, H. Combined
normal-phase and reversed-phase liquid chromatography/ESI-MS as a tool to determine the
molecular diversity of A-type procyanidins in peanut skins. J. Agric. Food Chem. 2009, 57,
6007–6013.
Arranz, S.; Saura-Calixto, F.; Shaha, S.; Kroon, P. High contents of nonextractable polyphenols
in fruits suggest that polyphenol contents of plant foods have been underestimated. J. Agric.
Food Chem. 2009, 57, 7298–7303.
Brad, K.; Chen, C. Physicochemical properties of diosmetin and lecithin complex. Trop J Pharm
Res. 2013, 12, 453–456.
Bravo, L. Polyphenols: Chemistry, dietary sources, metabolism, and nutritional significance. Nutr.
Rev. 1998, 56, 317–333.
Bravo, M. N.; Silva, S.; Coelho, A. V.; Boas, L. V.; Bronze, M. R. Analysis of phenolic
compounds in Muscatel wines produced in Portugal. Anal. Chim. Acta. 2006, 563, 84–92.
Chukwumah, Y. C.; Walker, L. T.; Verghese, M.; Bokanga, M.; Ogutu, S.; Alphonse, K.
Comparison of extraction methods for the quantification of selected phytochemicals in
peanuts (Arachis hypogaea). J. Agric. Food Chem. 2007, 55, 285–290.
Crozier, A.; Jaganath, I. B.; Clifford, M. N. Dietary phenolics: chemistry, bioavailability and
effects on health. Nat. Prod. Rep. 2009, 26, 1001–1043.
Cuyckens, F.; Claeys, M. Mass spectrometry in the structural analysis of flavonoids. J. Mass
Spectrom. 2004, 39, 1–15.
Fabre, N.; Rustan, I.; de Hoffmann, E.; Quetin-Leclercq, J. Determination of flavone, flavonol
and flavanone aglycones by negative ion LC–ES ion trap mass spectrometry. J. Am. Soc.
Mass Spectrom. 2001, 12, 707–715.

234
Foo, L. Y.; Lu, Y.; Howell, A.; Vorsa, N. The structure of cranberry proanthocyanidins which
inhibit adherence of uropathogenic P-fimbriated Escherichia coli in vitro. Phytochemistry.
2000, 54, 173−181.
Gu, L.; Kelm, M. A.; Hammerstone, J. F.; Beecher, G.; Holden, J.; Haytowitz, D.; Prior, R. L.
Screening of foods containing proanthocyanidins and their structural characterization using
LC-MS/MS and thiolytic degradation. J. Agric. Food Chem. 2003a, 51, 7513−7521.
Gu, L.; Kelm, M. A.; Hammerstone, J. F.; Zhang, Z.; Beecher, G.; Holden, J.; Haytowitz, D.;
Prior, R. L. Liquid chromatographic/electrospray ionization mass spectrometric studies of
proanthocyanidins in foods. J. Mass Spectrom. 2003b, 38, 1272–1280.
Hartley, R. D.; Morrison, W. H.; Himmelsbach, D. S.; Borneman, W. S. Cross-linking of cell
wall phenolic arabinoxylans in graminaceous plants. Phytochemistry, 1990, 29, 3705–3709.
Hertog, M. G. L.; Hollman, P. C. H.; Venema, D. P. Optimization of a quantitative HPLC
determination of potentially anticarcinogenic flavonoids in vegetables and fruits. J. Agric.
Food Chem. 1992, 40, 1591–1598.
Hollman, P. C. H.; Arts, I. C. W. Flavonols, flavones and flavanols—nature, occurrence and
dietary burden. J. Food. Sci. Agric. 2000, 80, 1081–1093.
Huang, S. C.; Yen, G. C.; Chang, L. W.; Yen, W. J.; Duh, P. D. Identification of an antioxidant,
ethyl protocatechuate, in peanut seed testa. J. Agric. Food Chem. 2003, 51, 2380–2383.
Justesen U. Collision-induced fragmentation of deprotonated methoxylated flavonoids, obtained
by electrospray ionization mass spectrometry. J. Mass Spectrom. 2001, 36, 169–178.
Justesen, U. Negative atmospheric pressure chemical ionization low-energy collision activation
mass spectrometry for the characterization of flavonoids in extracts of fresh herbs. J.
Chromatogr. A. 2000, 902, 369−379.

235
Kang, J.; Hick, L. A.; Price, W. E. A fragmentation study of isoflavones in negative electrospray
ionization by MSn ion trap mass spectrometry and triple quadrupole mass spectrometry.
Rapid Commun. Mass Spectrom. 2007, 21, 857–868.
Karchesy, J. J.; Hemingway, R. W. Condensed tannins: (4β→8; 2β→O→7)-linked procyanidins
in Arachis hypogea L. J. Agric. Food Chem. 1986, 34, 966–970.
King, A.; Young, G. Characteristics and occurrence of phenolic phytochemicals. J. Am. Diet.
Assoc. 1999, 99, 213–218.
Ku, K. L.; Chang, P. S.; Cheng, Y. C.; Lien, C. Y. Production of stilbenoids from the callus of
Arachis hypogaea: a novel source of the anticancer compound piceatannol. J. Agric. Food
Chem. 2005, 53, 3877–3881.
Lou, H.; Yuan, H.; Yamazaki, Y.; Sasaki, T.; Oka, S. Alkaloids and flavonoids from peanut skins.
Planta Med. 2001, 67, 345–349.
Ma, Y.; Kosińska-Cagnazzo, A.; Kerr, W. L.; Amarowicz, R.; Swanson, R. B.; Pegg, R. B.
Separation and characterization of phenolic compounds from dry-blanched peanut skins by
liquid chromatography-electrospray ionization mass spectrometry. J. Chromatogr A. 2014,
Accepted.
Merken, H. M.; Beecher, G. R. Measurement of food flavonoids by high-performance liquid
chromatography. J. Agric. Food Chem. 2000, 48, 577–599.
Miketova, P.; Schram, K.; Whitney, J.; Li, M.; Huang, R.; Klohr, S. et al. Tandem mass
spectrometry studies of green tea catechins. Identification of three minor components in the
polyphenolic extract of green tea. J. Mass Spectrom. 2000, 35, 860–869.
Monagas, M.; Garrido, I.; Aguilar, R. L.; Cordoves, M. C. G.; Rybarczyk, A.; Amarowicz, R.;
Bartome, B. Comparative flavon-3-ol profile and antioxidant capacity of roasted peanut,

236
hazelnut, and almond skins. J. Agric. Food Chem. 2009, 57, 10590– 10599.
Nuutila, A. M.; Kammiovirta, K.; Oksman-Caldentey, K. M. Comparison of methods for the
hydrolysis of flavonoids and phenolic acids from onion and spinach for HPLC analysis.
Food Chem. 2002, 76, 519-525.
Pinelo, M.; Arnous, A.; Meyer, A. Upgrading of grape skins: Significance of plant cell-wall
structural components and extraction techniques for phenol release. Trends Food Sci Tech,
2006, 17, 579–590.
Robbins, R. J. Phenolic acids in foods: an overview of analytical methodology. J. Agric. Food
Chem. 2003, 51, 2866–2887.
Sarnoski, P. J; Johnson, J. V.; Reed, K. A.; Tanko, J. M.; O’Keefe, S. F. Separation and
characterization of proanthocyanidins in Virginia type peanut skins by LC-MSn. Food Chem.
2012, 131, 927–939.
Skoula, M.; Grayer, R. J.; Kite, G. C.; Veitch, N. C. Exudate flavones and flavanones in
Origanum species and their interspecific variation. Biochem. Syst. Ecol. 2008, 36, 646–654.
Stella, L.; De Rosso, M.; Panighel, A.; Vedova, A. D.; Flamini, R.; Traldi, P. Collisionally
induced fragmentation of [M – H]– species of resveratrol and piceatannol investigated by
deuterium labelling and accurate mass measurements. Rapid Commun. Mass Spectrom. 2008,
22, 3867–3872.
Wang, M. I.; Gillaspie, A. G.; Morris, J. B.; Pittman, R. N.; Davis J.; Pederson, G. A. Flavonoid
content in different legume germplasm seeds quantified by HPLC. Plant Genetic Resources:
Characterization and Utilization, 2008, 6, 62–69.
Weidner, S.; Amarowicz, R.; Karamać, M.; Dąborwski, G. Phenolic acids in caryopses of two
cultivars of wheat, rye and triticale that display different resistance to pre-harvest sprouting.

237
Eur Food Res Technol. 1999, 210, 109–113.
White, B. L.; Howard, R. L.; Prior, R. L. Release of bound procyanidins from cranberry pomace
by alkaline hydrolysis. J. Agric. Food Chem. 2010, 58, 7572– 7579.
Yu, J.; Ahmedna, M.; Goktepe, I. Effects of processing methods and extraction solvents on
concentration and antioxidant activity of peanut skin phenolics. Food Chem. 2005, 90,
199–206.
Yu, J.; Ahmedna, M.; Goktepe, I.; Dai, J. Peanut skin procyanidins: composition and antioxidant
activities as affected by processing. J. Food. Compos. Anal. 2006, 19, 364–371.

238
Table 6.1 Tentative identification of phenolic compounds in dry-blanched peanut skins (PS) crude extracts (CE) by C18 RP-HPLC-ESI-MS2. Cmpd No. Tentative identificationa
tRb
(min) [M – H]‾ [M – H]2‾/2 Product ionsc CE-1-1 PAC A-type trimer [(E)C→B→(E)C→A→(E)C] 3.6 863 737, 711, 693, 575, 559, 449,
287 CE-1-2 PAC A-type trimer [(E)C→B→(E)C→B→(E)C] 3.7 865 739, 713, 695, 577, 575, 451,
287 CE-1-3 PAC A-type trimer [(E)C→B→(E)C→A→(E)C] 3.8 863 711, 693, 575, 559, 287 CE-1-4 PAC A-type trimer [(E)C→A→(E)C→B→(E)C] 3.8 863 711, 693, 573, 451, 411, 289 CE-1-5 PAC A-type pentamer
[(E)C→B→(E)C→B→(E)C→A→(E)C→B→(E)C] 3.9 1439 719 863, 575, 573
CE-1-6 PAC B-type dimer [(E)C→B→(E)C] 11.6 577 559, 451, 425, 407, 289, 287 CE-1-7 PAC A-type trimer [(E)C→B→(E)C→A→(E)C] 14.6 863 845, 711, 693, 575, 559, 449,
287 CE-1-8 PAC A-type trimer [(E)C→A→(E)C→B→(E)C] 14.6 863 711, 693, 451, 411, 289 CE-1-9 PAC A-type trimer [(E)C→A→(E)C→B→(E)C] 16.2 863 711, 693, 573, 531, 451, 411,
289 CE-1-10 PAC B-type dimer [(E)C→B→(E)C] 19.3 577 559, 451, 425, 407, 289, 287 CE-1-11 PAC A-type trimer [(E)C→B→(E)C→A→(E)C] 20.9 863 845, 737, 711, 693, 575, 559,
449, 287 CE-1-12 PAC A-type trimer [(E)C→A→(E)C→B→(E)C] 20.9 863 737, 711, 693, 573, 411, 289 CE-1-13 PAC A-type dimer [(E)C→A→(E)C] 21.0 575 557, 539, 449, 423, 407, 289,
285 CE-1-14 PAC A-type pentamer 21.2 1439 719 863, 575, 573, 287 [(E)C→B→(E)C→B→(E)C→A→(E)C→B→(E)C] CE-1-15 PAC A-type pentamer 21.3 1439 719 861, 577, 575, 287 [(E)C→B→(E)C→A→(E)C→B→(E)C→B→(E)C] CE-1-16 PAC A-type tetramer 21.5 1149 574 997, 859 [(E)C→A→(E)C→A→(E)C→B→(E)C] CE-1-17 PAC A-type dimer [(E)C→A→(E)C] 22.1 575 557, 539, 449, 423, 407, 289,

239
285 CE-1-18 PAC A-type trimer [(E)C→B→(E)C→A→(E)C] 22.5 863 711, 693, 575, 559, 449, 287 CE-1-19 PAC A-type trimer [(E)C→A→(E)C→B→(E)C] 22.5 863 711, 693, 573, 531, 451, 411,
289 CE-1-20 PAC A-type tetramer 24.7 1149 574 997, 861 [(E)C→B→(E)C→A→(E)C→A→(E)C] CE-1-21 PAC A-type dimer [(E)C→A→(E)C] 25.2 575 557, 539, 449, 423, 289, 285 CE-1-22 PAC A-type trimer [(E)C→B→(E)C→A→(E)C] 25.7 863 737, 711, 693, 575, 559, 449,
287 CE-1-23 PAC A-type trimer [(E)C→A→(E)C→B→(E)C] 26.1 863 737, 711, 693, 573, 531, 451,
411, 289 CE-1-24 PAC A-type dimer [(E)C→A→(E)C] 27.4 575 449, 423, 289, 285 CE-1-25 316-Da flavonoid such as Isorhamnetin + rutinoside
sugar side-group 27.7 623 356, 315, 300, 271, 255
MS3 [315→300]: 300, 271, 151
CE-1-26 PAC A-type dimer [(E)C→A→(E)C] 28.4 575 557, 539, 449, 423, 407, 289, 285
CE-1-27 PAC A-type dimer [(E)C→A→(E)C] 29.6 575 557, 539, 449, 423, 407, 289, 285
aThe A represents an A-type bond with both (C4→C8) and (C2→O→C7) linkages or (C4→C6) and (C2→O→C7) linkages, B represents a B-type bond which can be (C4→C8) or (C4→C6) linkage; (E)C represents (epi)catechin. bRetention times (tR) of the total ion chromatograms. cThe most abundant ions observed in the mass spectra are indicated in bold; quinone methide (QM) fission diagnostic ions are underlined.
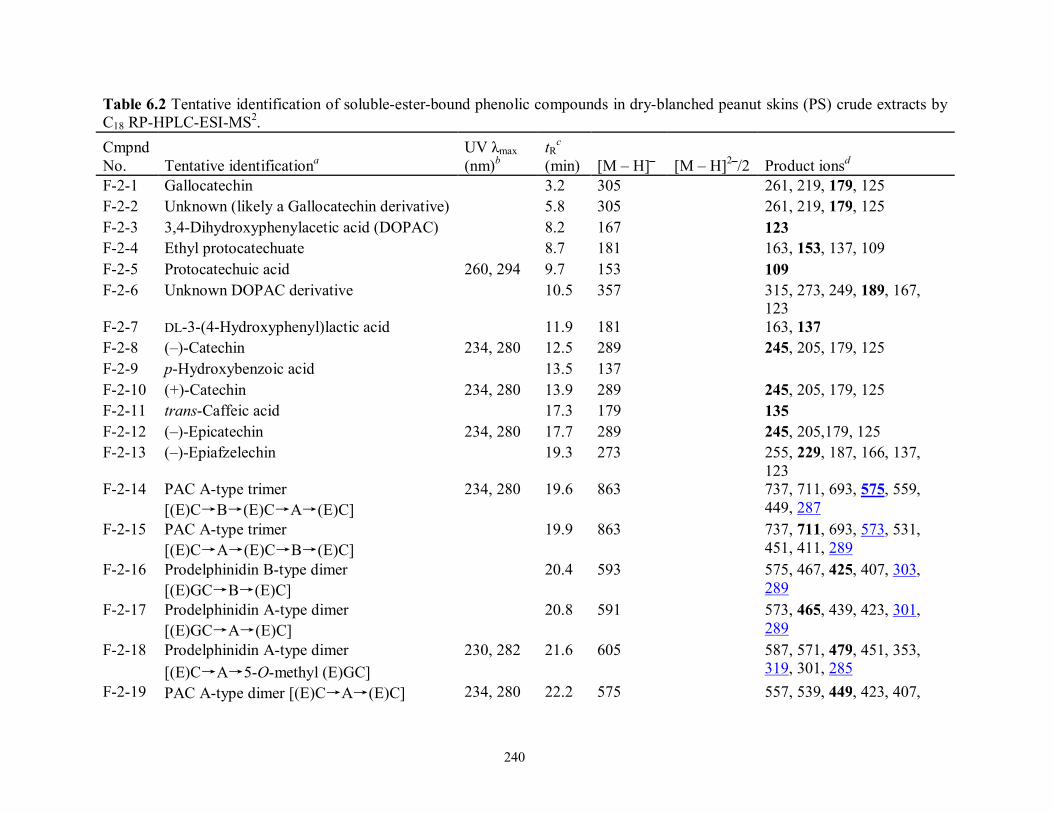
240
Table 6.2 Tentative identification of soluble-ester-bound phenolic compounds in dry-blanched peanut skins (PS) crude extracts by C18 RP-HPLC-ESI-MS2. Cmpnd No. Tentative identificationa
UV λmax (nm)b
tRc
(min) [M – H]‾ [M – H]2‾/2 Product ionsd F-2-1 Gallocatechin 3.2 305 261, 219, 179, 125 F-2-2 Unknown (likely a Gallocatechin derivative) 5.8 305 261, 219, 179, 125 F-2-3 3,4-Dihydroxyphenylacetic acid (DOPAC) 8.2 167 123 F-2-4 Ethyl protocatechuate 8.7 181 163, 153, 137, 109 F-2-5 Protocatechuic acid 260, 294 9.7 153 109 F-2-6 Unknown DOPAC derivative 10.5 357 315, 273, 249, 189, 167,
123 F-2-7 DL-3-(4-Hydroxyphenyl)lactic acid 11.9 181 163, 137 F-2-8 (–)-Catechin 234, 280 12.5 289 245, 205, 179, 125 F-2-9 p-Hydroxybenzoic acid 13.5 137 F-2-10 (+)-Catechin 234, 280 13.9 289 245, 205, 179, 125 F-2-11 trans-Caffeic acid 17.3 179 135 F-2-12 (–)-Epicatechin 234, 280 17.7 289 245, 205,179, 125 F-2-13 (–)-Epiafzelechin 19.3 273 255, 229, 187, 166, 137,
123 F-2-14 PAC A-type trimer 234, 280 19.6 863 737, 711, 693, 575, 559,
449, 287 [(E)C→B→(E)C→A→(E)C] F-2-15 PAC A-type trimer 19.9 863 737, 711, 693, 573, 531,
451, 411, 289 [(E)C→A→(E)C→B→(E)C] F-2-16 Prodelphinidin B-type dimer 20.4 593 575, 467, 425, 407, 303,
289 [(E)GC→B→(E)C] F-2-17 Prodelphinidin A-type dimer 20.8 591 573, 465, 439, 423, 301,
289 [(E)GC→A→(E)C] F-2-18 Prodelphinidin A-type dimer 230, 282 21.6 605 587, 571, 479, 451, 353,
319, 301, 285 [(E)C→A→5-O-methyl (E)GC] F-2-19 PAC A-type dimer [(E)C→A→(E)C] 234, 280 22.2 575 557, 539, 449, 423, 407,

241
289, 285 F-2-20 PAC B-type dimer [(E)C→B→(E)C] 22.6 577 559, 451, 425, 407, 289,
287 F-2-21 PAC A-type dimer [(E)C→A→(E)C] 234, 280 22.9 575 557, 539, 449, 423, 407,
289, 285 F-2-22 p-Coumaric acid 234, 310 23.2 163 119 F-2-23 Prodelphinidin A-type dimer 23.2 591 573, 465, 423, 305, 285
[(E)C→A→(E)GC] F-2-24 trans-Piceatannol 24.2 243 243, 215, 225, 201, 199,
175, 173, 159 F-2-25 Ferulic acid 238,
292sh,322 26.0 193 178, 149, 134
F-2-26 PAC A-type dimer [(E)C→A→(E)C] 234, 280 26.3 575 557, 539, 449, 423, 407, 289, 285
F-2-27 PAC A-type dimer [(E)C→A→(E)C] 234, 280 27.6 575 557, 539, 449, 423, 407, 289, 285
F-2-28 PAC A-type dimer [(E)C→A→(E)C] 234, 280 28.3 575 557, 539, 449, 423, 407, 289, 285
F-2-29 PAC A-type trimer 234, 280 28.8 863 737, 711, 693, 575, 559, 449, 287 [(E)C→B→(E)C→A→(E)C]
F-2-30 PAC A-type dimer [(E)C→A→(E)C] 234, 280 28.9 575 557, 539, 449, 423, 407, 289, 285
F-2-31 PAC A-type dimer [(E)C→A→(E)C] 234, 280 29.7 575 557, 539, 449, 423, 407, 289, 285
F-2-32 PAC A-type tetramer [1B, 2A] 234, 280 30.9 1149 574 F-2-33 PAC A-type trimer 234, 280 31.8 863 845, 737, 711, 693, 575,
449, 287 [(E)C→B→(E)C→A→(E)C] F-2-34 Prodelphinidin A-type trimer
[(E)GC→A→(E)C→A→(E)C] 32.1 877 859, 841, 751, 725, 599,
587, 575, 559, 461, 449, 301, 289
F-2-35 Propelargonidin A-type dimer [(E)C→A→(E)Afz]
32.1 559 541, 433, 423, 391, 285, 273

242
F-2-36 PAC A-type trimer 234, 280 32.2 863 737, 711, 693, 575, 559, 449, 287 [(E)C→B→(E)C→A→(E)C]
F-2-37 Myricetin 32.3 317 317, 271, 243, 227, 179, 151, 137, 109
F-2-38 PAC A-type tetramer [1B, 2A] 234, 280 33.2 1149 574 F-2-39 PAC A-type tetramer [1B, 2A] 234, 280 34.2 1149 574 F-2-40 PAC A-type trimer 34.2 875 857, 749, 723, 597, 555,
301 [(E)C→B→(E)GC→A→Luteolin or Kaempferol]
F-2-41 Prodelphinidin A-type dimer 34.3 607 [(E)C→B→methyl (E)GC] or [(E)GC→A→(E)GC]
F-2-42 PAC A-type trimer 234, 280 34.5 861 843, 825, 735, 709, 693, 575, 571, 449, 289, 285 [(E)C→A→(E)C→A→(E)C]
F-2-43 PAC A-type tetramer [1B, 2A] 34.6 1149 574 F-2-44 PAC A-type trimer 34.9 863 737, 711, 693, 575, 559,
449, 287 [(E)C→B→(E)C→A→(E)C] F-2-45 PAC A-type trimer 35.0 863 737, 711, 693, 573, 531,
451, 411, 289 [(E)C→A→(E)C→B→(E)C] F-2-46 PAC A-type tetramer [1B, 2A] 234, 280 35.4 1149 574 F-2-47 PAC A-type trimer 35.6 1015 507
[(E)C→A→(E)C→A→(E)CG] F-2-48 Prodelphinidin A-type tetramer
[(E)C→A→(E)GC→A→(E)C→A→(E)C] 234, 280 37.4 1163 581 877, 873, 751, 575, 449,
411, 289, 285 aThe A represents an A-type bond with both (C4→C8) and (C2→O→C7) linkages or (C4→C6) and (C2→O→C7) linkages, B represents a B-type bond which can be (C4→C8) or (C4→C6) linkage; (E)C represents (epi)catechin, (E)GC represents (epi)gallocatechin, (E)CG represents (epi)catechin gallate, and (E)Afz represents (epi)afzelechin. bsh, shoulder in the spectrum. cRetention times (tR) of the total ion chromatograms. dThe most abundant ions observed in the mass spectra are indicated in bold; quinone methide (QM) fission diagnostic ions are underlined.

243
Table 6.3 Tentative identification of glycoside-bound phenolic compounds in dry-blanched peanut skins (PS) crude extracts by C18 RP-HPLC-ESI-MSn. Cmpnd No. Tentative identificationa
UV λmax (nm)b
tRc
(min) [M – H]‾ Product ionsd F-3-1 Gallocatechin 3.2 305 261, 219, 179, 125 F-3-2 Unknown (likely a Gallocatechin derivative) 5.8 305 261, 219, 179, 125 F-3-3 3,4-Dihydroxyphenylacetic acid (DOPAC) 8.2 167 123 F-3-4 Methyl gallate 9.4 183 124 F-3-5 Protocatechuic acid 260, 294 9.7 153 109 F-3-6 Protocatechuic acid derivative 9.8 233 213, 203, 167, 153, 123, 109 F-3-7 Robinetin 12.8 301 301, 283, 257, 229, 163, 137 F-3-8 p-Hydroxybenzoic acid 256 13.1 137 F-3-9 (+)-Catechin 234, 280 13.8 289 245, 205, 179, 125 F-3-10 PAC A-type dimer [(E)C→A→(E)C→Phloroglucinol] 15.9 699 681, 573, 547, 531, 453, 411,
287, 285 MS3[699→411]: 411, 349, 301, 285, 257, 243, 215, 189, 163, 149, 125
F-3-11 Vanillic acid 260, 292 16.1 167 152, 123, 108 F-3-12 PAC A-type dimer [(E)C→A→(E)C→Phloroglucinol] 238, 278 16.7 699 681, 573, 547, 531, 453, 411,
285, 245 F-3-13 PAC B-type dimer [(E)C→B→(E)C→Phloroglucinol] 17.1 701 411, 289, 245 MS3[701→411]: 393, 383,
341, 307, 283, 242 F-3-14 (–)-Epicatechin 17.3 289 245, 205, 179, 125 F-3-15 PAC A-type dimer [(E)C→A→(E)C→Phloroglucinol] 238, 278 17.6 699 681, 573, 531, 453, 411, 287,
285, 245 F-3-16 PAC B-type dimer [(E)C→B→(E)C→Phloroglucinol] 17.9 701 411, 289, 245 F-3-17 PAC A-type dimer [(E)C→A→(E)C→Phloroglucinol] 238, 278 18.6 699 681, 573, 531, 453, 411, 287,
285, 245 F-3-18 PAC A-type dimer [(E)C→A→(E)C→Phloroglucinol] 238, 278 19.5 699 681, 573, 531, 453, 411, 287,

244
285, 245 F-3-19 PAC B-type dimer [(E)C→B→(E)C→Phloroglucinol] 20.3 701 411, 289, 245 F-3-20 PAC A-type dimer [(E)C→A→(E)C→Phloroglucinol] 238, 278 20.6 699 681, 573, 531, 453, 411, 287,
285, 245 F-3-21 PAC A-type dimer [(E)C→A→(E)C] 234, 280 20.8 575 557, 539, 449, 423, 407, 289,
285 F-3-22 Homovanillic acid 20.8 181 137, 122 F-3-23 PAC A-type dimer [(E)C→A→(E)C] 234, 280 21.7 575 557, 539, 449, 423, 407, 289,
285 F-3-24 Propelargonidin A-type trimer 22.2 847 711, 557, 435, 411, 289 [(E)C→A→(E)Afz→B→(E)C] F-3-25 PAC A-type dimer [(E)C→A→(E)C→Phloroglucinol] 238, 278 24.3 699 681, 573, 531, 453, 411, 287,
285, 245 F-3-26 PAC A-type dimer [(E)C→A→(E)C→Phloroglucinol] 238, 278 24.9 699 681, 573, 531, 453, 411, 287,
285, 245 F-3-27 PAC A-type dimer [(E)C→A→(E)C] 25 575 557, 539, 449, 423, 407, 289,
285 F-3-28 PAC A-type dimer 25.2 657 597, 547, 531, 411, 285, 245 [(E)C→A→(E)C→Phloroglucinol] – C2H2O (42 Da) F-3-29 PAC A-type dimer 25.8 657 597, 547, 531, 411, 285, 245 [(E)C→A→(E)C→Phloroglucinol] – C2H2O (42 Da) F-3-30 Taxifolin 26.2 303 303, 285, 257, 177, 125 F-3-31 PAC A-type dimer
[(E)C→A→(E)C→Phloroglucinol] – C2H2O (42 Da) 26.3 657 597, 547, 531, 411, 245
F-3-32 PAC A-type dimer [(E)C→A→(E)C] 234, 280 26.5 575 557, 539, 449, 423, 407, 289, 285
F-3-33 PAC A-type dimer 26.6 547 531, 437, 423, 411, 285, 245 [(E)C→A→(E)C→Phloroglucinol] – C8H8O3 (152 Da) F-3-34 PAC A-type dimer
[(E)C→A→(E)Afz→Phloroglucinol] 27.0 683 665, 647, 557, 515, 423, 411,
397, 285 MS3[683→557]: 539, 421,
395, 285, 271

245
F-3-35 PAC A-type dimer [(E)C→A→(E)C] 234, 280 27.5 575 557, 539, 449, 423, 407, 289, 285
F-3-36 PAC A-type dimer [(E)C→A→(E)C] 234, 280 28.2 575 557, 539, 449, 423, 407, 289, 285
F-3-37 PAC A-type dimer [(E)C→A→(E)C→Phloroglucinol] 238, 278 28.4 699 681, 573, 531, 453, 411, 287, 285, 245
F-3-38 PAC A-type dimer [(E)C→A→a novel Flavan-3-ol] 28.5 589 571, 553, 463, 453, 409, 303, 285
MS3[589→453]: 409, 367, 344, 327, 303, 176, 165
F-3-39 PAC A-type dimer [(E)C→A→(E)C→Phloroglucinol] – C8H8O4 (168 Da)
30.1 531 513, 499, 405, 393, 363, 309, 285, 245
F-3-40 PAC A-type dimer [(E)C→A→(E)C] 234, 280 30.3 575 557, 539, 449, 423, 407, 289, 285
F-3-41 PAC A-type dimer [(E)C→A→(E)Afz→Phloroglucinol]
31.1 683 665, 647, 557, 515, 423, 411, 397, 285
F-3-42 PAC A-type dimer 32.2 549 531, 489, 423, 411, 285 [(E)C→B→(E)C→Phloroglucinol] – C8H8O3 (152 Da) F-3-43 Fisetin 248, 362 32.2 285 285, 257, 241, 229, 213, 177,
163, 135, 121 F-3-44 PAC A-type dimer
[(E)C→A→(E)C→Phloroglucinol] – C8H8O4 (168 Da) 32.4 531 513, 499, 405, 393, 363, 309,
285, 245 F-3-45 PAC A-type dimer 32.6 557 539, 431, 389, 285 [(E)C→A→(E)Afz→Phloroglucinol] – C6H6O3 (126 Da) F-3-46 Biflavonoid [Eriodictyol→C-methyl (Epi)robinetinidol] 33.4 587 569, 461, 419, 301, 285 MS3[587→461]: 443, 339,
324, 301, 285, 293, 198 F-3-47 PAC A-type dimer 33.5 549 531, 489, 423, 411, 285 [(E)C→B→(E)C→Phloroglucinol] – C8H8O3 (152 Da) F-3-48 PAC A-type dimer
[(E)C→A→(E)C→Phloroglucinol] – C8H8O4 (168 Da) 33.9 531 513, 499, 405, 393, 363, 309,
285, 245

246
F-3-49 Myricetin 34.1 317 317, 289, 271, 191, 179, 151, 137, 125
F-3-50 PAC A-type dimer [(E)C→A→(E)C→Phloroglucinol] – C8H8O3 (152 Da)
34.2 547 527, 489, 437, 421, 360, 302, 245, 177
F-3-51 PAC A-type dimer [(E)C→A→(E)C→Phloroglucinol] – C8H8O4 (168 Da)
34.3 531 469, 405, 393, 363, 309, 285, 245
F-3-52 propelargonidin A-type trimer 34.4 845 719, 693, 575, 555, 449, 433, 289, 269 [(E)Afz→A→(E)C→A→(E)C]
F-3-53 4′,3′,5,6-Trihydroxy-7-methoxyflavone 35.6 315 315, 300, 232, 191 F-3-54 Genkwanin 338 37.2 283 268, 151 F-3-55 Prorobinetidin A-type dimer
[(E)C→A→C-methyl (Epi)robinetinidol] 37.5 589 571, 553, 463, 421, 303, 285
MS3[589→463]: 445, 435, 341, 301, 295, 285, 198
F-3-56 Biflavonoid [Eriodictyol→C-methyl (Epi)robinetinidol] 37.7 587 569, 551, 461, 447, 419, 301, 285 MS3[587→461]: 443, 301, 285, 293, 198
F-3-57 Prorobinetidin A-type dimer 38.1 589 571, 553, 463, 421, 303, 285 [(E)C→A→C-methyl (Epi)robinetinidol] F-3-58 Prodelphinidin A-type dimer 38.2 607 [(E)C→B→methyl (E)GC] or [(E)GC→A→(E)GC] F-3-59 Biflavonoid [Eriodictyol→C-methyl (Epi)robinetinidol] 38.3 587 569, 551, 461, 421, 301, 285 F-3-60 Biochanin A 38.5 283 268 MS3[283→268]: 267, 239,
224, 135 F-3-61 Isosakuranetin 38.9 285 285, 270, 243, 226, 199, 164,
136 F-3-62 Prorobinetidin A-type dimer 39.0 589 571, 553, 463, 421, 303, 285 [(E)C→A→C-methyl (Epi)robinetinidol] F-3-63 Quercetin 256, 370 39 301 301, 273, 257, 229, 179, 151,
107

247
F-3-64 Prorobinetidin A-type dimer 39.7 589 571, 553, 463, 421, 303, 285 [(E)C→A→C-methyl (Epi)robinetinidol] F-3-65 Hesperetin 40.4 301 301, 286, 283, 257, 242, 215,
164, 151, 125, 107 F-3-66 PAC A-type dimer 41.1 557 539, 521, 431, 389, 285 [(E)C→A→(E)Afz→phloroglucinol] – C6H6O3 (126 Da) F-3-67 Biflavonoid [Eriodictyol→C-methyl (Epi)robinetinidol] 41.4 587 569, 551, 461, 419, 301, 285 F-3-68 Prorobinetidin A-type dimer 41.7 589 571, 553, 463, 421, 303, 285 [(E)C→A→C-methyl (Epi)robinetinidol] F-3-69 PAC A-type dimer 42.7 557 539, 521, 431, 389, 285 [(E)C→A→(E)Afz→Phloroglucinol] – C6H6O3 (126 Da) F-3-70 trans-3,3′,5,5′-tetrahydroxy-4′-methoxystilbene 43.9 273 258, 163, 136, 109 F-3-71 Homoeriodictyol 44.4 301 301, 286, 151 F-3-72 Pratensein 45.6 299 284, 255, 177, 151, 122 F-3-73 Unknown 45.6 567 549, 505, 441, 399, 325, 285 F-3-74 3′,5,6-Trihydroxy-4′,7-dimethoxyflavone 46 329 314, 299, 191 F-3-75 Kaempferol 266,
326sh, 368
46.7 285 285, 257, 241, 229, 213, 199, 151
F-3-76 Luteolin methyl ether (Diosmetin) 254sh, 266, 348
47.1 299 299, 284, 217
MS3 [299→284]: 284, 256, 216, 151
F-3-77 Quercetin methyl ether (Isorhamnetin) 256, 370 47.3 315 315, 300 MS3 [315→300]: 300, 271,
256, 151 F-3-78 3′,4′,5′-Trimethylrobinetin 49 343 328, 313, 299, 285, 135 aThe A represents an A-type bond with both (C4→C8) and (C2→O→C7) linkages or (C4→C6) and (C2→O→C7) linkages, B represents a B-type bond which can be (C4→C8) or (C4→C6) linkage; (E)C represents (epi)catechin, (E)GC represents (epi)gallocatechin, and (E)Afz represents (epi)afzelechin. bsh, shoulder in the spectrum.
248
cRetention times (tR) of the total ion chromatograms. dThe most abundant ions observed in mass spectra are indicated in bold; quinone methide (QM) fission diagnostic ions are underlined.

249
Table 6.4 Content of selected phenolics quantified in dry-blanched peanut skins (PS) by C18 RP-HPLC. Ester-bound phenolic compoundsa Quantification
λ(nm) Content (mg/100 g)b
Protocatechuic acid 260 41.4 ± 1.72 (+)-Catechin 280 52.0 ± 2.66 (–)-Epicatechin 280 8.33 ± 0.40 Prodelphinidin A-type dimer 280 22.2 ± 0.58 [(E)C→A→5-O-methyl (E)GC] PAC A-type dimer [(E)C→A→(E)C] 280 74.9 ± 2.84 p-Coumaric acid 320 6.88 ± 0.22 Ferulic acid 320 2.03 ± 0.12 PAC A-type dimer [(E)C→A→(E)C] 280 44.3 ± 3.32 PAC A-type dimer [(E)C→A→(E)C] 280 152 ± 7.09 PAC A-type dimer [(E)C→A→(E)C] 280 81.2 ± 1.74 PAC A-type tetramer [1B, 2A] 280 32.1 ± 2.03 PAC A-type tetramer [1B, 2A] 280 29.5 ± 0.86 PAC A-type trimer [(E)C→B→(E)C→A→(E)C]
280 15.2 ± 0.37
PAC A-type tetramer [1B, 2A] 280 10.2 ± 0.13 PAC A-type tetramer [1B, 2A] 280 15.1 ± 0.35 PAC A-type trimer [(E)C→A→(E)C→A→(E)C]
280 24.8 ± 0.75
PAC A-type tetramer [1B, 2A] 280 8.96 ± 0.56 Prodelphinidin tetramer 280 3.66 ± 0.13 [(E)C→A→(E)GC→A→(E)C→A→(E)C] Glycoside-bound phenolic compounds
Protocatechuic acid 260 21.5 ± 0.66 (+)-Catechin 280 105 ± 4. 57 p-Hydroxybenzoic acid 255 1.72 ± 0.00 Vanillic acid 260 2.38 ± 0.10 PAC A-type dimer [(E)C→A→(E)C→Phloroglucinol]
280 86.2 ± 6.55
PAC A-type dimer [(E)C→A→(E)C] 280 110 ± 1.27 Kaempferol 360 0.89 ± 0.67 Fisetin 360 0.75 ± 0.03 Genkwanin 320 0.08 ± 0.00 Quercetin 360 1.62 ± 0.12 Diosmetin 360 0.46 ± 0.00 Isorhamnetin 360 1.29 ± 0.00 aPACs are quantified as catechin equivalents; Fisetin, genkwanin, isorhamnetin and diosmetin are quantified using corresponding flavonoid aglycone equivalents. bValues are means of triplicate analyses ± standard deviation. Findings are reported as mg respective phenolic/100-g dry weight (d.w.) of dry-blanched PS.

250
Figure Captions
Figure 6.1 Structures of monomeric phenolic aglycones released from soluble-ester and
glycoside in dry-blanched peanut skins.
Figure 6.2 Tentative structures and fragmentation schemes of (A) Prodelphinidin A-type dimer
[(E)C→A→6-O-methyl (E)GC] (F-2-18, m/z 605); (B) Prodelphinidin A-type
trimer [(E)GC→A→(E)C→A→(E)C] (F-2-34, m/z 877); and (C) Prodelphinidin
A-type tetramer [(E)C→A→(E)GC→A→(E)C→A→(E)C] (F-2-48, m/z 1163). See
Table 6.3 for formal designations
Figure 6.3 Tentative structures and fragmentation schemes of (A) PAC B-type dimer
[(E)C→B→(E)C→Phloroglucinol] (F-3-13, 16, and 19, m/z 701); (B) PAC A-type
dimer [(E)C→A→(E)C→Phloroglucinol] (F-3-10, 12, 15, 17, 18, 20, 25, 26, and
38, m/z 699); and (C) PAC A-type dimer [(E)C→A→(E)Afz→Phloroglucinol]
(F-3-34 and 43, m/z 683). See Table 6.3 for formal designations
Figure 6.4 Tentative structures and fragmentation schemes of (A) PAC A-type dimer
[(E)C→A→a novel Flavan-3-ol] (F-3-39, m/z 589); (B) Prorobinetidin A-type
dimer [(E)C→A→C-methyl (Epi)robinetinidol] (F-3-56, 62, 64 and 68, m/z 589);
and (C) biflavonoid [Eriodictyol→C-methyl (Epi)robinetinidol] (F-3-48, 57 and 67,
m/z 587). See Table 6.3 for formal designations.

251
Figure 6.1
OHHOCH3Vanillic acidOH
HH
H
R2
OCH2CH3OHEthyl protocatechuate
OH
OH
H
R1
OCH3Methyl gallate
OHProtocatechuic acid
OHp-Hydroxybenzoic acid
R3Hydroxybenzoic acids
OHHOCH3Vanillic acidOH
HH
H
R2
OCH2CH3OHEthyl protocatechuate
OH
OH
H
R1
OCH3Methyl gallate
OHProtocatechuic acid
OHp-Hydroxybenzoic acid
R3Hydroxybenzoic acids
OCH3Ferulic acid
OHCaffeic acid
Hp-Coumaric acidR1Hydroxycinnamic acids
OCH3Ferulic acid
OHCaffeic acid
Hp-Coumaric acidR1Hydroxycinnamic acids
OH
HR1
OCH3trans-3,3',5,5'-tetrahydroxy-4'-methoxystilbene
OHtrans-PiceatannolR2Stilbenes
OH
HR1
OCH3trans-3,3',5,5'-tetrahydroxy-4'-methoxystilbene
OHtrans-PiceatannolR2Stilbenes
OHOCH3OHPratenseinOHOCH3HBiochanin A
R3R2R1Isoflavone
OHOCH3OHPratenseinOHOCH3HBiochanin A
R3R2R1Isoflavone
OCH3
H
R
Homovanillic acid
3,4-Dihydroxyphenylacetic acid (DOPAC)
Hydroxyphenylacetic acid
OCH3
H
R
Homovanillic acid
3,4-Dihydroxyphenylacetic acid (DOPAC)
Hydroxyphenylacetic acid
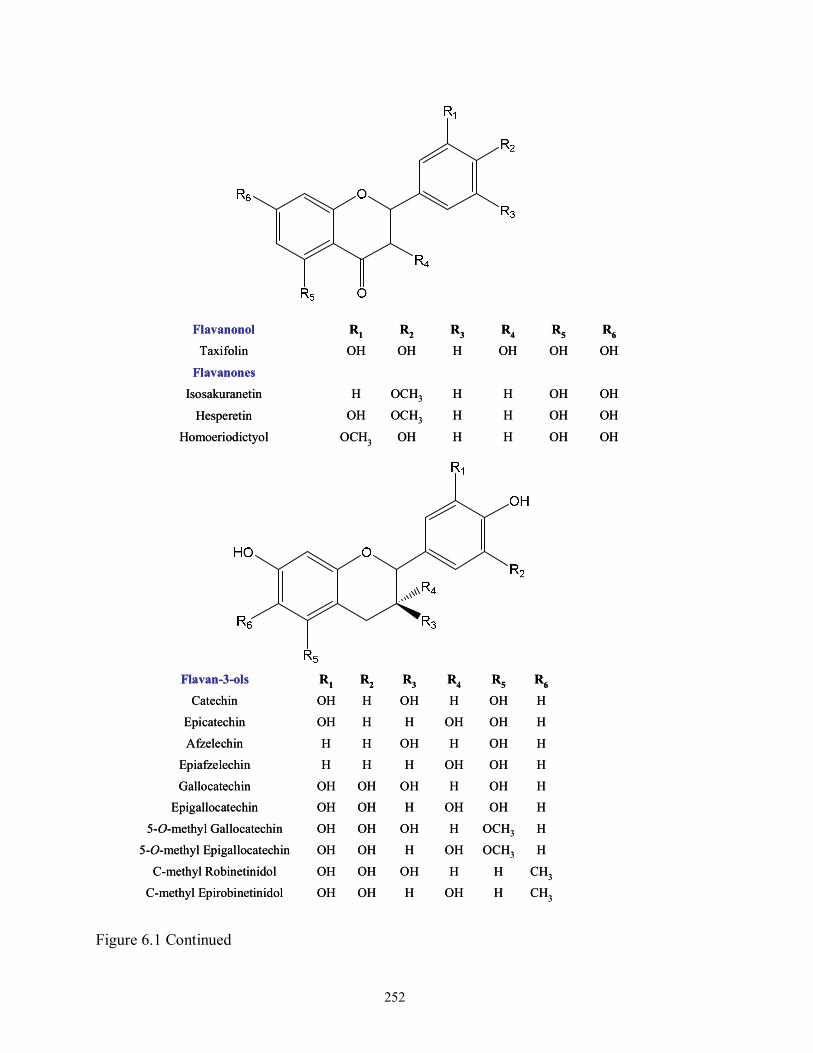
252
Figure 6.1 Continued
OHOHHHOCH3HIsosakuranetin
OHOHHHOCH3OHHesperetin
OHOHHHOHOCH3Homoeriodictyol
Flavanones
OHOHOHHOHOHTaxifolin
R6R5R4R3R2R1Flavanonol
OHOHHHOCH3HIsosakuranetin
OHOHHHOCH3OHHesperetin
OHOHHHOHOCH3Homoeriodictyol
Flavanones
OHOHOHHOHOHTaxifolin
R6R5R4R3R2R1Flavanonol
HOCH3HOHOHOH5-O-methyl Gallocatechin
HOCH3OHHOHOH5-O-methyl Epigallocatechin
CH3HOHHOHOHC-methyl Epirobinetinidol
CH3HHOHOHOHC-methyl Robinetinidol
HOHOHHOHOHEpigallocatechinHOHHOHOHOHGallocatechin
HOHOHHHHEpiafzelechin
HOHHOHHHAfzelechin
HOHOHHHOHEpicatechin
HOHHOHHOHCatechin
R6R5R4R3R2R1Flavan-3-ols

253
Figure 6.1 Continued
H
H
H
H
H
H
H
OH
OH
H
H
H
R6
OCH3OHHHOHHGenkwanin
OHHOHHOHOHFisetin
OHOHOHHOHHKaempferol
OCH3OHHHOHOH4',3',5,6-tetrahydroxy-7-methoxyflavone
OHHOHOCH3OCH3OCH3Robinetin 3’,4’,5’-trimethyl ether
OHHOHOHOHOHRobinetin
OHOHOHHOHOCH3Isoharmnetin
OHOHOHOHOHOHMyricetin
OHOHOHHOHOHQuercetin
FlavonolOCH3OHHHOCH3OH3',5,6-trihydroxy-4',7-dimethoxyflavone
OHOHHHOCH3OHDiosmetin
OHOHHHOHOHLuteolin
R7R5R4R3R2R1Flavone
H
H
H
H
H
H
H
OH
OH
H
H
H
R6
OCH3OHHHOHHGenkwanin
OHHOHHOHOHFisetin
OHOHOHHOHHKaempferol
OCH3OHHHOHOH4',3',5,6-tetrahydroxy-7-methoxyflavone
OHHOHOCH3OCH3OCH3Robinetin 3’,4’,5’-trimethyl ether
OHHOHOHOHOHRobinetin
OHOHOHHOHOCH3Isoharmnetin
OHOHOHOHOHOHMyricetin
OHOHOHHOHOHQuercetin
FlavonolOCH3OHHHOCH3OH3',5,6-trihydroxy-4',7-dimethoxyflavone
OHOHHHOCH3OHDiosmetin
OHOHHHOHOHLuteolin
R7R5R4R3R2R1Flavone

254
Figure 6.2 (A)
Mass-to-charge ratio (m/z)
Ion
sign
al in
tens
ity
0
10000
20000
30000
40000
50000
60000
587571
479
451
319
285[M - H - H2O]−
QM
QM
HRF
[0,2IIA]−
A

255
Figure 6.2 (B)
0
2000
4000
6000
8000
10000
12000
14000
16000
18000
Ion
sign
al in
tens
ity
Mass-to-charge ratio (m/z)
751
725575
449
301
289 859
587
599559
461QM
QM QM
QM
HRFI
RDA
[M - H - H2O]−
HRFII
B
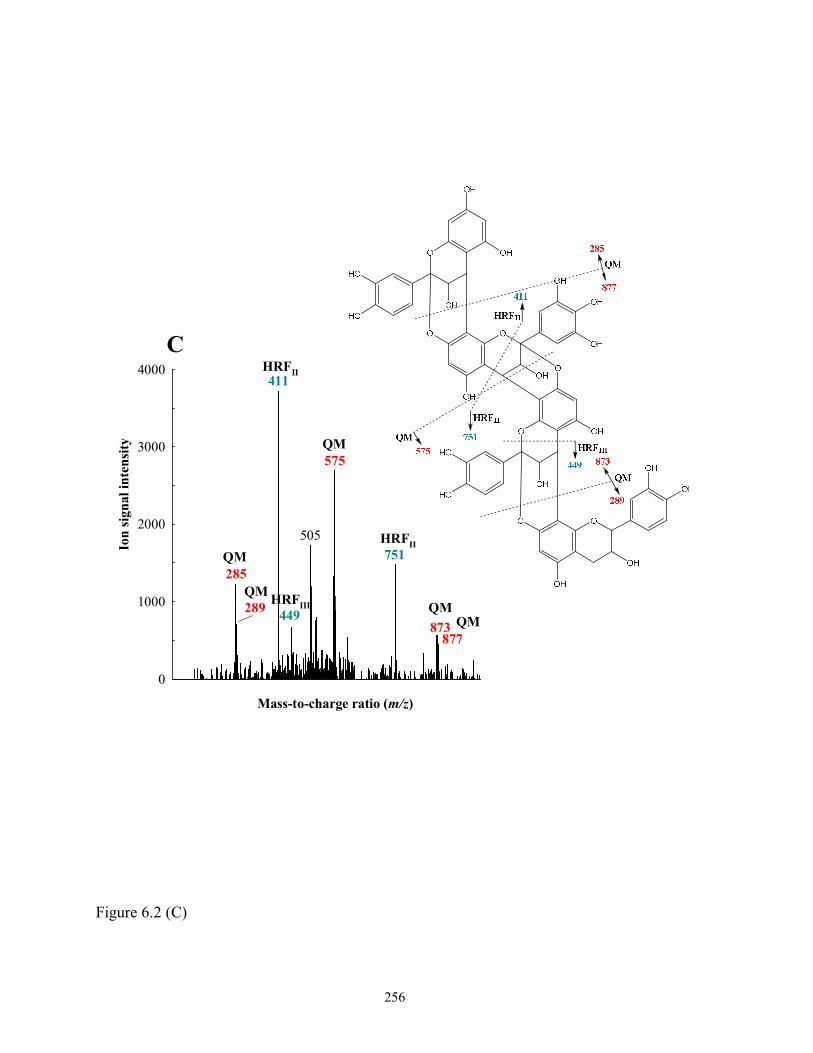
256
Figure 6.2 (C)
0
1000
2000
3000
4000
Ion
sign
al in
tens
ity
Mass-to-charge ratio (m/z)
873877
751
575
505
449
411
285
QM
QMQM
QM
289QM
HRFII
HRFII
HRFIII
C

257
Figure 6.3 (A)
0
2000
4000
6000
8000
10000
Ion
sign
al in
tens
ity
Mass-to-charge ratio (m/z)
681
573
453
411
285
245
547531
QM
HRFII
HRFI
RDA
[M - H - H2O]−
A

258
Figure 6.3 (B
0
10000
20000
30000
40000
50000
60000
289245
411
Ion
sign
al in
tens
ity
Mass-to-charge ratio (m/z)
B

259
Figure 6.3 (C)
0
1000
2000
3000
4000
5000
Ion
sign
al in
tens
ity
Mass-to-charge ratio (m/z)
647
557
515
423
397
361
285
259
665[M - H - H2O]−
HRFI
HRFI + RDA
QM
QM[M - H - C8H8O4]
−
411HRFII
C
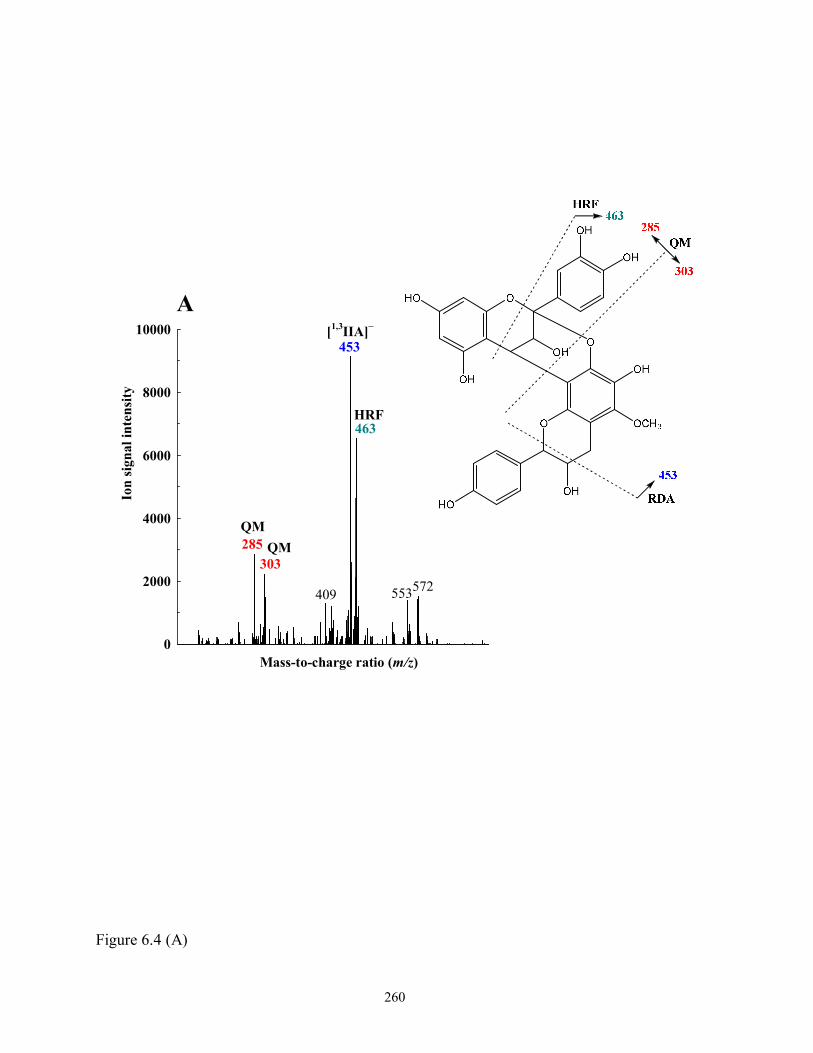
260
Figure 6.4 (A)
0
2000
4000
6000
8000
10000
Ion
sign
al in
tens
ity
Mass-to-charge ratio (m/z)
572
453
463
285303
HRF
QMQM
553409
[1,3IIA]−
A

261
Figure 6.4 (B)
B
Mass-to-charge ratio (m/z)
Ion
sign
al in
tens
ity
0
10000
20000
30000
40000
50000
60000
463
285
421
303 571
HRF
RDA
QM
QM [M - H - H2O]−

262
Figure 6.4 (C)
C
Mass-to-charge ratio (m/z)
Ion
sign
al in
tens
ity
0
2000
4000
6000
8000
10000
12000
14000
16000
18000
569
461
419
285
301
551
[1,4IB]−
[1,3IIA]−

263
CHAPTER 7
SUMMARY AND CONCLUSIONS
This research provides new insight in the contents and diversity of phenolic compounds in
PS, as well as the utilization of PS phenolics via their incorporation in peanut butters. A large
number and variety of phenolic compounds were separated, determined and quantified in PS by
HPLC-ESI-MSn, including PACs (monomers to nonamers), free phenolic acids and their esters,
stilbenes, flavonoids, and biflavonoids. Overall, PS contain significantly more PACs compared to
free phenolic compounds. p-Coumaroyl derivatives account for roughly ¾ of the non-PAC
phenolics found in PS. This study is the first to report on the presence of new PACs (i.e., PACs
containing an additional phloroglucinol unit), selected biflavonoids (e.g., morelloflavone,
homoeriodictyol (C3)→eriodictyol (C8)), and p-coumaroyltartaric acid derivatives (e.g.,
p-coumaroyltartaric acid etsters of phenolic acids, stilbenes, vitamin B3) in PS. Although further
analytical techniques are required for unequivocal identifications, we believe that the findings
reported here will greatly enrich the phenolics database of PS. PS provide an abundant and
inexpensive source of natural antioxidants, especially p-coumaroyl species and PACs.
Simultaneous grinding of PS with table sugar can produce powders with desirable grind
sizes (< 300 μm) of an appropriate range for incorporation into peanut butters. Addition of
ground PS also impacts the physical properties of the resultant peanut butters with the extent
depending on the type of skins used. In general, dry-blanched PS resulted in the least overall
change in physical properties of the fabricated peanut butters at a given level of PS incorporation.
Further, these peanut butters also possess greater levels of potentially-healthful phenolic

264
compounds and DF. Even though dry-blanched PS exhibited the greatest enhancement, all four
PS types effectively increased the phenolics content, antioxidant capacity, and the fiber content
of the formulated peanut butters in a concentration-dependent manner, while maintaining the US
FDA’s standard of identity for peanut butter. Moreover, the improved TPCs in the PS-fortified
peanut butters were largely attributed to the PACs, as demonstrated by the DMAC assay and
NP-HPLC/ESI-MS. Thus, given a similar price structure as nonfortified peanut butters, it is
expected that these formulations hold great promise as a functional food. The findings of this
study have paved the way for utilization of a low-valued industrial by-product (i.e., PS) to be an
ingredient in functional food formulations that can improve an existing product and allow for the
diversification of brands already available in the market.

265
INDEX OF ABBREVIATIONS
A: an A-type bond in PACs with both (C4→C8) and (C2→O→C7) linkages or (C4→C6)
and (C2→O→C7) linkages
ijA‾: A‾ is a product ion in the negative-ion mode consisting of the intact A-ring of a
flavonoid, while the superscripts i and j denote the positions in the C-ring where two C–C
bonds have been ruptured
AAPH: 2,2′-azobis(2-amidinopropane)dihydrochloride
ABTS+•: 2,2'-azino-bis(3-ethylbenzothiazoline-6-sulfonic acid) radical cation
ANOVA: analysis of variance
ArO•: phenoxy radical
ArOH: phenolic antioxidants
AUC: the area under the kinetic curve
B: a B-type bond in PACs, which can be (C4→C8) or (C4→C6) linkage
ijB‾: B‾ is a product ion in the negative-ion mode consisting of the intact B-ring of a flavonoid,
while the superscripts i and j indicate the positions in the C-ring where two C–C bonds have
been ruptured
DAD: diode array detection
DMAC: dimethylaminocinnamaldehyde
DF: dietary fiber
DP: degree of polymerization
266
DPPH•: 2,2-diphenyl-1-picrylhydrazyl radical
d.w.: dry weight
(E)Afz: (epi)afzelechin
(E)C: (epi)catechin
(E)CG: (epi)catechin gallate
EDTA: ethylenediamine tetraacetic acid
(E)GC: (epi)gallocatechin
(E)GCG: (epi)gallocatechin gallate
eq.: equivalents
ET: electron transfer
FDA: U.S. Food and Drug Administration
Fe(II)–TPTZ: ferrous tripyridyltriazine
Fe(III)–TPTZ: ferric-tripyridyltriazine
FL: fluorescein (3′6′-dihydroxy-spiro[isobenzofuran-1[3H],9′[9H]-xanthen]-3-one)
FRAP: ferric-reducing antioxidant power
f.w.: fresh weight
GC: gallocatechin
HAT: hydrogen atom transfer
HILIC: hydrophilic interaction liquid chromatography
H2O2: hydrogen peroxide
HOCl: hypochlorous acid
HRF: heterocyclic ring fission
IDF: Insoluble dietary fiber
267
[M – H]‾: molecular ion in the negative-ion mode of mass spectrometry; m/z: mass-to- charge
ratio
[ME]‾: quinone methide fission of the molecular ion at the extension (E) unit
[MT]‾: quinone methide fission of the molecular ion at the terminal (T)
NADH: nicotinamide adenine dinucleotide
NADPH: nicotinamide adenine dinucleotide phosphate
NP-HPLC/ESI-MSn: normal-phase high-performance liquid chromatography-electrospray
ionization mass spectrometry
1O2: singlet oxygen
O2•–: superoxide radical anion
•OH: hydroxyl radical
ORAC: oxygen radical absorbance capacity
PAC: proanthocyanidin
PAL: phenylalanine ammonia lyase
PS: peanut skins
QM: quinone methide
RDA: retro-Diels-Alder
RO•: alkoxyl radical
ROO•: peroxyl radical
ROOH: hydroperoxide
ROS: reactive oxygen species
RP-HPLC/ESI-MSn: reversed-phase high-performance liquid chromatography-electrospray
ionization mass spectrometry

268
RT: retention time
sh: shoulder
SOD: superoxide dismutase
SDF: soluble dietary fiber
TAC: total antioxidant capacity
TAL: tyrosine ammonia lyase
TEAC: trolox equivalent antioxidant capacity
TDF: total dietary fiber
TPAC: total proanthocyanidins
TPC: total phenolics content
TPTZ: 2,4,6-tri(2-pyridyl)-s-triazine
Trolox: 6-hydroxy-2,5,7,8-tetramethylchroman-2-carboxylic acid
UV: ultraviolet
UV-Vis: ultraviolet visible
USDA: U.S. Department of Agriculture
λem: emission spectra
λex: excitation spectra
λmax: maximum wavelength