the physical conditions_in_a_pre_super_star_cluster_molecular_cloud_in_the_antennae_galaxies
TRANSCRIPT

Accepted to ApJ, March 18 2015Preprint typeset using LATEX style emulateapj v. 11/26/04
THE PHYSICAL CONDITIONS IN A PRE SUPER STAR CLUSTER MOLECULAR CLOUD IN THEANTENNAE GALAXIES
K. E. Johnson1, A. K. Leroy2, R. Indebetouw 1,2, C. L. Brogan2, B. C. Whitmore3, J. Hibbard2, K. Sheth2, A.Evans1,2
Accepted to ApJ, March 18 2015
ABSTRACT
We present an analysis of the physical conditions in an extreme molecular cloud in the Antennaemerging galaxies. This cloud has properties consistant with those required to form a globular cluster.We have obtained ALMA CO and 870µm observations of the Antennae galaxy system with ∼ 0′′.5resolution. This cloud stands out in the data with a radius of . 24 pc and mass of > 5 × 10⁶ M�.The cloud appears capable of forming a globular cluster, but the lack of associated thermal radioemission indicates that star formation has not yet altered the environment. The lack of thermalradio emission places the cloud in an early stage of evolution, which we expect to be short-lived(. 1 Myr) and thus rare. Given its mass and kinetic energy, for the cloud to be confined (as itsappearance strongly suggests) it must be subject to an external pressure of P/kB & 108 K cm−3 –10,000 times higher than typical interstellar pressure. This would support theories that high pressuresare required to form globular clusters and may explain why extreme environments like the Antennaeare preferred environments for generating such objects. Given the cloud temperature of ∼ 25 K, theinternal pressure must be dominated by non-thermal processes, most likely turbulence. We expectthe molecular cloud to collapse and begin star formation in . 1 Myr.
Subject headings: galaxies: clusters: general; galaxies: individual(NGC 4038/9); galaxies: interactions;galaxies: star formation, submillimeter: galaxies
1. INTRODUCTION
1.1. Globular Cluster Formation
Globular clusters are among the most ancient objectsin the universe, often with ages > 12 Gyr (Bolte & Hogan1995; Carretta et al. 2000) and are common around mas-sive galaxies in the universe today (Harris et al. 2013).The present-day abundance of globular clusters is re-markable given that that the fraction expected to survive∼ 10 Gyr is extremely small, potentially lower than 1%(Fall & Zhang 2001; Whitmore, Chandar, & Fall 2007).Thus, this extreme type of star formation may have beena critical mode in the early evolution of today’s massivegalaxies.
Initial theories about globular cluster formation sug-gested that these objects were among the first to gravi-tationally collapse in the early universe (Peebles & Dicke1968). Subsequent work, particularly after the launchof the Hubble Space Telescope, has demonstrated thatclusters with extreme stellar densities often exceeding∼ 104 stars pc−3 (e.g. Miocchi et al. 2013) can still formin the universe today (O’Connell et al. 1994) – the so-called “super star clusters” (SSCs). Since that time,numerous studies have indicated that the properties ofSSCs are consistent with those expected of young globu-lar clusters (e.g. McLaughlin & Fall 2008).
A number of physical processes contribute to the de-struction of clusters, including two-body relaxation, stel-lar mass loss and feedback, compressive and tidal shocks
1 Department of Astronomy, University of Virginia, Char-lottesville, VA 22904-4325 e-mail: [email protected]
2 National Radio Astronomy Observatory, 520 Edgemont Road,Charlottesville, VA 22903
3 Space Telescope Science Institute, 3700 San Martin Drive, Bal-timore, MD 21218
as clusters orbit their host galaxy, and tidal truncation.The extent to which each of these processes act on a spe-cific cluster will depend on a variety of factors, includingthe orbital properties of the cluster (Gnedin & Ostriker1997). Indeed, the extent to which cluster disruption ismass-dependent is still debated (Fall et al. 2009; Bastianet al. 2012). For unresolved clusters in galaxies outsidethe local group, there is typically limited (if any) dynami-cal information, and for clusters younger than a few Myr,little dynamical evolution will have taken place. For allof these reasons, it is not possible to say whether anyparticular SSC will survive for a Hubble time.
While there is no generally accepted definition of “Su-per Star Cluster”, here we adopt a definition based on acluster having the potential to evolve into a globular clus-ter, regardless of whether or not it actually will do so overthe following ∼ 10 Gyr. This requirement results in bothmass and radius limits on the range of objects that can beconsidered as SSCs. Specifically, most present-day glob-ular clusters have half-light radii of < 10 pc (althoughsome have radii as large as ∼ 15 pc, van den Bergh etal. 1991), and stellar masses of & 105 M� (Harris etal. 1994). In addition, these clusters are expected tolose & 1/2 of their mass due to dynamical effects over1010 years (McLaughlin & Fall 2008), which suggests thatto be a globular cluster progenitor, a young star clustershould have a mass of & 2 × 10⁵ M�. If star formationefficiency is ∼ 20 − 50% (Ashman & Zepf 2001; Kroupaet al. 2001), the initial molecular core from which thecluster is formed must have a mass of & 106 M�.
Optical techniques have been able to probe the evo-lution of SSCs (and presumably some future globularclusters) to ages as young as a few million years. Be-fore this time, the clusters can be significantly shroudedby their birth material, limiting the usefulness of optical
arX
iv:1
503.
0647
7v1
[as
tro-
ph.G
A]
22
Mar
201
5

2 Johnson et al.
observations. Beginning in the late 1990’s efforts beganto observe SSC evolution at even earlier ages (. a fewmillion years) by using radio observations to detect thefree-free emission from the ionized gas around the clus-ter and internal to the cluster’s dust cocoon (Turner,Ho, & Beck 1998; Kobulnicky & Johnson 1999; Turneret al. 2000; Beck, Turner, & Kovo 2000; Johnson et al.2001; Johnson 2002; Johnson et al. 2003; Beck et al. 2004;Turner & Beck 2004; Johnson et al. 2004; Reines et al.2008; Johnson, Hunt, & Reines 2009; Tsai et al. 2009;Aversa et al. 2011; Kepley et al. 2014). We refer tothese objects as “natal” SSCs, meaning that the clus-ters themselves have already formed, but they have notyet emerged from their birth material. Studies of natalclusters were able to place constraints on the relative life-time of this enshrouded phase of SSC evolution to . amillion years and the gas density of the ionized hydrogenne > 103 cm−3(Johnson et al. 2003). A large number ofsubsequent studies have now identified additional com-pact thermal radio sources in a number of galaxies, al-though their low detection rate supports their relativelyshort lifetime (Tsai et al. 2009; Aversa et al. 2011).
However, determining the physical conditions that giverise to SSCs (and their surviving descendants – globularclusters) has been mired in the fundamental difficultythat once an SSC is present in the molecular cloud, it willdramatically alter it. Thus in order to observationallyprobe the conditions capable of creating an SSC requiresnot only identifying molecular clouds that are compact(radii . 25 pc, see Section 3.5) and massive (& 106 M�),but also for which massive stars have not begun to dis-rupt the environment. Efforts to observe the actual for-mation of SSCs – before the star clusters have formed– requires high spatial resolution millimeter observationsto determine the physical properties of the material fromwhich the clusters will form. Such work has largely beenstymied by the available observing facilities and limitedto only the most nearby galaxies.
One example of a relatively nearby starburst systemin which some progress has been made is M82. At3.6 Mpc (Freedman et al. 1994), relatively good linearresolution was achievable even before ALMA. This sys-tem was observed using the Owens Valley Radio Obser-vatory (OVRO) in CO(2-1) with a linear resolution of17 pc Keto et al. (2005). While the compact molecularclouds observed in M82 are likely to be associated withearly SSC evolution, multiwavelength observations sug-gest that these clouds have already begun star formation(Keto et al. 2005), and have therefore disrupted theirbirth environment4.
This paper reports results from an ALMA Early Sci-ence project studying the Antennae galaxies. In a highresolution survey of CO emission from the Antennae(Whitmore et al. 2014) the most immediately strikingfeature was a compact, high line width cloud with lit-tle associated star formation. This is coincident with asource identified by Herrera et al. (2011); Herrera etal. (2012) as a potential proto-SSC using H2 and ear-lier, lower resolution ALMA data. The strong compactH2 emission appears to be due to warm (1700-2300 K)
4 A possible exception to this is a CO cloud located at09h55m54.5s +69d40’50”, however the properties of this cloud arenot provided by Keto et al. (2005).
TABLE 1Interferometric CO Observations of the Antennae
Facility Transition Beam Reference
CMA 12CO1-0 4.91′′ × 3.15′′ Wilson et al. (2000)SMA 12CO3-2 1.42′′ × 1.12′′ Ueda et al. (2012)
SMA+PdBI 12CO2-1 3.3′′ × 1.5′′ Wei et al. (2012)ALMA-SV 12CO2-1 1.68′′ × 0.85′′ Espada et al. (2012)ALMA-SV 12CO3-2 1.05′′ × 0.60′′ Herrera et al. (2012)
ALMA-Cyc0 12CO3-2 0.56′′ × 0.43′′ this paper
shocked gas. However, the size of the cold molecularcomponent could only be constrained to . 100 pc, whichprecluded a conclusive identification.
The present paper characterizes this source, which weconsider among the best candidates for a proto-SSC, andlays out the evidence for and against the source’s even-tual evolution into a SSC or GC.
2. ALMA OBSERVATIONS
We obtained ALMA observations of the Antennae sys-tem in CO(3-2) and 870 µm continuum with the goalof probing the conditions of cluster formation and earlyevolution; data calibration is discussed in detail in theoverview paper (Whitmore et al. 2014). Briefly, the ob-servations consisted of a 13-point mosaic, and were car-ried out in the “extended” configuration, with a maxi-mum baseline of ∼ 400 m and 5 km s−1 spectral channels.The resulting rms was determined using line-free chan-nels and found to be 3.3 mJy/beam. With an angularresolution FWHM of 0.′′56 × 0.′′43 (59 × 45 pc), theseobservations are well-matched to the expected diameterof the precursor giant molecular clouds of . 50 pc (ora radius of 25 pc, see Section 3.5). For this paper, wealso recalibrated and reimaged the SV data, as well ascompared it to previous results to check for consistency.The SV CO(2-1) data used in this paper was taken witha beam size of 1.68′′×0.85′′. The rms of the SV CO(2-1)observations was also measured using line-free channelsand found to be 6.5 mJy/beam.
The ALMA observations enable the study of a compactand luminous source in the CO(3-2) data cube (see Fig-ure 1). This cloud is part of the super giant molecularcloud complex known as SGMC2 (Wilson et al. 2000);the full 3-D cube of SGMC2 is shown in Figure 2. TheAntennae galaxy system was previously observed in bothCO(2-1) and CO(3-2) by ALMA as part of the “scienceverification” (SV) process, which has already resulted inpublications (see Table 1, Espada et al. 2012; Herrera etal. 2012).
The specific source discussed here was singled outin the lower-resolution ALMA science verification data,with the CO(3-2) emission being coincident with strongH2 emission – potentially indicating shocks due to in-falling gas (Herrera et al. 2012). Even with lower resolu-tion data (∼ 100 pc), it was speculated that this regionmight contain an SSC in the early stages of its evolution(Herrera et al. 2012). However, the spatial resolution ofthe SV CO(3-2) data is ∼ 100 pc, or roughly twice thatof the Cycle 0 data presented here. It is clear that in theSV data, the molecular cloud that is the subject of thispaper is not resolved and is blended with other molecular
3
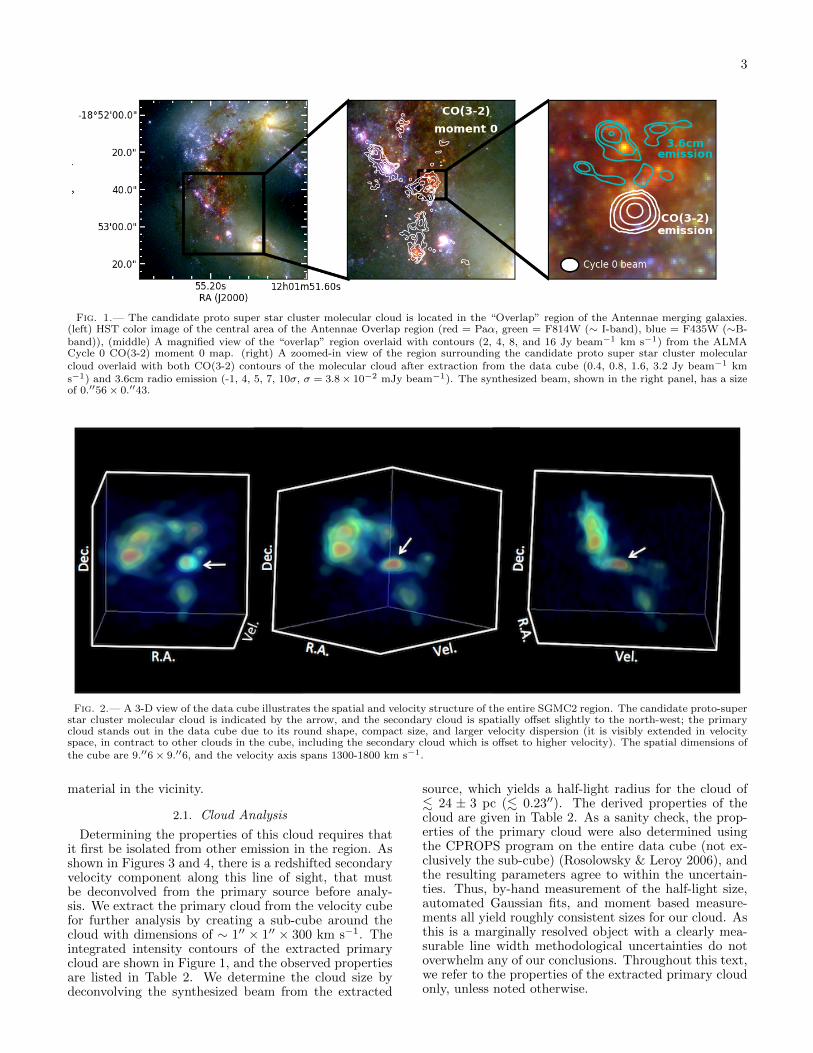
Fig. 1.— The candidate proto super star cluster molecular cloud is located in the “Overlap” region of the Antennae merging galaxies.(left) HST color image of the central area of the Antennae Overlap region (red = Paα, green = F814W (∼ I-band), blue = F435W (∼B-band)), (middle) A magnified view of the “overlap” region overlaid with contours (2, 4, 8, and 16 Jy beam−1 km s−1) from the ALMACycle 0 CO(3-2) moment 0 map. (right) A zoomed-in view of the region surrounding the candidate proto super star cluster molecularcloud overlaid with both CO(3-2) contours of the molecular cloud after extraction from the data cube (0.4, 0.8, 1.6, 3.2 Jy beam−1 kms−1) and 3.6cm radio emission (-1, 4, 5, 7, 10σ, σ = 3.8 × 10⁻² mJy beam−1). The synthesized beam, shown in the right panel, has a sizeof 0.′′56 × 0.′′43.
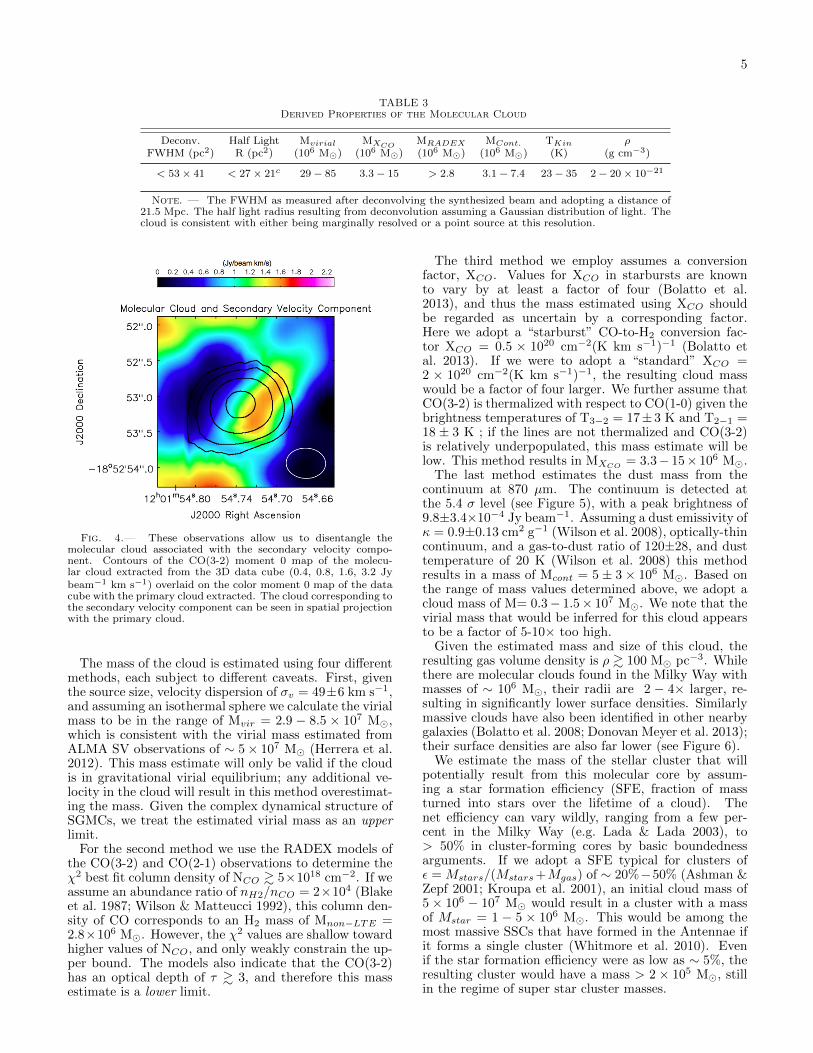
Fig. 2.— A 3-D view of the data cube illustrates the spatial and velocity structure of the entire SGMC2 region. The candidate proto-superstar cluster molecular cloud is indicated by the arrow, and the secondary cloud is spatially offset slightly to the north-west; the primarycloud stands out in the data cube due to its round shape, compact size, and larger velocity dispersion (it is visibly extended in velocityspace, in contract to other clouds in the cube, including the secondary cloud which is offset to higher velocity). The spatial dimensions ofthe cube are 9.′′6 × 9.′′6, and the velocity axis spans 1300-1800 km s−1.
material in the vicinity.
2.1. Cloud Analysis
Determining the properties of this cloud requires thatit first be isolated from other emission in the region. Asshown in Figures 3 and 4, there is a redshifted secondaryvelocity component along this line of sight, that mustbe deconvolved from the primary source before analy-sis. We extract the primary cloud from the velocity cubefor further analysis by creating a sub-cube around thecloud with dimensions of ∼ 1′′ × 1′′ × 300 km s−1. Theintegrated intensity contours of the extracted primarycloud are shown in Figure 1, and the observed propertiesare listed in Table 2. We determine the cloud size bydeconvolving the synthesized beam from the extracted
source, which yields a half-light radius for the cloud of. 24 ± 3 pc (. 0.23′′). The derived properties of thecloud are given in Table 2. As a sanity check, the prop-erties of the primary cloud were also determined usingthe CPROPS program on the entire data cube (not ex-clusively the sub-cube) (Rosolowsky & Leroy 2006), andthe resulting parameters agree to within the uncertain-ties. Thus, by-hand measurement of the half-light size,automated Gaussian fits, and moment based measure-ments all yield roughly consistent sizes for our cloud. Asthis is a marginally resolved object with a clearly mea-surable line width methodological uncertainties do notoverwhelm any of our conclusions. Throughout this text,we refer to the properties of the extracted primary cloudonly, unless noted otherwise.

4 Johnson et al.
TABLE 2Measured Properties of the Molecular Cloud
R.A. Dec. VLSR SCO3−2 σV Size(J2000) (J2000) (km s−1) (Jy km s−1) (km s−1) FWHM (arcsec2)
12:01:54.73 -18:52:53.2 1524±3 52±5 49±3 0.66 ± 0.12 × 0.55 ± 0.07
Note. — Properties of the clouds were measured both with the CPROPS programRosolowsky & Leroy (2006), and with Gaussian fitting (FWHM = 2.35σ). The quoted uncer-tainties reflect empirically determined variations in these values for different fitting attempts.The synthesized beam has not been deconvolved in this table to strictly report measuredproperties. The deconvolved size is reported in Table 3.
Fig. 3.— The CO(3-2) and CO(1-0) spectra of a ∼ 1′′ × 1′′ re-gion around the candidate proto super star cluster molecular cloudtaken from the full data cube (i.e. the primary cloud has not beenextracted). The line emission indicates that there are two com-ponents along the line-of-sight that have different temperatures.Spectral profile of the CO(3-2) line from current work (ALMACycle 0 observations) and the CO(2-1) line from ALMA scienceverification (Espada et al. 2012). The CO(3-2) data is convolvedto the CO(2-1) beam and both data sets are corrected for beamdilution. There is clearly more than one velocity component; inthese convolved data, the secondary source was fit by a Gaussianand subtracted from the spectra. The CO(3-2)/CO(2-1) ratio isdramatically different in the two velocity components.
2.2. Relative Astrometric Solutions
A comparison between the CO(3-2) emission and dataat other wavelengths, requires an understanding of therelative astrometric accuracy. Based on the phase stabil-ity of the ALMA observations, we estimate the absoluteastrometric accuracy to be better than ∼ 0.2′′. Cen-timeter observations from the VLA have an astrometricaccuracy better than ∼ 0.1′′ (Brogan et al. 2010), andtherefore the 3.6 cm and CO(3-2) observations have arelative precision of better than the synthesized beamof the ALMA data, and we consider them to be astro-metrically matched. We also register the astrometry ofarchival Hubble Space Telescope observations shown inFigure 1 by matching the Paα emission throughout theAntennae system to common features in the 3.6 cm emis-sion.
3. RESULTS
3.1. Cloud Temperature and Optical Depth
We constrain the temperature and optical depth of thecloud using the CO(3-2) and CO(2-1) emission. We re-
trieved, recalibrated, and reimaged CO(2-1) observationsfrom ALMA’s science verification period, shown over-plotted in Figure 3. The CO(3-2) observations were con-volved to the synthesized beam of the CO(2-1) observa-tions and corrected for beam dilution using the Cycle 0CO(3-2) source size, resulting in peak brightness temper-atures of T3−2 = 17 ± 3 K and T2−1 = 18 ± 3 K. Thelargest angular scale to which the CO(3-2) observationsare sensitive is ∼ 6′′, and therefore we do not expectthat any flux is resolved out on the size scales of interesthere. The secondary component has a significantly lowerCO(3-2)/CO(2-1) ratio, indicating much cooler gas thanthe primary cloud.
RADEX non-LTE modeling (van der Tak et al. 2007)was used to analyze the CO(3-2) and CO(2-1) emission.The line intensities and their ratio were compared to agrid of RADEX models covering a range of values for ki-netic temperature, CO column density, and H2 volumedensity. The best-fit values result from a chi-squaredminimization. Since the source is marginally resolved inCO(3-2), for CO(3-2) we set the beam filling fraction to1, and for CO(2-1) we set it to the dilution factor, or theratio of the CO(3-2) size to the CO(2-1) beamsize. TheRADEX models indicate that these transitions are opti-cally thick – the best fitting depth is τ ∼ 3.5 ± 0.5, butthe data do not rule out significantly higher values. Thelines appear to be close to thermalized, with an excita-tion temperature within a degree of the kinetic temper-ature of 25+10
−2 K; this temperature is on the upper endof the range of those found for dense molecular cloudsin the Milky Way (Shirley et al. 2013). However, thereis a degeneracy between the inferred temperature anddensity of the cloud, and the cloud could be warmer fordensities . 6 × 104 cm−3. In other words, the observedbrightness could also be reproduced with a large columnof subthermally excited, warm, relatively diffuse gas.
The temperature inferred here for the CO cloud isroughly 100× less than that inferred for the compact H2
emission observed in this region of 1,700-2,300 K (Her-rera et al. 2011). In addition, the H2 FWHM line-widthof ∼ 150 km s−1 Herrera et al. (2011) is significantlyhigher than the FWHM line-width of the CO emissionmeasured here of 115 km s−1 (σ = 49 km s−1). There-fore we infer that the origin of the CO and H2 emissionmay not be identical. We speculate that the H2 emissionhas a low filling factor, sampling only the most stronglyshocked regions in and/or around the cloud.
3.2. Cloud Mass
5
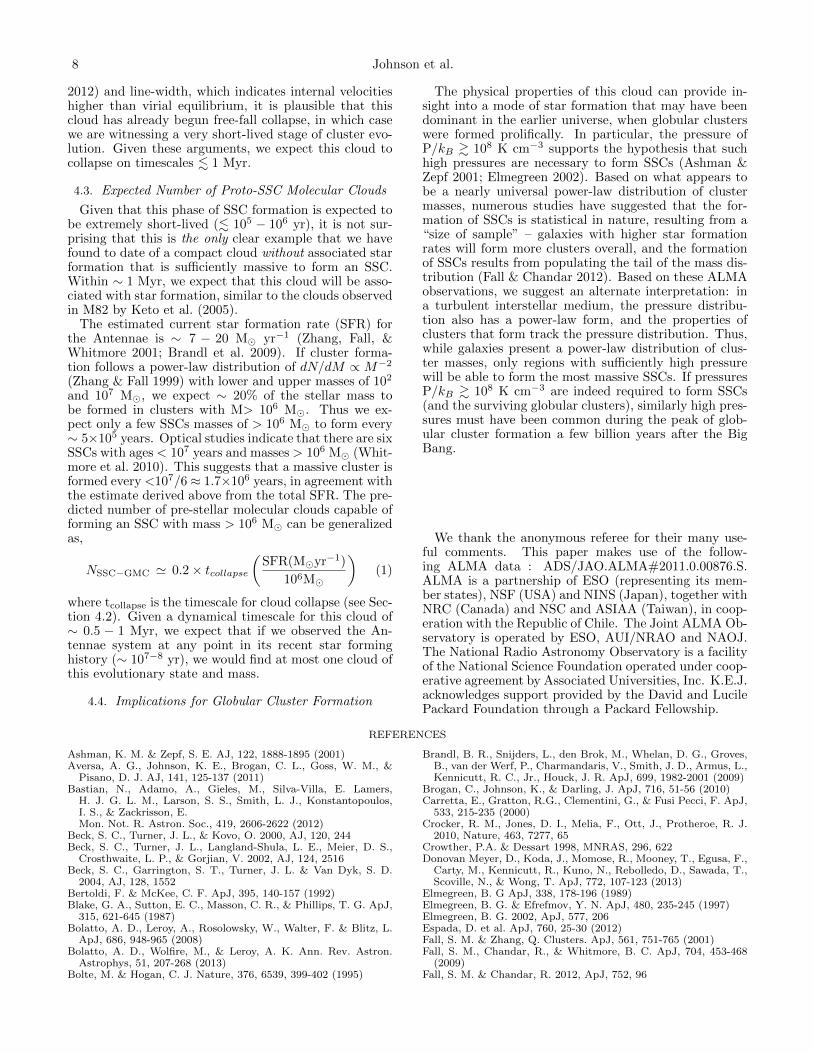
TABLE 3Derived Properties of the Molecular Cloud
Deconv. Half Light Mvirial MXCOMRADEX MCont. TKin ρ
FWHM (pc2) R (pc2) (106 M�) (106 M�) (106 M�) (106 M�) (K) (g cm−3)
< 53 × 41 < 27 × 21c 29 − 85 3.3 − 15 > 2.8 3.1 − 7.4 23 − 35 2 − 20 × 10−21
Note. — The FWHM as measured after deconvolving the synthesized beam and adopting a distance of21.5 Mpc. The half light radius resulting from deconvolution assuming a Gaussian distribution of light. Thecloud is consistent with either being marginally resolved or a point source at this resolution.
Fig. 4.— These observations allow us to disentangle themolecular cloud associated with the secondary velocity compo-nent. Contours of the CO(3-2) moment 0 map of the molecu-lar cloud extracted from the 3D data cube (0.4, 0.8, 1.6, 3.2 Jybeam−1 km s−1) overlaid on the color moment 0 map of the datacube with the primary cloud extracted. The cloud corresponding tothe secondary velocity component can be seen in spatial projectionwith the primary cloud.
The mass of the cloud is estimated using four differentmethods, each subject to different caveats. First, giventhe source size, velocity dispersion of σv = 49±6 km s−1,and assuming an isothermal sphere we calculate the virialmass to be in the range of Mvir = 2.9 − 8.5 × 10⁷ M�,which is consistent with the virial mass estimated fromALMA SV observations of ∼ 5× 10⁷ M� (Herrera et al.2012). This mass estimate will only be valid if the cloudis in gravitational virial equilibrium; any additional ve-locity in the cloud will result in this method overestimat-ing the mass. Given the complex dynamical structure ofSGMCs, we treat the estimated virial mass as an upperlimit.
For the second method we use the RADEX models ofthe CO(3-2) and CO(2-1) observations to determine theχ2 best fit column density of NCO & 5×1018 cm−2. If weassume an abundance ratio of nH2/nCO = 2×10⁴ (Blakeet al. 1987; Wilson & Matteucci 1992), this column den-sity of CO corresponds to an H2 mass of Mnon−LTE =2.8×10⁶ M�. However, the χ2 values are shallow towardhigher values of NCO, and only weakly constrain the up-per bound. The models also indicate that the CO(3-2)has an optical depth of τ & 3, and therefore this massestimate is a lower limit.
The third method we employ assumes a conversionfactor, XCO. Values for XCO in starbursts are knownto vary by at least a factor of four (Bolatto et al.2013), and thus the mass estimated using XCO shouldbe regarded as uncertain by a corresponding factor.Here we adopt a “starburst” CO-to-H2 conversion fac-tor XCO = 0.5 × 1020 cm−2(K km s−1)−1 (Bolatto etal. 2013). If we were to adopt a “standard” XCO =2 × 1020 cm−2(K km s−1)−1, the resulting cloud masswould be a factor of four larger. We further assume thatCO(3-2) is thermalized with respect to CO(1-0) given thebrightness temperatures of T3−2 = 17± 3 K and T2−1 =18 ± 3 K ; if the lines are not thermalized and CO(3-2)is relatively underpopulated, this mass estimate will below. This method results in MXCO
= 3.3− 15× 106 M�.The last method estimates the dust mass from the
continuum at 870 µm. The continuum is detected atthe 5.4 σ level (see Figure 5), with a peak brightness of9.8±3.4×10⁻⁴ Jy beam−1. Assuming a dust emissivity ofκ = 0.9±0.13 cm2 g−1 (Wilson et al. 2008), optically-thincontinuum, and a gas-to-dust ratio of 120±28, and dusttemperature of 20 K (Wilson et al. 2008) this methodresults in a mass of Mcont = 5 ± 3 × 10⁶ M�. Based onthe range of mass values determined above, we adopt acloud mass of M= 0.3− 1.5× 10⁷ M�. We note that thevirial mass that would be inferred for this cloud appearsto be a factor of 5-10× too high.
Given the estimated mass and size of this cloud, theresulting gas volume density is ρ & 100 M� pc−3. Whilethere are molecular clouds found in the Milky Way withmasses of ∼ 106 M�, their radii are 2 − 4× larger, re-sulting in significantly lower surface densities. Similarlymassive clouds have also been identified in other nearbygalaxies (Bolatto et al. 2008; Donovan Meyer et al. 2013);their surface densities are also far lower (see Figure 6).
We estimate the mass of the stellar cluster that willpotentially result from this molecular core by assum-ing a star formation efficiency (SFE, fraction of massturned into stars over the lifetime of a cloud). Thenet efficiency can vary wildly, ranging from a few per-cent in the Milky Way (e.g. Lada & Lada 2003), to> 50% in cluster-forming cores by basic boundednessarguments. If we adopt a SFE typical for clusters ofε = Mstars/(Mstars +Mgas) of ∼ 20%−50% (Ashman &Zepf 2001; Kroupa et al. 2001), an initial cloud mass of5 × 106 − 107 M� would result in a cluster with a massof Mstar = 1 − 5 × 10⁶ M�. This would be among themost massive SSCs that have formed in the Antennae ifit forms a single cluster (Whitmore et al. 2010). Evenif the star formation efficiency were as low as ∼ 5%, theresulting cluster would have a mass > 2 × 10⁵ M�, stillin the regime of super star cluster masses.

6 Johnson et al.
Fig. 5.— Detecting the continuum emission associated with thissource allows us to determine its dust mass. Contours of the CO(3-2) moment 0 map of the primary cloud overlaid on a color-scaleimage of the 870 µm continuum.
3.3. Constraining the Ionizing Flux Associated with theCloud
In order to assess the extent to which star formationmay have already affected the physical state of the ion-ized gas, we searched for ionizing flux potentially comingfrom stars within the molecular cloud. Figure 1 showsthe Paα emission in the region, and while there is diffuseemission associated with the SGMC in general, there isno discrete source associated with the molecular cloudin question. However, it is possible that given the em-bedded nature of this source, Paα emission could sufferfrom significant extinction, and thus we also utilize radioobservations to identify free-free emission that might bepresent.
We created two radio maps from archival 3.6 cm VLAobservations (proposal codes AN079, AP478, AS796,AA301); one with a synthesized beam of 0.65′′ × 0.42′′
to best match the beam of the ALMA CO(3-2) observa-tions and resolve out diffuse emission, and a second witha synthesized beam of 1.12′′ × 0.85′′, which has greatersensitivity to extended emission. In the higher resolu-tion map, there is no discrete source coincident withthe molecular cloud discussed here, and the 5σ detec-tion threshold of the radio emission corresponds to anionizing flux of NLyc ≈ 6 × 1050 s−1. This is equivalentto ∼ 60 O-type stars (Vacca et al. 1996). This limit isroughly three times lower than the previous limit placedon possible ionizing flux in this region of 2 × 1051 s−1
using lower resolution 6 cm observations (Herrera et al.2011). For comparison, the ionizing flux of 30 Dor has
been estimated to be NLyc ≈ 4 × 1051 s−1 (Crowther &Dessart 1998).
In the lower resolution map, while there is no discretesource coincident with the molecular cloud, there is dif-fuse emission in the region. Without velocity informationfor this diffuse emission, it is not possible to disentanglepotential line-of-sight confusion in this complex region.However, to estimate the possible contribution from starswithin this molecular cloud to the diffuse emission, wefirst fit and subtract Gaussian profiles to the other dom-inate sources in SGMC2. After subtracting the emissiondue to nearby sources, we measure the flux density dueto diffuse emission in the cloud aperture to be 0.03 mJy,
which corresponds to an ionizing flux of 1.1 × 1051 s−1,which corresponds to ∼ 100 O-type stars (Vacca et al.1996). However, the diffuse morphology of this emissionis not consistent with it coming from a single compactsource.
Thus, while both the Paα and cm radio observationsshow diffuse emission associated with the SGMC2 struc-ture, there is no discrete source associated with the com-pact cloud discussed here (Figure 1). We constrain thepossible ionizing flux that could be due to embeddedstars in this cloud to be . 60 O-type stars. We canrule out an existing stellar cluster in this molecular core& 104 M� (Leitherer et al. 1999), roughly two ordersof magnitude smaller than the anticipated cluster mass(Section 3.2). Either star formation has not begun or itis so deeply embedded that its ionizing radiation is con-fined by gas continuing to accrete onto the protostars.
3.4. Determination of Cloud Pressure
With a surface density of ∼ 4×10³ M� pc−2 and size-linewidth coefficient of σ2/R = 90 km2 s−2 pc, the cloudis not consistent with being in either pure gravitationalvirial equilibrium or free-fall collapse (Figure 6, Heyer etal. 2009). Nevertheless, the morphology of the cloud in-dicates that gravity is playing a significant role (round,compact, and bright – making it stand out as a singu-lar object in the data cube), suggesting that it is not atransient object. As illustrated in Figure 6, the observedline width value can be explained if the cloud is subjectto external pressures of P/kB ∼ 109 K cm−3, roughlyfive orders of magnitude higher than that typical in theinterstellar medium of a galaxy (Jenkins et al. 1983).This is consistent with theoretical considerations thathave argued SSC formation requires extreme pressures(P/kB & 108 K cm−3) (Jog & Soloman 1992; Elmegreen& Efremov 1997; Ashman & Zepf 2001). This high pres-sure is also in accord with previous findings of compres-sive shocks in the overlap region (Wei et al. 2012).
3.5. Expected Proto Super Star Cluster Cloud Size
The expected physical size of a molecular cloud capableof forming an SSC can be estimated based on virial the-orem arguments. Following previous work (Elmegreen1989), the external cloud pressure Pe, cloud mass M ,cloud radius r, and velocity dispersion σv can be relatedby
Pe =3ΠMσ2
v
4πr3,
where Π is defined by ne = Π〈ne〉, and here we adopt Π =0.5. It has been estimated that SSC formation requiresinternal pressures of P0/k & 108 K cm−3 (Elmegreen& Efremov 1997). These high pressures inhibit the dis-persal of the natal material and achieve sufficiently highstar formation efficiencies in the cloud core. If we adopta minimum mass of M = 106 M� for a cloud capable offorming a SSC, the resulting cloud radius is r ∼ 25 pc.Likewise, for the velocity dispersion of σv = 49 km s−1
observed for the cloud discussed here and the apparentexternal pressure of P0/k & 109 K cm−3 (see Figure 6),the expected radius is r ∼ 25 pc, which is within theuncertainty of the cloud half-light radius of . 24± 3 pcextracted from these observations.
4. DISCUSSION

7
Fig. 6.— The measured properties of the primary molecular cloud indicate that it may be subject to pressures of ∼P/kB = 109 K cm−3.This plot shows the relationship between surface density and the size-line width coefficient with the candidate proto-super star cluster cloudplotted as the blue point (error bars represent 1σ). Lines corresponding to pure gravitational virial equilibrium (no external pressure) alongwith corresponding line for equilibrium with external pressures of P/kB = 106, 107, 108, and 109 K cm−3 are shown in black, correspondingconditions for clouds undergoing free-fall collapse are shown as red dashed lines Field, Blackman, & Keto (2011). For comparison, datapoints are shown from molecular cloud survey in nearby galaxies as light green points (Donovan Meyer et al. 2013), and Galactic cloudsare shown as purple points (Heyer et al. 2009).
4.1. On the Origin of the High Pressure Inferred for theMolecular Cloud
If the cloud is confined, as we expect from such a strongconcentration of gas, then external pressure must play akey role. This high external pressure could result fromthe weight of the surrounding SGMC2 (if the SGMC isroughly in hydrostatic equilibrium) and/or large scalecompressive shocks. The pressure generated by thesurrounding molecular material can be estimated usingPG/kB ≈ 1.5 cm−3 K (Mcloud/M�)2(r/pc)−4 (Bertoldi& McKee 1992). The SGMC2 region has an estimatedtotal mass of ∼ 4 × 10⁸ M� (Wilson et al. 2000) andradius of ∼ 400 pc, resulting in a pressure from the over-lying molecular material of P/kB ∼ 107 K cm−3, whichis at least an order of magnitude less than the internalpressure inferred for this cloud.
Given that this cloud is not only in the “overlap” re-gion of the Antennae, but also appears to be at the nexusof two filaments of CO(3-2) emission that are suggestiveof colliding flows (Whitmore et al. 2014), a significantamount of external pressure could also be generated byram pressure. This interpretation is consistent with pre-vious work indicating strong H2 line emission and anabrupt velocity gradient across this region (Herrera etal. 2011; Herrera et al. 2012). However, the morphol-ogy of the cloud suggests an isotropic source of pressure,which is in tension with a ram pressure origin.
4.2. Timescales for Cloud Evolution and StarFormation
The relevant timescales for this cloud to evolve aredriven by the free-fall time and the crossing time. Thecompact size and marginally-resolved round morphologysuggest that self-gravity has had a significant role inshaping the source, although that is not possible to con-clusively demonstrate with the data in hand. The cloudmust be largely supported by turbulence: given the in-ferred density of the cloud (n∼ 103 cm−3), if the pressurewere entirely thermal, it would require a gas temperatureof ∼ 105 K, which is not reasonable or consistent withthese observations that indicate T ∼ 25 K. We concludethat this cloud is most likely supported by turbulence.This conclusion is also supported by the virial mass be-ing nearly an order of magnitude larger than the massinferred from the dust continuum, indicating significantinternal motion contributing to the observed line width.
Thus, we adopt the turbulent crossing time as the ap-propriate timescale for the evolution of this cloud andestimate it as tcr ∼ D/σV ∼ 1 Myr, where D is the di-ameter of the region. If self-gravity is not important, thecloud will disperse on this timescale – the turbulence willdissipate on this timescale in any case. If self-gravity isimportant (as argued above), the cloud will collapse onthis timescale. The free-fall time of the cloud can beestimated as tff = (3π/32 G ρ)1/2 ≈ 8 × 10⁵ years.Given the strong associated H2 emission (Herrera et al.
8 Johnson et al.
2012) and line-width, which indicates internal velocitieshigher than virial equilibrium, it is plausible that thiscloud has already begun free-fall collapse, in which casewe are witnessing a very short-lived stage of cluster evo-lution. Given these arguments, we expect this cloud tocollapse on timescales . 1 Myr.
4.3. Expected Number of Proto-SSC Molecular Clouds
Given that this phase of SSC formation is expected tobe extremely short-lived (. 105 − 106 yr), it is not sur-prising that this is the only clear example that we havefound to date of a compact cloud without associated starformation that is sufficiently massive to form an SSC.Within ∼ 1 Myr, we expect that this cloud will be asso-ciated with star formation, similar to the clouds observedin M82 by Keto et al. (2005).
The estimated current star formation rate (SFR) forthe Antennae is ∼ 7 − 20 M� yr−1 (Zhang, Fall, &Whitmore 2001; Brandl et al. 2009). If cluster forma-tion follows a power-law distribution of dN/dM ∝ M−2
(Zhang & Fall 1999) with lower and upper masses of 102
and 107 M�, we expect ∼ 20% of the stellar mass tobe formed in clusters with M> 106 M�. Thus we ex-pect only a few SSCs masses of > 106 M� to form every∼ 5×10⁵ years. Optical studies indicate that there are sixSSCs with ages < 107 years and masses > 106 M� (Whit-more et al. 2010). This suggests that a massive cluster isformed every <107/6 ≈ 1.7×10⁶ years, in agreement withthe estimate derived above from the total SFR. The pre-dicted number of pre-stellar molecular clouds capable offorming an SSC with mass > 106 M� can be generalizedas,
NSSC−GMC ' 0.2× tcollapse(
SFR(M�yr−1)
106M�
)(1)
where tcollapse is the timescale for cloud collapse (see Sec-tion 4.2). Given a dynamical timescale for this cloud of∼ 0.5 − 1 Myr, we expect that if we observed the An-tennae system at any point in its recent star forminghistory (∼ 107−8 yr), we would find at most one cloud ofthis evolutionary state and mass.
4.4. Implications for Globular Cluster Formation
The physical properties of this cloud can provide in-sight into a mode of star formation that may have beendominant in the earlier universe, when globular clusterswere formed prolifically. In particular, the pressure ofP/kB & 108 K cm−3 supports the hypothesis that suchhigh pressures are necessary to form SSCs (Ashman &Zepf 2001; Elmegreen 2002). Based on what appears tobe a nearly universal power-law distribution of clustermasses, numerous studies have suggested that the for-mation of SSCs is statistical in nature, resulting from a“size of sample” – galaxies with higher star formationrates will form more clusters overall, and the formationof SSCs results from populating the tail of the mass dis-tribution (Fall & Chandar 2012). Based on these ALMAobservations, we suggest an alternate interpretation: ina turbulent interstellar medium, the pressure distribu-tion also has a power-law form, and the properties ofclusters that form track the pressure distribution. Thus,while galaxies present a power-law distribution of clus-ter masses, only regions with sufficiently high pressurewill be able to form the most massive SSCs. If pressuresP/kB & 108 K cm−3 are indeed required to form SSCs(and the surviving globular clusters), similarly high pres-sures must have been common during the peak of glob-ular cluster formation a few billion years after the BigBang.
We thank the anonymous referee for their many use-ful comments. This paper makes use of the follow-ing ALMA data : ADS/JAO.ALMA#2011.0.00876.S.ALMA is a partnership of ESO (representing its mem-ber states), NSF (USA) and NINS (Japan), together withNRC (Canada) and NSC and ASIAA (Taiwan), in coop-eration with the Republic of Chile. The Joint ALMA Ob-servatory is operated by ESO, AUI/NRAO and NAOJ.The National Radio Astronomy Observatory is a facilityof the National Science Foundation operated under coop-erative agreement by Associated Universities, Inc. K.E.J.acknowledges support provided by the David and LucilePackard Foundation through a Packard Fellowship.
REFERENCES
Ashman, K. M. & Zepf, S. E. AJ, 122, 1888-1895 (2001)Aversa, A. G., Johnson, K. E., Brogan, C. L., Goss, W. M., &
Pisano, D. J. AJ, 141, 125-137 (2011)Bastian, N., Adamo, A., Gieles, M., Silva-Villa, E. Lamers,
H. J. G. L. M., Larson, S. S., Smith, L. J., Konstantopoulos,I. S., & Zackrisson, E.Mon. Not. R. Astron. Soc., 419, 2606-2622 (2012)
Beck, S. C., Turner, J. L., & Kovo, O. 2000, AJ, 120, 244Beck, S. C., Turner, J. L., Langland-Shula, L. E., Meier, D. S.,
Crosthwaite, L. P., & Gorjian, V. 2002, AJ, 124, 2516Beck, S. C., Garrington, S. T., Turner, J. L. & Van Dyk, S. D.
2004, AJ, 128, 1552Bertoldi, F. & McKee, C. F. ApJ, 395, 140-157 (1992)Blake, G. A., Sutton, E. C., Masson, C. R., & Phillips, T. G. ApJ,
315, 621-645 (1987)Bolatto, A. D., Leroy, A., Rosolowsky, W., Walter, F. & Blitz, L.
ApJ, 686, 948-965 (2008)Bolatto, A. D., Wolfire, M., & Leroy, A. K. Ann. Rev. Astron.
Astrophys, 51, 207-268 (2013)Bolte, M. & Hogan, C. J. Nature, 376, 6539, 399-402 (1995)
Brandl, B. R., Snijders, L., den Brok, M., Whelan, D. G., Groves,B., van der Werf, P., Charmandaris, V., Smith, J. D., Armus, L.,Kennicutt, R. C., Jr., Houck, J. R. ApJ, 699, 1982-2001 (2009)
Brogan, C., Johnson, K., & Darling, J. ApJ, 716, 51-56 (2010)Carretta, E., Gratton, R.G., Clementini, G., & Fusi Pecci, F. ApJ,
533, 215-235 (2000)Crocker, R. M., Jones, D. I., Melia, F., Ott, J., Protheroe, R. J.
2010, Nature, 463, 7277, 65Crowther, P.A. & Dessart 1998, MNRAS, 296, 622Donovan Meyer, D., Koda, J., Momose, R., Mooney, T., Egusa, F.,
Carty, M., Kennicutt, R., Kuno, N., Rebolledo, D., Sawada, T.,Scoville, N., & Wong, T. ApJ, 772, 107-123 (2013)
Elmegreen, B. G ApJ, 338, 178-196 (1989)Elmegreen, B. G. & Efrefmov, Y. N. ApJ, 480, 235-245 (1997)Elmegreen, B. G. 2002, ApJ, 577, 206Espada, D. et al. ApJ, 760, 25-30 (2012)Fall, S. M. & Zhang, Q. Clusters. ApJ, 561, 751-765 (2001)Fall, S. M., Chandar, R., & Whitmore, B. C. ApJ, 704, 453-468
(2009)Fall, S. M. & Chandar, R. 2012, ApJ, 752, 96
9
Field, G. B., Blackman, E. G., & Keto, E. R. 2011, MNRAS, 416,710
Freedman, W. L. et al. ApJ, 427, 628-655 (1994)Gnedin, O. Y. & Ostriker, J. P. ApJ, 474, 223-255 (1997)Harris, W. E. & Pudritz, R. E. ApJ, 429, 177-191 (1994)Harris, W. E., Harris, G. L. H., Alessi, M., ApJ, 772, 82-95 (2013)Herrera, C. N., Boulanger, F., & Nesvadba, N. P. H. Astron.
Astrophys, 534, 138-151 (2011)Herrera C. N., Boulanger, F., Nesvadba, N. P. H., & Falgarone, E.
Astron. Astrophys, 538, 9-13 (2012)Heyer, M., Krawczyk, C., Duval, J., & Jackson, J. M. ApJ, 699,
1092-1103 (2009)Jenkins, E. B., Jura, M., & Loewenstein, M. ApJ, 270, 88-104
(1983)Jog, C.J. & Soloman, P.M. 1992, ApJ, 387, 152Johnson, K. E., Kobulnicky, H. A., Massey, P., & Conti, P. S. 2001,
ApJ, 559Johnson, K. E. Science, 297, 5582, 776-777 (2002)Johnson, K. E. & Kobulnicky, H. A. ApJ, 597, 923-928 (2003)Johnson, K. E., Indebetouw, R., Watson, C., & Kobulnicky, H. A.
AJ, 128, 610-616 (2004)Johnson, K. E., Hunt, L. K., & Reines, A. E. 2009, AJ, 137, 3788Kepley, A. A., Reines, A. E., Johnson, K. E., & Walker, L. M. 2014,
AJ, 147, 43Keto, E., Ho, L. C., Lo, K. -Y., ApJ, 635, 1062-1076 (2005)Kobulnicky, H. A. & Johnson, K. E. ApJ, 527, 154-166 (1999)Kroupa, P., Aarseth, S., & Hurley, J. MNRAS, 321, 699-712 (2001)Lada, C. J. & Lada, E. A. 2003, ARAA, 41, 57Leitherer, C. et al. ApJS, 123, 3-40 (1999)McLaughlin, D. E. & Fall, S. M. ApJ, 679, 1272-1287 (2008)Mengel, S., Lehnert, M. D., Thatte, N., & Genzel, R. A&A, 443,
41-60 (2005)Miocchi, P., Lanzoni, B., Dalessandro, E., Vesperini, E., Pasquato,
M., Beccari, G., Pallanca, C., & Sanna, N. ApJ, 774, 151-167(2013)
O’Connell, R. W., Gallagher, J. S., III, & Hunter, D. A. ApJ, 433,65-79 (1994)
Peebles, P. J. E. & Dicke, R. H. ApJ, 154, 891-908 (1968)Reines, A. E., Johnson, K. E., & Goss, W. M. (2008), ApJ, 685, 39Rosolowsky, R. & Leroy, A. PASP, 118, 590-610 (2006)Schweizer, F. et al. AJ, 136, 1482-1489 (2008)Shirley, Y. L., Ellsworth-Bowers, T. P., Svoboda, B., Schlingman,
W. M., Ginsburg, A., Rosolowsky, E., Gerner, T., Mairs, S.,Battersby, C., Stringfellow, G. Dunham, M., Glenn, J., & Bally,J. ApJS, 209, 2-17 (2013)
Tsai, C. -W., Turner, J. L., Beck, S. C., Meier, D. S., Ho, P. T. P.AJ, 137, 4655-4669 (2009)
Turner, J. L., Beck, S. C., & Ho, P. T. P. ApJ, 532, 109-112 (2000)Turner, J. L. & Beck, S. C. ApJ, 602, 85-88 (2004)Turner, J. L., Ho, P. T. P., & Beck, S. C., 1998, 116, 1212Ueda, J. et al., ApJ, 745, 65-79 (2012)Vacca, W. D., Garmany, C. D., & Shull, J. M. ApJ, 460, 914-931
(1996)van den Bergh, S., Morbey, C., Pazder, J. ApJ, 375, 594-599 (1991)van der Tak, F. F. S., Black, J. H., Schoier, F. L., Jansen, D. J., &
van Dishoeck, E. F. Astron. Astrophys, 468, 627-635 (2007)Wei, L. H., Keto, E., Ho, L. C. ApJ, 760, 136-154 (2012)Whitmore, B.C., Chandar, R., & Fall, S.M. 2007, AJ, 133, 1067Whitmore, B. C. et al. AJ, 140, 75-109 (2010)Whitmore, B. C, Brogan, C., Chandar, R., Evans, A., Hibbard, J.,
Johnson, K., Leroy, A., Privon, G., Remijan, A., Sheth, K. ApJ(in press)
Wilson, T. L. & Matteucci, F. Astron. Astrophys. Rev., 4, 1-33(1992)
Wilson, C. D., Scoville, N., Madden, S. C., & Charmandaris, V.ApJ, 542, 120-127 (2000)
Wilson, C. D. et al. ApJS, 178, 189-224 (2008)Zhang, Q. & Fall, S. M. ApJ, 527, 81-84 (1999)Zhang, Q., Fall, S.M., Whitmore, B.C. 2001, ApJ, 561, 727