the physics of the aapm’s tg51_rogers
TRANSCRIPT
7/31/2019 The Physics of the AAPM’s TG51_Rogers
http://slidepdf.com/reader/full/the-physics-of-the-aapms-tg51rogers 1/58
Chapter 9
The Physics of the AAPM’s
TG-51 ProtocolD. W. O. Rogers, Ph.D.
Carleton Laboratory for Radiotherapy PhysicsCarleton University, Ottawa, Ontario, Canada
1. Introduction .................................................................................................. 2392. The TG-51 Formalism ................................................................................. 240
2.1 Review of the Formalism ...................................................................... 2402.2 Summary of Relationships Between Quantities in TG-51.................... 2432.3 Rationale for the TG-51 Formalism ...................................................... 2432.4 Fundamentals of Ion Chamber Theory.................................................. 2452.5 Derivations of the Equations for Calculating k Q, k R50
, and k ecal ............. 2503. Beam Quality Specification ......................................................................... 252
3.1 Use of %dd(10)x for Photon Beams...................................................... 2523.2 Use of R50 for Electron Beams .............................................................. 255
4. The Physical Data Sets in TG-51................................................................ 2584.1 Stopping Powers and Stopping-Power Ratios....................................... 258
4.2 Mass-Energy Absorption Coefficients .................................................. 2624.3 (W/e)air ................................................................................................... 263
5. Calculation of TG-51 Factors ..................................................................... 2645.1 Converting Between %dd(10)x and ........................................... 2645.2 The Central Electrode Correction Factor, Pcel ....................................... 2665.3 The Wall Correction Factor, Pwall........................................................... 2695.4 The Fluence Correction Factor, P f l ........................................................ 2775.5 The Gradient Correction Factor, Pgr ...................................................... 279
6. The Pion Equation ......................................................................................... 285
7. Electron Beam Depth-Dose Curves............................................................ 2878. Measured k Q Values ..................................................................................... 2889. Summary....................................................................................................... 288Acknowledgments .............................................................................................. 289References ........................................................................................................... 290Problems ............................................................................................................. 296
1. Introduction
In 1998, the AAPM approved the TG-51 protocol for reference dosimetry of high-
energy photon and electron radiotherapy beams. The protocol, herein referred tosimply as TG51, was published in September 1999 (Almond et al. 1999) andreplaced the previous TG-21 protocol published in 1983 (AAPM TG-21) and
TPR1020
239
from "Clinical Dosimetry Measurements in Radiotherapy", eds D.W.O. Rogers and J.E. Cygler
Medical Physics Publishing (Madison WI) 2009

7/31/2019 The Physics of the AAPM’s TG51_Rogers
http://slidepdf.com/reader/full/the-physics-of-the-aapms-tg51rogers 2/58
herein referred to simply as TG-21. The TG-51 protocol document contains a mini-
mum of background material and is meant to explain how to do reference dosime-try accurately. Little justification is given in TG-51 for many of the steps involvedin using the protocol since this would have made the document more complex.While all of the data used in the protocol come from published papers, and therehave been two publications which describe most of the details of the calculationsused in TG-51 (Rogers 1996, 1998), this chapter is a long-overdue effort to docu-ment and explain, in a single place, as much of the physics and computationaldetails behind TG-51 as reasonable.
The chapter starts with an introduction to the protocol formalism and a derivationof the equations used in the formalism. This is followed by a discussion of the phys-ical data sets used in TG-51 and the details of the calculations of the various factorsused in the equations. The discussion of each correction factor includes a discussionof the current state-of-the-art for that particular factor and these sections can beskipped without loss of detail about TG-51. After this is a discussion of the equationsused for ion recombination corrections. The final section presents a summary of experimental work to measure k Q values, which can be summarized by saying that thephoton beam data measured in many different primary standards laboratories agreeswith the TG-51 calculated values within experimental uncertainties.
The notation used in this chapter is the same as that used in TG-51, extended
where necessary by the notation used in two previous summer school presentations(Rogers 1996,1992c). Since TG-51 was published, there has been an internationalconsensus to use the term “calibration coefficient” rather than “calibration factor”since a change of units is implied with N D,w. This terminology is used here but thereis no change in meaning from the term “calibration factor” as used in TG-51.
About 3 years after the AAPM approved the TG-51 protocol, the InternationalAtomic Energy Agency (IAEA) published a Code of Practice which is based onvery similar physics (with a few minor exceptions that will be discussed below) buta somewhat different notation (IAEA 2000). This will be referred to simply as TRS-398 (for Technical Report Series). Similarly the IAEA’s 1987 Code of Practice(IAEA 1987) will be referred to as TRS-277.
2. The TG-51 Formalism
2.1 Review of the Formalism
The major new feature of TG-51 compared to the previous TG-21 protocol is thatit starts from an absorbed-dose calibration coefficient rather than an exposure or
air-kerma calibration coefficient. Thus TG-51 starts with (in Gy/C or Gy/rdg),the absorbed-dose to water calibration coefficient for an ion chamber located in abeam of quality Q. Under reference conditions the dose is given by:
(9.1) D MN w
Q
D w
Q= ,,Gy
N D w
Q
,
240 D. W. O. Rogers

7/31/2019 The Physics of the AAPM’s TG51_Rogers
http://slidepdf.com/reader/full/the-physics-of-the-aapms-tg51rogers 3/58
where is the absorbed dose to water (in Gy) at the point of measurement of the
ion chamber when it is absent (i.e., at the reference depth); M is the fully correctedelectrometer reading in coulombs (C) or meter units (rdg) which has been correctedfor ion recombination, polarity, and electrometer calibration effects and corrected tostandard environmental conditions of temperature and pressure (see section 2.4.3);and the same or equivalent waterproofing sleeve is used as used during the calibra-tion (if needed). For photon beams the beam quality, Q, is specified by %dd(10)x,which is defined below. TG-51 presumes that absorbed-dose calibration coeffi-cients will usually be obtained for reference conditions in a 60Co beam, viz.,
The quality conversion factor, k Q, is defined such that:
(9.2)
i.e., k Q converts the absorbed-dose to water calibration coefficient for a 60Co beaminto the calibration coefficient for an arbitrary photon or electron beam of qualityQ. The quality conversion factor k Q is chamber specific. Using k Q, gives (Hohlfeld1988; Rogers 1992b; Andreo 1992):
(9.3)
For photon beams, TG-51 provides values of k Q as a function of Q for mostchambers used for reference dosimetry.
For electron beams, the beam quality, Q, is specified by R50, the depth incentimeters in water at which the dose drops to 50% of its maximum. In electronbeams the quality conversion factor k Q contains two components, i.e.:
(9.4)
where k R50, is a chamber-specific factor that depends on the quality for which the
absorbed-dose calibration coefficient was obtained and , the gradient correctionfactor (necessary only for cylindrical chambers) corrects for gradient effects at the
reference depth. The factor is necessitated by the fact that absorbed-dose cali-bration coefficients are defined with the chamber’s point of measurement at the
reference depth and by the fact that the value of depends on the radius of thechamber cavity and the ionization gradient at the point of measurement in the user’s
beam. Since can vary considerably in different clinical beams with the same
R50, the user must measure in their own beam using simple methods described
in TG-51. In contrast, the gradient effect in a photon beam of a given quality (i.e.,a given value of %dd(10)x) is always the same (and can be calculated, see section 5.5)
and thus can be included in the k Q value.
Pgr
Q
Pgr
Q
PgrQ
PgrQ
Pgr
Q
k P k Q gr
Q
R=
50
,
D Mk N wQ
Q D wCo= ,
.60
Gy
N k N D w
Q
Q D w
Co
, ,,=
60
Gy/C or Gy/rdg
N D w
Co
,.
60
Dw
Q
Chapter 9 The Physics of the AAPM’s TG-51 Protocol 241

7/31/2019 The Physics of the AAPM’s TG51_Rogers
http://slidepdf.com/reader/full/the-physics-of-the-aapms-tg51rogers 4/58
TG-51 writes k R50as the product of two factors, viz.:
(9.5)
The photon-electron conversion factor, k ecal, is fixed for a given chamber model andis just k R50
for an electron beam of arbitrary quality Qecal, i.e., the value needed,along with , to convert into , the absorbed-dose calibration coeffi-cient in an electron beam of quality Qecal. For TG-51 Qecal is taken to be a beamwith R50 = 7.5 cm (Rogers 1998). The electron beam quality conversion factor, k R50
,is beam quality dependent and, along with gradient corrections, converts into
. In an electron beam, TG-51 gives the dose as:
(9.6)
The photon-electron conversion factor, k ecal, was introduced since: (i) the chamber-to-chamber variation of k R50
is much less than that of k R50; (ii) k ecal is a directly
measurable quantity based on primary standards for absorbed dose in electronbeams; and (iii) k ecal plays a very natural role when cross-calibrating plane-parallelchambers against calibrated cylindrical chambers (see below).
Although the above procedure can be used with plane-parallel chambers, TG-51
strongly encourages users to cross-calibrate them in as high-energy electron beamsas available against calibrated cylindrical chambers. This was also recommendedby the AAPM’s TG-39 on plane-parallel chambers (Almond et al. 1994). The ratio-nale for this at the time was that there had been significant chamber-to-chambervariations reported for plane-parallel chambers in 60Co beams (Kosunen et al.1994) and there was considerable uncertainty in the calculated values of k ecal due touncertainties in the measured and the Monte Carlo–calculated values of Pwall beingused (see section 5.3.2). Since the publication of TG-51 there have been improve-ments in both the manufacture of these chambers and the measurements and calcu-lations (Kapsch et al. 2007; Mainegra-Hing et al. 2003), but cross-calibration is stillpreferred until these new chambers and values are being used.
To do a cross-calibration, one determines the beam quality and the referencedepth in the high-energy electron beam to be used and measures the responses of the chambers, in sequence, with the point of measurement of both the calibratedcylindrical chamber and the plane-parallel chamber at d ref . While measuring withthe cylindrical chamber, Pgr is measured (see below). Since the same dose is beingmeasured by the plane-parallel chamber and the cylindrical chamber, by applyingequation (9.6) for both chambers, one can deduce that:
(9.7)k N D
Mk
MP k ecal D w
Copp
wcyl
R
pp
gr R
,
60
50
( ) = ( )′( )
= ′ 550
60
50
k N
Mk
ecal D wCo
cyl
R
pp
,.( )
′( ) Gy/C
N D w
Q
,
N D wCo
,
60
D MP k k N wQ
grQ
R ecal D wCo= ′
50
60
,.Gy
N D w
Qecal
, N D w
Co
,
60
PgrQ
k k k R R ecal50 50
= ′ .
242 D. W. O. Rogers
7/31/2019 The Physics of the AAPM’s TG51_Rogers
http://slidepdf.com/reader/full/the-physics-of-the-aapms-tg51rogers 5/58
When using the plane-parallel chamber, this value of is used inequation (9.6), thereby avoiding the need for obtaining the 60Co absorbed-dosecalibration coefficient for the plane-parallel chamber. The way in which this
equation is developed in terms of k ecal and how the product can be natu-
rally used in equation (9.6) are strong reasons for introducing this factor in the firstplace.
Another major change in TG-51 compared to the TG-21 protocol was that thereference depth for electron beams is at d ref = 0.6 R50 − 0.1 cm instead of at thedepth of maximum ionization as in TG-21. As discussed below (see section 4.1.2),this leads to significant simplifications in using stopping-power ratios for realisticelectron beams.
2.2 Summary of Relationships Between Quantities in TG-51
The TG-51 formalism introduces several new quantities and it may be useful toreview which relationships are defined and which are derived. Equations (9.1),(9.2), (9.4), and (9.5) are the fundamental equations which define the factors N D,w,k Q, k R50
, k R50, k ecal, and . In addition we have, by definition, that:
(9.8)
Starting from these definitions, the dose equations in equation (9.3) for photonbeams and equation (9.6) for electron beams can be derived, as can the followinggeneral relations which are not used directly in TG-51 but which relate the variousabsorbed-dose calibration coefficients mentioned, where and are forelectron beams:
(9.9)
(9.10)
These relationships are summarized in figure 9-1. Equations (9.2), (9.9), and (9.10)can be used to measure k Q, k ecal, and k R50
by using primary standards to determineabsorbed-dose calibration coefficients.
2.3 Rationale for the TG-51 Formalism
The k Q formalism was not new with TG-51; it had been used for many years in theGerman protocol for clinical dosimetry (Hohlfeld 1988) and the advantages of this
N P
Pk N D w
Q gr
Q
gr
Q R
Q D w
Q
ecal
ecal, ,
.= ′50
N P k N D w
Q
gr
Q
ecal D w
Coecal ecal
, ,
=60
N D w
Q
, N D w
Qecal
,
k k ecal R
Qecal=50
.
PgrQ
k N ecal D w
Co
,
60
( )
k N ecal D w
Co pp
,
60
( )
Chapter 9 The Physics of the AAPM’s TG-51 Protocol 243

7/31/2019 The Physics of the AAPM’s TG51_Rogers
http://slidepdf.com/reader/full/the-physics-of-the-aapms-tg51rogers 6/58
7/31/2019 The Physics of the AAPM’s TG51_Rogers
http://slidepdf.com/reader/full/the-physics-of-the-aapms-tg51rogers 7/58
Another reason for using the absorbed-dose based formalism is that calculation
of k Q factors for photon beams are more accurate than the corresponding calcula-tions of CQ. This is because the k Q factors are calculated as ratios of corrections,whereas the CQ factors use the corrections themselves. For example, in the limit-ing case of 60Co beams, there is no uncertainty on the k Q value of unity. This argu-ment grows weaker for high-energy photon beams and even weaker in electronbeams.
2.4 Fundamentals of Ion Chamber Theory
TG-51 is based on much the same theory of ion chamber response as the TG-21protocol, but TG-51 does not need to make the conversion from an air-kermameasurement to an absorbed-dose measurement. TG-51 also includes variousimprovements in the theory of ion chamber response that had been developed in the15 years since TG-21 was published (e.g., corrections for aluminum electrodes anduse of realistic stopping-power ratios in electron beams).
2.4.1 Spencer-Attix Cavity Theory
The central theory underlying ion chamber dosimetry is Spencer-Attix cavity theory(Spencer and Attix 1955), which relates the dose delivered to the gas in the ionchamber, Dgas, to the dose in the surrounding medium, Dmed by the relationship:
(9.11)
where the stopping-power ratio, , is the ratio of the spectrum averaged
mass collision stopping powers for the medium to that for the gas where the aver-aging extends from a minimum energy ∆ to the maximum electron energy in thespectrum. The fundamental assumptions of this theory are that: (i) the electronspectrum in the cavity is not changed from the spectrum in the medium; (ii) all thedose in the cavity comes from electrons entering the cavity, i.e., they are not createdby photon interactions in the cavity; and (iii) electrons below the energy ∆ are incharged particle equilibrium. Unlike Bragg-Gray cavity theory, Spencer-Attixtheory applies where charged particle equilibrium above ∆ does not exist for theknock-on electrons created by electrons. The lack of CPE for knock-ons is gener-ally the case near an interface between media or at the edge of a beam.
The calculation of accurate stopping-power ratios has not changed much since
the late 1970s with two exceptions. The stopping-power ratios used by TG-51 forelectron beams take into account the realistic nature of the incident electron beams,including the photon contamination, and methods for specifying beam quality haveimproved. The details regarding the calculated values used in TG-51 are givenbelow in section 4.1.2.
Lgas
med ρ ( )
D DL
med gas
gas
med
=
ρ ,
Chapter 9 The Physics of the AAPM’s TG-51 Protocol 245
7/31/2019 The Physics of the AAPM’s TG51_Rogers
http://slidepdf.com/reader/full/the-physics-of-the-aapms-tg51rogers 8/58
2.4.2 Humidity Effects
To make use of equation (9.11) requires a connection between Dgas and the chargemeasured from the ion chamber. If M is the charge released in the ion chamber (i.e.,the corrected charge measurement, see next section), then:
(9.12)
where (W/e)gas (in J/C) is the energy deposited in a gas per unit charge of one signreleased and mgas is the mass of the gas in the cavity. Fortunately, (W/e)air is gener-ally believed to be a constant for dry air, independent of electron energy (Boutillonand Perroche-Roux 1987) (viz., 33.97±0.05 JC−1, but see section 4.3). One compli-cation in ion chamber dosimetry is that the humidity in the air causes each of the
quantities (W/e)gas, mgas, and to vary by up to 1%. This caused consider-
able confusion in the TG-21 protocol (for a complete discussion see Rogers andRoss (1988) and Mijnheer and Williams (1985) and references therein). The humid-ity correction factor accounts for these variations:
(9.13)
Due to offsetting effects and the fact that is for all practical purposes
independent of beam quality, K h is virtually constant as a function of beam qualityand relative humidity, with a value of 0.997 for relative humidity between roughly15% and 80%. Inserting equation (9.12) into equation (9.11) and rearranging termsleads to:
(9.14)
where use is made of the fact that All the references
are now to dry air, except for M, the charge released. Hence, Dair as defined explic-itly in equation (9.14) is not strictly the dose to dry air in the chamber because themeasured value, M, is still for the humid air. However, one can not define K h to givea strict dose to dry air, Dair, since K h only actually applies when used in equation(9.14) because it also corrects the stopping-power ratio.
L L Lgas
med
air
gas
air
med ρ ρ ρ ( ) ( ) = ( ) .
D K M
m
W
e
L K Dmed h
air air air
med
h ai=
=
ρ rr
air
med L
ρ
,
Lgas
air ρ ( )
K W
e
m
m
Lh
air
gas
air
gas gas
air
=
ρ .
Lgas
w ρ ( )
DM
m
W
egas
gas gas
=
Gy ,
246 D. W. O. Rogers

7/31/2019 The Physics of the AAPM’s TG51_Rogers
http://slidepdf.com/reader/full/the-physics-of-the-aapms-tg51rogers 9/58
2.4.3 Charge Measurement
In TG-51, the charge released in an ion chamber, M, is given by the fully correctedion chamber reading:
M = Pion Ptp Pelec P pol Mraw [C or rdg], (9.15)
where Mraw is the raw ion chamber reading in coulombs, C, or the instrument’sreading units (rdg); Ptp is the temperature-pressure correction which corrects thereading to the standard environmental conditions for which the ion chamber’scalibration coefficient applies; Pion corrects for incomplete ion collection effi-
ciency; P pol corrects for any polarity effects; and Pelec takes into account the elec-trometer’s calibration factor if the electrometer and ion chamber are calibratedseparately.
These corrections are well known and discussed in chapter 6 and hence will notbe discussed further here except to justify below that the TG-51 recommendationfor the ion recombination correction is slightly different from the TG-21 recom-mendations (see section 6).
2.4.4 Cavity Theory with Corrections
Real ion chambers are not ideal cavities. This raises an issue about the location atwhich the cavity is measuring the dose, a complex problem, which is discussedbelow (section 2.4.6). However, for a cylindrical ion chamber, in-phantom calibra-tion coefficients apply with the central axis of the chamber at the point of measure-ment, and for plane-parallel chambers, the point of measurement is taken as thefront of the cavity. There are also several correction factors that are needed beforeapplying equation (9.11), viz.:
(9.16)
These correction factors are discussed briefly below, but see Alan Nahum’s chapter 3in this monograph for further discussion.
2.4.5 The Wall Correction Factor, Pwall
The Pwall correction in equation (9.16) accounts for the fact that the wall and otherparts of the chamber are not usually made of the same material as the medium. Inelectron beams, TG-51 takes Pwall as unity as is done in TG-21 and other protocols.The values used in photon beams are discussed in section 5.3.1.
D DL
P P P P K med air
air
med
wall fl gr cel h=
ρ .
Chapter 9 The Physics of the AAPM’s TG-51 Protocol 247

7/31/2019 The Physics of the AAPM’s TG51_Rogers
http://slidepdf.com/reader/full/the-physics-of-the-aapms-tg51rogers 10/58
7/31/2019 The Physics of the AAPM’s TG51_Rogers
http://slidepdf.com/reader/full/the-physics-of-the-aapms-tg51rogers 11/58
work of Cunningham and Sontag (1980) and is discussed more fully in section 5.5.
In electron beams the correction factor for cylindrical chambers is measured as:
(9.18)
where Mraw is the uncorrected ion chamber reading and the offset (0.5 rcav) was deter-mined as described above. Use of this value of Pgr is equivalent to using the effectivepoint of measurement approach. The reason for using equation (9.18) rather than theeffective point of measurement approach is that it gives a consistent method that
allows for the use of primary standards to provide absorbed-dose calibration coeffi-cients in electron beams since calibration coefficients are traditionally given with thecentral axis of a cylindrical chamber at the point of measurement. One could definethe calibration coefficients to make use of an effective point of measurement, but thatpresumes knowledge of the correct effective point of measurement. As mentionedabove, our knowledge of the offset needed for an effective point of measurement isbased on very scattered data. It was felt to be more consistent in the long term toconsider explicitly the Pgr correction rather than mix it into the calibration of the ionchamber (as done, e.g., in TRS-398 for electron beams).
The Fluence Correction Factor, P fl . The other component of Prepl is the fluencecorrection, P f l, which corrects for other changes in the electron fluence spectrumdue to the presence of the cavity.
Fluence corrections are not required for photon beam dose determinations madeat or beyond d max in a broad beam because transient electron equilibrium exists and P f l corrections are only needed if the ion chamber is in a region where full or tran-sient charged particle equilibrium has not been established, i.e., in the build-upregion or near the boundaries of a photon beam or anywhere in an electron beam.The Fano theorem tells us that under conditions of charged particle equilibrium the
electron spectrum is independent of the density in the medium [see p. 255, Attix(1986)]. To the extent that the cavity gas is just low-density medium material, thistheorem tells us that the electron fluence spectrum is not affected by the cavityexcept in the sense of the gradient correction discussed above, which in essenceaccounts for there being transient rather complete charged particle equilibrium.Hence no fluence correction factor is needed in regions of transient charged parti-cle equilibrium.
In electron beams there are two competing effects: the in-scatter effect thatincreases the fluence in the cavity because electrons are not scattered out by the gas(⇒ P f l < 1.0) and the obliquity effect which decreases the fluence in the cavitybecause the electrons go straight instead of scattering (⇒ P f l > 1.0). The in-scattereffect tends to dominate, especially at low energies. The value of P f l can be up to5% less than unity for cylindrical chambers at d max in electron beams.
Details of P f l values used in TG-51 are discussed in section 5.4.
P M d r
d gr
raw=+( )( )
ref cav
raw ref M
0 5.,
Chapter 9 The Physics of the AAPM’s TG-51 Protocol 249

7/31/2019 The Physics of the AAPM’s TG51_Rogers
http://slidepdf.com/reader/full/the-physics-of-the-aapms-tg51rogers 12/58
2.4.7 The Central Electrode Correction Factor, Pcel
Cylindrical chambers have central electrodes in their cavities and these have someeffect on the chamber response. For electrodes made out of the same material as thephantom, any effect of the electrode can be thought of as part of P f l. Any furthereffects due to the electrode being made of another material are properly part of Pwall.However, it is useful to separate out the correction for electrode effects, and it iscalled Pcel. This correction was ignored in TG-21 but accounted for in TG-51 foraluminum electrodes.
2.5 Derivation of the Equations for Calculating k Q
, k R50
, and k ecal
With the fundamental equations of ion chamber theory in place as discussed in theprevious section, the equations for the factors used in TG-51 can be derived.
Equation (9.1) for the dose to water in terms of the absorbed-dose calibrationcoefficient gives:
(9.19)
Using equation (9.16) for Dw and equation (9.14) to define Dair gives:
(9.20)
Using equation (9.2) to define k Q, substituting equation (9.20) at the two beam qual-ities, assuming (W/e)air is constant with beam quality and ignoring the very smallvariation of K h with beam quality (Rogers and Ross 1988), one has:
(9.21)
where the numerator and denominator are evaluated respectively for the beam qual-ity Q of interest and the calibration beam quality, 60Co.
Equation (9.21) applies to both electron and photon beams and was used to
calculate the photon beam k Q factors in TG-51. However, in electron beams,since the factor Pgr is not known for an arbitrary value of the beam qualityspecifier, R50, this equation cannot be used. Instead a measured value of Pgr is
N K
m
W
e
L P P D w
Q h
air air air
w
wall fl,=
ρ P P Pgr cel
Gy/C .
N D
M D w
Q w
Q
,.= Gy/C
250 D. W. O. Rogers
k
L P P P P
LQ
air
w
wall fl gr cel
Q=
ρ
ρ
air
w
wall fl gr cel
Co
P P P P
60
,

7/31/2019 The Physics of the AAPM’s TG51_Rogers
http://slidepdf.com/reader/full/the-physics-of-the-aapms-tg51rogers 13/58
used and we can use equation (9.21) and calculate k R50as defined in equation (9.4)
as
(9.22)
Recall that Pwall is taken as unity in electron beams in TG-51 but this factor is lefthere for completeness in view of the discussion in section 5.3.3.
For the reasons discussed above, TG-51 further splits k R50into two components,
defined in equation (9.5), viz., k ecal and k R50. Using equation (9.8) for k ecal in terms of
k R50and the above equation for k R50
gives:
(9.23)
For a parallel-plate chamber, using the standard assumptions of TG-51 ( Pgr = Pcel = P f l = 1 for a plane-parallel chamber and Pwall = 1 for a plane-parallel chamber in anelectron beam) and using the known water to air stopping-power ratios for 60Co(1.1334) and R50 = 7.5 cm [1.0244, see equation (9.28)] gives:
(9.24)
Starting again from equation (9.5) and substituting equation (9.22) and equation(9.23), after lots of cancellation one obtains:
(9.25)
k P
ecal pp
wallCo= 0 903860. .
k PQ grQ :
Chapter 9 The Physics of the AAPM’s TG-51 Protocol 251
k
L P P P
L R
air
w
wall fl cel
Q
50
=
ρ
ρ
air
w
wall fl gr cel
Co
P P P P
60
.
k
L P P P
ecal
air
w
wall fl cel
Qecal=
ρ
L L P P P P
air
w
wall fl gr cel
Co ρ
60
.
′ =
k
L P P P
L R
air
w
wall fl cel
Q
50
ρ
ρ
air
w
wall fl cel
Q
P P P
ecal
.

7/31/2019 The Physics of the AAPM’s TG51_Rogers
http://slidepdf.com/reader/full/the-physics-of-the-aapms-tg51rogers 14/58
The above equations are the basis of the calculated values in TG-51. After a section
to discuss the issue of beam quality specification, and another section describingthe basis of the physical data used, the details of the calculations will be described.
3. Beam Quality Specification
To be able to select which values of various quantities should be used in the aboveequations for k Q, etc., it is necessary to have good beam quality specifiers in thesense that a given value of the beam quality specifier uniquely determines whichvalue of the quantity to select. The beam quality specifiers used in TG-51, viz.,
%dd(10)x and R50 for photon and electron beams respectively, are different fromthose used by TG-21 and some other protocols, viz., and
3.1 Use of %dd(10)x for Photon Beams
The quantity %dd(10)x is the photon component of the photon beam percentagedepth-dose at 10 cm depth in a 1010 cm2 field on the surface of a water phantom
at an SSD of 100 cm. is the ratio of the doses measured at constant source-detector distance (SDD) for depths of 20 cm and 10 cm for a 10102 cm field at the
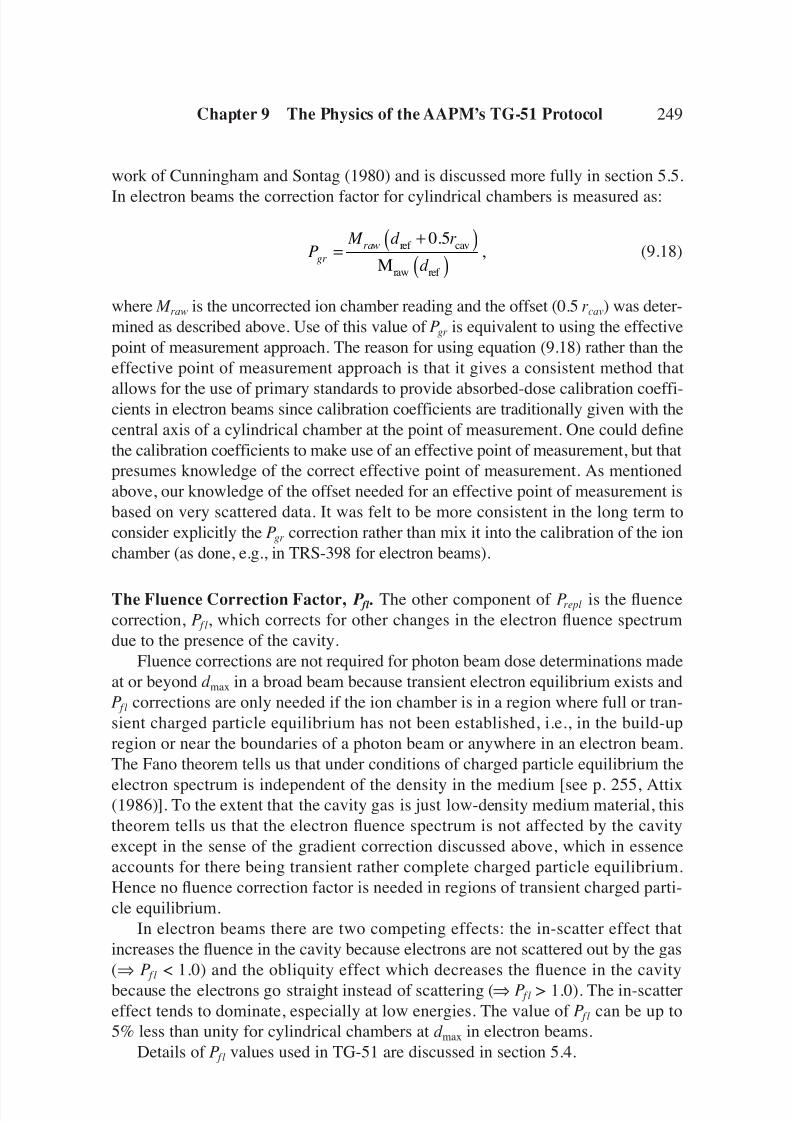
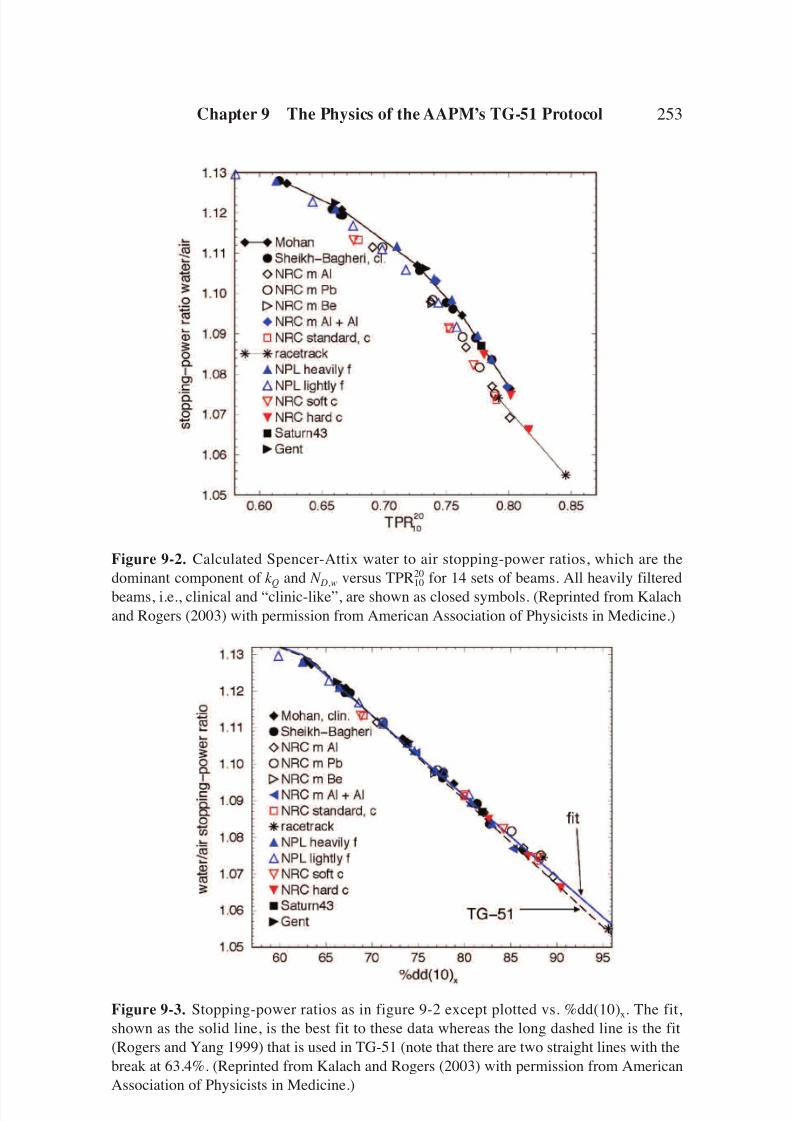
point of measurement.The reason for changing to %dd(10)x for photon beams is that was foundto be a poor beam quality specifier in the sense that one could have k Q values forbeams of the same value of which varied by over 1%, depending on othercharacteristics of the beam being used either for measurements of k Q (Seuntjens etal. 2000) or for k Q calculations (Kosunen and Rogers 1993). Figures 9-2 and 9-3present calculated stopping-power ratios versus %dd(10)x or as the beamquality specifiers. These stopping-power ratios are the dominant component of k Qand N D,w factors. The fact that there are two groupings of the data in figure 9-2 iswhy %dd(10)x is considered a better beam quality specifier since there is a single
grouping of the data as shown in figure 9-3. If one uses %dd(10)x as the beam qual-ity specifier, both measured and calculated results indicate that for a given value of %dd(10)x, there is only one corresponding k Q value. The choice of %dd(10)x
became surprisingly controversial since it was argued that is a good beamquality specifier for clinic-like beams and that it is primarily the unfiltered andtherefore very soft, nonclinical beams at the National Research Council (NRC) of
Canada for which is a poor beam quality specifier (Andreo 2000). Figure 9-2
bears this assertion out and proves that is a good beam quality specifier for
typical commercial, clinical accelerator photon beams available in 2000 (Kalachand Rogers 2003). However, this assertion was a conjecture at the time that TG-51was being developed. More importantly, up until 1997 the expectation was thatTG-51 would be based on an extensive set of k Q values being measured at NRC. Inthis case, it would have been mandatory to use %dd(10) x as the beam quality
TPR1020
TPR10
20
TPR10
20
TPR10
20
TPR10
20
TPR10
20
TPR1020
Eo.TPR
10
20
252 D. W. O. Rogers
7/31/2019 The Physics of the AAPM’s TG51_Rogers
http://slidepdf.com/reader/full/the-physics-of-the-aapms-tg51rogers 15/58
Chapter 9 The Physics of the AAPM’s TG-51 Protocol 253
Figure 9-2. Calculated Spencer-Attix water to air stopping-power ratios, which are thedominant component of k Q and N D,w versus TPR20
10 for 14 sets of beams. All heavily filteredbeams, i.e., clinical and “clinic-like”, are shown as closed symbols. (Reprinted from Kalachand Rogers (2003) with permission from American Association of Physicists in Medicine.)
Figure 9-3. Stopping-power ratios as in figure 9-2 except plotted vs. %dd(10)x. The fit,shown as the solid line, is the best fit to these data whereas the long dashed line is the fit(Rogers and Yang 1999) that is used in TG-51 (note that there are two straight lines with thebreak at 63.4%. (Reprinted from Kalach and Rogers (2003) with permission from AmericanAssociation of Physicists in Medicine.)

7/31/2019 The Physics of the AAPM’s TG51_Rogers
http://slidepdf.com/reader/full/the-physics-of-the-aapms-tg51rogers 16/58
specifier since even the most ardent advocates of using recognize that it does
not work as a beam quality specifier for the NRC beams.In the end, the TG-51 protocol is based on calculated values of k Q but it is still
very advantageous to have used %dd(10)x as a beam quality specifier because it hasallowed the extensive NRC measured data to be used to validate the calculatedvalues in TG-51, this despite the fact that the lightly filtered NRC beams aredistinctly non-clinical. Some of these data from Seuntjens et al. (2000) are reviewedbelow (see section 8) since they add considerable authority to the values of k Qpresented in TG-51.
With the recent interest in using accelerators without flattening filters because
of their advantages in intensity-modulated radiation therapy (IMRT) (Titt et al.2006), selection of %dd(10)x becomes more valuable since %dd(10)x is still a goodbeam quality specifier for these very soft beams whereas breaks down as abeam quality specifier to select stopping-power ratios by between 0.4% and 1%(Xiong and Rogers 2008).
3.1.1 Correcting for Electron Contamination in Measuring %dd(10) x
All photon beams include electron contamination and thus any measured %dd(10)m ispotentially reduced by this electron contamination if the contamination contributes tothe dose at d
max, the depth of dose maximum. This complicates the measurement of
%dd(10)x which refers only to the photon component of the depth-dose curve.If the electron contamination were the same for all beams of the same photon
beam quality, then one could use %dd(10)m as the beam quality specifier. Unfortu-nately this is not the case. However, it has been found that the contribution of elec-tron contamination to the dose at d max in a 1010 cm2 field is negligible for beamswith energies of less than about 10 MV. At 10 MV and above, it is necessary to takeinto account the electron contamination.
If one places a 1 mm slab of lead immediately below an accelerator head, thelead scatters the electrons so broadly that the contribution to the dose at d max in
the phantom is negligible (Li and Rogers 1994; Rogers 1999). However the leadhas two further effects: it creates its own electron contamination and it slightlyhardens the beam because it preferentially filters out low-energy photons. Fortu-nately, these two effects can be accurately calculated using Monte Carlo tech-niques and this allows a simple relationship to be derived between the value of %dd(10)Pb, the measured percentage depth-dose (PDD) with the lead foil in placeand %dd(10)x, the photon component of the PDD of the beam with no leadpresent. Figure 9-4 presents the Monte Carlo–calculated values of , the ratio of %dd(10)x to %dd(10)Pb for 1 mm lead foils placed 30 or 50 cm from the phantomsurface. This figure is the basis of equations (13) and (14) in TG-51 which gives%dd(10)x in the open beam based on the measure value of %dd(10)Pb with the foilin place.
′ f e
TPR1020
TPR1020
254 D. W. O. Rogers

7/31/2019 The Physics of the AAPM’s TG51_Rogers
http://slidepdf.com/reader/full/the-physics-of-the-aapms-tg51rogers 17/58
3.2 Use of R50 for Electron Beams
The beam quality specifier for electron beams is the depth at which the dose falls to50% of its maximum, R50, whereas previously it was E
–o, the mean energy of the
electrons at the surface of the phantom (TG-21, TRS-277). This change was not ascontroversial as the adoption of %dd(10)x for photon beams because the values of
E –
o were already indirectly based on values of R50.The reasons for abandoning E
–o as a specifier are twofold. The first is that there
is no simple way to determine E –
o . Shortly after publication, TG-21’s simple E –
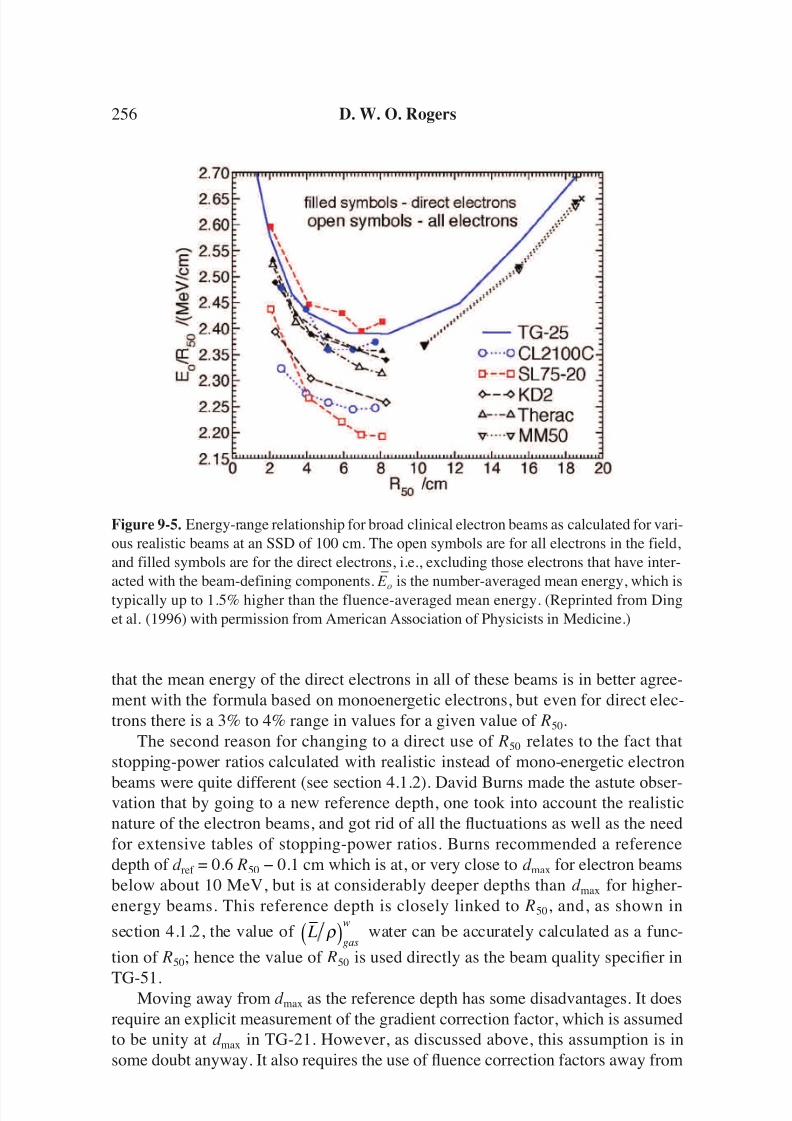
o = 2.33 R50 formula was found to be inaccurate, especially at lower and higherenergies (Rogers and Bielajew 1986) and the AAPM’s TG-25 report on electronbeam dosimetry (Khan et al. 1991) recommended some more accurate formulae,but these were still based on Monte Carlo calculations for monoenergetic electronbeams. With the accurate simulation of realistic electron beams it became possibleto study the actual values of E
–o for electron beams (Ding et al. 1996) and these
energies do not correlate well with R50
. For example, figure 9-5 shows that for20 MeV beams, the correct mean energy for a 20 MeV Clinac 2100C beam is morethan 6% less than predicted by the formula recommended by TG-25. It can be seen
Chapter 9 The Physics of the AAPM’s TG-51 Protocol 255
Figure 9-4. Monte Carlo–calculated values of the ratio = %dd(10)x/%dd(10)Pb as a func-
tion of %dd(10)Pb, which is what is measured. The filled symbols are for a 1 mm lead foilplaced 30 cm from the phantom surface, and the open symbols are for the foil at 50 cm.
(Reprinted from Rogers (1999) with permission from American Association of Physicists inMedicine.)
′ f e
7/31/2019 The Physics of the AAPM’s TG51_Rogers
http://slidepdf.com/reader/full/the-physics-of-the-aapms-tg51rogers 18/58
that the mean energy of the direct electrons in all of these beams is in better agree-ment with the formula based on monoenergetic electrons, but even for direct elec-trons there is a 3% to 4% range in values for a given value of R50.
The second reason for changing to a direct use of R50 relates to the fact thatstopping-power ratios calculated with realistic instead of mono-energetic electron
beams were quite different (see section 4.1.2). David Burns made the astute obser-vation that by going to a new reference depth, one took into account the realisticnature of the electron beams, and got rid of all the fluctuations as well as the needfor extensive tables of stopping-power ratios. Burns recommended a referencedepth of d ref = 0.6 R50 − 0.1 cm which is at, or very close to d max for electron beamsbelow about 10 MeV, but is at considerably deeper depths than d max for higher-energy beams. This reference depth is closely linked to R50, and, as shown in
section 4.1.2, the value of water can be accurately calculated as a func-
tion of R50; hence the value of R50 is used directly as the beam quality specifier in
TG-51.Moving away from d max as the reference depth has some disadvantages. It doesrequire an explicit measurement of the gradient correction factor, which is assumedto be unity at d max in TG-21. However, as discussed above, this assumption is insome doubt anyway. It also requires the use of fluence correction factors away from
Lgas
w ρ ( )
256 D. W. O. Rogers
Figure 9-5. Energy-range relationship for broad clinical electron beams as calculated for vari-ous realistic beams at an SSD of 100 cm. The open symbols are for all electrons in the field,and filled symbols are for the direct electrons, i.e., excluding those electrons that have inter-acted with the beam-defining components.
E
–
ois the number-averaged mean energy, which is
typically up to 1.5% higher than the fluence-averaged mean energy. (Reprinted from Dinget al. (1996) with permission from American Association of Physicists in Medicine.)
7/31/2019 The Physics of the AAPM’s TG51_Rogers
http://slidepdf.com/reader/full/the-physics-of-the-aapms-tg51rogers 19/58
d max, despite the fact that the main source of data for these factors is measured
at d max (Johansson et al. 1977) (see section 5.4). The final disadvantage, at least forhigher-energy beams, is that most clinical patient dose calculation algorithms arebased on the dose at d max and thus one must transfer the reference dose at d ref tod max. This leads to some complications, which are discussed below in section 7, butthis is not a completely new issue since TRS-277 also allowed reference dosimetryto be done away from d max at 1 or 2 cm depth.
3.2.1 Measuring R50
In TG-21 there was little attention paid to the difference between R50 and I 50, the
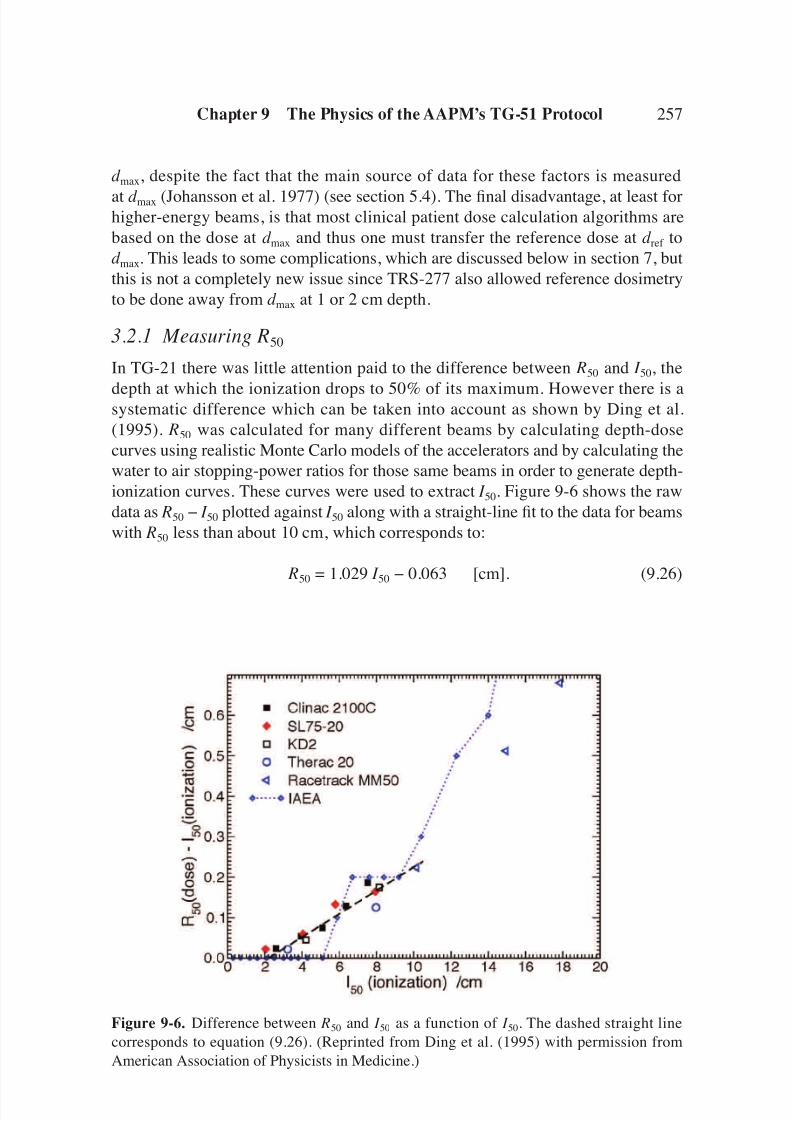
depth at which the ionization drops to 50% of its maximum. However there is asystematic difference which can be taken into account as shown by Ding et al.(1995). R50 was calculated for many different beams by calculating depth-dosecurves using realistic Monte Carlo models of the accelerators and by calculating thewater to air stopping-power ratios for those same beams in order to generate depth-ionization curves. These curves were used to extract I 50. Figure 9-6 shows the rawdata as R50 − I 50 plotted against I 50 along with a straight-line fit to the data for beamswith R50 less than about 10 cm, which corresponds to:
R50 = 1.029 I 50 − 0.063 [cm]. (9.26)
Chapter 9 The Physics of the AAPM’s TG-51 Protocol 257
Figure 9-6. Difference between R50 and I 50 as a function of I 50. The dashed straight linecorresponds to equation (9.26). (Reprinted from Ding et al. (1995) with permission fromAmerican Association of Physicists in Medicine.)

7/31/2019 The Physics of the AAPM’s TG51_Rogers
http://slidepdf.com/reader/full/the-physics-of-the-aapms-tg51rogers 20/58
This approach assumes that an effective point of measurement is used when the
depth-ionization measurements are done (see chapters 7 and 12) and that the prod-uct of other corrections, Pwall Pcel P f l, remains constant throughout the depth-dosecurve.
Using similar assumptions and the stopping-power ratios for monoenergeticelectrons as specified in the report of TG-25 (Khan et al. 1991) to convert measureddepth-ionization curves to depth-dose curves, Huq et al. (1997) showed that theabove equation was consistent with their measurements within 0.4 mm except forone high-energy beam where it disagreed with experiment by 1.2 mm.
4. The Physical Data Sets in TG-51TG-51 makes use, either directly or indirectly, of at least three external sets of physi-cal data. In many cases these data are taken directly from previous protocols (TG-21or TRS-277).
4.1 Stopping Powers and Stopping-Power Ratios
The most critical physical data are electron stopping powers for various materialsas these are needed to calculate stopping-power ratios. Since the mid 1980s there
has been an agreement amongst primary standards laboratories to use the stoppingpowers from Intrnational Commission on Radiation Units and Measurements(ICRU) Report 37 (ICRU 1984b) which is based directly on the work of Berger andSeltzer (1983) at National Institute for Standards and Technology (NIST) (thenNational Bureau of Standards [NBS]). These values have been used consistently inTG-51. This was not the case in TG-21 where the stopping-power ratios for elec-tron beams used this data set, but for photon beams a slightly earlier data set wasused from ICRU Report 35 (ICRU 1984a) (also based on NIST data). The differ-ences between these two data sets are considerable.
4.1.1 for Photon Beams
Figure 9-7 compares water to air stopping-power ratios as used in TG-51, TG-21,and TRS-277. For %dd(10)x values between 75% and 80%, the stopping powerused in TG-51 is about 1.3% less than that used in the dose equation for TG-21although the discrepancy is less for lower-energy beams. TG-21 used a slightlydifferent (0.2% to 0.3% higher) set of values for this same stopping-power ratiowhen calculating Pwall corrections. The data from TRS-277 differ slightly from theTG-51 values only at lower energies. Since most of these data were originally
presented as a function of , some of the difference could come from themapping of values to %dd(10)x values (described below in section 5.1).
The stopping-power ratios for photon beams in TG-51 were based on the Monte
Carlo–calculated values of and %dd(10)x for about 25 different realistic
TPR10
20TPR10
20
Lair
water ρ ( )
Lair
water ρ ( )
258 D. W. O. Rogers
7/31/2019 The Physics of the AAPM’s TG51_Rogers
http://slidepdf.com/reader/full/the-physics-of-the-aapms-tg51rogers 21/58
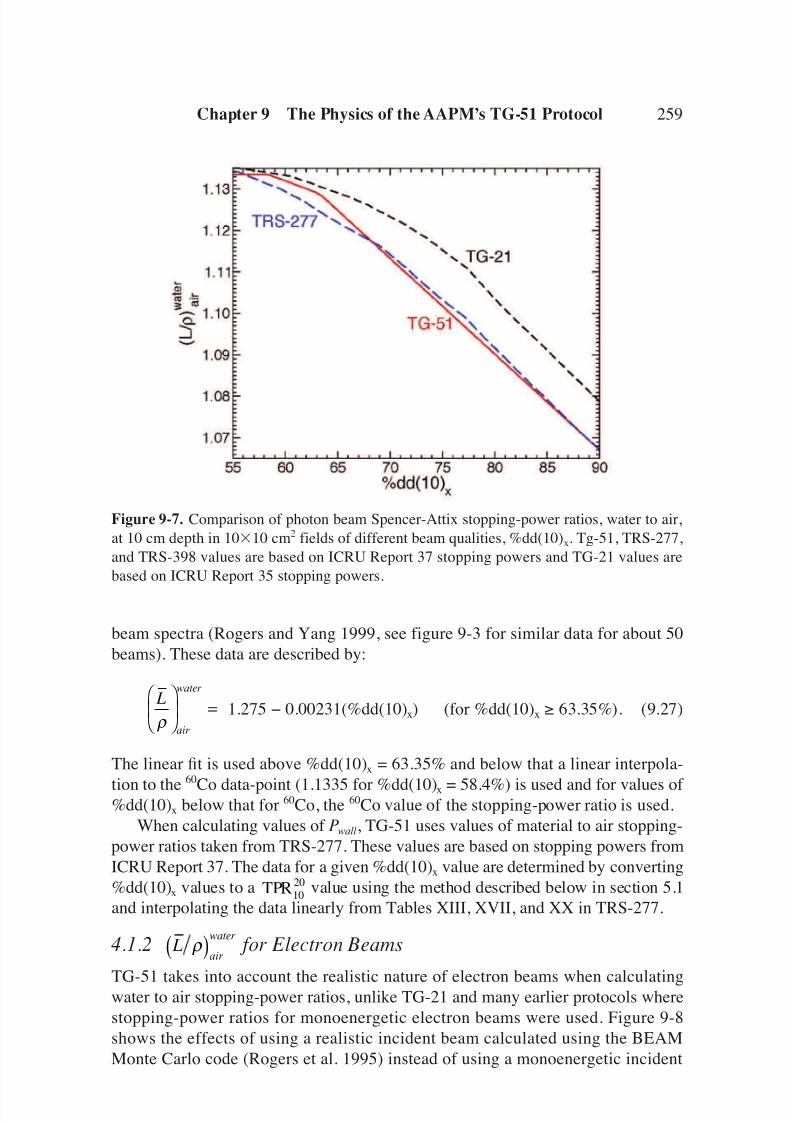
beam spectra (Rogers and Yang 1999, see figure 9-3 for similar data for about 50beams). These data are described by:
1.275 − 0.00231(%dd(10)x) (for %dd(10)x ≥ 63.35%). (9.27)
The linear fit is used above %dd(10)x = 63.35% and below that a linear interpola-
tion to the60
Co data-point (1.1335 for %dd(10)x = 58.4%) is used and for values of %dd(10)x below that for 60Co, the 60Co value of the stopping-power ratio is used.When calculating values of Pwall, TG-51 uses values of material to air stopping-
power ratios taken from TRS-277. These values are based on stopping powers fromICRU Report 37. The data for a given %dd(10)x value are determined by converting%dd(10)x values to a value using the method described below in section 5.1and interpolating the data linearly from Tables XIII, XVII, and XX in TRS-277.
4.1.2 for Electron Beams
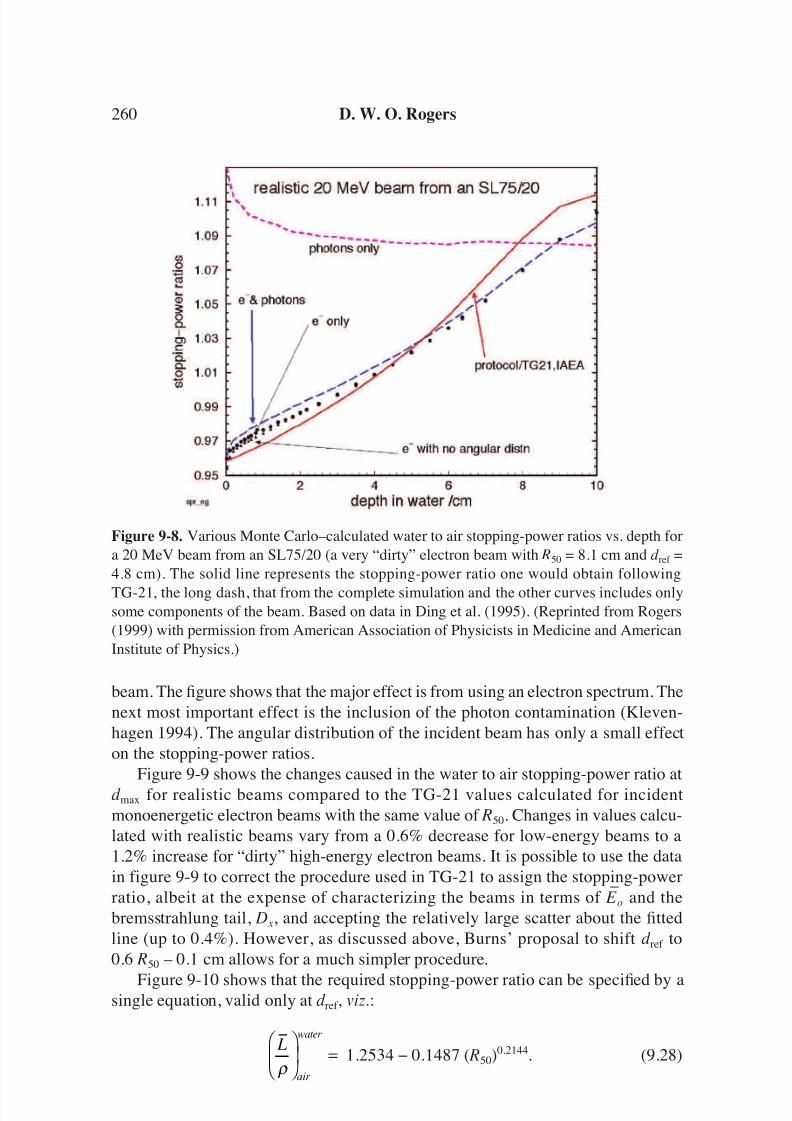
TG-51 takes into account the realistic nature of electron beams when calculatingwater to air stopping-power ratios, unlike TG-21 and many earlier protocols wherestopping-power ratios for monoenergetic electron beams were used. Figure 9-8shows the effects of using a realistic incident beam calculated using the BEAMMonte Carlo code (Rogers et al. 1995) instead of using a monoenergetic incident
Lair
water ρ ( )
TPR10
20
L
air
water
ρ
=
Chapter 9 The Physics of the AAPM’s TG-51 Protocol 259
Figure 9-7. Comparison of photon beam Spencer-Attix stopping-power ratios, water to air,at 10 cm depth in 1010 cm2 fields of different beam qualities, %dd(10)x. Tg-51, TRS-277,and TRS-398 values are based on ICRU Report 37 stopping powers and TG-21 values arebased on ICRU Report 35 stopping powers.
7/31/2019 The Physics of the AAPM’s TG51_Rogers
http://slidepdf.com/reader/full/the-physics-of-the-aapms-tg51rogers 22/58
beam. The figure shows that the major effect is from using an electron spectrum. Thenext most important effect is the inclusion of the photon contamination (Kleven-hagen 1994). The angular distribution of the incident beam has only a small effecton the stopping-power ratios.
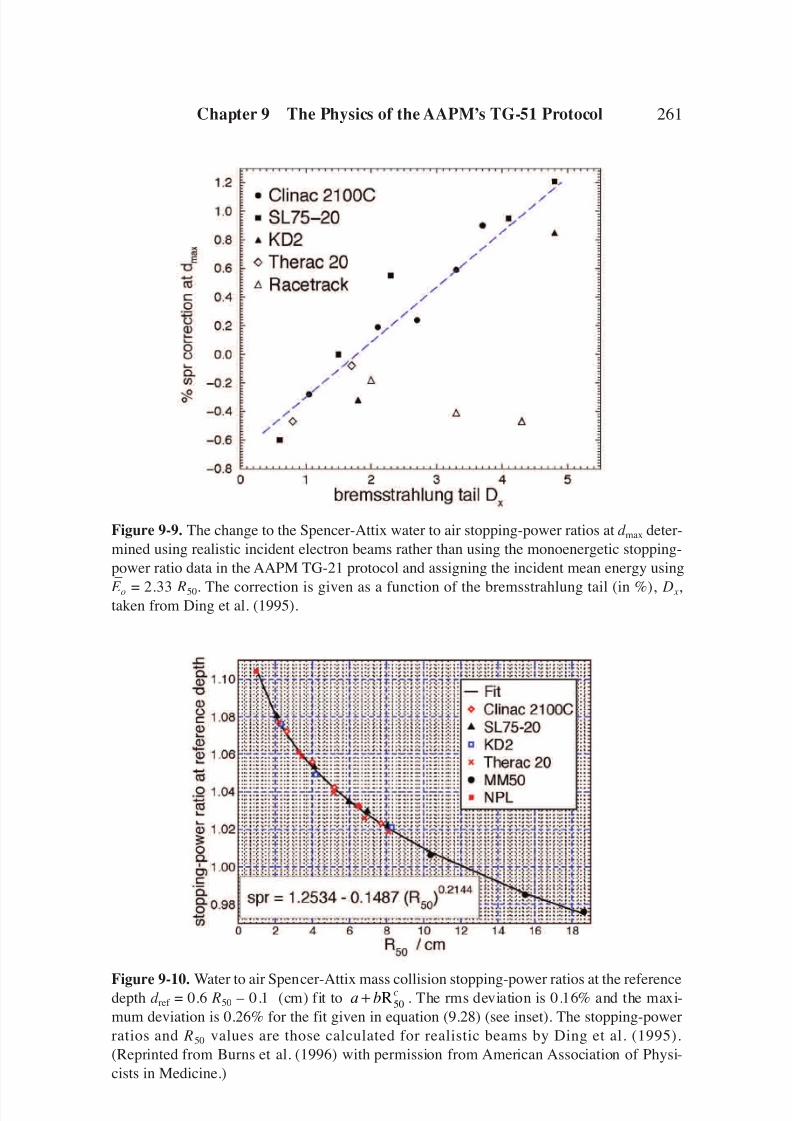
Figure 9-9 shows the changes caused in the water to air stopping-power ratio atd max for realistic beams compared to the TG-21 values calculated for incidentmonoenergetic electron beams with the same value of R50. Changes in values calcu-lated with realistic beams vary from a 0.6% decrease for low-energy beams to a1.2% increase for “dirty” high-energy electron beams. It is possible to use the datain figure 9-9 to correct the procedure used in TG-21 to assign the stopping-powerratio, albeit at the expense of characterizing the beams in terms of E
–o and the
bremsstrahlung tail, D x, and accepting the relatively large scatter about the fittedline (up to 0.4%). However, as discussed above, Burns’ proposal to shift d ref to0.6 R50 – 0.1 cm allows for a much simpler procedure.
Figure 9-10 shows that the required stopping-power ratio can be specified by asingle equation, valid only at d ref , viz.:
1.2534 − 0.1487 ( R50)0.2144. (9.28) L
air
water
ρ
=
260 D. W. O. Rogers
Figure 9-8. Various Monte Carlo–calculated water to air stopping-power ratios vs. depth fora 20 MeV beam from an SL75/20 (a very “dirty” electron beam with R50 = 8.1 cm and d ref =4.8 cm). The solid line represents the stopping-power ratio one would obtain following
TG-21, the long dash, that from the complete simulation and the other curves includes onlysome components of the beam. Based on data in Ding et al. (1995). (Reprinted from Rogers(1999) with permission from American Association of Physicists in Medicine and AmericanInstitute of Physics.)
7/31/2019 The Physics of the AAPM’s TG51_Rogers
http://slidepdf.com/reader/full/the-physics-of-the-aapms-tg51rogers 23/58
Chapter 9 The Physics of the AAPM’s TG-51 Protocol 261
Figure 9-9. The change to the Spencer-Attix water to air stopping-power ratios at d max deter-mined using realistic incident electron beams rather than using the monoenergetic stopping-power ratio data in the AAPM TG-21 protocol and assigning the incident mean energy using
E
–o = 2.33 R50. The correction is given as a function of the bremsstrahlung tail (in %), D x,taken from Ding et al. (1995).
Figure 9-10. Water to air Spencer-Attix mass collision stopping-power ratios at the referencedepth d ref = 0.6 R50 – 0.1 (cm) fit to . The rms deviation is 0.16% and the maxi-mum deviation is 0.26% for the fit given in equation (9.28) (see inset). The stopping-powerratios and R50 values are those calculated for realistic beams by Ding et al. (1995).(Reprinted from Burns et al. (1996) with permission from American Association of Physi-cists in Medicine.)
a b c+ R50

7/31/2019 The Physics of the AAPM’s TG51_Rogers
http://slidepdf.com/reader/full/the-physics-of-the-aapms-tg51rogers 24/58
This equation is used directly in the calculation of various factors in TG-51 and
although other parameters may only be accurate for R50 greater than 2, this equationis based on a fit to data down to R50 = 1.0 cm.
4.1.3 Stopping-Power Ratios: State-of-the-Art
The uncertainties in calculated stopping-power ratios are primarily due to uncer-tainties in the underlying stopping powers, which mostly depend on a knowledge of the mean ionization value of the materials involved. The ICRU is reevaluating thestopping power data (Steve Seltzer, NIST, private communication, 2008) but it isworth noting that Bichsel and Hiraoka (1992) reported a measured I-value for
water of 79.7±0.5 eV compared to the ICRU Report 37’s value of 75±3 eV, whichis used in the current calculations. However, this 6% change in I-value only leadsto changes in water stopping power of between 0.4% at 1 MeV and 0.1% at 10 MeVand thus will not make a significant difference.
Xiong and Rogers (2008) have recently reported new calculations of stopping-power ratios for a variety of clinical beams that differ in several ways from previ-ous calculations. First, they used full accelerator simulations when calculating thestopping-power ratios, which thereby included off-axis variations in both thephoton spectra and the photon fluence (horns) unlike prior work which used realis-tic spectra from point sources. Previously the fluence and the spectrum were
considered uniform across the entire field. The accelerator beams considered byXiong and Rogers also included beams with the flattening filters removed becausethere are suggestions that this is more efficient when doing IMRT treatments(Titt et al. 2006). Despite the variations in the beams, the underlying relationshipbetween and %dd(10)x remains valid as used in TG-51 although a slight
change would improve the relationship marginally if the protocol were to be rewritten.
4.2 Mass-Energy Absorption Coefficients
The ratio of mass-energy absorption coefficients for material A to material B,, plays a role in dosimetry since it relates the doses in two materials in a
photon beam when there is charged particle equilibrium (which rarely occurs forsmall volumes in high-energy beams). These ratios play a minor role in TG-51since they are needed to calculate ratios of Pwall values in equation (9.21) usingequation (9.33) presented below for Pwall. Thus they are not as important as inTG-21 where they are used directly in the equation for N gas in addition to the calcu-lation of Pwall (not its ratio) and K comp. The values of ratios of mass-energy absorp-tion coefficients in TG-51 are taken directly from TRS-277. These values were
calculated for a point at depth in a phantom by Cunningham using the Monte Carlotechniques described in an earlier paper by Cunningham et al. (1986). The basicmass energy absorption coefficient data are from Hubbell (1982). In contrast, theratios of mass-energy absorption coefficients in TG-21 are based on a more
µ ρ en
B
A
( )
Lair
water ρ ( )
262 D. W. O. Rogers

7/31/2019 The Physics of the AAPM’s TG51_Rogers
http://slidepdf.com/reader/full/the-physics-of-the-aapms-tg51rogers 25/58
restricted set of analytic calculations (Cunningham and Schulz 1984) which did notinclude scattered photons and which were based on the mass-energy absorptioncoefficient data of Howerton (as quoted in Johns and Cunningham 1983). Thesetwo data sets are compared in figure 9-11, which shows up to 1% changes in theratios for water to graphite.
4.2.1 Mass-Energy Absorption Coefficients: State-of-the-Art
There has been little investigation of ratios of mass-energy absorption coefficients.
However, in a paper about Pwall values, Buckley and Rogers (2006b) calculated awide range of these ratios in an attempt to explain some Pwall differences, whichare discussed below (see section 5.3.3). The results showed that the values used inTG-51 are within ≈0.1% usually, and at worst 0.3%, of the values calculated withan EGSnrc Monte Carlo calculation at depth in a phantom using the latest values of photon cross sections and realistic accelerator spectra.
4.3 (W/e)air
TG-51 is independent of the actual value of the mean energy deposited by electrons
slowing down per coulomb of charge of one sign released in air, but it does dependon the value of (W/e)air being a constant over the entire range of beam qualitiesconsidered here. The evidence for this constancy is not very strong. In fact, Svens-son and Brahme (1986) reanalyzed an extensive set of data measured by Domen
Chapter 9 The Physics of the AAPM’s TG-51 Protocol 263
Figure 9-11. Ratio of spectrum averaged mass-energy absorption coefficients, water tographite as used in TRS-277 and TG-51, compared to the values used in TG-21 for Pwall
calculations.
7/31/2019 The Physics of the AAPM’s TG51_Rogers
http://slidepdf.com/reader/full/the-physics-of-the-aapms-tg51rogers 26/58
and Lamperti (1976) and concluded that (W/e) varies by about 1%. The situation is
complex to assess, and an analysis including the effects of realistic electron beamsin the experiment could change the situation further. Nonetheless, the assumptioncontinues to be made that the value of (W/e) does not change. As we shall seebelow, the good agreement between the measured and calculated values of k Qsuggests that any variation of (W/e) in photon beams is not too important.
For comparisons to the air-kerma–based protocols such as TG-21, one needs avalue of (W/e)air. This value was reviewed in ICRU Report 31 (ICRU 1979) but thestandard value today is taken from the work of Boutillon and Perroche-Roux(1987). They reanalyzed all the previous data, took into account correlations andcame up with a value for dry air of (W/e)
air
= 33.97±0.06 J/C.
4.3.1 (W/e)air: State-of-the-Art
The subject of the determination of a value for (W/e)air is very complex since it
requires knowledge of the value of However, for the comparison
mentioned in the previous paragraph, one only needs a knowledge of the product of
these two quantities, viz., in a 60Co beam. There are strong
indications that the accepted value of this product is actually wrong by about 1%,which means that most primary standards for air kerma will require a 1% reduction(Wang and Rogers 2008b). While not directly relevant to TG-51 except for thecomparisons mentioned above, this volatility in primary standards for air kerma ina 60Co beam is yet another strong reason for the TG-51 change to using calibrationcoefficients based on primary standards for absorbed dose to water, which have notbeen so volatile.
5. Calculation of TG-51 Factors
The factors k Q, k ecal, and k R50are needed in TG-51 for all reference ion chambers as
a function of beam quality. These are calculated using equations (9.21), (9.23), and(9.25), respectively. These equations make use of the various factors defined and
discussed in the above sections, viz., , Pwall, P f l, Pgr, and Pcel. In the follow-
ing sections, the details of the calculations for each factor are reviewed in turn and,where appropriate, compared to those in TG-21.
The calculations for TG-51 were done by a suite of programs called PROT(Rogers and Booth 2009). A detailed report describing this suite of programs willbe available on-line at http://www.physics.carleton.ca/~drogers/pubs/papers/.
5.1 Converting between %dd(10)x and
TG-51 uses various values from TRS-277 which are presented as a function of . It is thus necessary to convert between the two beam qualities. This wasTPR
10
20
TPR1020
Lair
water ρ ( )
W e Lair air
graphite
( ) ( ) ρ
Lair
graphite ρ ( ) .
264 D. W. O. Rogers

7/31/2019 The Physics of the AAPM’s TG51_Rogers
http://slidepdf.com/reader/full/the-physics-of-the-aapms-tg51rogers 27/58
done by using a set of values (Kosunen and Rogers 1993) and %dd(10)x
values for the same nine clinical or clinic-like spectra (Rogers and Yang 1999).These pairs of values have been fit by cubic polynomials to give:
(9.29)
and
= − 2.079 + 0.08732 %dd(10)x − 0.0009132 (%dd(10)x)2
(9.30)
These relationships do not hold in general in nature. If there were a one-to-onecorrespondence for all beams, as implied by the equations, there would be no pointin using %dd(10)x instead of . However, these relationships were consideredaccurate enough for the purposes of converting between beam quality specifiers forclinical beams to allow access to physical data such as mass-energy absorptioncoefficients, which were tabulated in terms of when they are needed forcalculations of corrections such as Pwall.
5.1.1 Converting Between %dd(10) x and : State-of-the-Art
Since TG-51 was produced, Kalach and Rogers (2003) did a much more detailedstudy of the relationship between %dd(10)x and and found that for a verybroad range of clinical and clinic-like beams (i.e., heavily filtered beams), there isa unique relationship between %dd(10)x and , viz.:
= −0.8228 + 0.0342 (%dd(10)x) − 0.0001776 (%dd(10)x)2, (9.31)
with an rms deviation of the data about the fit of 0.0034 and a maximumdeviation of 0.007. In the other direction one has:
(9.32)
The rms deviation is 0.46 and the maximum deviation in values of %dd(10)x fromthe fit is 0.9%.
For heavily filtered beams, these expressions can be used to check measuredvalues of and %dd(10)x and ensure that they are consistent.
Figure 9-12 compares the results from that study to those developed and used inthe calculations for TG-51. The two fitted curves are in excellent agreement. The fitto the measured data is also in good agreement with the fit to the calculated data,although there is considerable scatter in the measured results [see original paper,Kalach and Rogers (2003)].
Note that these relationships do not apply for lightly filtered beams either instandards labs or for IMRT machines without flattening filters.
TPR1020
% . . .dd TPR TPRx
10 430 62 2181 9 3318 310
20
1( ) = − + ( ) −00
202
10
203
1746 5( ) + ( ). TPR
TPR10
20
TPR10
20
TPR1020
TPR10
20
TPR1020
TPR1020
TPR10
20
TPR10
20
% . . .dd TPR TPRx
10 106 6 759 3 12561020
1020( ) = − + × − × (( ) + × ( )
2
1020
3
756 8. TPR
TPR1020
Chapter 9 The Physics of the AAPM’s TG-51 Protocol 265
+ 3.34810−6 (%dd(10)x)3
7/31/2019 The Physics of the AAPM’s TG51_Rogers
http://slidepdf.com/reader/full/the-physics-of-the-aapms-tg51rogers 28/58
5.2 The Central Electrode Correction Factor, Pcel
As discussed in section 2.4.7, the central electrode correction takes into account theeffects of the central electrode on the chamber response, although traditionally onedoes not take them into account if they are of the same material as the wall.
Many chambers have aluminum electrodes to give a flat energy response inlow-energy x-ray fields (e.g., many NE and PTW chambers). These aluminum elec-
trodes have a distinct effect on the response even in high-energy photon beams.Although the value of Pcel is close to unity in electron beams, the effect of TG-51accounting for Pcel is actually larger in electron beams than in photon beamsbecause the final dose determination includes the factor Pcel(e−)/ Pcel (
60Co) and thefactor in the denominator is quite large (see below). In contrast, the equivalent ratiofor photon beams is closer to unity.
Ma and Nahum (1993) used Monte Carlo techniques to calculate that a 1 mmdiameter aluminum electrode increases chamber response in photon beams by 0.4%to 0.8% relative to a graphite electrode, requiring a Pcel correction factor less than
unity (see table 9-1), as shown in figure 9-13 along with the linear fit as a functionof %dd(10)x used in TG-51. The measured data of Palm and Mattsson (1999) arealso shown and are in quite good agreement with the calculations.
The effect of an aluminum electrode in electron beams is quite small and varieswith depth. The results of Ma and Nahum indicate that Pcel at d ref is unity up to 13 MeV
266 D. W. O. Rogers
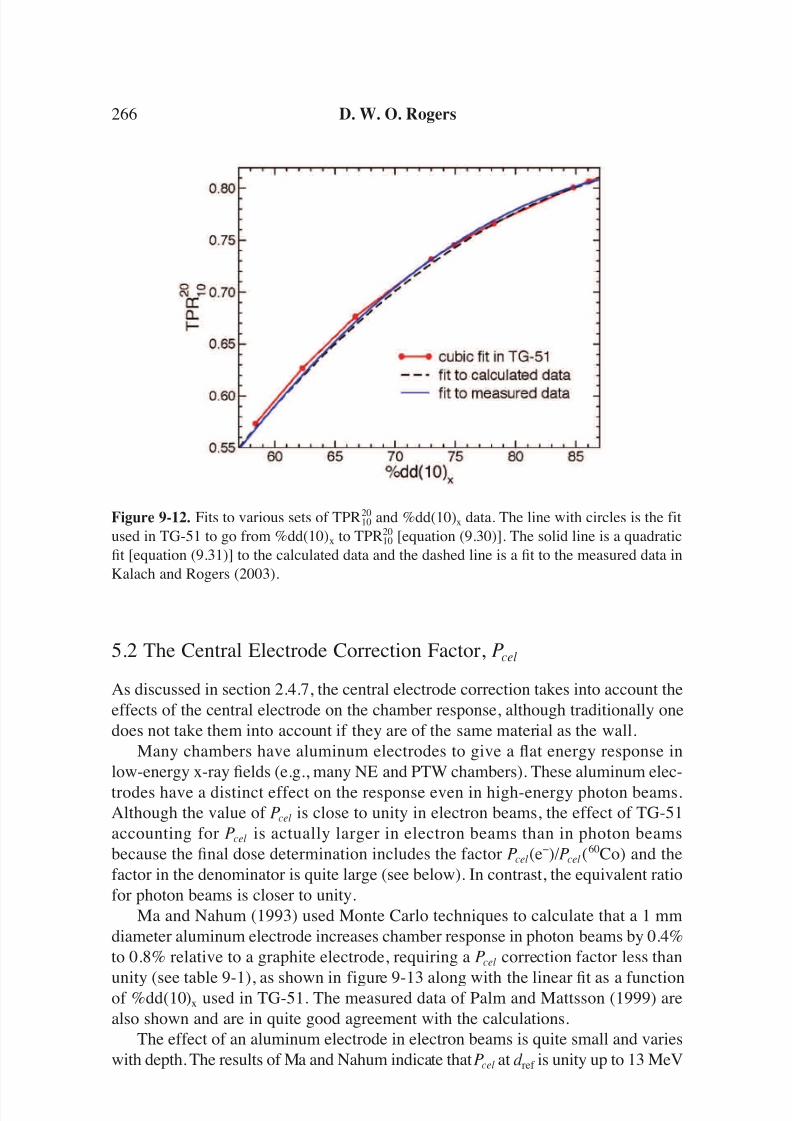
Figure 9-12. Fits to various sets of TPR2010 and %dd(10)x data. The line with circles is the fit
used in TG-51 to go from %dd(10)x to TPR2010 [equation (9.30)]. The solid line is a quadratic
fit [equation (9.31)] to the calculated data and the dashed line is a fit to the measured data inKalach and Rogers (2003).

7/31/2019 The Physics of the AAPM’s TG51_Rogers
http://slidepdf.com/reader/full/the-physics-of-the-aapms-tg51rogers 29/58
Chapter 9 The Physics of the AAPM’s TG-51 Protocol 267
Table 9-1. Pcel Correction Factor Required for Farmer Chambers with an Aluminum
Electrode of 1 mm Diameter, Based on the Calculations of Ma and Nahum (1993).
Factors apply past d max in photon beams and near d max or 0.6 R50 − 0.1 cm in electron beams.The %dd(10)x values exclude electron contamination. Note that Pcel as defined here is consis-tent with the other correction factors but is not the same as the Pcel correction in TRS-277.
Beam Quality
NAP/MeV %dd(10)x Pcel
Photons
60Co 0.58 56% 0.9926(15)4 MV 0.62 62% 0.9935(7)
6 MV 0.67 67% 0.9930(11)
10 MV 0.73 72% 0.9945(9)
15 MV 0.76 78% 0.9955(16)
24 MV 0.80 86% 0.9957(9)
Electrons
<13 MeV 1.000
≥13 MeV 0.998
TPR10
20
Figure 9-13. Values of Pcel for photon beams as calculated by Ma and Nahum (1993) andmeasured by Palm and Mattsson (1999). The solid line is the fit used in TG-51 to the data of Ma and Nahum. The more recent and much higher precision values of Buckley et al. (2004)and Wulff et al. (2008a) are seen to be in good agreement with the older values.

7/31/2019 The Physics of the AAPM’s TG51_Rogers
http://slidepdf.com/reader/full/the-physics-of-the-aapms-tg51rogers 30/58
and about 0.998 at 20 MeV (for monoenergetic incident beams). The experimental
data of Palm and Mattsson (1999) are in agreement with the calculations within theuncertainties of about 0.2%. Originally this correction was to be implemented inTG-51 as 1.00 up to 13 MeV and 0.998 above that energy. This led to a 0.2%discontinuity in calculated k R50
values at R50 = 5.5 cm (Rogers 1998). To get rid of this discontinuity, TG-51 treats Pcel as 1.0 for R50 < 4.3 cm, 0.998 for R50 > 6.7 cmand linearly interpolates on R50 between these values as shown in figure 9-14.
5.2.1 Pcel: State-of-the-Art
Buckley et al. (2004) did an extensive study of the electrode effect under reference
conditions in electron and photon beams. Results from that work have already beenseen in figures 9-13 and 9-14. Wulff et al. (2008b) have also calculated Pcel values,which are shown in the figure. In the photon beam case both sets of new resultshave much higher statistical precision but agree well with the values used in TG-51.The photon beam results also confirm that a graphite electrode has a negligibleeffect and thus it does not matter whether it is considered or not.
In electron beams the newer results show some small differences with the previousresults. In particular a 1 mm aluminum electrode would appear to require Pcel = 0.999in all beams. Perhaps more interestingly, figure 9-14 indicates that a graphite elec-trode requires a correction which is between 0.1% and 0.2% greater than unity.
Fortunately these differences from TG-51 are not very significant.
268 D. W. O. Rogers
Figure 9-14. Monte Carlo–calculated values of Pcel for electron beams compared to thevalues in TG-51. The TG-51 values were based on a few calculated values by Ma andNahum (1993) interpolated for depth whereas the Buckley et al. results are for d ref and real-istic beams. [Reproduced from Buckley et al. (2004) with permission from American Asso-ciation of Physicists in Medicine.]
7/31/2019 The Physics of the AAPM’s TG51_Rogers
http://slidepdf.com/reader/full/the-physics-of-the-aapms-tg51rogers 31/58
Wulff et al. (2008a) have repeated some of the calculations of Buckley et al.
(2004) and get close agreement. They also did the calculations as a function of depth in a 6 MV beam and found that Pcel was constant. More interestingly theyshowed that the on-axis value of Pcel decreased by 0.3% in a 4040 cm2 fieldcompared to the reference field of 1010 cm2 and showed that it decreased byanother 1% as the ion chamber passed through the penumbra of the 6 MV field.
5.3 The Wall Correction Factor, Pwall
5.3.1 Pwall for Cylindrical Chambers
In electron beams, Pwall was commonly assumed to be 1.00 and TG-51 (and TRS-398)continued to assume this although it is known to be a poor assumption. Nahum(1988) presented a theoretical model of the effect of the wall material on the elec-tron spectrum in the cavity (see chapter 3). It qualitatively agrees with the experi-mental data in an extreme case. Based on this model, Nahum has shown that thewall effect in electron beams due to changes in the spectrum, should be less than1%, and usually much less for situations of importance in clinical dosimetry.
In photon beams, the correction factor for the wall effect for cylindrical cham-bers was initially given by Almond and Svensson (1977). This has been slightly
extended (Hanson and Tinoco 1985; Gillin et al. 1985) to handle the case of awaterproofing sheath as well as the wall:
(9.33)
where is the ratio of mass energy absorption coefficients; a is the frac-tion of ionization in the cavity due to electrons originating in the chamber wall; t isthe fraction of ionization in the cavity due to electrons originating in the water-proofing sheath and (1 − a − t ) is the fraction due to electrons originating in thephantom.
There is another formula for Pwall that was originally developed by Shiragai(1978, 1979) and extended to the sheath case by analogy to equation (9.33):
(9.34)
µ ρ en B
A
( )
Chapter 9 The Physics of the AAPM’s TG-51 Protocol 269
P
L
wall
air
wall
en
wall
med
=
+α
ρ
µ
ρ τ
L L
air
sheath
en
sheath
med
ρ
µ
ρ α
+ −1 −−( )
τ ρ
ρ
L
L
air
med
air
med ,
P
L Lwall
air
med
wall
air
en
=
1
ρ α
ρ
µ
ρ
+
med
wall
sheath
air
en Lτ
ρ
µ
ρ + − −( )
med
sheath
med
air L
1 α τ ρ
.

7/31/2019 The Physics of the AAPM’s TG51_Rogers
http://slidepdf.com/reader/full/the-physics-of-the-aapms-tg51rogers 32/58
This formula is on a more solid theoretical foundation. However, it turns out that
these equations produce virtually identical numerical results. For 0.05 g/cm2 thickwalls, the two equations give Pwall values within 0.01% for graphite and 0.02% forA-150 walls (Rogers 1991; Rogers and Booth 2009). TG-51 has consistently usedequation (9.33).
The Pwall correction is typically 1% or less for most ion chambers, but the accu-racy of the formula has not been rigorously demonstrated and there were indica-tions that there are problems with it (Hanson and Tinoco 1985; Gillin et al. 1985;Ross et al. 1994). Also, there are conceptual problems with the Pwall factor since ituses many approximations in its derivation and it ignores changes in attenuationand scatter by the wall. For a more complete discussion and derivation of the P
wallequation [equation (9.34)], see Rogers (1992c) or Nahum (1994).To calculate Pwall in photon beams one must know values of a and possibly t
and the values used in TG-51 are shown in figure 9-15. These quantities are thoughtto be relatively independent of the material involved and are given as a function of wall thickness in g/cm2. The values needed are determined from the wall and sheaththickness respectively by interpolating tabulated values based on figures 1 and 7 of
TG-21 after converting the beam quality specifier, %dd(10)x to using equa-
tion (9.30) and then using Figure 3 in TG-21 to convert into nominal accel-TPR10
20
TPR10
20
270 D. W. O. Rogers
Figure 9-15. The values of a or t as a function of wall thickness with beam quality speci-
fied in terms of %dd(10)x as used in TG-51 calculations of Pwall. Data are based on interpo-lations of Figures 1 and 7 of TG-21. For values when walls are less than 0.05 g/cm2, thethinnest value in the original figure, TG-51 uses linear interpolation to 0.0 for zero wallthickness. Values of a and t are assumed independent of the material of the wall.

7/31/2019 The Physics of the AAPM’s TG51_Rogers
http://slidepdf.com/reader/full/the-physics-of-the-aapms-tg51rogers 33/58
erating potential (NAP) in MV before interpolating the original figures. Buckley et al.(2003) did a series of Monte Carlo calculations of a for a 60Co beam and showedthat the correct values can be as much as 15% different from the values used inTG-51 and that the linear interpolation to zero wall thickness is not ideal. However,given the complete breakdown of the Pwall formalism [i.e., equation (9.33)] reportedin Buckley and Rogers (2006b) (see section 5.3.3), the issue of accurate values of a has not been pursued.
The other data needed to calculate Pwall values in TG-51 are stopping-powerratios and mass-energy absorption coefficients. Their sources are described above
in sections 4.1 and 4.2.Figure 9-16 compares the values of Pwall for chambers of different wall materi-
als with a thickness of 0.05 g/cm2 as calculated in TG-51 and TG-21 protocols.
5.3.2 Pwall for Plane-Parallel Chambers
The above formulation applies to cylindrical chambers. For plane-parallel cham-bers the Pwall correction in a 60Co beam is needed in equation (9.24) for the calcula-tion of k ecal to account for the effects of the chamber wall materials being differentfrom the material of the phantom. Equation (9.33) cannot be applied since the
values of a and t are not known, and, more importantly, there are major effects dueto variations in backscatter from the insulator at the back of the chamber (Rogers1992a) and these are not accounted for in the formula. TG-51 has based its valuesof Pwall for plane-parallel chambers on values calculated with the EGS4 Monte
Chapter 9 The Physics of the AAPM’s TG-51 Protocol 271
Figure 9-16. Comparison of Pwall values for 0.05 g/cm2 walls of different materials as calcu-lated for TG-51 (dashed lines) vs. the value calculated using TG-21 (solid lines). The differ-ences are entirely due to changes in the data sets.

7/31/2019 The Physics of the AAPM’s TG51_Rogers
http://slidepdf.com/reader/full/the-physics-of-the-aapms-tg51rogers 34/58
Carlo code although these calculations were known to be subject to large system-
atic uncertainties (about ±1%) and rely on having an accurate description of thechamber (Rogers 1992a; 1998). There are also measured data available (Laitano etal. 1993; Ding and Cygler 1998; Palm et al. 2000; Araki et al. 2000). The measuredvalues were known to be subject to large uncertainties since they require eitherknowledge of, or assumptions about, various other correction factors such as Prepl.
When TG-51 was being developed, for photon beam energies other than 60Cothere were no values of Pwall that were considered complete enough or reliableenough to allow use of plane-parallel chambers in accelerator photon beams andthus they were excluded from photon beam dosimetry.
In electron beams, although TG-51 takes Pwall
= 1.00 for plane-parallel cham-bers (as it does for cylindrical chambers) several authors (Klevenhagen 1991; Huntet al. 1988) have pointed out that for plane-parallel chambers, the electronbackscatter from non-water materials behind the air cavity is different from that of water and this induces a change in the ion chamber reading. In principle this couldhave been corrected for using the Pwall corrections given in table 9-2. The correc-tions can be substantial for low-energy beams. Preliminary results of Monte Carlocalculations of this effect for the entire chamber for NACP and PTW/Markus cham-bers also indicated an effect of the order of 1% or 2% (Ma and Rogers 1995).Nonetheless this factor was taken as 1.0 in TG-51 (and TRS-398) due to the incom-
plete data available at that time.
5.3.3 Pwall: State-of-the-Art
There has been considerable work on the Pwall correction since TG-51 was published.
Pwall Values for Plane-Parallel Chambers in 60Co. Since there were knownsystematic uncertainties that were the basis for the Pwall values for plane-parallel
272 D. W. O. Rogers
Table 9-2. Electron Beam Pwall Correction Factor for Plane-Parallel Chamberswith Effectively Thick Back Walls of the Materials Shown
Data from Klevenhagen (1991), based on the results of Hunt et al. (1988).
E z , energy at depth
of chamber (MeV) Graphite PMMA Polystyrene
3 1.010 1.012 1.021
4 1.009 1.011 1.018
6 1.006 1.008 1.01310 1.004 1.005 1.009
14 1.003 1.003 1.006
20 1.001 1.001 1.002

7/31/2019 The Physics of the AAPM’s TG51_Rogers
http://slidepdf.com/reader/full/the-physics-of-the-aapms-tg51rogers 35/58
chambers used to calculate the values of k ecal using equation (9.24), Mainegra-Hing
et al. (2003) redid these calculations using EGSnrc which calculates ion chamberresponse much more accurately than EGS4 (Kawrakow 2000). Figure 9-17 showsthat this systematically increased the values of Pwall and hence k ecal. The new calcu-lations improved agreement with experiment although all of the experimental meth-ods required values of parameters such as Pwall and Pcel for cylindrical andplane-parallel chambers in high-energy beams and, as we will see below, there havebeen significant changes in many of these values, thereby implying changes in theexperimental results.
Mainegra-Hing et al. (2003) showed that the uncertainties on the calculatedvalues of P
wall
from the 1% uncertainties on the underlying photon cross sections istypically 0.3%. Thus the uncertainties on the calculated values are likely smallerthan the measurement uncertainties on the condition that the descriptions of the ionchambers are accurate. Recent work (Dohm et al. 2001; Christ et al 2002; Kapschet al. 2007) suggests that the chamber to chamber variations with parallel platechambers are much better, at least with the Roos, Advanced Markus and Markuschambers, than reported for the NACP chambers by Kosunen et al. (1994). Once itis clearly established that plane-parallel chambers are consistent from chamber to
Chapter 9 The Physics of the AAPM’s TG-51 Protocol 273
Figure 9-17. A comparison of the values of Pwall used in TG-51 [EGS4 calculations (Rogers1998)] to the more recent EGSnrc calculations of Mainegra-Hing et al. (2003) and to a vari-
ety of experimental determinations. For complete references for the experimental work, seeMainegra-Hing et al. (2003) and Kapsch et al. (2007). Several authors used two methods toanalyze their measurements and both results are shown. Figure is redrawn from Mainegra-Hing et al. (2003) with extra data from Kapsch et al. (2007). (Redrawn with permission fromAmerican Association of Physicists in Medicine.)

7/31/2019 The Physics of the AAPM’s TG51_Rogers
http://slidepdf.com/reader/full/the-physics-of-the-aapms-tg51rogers 36/58
chamber, then the values of k ecal can be trusted (either calculated or measured). This
means that plane-parallel chambers calibrated directly in 60Co beams will be areasonable alternative despite the fact that TG-51 strongly encouraged the use of the cross-calibration technique.
Pwall Values for Cylindrical Chambers in Photon Beams. Buckley and Rogers(2006b) did a detailed study of Monte Carlo calculated values of Pwall under refer-ence conditions (i.e., at 10 cm depth in a 1010 cm2 photon beam). In that studythey demonstrated that their calculated values led to much better agreement withthree different previously reported measurements than when Pwall values calculatedwith equation (9.33) were used. Figure 9-18 presents the ratios of the Monte Carlocalculated values to those used in TG-51, and for wall materials such as graphiteand A150 (tissue equivalent plastic) the differences are up to 0.8%. It was shownthat the differences were due to the breakdown of equation (9.33) because thevalues of all the physical parameters used in the equation were calculated with thesame cross sections as used in the Monte Carlo calculations and this did not signifi-cantly change the Pwall values using equation (9.33). Despite the significant changesin Pwall values, in practice it is only the variation in the difference that matters inTG-51 because k Q involves only the ratio of Pwall values. This reduces the overallerror in TG-51 to less than 0.6% from this effect and for chambers with walls of
C552 (air-equivalent plastic) and polymethylmethacrylate (PMMA), the error isless than roughly 0.1%.
274 D. W. O. Rogers
Figure 9-18. Ratio as a function of beam quality %dd(10)x, of the Monte Carlo–calculated,i.e., correct, values of Pwall under reference conditions to those calculated by equation (9.33)and used in TG-51. Only the variation of the ratio with beam quality has an effect on TG-51since it only depends on ratios of Pwall values. [Redrawn from Buckley and Rogers (2006b)with permission from American Association of Physicists in Medicine.]

7/31/2019 The Physics of the AAPM’s TG51_Rogers
http://slidepdf.com/reader/full/the-physics-of-the-aapms-tg51rogers 37/58
In a more recent study, Wulff et al. (2008b) calculated Pwall for an NE2571 as a
function of beam quality and got good agreement with the previous Monte Carloresults at the reference depth but also showed that: Pwall values increased by about0.5% as a function of depth in a 1010 cm2 field; Pwall values on the central axisincrease by about 0.6% as the field goes from 1010 cm2 to 4040 cm2; Pwall
values decrease by about 0.5% from the central axis to the edge of the field in a4040 cm2 field and then increase by 1.5% passing through the penumbra. Whilethese results do not affect dosimetry under reference conditions, they indicate thedifficulty of making clinical ion chamber measurements with accuracy at the 1%level or better.
Pwall Values for Cylindrical Chambers in Electron Beams. Although Pwall forcylindrical chambers is assumed to be 1.00 in all current dosimetry protocols,Buckley and Rogers (2006b) calculated values at d ref for a variety of common thim-ble chambers (see figure 9-19). While there is some scatter about the lines shown(±0.1%), the figure shows that there are variations of up to 0.8%, consistent withNahum’s 1988 estimate discussed above. For example, for a beam with R50 = 3 cm,one would expect to see a difference of over 0.7% in the doses determined withTG-51 using an NE2581 versus using an A12 chamber because of the use of thewrong values of Pwall in the electron beam.
Chapter 9 The Physics of the AAPM’s TG-51 Protocol 275
Figure 9-19. Monte Carlo–calculated values of Pwall in a water phantom for thimble cham-bers at d ref in electron beams, as a function of beam quality, R50. Lines represent least squaresfits to the raw data, which are scattered. The individual values are shown for the NE2571.[Redrawn from Buckley and Rogers (2006b) with permission from American Association of Physicists in Medicine.]

7/31/2019 The Physics of the AAPM’s TG51_Rogers
http://slidepdf.com/reader/full/the-physics-of-the-aapms-tg51rogers 38/58
That same paper showed a dramatic variation in Pwall with depth (up to 2.5%
increase from the surface to a depth of R50 for an NE2571 chamber in a 6 MeVbeam). If the density of the graphite wall was reduced to 1.00 g/cm3 in the calcula-tions, the values of Pwall decrease by 0.5% with depth rather than increasing.However, the effect cannot be taken into account by a simple depth shift since if that were the case, the Pwall correction would be constant in the linear fall-off regionof the depth-dose curve, and it continues to increase.
Pwall Values for Plane-Parallel Chambers in Electron Beams. In another paperBuckley and Rogers (2006a) reported extensive calculations of Pwall corrections forplane-parallel chambers in electron beams. Figure 9-20 shows these values at d
ref for four plane-parallel chambers. As discussed above, these results are not particu-larly surprising but are at odds with the standard assumption of Pwall = 1.0 made inTG-51 and other protocols. Perhaps most critical is that the largest deviation fromunity is for the NACP chamber, which has been used in many measurements of various factors for other chambers under the assumption of a unity value. Zink andWulff (2008) and Verhaegen et al. (2006) reported calculated Pwall values for theRoos and NACP chambers respectively which agreed well with those presented inthe figure.
Buckley and Rogers (2006a) and Verhaegen et al. (2006) both calculated values
of Pwall for the NACP chamber as a function of depth and found values over 1.06 at
276 D. W. O. Rogers
Figure 9-20. Monte Carlo–calculated values of Pwall in a water phantom for plane-parallelchambers at d ref in electron beams, as a function of beam quality, R50. Lines represent leastsquares fits to the raw data, which are quite scattered. The individual values are shown forthe NACP02 chamber. [Redrawn from Buckley and Rogers (2006a) with permission fromAmerican Association of Physicists in Medicine.]
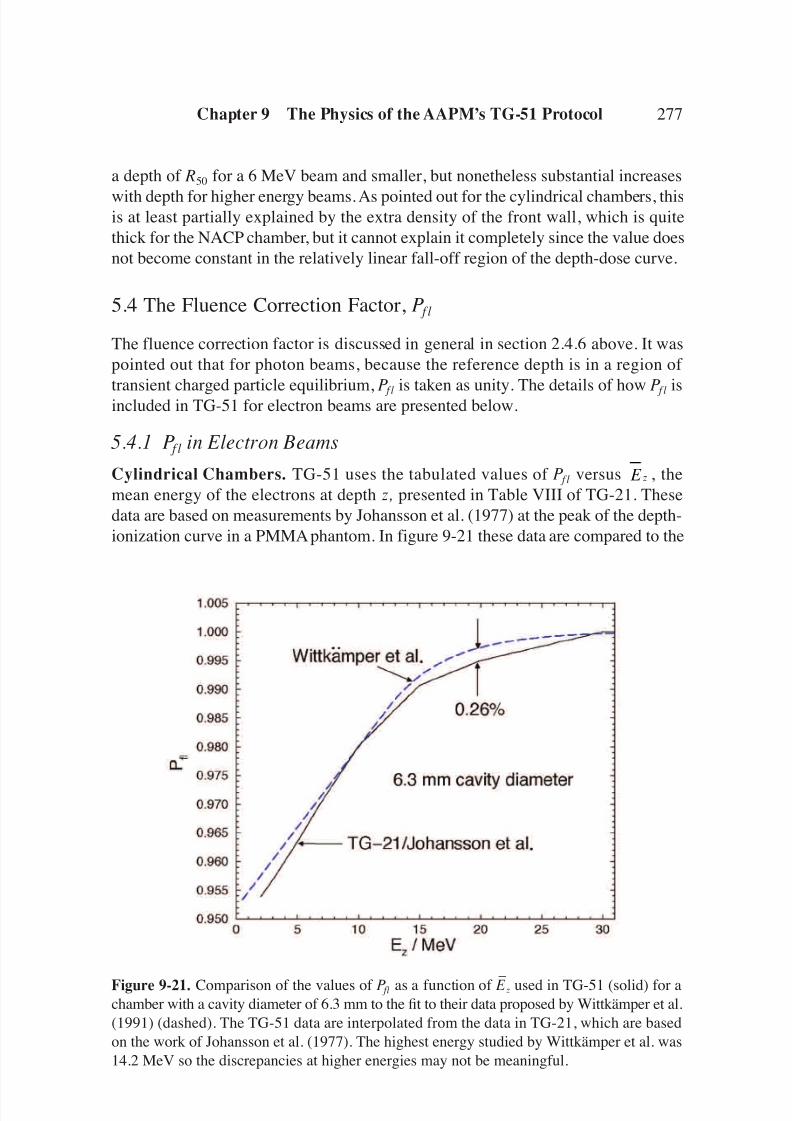
7/31/2019 The Physics of the AAPM’s TG51_Rogers
http://slidepdf.com/reader/full/the-physics-of-the-aapms-tg51rogers 39/58
a depth of R50 for a 6 MeV beam and smaller, but nonetheless substantial increases
with depth for higher energy beams. As pointed out for the cylindrical chambers, thisis at least partially explained by the extra density of the front wall, which is quitethick for the NACP chamber, but it cannot explain it completely since the value doesnot become constant in the relatively linear fall-off region of the depth-dose curve.
5.4 The Fluence Correction Factor, P f l
The fluence correction factor is discussed in general in section 2.4.6 above. It waspointed out that for photon beams, because the reference depth is in a region of
transient charged particle equilibrium, P f l is taken as unity. The details of how P f l isincluded in TG-51 for electron beams are presented below.
5.4.1 P f l in Electron Beams
Cylindrical Chambers. TG-51 uses the tabulated values of P f l versus , themean energy of the electrons at depth z, presented in Table VIII of TG-21. Thesedata are based on measurements by Johansson et al. (1977) at the peak of the depth-ionization curve in a PMMA phantom. In figure 9-21 these data are compared to the
E z
Chapter 9 The Physics of the AAPM’s TG-51 Protocol 277
Figure 9-21. Comparison of the values of P fl as a function of E –z used in TG-51 (solid) for achamber with a cavity diameter of 6.3 mm to the fit to their data proposed by Wittkämper et al.(1991) (dashed). The TG-51 data are interpolated from the data in TG-21, which are basedon the work of Johansson et al. (1977). The highest energy studied by Wittkämper et al. was14.2 MeV so the discrepancies at higher energies may not be meaningful.

7/31/2019 The Physics of the AAPM’s TG51_Rogers
http://slidepdf.com/reader/full/the-physics-of-the-aapms-tg51rogers 40/58
data of Wittkämper et al. (1991), which were also independently confirmed by Van
der Plaetsen et al. (1994). The newer data are for a single chamber (an NE2571Farmer chamber) so they have not been used in TG-51. However, they suggest thatthe TG-51 data are accurate at the 0.26% level.
All of the accurately measured values of P f l are at d max (Johansson et al. 1977;Wittkämper et al. 1991; Van der Plaetsen et al. 1994) and in principle do not applyat depths away from d max, e.g., at d ref for higher-energy electron beams. Nonethe-
less, TG-51 uses these values at d ref by taking the value of at d ref and using the
corresponding P f l ( ) value determined at d max. There are some measurementswhich confirm the applicability of these correction factors away from d max (Huqet al. 1997; Ding and Cygler 1998; Reft and Kuchnir 1999) although the overalluncertainty on measurements such as these is often quite large (i.e., ≥1%).
To determine P f l at the reference depth, TG-51 needed to determine the meanenergy at d ref . This was done by using the standard Harder relationship for the meanelectron energy at depth z, (ICRU 1984a), viz.:
(9.35)
where E –
o is the mean electron energy at the surface of the phantom, and R p is the
practical range. Two approximations were used to recast this equation in terms of R50, the beam quality specifier in TG-51. Firstly E –
o = 2.33 R50, the approximaterelationship from TG-21 was used. To establish a relationship between R p and R50,21 pairs of these data were taken from the work of Ding and Rogers (1995) (seefigure 9-22) and fit to give (Rogers 1996):
R p = 1.2709 R50 − 0.23, (9.36)
where R p and R50 are in cm. Hence the mean energy at depth z is given in terms of the beam quality specifier R50 as:
E –
o = 2.33 R50(1 − z/(1.2709 R50 − 0.23)) [MeV]. (9.37)
This Harder relationship is used to assign the mean energy at depth despite the factthat it is approximate (Ding et al. 1996). It is adequate for these purposes andensures a consistent use of the P f l data, which were originally characterized in thesame way. TRS-277 chose to assign based on Monte Carlo calculations byAndreo and Brahme (1981) but in principle this leads to an inappropriate selectionof P f l unless the mean energies in the Johansson et al. (1977) data are reanalyzed.
Also, Ding et al. (1996)’s calculations of mean energy as a function of depth forrealistic beams show considerable discrepancy with the earlier calculations formonoenergetic beams (Andreo and Brahme 1981).
E z
E z
E E z Rz o p= −( )1 / ,
E z
E z
278 D. W. O. Rogers

7/31/2019 The Physics of the AAPM’s TG51_Rogers
http://slidepdf.com/reader/full/the-physics-of-the-aapms-tg51rogers 41/58
Plane-Parallel Chambers. The fluence correction for well-guarded plane-parallelchambers is taken as unity (Almond et al. 1994). However, many authors haveshown that the Markus and Capintec plane-parallel chambers have substantialfluence corrections (see TG-39 and references therein, Almond et al. 1994), espe-cially at low energies. Unfortunately, these are very difficult measurements to makeand the scatter in experimental results is substantial. Nonetheless TG-39 recom-
mended values for P f l as a function of mean electron energy at depth. These valuesare used in TG-51 and presented in figure 9-23. The method for determiningdescribed in the previous section is also used with plane-parallel chambers.
5.5 The Gradient Correction Factor, Pgr
As discussed in section 2.4.6, for electron beams the gradient correction is based ona simple measurement in the user’s beam and application of equation (9.18). Thisis equivalent to using an effective point of measurement as done in TRS-398.
For photon beams, gradient correction factors in various protocols are based ondifferent sources. TG-21 based its values on the work of Cunningham and Sontag(1980), which is a mixture of experiment and mostly calculations. TRS-398 uses
E z
Chapter 9 The Physics of the AAPM’s TG-51 Protocol 279
Figure 9-22. Linear relationship between R50, the depth at which the dose falls to 50% of dose maximum, and the R
p, the practical range, based on fitting 21 pairs of calculated data
points from Ding and Rogers (1995).

7/31/2019 The Physics of the AAPM’s TG51_Rogers
http://slidepdf.com/reader/full/the-physics-of-the-aapms-tg51rogers 42/58
the measured data of Johansson et al. (1977) for the displacement factor, DF, toestimate the gradient correction as:
(9.38)
where Andreo has done a fit to interpolate the Johansson et al. data as a function of (Andreo, private communication, 2008). One can also estimate the effective Pgr value caused by using a given offset of the effective point of measurement as(Rogers and Ross 1992):
(9.39)
where ∆z is the chamber offset (0.6 rcav or 0.75 rcav) and the ratio of doses at 20 and
10 cm is determined from the value of using a linear fit (Rogers and Booth2009) to the data in Table XIII of TRS-277, viz.:
(9.40) D
D
20
10
10200 05607 0 77639= +. . .TPR
TPR10
20
PD
Dzgr
offset = +
1
1
10
20
10
ln ,∆
TPR10
20
P D F rgr398 1= −
cav,
280 D. W. O. Rogers
Figure 9-23. The P f l factors for plane-parallel chambers recommended by TG-39 (Almondet al. 1994) and used in TG-51. Also shown are cubic fits to the curves used by TG-51 forthe Markus and Capintec chambers. The factors are given as a function of E
–z, the mean
energy at the depth of measurement. These fits were not actually needed since TG-39presented a similar characterization, but this is what was used in TG-51.
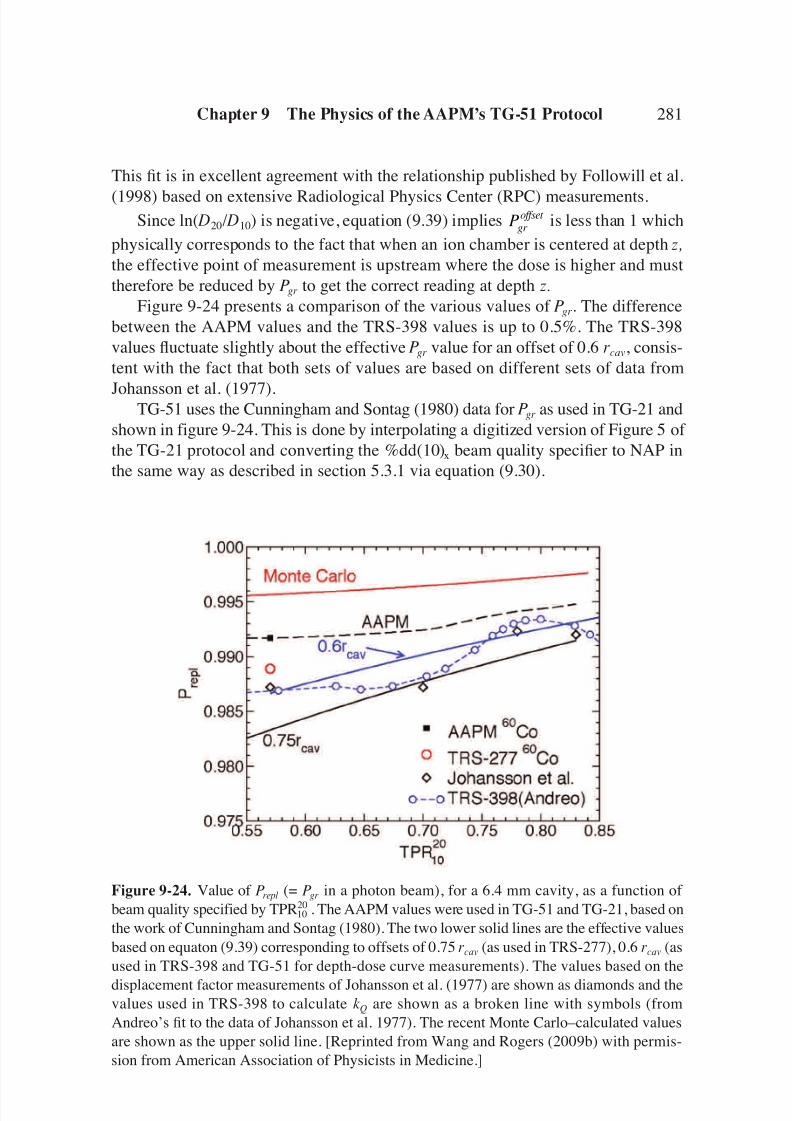
7/31/2019 The Physics of the AAPM’s TG51_Rogers
http://slidepdf.com/reader/full/the-physics-of-the-aapms-tg51rogers 43/58
This fit is in excellent agreement with the relationship published by Followill et al.
(1998) based on extensive Radiological Physics Center (RPC) measurements.Since ln( D20/ D10) is negative, equation (9.39) implies is less than 1 which
physically corresponds to the fact that when an ion chamber is centered at depth z,
the effective point of measurement is upstream where the dose is higher and musttherefore be reduced by Pgr to get the correct reading at depth z.
Figure 9-24 presents a comparison of the various values of Pgr. The differencebetween the AAPM values and the TRS-398 values is up to 0.5%. The TRS-398values fluctuate slightly about the effective Pgr value for an offset of 0.6 rcav, consis-tent with the fact that both sets of values are based on different sets of data from
Johansson et al. (1977).TG-51 uses the Cunningham and Sontag (1980) data for Pgr as used in TG-21 andshown in figure 9-24. This is done by interpolating a digitized version of Figure 5 of the TG-21 protocol and converting the %dd(10)x beam quality specifier to NAP inthe same way as described in section 5.3.1 via equation (9.30).
Pgroffset
Chapter 9 The Physics of the AAPM’s TG-51 Protocol 281
Figure 9-24. Value of Prepl (= Pgr in a photon beam), for a 6.4 mm cavity, as a function of beam quality specified by TPR20
10 . The AAPM values were used in TG-51 and TG-21, based onthe work of Cunningham and Sontag (1980). The two lower solid lines are the effective valuesbased on equaton (9.39) corresponding to offsets of 0.75 rcav (as used in TRS-277), 0.6 rcav (asused in TRS-398 and TG-51 for depth-dose curve measurements). The values based on the
displacement factor measurements of Johansson et al. (1977) are shown as diamonds and thevalues used in TRS-398 to calculate k Q are shown as a broken line with symbols (fromAndreo’s fit to the data of Johansson et al. 1977). The recent Monte Carlo–calculated valuesare shown as the upper solid line. [Reprinted from Wang and Rogers (2009b) with permis-sion from American Association of Physicists in Medicine.]

7/31/2019 The Physics of the AAPM’s TG51_Rogers
http://slidepdf.com/reader/full/the-physics-of-the-aapms-tg51rogers 44/58
5.5.1 Prepl: State-of-the-Art
The values of the Prepl correction used by TG-51 and TRS-398 for photon beams arethe largest differences between these protocols because they are based on differentdata sources. However, in the end, the ratio of the Prepl values is what is used in theprotocols and these do not differ as much because the curves in figure 9-24 arenearly parallel. Until recently this was also a very difficult correction to calculatewith Monte Carlo techniques because, unlike many other correction factors, itrequires the correct absolute calculation of the dose in a cavity rather than just aratio of two related quantities as needed for Pwall or K wall. Wang and Rogers (2008b)showed that EGS4 calculations of this quantity were wrong by roughly 1% because
of EGS4’s known systematic uncertainty calculating ion chamber response. Inaddition, the calculations are extremely time consuming since they require calcula-tions of the dose to the cavity in a phantom at the reference depth.
Wang and Rogers (2008a) evaluated four methods to calculate Prepl using MonteCarlo techniques. Two were direct methods, independent of the calculation of thewater to air stopping-power ratio, which thereby avoids uncertainties regarding theappropriate selection of ∆. For the case of photon beams and plane-parallel cham-bers in electron beams it was shown that the four proposed methods gave the sameanswers within about 0.1%, which was reassuring since most previous calculationshad depended on one of the indirect methods. However, Wang and Rogers (2009a)showed that not all these techniques worked for cylindrical chambers in electronbeams because there is no longer transient charged particle equilibrium.
Prepl or P gr Corrections for Cylindrical Chambers in Photon Beams. With thenew ability to calculate Prepl (i.e., Pgr because P f l is unity past d max) directly forphoton beams, Wang and Rogers (2008a) found that the correct value was consid-erably closer to unity than the previous values. For example the value for a Farmer-like chamber in a 60Co beam was 0.9964 compared to the values of 0.992 and 0.988used in TG-51 and TRS-398, respectively. Wulff et al. (2008a) calculated similar
values for an NE2571 chamber. Wang and Rogers (2008a) demonstrated that theircalculations could match the measured values in Cunningham and Sontag (1980)which were used to extract the Prepl values used in TG-21 and TG-51, but that theexplicit calculation of the Prepl value was different, i.e., the interpretation of theearlier results in terms of Prepl was incorrect. Similarly, Wang and Rogers (2009c)demonstrated that the interpretation of the measurements in Johansson et al. (1977)is incorrect, and that a proper interpretation leads to values consistent with the newcalculations of Prepl. These new values are shown in figure 9-24 and are seen to beconsiderably closer to unity than the previous values. Figure 9-25 shows the ratiosof Prepl values as a function of beam quality since it is only the ratios which appearin the TG-51 protocol and it can be seen that there is little change in the ratiosdespite the overall change in Prepl values.
In addition to finding new values for Prepl in photon beams, Wang and Rogers(2008a) studied the value as a function of cavity length and found that is was only
282 D. W. O. Rogers

7/31/2019 The Physics of the AAPM’s TG51_Rogers
http://slidepdf.com/reader/full/the-physics-of-the-aapms-tg51rogers 45/58
weakly dependent on the length from 5 to 20 mm (0.2% increase), which is consis-tent with the assumed lack of any dependence in all protocols.
Prepl Corrections for Cylindrical Chambers in Electron Beams. Wang andRogers (2009a) have shown that the issue of Prepl for cylindrical chambers in elec-tron beams is complex because the spectrum of electrons at the effective point of measurement is quite different from that in the phantom at the point correspondingto the center of the ion chamber. The same paper shows that selecting the offset forthe effective point of measurement can be done in two ways. One is to minimize thedifference between the depth-ionization and depth-dose curves after correcting forthe stopping-power ratio, in which case one finds that an offset of about 0.5 rcav iscorrect. Another method is to match the spectrum in the ion chamber to the spec-trum at the effective point of measurement in the phantom, in which case an offsetof about 0.8 rcav is appropriate. Figure 9-26a shows that when parameterized interms of the mean energy at the point of measurement, P f l values at d ref and at d max
are on a single curve, thereby justifying this approach in TG-51. Figure 9-26bshows that the Monte Carlo calculated P f l values at d ref are in reasonably good
Chapter 9 The Physics of the AAPM’s TG-51 Protocol 283
Figure 9-25. The beam quality dependence of the ratio of Prepl values for a beam of qualityQ to that of 60Co for both a Farmer-type chamber (3 mm radius) and a larger cylindricalchamber (5 mm radius). The symbols are calculated in this study and the lines are the values
used in either TG-51 (TG-21) or IAEA’s TRS-398. [Reprinted from Physics in Medicine and Biology, “The replacement correction factors for cylindrical chambers in high-energy photonbeams.” L. L. W. Wang and D. W. O. Rogers, vol 54, pp. 1609–1620. © 2009 with permis-sion from IOP Publishing.)

7/31/2019 The Physics of the AAPM’s TG51_Rogers
http://slidepdf.com/reader/full/the-physics-of-the-aapms-tg51rogers 46/58
284 D. W. O. Rogers
Figure 9-26. (a) The calculated P fl values for a Farmer chamber in electron beams as a func-tion of the mean electron energy at depth. P f l values at d max and/or at d ref for both real linacbeams (open symbols) and monoenergetic beams (solid symbols) are shown. The crosssymbols are the TG-21 values (used in TG-51) based on Johansson et al.’s measurement(1977) at d max. (b) Same data sets as in (a) but with R50 as the beam quality specifier. Thedashed line and x’s are the P f l ( pcav) values used in TRS-398 and TG-51, respectively.[Reprinted from Wang and Rogers (2009b) with permission from American Association of Physicists in Medicine.]
agreement with those currently in use based on the measurements of Johanssonet al. (1977), although the new values do tend to be 0.5% to 1.0% closer to unity,which reflects the incorrect assumption in the original measurements that Pwall isunity for a plane-parallel chamber in a high-energy electron beam.

7/31/2019 The Physics of the AAPM’s TG51_Rogers
http://slidepdf.com/reader/full/the-physics-of-the-aapms-tg51rogers 47/58
Prepl Corrections for Plane-Parallel Chambers in Electron Beams. Although Prepl
is considered unity for well-guarded plane-parallel chambers, various Monte Carlostudies have indicated considerable variation with depth (Buckley and Rogers2006a; Verhaegen et al. 2006; Wang and Rogers 2008a). The values for the NACPchamber at d ref vary between 0.996 in a 6 MeV beam to 1.0005 in an 18 MeV beam(Wang and Rogers 2008a) and for the Roos chamber the values fluctuate between0.997 and 1.003 (Zink and Wulff 2008). The major impact of these apparentlynon-unity values is that they imply many measured values for both cylindricaland plane-parallel chambers contain systematic errors because of the assumedvalue of unity.
The more significant issue in clinical practice is the value of Prepl
at depth wherethe NACP chamber’s Prepl value is greater than 1.03 at R50 (Wang and Rogers 2008a).
6. The Pion Equation
The correction for ion recombination has been extensively studied and Boag (1987)gives a general introduction to the details of the physics and chapter 6 outlines it.
TG-51 uses two-voltage techniques for determining the Pion correction. Let V H
be the normal operating voltage for the detector (always the higher of the two volt-
ages in these measurements) and be the raw chamber reading with bias V H .
After measuring the detector bias is reduced by at least a factor of 2 to V L and
is measured once the chamber readings have reached equilibrium.
For continuous 60Co beams, the underlying theory for general recombination gives:
(9.41)
where C is a constant. From this one can derive the two-voltage formula by algebraicmanipulation or by considering a plot of (Almond 1981; Weinhous and
Meli 1984):
(9.42)
Equation (9.42) provides an estimate of the general recombination in the continu-ous beam. This is what TG-51 uses although though initial recombination maydominate, in which case equation (9.46) may be more appropriate.
1 12 M V
vs.
PM
M
C M
V ion
sat sat= = +12
,
Mraw L
Mraw
H
Mraw
H
Chapter 9 The Physics of the AAPM’s TG-51 Protocol 285
P V
V
V
M
M
V
V
ion H
H
L
raw H
raw
L
H
L
( ) =
−
−
1
2
.
2
.

7/31/2019 The Physics of the AAPM’s TG51_Rogers
http://slidepdf.com/reader/full/the-physics-of-the-aapms-tg51rogers 48/58
The exact equations for pulsed or pulsed-swept beams are nonlinear (Weinhous
and Meli 1984). From the underlying theory, for a pulsed beam one has:
(9.43)
where u = C/ V with C a constant. From this relationship one can show that:
(9.44)
Weinhous and Meli (1984) solved this equation numerically for u H given V H /V L and M H /M L. Then, Pion can be calculated using equation (9.43).
However, for small values of u H , ln(1 + u H ) can be approximated asso that:
(9.45)
and hence for pulsed beams with Pion < 1.05 one can show, using a plot of ,that:
(9.46)
Although pulsed swept beams no longer appear to be used, the same equationapplies to that case despite having a different form of exact equation.Equation (9.46) gives the same result as solving the exact nonlinear equations
for pulsed or pulsed swept beams to within 0.2% and 0.4%, respectively, for a volt-age ratio of 2 and 0.3% and 0.6% for a voltage ratio of 3 and is most inaccurate atthe limiting value of Pion = 1.05; i.e., it is much more accurate for values of Pion
closer to unity. Figure 9-27 presents a comparison of the results for the equationused in TG-51 for pulsed and pulsed swept beams compared to the “exact” solutionof Boag’s equations using the algorithm of Weinhous and Meli (1984).
For larger values of the voltage ratio or values of Pion near 1.05 one may use the
published programs or fits for the nonlinear equations (Weinhous and Meli 1984;Schulz et al. 1986).
1 1 M V
vs.
PC
V ion = + ′
1 ,
u u H H − 12
2
M
M
V
V
u
u
H
L
H
L
H
H
V
V
H
L
=+( )
+
ln
ln
.1
1
PM
M
u
uion
sat= =+( )ln
,1
286 D. W. O. Rogers
P V ion H
V
V
M
M
V
V
H
L
raw
H
raw
L
H
L
( ) =−
−
1.
.

7/31/2019 The Physics of the AAPM’s TG51_Rogers
http://slidepdf.com/reader/full/the-physics-of-the-aapms-tg51rogers 49/58
The British Code of Practice (Thwaites et al. 1996) also presents a linearizedform of these equations, viz.:
(9.47)
but it is clear from figure 9-27 that equation (9.46) is slightly more accurate.
7. Electron Beam Depth-Dose Curves
TG-51 (and TRS-398) determine the absorbed dose to water at the reference depthbased on the stopping-power ratios calculated by Ding et al. (1995) for realistic elec-
tron beams. For consistency these data must be used to derive the stopping-powerratio at other depths when converting a measured depth-ionization distribution to a
Chapter 9 The Physics of the AAPM’s TG-51 Protocol 287
P V ion H
M
M
V V
raw
H
raw
L
H
L
( ) = +
−
−
1
1
1
,,
Figure 9-27. Comparison of the value of Pion predicted by the equation for pulsed and pulsedswept beams given in TG-51 (solid) compared to the exact solutions as given by the algo-rithm of Weinhous and Meli (1984) and the equation in the IPEMB protocol (Thwaites et al.
1996). Voltage ratio is either 2 or 3.

7/31/2019 The Physics of the AAPM’s TG51_Rogers
http://slidepdf.com/reader/full/the-physics-of-the-aapms-tg51rogers 50/58
depth-dose distribution. Burns et al. (1996) gave an expression for the stopping-
power ratio as a function of R50 and depth based on a fit to the versusdepth data for 24 realistic electron beams (Ding et al. 1995; Ding and Rogers1993). The R50 values that were fit range from 0.98 cm to 18.6 cm and values forz / R50 range from 0.02 to 1.2.
The best least squares universal fit to the data is:
(9.48)
The values for the eight coefficients given above result in an rms deviation of 0.4% and a maximum deviation of 1.0% for z/ R50 ranging between 0.02 and 1.1 forthe full range of beam qualities (1 cm < R50 < 18.6 cm). The maximum deviationincreases to 1.7% for z/ R50 values up to 1.2 and is much worse at deeper depths(see Rogers 2004).
The universal fit is best applied to relative calculations and in particular to the
conversion of a measured depth-ionization distribution into a depth-dose distribu-tion (which, in principle, also requires taking into account any changes in otherfactors such as Pwall and Prepl). For the determination of the stopping-power ratio atthe reference depth, equation (9.28) should be used.
8. Experimental Verification of k Q Values for Photon Beams
There have been a wide variety of measurements of k Q values. Some of these aresummarized in figure 9-28 for the NE2571 chamber. Given the measurement uncer-tainties, it is clear that the TG-51 calculated values of k Q are in good agreement
with the measured values. Seuntjens et al. (2000) was the most extensive, highestprecision study which included measurements for 20 different ion chambers of sixdifferent makes. The rms deviation between the measured k Q values and the TG-51calculated values was 0.41% with an uncertainty on the individual measurements of 0.36%. This suggests that the uncertainty on the calculated values of k Q is of theorder of 0.4%.
9. Summary
The physics of the TG-51 protocol was firmly built on the physics in the TG-21protocol. A great simplification was possible in TG-51 due to using calibrationsbased on absorbed-dose primary standards. Unlike TG-21 where a large number of logical and physical data inconsistencies were discovered over the years after publi-
a = 1.0752e = –0.42806
b = –0.50867f = 0.064627
c = 0.088670g = 0.003085
d = –0.08402h = –0.12460
L R z
a b R c R
air
water
ρ
( ) =
+ ( ) + ( )50
50 50,
ln ln22
50
50 50
2
50
31
+ ( )
+ ( ) + ( ) + ( ) +
d z R
e R f R g R
ln
ln ln ln hh z Rln.
50( )
Lairwater ρ ( )
288 D. W. O. Rogers

7/31/2019 The Physics of the AAPM’s TG51_Rogers
http://slidepdf.com/reader/full/the-physics-of-the-aapms-tg51rogers 51/58
cation, so far there have been no major errata required for TG-51, although, as indi-cated throughout this chapter, there have been a variety of advances in our under-standing which could impact various aspects of the protocol. Nonetheless, theexperimental verification of the calculated k Q factors for photon beams suggest that
whatever improvements there may be, the overall changes required remain small.There is still room for more study in electron beams where the potential changesseem more important. The development of primary standards of absorbed dose thatcan be used reliably in electron beams will be of direct interest.
Acknowledgments
I want to thank my colleagues on Task Group 51, Peter Almond, Peter Biggs, BertCoursey, Will Hanson, Saiful Huq, and Ravi Nath for many thought-provoking and
enjoyable discussions over the years that the protocol was being developed. I alsothank two of my doctoral students at Carleton University, Lesley Buckley and LilieWang, who devoted several years of their lives to developing the tools and expertiseto nail down Pwall and Prepl correction factors. I thank Pedro Andreo for permission to
Chapter 9 The Physics of the AAPM’s TG-51 Protocol 289
Figure 9-28. Comparison of measured values of k Q to those given in TG-51 for the NE2571ion chamber. Most data are taken from Seuntjens et al. (2000). The Seuntjens, Stucki, andPalmans data are based on sealed water calorimeters, the NPL data on a graphite calorime-
ter, and the other measurements on Fricke dosimetry where the original results have beensystematically corrected for the variation in e G reported by Klassen et al. (1999). Stateduncertainties are given in the legend. Full references to original sources are included in Seun-tjens et al. (2000) and Aalbers et al. (2008).

7/31/2019 The Physics of the AAPM’s TG51_Rogers
http://slidepdf.com/reader/full/the-physics-of-the-aapms-tg51rogers 52/58
quote his calculated values of Pgr used in TRS-398. This work was supported by
NSERC, the Canada Research Chairs program and the National Research Council of Canada where much of the original work was done.
References
Aalbers, A. H. L., M. T. Hoornaert, A. Minken, H. Palmans, M. W. H. Pieksma, L. A. dePrez, N. Reynaert, S. Vynckier, and F. W. Wittkämper. (2008). Code of Practice for theAbsorbed Dose Determination in High Energy Photon and Electron Beams. NCS Report18 of The Netherlands Commission on Radiation Dosimetry.
AAPM TG–21 (1983). “A protocol for the determination of absorbed dose from high-energy
photon and electron beams.” Med Phys 10:741–771.Almond, P. R. (1981). “Use of a Victoreen 500 electrometer to determine ionization cham-
ber collection efficiencies.” Med Phys 8:901–904.Almond, P. R., and H. Svensson. (1977). “Ionization chamber dosimetry for photon and elec-
tron beams.” Acta Radiol Ther Phys Biol 16:177–186.Almond, P. R., F. H. Attix, S. Goetsch, L. J. Humphries, H. Kubo, R. Nath, and D. W. O.
Rogers. (1994). “The calibration and use of plane-parallel ionization chambers fordosimetry of electron beams: An extension of the 1983 AAPM protocol report of AAPMRadiation Therapy Committee Task Group 39.” Med Phys 21:1251–1260. Also availableas AAPM Report No. 48.
Almond, P. R., P. J. Biggs, B. M. Coursey, W. F. Hanson, M. S. Huq, R. Nath, and D. W. O.Rogers. (1999). “AAPM’s TG–51 protocol for clinical reference dosimetry of high-energy photon and electron beams.” Med Phys 26:1847–1870. Also available as AAPMReport No. 67.
Andreo, P. (2000). “A comparison between calculated and experimental k Q photon beamquality correction factors.” Phys Med Biol 45:L25–L38.
Andreo. P. (1992). “Absorbed dose beam quality factors for the dosimetry of high-energyphoton beams.” Phys Med Biol 37:2189–2211.
Andreo, P., and A. Brahme. (1981). “Mean energy in electron beams.” Med Phys 8:682–687.Araki, F., R. Ikeda, Y. Shirakawa, T. Shimonobou, N. Moribe, T. Takada, M. Takahashi,
H. Oura, and M. Matoba. (2000). “Wall correction factors for calibration of plane-parallel
ionization chambers with high-energy photon beams.” Phys Med Biol 45:2509–2517.Attix, F. H. Introduction to Radiological Physics and Radiation Dosimetry. New York: John
Wiley & Sons, 1986.Berger, M. J., and S. M. Seltzer. (1983). Stopping Power and Ranges of Electrons and
Positrons. NBS Report NBSIR 82-2550-A (Second edition). Gaithersburg, MD: NBS.Bichsel, H., and T. Hiraoka. (1992). “Energy loss of 70 MeV protons in elements.” Nucl
Instrum Meth B 66:345–351.Boag, J. W. “Ionization Chambers” in The Dosimetry of Ionizing Radiation, Vol II. K. R. Kase,
B. E. Bjärngard, and F. H. Attix (eds.). San Diego, CA: Academic Press, pp. 169–243,1987.
Boutillon, M., and A. M. Perroche-Roux. (1987). “Re-evaluation of the W value for elec-trons in dry air.” Phys Med Biol 32:213–219.Buckley, L. A., and D. W. O. Rogers. (2006a). “Wall correction factors, P wall, for parallel-
plate ionization chambers.” Med Phys 33:1788–1796.
290 D. W. O. Rogers

7/31/2019 The Physics of the AAPM’s TG51_Rogers
http://slidepdf.com/reader/full/the-physics-of-the-aapms-tg51rogers 53/58
Buckley, L. A., and D. W. O. Rogers. (2006b). “Wall correction factors, Pwall, for thimble
ionization chambers.” Med Phys 33:455–464.Buckley, L. A., I. Kawrakow, and D. W. O. Rogers. (2004). “CSnrc: Correlated samplingMonte Carlo calculations using EGSnrc.” Med Phys 31:3425–3435.
Buckley, L. A., I. Kawrakow, and D. W. O. Rogers. (2003). “An EGSnrc investigation of cavity theory for ion chambers measuring air kerma.” Med Phys 30:1211–1218.
Burns, D. T., G. X. Ding, and D. W. O. Rogers. (1996). “ R50 as a beam quality specifier forselecting stopping-power ratios and reference depths for electron dosimetry.” Med Phys23:383–388.
Christ, G., O. S. Dohm, G. Bruggmoser, and E. Schüle. (2002). “The use of plane-parallel cham-bers in electron dosimetry without any cross-calibration.” Phys Med Biol 47:N121–N126.
Cunningham, J. R., and R. J. Schulz. (1984). “On the selection of stopping-power and mass-energy absorption coefficient ratios for high energy x-ray dosimetry.” Med Phys 11:618–623.
Cunningham, J. R., and M. R. Sontag. (1980). “Displacement corrections used in absorbeddose determinations.” Med Phys 7:672–676.
Cunningham, J. R., M. Woo, D. W. O. Rogers, and A. F. Bielajew. (1986). “The dependenceof mass energy absorption coefficient ratios on beam size and depth in a phantom.” Med
Phys 13:496–502.Ding, G. X., and J. Cygler. (1998). “Measurement of Prepl Pwall factors in electron beams and
in a 60Co beam for plane-parallel chambers.” Med Phys 25:1453–1457.Ding, G. X., and D. W. O. Rogers. (1995). Energy Spectra, Angular Spread, and Dose Distri-
butions of Electron Beams from Various Accelerators Used in Radiotherapy. NRCReport PIRS–0439. Ottawa: National Research Council.
Ding, G. X., and D. W. O. Rogers. (1993). Monte Carlo Simulation of NPL Linac and Calcu-lation of Dose Distributions and Water/Air Stopping-Power Ratios. NRC ReportPIRS–0399. Ottawa: National Research Council.
Ding, G. X., D. W. O. Rogers, and T. R. Mackie. (1996). “Mean energy, energy-range rela-tionship and depth-scaling factors for clinical electron beams.” Med Phys 23:361–376.
Ding, G. X., D. W. O. Rogers, and T. R. Mackie. (1995). “Calculation of stopping-powerratios using realistic clinical electron beams.” Med Phys 22:489–501.
Dohm, O. S., G. Christ, F. Nüsslin, E. Schüle, and G. Bruggmoser. (2001). “Electron dosime-
try based on the absorbed dose to water concept: A comparison of the AAPM TG–51 andDIN 6800-2 protocols.” Med Phys 28:2258–2264.Domen, S. R., and P. J. Lamperti. (1976). “Comparisons of calorimetric and ionometric
measurements in graphite irradiated with electrons from 15 to 50 MeV.” Med Phys 3:294–301.
Followill, D. S., R. C. Tailor, V. M. Tello, and W. F. Hanson. (1998). “An empirical relation-ship for determining photon beam quality in TG–21 from a ratio of percent depth doses.” Med Phys 25:1202–1205.
Gillin, M. T., R. W. Kline, A. Niroomand-Rad, and D. F. Grimm. (1985). “The effect of thickness of the waterproofing sheath on the calibration of photon and electron beams.” Med Phys 12:234– 236.
Hanson, W. F., and J. A. D. Tinoco. (1985). “Effects of plastic protective caps on the cali-bration of therapy beams in water.” Med Phys 12:243–248.
Hohlfeld, K. (1988). “The Standard DIN 6800: Procedures for Absorbed Dose Determina-tion in Radiology by the Ionization Method” in Proceedings of 1987 Symposium onDosimetry in Radiotherapy, Vol 1, pp. 13–24. Vienna, Austria: IAEA.
Chapter 9 The Physics of the AAPM’s TG-51 Protocol 291

7/31/2019 The Physics of the AAPM’s TG51_Rogers
http://slidepdf.com/reader/full/the-physics-of-the-aapms-tg51rogers 54/58
Hubbell, J. H. (1982). “Photon mass attenuation and energy-absorption coefficients from 1 keV
to 20 MeV.” Int J Appl Radiat Isot 33:1269–1290.Hunt, M. A., G. J. Kutcher. and A. Buffa. (1988). “Electron backscatter correction for paral-lel-plate chambers.” Med Phys 15:96–103.
Huq, M. S., N. Yue, and N. Suntharalingam. (1997). “Experimental determination of fluencecorrection factors at depths beyond d max for a Farmer type cylindrical ionization cham-ber in clinical electron beams.” Med Phys 24:1609–1613.
IAEA (2000). International Atomic Energy Agency. Absorbed Dose Determination in Exter-nal Beam Radiotherapy: An International Code of Practice for Dosimetry Based on Stan-dards of Absorbed Dose to Water. Technical Report Series (TRS) No. 398. Vienna,Austria: IAEA.
IAEA (1987). International Atomic Energy Agency. Absorbed Dose Determination in Photonand Electron Beams; An International Code of Practice. Technical Report Series (TRS)No. 277. Vienna, Austria: IAEA.
ICRU (1984a). International Commission on Radiation Units and Measurements. RadiationDosimetry: Electron Beams with Energies Between 1 and 50 MeV. ICRU Report 35,Washington D.C., ICRU.
ICRU (1984b). International Commission on Radiation Units and Measurements. StoppingPowers for Electrons and Positrons, ICRU Report 37. Bethesda, MD: ICRU.
ICRU (1979). International Commission on Radiation Units and Measurements. AverageEnergy Required to Produce an Ion Pair. ICRU Report 31. Washington D.C.: ICRU.
Johansson, K. A., L. O. Mattsson, L. Lindborg, and H. Svensson. (1977). “Absorbed-Dose
Determination with Ionization Chambers in Electron and Photon Beams Having Ener-gies Between 1 and 50 MeV” in IAEA Symposium Proceedings, pp. 243–270.IAEA–SM– 222/35. Vienna, Austria: IAEA.
Johns, H. E., and J. R. Cunningham. The Physics of Radiology, 4th ed. Springfield, IL:Charles C Thomas, 1983.
Kalach, N. I., and D. W. O. Rogers. (2003). “Which accelerator photon beams are ‘clinic-like’ for reference dosimetry purposes?” Med Phys 30:1546–1555.
Kapsch, R. P., G. Bruggmoser, G. Christ, O. S. Dohm, G. H. Hartmann, and E. Schüle.(2007). “Experimental determination of pCo perturbation factors for plane-parallelchambers.” Phys Med Biol 52:7167–7181.
Kawrakow, I. (2000). “Accurate condensed history Monte Carlo simulation of electron trans-port. II. Application to ion chamber response simulations.” Med Phys 27:499–513.Khan, F. M., K. P. Doppke, K. R. Hogstrom, G. J. Kutcher, R. Nath, S. C. Prasad, J. A. Purdy,
M. Rozenfeld, and B. L. Werner. (1991). “Clinical electron-beam dosimetry: Report of AAPM Radiation Therapy Committee Task Group 25.” Med Phys 18:73–109. Alsoavailable as AAPM Report No. 32.
Klassen, N. V., K. R. Shortt, J. P. Seuntjens, and C. K. Ross. (1999). “Fricke dosimetry: Thedifference between G(Fe3+) for 60Co γ -rays and high-energy x-rays.” Phys Med Biol 44:1609–1624.
Klevenhagen, S. C. (1994). “An algorithm to include the bremsstrahlung contamination in thedetermination of the absorbed dose in electron beams.” Phys Med Biol 39:1103–1112.
Klevenhagen, S. C. (1991). “Implications of electron backscatter for electron dosimetry.” Phys Med Biol 36:1013–1018.
292 D. W. O. Rogers

7/31/2019 The Physics of the AAPM’s TG51_Rogers
http://slidepdf.com/reader/full/the-physics-of-the-aapms-tg51rogers 55/58
Kosunen, A., H. Järvinen, and P. Sipilä. (1994). Optimum Calibration of NACP type Plane-
Parallel Ionization Chambers for Absorbed Dose Determinations in Low Energy Elec-tron Beams” in Proceedings of a Symposium on Measurement Assurance in Dosimetry,pp. 505– 513. IAEA–SM–330/419. Vienna, Austria: IAEA.
Kosunen, A., and D. W. O. Rogers. (1993). “Beam quality specification for photon beamdosimetry.” Med Phys 20:1181–1188.
Laitano, R. F., A. S. Guerra, M. Pimpinella, H. Nyström, M. Karlsson, and H. Svensson.(1993). “Correction factors for calibration of plane-parallel ionization chambers with a60Co gamma-ray beam.” Phys Med Biol 38:39–54.
Li, X. A., and D. W. O. Rogers. (1994). “Reducing electron contamination for photon-beam-quality specification.” Med Phys 21:791–798.
Ma, C.-M., and A. E. Nahum. (1993). “Effect of size and composition of central electrode onthe response of cylindrical ionisation chambers in high-energy photon and electronbeams.” Phys Med Biol 38:267–290.
Ma, C.-M., and D. W. O. Rogers. (1995). “Monte Carlo Calculated Wall Correction Factorsfor Plane-Parallel Chambers in High-Energy Electron Beams” in Proceedings of the1995 COMP Annual Meeting (Canadian Organization of Medical Physicists, Edmonton,Alberta), pp. 117–118.
Mainegra-Hing, E., I. Kawrakow, and D. W. O. Rogers. (2003). “Calculations for plane-parallel ion chambers in 60Co beams using the EGSnrc Monte Carlo code.” Med Phys
30:179–189.Mijnheer, B. J., and J. R. Williams. (1985). “Comments on dry air or humid air values for
physical parameters used in the AAPM protocol for photon and electron dosimetry.” Med Phys 12:656–658.
Nahum, A. E. (1988). Extension of the Spencer-Attix Cavity Theory to the 3-Media Situationfor Electron Beams In Dosimetry in Radiotherapy, Vol 1, pp. 87–115. Vienna: IAEA.
Nahum, A. E. (1994). Perturbation Effects in Dosimetry. Technical Report ICR-PHYS-1/94.Joint Department of Physics, The Royal Marsden Hospital, Sutton, Surrey, UK.
Palm, Å., and O. Mattsson. (1999). “Experimental study on the influence of the central elec-trode in Farmer-type ionization chambers.” Phys Med Biol 44:1299–1308.
Palm Å, O. Mattsson, and P. Andreo. (2000). “Calibration of plane-parallel chambers anddetermination of Pwall for the NACP and Roos chambers for 60Co γ -ray beams.” Phys
Med Biol 45:971–981.Reft, C. S., and F. T. Kuchnir. (1999). “Measured overall perturbation factors at depthsgreater than d max for ionization chambers in electron beams.” Med Phys 26:208–213.
Rogers, D. W. O. (2004). “Accuracy of the Burns equation for stopping-power ratio as afunction of depth and R50.” Med Phys 31:2961–2963.
Rogers, D. W. O. (1999). “Correcting for electron contamination at dose maximum in photonbeams.” Med Phys 26:533–537.
Rogers, D. W. O. (1998). “A new approach to electron beam reference dosimetry.” Med Phys
25:310–320.Rogers, D. W. O. “Fundamentals of Dosimetry Based on Absorbed-Dose Standards” in
Teletherapy: Present and Future. J. R. Palta and T. R. Mackie (eds.). Madison, WI:
Advanced Medical Physics, pp. 319–356, 1996.
Chapter 9 The Physics of the AAPM’s TG-51 Protocol 293

7/31/2019 The Physics of the AAPM’s TG51_Rogers
http://slidepdf.com/reader/full/the-physics-of-the-aapms-tg51rogers 56/58
Rogers, D. W. O. (1992a). “Calibration of parallel–plate ion chambers: Resolution of several
problems by using Monte Carlo calculations.” Med Phys 19:889–899.Rogers, D. W. O. (1992b). “The advantages of absorbed-dose calibration factors.” Med Phys
19:1227–1239.Rogers, D. W. O. “Fundamentals of High Energy X-ray and Electron Dosimetry Protocols”
in Advances in Radiation Oncology Physics, J. Purdy (ed.). Medical Physics Monograph19. New York: American Institute of Physics, pp. 181–223, 1992c.
Rogers, D. W. O. (1991). Compilation of Quantities Associated with Dosimetry Protocols.NRC Report PIRS–291. Ottawa: NRC.
Rogers, D. W. O., and A. F. Bielajew. (1986). “Differences in electron depth dose curvescalculated with EGS and ETRAN and improved energy range relationships.” Med Phys
13:687–694.Rogers, D. W. O. and A. Booth. (2009). PROT: A General Purpose Utility for Calculating
Quantities Related to Dosimetry Protocols. Technical Report CLRP 09-01, PIRS–529(rev. in preparation). Ottawa: Carleton University and National Research Council.
Rogers, D. W. O., and C. K. Ross. (1992). “Comparison of IAEA 1987 and AAPM 1983protocols for dosimetry calibration of radiotherapy beams.” Med Phys 19:213–214.
Rogers, D. W. O., and C. K. Ross. (1988). “The role of humidity and other correction factorsin the AAPM TG–21 dosimetry protocol.” Med Phys 15:40–48.
Rogers, D. W. O., and C. L. Yang. (1999). “Corrected relationship between %dd(10)x andstopping-power ratios.” Med Phys 26:538–540.
Rogers, D. W. O., B. A. Faddegon, G. X. Ding, C.-M. Ma, J. Wei, and T. R. Mackie. (1995).
“BEAM: A Monte Carlo code to simulate radiotherapy treatment units.” Med Phys 22:503–524.
Rogers, D. W. O., C. K. Ross. K. R. Shortt, N. V. Klassen, and A. F. Bielajew. (1994).“Towards a Dosimetry System Based on Absorbed-Dose Standards” in Proceedings of aSymposium on Measurement Assurance in Dosimetry, pp. 565–580. IAEA–SM–330/9.Vienna, Austria: IAEA.
Ross, C. K., K. R. Shortt, D. W. O. Rogers, and F. Delaunay. (1994). “A Test of TPR 2010 as a
Beam Quality Specifier for High-Energy Photon Beams” in Proceedings of a Sympo-sium on Measurement Assurance in Dosimetry, pp. 309–321. IAEA–SM–330/10.Vienna, Austria: IAEA.
Schulz, R. J., P. R. Almond, G. Kutcher, R. Loevinger, R. Nath, D. W. O. Rogers, N. Sunthar-alingham, K. A. Wright, and F. Khan. (1986). “Clarification of the AAPM Task Group 21protocol.” Med Phys 13:755–759.
Seltzer, S. (2008). NIST, private communication.Seuntjens, J. P., C. K. Ross, K. R. Shortt, and D. W. O. Rogers. (2000). “Absorbed-dose
beam quality conversion factors for cylindrical chambers in high-energy photon beams.” Med Phys 27:2763–2779.
Sheikh-Bagheri, D., D. W. O. Rogers, C. K. Ross, and J. P. Seuntjens. (2000). “Comparisonof measured and Monte Carlo calculated dose distributions from the NRC linac.” Med
Phys 27:2256–2266.Shiragai, A. (1979). “Effective mass stopping power ratio in photon dosimetry.” Phys Med
Biol 24:452–454.Shiragai, A. (1978). “A proposal concerning the absorbed dose conversion factor.” Phys Med
Biol 23:245–252.
294 D. W. O. Rogers

7/31/2019 The Physics of the AAPM’s TG51_Rogers
http://slidepdf.com/reader/full/the-physics-of-the-aapms-tg51rogers 57/58
Spencer, L. V., and F. H. Attix. (1955). “A theory of cavity ionization.” Radiat Res 3:
239–254.Svensson, H., and A. Brahme. “Recent Advances in Electron and Photon Dosimetry” in Radiation Dosimetry. C. G. Orton (ed.). New York: Plenum Press, pp. 87–170, 1986.
Thwaites, D. I., D. T. Burns, S. C. Klevenhagen, A. E. Nahum, and W. G. Pitchford. (1996).“The IPEMB code of practice for electron dosimetry for radiotherapy beams of initialenergy from 2 to 50 MeV based on air kerma calibration.” Phys Med Biol 41:2557–2603.
Titt, U., O. N. Vassiliev, F. Ponisch, L. Dong, H. Liu, and R. Mohan. (2006). “A flatteningfilter free photon treatment concept evaluation with Monte Carlo.” Med Phys 33(6):1595–1602.
Van der Plaetsen, A., J. Seuntjens, H. Thierens, and S. Vynckier. (1994). “Verification of absorbed doses determined with thimble and parallel-plate ionization chambers in clini-cal electron beams using ferrous sulphate dosimetry.” Med Phys 21:37–44.
Verhaegen, F., R. Zakikhani, A. DuSautoy, H. Palmans, G. Bostock, D. Shipley, and J. Seun-tjens. (2006). “Perturbation correction factors for the NACP-02 plane-parallel ionizationchamber in water in high-energy electron beams.” Phys Med Biol 51:1221–1235.
Wang, L. L. W., and D. W. O. Rogers. (2009a). “Study of the effective point of measurementfor ion chambers in electron beams by Monte Carlo simulation.” Med Phys 36:2034–2042.
Wang, L. L. W., and D. W. O. Rogers. (2009b). “The replacement correction factors forcylindrical chambers in electron beams.” Med Phys 36 (to be submitted, Jan. 2009).
Wang, L. L. W., and D. W. O. Rogers. (2009c). “The replacement correction factors forcylindrical chambers in high-energy photon beams.” Phys Med Biol 54:1609–1620.
Wang, L. L. W., and D. W. O. Rogers. (2008a). “Calculation of the replacement correctionfactors for ion chambers in megavoltage beams by Monte Carlo simulation.” Med Phys
35:1747–1755.Wang, L. L. W., and D. W. O. Rogers. (2008b). “The replacement correction factor for the
BIPM flat cavity ion chamber and the value of W/e.” Med Phys 35:4410–4416.Weinhous, M. S., and J. A. Meli. (1984). “Determining Pion , the correction factor for recom-
bination loses in an ionization chamber.” Med Phys 11:846–849.Wittkämper, F. W., H. Thierens, A. Van der Plaetsen, C. de Wagter, and B. J. Mijnheer.
(1991). “Perturbation correction factors for some ionization chambers commonlyapplied in electron beams.” Phys Med Biol 36:1639–1652.
Wulff, J., J. T. Heverhagen, and K. Zink. (2008). “Monte-Carlo-based perturbation and beamquality correction factors for thimble ionization chambers in high-energy photonbeams.” Phys Med Biol 53:2823–2836.
Wulff, J., K. Zink, and I. Kawrakow. (2008). “Efficiency improvements for ion chambercalculations in high energy photon beams.” Med Phys 35:1328–1336.
Xiong, G., and D. W. O. Rogers. (2008). “Relationship between %dd(10)x and stopping-power ratios for flattening filter free accelerators: A Monte Carlo study.” Med Phys 35:2104–2109.
Zink, K. and J. Wulff. (2008). “Monte Carlo calculations of beam quality correction factorsk Q for electron dosimetry with a parallel-plate Roos chamber.” Phys Med Biol 53:1595–1607.
Chapter 9 The Physics of the AAPM’s TG-51 Protocol 295

7/31/2019 The Physics of the AAPM’s TG51_Rogers
http://slidepdf.com/reader/full/the-physics-of-the-aapms-tg51rogers 58/58
Problems
1. Derive equation (9.9) for and equation (9.10) for in an electron
beam of quality R50 starting from the earlier equations.
2. Derive equation (9.14) for the dose to the medium in terms of Dair.
3. Starting from the definition of Pgr and assuming that D(z) = Do e− m z for alldepths z past the depth of dose maximum, derive equation (9.39) for interms of the offset ∆z.
4. Starting from equation (9.41), derive equation (9.42) for Pion for general recom-bination in a continuous beam.
5. Starting from equation (9.43), derive equation (9.46) for Pion in a pulsed beam.
Pgr
offset
N D wQ
, N D w
Qecal
,
296 D. W. O. Rogers