the phytotoxicity of selected mycotoxins on mature, germinatingzea mays embryos
TRANSCRIPT

Mycopathologia 132: 173-183, 1996. 173 © 1996 Kluwer Academic Publishers. Printed in the Netherlands.
The phytotoxicity of selected mycotoxins on mature, germinating Zea mays embryos
M i c h e l l e M c L e a n Department of Physiology, Faculty of Medicine, University of Natal, P.O. Box 17039, Congella, 4013, South Africa
Received 6 June 1995; Accepted in final form 9 December 1995
Abstract
Mature maize (Zea mays) embryos were exposed to 5, 10 and 25 #g ml-1 of deoxynivalenol (DON), zearalenone (ZEA), ochratoxin A (OA) and a mixture of zearalenone and deoxynivalenol (ZEA/DON) for 9 days. DON and the ZEA/DON combination were consistently more inhibitory of the measured parameters than either ZEA or OA. Based on the predicted additive values, it would appear that, in combination, ZEA and DON act synergistically to inhibit root and shoot growth. For ZEA alone, a concentration of 5/~g ml - 1 ZEA was generally inhibitory of root and shoot elongation and fresh mass accumulation, while at 10 and 25/zg ml - 1, this toxin had a stimulatory effect on these parameters. For OA, the measured effects on root and shoot growth at 5 and 25 #g ml - 1 were stimulatory, while at 10 pg ml - t OA, an inhibitory effect was observed. For all toxins, inhibitory/stimulatory effects were generally more marked for root parameters than for shoot elongation or mass.
Key words: Deoxynivalenol, Embryo, Mature, Ochratoxin, Plantlet, Zearalenone, Zea mays
Abbreviations: ADON, acetyldeoxynivalenol; AFB1, aflatoxin B1; DAS, diacetyoxyscirpenol; DON, deoxyni- valenol; FB 1, fumonisin B 1; FHB, Fusarium head blight; MON, moniliformin; NIV, nivalenol; OA, ochratoxin A; ZEA, zearalenone
Introduction
Under field conditions, plants and developing and maturing seeds are frequently subjected to attack by a variety of micro-organisms, from viruses, through bacteria to fungi. Traditionally, the fungi that invade seed crops have been described as 'field' fungi (e.g. Cladosporium, Fusarium, Alternaria spp.), which reputedly gain access to seeds during plant develop- ment, and 'storage' fungi, (e.g. Aspergillus; Penicil- llum spp.), which proliferate during storage [1, 2]. It is now, however, generally considered that most of these 'storage' fungi are capable of invasion under field conditions, and the prevalence of one or other species will depend on local environmental factors, the storage regime and interfungal relationships [3]. It is well documented that while Aspergillus and Pen- cillium species generally predominate during storage, Fusarium species are considerably more active under field conditions. Many Fusarium species may, howev-
er, persist for several months of storage at low temper- ature [4]. Some of these fungi elaborate mycotoxins (secondary metabolites), many of which are consid- ered a potential risk to human and animal populations (e.g. aflatoxin BI and hepatocellular carcinoma [5])
Several of the Fusaria are regarded as plant pathogens, causing fusarial head blight of wheat (FHB) and ear rot of maize, amongst other diseases [6, 7]. The r61e of the secondary metabolites of Fusarium spp. in plant diseases is, however, circumstantial and contro- versial. Fusarium pathogenicity has been related to trichothecene production [7-13], with reduced yield and kernel size being reported [7, 10-14]. On the oth- er hand, Adams & Hart [15] have found that several strains of highly virulent Gibberella zea (teleomorph of F. graminearum) did not produce DON or ADON, and concluded that toxins were not virulence factors in disease development. The results of these studies have been inconsistent, and it has been suggested that the apparent contradiction regarding the involvement
174
of Fusarium toxins in plant disease may arise, in part, from differing abilities of plants to metabolise the tox- ins [16].
The present investigation utilises an in vitro assay of excised, mature germinating Zea mays embryos to assess the phytotoxic effects of DON, ZEA and OA on the growth and development of the plantlets. Since F. graminearum may produce several metabolites, of which DON, ADON and ZEA are the most important [6], a combination of ZEA/DON was also investigated.
Statistics. Data were compared with control values (ANOVA, LSD, p ___ 0.05) [Tables 1 and 2]. In addi- tion, measurements were expressed as a percentage inhibition of the mean control value. Inhibitory effects of 5, 10 and 25 #g m1-1 toxin concentrations were compared statistically (Figures 1 and 2a-e). For any one toxin treatment (e.g. ZEA) and any one parameter measured (e.g. root fresh mass), different alphabetical letters indicate statistically significant differences (see tables and figures).
Materials and methods
Aflatoxin exposure. Mature Zea mays seeds (PNR 6363, Pannar Seed Company, Greytown, Kwazu- lu/Natal, South Africa) were surface-sterilised in 2% Hibitane (v/v) (ICI Pharmaceuticals; South Africa) for 15 min and, in order to facilitate aseptic embryo excision, caryopses were soaked overnight in ster- ile distilled water. Following excision, embryos were surface-sterilised in 2% Hibitane (15 min), soaked for 15 min in a 10 mg ml-1 penicillin/streptomycin mix- ture (Highveld Biological, South Africa), followed by a 15 min immersion in 2% NaOC1. Embryos were rinsed three times in sterile distilled water and plated aseptically onto a maize embryo germination medium (pH 5.8) [17] to which toxins from stock solutions of toxin (OA, ZEA or DON) were added after autoclaving of the medium to give final toxin concentrations of 5, 10 and 25 pg ml - 1. In the case of the ZEA/DON com- bination, toxins were added in equal volumes, such that final combined toxin concentrations were 5, 10 and 25 #g m1-1 (i.e. in 25 m1-1 toxin, DON = 12.5 pg m1-1 and ZEA = 12.5 #g ml-1). Appropriate con- trois incorporating methanol (in which toxins had been dissolved) were used.
Measurements. Embryos germinated and established for nine days on the medium (25 -4- 3 °C; 16 h pho- toperiod; 200 pmoles ml-1 sec-1 photon flux densi- ty). Three replicates of twenty or twenty-five embryos were assessed for each treatment. During the incu- bation period, roots (2, 4 and 6 days) and shoots (4 and 6 days) exceeding 20 mm were recorded. At the termination of the experiment, primary root and shoot length; root and shoot fresh mass and plantlet fresh and percentage dry mass were determined. Dry mass was determined by placing plantlets at 60 ° C until constant mass was attained.
Results
Root and shoot emergence
A dose range of 5-25 pg ml - 1 of toxin had no negative effect on embryo germination (i.e. 100% germination). Differences were, however, observed between the dif- ferent dose levels for any one toxin regime (Table 1). The percentage of plantlets with primary roots attain- ing a length greater than 20 mm following DON and ZEA/DON exposure was consistently lower than for ZEA or OA. In most instances, values reported for 25 /tg ml - 1 DON and ZEA/DON were significantly lower than for 5 or 10 pg m1-1. For OA, at 10/~g m1-1, the number of roots exceeding 20 mm in length was signif- icantly lower than for 5 or 25 pg ml - 1 toxin (Table 1). For shoots, differences between toxin concentrations for any one toxin were less marked than for root mea- surements. Statistically lower values were recorded for ZEA/DON and DON at 10 and/or 25 #g m1-1 when compared with control and plantlets exposed to 5 #g m1-1 (Table 1).
Primary root and shoot measurements; fresh and dry mass
Of the four toxin regimes investigated, DON and ZEA/DON were consistently more toxic than either ZEA or OA (Table 2, Figures I and 2a-e). The inhibito- ry effects on root and fresh mass accumulation were greater than was measured for shoots (Figures 1 and 2a - e).
DON. Values for primary root length and root fresh mass of 10 and 25 #g ml - 1 DON-treated plantlets were significantly lower than control and 5 #g ml - 1-treated material (Table 2). At 5 #g m1-1, a slight stimulatory effect on primary root length was recorded (Figure la, Table 2). The inhibitory effects (expressed as a %

Table 1. Percentage of root and shoots attaining a length in excess of 20 mm in plantlets of Zea mays exposed to 5 -25 t~g m l - 1 ZEA, DON, OA and a ZEA/DON combination for 9 days
1 7 5
Parameter Control Toxin concentration (~zg m l - 1 )
5 10 25
% roots > 20 mm
2 days DON 26 .64 -4 .4 24 .54-8 .3 17 .84-9 .9 19 .04-11 .8
ZEA 39.2 4- 4.9 46.7 4- 9.6 48.7 4- 0.7 38.3 4- 2.9
ZEA/DON 38.0 4- 4.3 a 20.0 4- 0.6 a 23.7 4- 2.0 i 6.7 4- 1.8 i
OA 43.4 4- 2.4 m 48.0 4- 4.9 n 29.5 4- 2.3 n 43.8 4- 9.2 mn
4 days DON 73.9 4- 4.9 a 75.8 4- 9.2 a 62.8 4- 12.5 a,b 46.3 4- 12.5 b
ZEA 90.6 4- 2.0 87.0 4- 4.0 93.3 4- 3.3 89.3 4- 4.3
ZEA/DON 85.4 4- 2.9 h 80.7 4- 8.6 h 83.7 4- 5.4 h 56.0 4- 8.1 i
OA 83.8 4- 3.4 m 80.3 4- 5.7 mn 62.3 4- 10.9 n 80.5 4- 4.6 mn
Ii days DON 81.1 4- 3.4 84.3 4- 7.7 72.3 4- 14.1 60.8 4- 17.6
ZEA 90.3 4- 2.3 91.7 4- 4.9 95.7 4- 2.3 94.7 4- 3.2
ZEA/DON 91.3 4- 2.7 a 87.3 4- 5.4 h 93.0 4- 3.5 i 71.0 4- 2.0 i
OA 87.5 4- 2.8 TM 85.8 4- 5.9 mn 69.0 4- 9.9 n 84.3 4- 2.8 mn
9 days DON 93.5 4- 1.4 a 91.5 4- 5.0 ab 81.0 4- 12.4 ab 72.0 4- 3.7 b
ZEA 93.8 -4- 2.5 91.0 -4- 5.5 95.7 4- 2.3 94.7 4- 3.2
ZEA/DON 92.9 4- 2.3 a 88.7 4- 6.3 a 94.3 4- 3.0 h 72.0 4- 17.1 i
OA 90.3 4- 2.4 TM 87.0 4- 5.2 mn 77.8 4- 6,2 n 87.0 4- 3.2 mn
% shoot > 20 mm
4 days DON 32.3 ± 9.9 24.8 4- 14.7 16.5 4- 11.8 7.0 4- 7.0
ZEA 34.6 4- 5.2 29.3 4- 8.4 48.7 4- 1.3 43.7 4- 12.3
ZEA/DON 53.1 4- 5,6 h 37.7 4- 2.7 m 33.7 4- 10.5 hi 17.7 4- 6.4 i
OA 4 7 . 0 4 - 4 . 0 52.3 4-5.3 42.04- 11.0 45.3 4- 1.1
6 days DON 63.6 4- 8.7 61.5 4- 17.3 63.3.4- 19.3 47.8 4- 17.0
ZEA 84.7 4- 4.7 89.3 4- 3.7 93.3 -4- 4.4 90,0 4- 5.8
ZEA/DON 90.4 4- 1.8 a 87.7 4- 3.7 h 75.3 4- 1.2 i 73.7 4- 1.3 i
OA 84.7 4- 1.8 88.0 -4- 4.3 78.5 4- 2.1 84.6 4- 2,7
9 days DON 96.3 4- 1.4 a 96.3 4- 2.4 a0 77.5 4- 13.0 b 76.3 4- 13.8 b
ZEA 97.4 4- 2.0 100 97.3 -4- 2.7 98.3 4- 1.7
ZEA/DON 99.6 4- 0.4 100 98.7 4- 1.3 100
OA 98.3 -4- 0,7 98.5 4- 1.5 100 97.8 4- 2.3
a;b;c, etc. Different alphabetical characters for any one toxin treatment (control and 5-25 /~g m l - 1 for 2, 4, 6 or 9 days) indicate a statistical difference. The absence of characters indicates that no statistical differences were measured for that toxin treatment. ZEA, DON, ZEA/DON and OA were considered separately.

176
o
o
8
c
7O
5O
3O
10
- 1 0
- 3 0
% i n h i b i t i o n - p r i m a r y r o o t l e n g t h ZEA, DON, ZEA/DON
5 10 25 Toxin concentration (Pg m l "~)
ZEA ~ DON ~ ZEA/DON
70
5o
E 30
,to
- 3 0
% i n h i b i t i o n - s h o o t f r e s h m a s s ZEA, DON, ZEA/DON
Iso d
a
i
T
e i de i ~__ _L_
#~;~:.~
I. a i
S 10 25 Toxin concentration ( ~ g m l "~)
ZEA ~ DON ~ ZEAIDON
% i n h i b i t i o n - s h o o t l e n g t h ZEA, DON, ZEA/DON
8 =~ 8 -$
"~ 3o J:
-z .,c - 10 =
- 30
150 b 50 . . . . . . . . . . . . . . . . . . . . . . . . . . . . . . . . . . . . . . . . . . . . . . . . .
e de
b
5 10 25 Toxin concentration (IJg m l "1}
ZEA ~ DON ~ ZEAIDON
% i n h i b i t i o n - r o o t f r e s h m a s s ZEA, DON, ZEA/DON
15° e e l C o ,o
o E ;~, ;~ ~ I , ; : / > ' . : J
.to L _ a b *~ . - b
- 3 0 5 10 25
Toxin concentration (tag m l "1)
ZEA ~ DON ~ ZEA/DON
Figure la-c . Percentage inhibitory response (with respect to con- trois) of zearalenone, deoxynivalenol and a ZEA/DON combination on plantlets of Zea mays. (a) Primary root length; (b) shoot length; (e) root fresh mass.
% i n h i b i t i o n - p l a n t l e t f r e s h m a s s ZEA, DON, ZEA/DON
Iso e 50 . . . . . . . . . . . . . . . . . . . . . . . . . . . . . . . . . . . . . . . . . . . . . . . .
30 e
-10 a a a
-30 - - . 5 10 25
Toxin concentration (Ng r n l ' l )
ZEA ~ DON ~ ZEA/DON
Figure ld-e . Percentage inhibitory response (with respect to con- trois) of zearalenone, deoxynivalenol and a ZEA/DON combination on plantlets of Zea mays. (d) Shoot fresh mass; (e) plantlet fresh mass.
inhibition with respect to the control) of 10 and 25 #g ml -~ DON on root length (38 - 43% inhibition) and root mass (43 - 46%) were significantly higher than at 5 #g m1-1 ( -3% and 9% inhibition for root length and mass, respectively) (Figures la,c). For most of the parameters measured, the greatest inhibitory effect was between 5 and 10 #g m1-1 toxin (Figures la,e).
The inhibitory effects of DON on shoot develop- ment were less marked than for root growth (Figures 1 a,d). Mean shoot length, shoot mass and plantlet fresh mass of 10 and 25 #g ml-Ltreated plantlets were sig- nificantly lower than those measured for 5 / zg ml -I or control plantlets (Table 2). Over the 5-25/zg m1-1 toxin regime, inhibition of shoot elongation (4-25%), shoot fresh mass (0.05-26%) and plantlet fresh mass

Table 2. The effects of DON, ZEA, OA and a ZEA/DON combination on root and shoot length and mass, plantlet fresh mass and % dry mass of germinating Zea mays embryos exposed to toxin for 9 days
177
Parameter Control Toxin concentration (#g m1-1)
5 10 25
Primary root length
DON 6.79 4- 0.30 a 6.96 4- 0.40 a 4.19 4- 0.23 b
ZEA 8.95 -4- 0.42 d 6.59 4- 0.63 e 9.24 4- 0.72 d
ZEA/DON 7.33 4- 0.37 h 4.81 4- 0.48 i 4.87 -4- 0.35 i
OA 6.76 4- 0.33 mn 6.85 4- 0.60 mn 5.45 4- 0.50 m
Root fresh mass
DON 0 .048 4- 0.004 a 0.043 4- 0.004 a 0.027 4- 0.003 b
ZEA 0.076 4- 0.005 de 0.065 4- 0.006 d 0.079 -4- 0.007 de
ZEA/DON 0.062 4- 0.003 h 0.045 4- 0.0030 0.047 4- 0.003 i
OA 0.065 4- 0.003 m 0.062 4- 0.005 mn 0.051 4- 0.005 n
Shoot length
DON 5.90 + 0.18 a 5.66 :k 0.28 a 4.44 4- 0.40 b
ZEA 6.64 4- 0.18 d 6.43 4- 0.24 d 7.85 4- 0.28 e
ZEA/DON 7.96 4- 0.175 7.00 4- 0.30 i 6.33 4- 0.29 ij
OA 6.56 4- 0.15 m 6.79 4- 0.25 rn 6.18 4- 0.25 m
Shoot fresh mass
DON 0.105 4- 0.006 a 0.105 4- 0.011 ab 0.085 4- 0.01 at'
ZEA 0 . 1 0 7 + 0 . 0 0 5 d 0.112:]=0.007 d 0 .1254-0 .010 d
ZEA/DON 0.121 4- 0.004 h 0.097 4- 0.007 i 0.094 + 0.006 i
OA 0.105 4- 0.003 m 0.109 4- 0.006 m 0.101 4- 0.006 m
Plantlet fresh mass
DON 0.261 4- 0.010 a 0.251 4- 0.001 ab 0.208 4- 0.012 bc
ZEA 0.297 4- 0.009 d 0.303 4- 0.013 d 0.318 4- 0.017 d
ZEA/DON 0.294 4- 0.007 la 0.255 4- 0.011 i 0.254 4- 0.011 i
OA 0.280 4- 0.006 m 0.281 4- 0.010 TM 0.265 4- 0.011 rn
% dry mass DON 14.37 4- 0.31 a 14.40 4- 0.41 a 16.35 4- 0.31 b
ZEA 13.55 4- 0.18 d 13.20 4- 0.26 d 13.11 4- 0.33 d
ZEA/DON 13.84 4- 0.16 h 14.14 4- 0.22 h 14.98 4- 0.39 i
OA 14.51 4- 0.15 m 14.10 4- 0.28 m 14.06 4- 0.26 TM
3.88 -t- 0.22 b
10.01 4- 0.79 d
3.37 4- 0.29 i
7.88 4- 0.74 n
0.026 4- 0.004 b
0.086 4- 0.009 e
0.034 -¢- 0.003J
0.066 4- 0.006 m
4.67 -4- 0.38 b
7.32 -4- 0.27 e
6.09 4- 0.29 j
6.71 4- 0.25 rn
0.078 4- 0.008 t'
0.122 4- 0.010 d
0.086 4- 0.006 i
0.102 4- 0.006 m
0.206 4- 0.011 c
0.314 4- 0.015 d
0.224 4- 0.010 i
0.261 4- 0.011 m
16.31 4- 0.60 b
13.36 4- 0.25 d
15.14 -4- 0.30 i
13.96 -t- 0.22 TM
a,b,c, etc. Different alphabetical letters for any one toxin treatment indicate a statistical significance.
(4-21%) were similar (Figures lb,d,e). The percentage dry mass of DON-treated plantlets exposed to 10 and 25 #g ml-1 DON was significantly higher than control
1 and 5 #g ml- -treated plantlets (Table 2).
ZEA. For ZEA, 5 #g m1-1 was generally inhibito- ry of the parameters assessed, while at 10 and 25 #g m1-1, a stimulatory effect was recorded (Table 2, Fig- ures 1 a-e). The inhibitory effect of 5 #g ml-1 ZEA was significant for primary root elongation, while the stimulatory effect was statistically significant for shoot elongation (Table 1). When percentage inhibition for the three toxin concentrations was compared, differ- ences between 5 and 10 or 25 #g m1-1 were significant for root and shoot elongation and for root fresh mass
(Figures 1 a-c). Stimulatory effects of ZEA at 10 and 25 #g ml-1 were similar for root and shoot measurement (Figures la-c).
Although plantlet fresh mass at all ZEA concentra- tion exceeded (2-7% increase) that of control plantlets, these values were not statistically significant (Table 2). ZEA had little effect on plantlet dry mass (Table 2).
ZEA/DON. Statistically lower values for root and shoot measurements and fresh mass were measured at all ZEA/DON concentrations (Table 2) when com- pared with controls. The greatest inhibitory response was measured between 5 and 10 #g m1-1 toxin (Fig- ures la-e). Statistically significant differences were observed between 5/10 and 25 #g m1-1 for root elon-

178
% i n h i b i t i o n - p r i m a r y r o o t l e n g t h Ochratoxin
7O
I~0 a 50 . . . . . . . . . . . . . . . . . . . . . . . . . . . . . . . . . . . . . . . . . . . . . . . . .
b
a b ~iii~iiii::ii~'.'~ii~
30
10
-10
-30 5 10 25
T o x i n concentra t ion (ug rnl "~)
% i n h i b i t i o n - s h o o t f r e s h m a s s Ochratoxin
7O
I~0 d 50 . . . . . . . . . . . . . . . . . . . . . . . . . . . . . . . . . . . . . . . . . . . . . . . . .
30
10
-10
a a
T o T , :::::::::::::::::::::::::::::::::::::::::: ,:.:,x.:.:..+:.:.:<.:.:.>:..:.:+:,:.
a
-30 5 10 25
T o x i n eoneent ra t ion (pg rnl "t)
o
8
70
% i n h i b i t i o n - s h o o t l e n g t h O c h r a t o x i n
50
30
10
-10
Iso b
a
r
a
-30 5 10 25
T o x i n c o n c e n t r a t i o n (pg ml "1)
o c
E 30
"6 tO
.~ -10
-3o
% i n h i b i t i o n - r o o t f r e s h m a s s O c h r a t o x i n
70
150 C 50 . . . . . . . . . . . . . . . . . . . . . . . . . . . . . . . . . . . . . . . . . . . . . . .
b
a b iiiiii:i::::!!i::i~ii~::~!::i!:~::; .........
a
5 10 25
T o x i n c o n c e n t r a t i o n (P9 m l ' l )
Figure 2a-c . Percen tage inh ib i to ry r e sponse (wi th respec t to con- t rols) o f o c h r a t o x i n on p lan t le t s o f Z e a mays. (a) P r imary root length; (b) shoo t length ; (c) roo t f resh mass .
30
10
-10
-30
% i n h i b i t i o n - p l a n t l e t f r e s h m a s s Ochratoxin
7O
150 e 50 . . . . . . . . . . . . . . . . . . . . . . . . . . . . . . . . . . . . . . . . . . . . . . . . .
5 10 25 T o x i n c o n c e n t r a t i o n (Jug m l "1)
Figure 2d-e. Percentage inhibitory response (with respect to con- trois) of ochratoxin on plantlets of Zea mays. (d) Shoot fresh mass; (e) plantlet fresh mass.
gation (Figure la), root mass (Figure lc) and plant- let fresh mass (Figure le). The greatest inhibitory response (54%) for all toxin treatments in the present investigation was measured for primary root lengths of embryos exposed to 25 /zg ml-1 ZEA/DON. The inhibitory effects of 25 #g ml-1 ZEA/DON on root fresh mass were slightly lower (45%). The inhibitory effects of 25/~g m1-1 on shoot mass (19-29%), shoot length (12-21%) and fresh mass (13-24%) were sim- ilar, and less inhibitory than measured for root length (34-54% inhibition) or root mass (28-45% inhibition) (Figures 1a-e). Inhibition at 5 #g m1-1 was always greater than for ZEA or DON alone (Figures 1a-e). At 10 and 25 pg m1-1, the inhibitory responses of DON and ZEA/DON were similar. At 10 #g m1-1, the inhibitory responses for DON generally exceed-

ed those of ZEA/DON, but this was reversed at 25 /~g m1-1 (Figure ld). The percentage dry mass of 10 and 25 #g ml-a ZEA/DON-treated plantlets was sig- nificantly greater than control and 5 #g ml-a-treated plantlets (Table 2).
OA. For most of the parameters measured,. 5 and 25/tg m1-10A had a stimulatory effect, while 10 #g ml- a was inhibitory (Table 2). These differences were, however, statistically significant for root length and root fresh mass only (10 #g ml- 1). When the inhibitory responses of the three toxin doses were compared, 5 and 25 #g ml- ag compared statistically (Figures 2a-e).
Although both plantlet fresh and dry mass decreased with increasing OA concentration, differ- ences were not statistically significant (Figures 2d, e).
Discussion
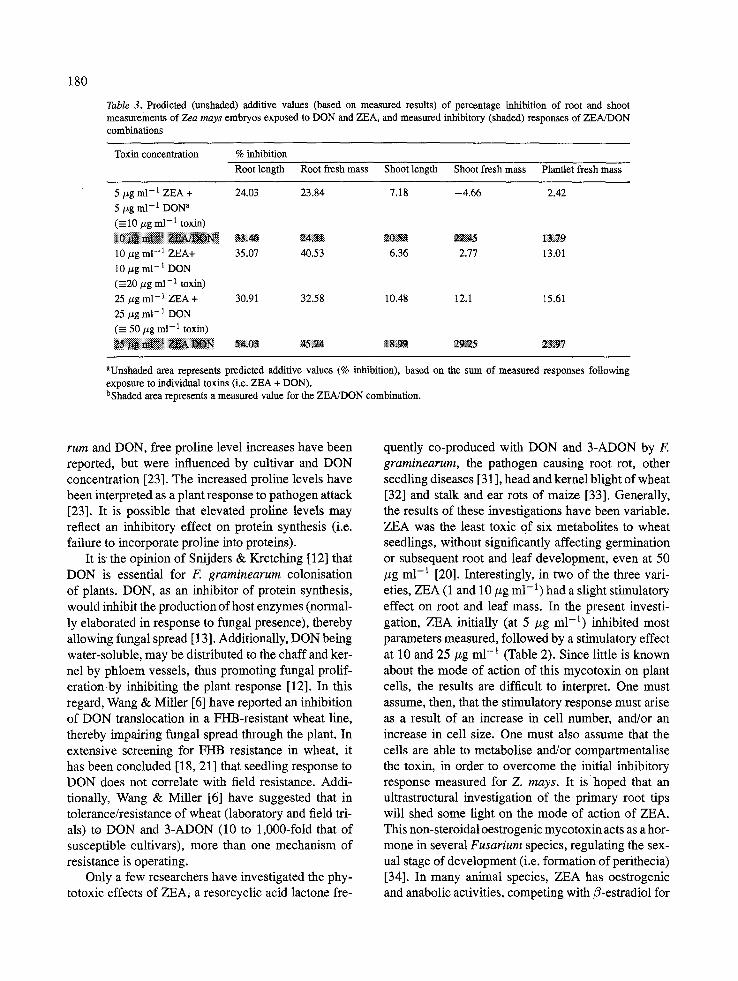
DON and ZEA/DON generally had an inhibitory effect on the parameters measured, while for ZEA and OA, these effects were negligible or stimulatory. Since ZEA alone stimulated root and shoot development, and DON was inhibitory, one could predict that, in combination, the effects of ZEA and DON may coun- teract each other (i.e. an additive response), resulting in less severe phytotoxic effects than DON alone. When comparing predicted additive effects with measured responses for ZEA/DON, the measured responses for ZEA/DON were generally greater (Table 3). At pre- dicted responses for 50/~g ml -a (25/~g m1-1 ZEA + 25 #g ml-1 DON), the inhibitory response of the mea- sured 25 /~g ml-1 ZEA/DON combination exceeded these values, suggesting that when ZEA and DON occur simultaneously, their phytotoxic effects may be synergistic (Table 3). These results have impor- tant implications regarding the presence in developing cereal crops of strains of F. graminearum producing more than one toxin (i.e. DON, ZEA, NIV, and/or ADON) [71, particularly since some of these metabo- lites are regarded as virulence factors in disease devel- opment [7, 11-14]. In wheat, even low incidences ofF. graminearum andF. culmorurn cause FHB, resulting in significant yield losses and mycotoxin contamination of grain [18, 19].
Several researchers have investigated the phyto- toxic effects of Fusarium metabolites. In this regard, Wakulifiski [20] found that of six Fusarium metabo- lites (T-2, ZEA, DAS, DON, ADON, MON), DON and 3-ADON (1-100 #g m1-1 ) were the most inhibitory of
179
wheat seed germination and subsequent root and leaf mass increases. ZEA was the least toxic [20]. Root development generally appeared more sensitive than shoot development to the toxins, as was observed in the present investigation with Zea mays. Shimada and Otani [21] found the 150 value (50% inhibitory effect) for DON in seven wheat varieties to be • 10/_tg m1-1 for shoot growth, and five-fold lower, at -t-2 #g ml- 1 for root growth [211, suggesting wheat may be more sensitive than presently being reported for maize. The 150 value for Z. mays root elongation for DON was marginally below 25 #g ml- 1 (54% inhibition at 25/~g ml-1), while for the ZEA/DON combination, this was just above 25 ~g ml- i (43% inhibition at 25 #g m1-1) (Figure la). For shoot length, the I50 value exceeded 25 pg m1-1 for both DON and ZEA/DON (21% and 20% inhibition, respectively, at 25 #g ml-1). Inter- estingly, the effect of DON alone on shoot elongation was greater than for the ZEA/DON combination (Fig- ure lb). Bottalico et al. [22] have reported DON to be more inhibitory of root growth than of shoot/leaf growth in tomato seedlings. In wheat seeds, 50 #g ml-1 DON completely inhibited germination, while 10-25/zg ml-1 significantly reduced plantlet growth [231.
The phytotoxic effects of DON on tissues other than seeds/seedlings have also been investigated [18, 21,24]. Calli of three wheat genotypes exhibited differ- ing sensitivities to DON, as measured by callus regen- eration (calli forming shoots) [25 /zg m1-1 - 0-63% regeneration] [24]. A dose of 100 ppm DON proved lethal to most calli [24].
There is evidence that DON may exert it effects on nucleic acids. Packa [25] found a decrease in the mitotic index and an increase in chromosome abnor- malities in cells of roots of germinated caryopses of rye, wheat, triticale and field bean treated with 10 ~g ml-1 DON [25]. Similarly, in dividing root tip cells of DON-treated onion seedlings, mitotic activity (MI) and relative division rate (RDR) decreased [26].
In eukaryotic cells, although all 12,13- epoxytrichothecenes (DON, DAS, NIV, T-2 toxin) are reported to be cytotoxic and inhibit protein synthe- sis, this was dependent on the number and position of the hydroxyl groups and the type of esterifying acids [27]. DON is known to influence protein syn- thesis by acting on peptidyl transferase [28], and many yeasts, mammalian cells, fungi and the plant, Bac- charis megapotamica, contain modifie d peptidyl trans- ferase enzyme systems tolerant to trichothecenes [29, 30]. In wheat seedlings sensitive to both F. culmo-
180
Table 3. Predicted (unshaded) additive values (based on measured results) of percentage inhibition of root and shoot measurements of Zea mays embryos exposed to DON and ZEA, and measured inhibitory (shaded) responses of ZEA/DON combinations
Toxin concentration % inhibition
Root length Root fresh mass Shoot length Shoot fresh mass Plantiet fresh mass
5/~g m1-1 ZEA + 24.03 23.84 7.18 -4 .66 2.42
5/zg ml-1 DON a
(----10 tzg m1-1 toxin)
10 #g m l - 1 ZEA+ 35.07 40.53 6.36 2.77 13.01
10/zg ml - 1 DON (----20/zg m1-1 toxin)
25/~g m1-1 ZEA + 30.91 32.58 10.48 12.1 15.61
25/zg ml-1 DON
( - 50 #g m1-1 toxin)
aUnshaded area represents predicted additive values (% inhibition), based on the sum of measured responses following exposure to individual toxins (i.e. ZEA + DON). bShaded area represents a measured value for the ZEA/DON combination.
rum and DON, free proline level increases have been reported, but were influenced by cultivar and DON concentration [23]. The increased proline levels have been interpreted as a plant response to pathogen attack [23]. It is possible that elevated proline levels may reflect an inhibitory effect on protein synthesis (i.e. failure to incorporate proline into proteins).
It is the opinion of Snijders & Kretching [12] that DON is essential for F graminearum colonisation of plants. DON, as an inhibitor of protein synthesis, would inhibit the production of host enzymes (normal- ly elaborated in response to fungal presence), thereby allowing fungal spread [13]. Additionally, DON being water-soluble, may be distributed to the chaff and ker- nel by phloem vessels, thus promoting fungal prolif- eration by inhibiting the plant response [12]. In this regard, Wang & Miller [6] have reported an inhibition of DON translocation in a FHB-resistant wheat line, thereby impairing fungal spread through the plant. In extensive screening for FHB resistance in wheat, it has been concluded [18, 21] that seedling response to DON does not correlate with field resistance. Addi- tionally, Wang & Miller [6] have suggested that in tolerance/resistance of wheat (laboratory and field tri- als) to DON and 3-ADON (10 to 1,000-fold that of susceptible cultivars), more than one mechanism of resistance is operating,
Only a few researchers have investigated the phy- totoxic effects of ZEA, a resorcyclic acid lactone fre-
quently co-produced with DON and 3-ADON by E graminearum, the pathogen causing root rot, other seedling diseases [31 ], head and kernel blight of wheat [32] and stalk and ear rots of maize [33]. Generally, the results of these investigations have been variable. ZEA was the least toxic of six metabolites to wheat seedlings, without significantly affecting germination or subsequent root and leaf development, even at 50 #g ml-1 [20]. Interestingly, in two of the three vari- eties, ZEA (1 and 10 #g m1-1) had a slight stimulatory effect on root and leaf mass. In the present investi- gation, ZEA initially (at 5 /zg m1-1) inhibited most parameters measured, followed by a stimulatory effect at 10 and 25 #g m1-1 (Table 2). Since little is known about the mode of action of this mycotoxin on plant cells, the results are difficult to interpret. One must assume, then, that the stimulatory response must arise as a result of an increase in cell number, and/or an increase in cell size. One must also assume that the cells are able to metabolise and/or compartmentalise the toxin, in order to overcome the initial inhibitory response measured for Z. mays. It is hoped that an ultrastructural investigation of the primary root tips will shed some light on the mode of action of ZEA. This non-steroidal oestrogenic mycotoxin acts as a hor- mone in several Fusarium species, regulating the sex- ual stage of development (i.e. formation of perithecia) [34]. In many animal species, ZEA has oestrogenic and anabolic activities, competing with 3-estradiol for

receptor binding sites in animal [35] and human tis- sue [36]. Interestingly, c~-zearalenol (a metabolite of ZEA, particularly in man and the pig [37]), is several fold more active than the parent molecule [38]. In Z. mays cell suspensions, ZEA was metabolised to the c~- and fl-zearalenol and the fl-D-glucosides of zear- alenone and c~- and/3-zearalenol [39]. Up to 50% of the mycotoxin became bound to starch, hemicellulose, and in particular, lignin fractions, suggesting binding of zearalenone metabolites to cell wall components [39]. Scheel & Sandermann [40] have postulated that the incorporation of xenobiotic metabolites into lignin, followed by deposition in the cell wall, is a means of 'local excretion' and detoxification by plant cells. This might explain a possible 'compartmentalisation' of ZEA, but does not explain the observed stimulatory effect of ZEA on maize plantlets.
At low doses, ZEA does not appear to interfere with nucleic acids to any great extent. Packa [25] found a variable effect of 10 /tg m1-1 ZEA on germinat- ing seeds of wheat, rye and field bean: the mitotic activity increased for rye, but decreased for wheat and field beans. Since no abnormal metaphase chromo- somes were observed [25], it would suggest that at this ZEA concentration minimal disruption of DNA had occurred.
In the present investigation, the results for OA are as difficult to interpret as for ZEA: an initial stimu- latory effect (5/~g ml-1), an inhibitory effect (10 #g ml-1), followed by a stimulatory effect (25 #g m1-1) (Table 2, Figures 2a-e). Despite the numerous reports involving the contamination of plants and plant prod- ucts with OA [41,42], there is a paucity of information regarding the phytotoxic effects of this toxin. A decline in OA has been observed during storage of cereals [43], and it is assumed that metabolic conversion may take place in plant cells, as has been reported for animals [44]. In wheat and maize cell suspensions treated with a sublethal dose of OA (5 ppm), several metabolites of OA were recovered: hydroxylated metabolites and /3-glucosides of hydroxyochratoxin A [45], indicating metabolic conversion of the parent molecule. Based on their results, Ruhland et al [45] are of the opinion that OA derivatives produced by plants may be as toxic as the parent molecule, as found in human microsomes and rat hepatocytes [46]. It must be remembered, how- ever, that the assumptions regarding toxicity of OA metabolites are based on the findings for animal ceils. Plants have the ability to compartmentalise noxious substances [40], and hydroxylation and glucosidation of OA may indeed represent a detoxiflcation mecha-
181
nism. The formation of glucosides of OA by the wheat and maize cells is similar to the findings of Zill & coworkers for ZEA [39].
The apparent recovery of plantlets exposed to 25 #g ml-1 OA following the observed inhibitory response at 10 #g m1-1 could indicate the existence of mecha- nisms (metabolism; detoxification; compartmentalisa- tion) to overcome the phytotoxic effects. Since Ruh- tand & coworkers [45] have demonstrated that wheat and maize cells are able to metabolise OA, it is possible that the metabolites produced are rendered less toxic, or may somehow be sequestered away from the toxin site/s of action. In one of the few reports on the possible mode of action of OA albeit (in the animal literature), it has been proposed that OA is able to influence lipid peroxidation [47]. If this is indeed the case, and OA exerts minimal phytotoxic effects in comparison with other mycotoxins, then it must be assumed that harm- ful free radicals that may be generated in plant tissues are adequately scavenged.
While, in the present investigation, DON and the ZEA/DON combination proved to be the most phyto- toxic (Figures la--e), these mycotoxins were less tox- ic than has been reported for AFB1, using the same Z. mays embryo bioassay [48, 49] (Table 4). In that investigation, the 150 value of AFB1 for root elonga- tion was -4-7.5 #g ml - 1 toxin. The maximum inhibito- ry response for any root parameter measured in the present investigation was 54% (root elongation at 25 #g ml - 1 ZEA/DON), as compared with 81% for AFB ! (Table 4). The results for DON and ZEA/DON for shoot parameters were somewhat lower than for AFB 1, suggesting that the phytotoxic effects of DON and ZEA/DON may be more localised (i.e. at the root lev- el) than for AFB~. It is not known, however, whether DON and ZEA are transported to higher plant parts, but based on the literature (i.e. that DON is water- soluble), it is assumed that toxin may (to some extent) reach aerial plant parts. AFB1 was indeed able to do so, and so some of the inhibitory effects on shoot develop- ment may have resulted directly from toxin-exposure following translocation [49].
The increase in plantlet dry mass following expo- sure to the more phytotoxic mycotoxins (DON, ZEA/DON) is interesting. This increase may arise either as a result of the incorporation of toxin molecules into the cellulose and hemicellulose of the wall, and/or as a result of cell wall thickening as a possible defence mechanism. Zill et al. [39] found that in maize sus- pension cultures exposed to ZEA, the metabolites pro- duced were incorporated into plant cell walls. Thick-

182
Table 4. Comparison of maximum inhibitory response of aflatoxin B1 [49] and toxins used in the present investigation on root and shoot development
Parameter Maximum inhibitory response (% inhibition)
Present investigation Aflatoxin B1 [49]
Root length 54.03 4- 3.90 81.00 4- 1.33
(ZEA/DON - 25 ug m1-1)
Shoot length 24.60 -4- 6.81 37.68 4- 4.69
(DON - 10 t~g m1-1)
Root fresh mass 45.57 4- 7.4i 54.32 a
(DON - 25 tzg m1-1)
Shoot fresh mass 29.254- 5.40 54.22 -a
(ZEA/DON - 25 ~g m1-1)
aSE not determined (seedlings pooled).
ening of cell walls has frequently been reported in the literature as a response to fungal or toxin presence (i.e. maize callus exposed to FB 1) [50]. Cell wall thickening has been described in cells of maize leaves innoculat- ed with Puccinia gramininis f.sp. tritici or treated with exudates of germinating urediospores [51]. Wheeler [52] has suggested that wall deposits in disease or toxin-treated plants may function as a protective barri- er over damaged areas of the plasma membrane.
The apparent synergistic effect of DON and ZEA in combination reported in the present investigation emphasizes the importance of considering toxin com- binations in studying the role of mycotoxins in plant disease. This is of particular relevance since a num- ber of the Fusarium species implicated in plant disease may produce more than one mycotoxin (e.g.F. gramin- earum is capable of producing DON, NIV, ADON and/or ZEA). It may then be that symptoms associat- ed with a particular disease (e.g. FHB) in the affected plant result from the presence of more than one toxin.
References
1. Christensen CM, Kaufmann HH. Microflora. In: Christensen CM (ed), Storage of Cereal Grains and their Products. St. Paul: American Association of Cereal Chemists, 1974: 158-92.
2. Christensen CM, Saner DB. Microflora. In: Christenscn CM (ed), Storage of Cereal Grains and Their Products. St Paul: American Association of Cereal Chemists, 1982: 2194-40.
3. Mycock DJ, Berjak E Paradoxical behaviour of seed-storage and field fungi: an overview. S Aft J Sci 1992; 88: 371-75.
4. McLean M, Berjak E Maize grains and their associated mycoflora - a micro-ecological consideration. Seed Sci & Techno11987; 15: 831-50.
5. Hsieh DPH. Mode of action of mycotoxins. In: Hsieh DPH (ed), Mycotoxins in Food. Cambridge: Academic Press, 1987: 149-76.
6. Wang YZ, Miller JD. Effect of Fusarium graminearum metabolites on wheat tissue in relation to fusarium head blight resistance. J Phytopatho11988; 122:118-25.
7. Atanassov Z, Nakamura C, Mori N, Kaneda C, Kato H, Jin Y-Z, Yoshizawa T, Murai K. Mycotoxin production and pathogenic- ity of Fusarium species and wheat resistance to Fusarium head light. Can J Bot 1994; 72: 161-67.
8. Yoder OC. Toxins in pathogenesis. Annu Rev Phytopathol 1980; 18: 103-29.
9. Mafike M, Chelkowski J, Brayford D, Visconti A, Kwa~na K, Perkowski J. Fusarium graminearum Schwabe (Teleo- morph Gibberella zeae Schw. Petch) - Cultural characteristics, pathogenicity towards cereal seedlings and ability to produce mycotoxins. J Phytopatho11989; 124: 14348.
10. Snijders CHA, Perkowski J. Effects of head blight caused by Fusarium culmorum on toxin content and weight of wheat kernels. Phytopathology 1990; 80: 566-70.
11. Beremand MN, Desjardins AE, Hohn TM, VanMiddlesworth FL. Survey of Fusarium sambucinum (Gibberella pulicaris) for mating type, trichothecene production, and other selected traits. Phytopathology 1991; 81: 1452-58.
12. Snijders CHA, Krechting CE Inhibition of deoxynivalenol translocation and fungal colonization in Fusarium head blight resistant wheat. Can J Bot 1992; 70: 1570-76.
13. Snijders CHA. Breeding for resistance to Fusarium in wheat and maize. In: Miller JD, Trenholm HL, (eds), Mycotoxins in Grain. Compounds other than Aflatoxin. St. Paul: Eagan Press, 1994; 37-58.
14. Wakuliriski W. Phytotoxicity of Fusarium metabolites in rela- tion to pathogenicity. In: Chelkowski J (ed), Fusarium Myco- toxins, Taxonomy and Pathogenicity. Amsterdam: Elsevier Press, 1989; 257-68.
15. Adams GC, Hart LP. The role of deoxynivalenol and 15- acetyldeoxynivalenol in pathogenesis by Gibberella zeae, as elucidated through protoplast fusions between toxigenic and non-toxigenic strains. Phytopathology 1989; 79: 404408.
16. Desjardins AE, Hohn TM, McCormick SE Trichothecene biosynthesis in Fusarium species: Chemistry, genetics, and significance. Microbiol Rev 1993; 57: 595-604.
17. Reinert J, Yeoman MM. Plant Cell and Tissue Culture. Berlin: Springer-Verlag, 1982.
18. Bruins MBM0 Karsai I, Schepers J, Snijders CHA. Phytotox- icity of deoxynivalenol to wheat tissue with regard to in vitro selection for Fusarium head blight resistance. Plant Sci 1993; 94: 195-206.
19. Mirocha CJ, Weiping X, Yichun X, Wilcoxson RD, Wood- ward RP, Etebarian RH, Behele G. Production of trichothecene mycotoxins by Fusarium graminearum and Fusarium culmo- rum on barley and wheat. Mycopathologia 1994; 128: 19-23.
20. Wakuliriki W. Phytotoxicity of the secondary metabolites of fungi causing wheat head fu sariosis (head blight). Acta Pbysiol Plant 1989; 11: 301-306.
21. Shimada T, Otani M. Effects of Fusarium mycotoxins on the growth of shoots and roots at germination in some Japanese wheat cultivars. Cereal Res Commun 1990; 18: 229-32.
22. Bottalico A, Leario P, Visconti A. Some experimental data on the phytotoxicity of mycotoxins. Phytopath Medit 1980; 19: 196-98.
23. Bandurska H, Chelkowski J, Wi~niewska H. Free proline accu- mulation in wheat seedlings influenced by Fusarium culmorum

infection and the pathogen metabolite deoxynivaienol. Acta Physiol Plant 1994; 16:111-16.
24. Menke-Milczarek I, Zimny J. Phytotoxicity of deoxynivalenol to wheat calli. Mycotox Res 1991; 7: 146-49.
25. Packa D. Cytogenetic changes in plant cells as influenced by mycotoxins. Mycotox Res 1991; 7: 150-55.
26. Rahman MF, Bilgrami KS, Masood A. Cytotoxic effects of DON and T-2 toxin on plant cells. Mycopathologia 1993; 124: 95-97.
27. Betina V. Structure-activity relationships among mycotoxins. Chem-Biol Interact 1989; 71: 105--46.
28. McLaughlin CS, Vaughan MH, Campbell IM, Wei CM, Stafford ME, Hansen BS. Inhibition of protein synthesis by trichothecenes. In: Rodricks JV, Hesseltine CW, Mehlman MA (eds), Mycotoxins in Human and Animal Health. Park Forest South: Pathotox Publishers, 1977 ; Vol. 1: 63-73.
29. Jarvis BB, Midiwo JO, Tuthill D, Bean GA. Interaction between the antibiotic trichothecenes and the higher-plant Bac- charis megapotamica. Science 1981; 214: 460-62.
30. Schoental R. Mycotoxins and the toxicity of plants. Chemistry in Britain 1984; 1108, 1113.
3 t. M~tnke M, Visconti A, Chelkowski J, Bottalico A. Pathogenic- ity of Fusarium isolates from wheat, rye, and triticale towards seedlings and their ability to produce trichothecenes and zear- alenone. Phytopathol Z 1985; 113: 24-29.
32. Hagler W, Tycskowska K Hamilton PB. Simultaneous occur- rence of deoxynivalenol, zearalenone, and aflatoxin in 1982 scabby wheat from the midwestern United States. Appl Envi- ron Microbiol 1984; 47: 151-54.
33. Miller JD. Effects of Fusarium graminearum metabolites on wheat cells. In: Graniti A, Durbin RD, Ballio A (eds), Phyto- toxins and Plant Pat~ogenesis. NATO ASI Set. H. Cell Biol. 1989; 27: 449-52.
34. Wolf JC, Lieberman JR, Mirocha CJ. Inhibition of F-2 (zear- laenone) biosynthesis and perithecium production in Fusarium roseum 'Graminearum'. Phytopathology 1972; 62: 937-39.
35. PoweU-Jones W, Raeford S, Lucier GW. Binding properties of zearalenone mycotoxins to hepatic estrogen receptors. Mol Pharmacol 1981; 20: 35-42.
36. Martin PM, Horowitz KB, Ryans DS, McGuire WL. Phytoe- strogen interaction with estrogen receptors in human breast cancer cells. Endocrinology 1978; 103: 1860-67.
37. Mirocha CJ, Pathre SV, Robison TS. Comparative metabolism of zearalenone and transmission into bovine milk. Cosmet Food Toxicol 1981; 19: 25-30.
38. Kuiper-Goodman T, Scott PM. Risk assessment of the myco- toxin ochratoxin A. Biomed Environ Sci 1989; 2: 179-248.
39. Zill G, Engelhardt G, Wohner B, Walinofer PR. The fate of Fusarium mycotoxin zearalenone in maize cell suspension cul- tures. Mycotox Res 1990; 6: 31-40.
183
40. Scheel D, Sandermann H. Metabolism of 2,4-dichlorphen- oxyacefic acid in cell cultures of soybean (Glycine max L.) and wheat (Triticum aestivum L.). Planta 1981; 152: 253-58.
41. Krogh P, Hald B, Pederson EJ. Occurrence of ochratoxin A and citrinin in cereals associated with mycotoxin porcine nephropa- thy. Acta Path Microbiol Scand Sect B 1973; 81: 689-95.
42. Abramson D, Sinlaa RN, Mills JT. Mycotoxin formation in moist 2-row and 6-row barley during granary storage. Myco- pathologia 1987; 97: 179-95.
43. Rotter RG, Marquard RR, Frohlich AA, Abramson D. Ensil- ing as a means of reducing ochratoxin A concentrations in contaminated barley. J Sci Food Agr 1990; 50: 155-66.
44. St0rmer FC, Storen O, Hansen CE, Pedersen JI, Aasen AJ. Formation of (4R)- and (4S)-4- hydroxyochratoxin A and 10-hydroxyochratoxin A from ochratoxin A by rabbit liver microsomes. Appl Environ Microbiol 1983; 45:1183-87.
45. Ruhland M, Eugelhardt G, Walin6fer PR. Transformation of the mycotoxin ochratoxin A in wheat and maize cell suspension cultures. Naturwissenschaften 1994; 81: 453-54.
46. Creppy EE, St0rmer FC, R6schenthaler R, Dirheimer G. Effects of two metabolites of ochratoxin A, (4R)-4- hydroxyochratoxin A and oclaratoxin c~, on immune response in mice. Infect Immun 1983; 39: 1015-18.
47. Rahimtula AD, B6r6ziat J-C; Bussacchini-Griot V, Bartsch H. Lipid peroxidation as a possible cause of ochratoxin A toxicity. Biochem Pharmacol 1988; 37: 4469-77.
48. McLean M, Berjak P, Watt MP and Dutton MF. The influence of aflatoxin B 1 on the in vitro germination and growth of excised, mature Zea mays embryos. J Nat Toxins 1993; 2: 13-26.
49. McLean M. Towards an understanding of the effects of aflatox- in B1 on plant tissue. PhD Thesis, University of Natal, South Africa, 1993.
50. van Asch MAJ. Studies on the resistance of wheat and maize to ftmgal pathogenesis. PhD Thesis, University of Natal, Pieter- maritzburg, South Africa, 1990.
51. Leath KT, Rowell JB. Thickening of corn mesophyll walls in response to invasion by Puccinia graminis. Phytopathology 1969; 59: 1654-56.
52. Wheeler H. Cell wall and plasma membrane modifications in diseased and injured plant tissues. Can J Bot 1974: 52: 1005- 1009.
Address for correspondence: Dr. M. McLean, Dept. of Physiology, Faculty of Medicine, University of Natal, P.O. Box 17039, Congella 4031, South Africa. Phone: +27-31-2604275; Fax: +27-31-2604455 E-Mail: [email protected]