the plasma nature of lightning channels and the resulting
TRANSCRIPT


Journal of Geophysical Research: Atmospheres 10.1029/2019JD030693
collision rates between charged and neutral particles, and low degree of ionization (see, e.g., Becker et al.,
2004). Streamers, for instance, only partially meet the three standard conditions that traditionally define a
plasma (Bittencourt, 2004; pp. 6–11). These criteria define the plasma's ability to shield short-range electro-
static interactions between individual particles, remain quasi-neutral, and respond collectively to long-range
electromagnetic forces. The three conditions can be estimated for typical streamer properties at atmospheric
pressure, that is, electron temperature of 23,000 K, or ∼2 eV, and electron density of 1018–1020 m−3 (Raizer,
1991; section 12.3). First, the Debye length is∼1–10 μm,which is relatively smaller than the streamer radius,
∼0.1–1 mm (Naidis, 2009). Second, there are many electrons in a Debye sphere, ∼500–5,000. Third, the
electron-neutral collision frequency is ∼ 1012 s−1, which is higher than the frequency of relevant processes,
including the plasma frequency. Therefore, it can be said that the first two conditions are approximately
met, but not the third one. On the other hand, it is easy to show that all three conditions are met in the
return stroke channel. Therefore, even though the formal definition of a plasma is not alwaysmet within the
many elements of a lightning flash, we refer to its constituting ionized gas as a “plasma,” because it remains
quasi-neutral and responds collectively to applied electric fields.
The aforementioned collective behavior in lightning is evidenced in the many types of ionization waves
(e.g., streamer front, leader front, dart leaders, and return strokes), its ability to shield itself from exter-
nally applied electric fields, and its negative differential resistance, which in its turn map into several
phenomenological features, including its fractal structure, the contrasting behavior of positively and neg-
atively charged extremities, and the fact that leader channels are enveloped by streamer zones and corona
sheaths. This manuscript focus on perhaps the most important feature attributed to the plasma nature of
lightning—its nonlinear resistance. A correct description of the channel resistance is required to better
characterize lightning electromagnetic emissions, to correctly predict its deleterious effects in man-made
structures, to quantify the impacts of lightning in atmospheric chemistry, and to address fundamental open
questions regarding lightning initiation, propagation, and polarity asymmetries. The nonlinear plasma resis-
tance is in its turn dependent on the history of energy deposition and losses in the channel and cannot be
accurately determined without properly tracking the evolution of all other channel properties, including
electric field, electron density, temperature, and radius.
Efforts to characterize the nonlinear resistance and overall plasma properties of the lightning channel can
be classified into three categories: (1) LTE gas-dynamic models (Aleksandrov et al., 2000; Chemartin et al.,
2009; Hill, 1971; Paxton et al., 1986; Plooster, 1971; Ripoll et al., 2014a), (2) streamer-to-leader transition
models (Aleksandrov et al., 2001; Bazelyan et al., 2007; da Silva & Pasko, 2013; da Silva, 2015; Gallimberti,
1979; Gallimberti et al., 2002; Popov, 2003; 2009), and (3) semiempirical resistance models (Baker, 1990;
De Conti et al., 2008; Koshak et al., 2015; Mattos & Christopoulos, 1990; Theethayi & Cooray, 2005). The
three categories are described in the upcoming paragraphs. Instructive discussions and additional references
regarding each of the three categories can also be found in sections 2.5, 2.3, and 4.4, respectively, of Bazelyan
and Raizer's (2000) textbook. On a separate note, the literature concerning the resistance of short spark
discharges in the laboratory is very rich and has providedmany insights into building themodels cited above
(see, e.g., Engel et al., 1989; Kushner et al., 1985; Marode et al., 1979; Naidis, 1999; Riousset et al., 2010;
Takaki & Akiyama, 2001). It is outside of our scope to provide a detailed review of these investigations, but
it can easily be found elsewhere (da Silva & Pasko, 2013; Engel et al., 1989; Montano et al., 2006).
The first group of investigations evaluates the resistance of a lightning channel under the assumption that
the plasma is in LTE. In this framework, the electrical conductivity is only a function of temperature, that
is, 𝜎 = 𝜎(T), which is valid for atmospheric-pressure arcs at temperatures higher than ∼10,000 K, where T
or simply the word “temperature” here and in the remainder of this manuscript corresponds to the tem-
perature of the neutral gas. (The 10,000-K threshold is a rough estimate; see section 2.2 for justifications.)
Following the return stroke simulations performed by Plooster (1971), these models describe how Joule
heating deposition in the channel core heats the air and causes rapid hydrodynamic expansion. They solve
a system of three equations accounting for conservation of mass, momentum, and energy (or enthalpy) of
the neutral gas (air). They are often solved in a 1-D radial domain, with the exception being the work of
Chemartin et al. (2009) where efforts are made to capture the 3-D tortuosity of a plasma arc. A few of these
models also present a detailed description of the plasma radiative transfer (see, e.g., Paxton et al., 1986;
Ripoll et al., 2014a).
DA SILVA ET AL. 9443

Journal of Geophysical Research: Atmospheres 10.1029/2019JD030693
The second class is dedicated to a detailed description of the streamer-to-leader transition process, which
takes place during the discharge onset or at the tip of a growing channel. Streamer-to-leader transition is the
name given to the sequence of processes converting cold and low-conductivity plasma channels (streamers)
into hot and highly conducting ones (leaders), a condition required to allow lightning channels to propagate
for several kilometers in the atmosphere before decaying (Bazelyan & Raizer, 2000, p. 59). These models
account for the hydrodynamic expansion of the neutral gas, such as the ones described in the first category.
However, following in the footsteps of the seminal monograph by Gallimberti (1979), they also account for
a non-LTE plasma conductivity arising from the detailed kinetic balance of an air plasma. The more recent
models describe in detail the energy exchange between charged and neutral particles accounting for the
partitioning of electronic power between elastic collisions, and excitation of vibrational and electronic states,
and also delayed vibrational energy relaxation of nitrogen molecules (see, e.g., da Silva & Pasko, 2013). The
non-LTE conductivity regime encompasses temperatures lower than∼10,000 K. Themodels in this category
(cited in this paragraph) do not account for photoionization, which is important at the high temperatures
present in the return stroke channel.
The third category groups investigations where a semiempirical expression for the channel resistance (per
unit length) as a function of time, R(t), has been employed in return stroke simulations. The reasoning
behind such approach is that it is impractical to use the self-consistent gas-dynamic simulations to calculate
the resistance of a channel that is 5 (or more) orders of magnitude longer than wider. Therefore, a paramet-
ric dependence for R(t) facilitates the implementation of a height-dependent, transmission-line-like return
stroke model. These investigations use expressions for R(t) derived by Barannik et al. (1975), Kushner et al.
(1985), and others, as reviewed by De Conti et al. (2008). To the best of our knowledge, only Liang et al.
(2014) present an effort to couple a self-consistent resistance calculationwith a transmission-line-like return
stroke model. These authors use a two-temperature plasma model to infer the electronic conductivity. The
model does not account for channel expansion or plasma chemistry, and it is unclear how well it compares
to the conventional gas-dynamic return stroke simulations. Nonetheless, investigations such as done by De
Conti et al. (2008) and Liang et al. (2014) raise the need for accurate and computationally efficient models
for R(t).
The objective of this work is to fill a gap in the peer-reviewed literature by introducing a comprehensive—yet
simple—model that can exemplify the plasma nature of lightning channels (section 2.1). We describe
a series of parameterizations that allow us to capture both the low-temperature/non-LTE and the
high-temperature/LTE regimes, account for radial expansion, and include negative-ion chemistry, at little
computational cost (section 2.2). Themodel is first tested by calculating the time scale for streamer-to-leader
transition (section 3.1), it is then validated against experimental data on the steady-state negative differential
resistance of plasma arcs (section 3.2), and finally, compared to well-established gas-dynamic return stroke
simulations (section 3.3). As an application of the model, we simulate optical emissions of rocket-triggered
lightning and compare to the experimental findings of Quick and Krider (2017) (section 3.4).
2. Model Formulation2.1. Basic Equations
In this work we describe the minimal model to qualitatively capture the consequences of the plasma nature
of lightning channels. The key simplification here is to solve a set of zero-dimensional equations (i.e., with
zero spatial dimensions) that describe the temporal dynamics of the plasma in a given cross section of the
channel. Starting from a general 3-D problem, we can progressively reduce the dimensionality of the system.
A schematical representation of themodel is given in Figure 1a. It can be assumed that the lightning channel
is a long cylinder. The axial symmetry indicates that the plasma conditions do not depend on the polar
coordinate. Furthermore, the 2-D long cylinder geometry can be reduced to a 1-D radial one, by noting that
variations along the channel have significantly larger length scales than along the radial direction. Thus,
the change in plasma properties are driven by the conduction current created by the overall lightning tree
dynamics and merely imposed in that channel section. Finally, the 1-D radial dynamics can be averaged
over to produce self-similar solutions of average channel properties. The minimal set of equations can be
written as follows:
E = RI =I
𝜎𝜋r2c=
I
e𝜇ene𝜋r2c
(1)
DA SILVA ET AL. 9444

Journal of Geophysical Research: Atmospheres 10.1029/2019JD030693
Figure 1. (a) Schematical representation of how the model simulates a cross sectional area of the lightning channel,provided only the current passing through that region I(t) and the channel initial conditions. (b) Current waveformsadopted in this study: constant current versus four-parameter pulsed profile. (c) Radial temperature profile andcorresponding channel expansion. Lightning leader channels are surrounded by streamer zones and corona sheaths,which are not depicted in panel (a).
𝜌mcpdT
dt= 𝜂T𝜎E
2 −4𝜅Tr2g
(T − Tamb
)− 4𝜋𝜖 (2)
dnedt
=(𝜈i − 𝜈a2 − 𝜈a3
)ne + 𝜈dnn + kepn
2LTE − kepne
(ne + nn
)(3)
dnndt
=(𝜈a2 + 𝜈a3
)ne − 𝜈dnn − knpnn
(ne + nn
)(4)
dr2cdt
= 4Da (5)
dr2g
dt=
4𝜅T𝜌mcp
(6)
Equation (1) is the Ohm's law applied to the channel's cross section, which relates the axial electric field E
to the electrical current I, via the resistance per unit channel length R= 1∕𝜎𝜋r2c , where 𝜎 is the electrical
conductivity and rc is the plasma channel or current-carrying radius. (For the remainder of this manuscript,
we refer to the resistance per unit channel length R as simply the resistance.) The electrical conductivity
is given by 𝜎 = e𝜇ene under the assumption that only the electron contribution is important, where e is the
electronic charge, 𝜇e is the electron mobility, and ne is the electron density. This is a reasonable approxima-
tion because the ion mobility is of the order of 10−4 m2·V−1·s−1 (at 1 atm), while the electron mobility is 2–4
orders of magnitude larger in the range of typical electric fields present in electrical discharges (see, e.g.,
Figure 3a).
Equation (2) describes the rate of change of air temperature T, where 𝜌m is the air mass density and cp is
the specific heat at constant pressure. The first term on the right-hand side is the rate of Joule heating of air,
where 𝜂T ≃ 10% is the fraction of electron Joule heating power contributing to air heating. The second term
represents cooling due to heat conduction, where rg is the thermal radius (delimiting the hot air region), 𝜅Tis the thermal conductivity, and Tamb =300 K is the ambient air temperature. The third term corresponds to
DA SILVA ET AL. 9445

Journal of Geophysical Research: Atmospheres 10.1029/2019JD030693
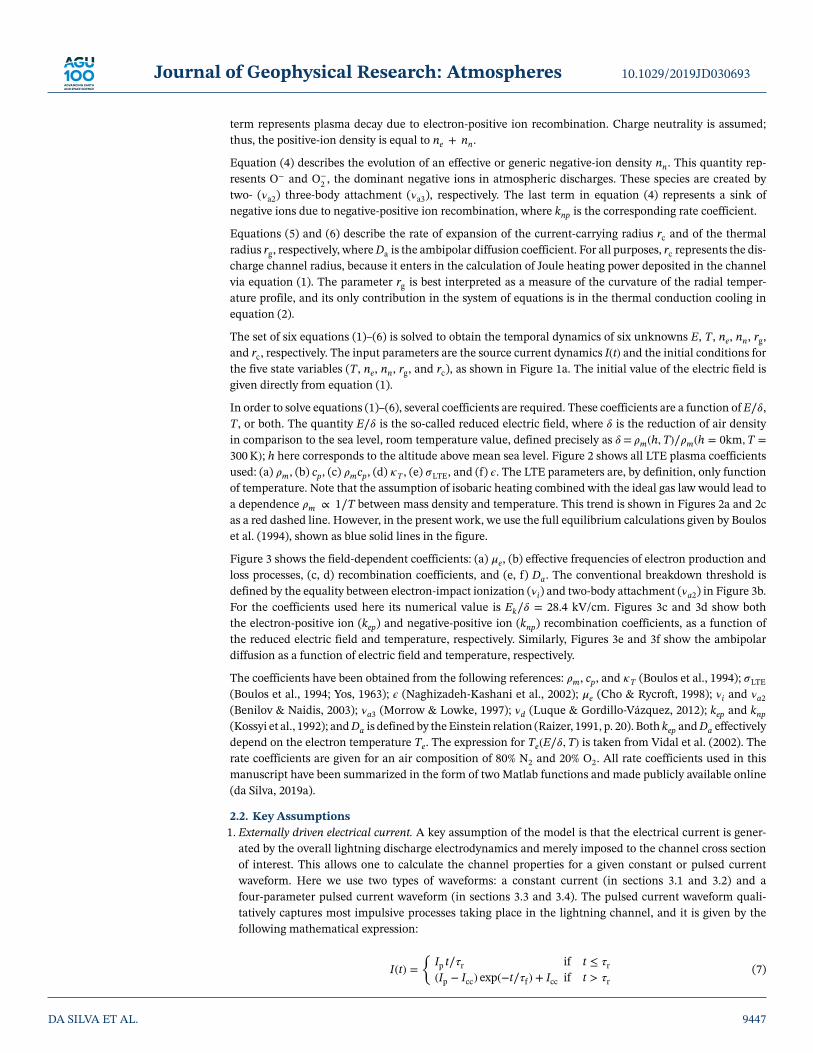
Figure 2. The solid lines show the local-thermodynamic equilibrium (LTE) properties of air as a function of temperature used in the present paper. (a) Massdensity 𝜌m, (b) specific heat at constant pressure cp, (c) the product 𝜌mcp, (d) thermal conductivity 𝜅T , (e) electrical conductivity 𝜎LTE, and (f) net emissioncoefficient 𝜖 for an optically thin plasma. The red dashed line in panels (a) and (c) show the ideal gas law trend 𝜌m ∝ 1∕T. In the original references, data areonly available for temperatures to the left of the vertical dash-dotted line. For higher temperatures, we perform an analytical extrapolation using the data in therange highlighted in green. The air-plasma properties shown in the figure are taken from Boulos et al. (1994, pp. 413–417), unless otherwise noted.
energy loss due to radiative emission, where 𝜖 is the net radiation emission coefficient. Equation (2) assumes
isobaric air heating and neglects cooling by convection.
Equation (3) describes the change in electron density ne. The first term on the right-hand side describes
the rate of change due to field-induced, electron-impact processes, where 𝜈i, 𝜈a2, and 𝜈a3 are the ionization,
two-, and three-body attachment frequencies, respectively. The second term describes electron detachment
from negative ions, where 𝜈d is the detachment frequency and nn is the negative-ion density. The third term
describes the effective rate of thermal ionization, where kep is the rate coefficient for electron-positive ion
recombination, and nLTE is the electron density in local thermodynamical equilibrium (LTE), defined as
nLTE = 𝜎LTE∕e𝜇e. TheLTE conductivity𝜎LTE is only a function of temperature (see, e.g., Figure 2e). The fourth
DA SILVA ET AL. 9446
Journal of Geophysical Research: Atmospheres 10.1029/2019JD030693
term represents plasma decay due to electron-positive ion recombination. Charge neutrality is assumed;
thus, the positive-ion density is equal to ne + nn.
Equation (4) describes the evolution of an effective or generic negative-ion density nn. This quantity rep-
resents O− and O−2, the dominant negative ions in atmospheric discharges. These species are created by
two- (𝜈a2) three-body attachment (𝜈a3), respectively. The last term in equation (4) represents a sink of
negative ions due to negative-positive ion recombination, where knp is the corresponding rate coefficient.
Equations (5) and (6) describe the rate of expansion of the current-carrying radius rc and of the thermal
radius rg, respectively, whereDa is the ambipolar diffusion coefficient. For all purposes, rc represents the dis-
charge channel radius, because it enters in the calculation of Joule heating power deposited in the channel
via equation (1). The parameter rg is best interpreted as a measure of the curvature of the radial temper-
ature profile, and its only contribution in the system of equations is in the thermal conduction cooling in
equation (2).
The set of six equations (1)–(6) is solved to obtain the temporal dynamics of six unknowns E, T, ne, nn, rg,
and rc, respectively. The input parameters are the source current dynamics I(t) and the initial conditions for
the five state variables (T, ne, nn, rg, and rc), as shown in Figure 1a. The initial value of the electric field is
given directly from equation (1).
In order to solve equations (1)–(6), several coefficients are required. These coefficients are a function of E∕𝛿,
T, or both. The quantity E∕𝛿 is the so-called reduced electric field, where 𝛿 is the reduction of air density
in comparison to the sea level, room temperature value, defined precisely as 𝛿= 𝜌m(h,T)∕𝜌m(h = 0km,T =
300K); h here corresponds to the altitude above mean sea level. Figure 2 shows all LTE plasma coefficients
used: (a) 𝜌m, (b) cp, (c) 𝜌mcp, (d) 𝜅T , (e) 𝜎LTE, and (f) 𝜖. The LTE parameters are, by definition, only function
of temperature. Note that the assumption of isobaric heating combined with the ideal gas law would lead to
a dependence 𝜌m ∝ 1∕T between mass density and temperature. This trend is shown in Figures 2a and 2c
as a red dashed line. However, in the present work, we use the full equilibrium calculations given by Boulos
et al. (1994), shown as blue solid lines in the figure.
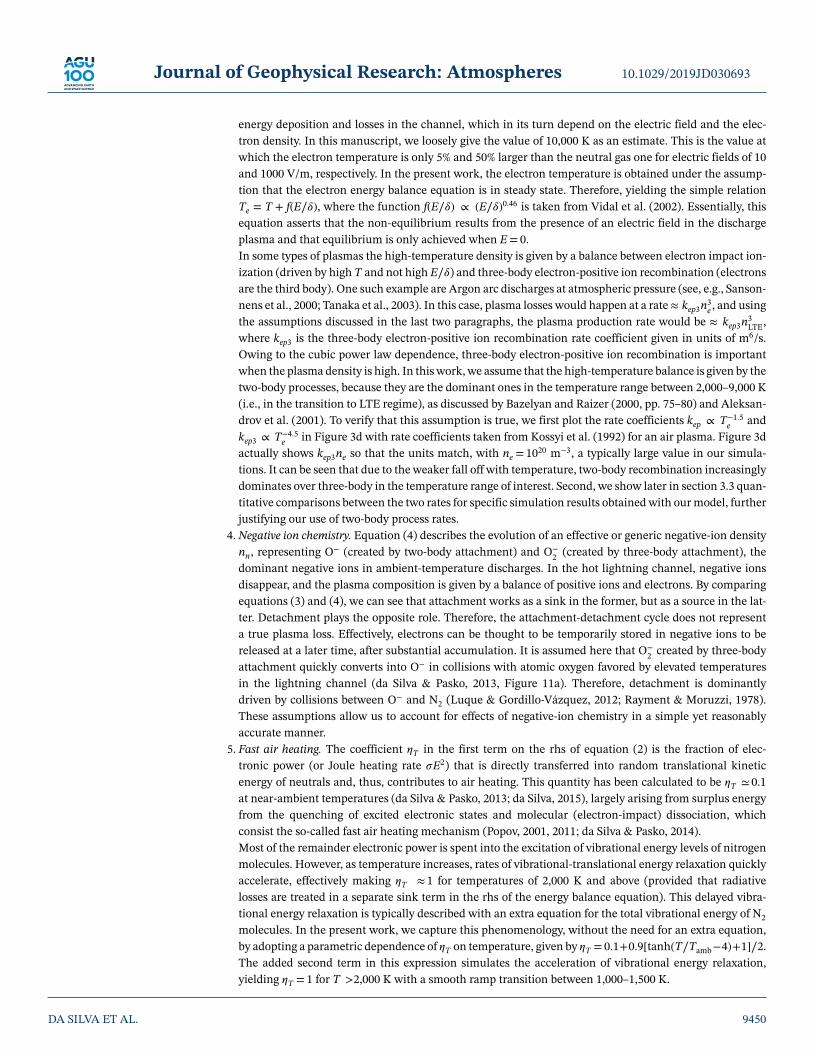
Figure 3 shows the field-dependent coefficients: (a) 𝜇e, (b) effective frequencies of electron production and
loss processes, (c, d) recombination coefficients, and (e, f) Da. The conventional breakdown threshold is
defined by the equality between electron-impact ionization (𝜈i) and two-body attachment (𝜈a2) in Figure 3b.
For the coefficients used here its numerical value is Ek∕𝛿 = 28.4 kV/cm. Figures 3c and 3d show both
the electron-positive ion (kep) and negative-positive ion (knp) recombination coefficients, as a function of
the reduced electric field and temperature, respectively. Similarly, Figures 3e and 3f show the ambipolar
diffusion as a function of electric field and temperature, respectively.
The coefficients have been obtained from the following references: 𝜌m, cp, and 𝜅T (Boulos et al., 1994); 𝜎LTE(Boulos et al., 1994; Yos, 1963); 𝜖 (Naghizadeh-Kashani et al., 2002); 𝜇e (Cho & Rycroft, 1998); 𝜈i and 𝜈a2
(Benilov & Naidis, 2003); 𝜈a3 (Morrow & Lowke, 1997); 𝜈d (Luque & Gordillo-Vázquez, 2012); kep and knp(Kossyi et al., 1992); andDa is defined by theEinstein relation (Raizer, 1991, p. 20). Both kep andDa effectively
depend on the electron temperature Te. The expression for Te(E∕𝛿,T) is taken from Vidal et al. (2002). The
rate coefficients are given for an air composition of 80% N2 and 20% O2. All rate coefficients used in this
manuscript have been summarized in the form of two Matlab functions and made publicly available online
(da Silva, 2019a).
2.2. Key Assumptions
1. Externally driven electrical current. A key assumption of the model is that the electrical current is gener-
ated by the overall lightning discharge electrodynamics and merely imposed to the channel cross section
of interest. This allows one to calculate the channel properties for a given constant or pulsed current
waveform. Here we use two types of waveforms: a constant current (in sections 3.1 and 3.2) and a
four-parameter pulsed current waveform (in sections 3.3 and 3.4). The pulsed current waveform quali-
tatively captures most impulsive processes taking place in the lightning channel, and it is given by the
following mathematical expression:
I(t) =
{Ip t∕𝜏r if t ≤ 𝜏r
(Ip − Icc) exp(−t∕𝜏f ) + Icc if t > 𝜏r(7)
DA SILVA ET AL. 9447

Journal of Geophysical Research: Atmospheres 10.1029/2019JD030693
Figure 3. Electric-field-dependent coefficients used in this investigation. (a) Electron mobility 𝜇e. (b) Effective frequencies of electron production and lossprocesses 𝜈i, 𝜈a2, 𝜈a3, and 𝜈d, from equation (3). (c, d) Recombination coefficients kep and knp. (e, f) Ambipolar diffusion coefficient Da. Panel (c) shows therecombination coefficients as a function of E∕𝛿 for two different temperature values. Contrastingly, panel (d) shows the same coefficients as a function of T fortwo values of E∕𝛿. The same strategy is used to display Da in panels (e) and (f). Panel (d) also shows the rate coefficient for three-body electron-positive-ionrecombination (electrons are the third body), or more precisely kep3ne, with ne =10
20 m−3. This process is not included in the model, and the coefficient is justshown for comparison with the two-body rate. Expressions for the rate coefficients shown in this figure are given by da Silva and Pasko (2013); see text forreferences.
The four parameters in the waveform are peak current Ip, rise time 𝜏r, fall time 𝜏 f, and continuing current
Icc. These four parameters can be adjusted to represent a first or subsequent return stroke with or without
continuing current. They can also be adjusted to allow the model to simulate the surge current injected
in the leader channel following the stepping process (see, e.g., Winn et al., 2011), a dart leader reioniza-
tion wave, or ICC pulses happening during the initial continuous current (ICC) stage of a rocket-triggered
lightning flash. A schematical representation of this waveform is given in Figure 1b. It should be noted
that several different analytical functions have been used to simulate the current waveform propagating
through the lightning channel, such as theHeidler function (Heidler, 1985; Rakov&Uman, 1998), the dou-
ble exponential (Bruce & Golde, 1941), or the asymmetric Gaussian (e.g., da Silva et al., 2016). The model
DA SILVA ET AL. 9448

Journal of Geophysical Research: Atmospheres 10.1029/2019JD030693
can handle any of them as input; equation (7) is chosen for its simplicity and to facilitate the comparison
with the work of Plooster (1971) and Paxton et al. (1986) in section 3.3 below.
The overall strategy of prescribing I(t) and calculating the channel properties has been success-
fully employed by a number of researchers to investigate the dynamics of streamer-to-leader and
streamer-to-spark transition (Aleksandrov et al., 2001; da Silva & Pasko, 2012; Gallimberti et al., 2002;
Popov, 2003) and to simulate the channel decay following a return stroke (Aleksandrov et al., 2000; Hill,
1971; Paxton et al., 1986; Plooster, 1971). Although insightful, this strategy does not reveal the full lightning
electrodynamics, because changes in the plasma conductivity should feedback into how much current is
flowing in the channel. However, the approach used here allows us to provide a detailed characterization
of the plasma-channel nonlinear resistance R(t) for a given current I(t). This manuscript should be seen
as an initial effort toward quantifying the effects of the nonlinear plasma resistance into the overall elec-
trodynamics of lightning leaders. Future investigations can leverage this model by replacing equation (1)
with lumped or distributed circuit equations that describe the lightning discharge tree.
2. Averaged radial dynamics. The radial profile of temperature is assumed to follow a step function so that
T(r)=T for r ≤ rg and T(r)=Tamb for r > rg. The radial expansion is given by an increase of rg at a rate
given by equation (6). It is assumed here that the expansion rate is determined by thermal conduction
or, in other words, the radial temperature profile follows the equation 𝜕T∕𝜕t= k∇2T, where k= 𝜅T∕𝜌mcp.
The solution for this equation under a delta function initial condition is T(r, t)= exp(−r2∕4kt)∕√4𝜋kt. The
solution is a Gaussian function with half-width rg =√4kt. Taking the time derivative of this expression,
one obtains the expansion rate of the thermal radius in equation (6).
The second term in the right-hand side (rhs) of equation (2) is the spatially averaged Laplacian of temper-
ature, that is, the rhs of the heat conduction equation. The method for evaluating that term is illustrated
in Figure 1c. It is assumed that the thermal conduction-driven expansion conserves the area under the
curve in Figure 1c, or the quantity A= (T − Tamb)𝜋r2g . Therefore, 𝜕T∕𝜕t|
thermalconduction
is determined from set-
ting 𝜕A∕𝜕t=0. This is a rather robust assumption since it is virtually equivalent to enforcing energy
conservation. However, in reality, the shape of the profile is not preserved as assumed here.
Similar results are obtained by assuming that the plasma distribution expands with ambipolar diffusion,
leading to the expansion rate given in equation (5). In this case, the conserved quantity is A=ne𝜋r2c ,
or simply the number of electrons per unit channel length. Conservation of A in this case is equivalent
to conservation of mass. This analysis also yields a radially averaged ambipolar diffusion sink term in
equation (3). However, this loss process is negligible in comparison to chemically driven losses and, there-
fore, it is not included in equation (3). Our considerations here are similar to Braginskii's (1958), where
the plasma channel boundary is assumed to behave as a moving piston that “snowplows” the ambient gas.
Both models yield a channel radius expansion as rc ∝√t, but Braginskii's expansion rate is not deter-
mined by ambipolar diffusion. In a comparison between several semiempirical models of the lightning
return stroke resistance, De Conti et al. (2008) concluded that the model accounting for channel expan-
sion rc ∝√t effects in the resistance yielded the most robust return stroke radiated electromagnetic field
signatures.
3. Thermal ionization rate. At temperatures of several thousand Kelvin, the plasma-channel composition is
roughly made of equal parts electrons and NO+ ions (Aleksandrov et al., 1997; da Silva & Pasko, 2013;
Popov, 2003). The NO+ ions are formed by associative ionization of N andO atoms at a rate F = kassocnOnN.
The plasmadensity is dictated by a balance between associative ionization and electron-positive ion recom-
bination, that is, by F = kepnenNO+ ≈ kepn2e. Without knowing the precise rate F, we know that at high
temperatures this equation should yield the LTE conductivity given in Figure 2e, or the corresponding elec-
tron density nLTE = 𝜎LTE∕e𝜇e. This can be achieved by setting the rate of thermal (associative) ionization
to be equal to F = kepn2LTE
, as done in equation (3).
Therefore, equation (3) is designed to essentially have two different modes of operation. At low
(near-ambient) temperatures, the plasma population balance is driven by electron-impact ionization,
attachment, and detachment, that is, the typical chemistry considered in the streamer breakdown of short
air gaps (da Silva & Pasko, 2013; Flitti & Pancheshnyi, 2009; Liu & Pasko, 2004; Naidis, 2005; Pancheshnyi
et al., 2005). However, at high temperatures (≳10,000 K) the equation yields the LTE conductivity 𝜎LTE(T),
in alignment with the typical approach used for the simulation of free-burning arcs (Chemartin et al.,
2009; Lowke et al., 1992) or used in gas-dynamic return stroke simulations (Aleksandrov et al., 2000;
Paxton et al., 1986; Plooster, 1971). It is not possible to state exactly what is the minimum temperature at
which the assumption of LTE regime yields accurate calculations. Both T and Te depend on the history of
DA SILVA ET AL. 9449
Journal of Geophysical Research: Atmospheres 10.1029/2019JD030693
energy deposition and losses in the channel, which in its turn depend on the electric field and the elec-
tron density. In this manuscript, we loosely give the value of 10,000 K as an estimate. This is the value at
which the electron temperature is only 5% and 50% larger than the neutral gas one for electric fields of 10
and 1000 V/m, respectively. In the present work, the electron temperature is obtained under the assump-
tion that the electron energy balance equation is in steady state. Therefore, yielding the simple relation
Te = T + f(E∕𝛿), where the function f(E∕𝛿) ∝ (E∕𝛿)0.46 is taken from Vidal et al. (2002). Essentially, this
equation asserts that the non-equilibrium results from the presence of an electric field in the discharge
plasma and that equilibrium is only achieved when E=0.
In some types of plasmas the high-temperature density is given by a balance between electron impact ion-
ization (driven by high T and not high E∕𝛿) and three-body electron-positive ion recombination (electrons
are the third body). One such example are Argon arc discharges at atmospheric pressure (see, e.g., Sanson-
nens et al., 2000; Tanaka et al., 2003). In this case, plasma losses would happen at a rate≈ kep3n3e , and using
the assumptions discussed in the last two paragraphs, the plasma production rate would be ≈ kep3n3LTE
,
where kep3 is the three-body electron-positive ion recombination rate coefficient given in units of m6/s.
Owing to the cubic power law dependence, three-body electron-positive ion recombination is important
when the plasma density is high. In this work, we assume that the high-temperature balance is given by the
two-body processes, because they are the dominant ones in the temperature range between 2,000–9,000 K
(i.e., in the transition to LTE regime), as discussed by Bazelyan and Raizer (2000, pp. 75–80) and Aleksan-
drov et al. (2001). To verify that this assumption is true, we first plot the rate coefficients kep ∝ T−1.5e
and
kep3 ∝ T−4.5e in Figure 3d with rate coefficients taken from Kossyi et al. (1992) for an air plasma. Figure 3d
actually shows kep3ne so that the units match, with ne =1020 m−3, a typically large value in our simula-
tions. It can be seen that due to the weaker fall off with temperature, two-body recombination increasingly
dominates over three-body in the temperature range of interest. Second, we show later in section 3.3 quan-
titative comparisons between the two rates for specific simulation results obtainedwith ourmodel, further
justifying our use of two-body process rates.
4. Negative ion chemistry. Equation (4) describes the evolution of an effective or generic negative-ion density
nn, representing O− (created by two-body attachment) and O−
2(created by three-body attachment), the
dominant negative ions in ambient-temperature discharges. In the hot lightning channel, negative ions
disappear, and the plasma composition is given by a balance of positive ions and electrons. By comparing
equations (3) and (4), we can see that attachment works as a sink in the former, but as a source in the lat-
ter. Detachment plays the opposite role. Therefore, the attachment-detachment cycle does not represent
a true plasma loss. Effectively, electrons can be thought to be temporarily stored in negative ions to be
released at a later time, after substantial accumulation. It is assumed here that O−2created by three-body
attachment quickly converts into O− in collisions with atomic oxygen favored by elevated temperatures
in the lightning channel (da Silva & Pasko, 2013, Figure 11a). Therefore, detachment is dominantly
driven by collisions between O− and N2 (Luque & Gordillo-Vázquez, 2012; Rayment & Moruzzi, 1978).
These assumptions allow us to account for effects of negative-ion chemistry in a simple yet reasonably
accurate manner.
5. Fast air heating. The coefficient 𝜂T in the first term on the rhs of equation (2) is the fraction of elec-
tronic power (or Joule heating rate 𝜎E2) that is directly transferred into random translational kinetic
energy of neutrals and, thus, contributes to air heating. This quantity has been calculated to be 𝜂T ≃ 0.1
at near-ambient temperatures (da Silva & Pasko, 2013; da Silva, 2015), largely arising from surplus energy
from the quenching of excited electronic states and molecular (electron-impact) dissociation, which
consist the so-called fast air heating mechanism (Popov, 2001, 2011; da Silva & Pasko, 2014).
Most of the remainder electronic power is spent into the excitation of vibrational energy levels of nitrogen
molecules. However, as temperature increases, rates of vibrational-translational energy relaxation quickly
accelerate, effectively making 𝜂T ≈ 1 for temperatures of 2,000 K and above (provided that radiative
losses are treated in a separate sink term in the rhs of the energy balance equation). This delayed vibra-
tional energy relaxation is typically described with an extra equation for the total vibrational energy of N2
molecules. In the present work, we capture this phenomenology, without the need for an extra equation,
by adopting a parametric dependence of 𝜂T on temperature, given by 𝜂T = 0.1+0.9[tanh(T∕Tamb−4)+1]∕2.
The added second term in this expression simulates the acceleration of vibrational energy relaxation,
yielding 𝜂T =1 for T >2,000 K with a smooth ramp transition between 1,000–1,500 K.
DA SILVA ET AL. 9450

Journal of Geophysical Research: Atmospheres 10.1029/2019JD030693
3. Results and Discussion3.1. Streamer-to-Leader Transition
The most fundamental step in the formation of a lightning channel is the streamer-to-leader transition.
Streamers are the precursor stage. They are thin filamentary discharge channels that propagate as a non-
linear electron-impact ionization wave, self-enhancing the electric field at its tips. Their conductivity is of
the order of 0.1–1 S/m. They require electric fields higher than 17% of the conventional breakdown thresh-
old for stable propagation. Streamer lifetimes are rather short, approximately tens of microseconds, limited
by attachment to oxygen molecules. Leaders are a necessity for the breakdown of air gaps longer than one
meter (Bazelyan&Raizer, 2000, p. 59). It takes severalmilliseconds for a leader to come from the cloud to the
ground. The only way to keep the leader channel conductive for so long is by substantially heating the air. In
the hot air plasma, attachment loses its importance; instead, the electron density decays via electron-positive
ion recombination, which is substantially slower. The transition between streamer and leader happens in
a region in space called stem, a converging point where several streamers in a streamer corona are rooted.
In this region the small current carried by individual streamers can add up to values ≳1 A to produce air
heating and create a leader channel.
da Silva and Pasko (2013) developed a first-principles model to investigate the dynamics of streamer-to-
leader transition. It consists of four main blocks: (1) a set of fully nonlinear gas-dynamic equations that
described the heating and radial expansion of the neutral gas; (2) a detailed kinetic scheme accounting for
the most important processes in an air discharge plasma; (3) energy exchange between charged and neu-
tral particles accounting for the partitioning of electronic power between elastic collisions, and excitation
of vibrational and electronic states; and (4) delayed vibrational energy relaxation of nitrogen molecules. da
Silva and Pasko's (2013) model was validated against streamer-to-spark transition time scales measured in
centimeter-long laboratory discharges (Cernák et al., 1995; Larsson, 1998). That model was also applied to
simulation of leader speeds at reduced air densities and for interpretation of the phenomenology of gigan-
tic jets (da Silva & Pasko, 2012), as well as to study the mechanism of infrasound emissions in sprites
(da Silva & Pasko, 2014). Figure 4a shows, as discontinuous traces, the air heating rate calculated with da
Silva and Pasko's (2013) model with an assumed Gaussian initial distribution of electron density in the
streamer channel. The peak ne value is 2 ×10²⁰ m−3 and the e-folding spatial scale is rc = 0.3, 0.5, and 1
mm, respectively. The streamer-to-leader transition time scale 𝜏h is defined as the time required to heat the
channel up to 2000 K; the heating rate shown in the figure is simply 1∕𝜏h. The 2000-K threshold is chosen
because when the channel reaches this temperature level a thermal-ionizational plasma instability is trig-
gered: vibrational relaxation is accelerated, temperature raises very sharply, N + O associative ionization
starts to take place, and transition to leader mode is unavoidable.
The present work's goal is to propose the minimal physical model to describe the dynamics of the leader
plasma. As discussed in section 2.2, the model uses a simplified plasma chemistry and parameterized radial
dynamics. As a means of validation, in Figure 4 we compare the present model with the simulations of
da Silva and Pasko (2013). Figure 4a uses the same initial conditions as the previous work and an ini-
tial current-carrying radius rc =0.5 mm. The figure shows order-of-magnitude agreement between the two
models. However, there is an inherently different slope between the two curves, attributed to the multiple
parameterizations and simplifications introduced in this paper. The other three panels in the figure show
the effects of the initial conditions in the air heating rate: ne (b), rc (c), and rg (d). The current-carrying
radius is the parameter that has the largest influence on the heating rate (Figure 4c). The thermal radius rghas no effect on the heating rate at all (Figure 4d), because this quantity is exclusively related to the cooling
rate of the channel (see equation (2)), which is negligible in submicrosecond time scales. The dependence
on initial electron density is slightly more complicated. The heating rate is ∝ ∫ 𝜏h
0𝜎E2dt which, according
to equation (1) is also ∝ ∫ 𝜏h
0I2∕nedt. The inverse 1∕ne dependence can be qualitatively seen when com-
paring the 1020- and 1022-m−3 cases. But reducing the initial electron density tends to increase the electric
field according to Ohm's law. If the electric field goes beyond Ek, ionization increases ne until the field drops
down to the Ek level. This self-regulatory mechanism imposes a maximum heating rate given by the 1018-
to 1020-m−3 curves in Figure 4b.
For the sake of comparison, we have repeated the calculations shown here with a full LTE version of the
model. This is done by replacing equations (3) an (4) with 𝜎 = 𝜎LTE and by setting 𝜂T =1. The calculated
air heating rate is in the range of 1012–1015 s−1 for currents between 1 and 100 A. They are not shown in
Figure 4 because they lie completely outside of the vertical-axis limits. This result indicates that a full-LTE
DA SILVA ET AL. 9451

Journal of Geophysical Research: Atmospheres 10.1029/2019JD030693
Figure 4. Calculated heating rate (1∕𝜏h) leading to the conversion of a streamer into a leader channel. The title in thefour panels list the initial conditions for electron density ne (ne in the figure), current-carrying radius rc (rc), andthermal radius rg (rg) used in the simulations. The ambient neutral temperature is 300 K, and there are no negativeions initially. Panel (a) shows as discontinuous traces the calculation of da Silva and Pasko (2013) for the same initialconditions, but three different values of rc. The gray shaded area delimiting the calculations of da Silva and Pasko(2013) is repeated in all four panels for comparison. Panels (b)–(d) emphasize the effect of changing the initialconditions for ne (b), rc (c), and rg (d).
model completely overestimates the air heating rate, and cannot capture the finite streamer-to-leader (or
to-spark) transition time scale, well known from laboratory studies to be a fraction of 1 μs (Cernák et al.,
1995; Larsson, 1998). The reason for the unreasonably high air heating rate of a full-LTE model lies in the
fact that the LTE conductivity at 300 K is substantially lower than the typical conductivity in a streamer
channel (see Figure 2e). Since conductivity is lower, the resistance per unit length R is larger, and so is the
Joule heating rate RI2, which is the same argument presented when discussing Figure 4b.
In summary, the present model compares very well to a first-principles theoretical simulation that has been
validated with spark data from laboratory discharges. The proposed computer-simulation tool is able to
account for the finite time scale of streamer-to-leader transition, something that a full-LTE model cannot.
The following input parameters are used as initial conditions in all simulations below, unless otherwise
noted: ne =1020 m−3, rc =0.5 mm, rg =5 mm, nn =0, T=300 K.
DA SILVA ET AL. 9452

Journal of Geophysical Research: Atmospheres 10.1029/2019JD030693
Figure 5. (a) Temporal dynamics of resistance in a discharge channel for several current values. Solid and dashed linesshow the contrast between full model versus suppressed channel expansion, respectively. The figure also shows thedata by Tanaka et al. (2000) as a solid black line, with the gray shaded area marking ±50% variability. (b–d) Resistancevalue at 10 ms as a function of current. Panel (b) also shows the data from Tanaka et al. (2000) at 10 ms (square with±50% error bar), as well as, the steady-state arc resistance measured by King (1961) (black solid line with ±50% grayshaded band). Panels (b)–(d) emphasize the effect of changing the initial conditions for ne (b), rc (c), and rg (d), withthe initial conditions being listed in the panel titles and legends. The gray shaded band marking the results from King(1961) are repeated in panels (b-d) for comparison with our simulations.
3.2. Steady-State Negative Differential Resistance
The behavior of the steady-state resistance of arc channels has been used to discuss the phenomenology
of lightning channels (Hare et al., 2019; Heckman, 1992; Krehbiel et al., 1979; Mazur & Ruhnke, 2014;
Williams, 2006; Williams & Heckman, 2012; Williams & Montanyà, 2019). Steady-state plasma arcs exhibit
the so-called negative differential resistance, that is, the resistance decreases with increasing electrical cur-
rent. Such behavior is reproduced in our simulations and shown in Figure 5. Figure 5a shows the temporal
evolution of resistance in the discharge channel for several values of electrical current between 1 A and
10 kA. It is easy to see that, owing to channel expansion, there is no true steady-state resistance. A con-
stant value for the steady-state resistance can only be obtained if channel expansion is suppressed (compare
the solid and dashed lines). At low currents (see the 1-A curve), one can start to see the channel recovery
DA SILVA ET AL. 9453

Journal of Geophysical Research: Atmospheres 10.1029/2019JD030693
Table 1Fit Parameters for the Resistance per Unit Channel Length Formula R=A∕Ib
Reference Current range (A) Time scale (s) A (Ω Ab/m) b Mean fit error (%)
This Work 100–104 10−2 4.27×10³ 1.18 35
This Work 100–104 1 4.81×10³ 1.37 74
This Work: Region I 100–101 10−2 1.24×10⁴ 1.84 9
This Work: Region II 101–103 10−2 2.82×10³ 1.16 4
This Work: Region III 103–104 10−2 0.18×10³ 0.75 1
King (1961) 100–104 — 2.87×10³ 1.16 25
Bazelyan and Raizer (1998) — — 3×10⁴ 2 —
starting as early as 0.1 ms. The recovery in this case is due to the fact that the channel cools down to a suffi-
cient level that three-body attachment becomes important, accelerating the rate of plasma density depletion.
For currents higher than 10 A, the resistance is still decreasing at the 0.1 s mark; in some cases after a partial
recovery. In Figure 5a we also show data fromTanaka et al. (2000) used by Chemartin et al. (2009) to validate
their 3-D free burning arc simulations. Tanaka et al. (2000) report on 1.6-m-long arcs with 100-A current.
Theirmeasurements are shown in Figure 17 of Chemartin et al. (2009).We obtain a good agreement between
our simulations and the measurements despite the fact that the 3-D tortuous nature of the arc channel is
neglected in the present work.
For the purpose of evaluating the negative differential resistance behavior predicted by our simulations, we
evaluate the resistance (per unit length) at 10ms for several different values of electrical current. The results
are shown in Figure 5b alongside measurements from King (1961). We chose to compare our simulations to
King'smeasurements because this work has been featured in a number ofmanuscripts in lightning-research
literature (e.g., Heckman, 1992; Mazur & Ruhnke, 2014; Williams, 2006; Williams & Heckman, 2012). The
data from King (1961) is shown as a black solid line with a ±50% variability gray shaded band. The gray
band is repeated in panels (b)–(d) for comparison with our simulations. The time instant of 10 ms is chosen
because it is when the time-dependent data from Tanaka et al. (2000) (shown as a square with ±50% error
bar) best aligns with King's curve. Our calculations in Figure 5a show good agreement with King's curve;
the average difference between the two is 40%. Figures 5b–5d show the effects of the initial conditions in the
steady-state resistance: ne (b), rc (c), and rg (d). It can be seen that changes in the initial conditions have very
little impact on the resistance in the 10-ms time scale. It is as if the channel “forgets” the initial conditions
(Aleksandrov et al., 2001). Given the uncertainty in determining the initial conditions of the channel, this
result lends robustness to the resistance calculations shown hereafter. However, in shorter time scales the
resistance R does depend on the initial conditions. Similarly to the discussion in section 3.1, the dependence
onne and rg isweak, but the dependence on rc can bemore noticeable. The dependence on the initial channel
radius becomes weaker and weaker at higher currents. As an example, at the 10-μs mark, we find that the
ratio R(rc=2mm)/R(rc=0.5mm) is of the order of 700 for a constant current of 10 A. The same ratio is only
0.63 for a current of 1,000 A.
The dependence of the resistance on electrical current can be approximated by the analytical formula
R=A∕Ib, whereA and b are positive constants. It is easy to see that with this dependence dR∕dI < 0 always,
in accordance with the terminology “negative differential resistance.” The limiting case b=1 corresponds
to a constant steady-state electric field inside the channel (with numerical value equal to A). We have eval-
uated the fit parameters that best match our model for the standard set of initial conditions (shown in the
title of Figure 5a). The results are shown in Table 1 alongside the fit parameters for the King's curve and also
values given by Bazelyan and Raizer (1998). It can be seen that the exponent b that best fits both the present
work and King (1961) are very close to each other (b=1.16–1.18). The empirical trend given by Bazelyan
and Raizer (1998) has a substantially steeper slope (b=2). If we run the simulation for a longer time, up to
1 s, the power law index increases from 1.18 to 1.37 (see second row in Table 1). However, the mean fit error
doubles indicating that the curve deviates further from the power law approximation.
It can be seen from Table 1 that fitting the power law dependence to a four-decade current range produces
errors of 35–74%. A better fit can be produced by braking down the current range in three regions: (I) 100–101
A, (II) 101–103 A, and (III) 103–104 A. The three regions are marked in Figure 5c. It can be seen in Table 1
DA SILVA ET AL. 9454

Journal of Geophysical Research: Atmospheres 10.1029/2019JD030693
that the three regions have different power law indexes, progressively lower as current increases. Detailed
analysis of the temporal evolution of energy deposition in the channel reveals that the steady state is given by
different mechanisms in the three regions. In Region I the steady state is given by a balance of Joule heating
and heat conduction, that is, between the first and second terms in the right-hand side of equation (2).
Meanwhile, In Region III the steady state is given by a balance with radiative emission, that is, between
the first and third terms in the right-hand side of equation (2). Region II is marked by a comparable role
between the two loss processes; radiative emission is important in the submillisecond time scale, while heat
conduction is significant at later stages.
3.3. Energy Deposition in Return Strokes
The return stroke follows the attachment of lightning leader channels to ground structures. In the case of a
negative cloud-to-ground discharge, the return stroke effectively lowers several coulombs of negative charge
originally deposited along the downward propagating stepped leader. The high-current return stroke wave
(with typically tens of kiloamperes) rapidly heats the channel to peak temperatures of the order of 30,000
K, emitting intense optical radiation, and creating a channel expansion shock wave (that produces audible
thunder). According to Rakov and Uman (1998), models that describe the lightning return stroke can be
divided into four categories: gas-dynamic or physical, electromagnetic, distributed-circuit, and engineering
models. The basic set of equations described in this manuscript fits into the first category, where the cur-
rent flowing through the channel is an input parameter and all other channel properties can be calculated
from first principles. Some of the most well-accepted investigations within this framework are the papers
by Plooster (1971) and Paxton et al. (1986). These authors solve the hydrodynamic equations of motion for
atmospheric-pressure air in a Lagrangian frame of reference. A description of this simulation approach,
which shows contemporary versions of the pertinent equations, is given by Aleksandrov et al. (2000). The
model resolves the 1-D radial profiles of all state variables and captures the shock wave expansion as driven
by ohmic heating. The plasma is assumed to be in LTE and the conductivity is simply 𝜎 = 𝜎LTE(T). These
models also describe the radial transport of radiation, and primarily differ by its implementation and com-
prehensiveness. Plooster (1971) used a single temperature-independent opacity to obtain radiation loss and
absorption in each radial grid point, while Paxton et al. (1986) used a detailedmultigroup radiative transport
algorithm using a diffusion approximation. A detailed discussion on plasma radiative transport is given by
Ripoll et al. (2014a).
In Figure 6a we present a comparison between our model's results and the seminal works of Plooster (1971)
and Paxton et al. (1986). The current waveform has the qualitative shape depicted in Figure 1b, with a rise
time of 5 μs and a fall time of 50 μs (or simply written as 5/50 μs). The peak current is 20 kA, a typical value
for first return strokes, and no continuing current is incorporated. The current waveform is the same one
used in the two papers for the simulation case shown in Figure 8 of Paxton et al. (1986). We generate initial
conditions by starting the simulationwith the standard streamer-like channel parameters used in section 3.1
and running a constant 10-A current through the channel during 4 μs. This strategy ensures that the channel
has the properties of a leader discharge prior to the return stroke. These initial conditions are rc =1 mm, rg= 1 cm, ne = 9×10¹⁷ m−3, and T = 5000 K. Additionally, instead of using the value of 𝜌m(T = 5000K) for
the air mass density, the ambient value 𝜌m(T = 300K) = 0.7 kg/m3 is used. These initial conditions are very
similar to the ones used in the aforementioned references. Note that even a steady current as low as 10 A can
produce a leader with temperature of∼5,000 K. This value is within the estimate for the predart and postdart
leader channel temperatures provided by Rakov (1998), which are 3,000 K and 20,000 K, respectively. It
can be seen from Figure 6a that our model compares very well with simulation results of Plooster (1971),
predicting a peak temperature of 36,000 K. The mean difference between the two curves is 3%.
Both curves (Plooster's and ours) deviate from the results of Paxton et al. (1986). It can be seen fromFigure 6a
that a better agreement with Paxton et al. (1986) can be found by simply multiplying the radiative emis-
sion coefficient (last term in equation (2)) by a factor of 10. This fact can be better understood by looking
at the energy deposition in the return stroke channel, depicted in Figure 6b. The figure shows (in order)
the four terms in the energy equation (2): the internal energy is given by 𝜌mcpT𝜋r2c , the Joule heating by
∫ 𝜂T𝜎E2𝜋r2cdt, the thermal conduction by ∫
4𝜅Tr2g
(T − Tamb
)𝜋r2cdt, and the radiative emission by ∫ 4𝜋𝜖𝜋r2cdt.
It can be seen that the channel's temperature is dictated by a balance between Joule heating and cooling by
radiative emission. Therefore, simply increasing the rate of channel cooling by radiation can lower the peak
temperature and provide a better agreement with Paxton's results. As mentioned above, the models pre-
DA SILVA ET AL. 9455

Journal of Geophysical Research: Atmospheres 10.1029/2019JD030693
Figure 6. (a) Evolution of temperature in a 20-kA return stroke channel: comparison between the present investigation and established results (Paxton et al.,1986; Plooster, 1971). (b) Energy deposition in the return stroke channel. The four lines, in the order listed in the figure legend, correspond to the four terms inthe energy balance equation (2). Panel (c) is a zoom-in into the gray shaded rectangle in panel (b). Panels (d)–(f) show the radius, resistance per unit length,and rates of electron-positive ion recombination, respectively. Panel (f) justifies a posteriori neglecting the three-body process in equation (3).
sented by Plooster (1971) and Paxton et al. (1986) are essentially the same and only differ by the treatment
of radiative emission, lending further credence to the idea that peak temperatures are dictated by radiative
emission.
An important conclusion to be drawn here is that the effective representation of the radiative emission
through a net emission coefficient (𝜖 in Figure 2f) produces a proper description of the channel temperature
dynamics, especially because all four curves in Figure 6a have similar qualitative shape and rate of cooling
after the peak. Moreover, at 35 μs the total deposited energy in our simulations of 5.6 kJ/m compares well
to the estimates of 2 and 3.8 kJ/m by Plooster (1971) and Paxton et al. (1986), respectively (see also Rakov &
Uman, 1998, Table I). The state of the art in lightning spectroscopy is the recent investigations byWalker and
Christian (2017, 2019). From the ratio of several atomic spectral lines recordedwith 1-μs temporal resolution,
these authors report peak temperatures ranging between 32 and 42 kK for five rocket-triggered lightning
strikes with peak currents varying between 8.1 and 17.3 kA (Walker & Christian, 2019, Figure 4). There is
not a clear linear correlation between peak current and peak temperature in their dataset and the average
peak temperature between the five strikes is≈ 36±4 kK. Remarkably, our work and Plooster's do a better job
reproducing the measured peak temperatures than Paxton's. Further work is required to explain the highest
value registered by Walker and Christian (2019), in excess of 42,000 K.
DA SILVA ET AL. 9456

Journal of Geophysical Research: Atmospheres 10.1029/2019JD030693
Figure 6d shows the channel radius as a function of time. We have verified that the proposed averaged
radial dynamics qualitatively captures the radial expansion and also provides order-of-magnitude quantita-
tive agreement with previous investigations alike (Braginskii, 1958; Koshak et al., 2015; Plooster, 1971). All
of these models (including ours) predict an initial rapid channel expansion rate, leveling off when the chan-
nel is cooling down. During the initial return stroke stage (0.5–5 μs), our calculated radius is 8–42% smaller
than the results obtained by Braginskii (1958) and Plooster (1971), shown in Table II of Plooster (1971).
Koshak et al. (2015) improved on the channel radial expansion rate derived by Braginskii (1958) and found a
good agreement with Plooster (1971) at the 35-μs mark. Both investigations yielded a 1.5-cm radius at 35 μs,
while our simulations yielded a value 57% lower. Generally, the results are in good agreement with previous
investigations. However, it should be noted that our peak channel expansion rate is ∼500 m/s, which is a
factor of 4 lower than in Koshak et al. (2015).
Figure 6e presents the resistance (per unit length) as a function of time. It can be seen that the resistance
drops bymore than two orders ofmagnitudewhile the current is rising, illustrating hownegative differential
resistance works for a current changing over time. After that, while the current is decreasing exponentially
in time, the resistance achieves a stable value between 0.6–1 Ω/m. This leveling off is in agreement with
the trend seen in measurements (Jayakumar et al., 2006, Figure 4). Jayakumar et al. (2006) measured the
electrical current to ground and the vertical electric field in close vicinity to a series of rocket-triggered
lightning strikes in Florida. At the instant of peak power, these authors found resistance values between
0.67 and 31 Ω/m in eight different strikes. In our calculations, we obtain R=0.6 Ω/m, which is close to the
lowest resistance value in their dataset. This value is closer to the measurements than the early estimate
of 0.035 Ω/m by Rakov (1998). Additionally, Jayakumar et al. (2006) registered input electrical energies
between 0.9–6.4 kJ/m, also in range with our calculations.
Figure 6f shows the rates of electron-positive ion recombination. The figure shows a comparison between
the rate of two- and three-body recombination with coefficients taken from Kossyi et al. (1992). The
figure is included here to justify the model design assumptions discussed in section 2.2 (item #3). In
the regime studied here and with the rate coefficients for an air plasma available in the literature, the
three-body recombination rate is substantially slower than the two-body counterpart, justifying neglecting
it in equation (3).
3.4. Behavior of Light Emission in Return Strokes
The net emission coefficient 𝜖 describes the radiative emission in all bands of the optical spectrum, encom-
passing the infrared, visible, and ultraviolet (Naghizadeh-Kashani et al., 2002). Most of the radiation
escaping the plasma is in the vacuum ultraviolet range (wavelengths lower than 200 nm) and is caused by
atomic emissions. However, this band is not easily detected because the radiation is readily absorbed by
atmospheric-pressure air surrounding the plasma discharge (Cressault et al., 2015). Spectroscopic measure-
ments of rocket-triggered lightning strikes show characteristic line emissions associatedwith neutral, singly,
and doubly ionized nitrogen and oxygen, neutral argon, neutral hydrogen, and neutral copper (from the
triggering wire) and present no detected molecular emissions (Walker & Christian, 2017).
For the purposes of comparing our simulations with observations, we estimate the power (per unit channel
length) emitted in the visible range as 𝜂vis4𝜋𝜖𝜋r2c , where 𝜂vis is the fraction of optical radiation emitted in
the visible range (380–780 nm). We use a constant fraction 𝜂vis =3% for the sake of simplicity. In reality 𝜂visdepends on the radial distribution of the plasma temperature and the cumulative balance of emission and
absorption. Table 2 shows seven estimates of 𝜂vis based on different references and techniques. Perhaps the
most pertinent is estimate #2, which is calculated by taking the ratio of 𝜖vis in the visible range calculated
by Cressault et al. (2011, Figure 2) to 𝜖 in the total optical range calculated by (Naghizadeh-Kashani et al.,
2002, Figure 13) for an optically thin plasma. This strategy places 𝜂vis between 0.1% and 10% in the tempera-
ture range between 3,000 and 30,000 K. Within this range, we adopt the value of 3% because it yields a good
agreement with experimental data from Quick and Krider (2017) discussed below.
Figure 7 shows properties of return stroke light emission and comparison to rocket-triggered lightning data
collected by Quick &Krider (2017, Figures 15 and 16). From a 200-m distance to the lightning striking point,
Quick and Krider (2017) recorded the luminosity of a 62-m-long channel segment near the ground. The
radiometers used had an approximately flat spectral response in the 400- to 1,000-nm range. Figure 7a shows
the simulated temporal dynamics of visible power and electrical current in the channel, for conditions that
resemble the aforementioned observations. The waveform is 0.5/50 μs with a 12-kA peak current, similar to
DA SILVA ET AL. 9457

Journal of Geophysical Research: Atmospheres 10.1029/2019JD030693
Table 2Fraction of Optical Power Radiated in the Visible Range by an Air Plasma
# Estimation method and reference 𝜂vis (%)
1 Black-body spectral radiance (Siegel, 2001, p. 22) (3,000–30,000 K) 5.3–49
2 Visible 𝜖vis calculated by Cressault et al. (2011) (3,000–30,000 K) 0.1–10
3 Visible radiance calculated by Cressault et al. (2015) (8,000–30,000 K) 0.2–0.6
4 20-kJ/m hot air shock (Ripoll et al., 2014a, Figure 9 and section 3.1 ) 14.3
5 Several simulations in Table 1 of Ripoll et al. (2014a) 4–30
6 Section 4.2 of Ripoll et al. (2014a) 5.3–21.7
7 A 12-kA discharge (Ripoll et al., 2014b, Figures 9b and 10b) 30
Empirical (this work) 3
the median case in the data set (Quick & Krider, 2017, Table 1). Figure 7b shows the first 3 μs of light emis-
sion, evidencing a 0.1-μs delay between the rise of current and optical emissions in the channel. Figure 7c
shows the effects of increasing peak current, which lead to higher emitted power and longer duration of the
light emission.
The delay shown in Figure 7b is evaluated at the 20% of peak level. The 0.1-μs value is in excellent agreement
with experimental results by Carvalho et al. (2014, 2015) and Quick and Krider (2017) who found delays of
Figure 7. (a) Temporal evolution of power per unit channel length emitted by a return stroke in the visible range (left-hand side axis) and electrical current(right-hand side). Panel (b) is a zoom-in into the gray shaded rectangle in panel (a). (c) Visible power emitted for several different peak current values.(d) Visible peak power versus peak current for four different current waveforms. (e) Energy emitted in the visible range versus charge transferred to the ground(the integration time is 2 ms). Panels (d) and (e) show a comparison with the experimental data from Quick and Krider (2017). The big crosses indicate theaverage ± standard deviation in the dataset. The data were collected during a study conducted by the University of Arizona at the International Center forLightning Research and Testing, in Camp Blanding, FL, in 2012.
DA SILVA ET AL. 9458

Journal of Geophysical Research: Atmospheres 10.1029/2019JD030693
0.09 ± 0.05 and 0.09 ± 0.06 μs, respectively. Differently than Quick and Krider (2017), Carvalho et al. (2014)
recorded luminosity from a 3-m-long channel segment near the ground. From such a short segment, the
luminosity rise time is not masked by the geometrical growth of the return stroke in the field of view. The
fact that both experimental investigations observing different channel lengths (62 and 3 m) yielded similar
results lends robustness to the ∼0.1 μs measured delay. Furthermore, analysis of different types of pulses
occurring in the return stroke channel (Zhou et al., 2014) and of several channel segments at different heights
(Carvalho et al., 2015) have led to the general conclusion that current and luminosity have similar rise times
and the delay between the twohas the same order ofmagnitude as such time scales.More precisely, Carvalho
et al. (2015) found that the delay is approximately linearly dependent on the current rise time according to
the following fit formula: delay= 0.35 𝜏1.03rise
, where 𝜏rise is the 10–90% current rise time given inmicroseconds.
The fit comprises rise times between ∼0.1 μs (for return strokes) and ∼100 μs (for M components). Using
this formula, we obtain a delay of 0.14 μs for the simulation shown in Figure 7b, once more indicating good
agreement between simulation and measurements.
In our simulations the delay between the rise of current and optical emissions highlighted in Figure 7b has
a clear interpretation. It is attributed to the finite time scale of channel heating and expansion. Since the
initial channel temperature for the simulations shown in this section is 5000 K, non-LTE effects play aminor
role here. From equations (1) and (2), the air heating rate thus is 𝜕T∕𝜕t ≃ (I2∕𝜎LTE𝜋2r4c − 4𝜋𝜖)∕𝜌mcp. What
determines the finite 0.1-μs delay, in a return stroke with 0.5-μs rise time, are the coefficients 𝜌m, cp, 𝜎LTE,
and 𝜖, as well as the channel expansion rc(t). A comparison with a full-LTE version of the simulation code
yielded a similar time delay between current and optical emissions, but the full-LTE model overestimated
the peak optical power by a factor of 3–4.
Figures 7d and 7e show the peak visible power versus peak current and total energy versus charge, respec-
tively. The integration time for the charge and energy is 2 ms. The figures show simulations for different
current waveforms and comparison with light emitted by rocket-triggered lightning. The data correspond
to optical irradiance from 55 rocket-triggered lightning strikes (with currents and charges ranging between
3–20 kA and 0.3–3 C, respectively) observed in Florida by Quick and Krider (2017) in 2012. The irradi-
ance data is converted to power per unit channel length according to equation (2) in the original reference.
The simulations use the same initial conditions as in Figure 6, and the results indicate a direct relationship
between current and power and between total energy and charge. Additionally, the calculations (under the
𝜂vis =3% assumption) present good agreement with the observational data, especially near the average val-
ues (the big crosses in the figures). The peak visible power shows little dependence on the current waveform
parameters in the range used (𝜏r = 0.5 and 5 μs, and 𝜏 f = 50 and 150 μs). The rise time also does not affect the
relationship between energy emitted and charge transferred to the ground, shown in Figure 7e. The same
figure also shows that strokes with a narrower current pulse (i.e., with shorter fall time) are more efficient
in converting electrical energy into optical.
There are two important issues that must be noted about the comparison made in Figures 7d and 7e.
First, the radiometers used by Quick and Krider (2017) have a flat spectral response in the 400-1,000
nm range. According to Ripoll et al. (2014a, 2014b), about twice as much energy is emitted in this range
than in the visible, because it includes part of the infrared spectrum. Second, Quick and Krider (2017)
state that rocket-triggered lightning strikes radiate around half as much energy as first strikes in natural
cloud-to-ground flashes. But the simulations use initial conditions that best resemble first strikes in natu-
ral lightning, similarly to the works by Plooster (1971) and Paxton et al. (1986). Therefore, if we attempt
to scale the numerical results to correspond to optical power emitted in the 400-1,000 nm range (×2) by
rocket-triggered lightning (×1/2), the factors of two cancel and the curves would stay in the same place in
Figures 7d and 7e, which lends further credence to the comparison. Nonetheless, it should be noted that
our numerical investigations did not capture the approximate quadratic scaling between peak luminosity
and peak current, that is, luminosity ∝ I2p , seen in observations (Carvalho et al., 2015; Quick & Krider, 2017;
Zhou et al., 2014). Further work is required to explain all experimentally inferred relationships between
current and luminosity derived from close-by observations of rocket-triggered lightning.
When analyzing the light emission of return strokes, two additional factors must be noted. First, in
rocket-triggered lightning there is a nonnegligible amount of copper emission within the visible spectrum,
DA SILVA ET AL. 9459

Journal of Geophysical Research: Atmospheres 10.1029/2019JD030693
arising from the vaporization of the copper wire that connects the rocket to the ground (Walker &
Christian, 2017). Second, there is a geometric growth effect of the optical emission within the field of view
of the detector. For the sake of simplicity, these two effects are neglected in the simulations by assuming that
the fraction of total energy radiated by neutral copper is small in comparison to all other emissions from
the air plasma, and by assuming that within the narrow field of view of the detector (only 62 m of chan-
nel length) the return stroke current amplitude does not change considerably. All these uncertainties are
encapsulated within the parameter 𝜂vis, adjusted within reason to fit the measurements.
In all simulations shown in Figure 7, the total energy deposited in the channel by Joule heating ranges
between 10 J/m and 18 kJ/m. At the instant of peak electrical power, the channel resistance varies between
0.6–130 Ω/m within all simulation cases presented in this section. For peak currents larger than 5 kA, this
quantity shows little dependence on the current rise time and fall time values used, and can be fitted by
the following formula R=A∕Ip, where A=13 kAΩ/m (the mean error between fit and simulation results
is lower than 3%). From this formula it is easy to see that in the range of peak currents between 10 and 20
kA, the channel resistance per unit length at the instant of peak electrical power reduces from 1.3 to 0.65
Ω/m. Once again these values are in good agreement with the experimental findings of Jayakumar et al.
(2006, Table 2).
4. Summary and Conclusions
In summary, in this manuscript we introduced, validated, and used a physics-based computational tool to
calculate the lightning channel's nonlinear plasma resistance. A model that bridges an existing gap in the
literature, by providing a self-consistent evaluation of the plasma properties at little computational cost
(i.e., at the cost of solving five ordinary differential equations). In this paper, we showed how the proposed
computer-simulation tool can performwell in a wide range of current values, from 1 to 104 A. It can capture
well the non-LTE plasma regime, by reproducing the finite time scale for streamer-to-leader transition with
reasonable accuracy. Furthermore, in the high-current/full-LTE regime, the model can capture well the
temporal evolution of the neutral-gas temperature and the estimated energy deposition by a return stroke,
in good agreement with the work of Plooster (1971) and Paxton et al. (1986).
The model also describes well the negative differential resistance behavior of steady-state arc discharges, in
good agreement with the experimental findings of King (1961) and Tanaka et al. (2000). The steady-state
resistance in the millisecond time scale has an inverse power law dependence on the current, that is,
R=A∕Ib, where A and b are fitting constants. We found that the power law index b decreases with increas-
ing current, because at different current regimes the steady state is dictated by distinct physical processes.
At low currents (I < 10 A) the steady state is given by a balance of Joule heating and heat conduction, while
at high currents (I > 1 kA) the steady state is given by a balance with radiative losses. The intermediate cur-
rent range is marked by a comparable role between the two loss processes, with radiative emission being
important in the submillisecond time scale, while heat conduction being significant at later stages.
We presented a detailed description of the light emission in a return stroke. We showed that the proposed
model can reproduce the experimentally inferred direct relationship between peak current and peak radi-
ated power and between charge transferred to ground and total energy radiated, as experimentally inferred
byQuick andKrider (2017). The caveat is that the quadratic power law relationship between the two remains
unexplained. The model also captures the 0.1-μs delay between the rise of current and optical emissions in
rocket-triggered lightning return strokes, as measured with high precision by Carvalho et al. (2014, 2015).
It has been suggested that the negative differential resistance behavior of lightning channels plays an impor-
tant role in themechanism of current cutoff, which in its turnmakes some flashes transfer charge to ground
by a series of (discrete) return strokes, while others by a single stroke followed by a long continuing current
(Krehbiel et al., 1979; Hare et al., 2019; Heckman, 1992;Mazur et al., 1995). Recent review articles argue that
the role of negative differential resistance in the channel cutoff remains to be quantified (Mazur & Ruhnke,
2014; Williams, 2006; Williams & Heckman, 2012; Williams & Montanyà, 2019). The model described in
this manuscript can be applied for simulating multiple return strokes in a flash and other types of processes
taking place in the lightning channel, such as dart-leader ionization waves and M components, provided
that the current waveform is given (see Figure 1b). Suggestions of future work include coupling this tool to
DA SILVA ET AL. 9460

Journal of Geophysical Research: Atmospheres 10.1029/2019JD030693
distributed circuit models of the lightning return stroke, or to fractal models of the growing lightning-leader
network.We speculate that this strategywill provide important insights into the physics of lightning channel
cutoff.
References
Aleksandrov, N. L., Bazelyan, E. M., Kochetov, I. V., & Dyatko, N. A. (1997). The ionization kinetics and electric field in the leader channel
in long air gaps. Journal of Physics D: Applied Physics, 30, 1616–1624. https://doi.org/10.1088/0022-3727/30/11/011
Aleksandrov, N. L., Bazelyan, E. M., & Konchakov, A. M. (2001). Plasma parameters in the channel of a long leader in air. Plasma Physics
Reports, 27, 875–885. https://doi.org/10.1134/1.1409721
Aleksandrov, N. L., Bazelyan, E. M., & Shneider, M. N. (2000). Effect of continuous current during pauses between successive strokes on
the decay of the lightning channel. Plasma Physics Reports, 26(10), 893–901. https://doi.org/10.1134/1.1316830
Baker, L. (1990). Return-stroke transmission line model. In R. L. Gardner (Ed.), Lightning electromagnetics (pp. 63–74). Philadelphia, PA:
Taylor and Francis.
Barannik, S. I., Vasserman, S. B., & Lukin, A. N. (1975). Resistance and inductance of a gas arc. Soviet physics. Technical physics, 19(11),
1499–1453.
Bazelyan, E. M., & Raizer, Y. P. (1998). Spark discharge. Boca Raton/Florida: CRC Press.
Bazelyan, E. M., & Raizer, Y. P. (2000). Lightning physics and lightning protection. Bristol/Philadelphia: Institute of Physics Publishing.
Bazelyan, E. M., Raizer, Y. P., & Aleksandrov, N. L. (2007). The effect of reduced air density on streamer-to-leader transition and on
properties of long positive leader. Journal of Physics D: Applied Physics, 40(14), 4133–4144. https://doi.org/10.1088/0022-3727/40/14/007
Becker, K. H., Kogelschatz, U., Schoenbach, K. H., & Barker, R. J. (2004). Non-equilibrium air plasmas at atmospheric pressure (pp. 700).
Boca Raton, FL: CRC Press. https://doi.org/10.1201/9781482269123
Benilov, M. S., & Naidis, G. V. (2003). Modelling of low-current discharges in atmospheric-pressure air taking account of non-equilibrium
effects. Journal of Physics D: Applied Physics, 36, 1834–1841. https://doi.org/10.1088/0022-3727/36/15/314
Bittencourt, J. A. (2004). Fundamentals of plasma physics (3rd ed.). New York: Springer.
Boulos, M. I., Fauchais, P., & Pfender, E. (1994). Thermal plasmas, fundamentals and applications (Vol. 1). New York: Plenum.
Braginskii, S. I. (1958). Theory of the development of a spark channel. Soviet Physics-JETP, 34(6), 1068–1074.
Bruce, C. E. R., & Golde, R. H. (1941). The lightning discharge. Journal of the Institution of Electrical Engineers—Part II: Power Engineering,
88(6), 487–505. https://doi.org/10.1049/ji-2.1941.0065
Carvalho, F. L., Jordan, D. M., Uman, M. A., Ngin, T., Gamerota, W. R., & Pilkey, J. T. (2014). Simultaneously measured lightning return
stroke channel-base current and luminosity. Geophysical Research Letters, 41, 7799–7805. https://doi.org/10.1002/2014GL062190
Carvalho, F. L., Uman, M. A., Jordan, D. M., & Ngin, T. (2015). Lightning current and luminosity at and above channel bottom for return
strokes and M-components. Journal Geophysical Research: Atmospheres, 120, 10,645–10,663. https://doi.org/10.1002/2015JD023814
Cernák, M., van Veldhuizen, E. M., Morva, I., & Rutgers, W. R. (1995). Effect of cathode surface properties on glow-to-arc transition in a
short positive corona gap in ambient air. Journal of Physics D: Applied Physics, 28, 1126–1132. https://doi.org/10.1088/0022-3727/28/6/
015
Chemartin, L., Lalande, P., Montreuil, E., Delalondre, C., Cheron, B. G., & Lago, F. (2009). Three dimensional simulation of a DC free
burning arc. Application to lightning physics. Atmospheric Research, 91(2-4), 371–380. https://doi.org/10.1016/j.atmosres.2008.07.009
Cho, M., & Rycroft, M. J. (1998). Computer simulation of the electric field structure and optical emission from cloud-top to the ionosphere.
Journal of Atmospheric and Solar-Terrestrial Physics, 60(7-9), 871–888. https://doi.org/10.1016/S1364-6826(98)00017-0
Cressault, Y., Bauchire, J. M., Hong, D., Rabat, H., Riquel, G., Sanchez, F., & Gleizes, A. (2015). Radiation of long and high power arcs.
Journal of Physics D: Applied Physics, 48(41), 415201. https://doi.org/10.1088/0022-3727/48/41/415201
Cressault, Y., Gleizes, A., & Riquel, G. (2011). Calculation of the radiation emitted by isothermal arc plasmas in air and air-metal mixtures.
In XX International Symposium on Plasma Chemistry (ISPC), Philadelphia, USA.
da Silva, C. L. (2015). Numerical modeling of leader discharge mechanisms in lightning, blue jets, gigantic jets, and sprites (Ph.D. thesis),
Penn State University University Park, PA.
da Silva, C. L. (2019a). Rate coefficients used in the plasma nature of lightning channels and the resulting nonlinear resistance. Zenodo,
Software https://doi.org/10.5281/zenodo.2597562
da Silva, C. L. (2019b). Simulation data output used in the plasma nature of lightning channels and the resulting nonlinear resistance.
Zenodo, Dataset https://doi.org/10.5281/zenodo.2597552
da Silva, C. L., Merrill, R. A., & Pasko, V. P. (2016). Mathematical constraints on the use of transmission line models to investigate the
preliminary breakdown stage of lightning flashes. Radio Science, 51, 367–380. https://doi.org/10.1002/2015RS005853
da Silva, C. L., & Pasko, V. P. (2012). Simulation of leader speeds at gigantic jet altitudes. Geophysical Research Letters, 39, L13805. https://
doi.org/10.1029/2012GL052251
da Silva, C. L., & Pasko, V. P. (2013). Dynamics of streamer-to-leader transition at reduced air densities and its implications for propaga-
tion of lightning leaders and gigantic jets. Journal of Geophysical Research: Atmospheres, 118, 13,561–13,590. https://doi.org/10.1002/
2013JD020618
da Silva, C. L., & Pasko, V. P. (2014). Infrasonic acoustic waves generated by fast air heating in sprite cores. Geophysical Research Letters,
41, 1789–1795. https://doi.org/10.1002/2013GL059164
De Conti, A., Visacro, S., Theethayi, N., & Cooray, V. (2008). A comparison of different approaches to simulate a nonlinear channel
resistance in lightning return stroke models. Journal of Geophysical Research, 113, D14129. https://doi.org/10.1029/2007JD009395
Engel, T. G., Donaldson, A. L., & Kristiansen,M. (1989). The pulsed discharge arc resistance and its functional behavior. IEEETransactions
on Plasma Science, 17(2), 323–329. https://doi.org/10.1109/27.24643
Flitti, A., & Pancheshnyi, S. (2009). Gas heating in fast pulsed discharges in N2–O2 mixtures. The European Physical Journal Applied
Physics, 45(2), 21001. https://doi.org/10.1051/epjap/2009011
Gallimberti, I. (1979). The mechanism of the long spark formation. Journal de Physique Colloques, 40(C7), 193–250.
Gallimberti, I., Bacchiega, G., Bondiou-Clergerie, A., & Lalande, P. (2002). Fundamental processes in long air gap discharges. Comptes
Rendus Physique, 3, 1335–1359. https://doi.org/10.1016/S1631-0705(02)01414-7
Hare, B. M., Scholten, O., Dwyer, J., Trinh, T. N. G., Buitink, S., ter Veen, S., et al. (2019). Needle-like structures discovered on positively
charged lightning branches. Nature, 568(7752), 360–363. https://doi.org/10.1038/s41586-019-1086-6
Heckman, S. (1992). Why does a lightning flash have multiple strokes? (Ph.D. thesis), Massachusetts Institute of Technology, Cambridge.
AcknowledgmentsThis research was supported by a
Research Infrastructure Development
award from New Mexico NASA
EPSCoR. We have made the simulation
data output (da Silva, 2019b) and rate
coefficients (da Silva, 2019a) shown in
this manuscript publicly available
online.
DA SILVA ET AL. 9461

Journal of Geophysical Research: Atmospheres 10.1029/2019JD030693
Heidler, F. (1985). Traveling current source model for LEMP calculation, Proc. 6th Int. Zurich Symp. Electromagnetic Compatibility
(pp. 157–162). Switzerland: Zurich.
Hill, R. . D. (1971). Channel heating in return-stroke lightning. Journal of Geophysical Research, 76(3), 637–645. https://doi.org/10.1029/
JC076i003p00637
Jayakumar, V., Rakov, V. A., Miki, M., Uman,M. A., Schnetzer, G. H., & Rambo, K. J. (2006). Estimation of input energy in rocket-triggered
lightning. Geophysical Research Letters, 33, L05702. https://doi.org/10.1029/2005GL025141
King, L. A. (1961). The voltage gradient of the free-burning arc in air or nitrogen. British Electrical and Allied Industries Research
Association, Reference G/XT172.
Koshak, W. J., Solakiewicz, R. J., & Peterson, H. S. (2015). A return stroke NOx production model. Journal of the Atmospheric Sciences,
72(2), 943–954. https://doi.org/10.1175/JAS-D-14-0121.1
Kossyi, I. A., Kostinsky, A. Y., Matveyev, A. A., & Silakov, V. P. (1992). Kinetic scheme of the non-equilibrium discharge in nitrogen-oxygen
mixtures. Plasma Sources Science and Technology, 1, 207–220. https://doi.org/10.1088/0963-0252/1/3/011
Krehbiel, P. R., Brook, M., & McCrory, R. A. (1979). An analysis of the charge structure of lightning discharges to ground. Journal of
Geophysical Research, 84(C5), 2432–2456. https://doi.org/10.1029/JC084iC05p02432
Kushner, M. J., Kimura, W. D., & Byron, S. R. (1985). Arc resistance of laser-triggered spark gaps. Journal of Applied Physics, 58(5),
1744–1751. https://doi.org/10.1063/1.336023
Larsson, A. (1998). The effect of a large series resistance on the streamer-to-spark transition in dry air. Journal of Physics D: Applied Physics,
31, 1100–1108. https://doi.org/10.1088/0022-3727/31/9/011
Liang, C., Carlson, B., Lehtinen, N., Cohen, M., Marshall, R. A., & Inan, U. S. (2014). Differing current and optical return stroke speeds in
lightning. Geophysical Research Letters, 41, 2561–2567. https://doi.org/10.1002/2014GL059703
Liu, N. Y., & Pasko, V. P. (2004). Effects of photoionization on propagation and branching of positive and negative streamers in sprites.
Journal of Geophysical Research, 109, A04301. https://doi.org/10.1029/2003JA010064
Lowke, J. J., Kovitya, P., & Schmidt, H. P. (1992). Theory of free-burning arc columns including the influence of the cathode. Journal of
Physics D: Applied Physics, 25(11), 1600–1606. https://doi.org/10.1088/0022-3727/25/11/006
Luque, A., & Gordillo-Vázquez, F. J. (2012). Mesospheric electric breakdown and delayed sprite ignition caused by electron detachment.
Nature Geoscience, 5(1), 22–25. https://doi.org/10.1038/NGEO1314
Marode, E., Bastien, F., & Bakker, M. (1979). A model of the streamer-induced spark formation based on neutral dynamics. Journal of
Applied Physics, 50, 140–146. https://doi.org/10.1063/1.325697
Mattos, M. A. F., & Christopoulos, C. (1990). A model of the lightning channel, including corona, and prediction of the generated
electromagnetic fields. Journal of Physics D: Applied Physics, 23(1), 40. https://doi.org/10.1088/0022-3727/23/1/007
Mazur, V., Krehbiel, P. R., & Shao, X.-M. (1995). Correlated high-speed video and radio interferometric observations of a cloud-to-ground
lightning flash. Journal Geophysical Research, 100(D12), 25,731–25,753. https://doi.org/10.1029/95JD02364
Mazur, V., &Ruhnke, L. H. (2014). The physical processes of current cutoff in lightning leaders. Journal Geophysical Research: Atmospheres,
119, 2796–2810. https://doi.org/10.1002/2013JD020494
Montano, R., Becerra, M., Cooray, V., Rahman, M., & Liyanage, P. (2006). Resistance of spark channels. IEEE Transactions on Plasma
Science, 34(5), 1610–1619. https://doi.org/10.1109/TPS.2006.883350
Morrow, R., & Lowke, J. J. (1997). Streamer propagation in air. Journal of Physics D: Applied Physics, 30, 614–627. https://doi.org/10.1088/
0022-3727/30/4/017
Naghizadeh-Kashani, Y., Cressault, Y., & Gleizes, A. (2002). Net emission coefficient of air thermal plasmas. Journal of Physics D: Applied
Physics, 35(22), 2925. https://doi.org/10.1088/0022-3727/35/22/306
Naidis, G. (1999). Simulation of streamer-to-spark transition in short non-uniform air gaps. Journal of Physics D: Applied Physics, 32(20),
2649–2654. https://doi.org/10.1088/0022-3727/32/20/311
Naidis, G. V. (2005). Dynamics of streamer breakdown of short non-uniform air gaps. Journal of Physics D: Applied Physics, 38(21),
3889–3893. https://doi.org/10.1088/0022-3727/38/21/009
Naidis, G. V. (2009). Positive and negative streamers in air: Velocity-diameter relation. Physical Review E, 79(5), 57401. https://doi.org/10.
1103/PhysRevE.79.057401
Pancheshnyi, S., Nudnova, M., & Starikovskii, A. (2005). Development of a cathode-directed streamer discharge in air at different
pressures: Experiment and comparison with direct numerical simulation. Physical Review E, 71, 16407. https://doi.org/10.1103/
PhysRevE.71.016407
Paxton, A. H., Gardner, R. L., & Baker, L. (1986). Lightning return stroke. A numerical calculation of the optical radiation. Physics Fluids,
29(8), 2736–2741. https://doi.org/10.1063/1.865514
Plooster, M. N. (1971). Numerical model of the return stroke stroke of the lightning discharge. Physics Fluids, 14(10), 2124–2133. https://
doi.org/10.1063/1.1693303
Popov, N. A. (2001). Investigation of the mechanism for rapid heating of nitrogen and air in gas discharges. Plasma Physics Reports, 27(10),
886–896. https://doi.org/10.1134/1.1409722
Popov, N. A. (2003). Formation and development of a leader channel in air. Plasma Physics Reports, 29(8), 695–708. https://doi.org/10.
1134/1.1601648
Popov, N. A. (2009). Study of the formation and propagation of a leader channel in air. Plasma Physics Reports, 35, 785–793. https://doi.
org/10.1134/S1063780X09090074
Popov, N. A. (2011). Fast gas heating in a nitrogen-oxygen discharge plasma: I. Kinetic mechanism. Journal of Physics D: Applied Physics,
44, 285201. https://doi.org/10.1088/0022-3727/44/28/285201
Quick, M. G., & Krider, P. E. (2017). Optical power and energy radiated by return strokes in rocket-triggered lightning. Journal Geophysics
Research: Atmospheres, 122, 8816–8832. https://doi.org/10.1002/2017JD027363
Raizer, Y. P. (1991). Gas discharge physics. New York: Springer-Verlag.
Rakov, V. A. (1998). Some inferences on the propagation mechanisms of dart leaders and return strokes. Journal Geophysics Research,
103(D2), 1879–1887. https://doi.org/10.1029/97JD03116
Rakov, V. A., & Uman, M. A. (1998). Review and evaluation of lightning return stroke models including some aspects of their application.
IEEE Transactions on Electromagnetic Compatibility, 40(4), 403–426. https://doi.org/10.1109/15.736202
Rakov, V. A., & Uman, M. A. (2003). Lightning: Physics and effects (pp. 687). Cambridge: University Press.
Rayment, S. W., & Moruzzi, J. L. (1978). Electron detachment studies between O− ions and nitrogen. International Journal of Mass
Spectrometry and Ion Processes, 26(3), 321–326. https://doi.org/10.1016/0020-7381(78)80033-3
Riousset, J. A., Pasko, V. P., & Bourdon, A. (2010). Air-density-dependent model for analysis of air heating associated with streamers,
leaders, and transient luminous events. Journal Geophysical Research, 115, A12321. https://doi.org/10.1029/2010JA015918
DA SILVA ET AL. 9462

Journal of Geophysical Research: Atmospheres 10.1029/2019JD030693
Ripoll, J.-F., Zinn, J., Colestock, P. L., & Jeffery, C. A. (2014b). On the dynamics of hot air plasmas related to lightning discharges: 2.
Electrodynamics. Journal Geophysical Research: Atmospheres, 119, 9218–9235. https://doi.org/10.1002/2013JD020068
Ripoll, J.-F., Zinn, J., Jeffery, C. A., & Colestock, P. L. (2014a). On the dynamics of hot air plasmas related to lightning discharges: 1. Gas
dynamics. Journal Geophysical Research: Atmospheres, 119, 9196–9217. https://doi.org/10.1002/2013JD020067
Sansonnens, L., Haidar, J., & Lowke, J. J. (2000). Prediction of properties of free burning arcs including effects of ambipolar diffusion.
Journal of Physics D: Applied Physics, 33(2), 148. https://doi.org/10.1088/0022-3727/33/2/309
Siegel, R. (2001). Thermal radiation heat transfer (4th ed., Vol. 1, pp. 864). New York: CRC Press.
Takaki, K., & Akiyama, H. (2001). The resistance of a high-current pulsed discharge in nitrogen. Japanese Journal of Applied Physics,
40(Part 1, No. 2B), 979–983. https://doi.org/10.1143/jjap.40.979
Tanaka, S., Sunabe, K., & Goda, Y. (2000). Three dimensional behaviour analysis of D.C. free arc column by image processing technique.
In XIII Int'l. Conf. on Gas Discharges and Their Applications, Glasgow.
Tanaka, M., Terasaki, H., Ushio, M., & Lowke, J. J. (2003). Numerical study of a free-burning argon arc with anode melting. Plasma
Chemistry and Plasma Processing, 23(3), 585–606. https://doi.org/10.1023/A:1023272007864
Theethayi, N., & Cooray, V. (2005). On the representation of the lightning return stroke process as a current pulse propagating along a
transmission line. IEEE Transactions on Power Delivery, 20(2), 823–837. https://doi.org/10.1109/TPWRD.2004.839188
Vidal, F., Gallimberti, I., Rizk, F. A. M., Johnston, T. W., Bondiou-Clergerie, A., Comtois, D., et al. (2002). Modeling of the air plasma near
the tip of the positive leader. IEEE Transactions on Plasma Science, 30(3), 1339–1349. https://doi.org/10.1009/TPS.2002.801538
Walker, T. D., & Christian, H. J. (2017). Triggered lightning spectroscopy: Part 1. A qualitative analysis. Journal of Geophysical Research:
Atmospheres, 122, 8000–8011. https://doi.org/10.1002/2016JD026419
Walker, T. D., & Christian, H. J. (2019). Triggered lightning spectroscopy: 2. A quantitative analysis. Journal of Geophysical Research:
Atmospheres, 124, 3930–3942. https://doi.org/10.1029/2018JD029901
Williams, E. R. (2006). Problems in lightning physics—The role of polarity asymmetry. Plasma Sources Science and Technology, 15,
S91—S108. https://doi.org/10.1088/0963-0252/15/2/S12
Williams, E. R., & Heckman, S. (2012). Polarity asymmetry in lightning leaders: The evolution of ideas on lightning behavior from strikes
to aircraft. Journal Aerospace Lab, 5, AL05–04.
Williams, E., &Montanyà, J. (2019). A closer look at lightning reveals needle-like structures.Nature, 568, 319–320. https://doi.org/10.1038/
d41586-019-01178-7
Winn, W. P., Aulich, G. D., Hunyady, S. J., Eack, K. B., Edens, H., Krehbiel, P. R., et al. (2011). Lightning leader stepping, K changes, and
other observations near an intracloud flash. Journal Geophysical Research, 116, D23115. https://doi.org/10.1029/2011JD015998
Yos, J. M. (1963). Transport properties of nitrogen, hydrogen, oxygen, and air to 30,000◦ K (Tech. Rep.) Wilmington, MA: AVCO Corp.
Tech. Memo. RAD-TM-63-7.
Zhou, M., Wang, D., Wang, J., Takagi, N., Gamerota, W. R., Uman, M. A., et al. (2014). Correlation between the channel-bottom light
intensity and channel-base current of a rocket-triggered lightning flash. Journal Geophysical Research: Atmospheres, 119, 13,457–13,473.
https://doi.org/10.1002/2014JD022367
DA SILVA ET AL. 9463