the point of care quality control debate - welcome …€¦ · the point of care quality control...
TRANSCRIPT

The Point of Care Quality Control Debate Thomas Koshy, Ph.D., Sr. Director, Scientific Affairs Alere, Inc
Disclaimers
• I work for Biosite/Inverness/Alere
• Alere produces testing devices for use at the POC…so I have more data on the testing areas my company covers; with special attention to ED (i.e. cardiac) POCT
• I think POCT is pretty cool
• This is usually a 90-120 minute talk!! • So I’m going to cover some of this way too fast…..

A Show of Hands
EP23
EQC
IQCPs
What is QC? Where did it come from?
How does QC assure
quality data?

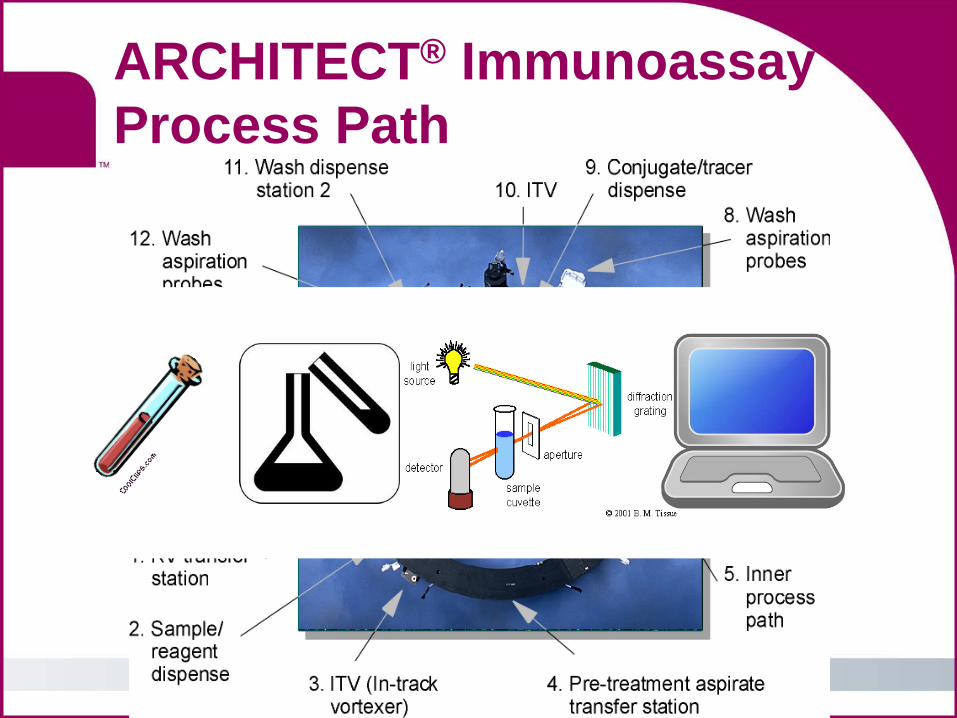
ARCHITECT® Immunoassay Process Path

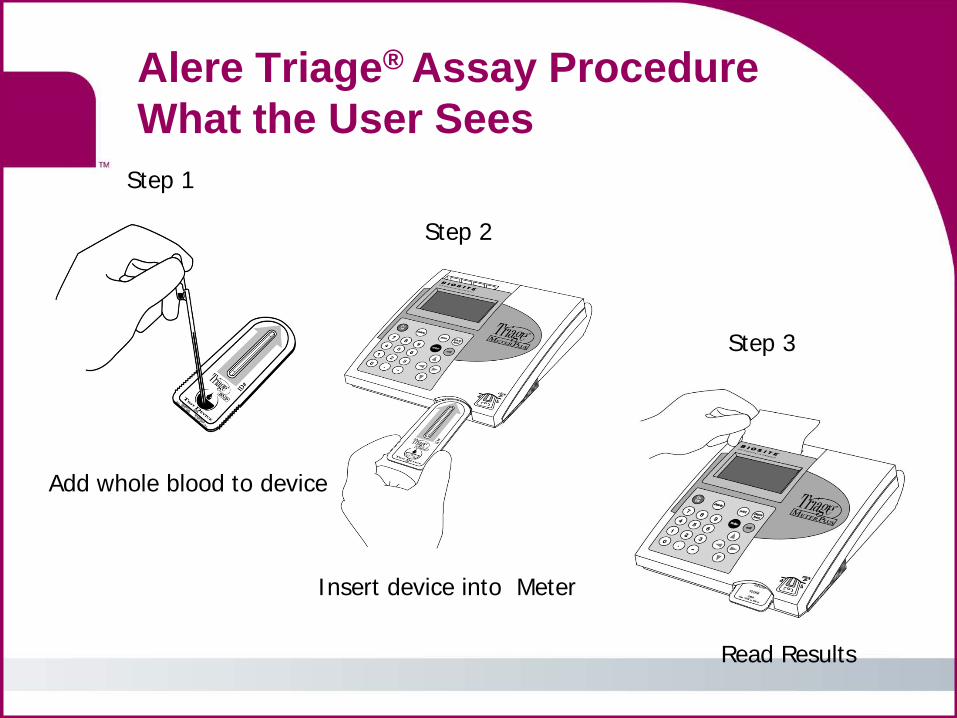
Alere Triage® Assay Procedure What the User Sees
Step 1
Add whole blood to device
Step 2
Insert device into Meter
Step 3
Read Results
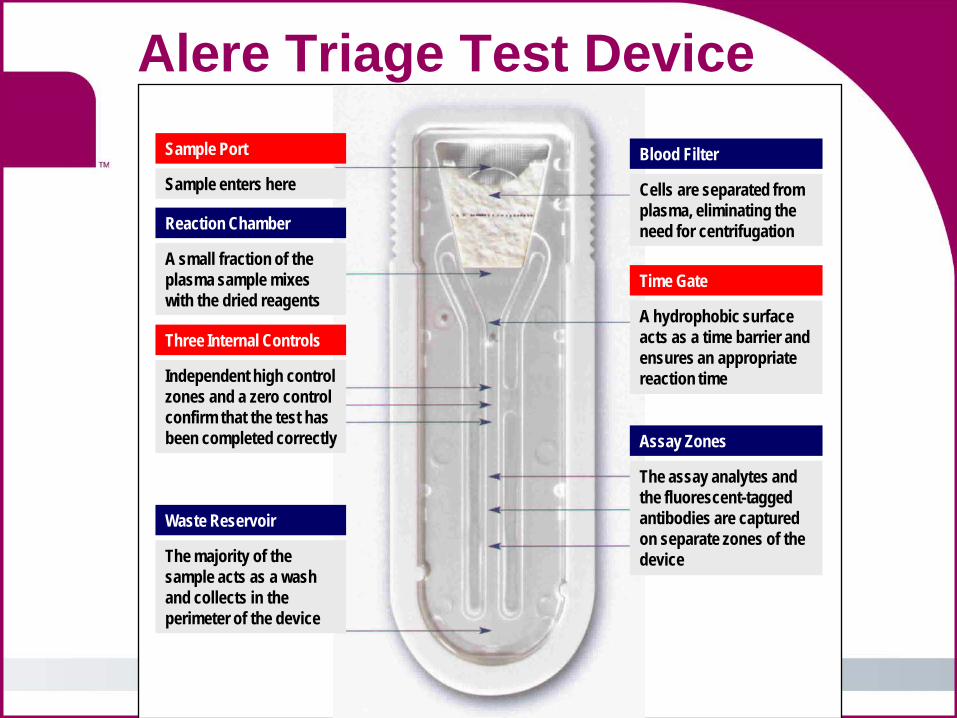
Alere Triage Test Device
Independent high control zones and a zero control confirm that the test has been completed correctly
Three Internal Controls
Sample enters here
Sample Port
A small fraction of the plasma sample mixes with the dried reagents
Reaction Chamber
The majority of the sample acts as a wash and collects in the perimeter of the device
Waste Reservoir
A hydrophobic surface acts as a time barrier and ensures an appropriate reaction time
Time Gate
Cells are separated from plasma, eliminating the need for centrifugation
Blood Filter
The assay analytes and the fluorescent-tagged antibodies are captured on separate zones of the device
Assay Zones
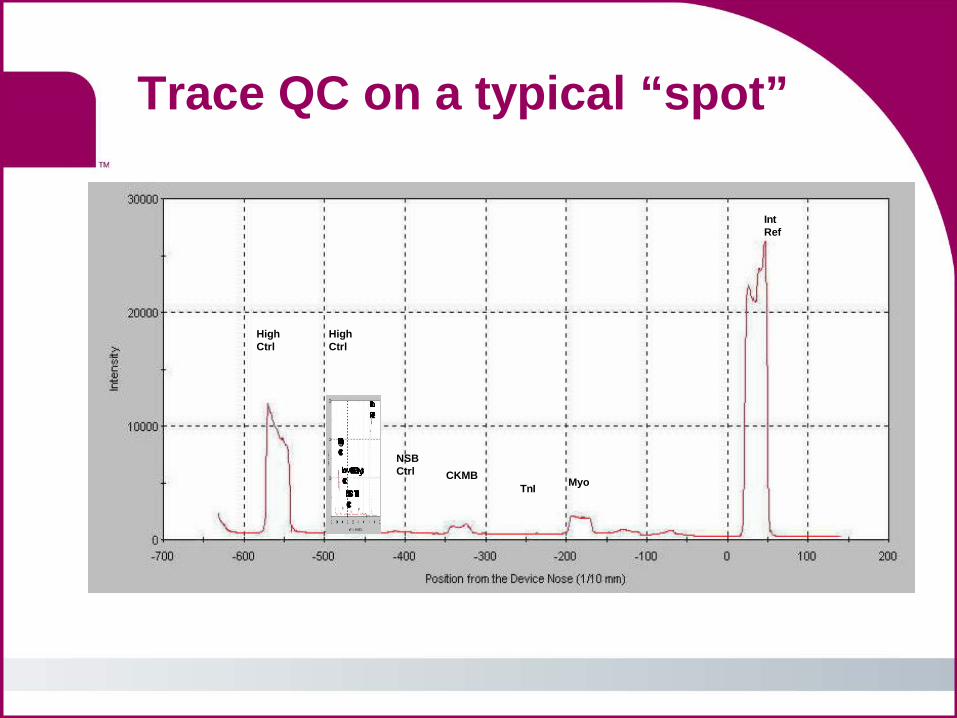
Trace QC on a typical “spot”
NSB Ctrl CKMB
TnI Myo
Int Ref
High Ctrl
High Ctrl
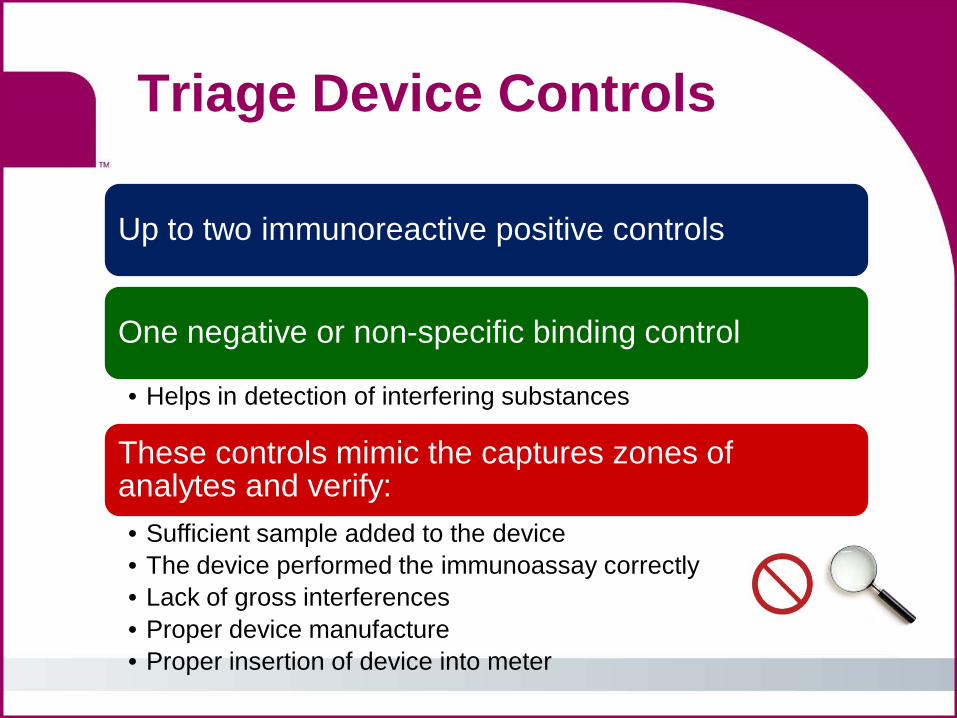
Triage Device Controls
Up to two immunoreactive positive controls
One negative or non-specific binding control
• Helps in detection of interfering substances
These controls mimic the captures zones of analytes and verify: • Sufficient sample added to the device • The device performed the immunoassay correctly • Lack of gross interferences • Proper device manufacture • Proper insertion of device into meter
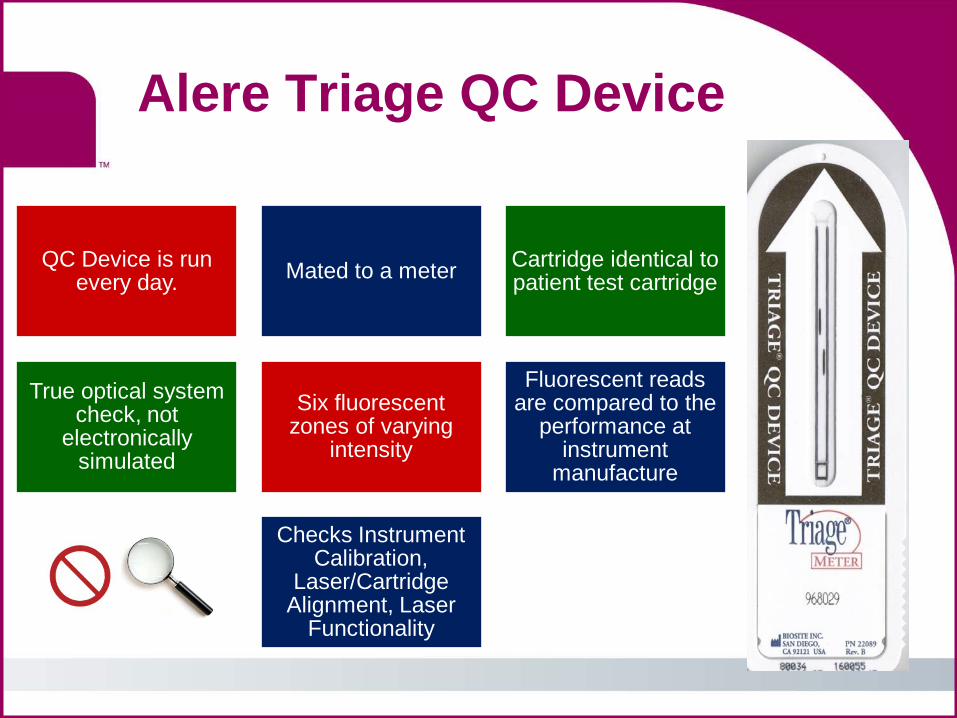
Alere Triage QC Device
QC Device is run every day. Mated to a meter Cartridge identical to
patient test cartridge
True optical system check, not
electronically simulated
Six fluorescent zones of varying
intensity
Fluorescent reads are compared to the
performance at instrument
manufacture
Checks Instrument Calibration,
Laser/Cartridge Alignment, Laser
Functionality
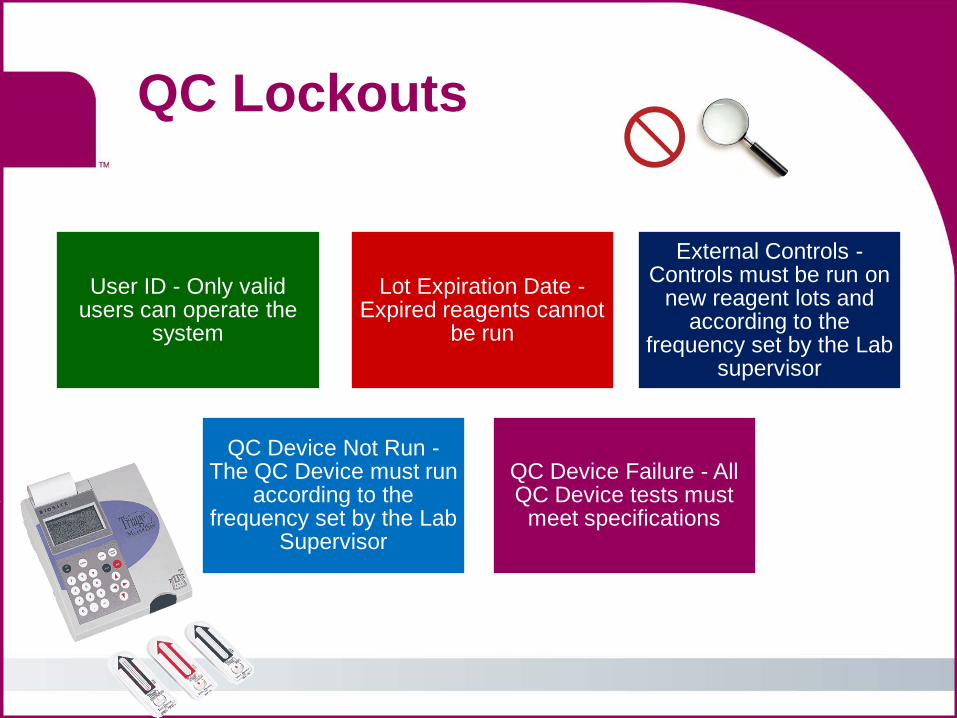
QC Lockouts
User ID - Only valid users can operate the
system
Lot Expiration Date - Expired reagents cannot
be run
External Controls - Controls must be run on
new reagent lots and according to the
frequency set by the Lab supervisor
QC Device Not Run - The QC Device must run
according to the frequency set by the Lab
Supervisor
QC Device Failure - All QC Device tests must
meet specifications

15
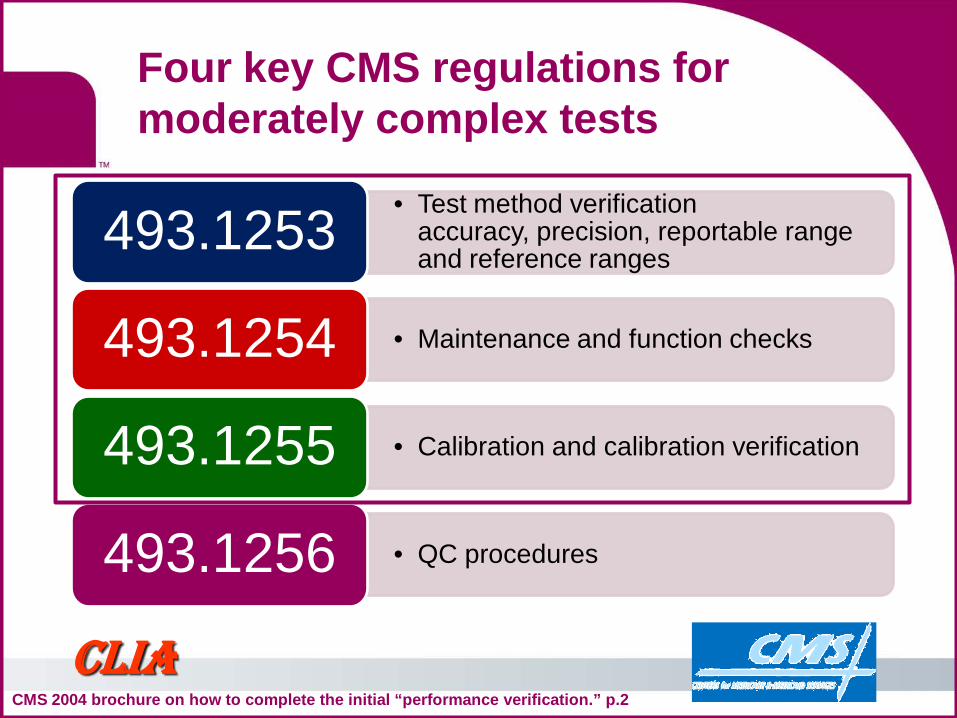
Four key CMS regulations for moderately complex tests
CMS 2004 brochure on how to complete the initial “performance verification.” p.2
CLIA
• Test method verification accuracy, precision, reportable range and reference ranges
493.1253
• Maintenance and function checks 493.1254
• Calibration and calibration verification 493.1255
• QC procedures 493.1256
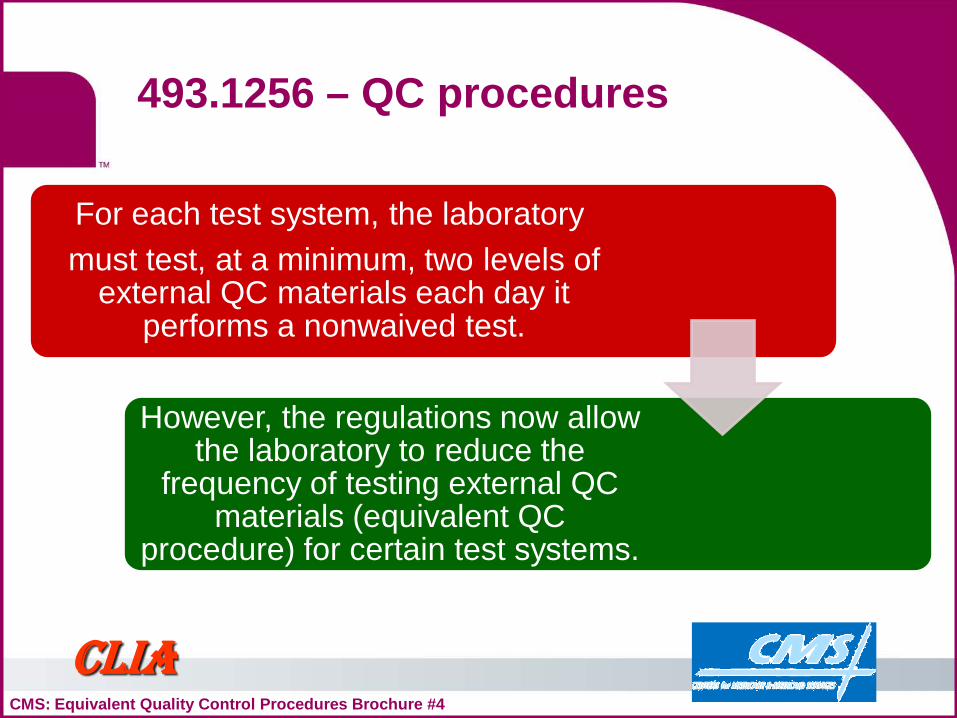
493.1256 – QC procedures
CLIA CMS: Equivalent Quality Control Procedures Brochure #4
For each test system, the laboratory must test, at a minimum, two levels of
external QC materials each day it performs a nonwaived test.
However, the regulations now allow the laboratory to reduce the
frequency of testing external QC materials (equivalent QC
procedure) for certain test systems.
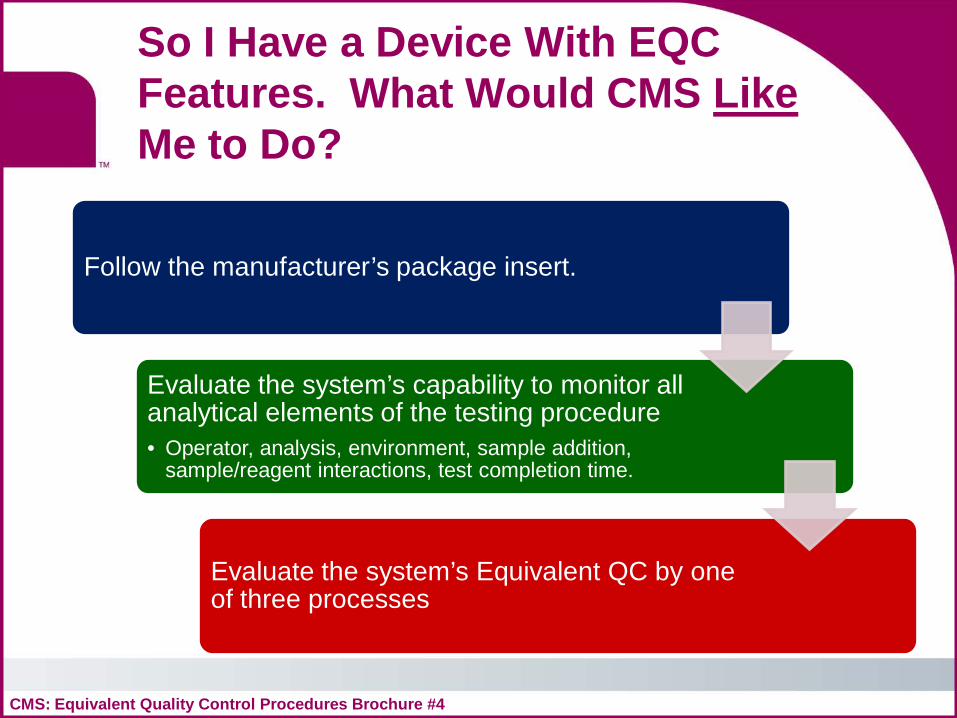
So I Have a Device With EQC Features. What Would CMS Like Me to Do?
CMS: Equivalent Quality Control Procedures Brochure #4
Follow the manufacturer’s package insert.
Evaluate the system’s capability to monitor all analytical elements of the testing procedure • Operator, analysis, environment, sample addition,
sample/reagent interactions, test completion time.
Evaluate the system’s Equivalent QC by one of three processes
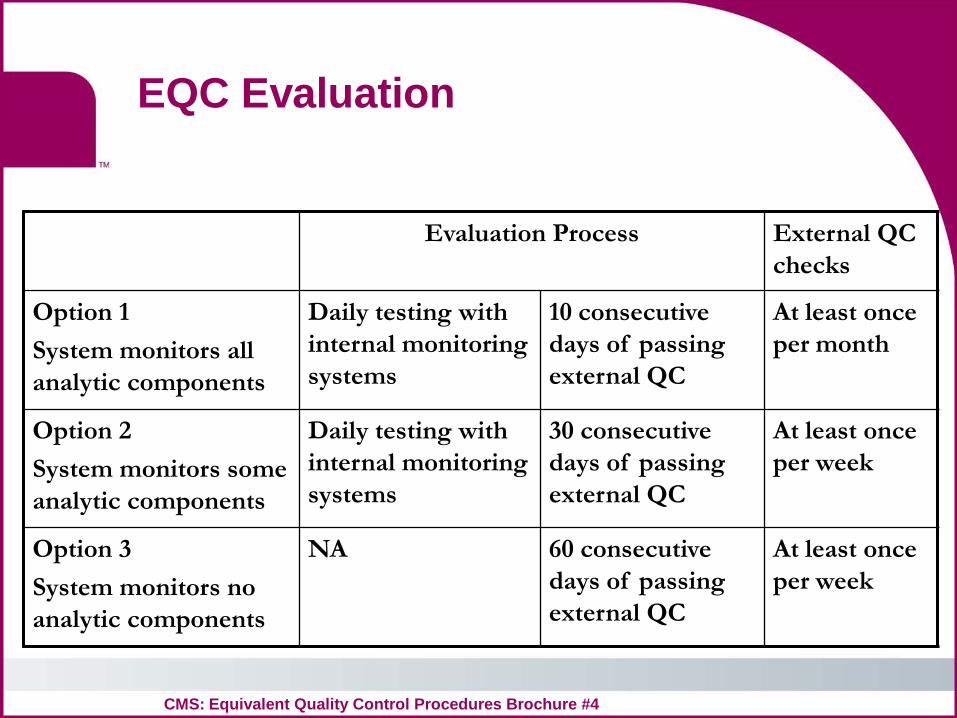
EQC Evaluation
Evaluation Process External QC checks
Option 1 System monitors all analytic components
Daily testing with internal monitoring systems
10 consecutive days of passing external QC
At least once per month
Option 2 System monitors some analytic components
Daily testing with internal monitoring systems
30 consecutive days of passing external QC
At least once per week
Option 3 System monitors no analytic components
NA 60 consecutive days of passing external QC
At least once per week
CMS: Equivalent Quality Control Procedures Brochure #4
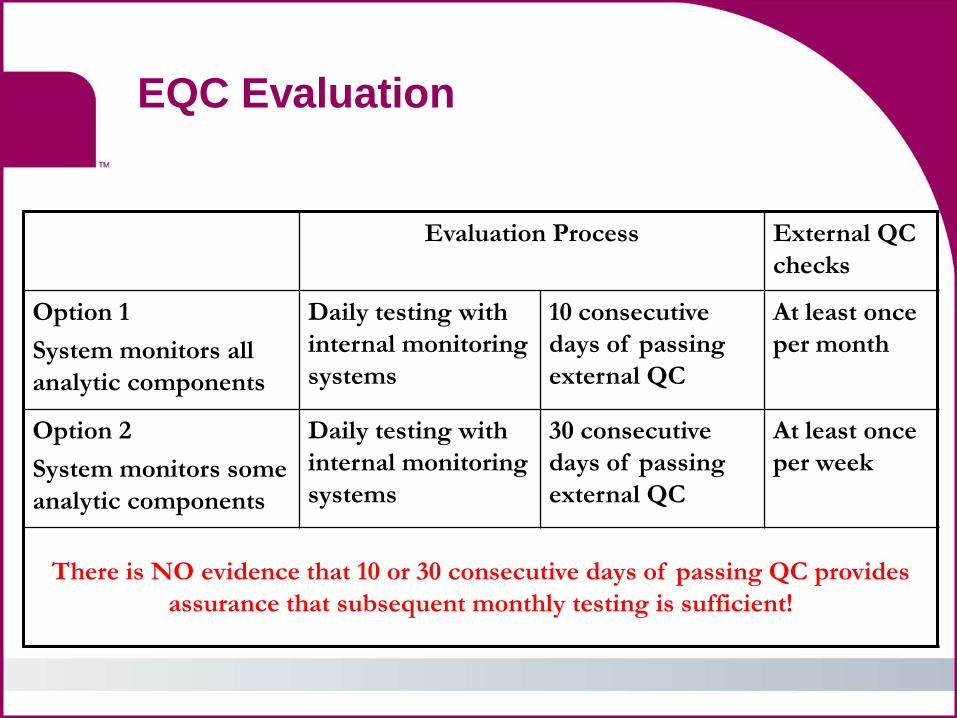
EQC Evaluation
Evaluation Process External QC checks
Option 1 System monitors all analytic components
Daily testing with internal monitoring systems
10 consecutive days of passing external QC
At least once per month
Option 2 System monitors some analytic components
Daily testing with internal monitoring systems
30 consecutive days of passing external QC
At least once per week
There is NO evidence that 10 or 30 consecutive days of passing QC provides assurance that subsequent monthly testing is sufficient!
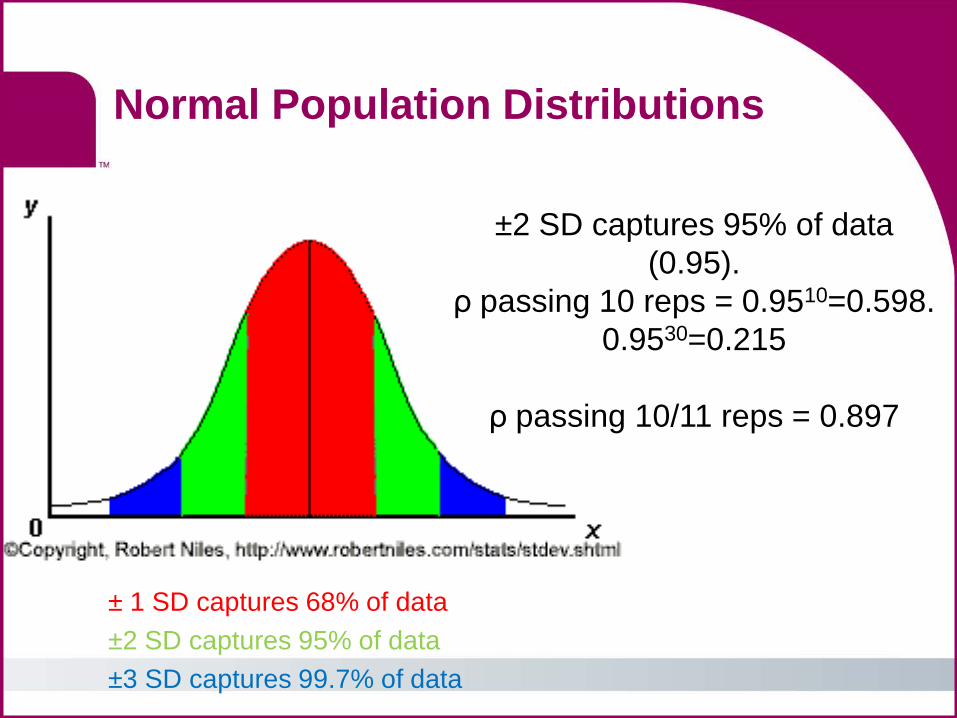
± 1 SD captures 68% of data ±2 SD captures 95% of data
±3 SD captures 99.7% of data
Normal Population Distributions
±2 SD captures 95% of data (0.95).
ρ passing 10 reps = 0.9510=0.598. 0.9530=0.215
ρ passing 10/11 reps = 0.897
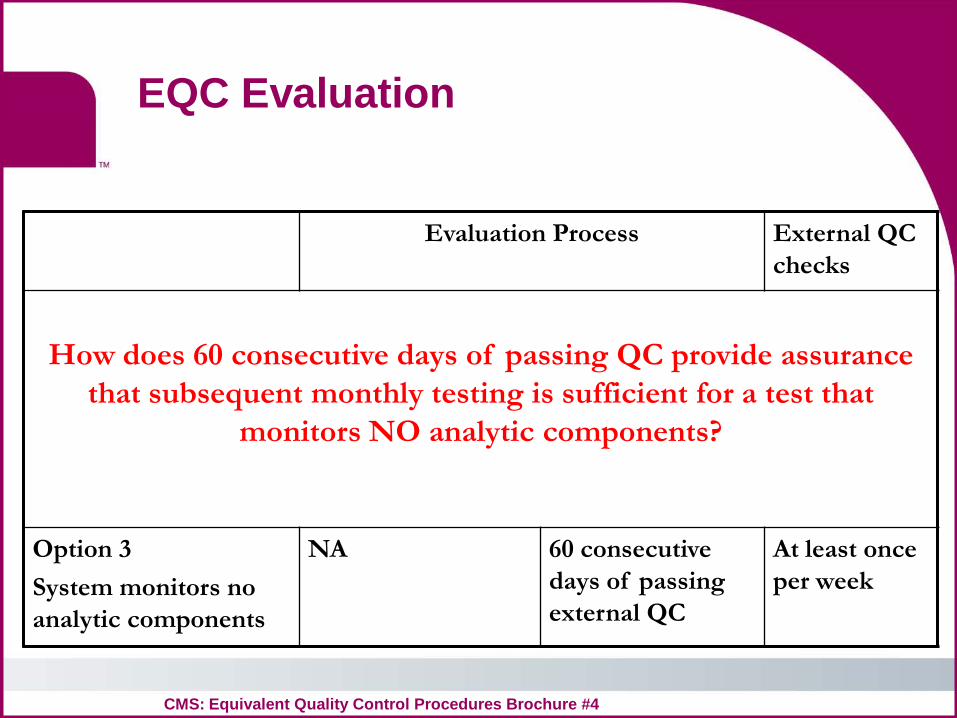
EQC Evaluation
Evaluation Process External QC checks
How does 60 consecutive days of passing QC provide assurance that subsequent monthly testing is sufficient for a test that
monitors NO analytic components?
Option 3 System monitors no analytic components
NA 60 consecutive days of passing external QC
At least once per week
CMS: Equivalent Quality Control Procedures Brochure #4

The Pen is Mightier than QC
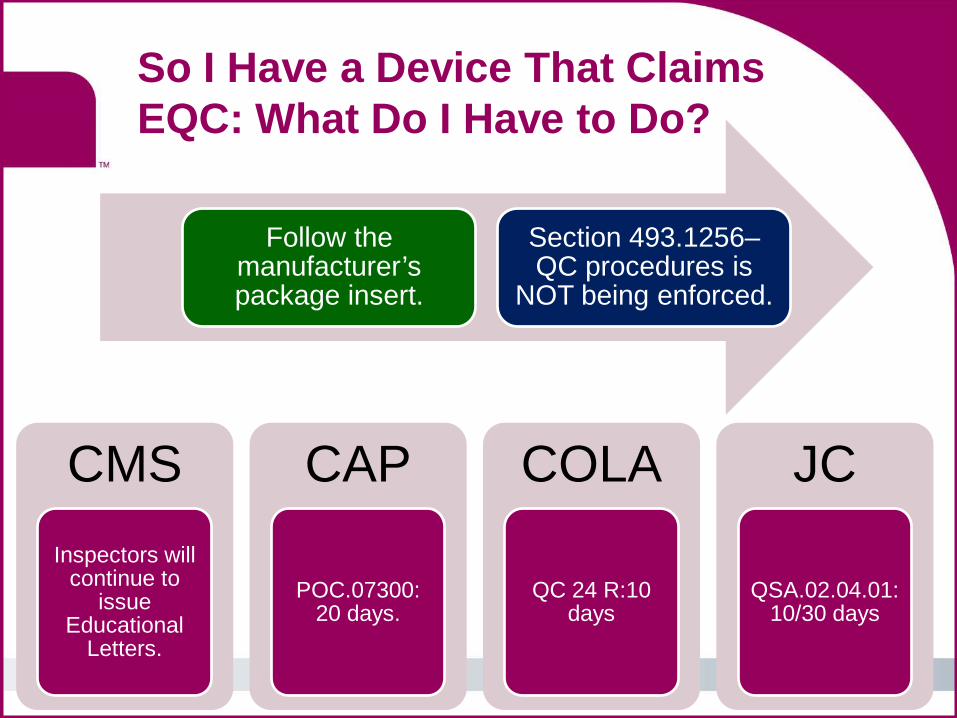
So I Have a Device That Claims EQC: What Do I Have to Do?
Follow the manufacturer’s package insert.
Section 493.1256–QC procedures is
NOT being enforced.
CMS Inspectors will
continue to issue
Educational Letters.
CAP
POC.07300: 20 days.
COLA
QC 24 R:10 days
JC
QSA.02.04.01: 10/30 days
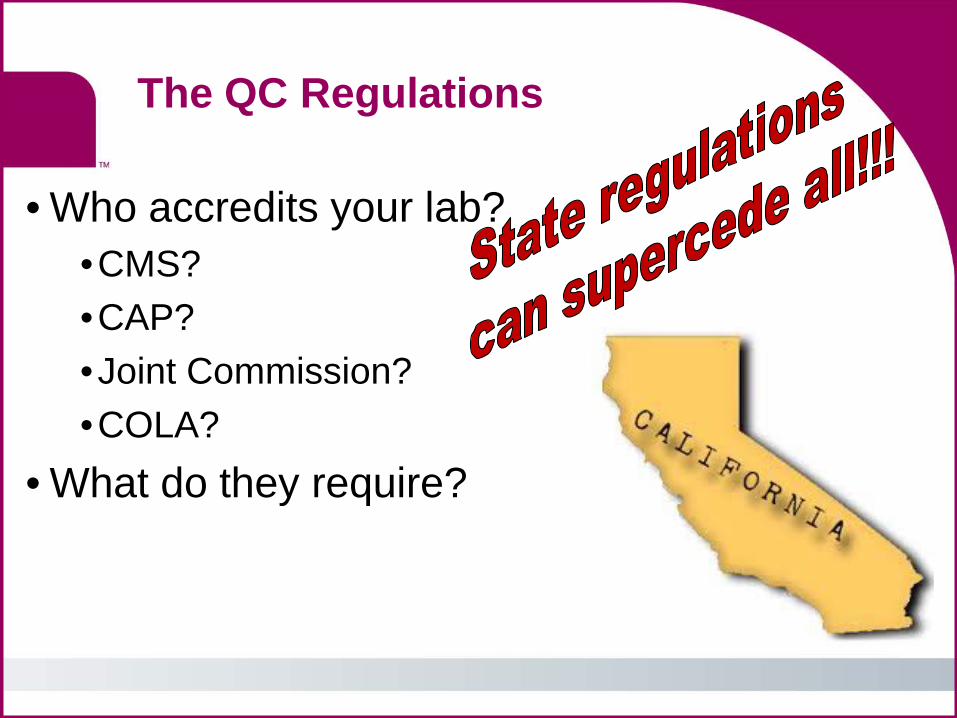
The QC Regulations
• Who accredits your lab? •CMS? •CAP? •Joint Commission? •COLA?
• What do they require?
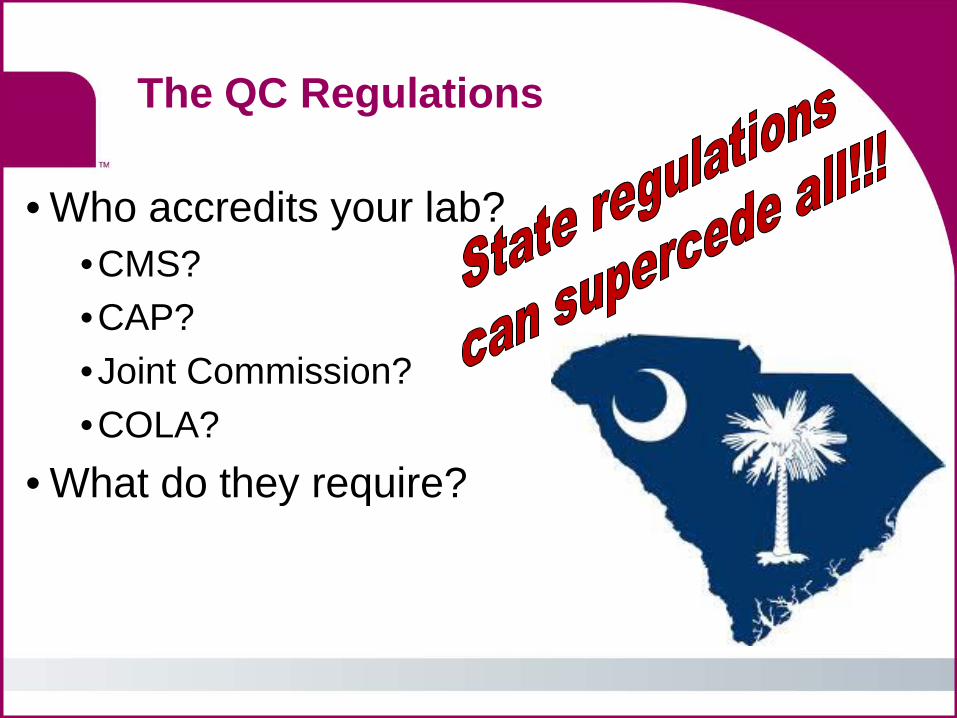
The QC Regulations
• Who accredits your lab? •CMS? •CAP? •Joint Commission? •COLA?
• What do they require?
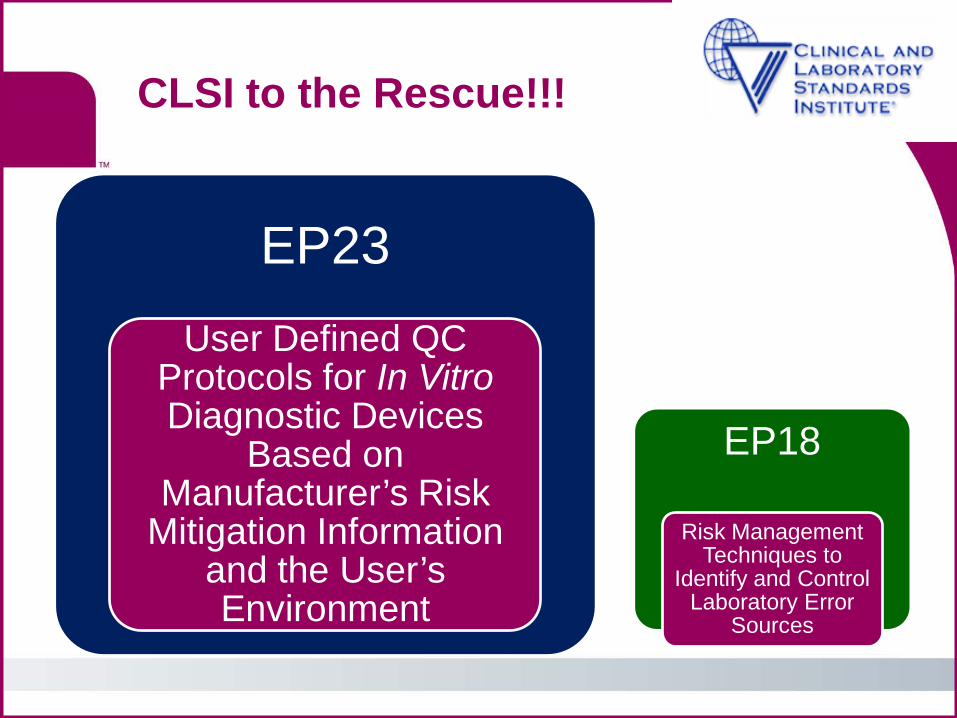
CLSI to the Rescue!!!
EP23 User Defined QC
Protocols for In Vitro Diagnostic Devices
Based on Manufacturer’s Risk
Mitigation Information and the User’s Environment
EP18
Risk Management Techniques to
Identify and Control Laboratory Error
Sources
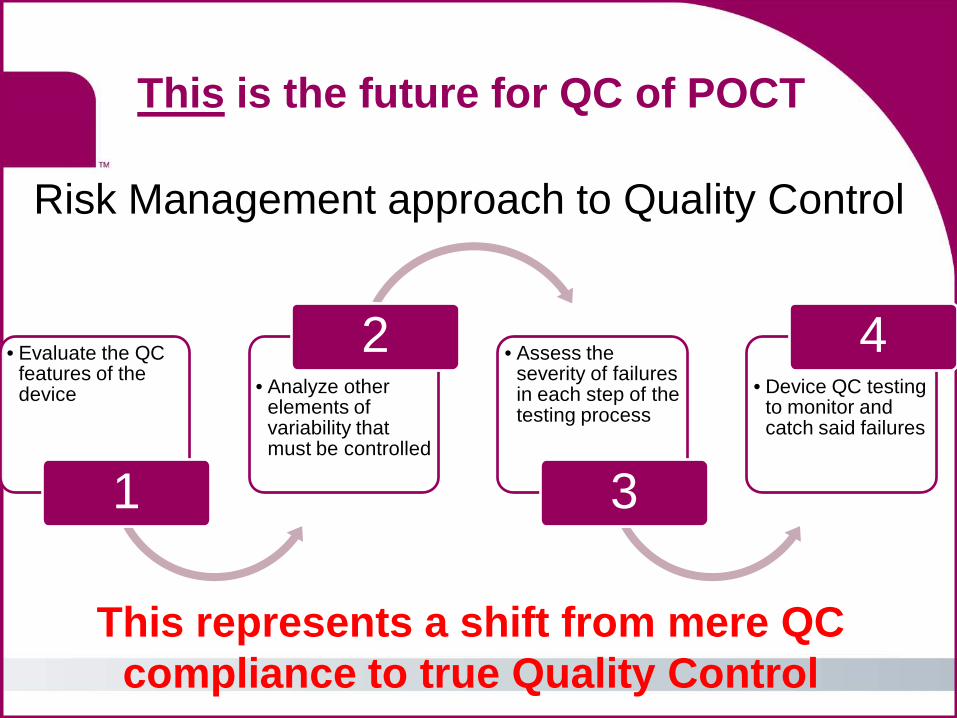
This is the future for QC of POCT
Risk Management approach to Quality Control
• Evaluate the QC
features of the device
1
• Analyze other elements of variability that must be controlled
2 • Assess the severity of failures in each step of the testing process
3
• Device QC testing to monitor and catch said failures
4
This represents a shift from mere QC compliance to true Quality Control

3/9/12 CMS Official Memorandum
Key concepts from EP-23 will be an acceptable alternative QC policy. The New CLIA QC policy will be entitled Individualized Quality Control Plan (IQCP)
IQCPs are a formal representation and compilation of many things laboratories currently do for quality.
IQCPs permits the laboratory to customize its QC plan according to environment, reagents, testing personnel, specimens, and test system.
IQCP will be voluntary: Laboratories will have two choices for QC compliance: 1) Two levels of QC per day or, 2) IQCP. Package insert requirements must be met.
EQC will be phased out at the end of the education and transition period
Education and transition dates
TBD
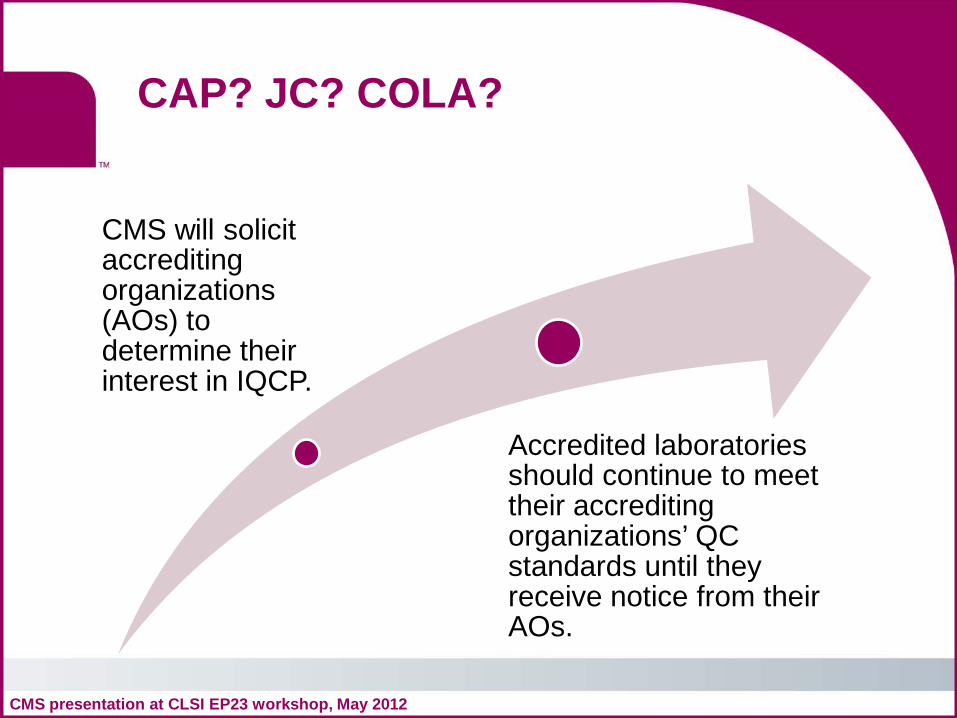
CAP? JC? COLA?
CMS will solicit accrediting organizations (AOs) to determine their interest in IQCP.
Accredited laboratories should continue to meet their accrediting organizations’ QC standards until they receive notice from their AOs.
CMS presentation at CLSI EP23 workshop, May 2012
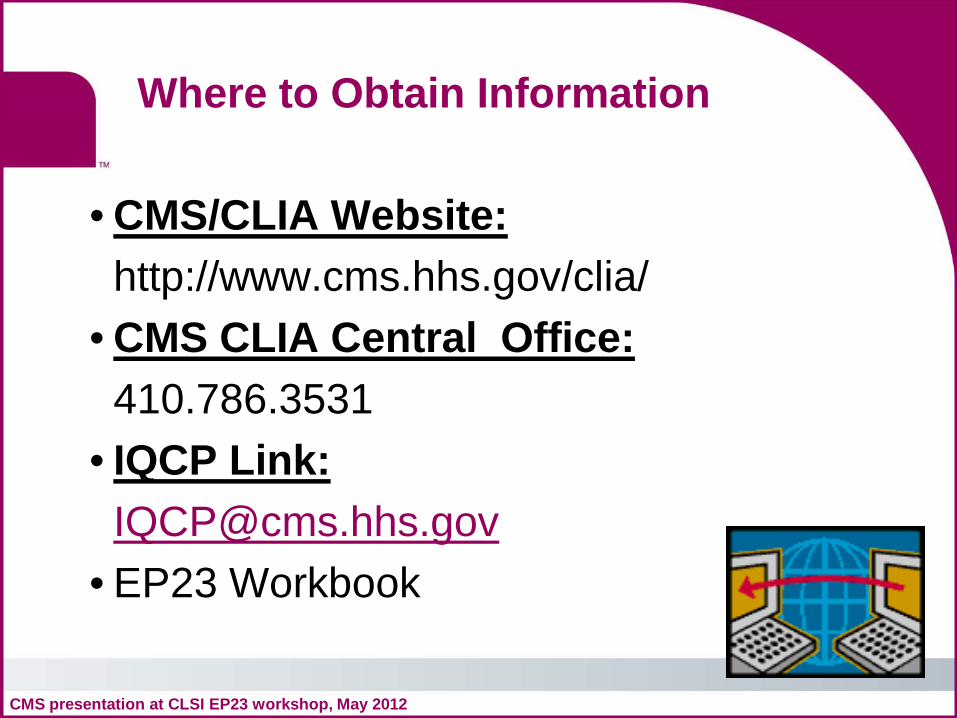
Where to Obtain Information
• CMS/CLIA Website: http://www.cms.hhs.gov/clia/ • CMS CLIA Central Office: 410.786.3531 • IQCP Link: [email protected] • EP23 Workbook
CMS presentation at CLSI EP23 workshop, May 2012
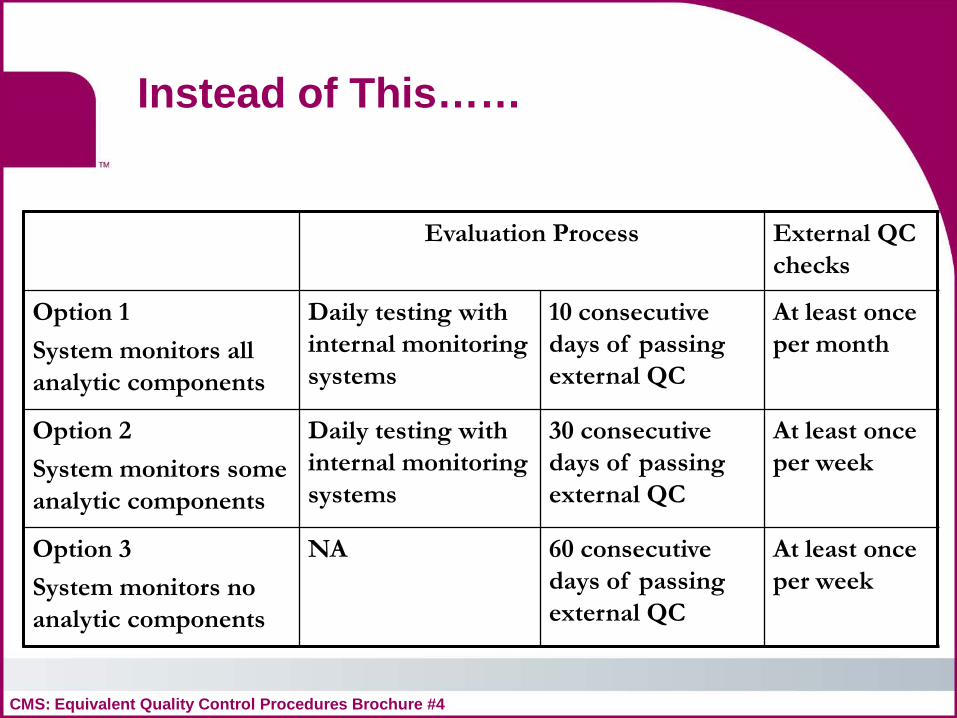
Instead of This……
Evaluation Process External QC checks
Option 1 System monitors all analytic components
Daily testing with internal monitoring systems
10 consecutive days of passing external QC
At least once per month
Option 2 System monitors some analytic components
Daily testing with internal monitoring systems
30 consecutive days of passing external QC
At least once per week
Option 3 System monitors no analytic components
NA 60 consecutive days of passing external QC
At least once per week
CMS: Equivalent Quality Control Procedures Brochure #4
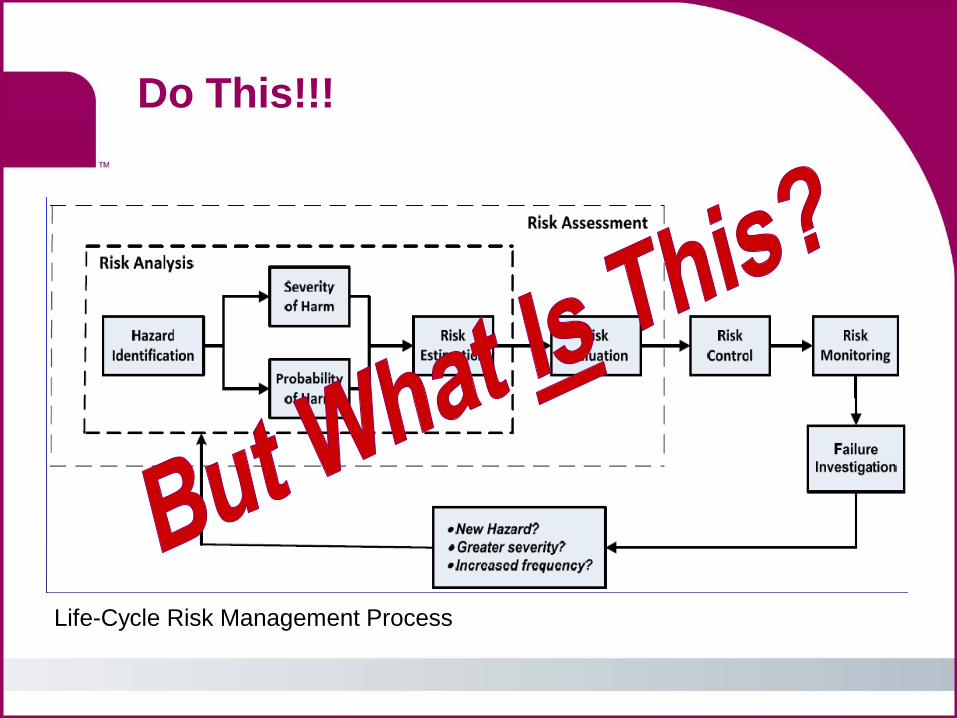
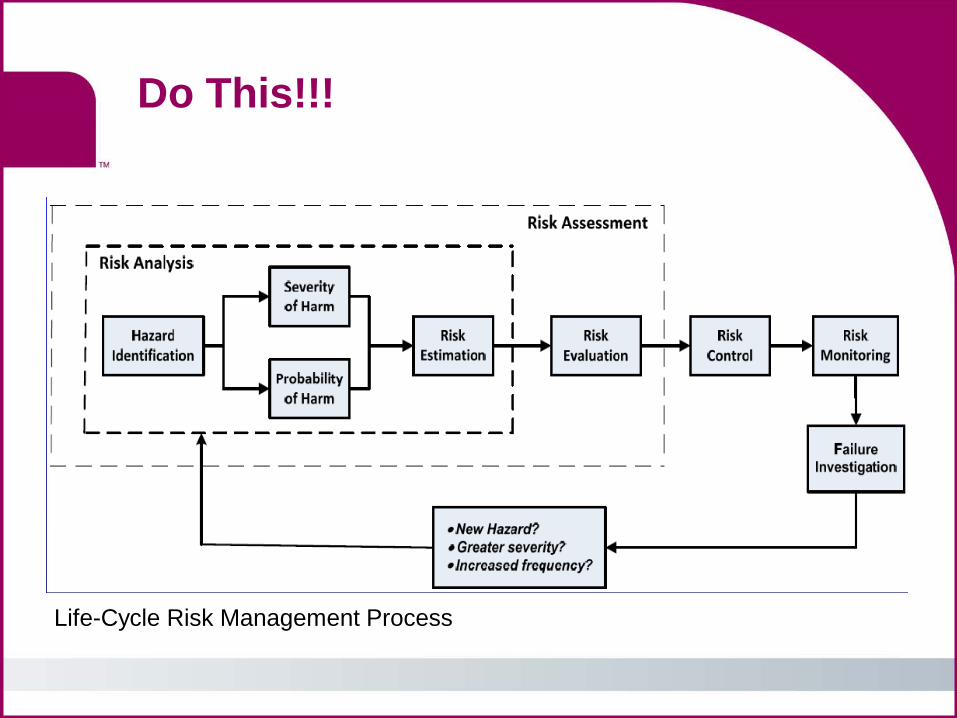
Do This!!!
Life-Cycle Risk Management Process

Risk/Hazard Assessments
Gruesomely Complex Ineffective
Hand-waving

Statistical Data
Existing QC procedures

Risk Management approach to QC
FIrst understAnd the
dIFFerenCe between hAzArd
And rIsk
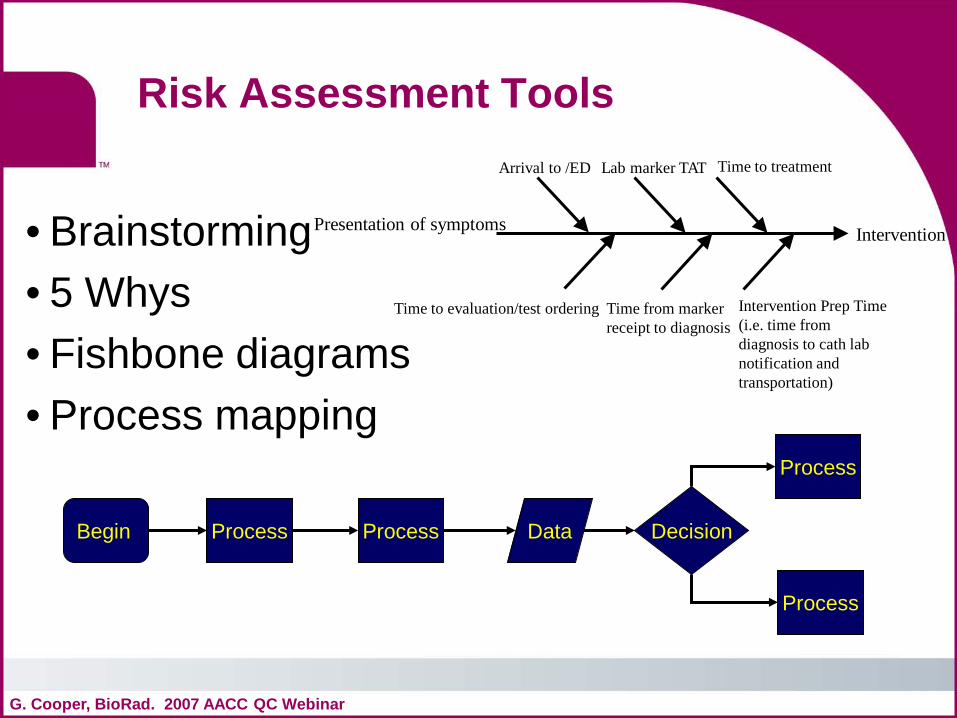
Risk Assessment Tools
• Brainstorming • 5 Whys • Fishbone diagrams • Process mapping
G. Cooper, BioRad. 2007 AACC QC Webinar
Begin Decision Process Process Data
Process
Process
Presentation of symptoms Intervention
Arrival to /ED
Time to evaluation/test ordering
Lab marker TAT
Time from marker receipt to diagnosis
Time to treatment
Intervention Prep Time (i.e. time from diagnosis to cath lab notification and transportation)

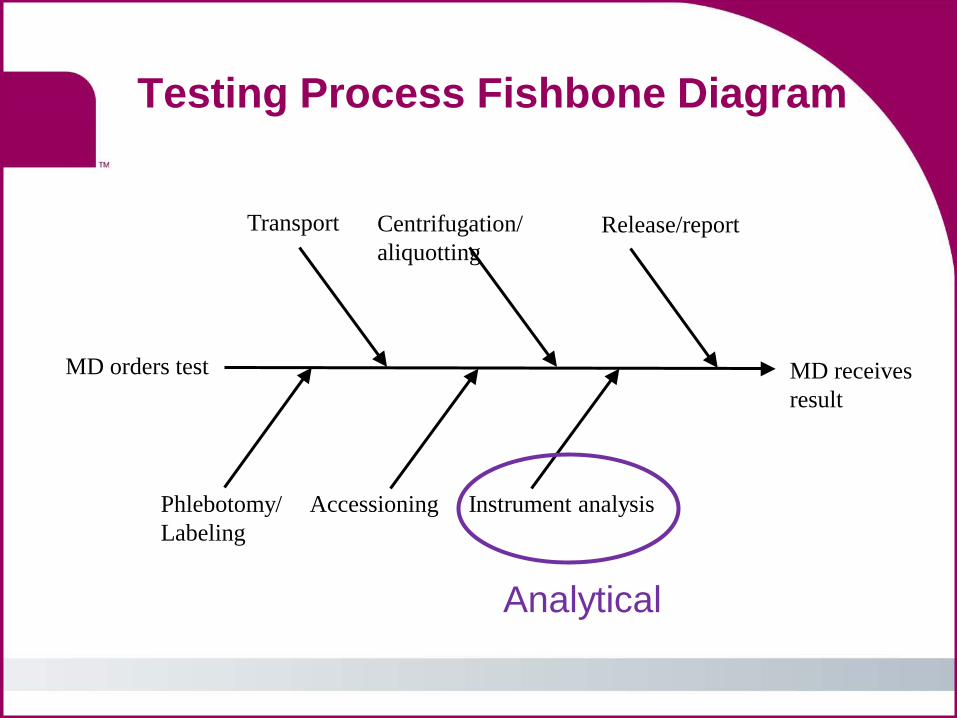
Testing Process Fishbone Diagram
MD receives result
MD orders test
Phlebotomy/ Labeling
Transport
Accessioning
Centrifugation/ aliquotting
Instrument analysis
Release/report
Pre-analytical
Post-analytical
Analytical
Testing Process Fishbone Diagram
MD receives result
MD orders test
Phlebotomy/ Labeling
Transport
Accessioning
Centrifugation/ aliquotting
Instrument analysis
Release/report
Analytical
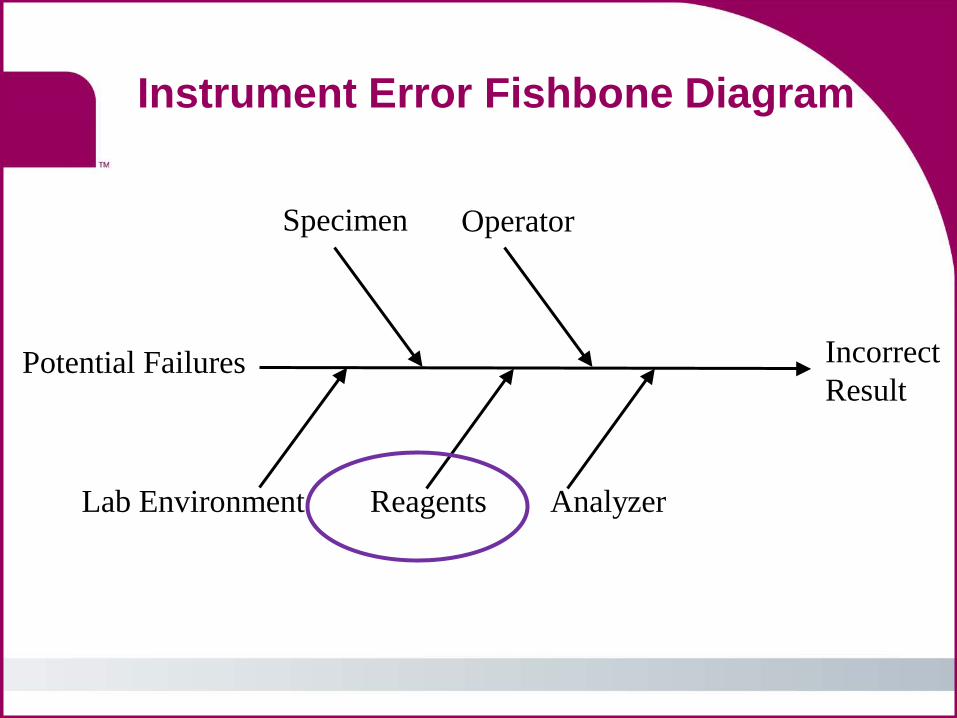
Instrument Error Fishbone Diagram
Incorrect Result
Potential Failures
Lab Environment
Specimen
Reagents
Operator
Analyzer
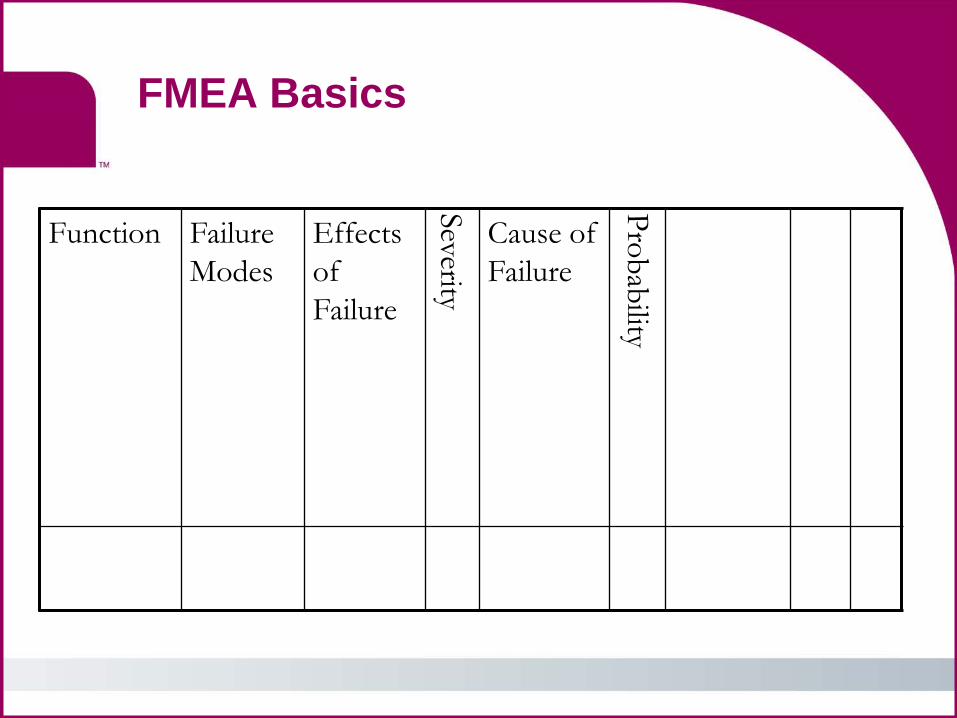
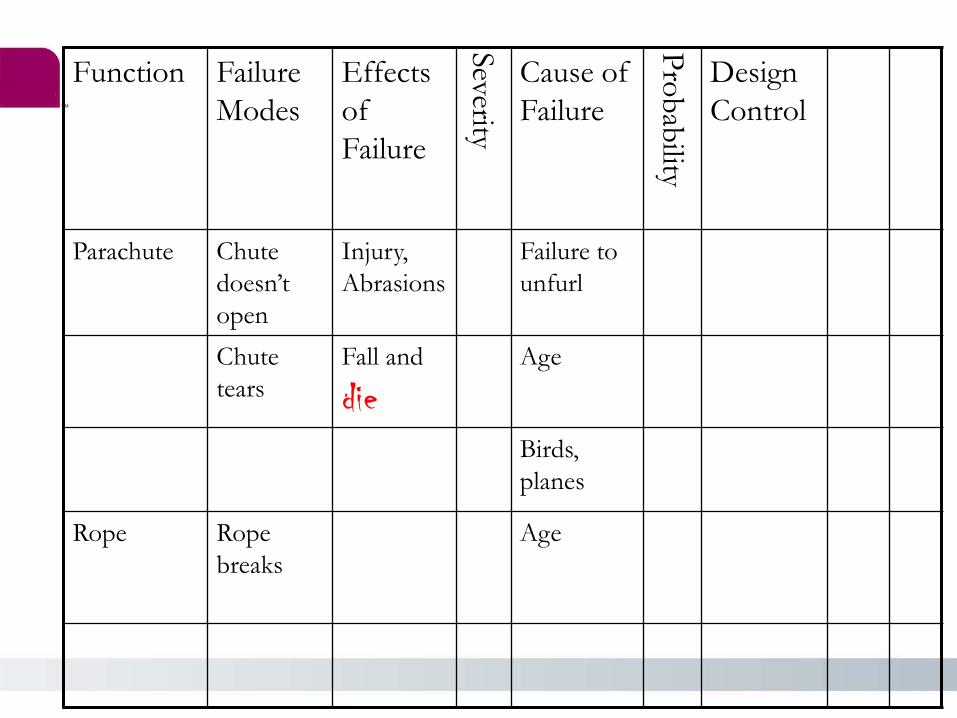
FMEA Basics
Function Failure Modes
Effects of Failure
Severity
Cause of Failure
Probability

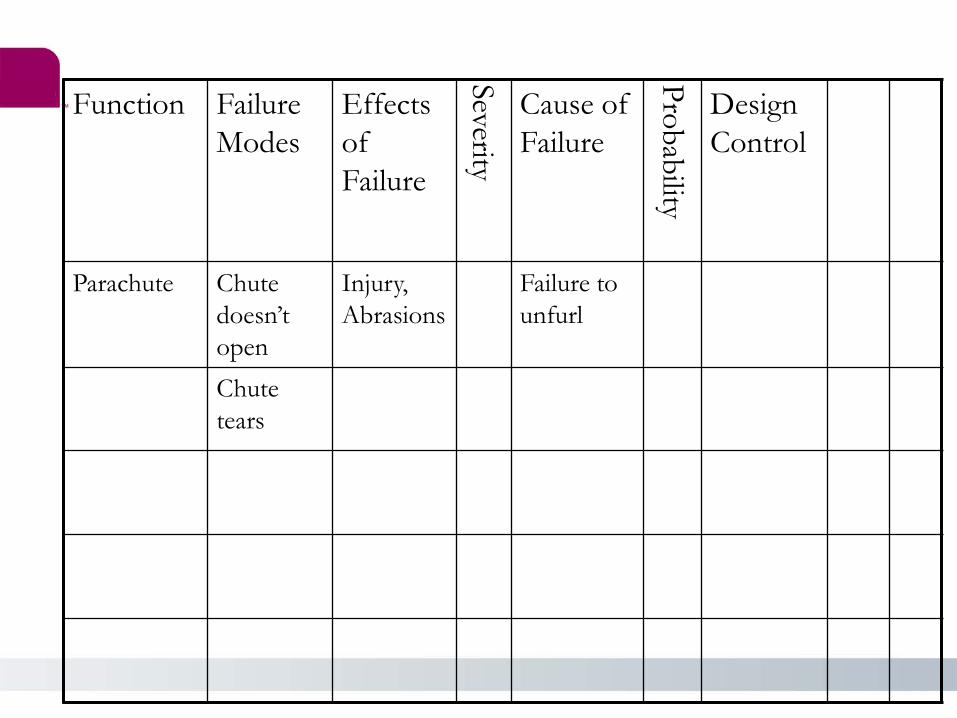
Let’s Learn with an Example

Function Failure Modes
Effects of Failure
Severity
Cause of Failure
Probability
Design Control
Parachute Chute doesn’t open
Injury, Abrasions
Failure to unfurl
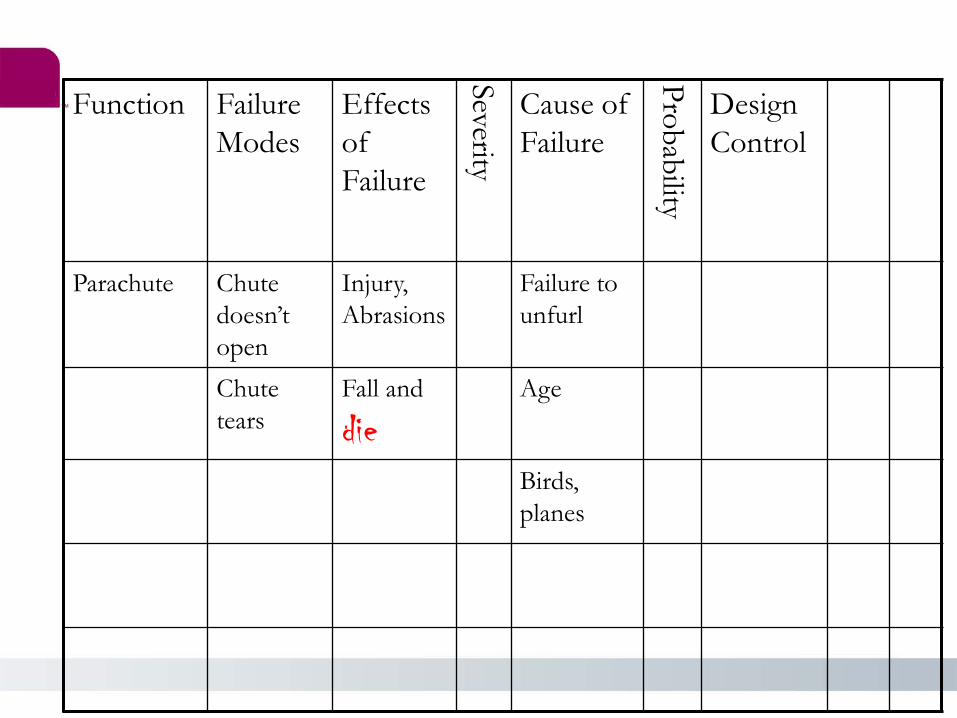
Function Failure Modes
Effects of Failure
Severity
Cause of Failure
Probability
Design Control
Parachute Chute doesn’t open
Injury, Abrasions
Failure to unfurl
Chute tears
Function Failure Modes
Effects of Failure
Severity
Cause of Failure
Probability
Design Control
Parachute Chute doesn’t open
Injury, Abrasions
Failure to unfurl
Chute tears
Fall and
die Age
Birds, planes
Function Failure Modes
Effects of Failure
Severity
Cause of Failure
Probability
Design Control
Parachute Chute doesn’t open
Injury, Abrasions
Failure to unfurl
Chute tears
Fall and
die Age
Birds, planes
Rope Rope breaks
Age

47
Unacceptable or Acceptable
with Risk Benefit
Recommend, Implement & Verify Risk Control Actions Evaluate Residual Risk
Acceptable Requires Risk Benefit Unacceptable
Proceed with Use Discontinue Use Perform Risk
Benefit Analysis

Risk Benefit
48
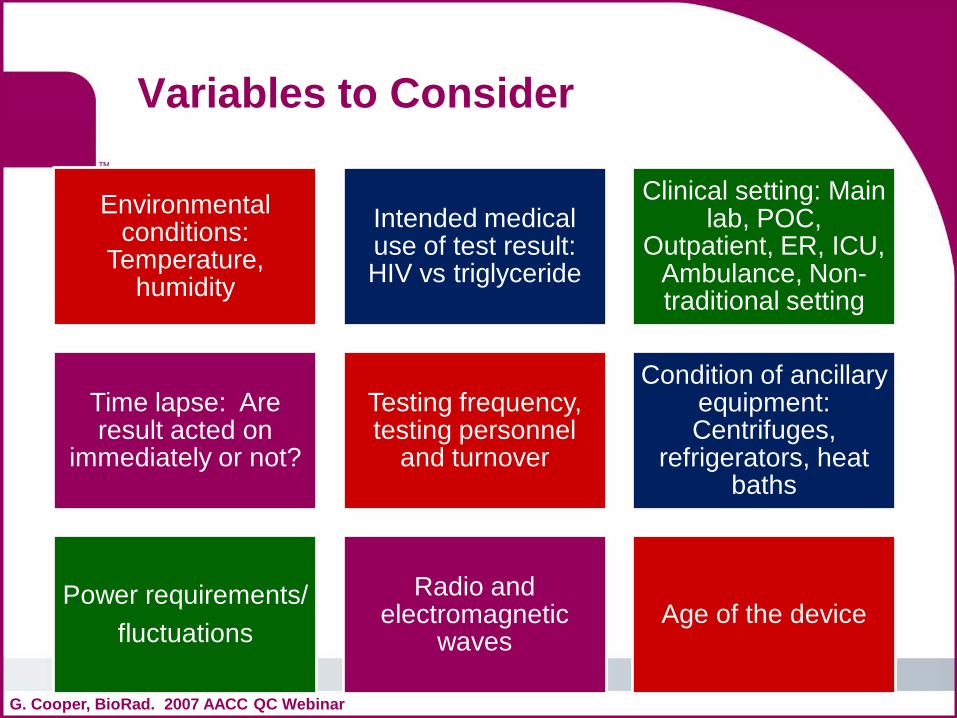
Variables to Consider
G. Cooper, BioRad. 2007 AACC QC Webinar
Environmental conditions:
Temperature, humidity
Intended medical use of test result: HIV vs triglyceride
Clinical setting: Main lab, POC,
Outpatient, ER, ICU, Ambulance, Non-traditional setting
Time lapse: Are result acted on
immediately or not?
Testing frequency, testing personnel
and turnover
Condition of ancillary equipment: Centrifuges,
refrigerators, heat baths
Power requirements/ fluctuations
Radio and electromagnetic
waves Age of the device
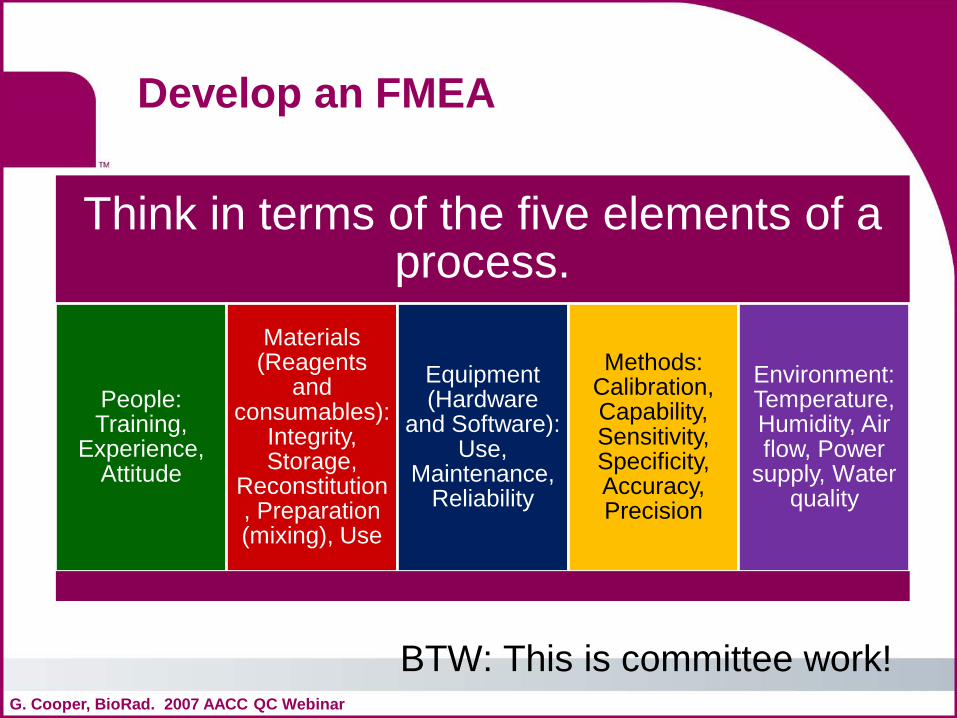
Develop an FMEA
BTW: This is committee work! G. Cooper, BioRad. 2007 AACC QC Webinar
Think in terms of the five elements of a process.
People: Training,
Experience, Attitude
Materials (Reagents
and consumables):
Integrity, Storage,
Reconstitution, Preparation (mixing), Use
Equipment (Hardware
and Software): Use,
Maintenance, Reliability
Methods: Calibration, Capability, Sensitivity, Specificity, Accuracy, Precision
Environment: Temperature, Humidity, Air flow, Power
supply, Water quality

Package Insert
Vendor Output
Regulatory Requirements
Clinical Requirements
Lab Information
Risk Analysis
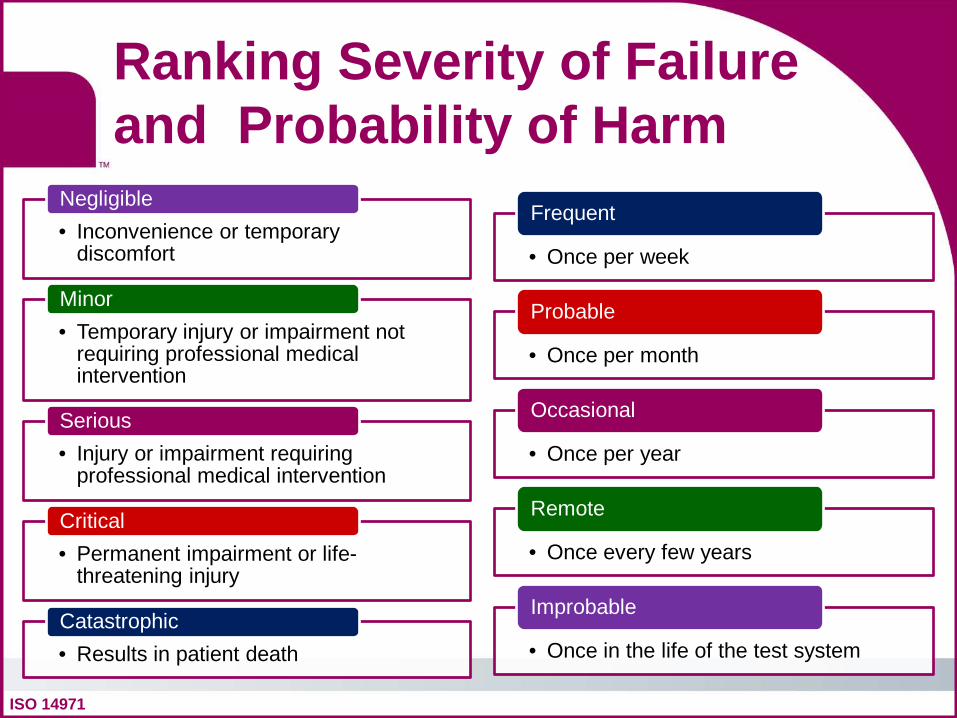
Ranking Severity of Failure and Probability of Harm
ISO 14971
• Inconvenience or temporary discomfort
Negligible
• Temporary injury or impairment not requiring professional medical intervention
Minor
• Injury or impairment requiring professional medical intervention
Serious
• Permanent impairment or life-threatening injury
Critical
• Results in patient death Catastrophic
• Once per week
Frequent
• Once per month
Probable
• Once per year
Occasional
• Once every few years
Remote
• Once in the life of the test system
Improbable
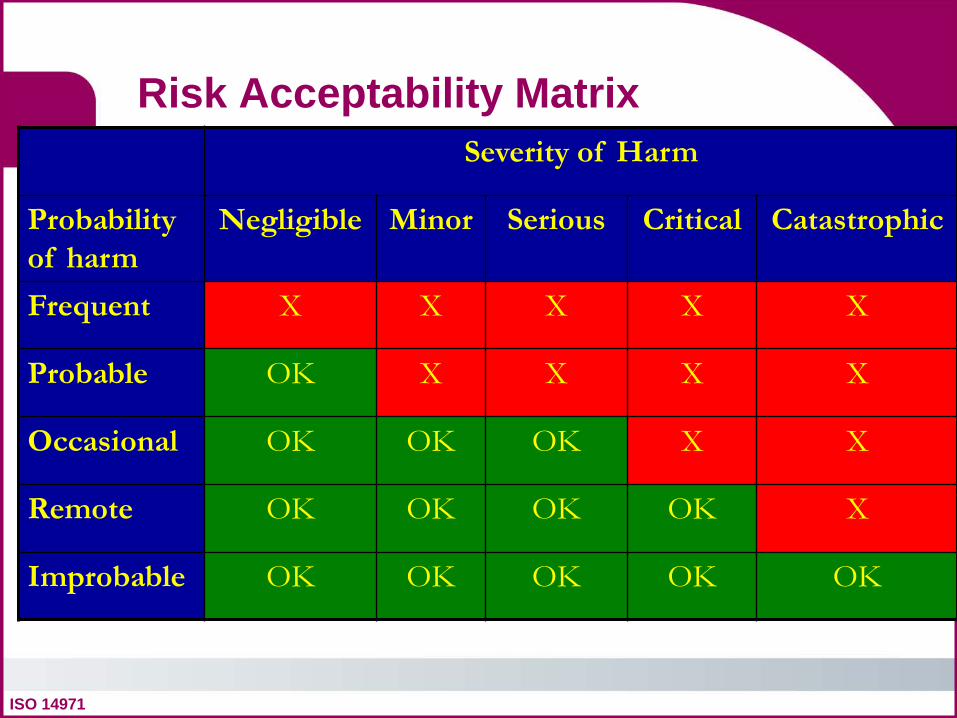
Risk Acceptability Matrix Severity of Harm
Probability of harm
Negligible Minor Serious Critical Catastrophic
Frequent X X X X X
Probable OK X X X X
Occasional OK OK OK X X
Remote OK OK OK OK X
Improbable OK OK OK OK OK
ISO 14971

Process Severity Evaluation Criteria
Effect Severity of effect Ranking
Hazardous, without warning Hazardous, with warning Very High High Moderate Low Very Low Minor Very Minor None
May endanger patient. Involves non-compliance with gov’t. regulation without warning. Same as above only with warning
Major injury to patient requiring emergency intervention
Minor injury to patient; patient dissatisfied Results acceptable; not cosmetically satisfactory 100% of results may have to be retested; some patient dissatisfaction Timing/efficiency defects noticed by most users Same as above, but, defect noticed by average user Same as above, but, defect noticed only by the discriminating user No effect
10 9 8 7 6 5 4 3 2 1
Adapted from Quality Support Group, Inc
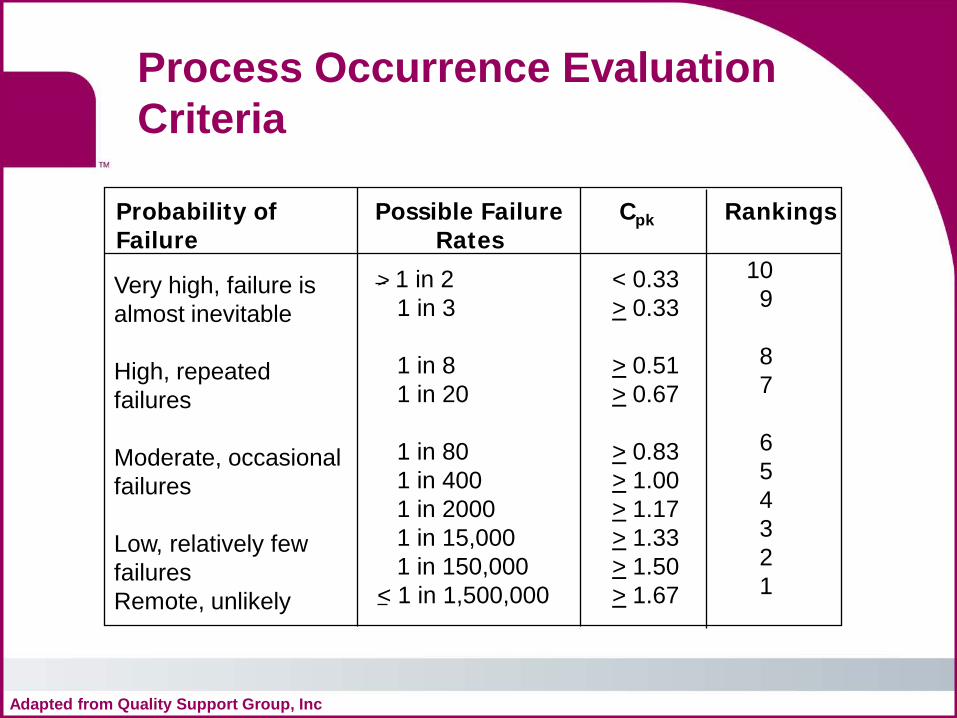
Process Occurrence Evaluation Criteria
Probability of Possible Failure Cpk Rankings Failure Rates
Very high, failure is almost inevitable High, repeated failures Moderate, occasional failures Low, relatively few failures Remote, unlikely
> 1 in 2 1 in 3 1 in 8 1 in 20 1 in 80 1 in 400 1 in 2000 1 in 15,000 1 in 150,000 < 1 in 1,500,000
< 0.33 > 0.33 > 0.51 > 0.67 > 0.83 > 1.00 > 1.17 > 1.33 > 1.50 > 1.67
10 9 8 7 6 5 4 3 2 1
Adapted from Quality Support Group, Inc
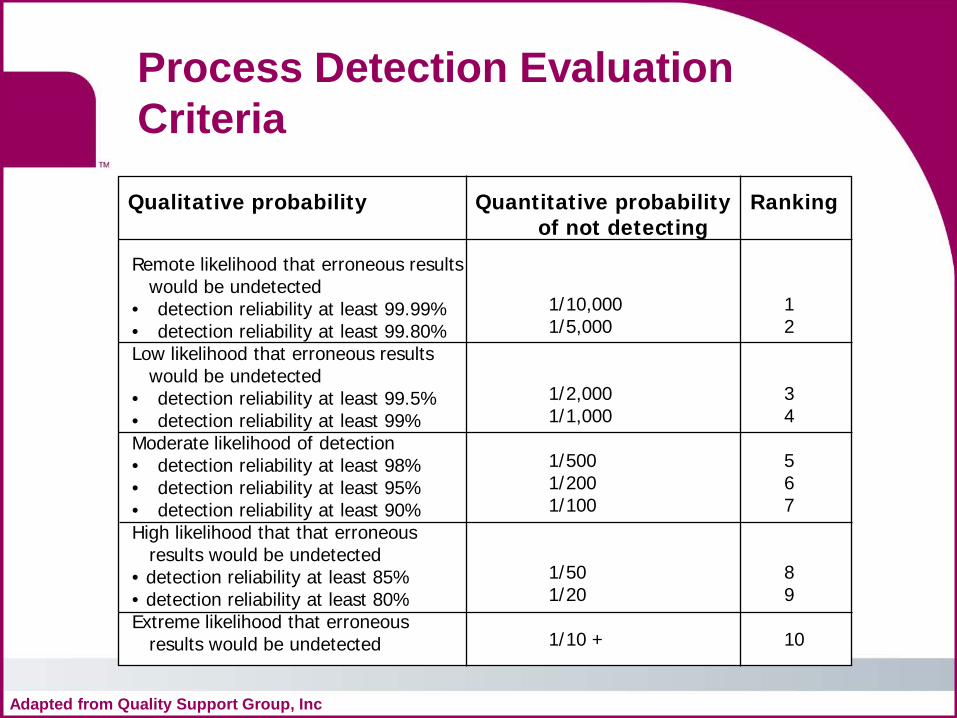
Process Detection Evaluation Criteria
Qualitative probability Quantitative probability Ranking of not detecting
Remote likelihood that erroneous results would be undetected • detection reliability at least 99.99% • detection reliability at least 99.80% Low likelihood that erroneous results would be undetected • detection reliability at least 99.5% • detection reliability at least 99% Moderate likelihood of detection • detection reliability at least 98% • detection reliability at least 95% • detection reliability at least 90% High likelihood that that erroneous results would be undetected • detection reliability at least 85% • detection reliability at least 80% Extreme likelihood that erroneous results would be undetected
1/10,000 1/5,000 1/2,000 1/1,000 1/500 1/200 1/100 1/50 1/20 1/10 +
1 2 3 4 5 6 7 8 9 10
Adapted from Quality Support Group, Inc
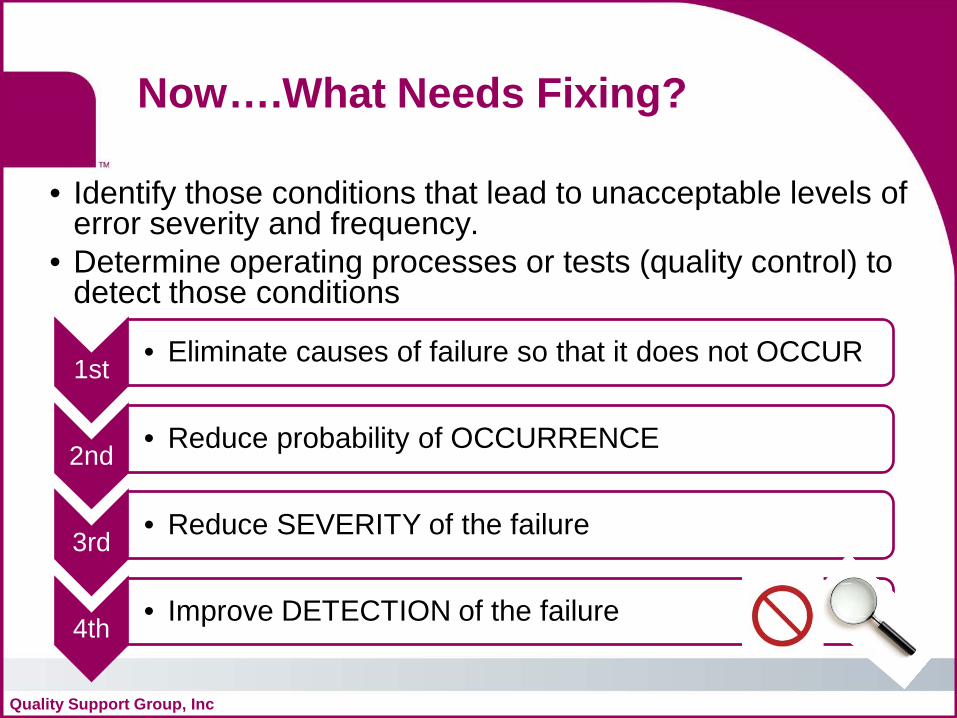
Now….What Needs Fixing?
• Identify those conditions that lead to unacceptable levels of error severity and frequency.
• Determine operating processes or tests (quality control) to detect those conditions
Quality Support Group, Inc
1st • Eliminate causes of failure so that it does not OCCUR
2nd • Reduce probability of OCCURRENCE
3rd • Reduce SEVERITY of the failure
4th • Improve DETECTION of the failure

As a Result You Will
Take action on those items designated as
high risk G. Cooper, BioRad. 2007 AACC QC Webinar
Identify each component and its function
Identify the potential failure mode for each
component
Identify the potential effect(s) of the failure
and rate the severity of each
Identify the potential causes of the failure and
rate the occurrence of each
Identify the current control for each
occurrence and rate the detection capability
Calculate the RPN for each item
Rank RPNs from highest to lowest
Do This!!!
Life-Cycle Risk Management Process
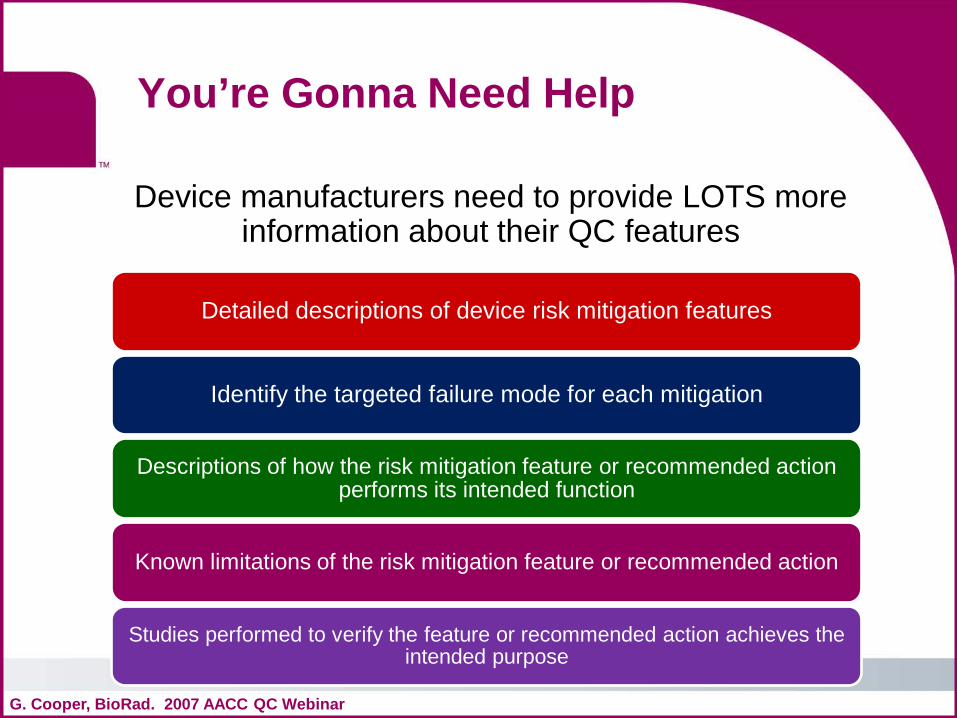
You’re Gonna Need Help
Device manufacturers need to provide LOTS more information about their QC features
G. Cooper, BioRad. 2007 AACC QC Webinar
Detailed descriptions of device risk mitigation features
Identify the targeted failure mode for each mitigation
Descriptions of how the risk mitigation feature or recommended action performs its intended function
Known limitations of the risk mitigation feature or recommended action
Studies performed to verify the feature or recommended action achieves the intended purpose
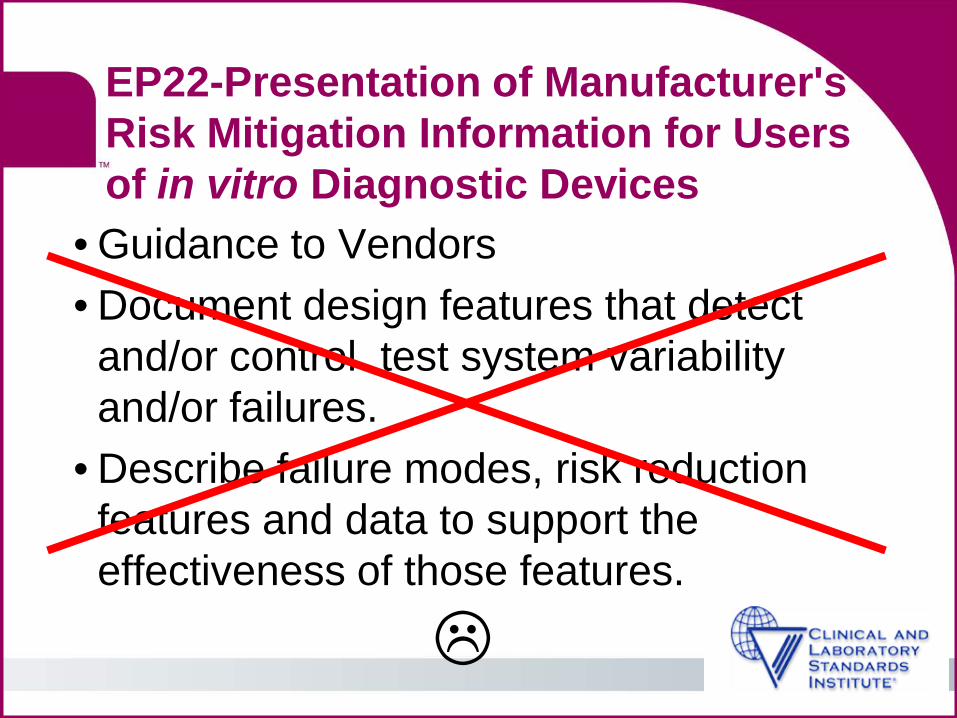
EP22-Presentation of Manufacturer's Risk Mitigation Information for Users of in vitro Diagnostic Devices
• Guidance to Vendors • Document design features that detect
and/or control test system variability and/or failures.
• Describe failure modes, risk reduction features and data to support the effectiveness of those features.
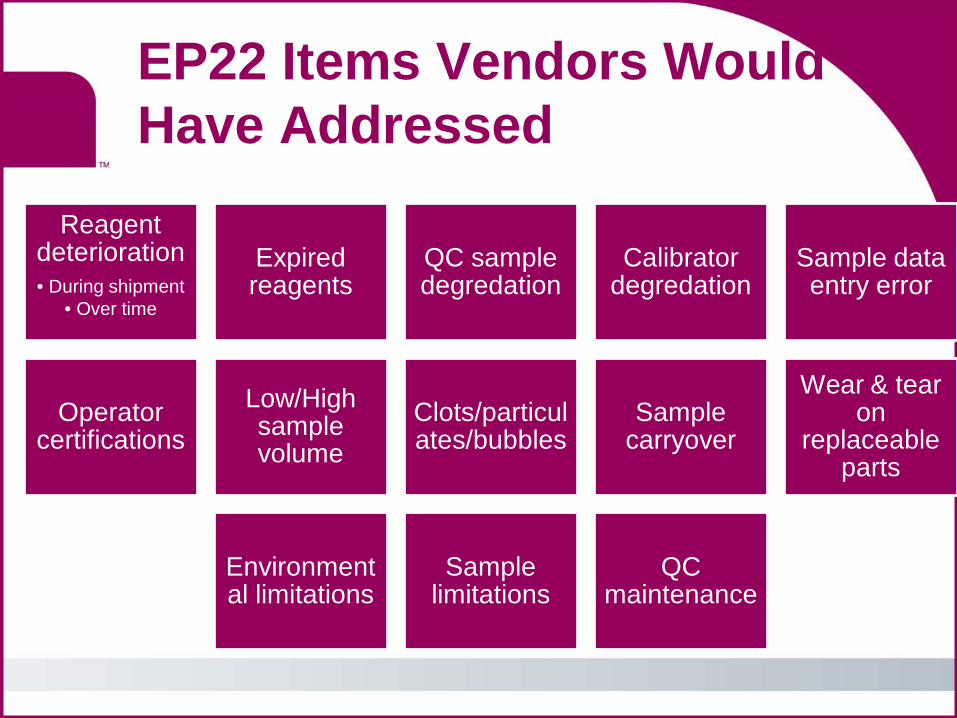
EP22 Items Vendors Would Have Addressed
Reagent deterioration • During shipment
• Over time
Expired reagents
QC sample degredation
Calibrator degredation
Sample data entry error
Operator certifications
Low/High sample volume
Clots/particulates/bubbles
Sample carryover
Wear & tear on
replaceable parts
Environmental limitations
Sample limitations
QC maintenance
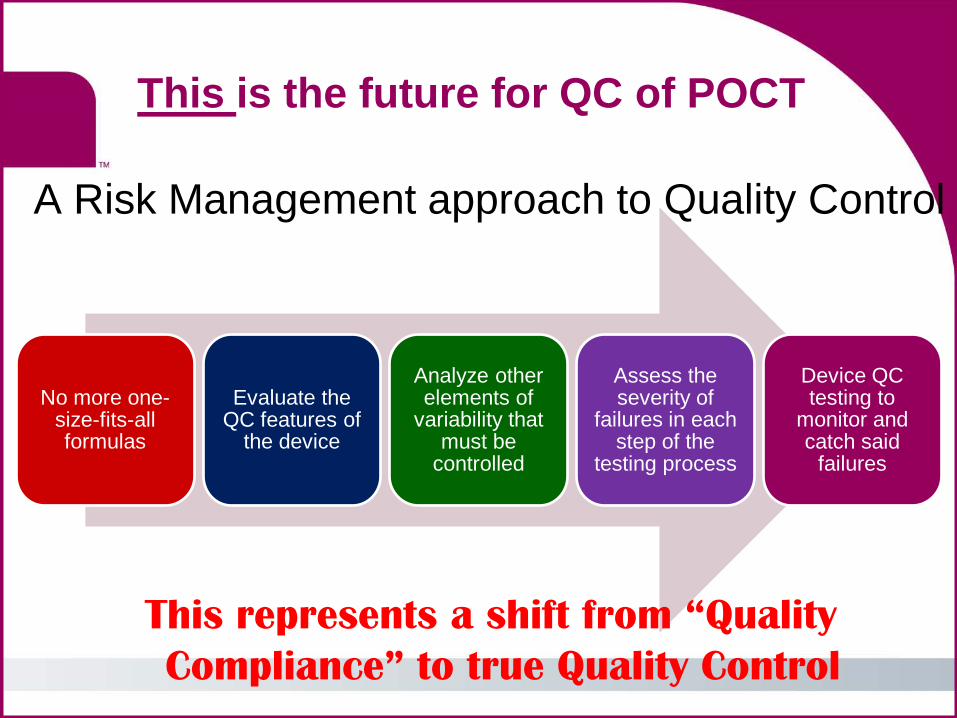
This is the future for QC of POCT
A Risk Management approach to Quality Control
No more one-size-fits-all formulas
Evaluate the QC features of
the device
Analyze other elements of
variability that must be
controlled
Assess the severity of
failures in each step of the
testing process
Device QC testing to
monitor and catch said
failures
This represents a shift from “Quality Compliance” to true Quality Control
A Show of Hands
EP23
EQC
IQCPs

Questions?
Thank You!
Today is the youngest you’ll be for the rest of your life. Act like it.