the political economy of community solar: lessons … politic… · not for citation; comments...
TRANSCRIPT

DRAFT: September 4, 2017
Not for Citation; Comments Welcome
We thank seminar participants at the University of Minnesota and Florida State University for comments and
suggestions. This work has been supported by NSF SRN Grant No. 1444745, the University of Minnesota Center
for Urban and Regional Affairs’ Faculty Interactive Research Program, and University of Minnesota’s Office of
the Vice President for Research’s Grant-in-Aid of Research, Artistry, and Scholarship.
The Political Economy of Community Solar: Lessons from Minnesota
Gabriel Chan1,*
, Matthew Grimley2, Ben Ihde
2, Isaac Evans
2
1 Assistant Professor, Humphrey School of Public Affairs, University of Minnesota
2 M.S. Candidate, Humphrey School of Public Affairs, University of Minnesota
3 M.P.P. Candidate, Humphrey School of Public Affairs, University of Minnesota
* Corresponding Author: [email protected]; 612-626-3292
Humphrey School of Public Affairs, University of Minnesota, 301 19th Ave S, Minneapolis, MN 55455
Abstract
Solar energy is rapidly growing in the United States due to declining costs and favorable policy
incentives at the national, state, and local levels. However, many household and business
electricity consumers do not have access to solar energy due to a lack of appropriate or available
rooftop space and financing constraints. To broaden access to solar energy, fifteen states (and the
District of Columbia) along with an increasing number of electric utilities, have developed
policies to incentivize community solar programs. Traditionally, solar energy requires either
centralized planning for large, utility-scale project development or for customers to own or
finance single solar projects located on their own property. In contrast to traditional models, new
community solar programs allow multiple electricity consumers, often in close geographic
proximity, to collectively finance a single offsite centralized solar project by purchasing shares or
subscriptions to power generated by the project. Participants who finance the development of a
community solar project receive bill credit for electricity generated by their share in the project.
Minnesota has long been on the forefront of community solar. In the early 2010s, several of
Minnesota’s electric cooperatives and municipal utilities adopted community solar programs. In
this paper, we study the diversity in community solar program design and its effects on accessing
the benefits of community. Our study helps illustrate how the implementation of community solar
programs affects performance, offers lessons to better anticipate the potential downfalls in
program design, and identify best practices to enhance equitable access to the market for solar
energy.

Not for Citation; Comments Welcome
2
1. Introduction
The challenges associated with broadening access to technology in the transition to sustainability is a growing
area of scholarship (Anadon et al., 2016). Within this field, the rapid deployment of solar energy is seen as a key
strategy to mitigate climate change and reduce other environmental impacts of energy use (IEA, 2016). In the
United States, solar energy adoption is growing rapidly, but as of 2015, solar comprised less than 1% of national
electricity generation (EIA, 2017). Solar energy’s growth is also constrained; in the United States, half of
residential and commercial electricity consumers lack the onsite space to install solar panels (Feldman et al.,
2015). Even fewer consumers can support the high upfront finance requirements of solar, despite declining costs
and favorable national, state, and local policies (Asmus, 2008).
2. Community Solar
Innovation in “finance and business solutions to expand access to capital” is a major focus of public policies to
address the non-hardware costs1 of installing solar power (U.S. Department of Energy, n.d.). One promising
approach to addressing solar energy’s financing challenges are community solar programs, now adopted in 15
states (and the District of Columbia), along with an increasing number of electric utilities. Traditionally, solar
energy requires either centralized planning for large, utility-scale project development or for customers to own or
finance single solar projects located on their own property. In contrast to traditional models, new community solar
programs allow multiple electricity consumers, often in close geographic proximity, to collectively finance a
single offsite centralized solar project by purchasing shares or subscriptions to power generated by the project.
Participants who finance the development of a community solar project receive bill credit for electricity generated
by their share in the project. By expanding the market in this way, community solar programs potentially double
the number of customers who can access solar energy (Feldman et al., 2015).
Community solar programs offer several streams of potential benefits. First, community solar projects can lower
average costs of solar energy by capturing economies of scale relative to rooftop installations. Second, because
they pool together many consumers, community solar programs are amenable to affordable finance models
(Funkhouser et al., 2015; Interstate Renewable Energy Council, 2016a), thereby creating the potential to address
existing inequities in the energy system (Granqvist and Grover, 2016; Rule, 2014). Finally, community solar
programs may provide unique opportunities for community-level mobilization of resources (Walker et al., 2007),
which could enable niche-level technology adoption as part of a larger-scale energy transition (Geels, 2002).
Increasing public resources at the federal and state level are being dedicated to accelerating these programs (U.S.
Department of Energy, n.d.). As a relatively new area of practice, community solar programs have been studied in
only very limited fashion in the scholarly literature (Chang et al., 2017; Funkhouser et al., 2015). As states and
businesses consider adopting or reforming community solar programs, it is critical to build on the experience of
the 15 states (and even more utilities) who have been early adopters. Yet no two community solar programs are
identical (Coalition for Community Solar Access, 2016; Interstate Renewable Energy Council, 2016b). It is likely
that how these programs are designed and implemented impact the pace and scale of community solar
development as well as the fairness of how energy consumers participate.
As states continue to grapple with how best to deploy solar to maximize clean energy growth, and overcome the
high upfront costs inherent in renewable energy development, community solar has emerged as a promising
alternative financing model. In contrast to traditional models, community solar programs allow multiple
electricity consumers, often in close geographic proximity, to collectively finance a single offsite centralized solar
project by purchasing shares or subscriptions to power generated by the project. Participants who finance the
1 The U.S. Department of Energy estimates that the non-hardware costs, or “soft” costs, comprise 64% of the total installation cost of a new
solar power system (U.S. Department of Energy, n.d.).

Not for Citation; Comments Welcome
3
development of a community solar project receive bill credit for electricity generated by their share in the project
(Chwastyk and Sterling, 2015; National Renewable Energy Laboratory, 2014).
Figure 1. Schematic of arrangements between solar garden developers, solar garden subscribers, and the
electric utility in Minnesota’s community solar garden program in Xcel Energy’s territory. Reproduced
from Schaffer, 2015 (Schaffer, 2015).
2.1. The rationale for community solar
Community solar program design can vary significantly across states and electric utilities, but are generally
supported for their potential to increase the rate of solar deployment and make the opportunity to finance solar
energy more affordable and accessible (Chwastyk and Sterling, 2015; National Renewable Energy Laboratory,
2014). Community solar projects can lower average costs of solar energy by capturing economies of scale relative
to rooftop installations (National Renewable Energy Laboratory, 2014). Second, because they pool together many
consumers, community solar programs are amenable to affordable finance models, thereby creating the potential
to address existing inequities in the energy system for customers who are prevented from having their own
systems due to lack of credit (Funkhouser et al., 2015; National Renewable Energy Laboratory, 2014; Stanton and
Kline, 2016). Finally, community solar programs may provide unique opportunities for community-level
mobilization of resources (Schroeder McConnell et al., 2016), which could enable niche-level technology
adoption as part of a larger-scale energy transition (Geels and Schot, 2010).
One major benefit to community solar programs for consumers is that it increases access of solar energy for
customers who do not have appropriate rooftop space or could not otherwise benefit from residential distributed
solar generation (Chwastyk and Sterling, 2015; Funkhouser et al., 2015; National Renewable Energy Laboratory,
2014). If the program is designed with consumer incentives like fixed solar rates, shared investment returns, or
per unit bill credits that are greater than the per unit cost of the community solar subscription customers are paid
over time rather than paying a premium for solar energy (Funkhouser et al., 2015; Stanton and Kline, 2016). This
can stabilize the rate the customer pays for electricity while offering potential bill savings (National Renewable
Energy Laboratory, 2014).
For a utility, increased residential solar penetration threatens to disrupt the traditional utility-customer
relationship. Community solar on the other hand has the potential to improve the utility-customer relationship,
and give the utility more control over new distributed generation projects (Chwastyk and Sterling, 2015;
Funkhouser et al., 2015; National Renewable Energy Laboratory, 2014; Stanton and Kline, 2016). Improved
relationships come with the added benefit that demand continues to pass through the utility when the CSGs are
utility owned, thus stabilizing revenues. Depending on the state, utilities may also benefit from being able to retire

Not for Citation; Comments Welcome
4
RECs generated from community solar projects towards a RPS (National Renewable Energy Laboratory, 2014).
However, these benefits vary by utility type and severely diminish under third-party led community solar garden
programs. These “special purpose entity” designed programs are typical only in partnerships with investor owned
utilities (IOUs) (Funkhouser et al., 2015). Utilities may also encounter greater financial burden dealing with the
billing mechanism (Chwastyk and Sterling, 2015).
In general, community solar programs aim to achieve two related objectives: (a) increasing the overall level of
solar energy deployment, and (b) broadening who has access to the benefits of adopting solar energy (Chwastyk
and Sterling, 2015; Funkhouser et al., 2015). However, given the flexibility of program design options and
ensuing variety, not all programs have delivered on their potential and it is likely that how these programs are
designed and implemented impact the pace and scale of community solar development as well as the
characteristics of the consumers that participate. For this reason, it is important to take into consideration different
contexts, design elements, and policy barriers to creating an effective community solar program.
Figure 2. Estimated technical potential of community solar (National Renewable Energy Laboratory,
2014).
2.2. Community solar program design
Much of the current literature classifies the most important differences in program design across the many
community solar projects and utility types. When programs are designed by a state legislature each state program
defines who are the participants, what the customer reimbursement will be, subscription terms, and other program
limits (Trabish, 2017). Therefore, it is pertinent to take into account the different program design options while
evaluating community solar programs.
The Solar Electric Power Association (SEPA) highlights the twelve different design decisions a program must
take into account: customer offer, economic proposition, one-time sign-up fee, REC treatment, siting and scale,
usage participation limit, capacity participation limit, production guarantees, minimum terms, program length,
subscription transfers, and what to do with the unsubscribed energy (Chwastyk and Sterling, 2015). A recent
Princeton report reiterates many of these characteristics but simplifies the list into nine distinct topics: (1) Rate
Design, (2) Financing, (3) Grid Integration, (4) Siting and Permitting, (Timilsina et al., 2012) Project Size and
Capacity, (6) Subscription Structure, (7) Developer Application Process, (8) Community Engagement and
Education, and (9) Ensuring Widespread Access (Chang et al., 2017). The last category recognizes the possibility
of facilitating LMI subscriber participation in shared solar projects as in the case of Colorado’s program statute
(National Renewable Energy Laboratory, 2014; Stanton and Kline, 2016). Lastly, an increasingly important
Not for Citation; Comments Welcome
5
design consideration is consumer protections, education, and disclosure. These provisions help potential
subscribers acquire all of the facts necessary to weigh their options effectively (Stanton and Kline, 2016).
Rate design and the customer offer are arguably the most essential aspects of designing an effective community
solar program. Many of the financial benefits to consumers outlined above, and the incentives for developers in
third-party led utility programs stem from having a rate that credits subscribers appropriately for their share of the
electricity. The rate the subscriber pays must be lower than the rate that they credited in order for the participant
to benefit in the form of bill savings (Stanton and Kline, 2016). The most common ways of crediting community
solar are virtual net metering and value of solar (Chang et al., 2017; Funkhouser et al., 2015; National Renewable
Energy Laboratory, 2014). A stable and appropriately drafted bill credit rate and transparency of development can
also lower the financial risk that financiers may see with community solar by increasing the predictability of
returns (Chang et al., 2017).
The choice of ownership and price to participate can also dramatically affect participation in community solar
programs. What SEPA refers to as “economic decisions” deal with whether the customer must pay for their
subscription up front or overtime, whether there is a bill credit or line item (on bill) payment, and if there is a
refundable down payment to sign up or not (Chwastyk and Sterling, 2015). If the up-front financing costs are too
high, or the relationship between monthly payments and expected monthly credits is not balanced correctly LMI
customers may find it particularly difficult to purchase a share of a community solar garden (Stanton and Kline,
2016). For these reasons, pay as you go has been viewed by some developers as easier to set up since it is easier to
get customers relative to paying up-front (Trabish, 2017).
Other design features that are considered are cap on total program size, and the amount of capacity or percentage
of a solar project that an individual subscriber can purchase or subscribe to (Chwastyk and Sterling, 2015;
National Renewable Energy Laboratory, 2014). SEPA discusses participation limits in terms of usage and
capacity limits that have been implemented to ensure that multiple subscribers can benefit from one community
solar project. Usage limits cap subscription levels to a given percent of a customer’s average annual power usage,
and range from 50% to 120%. Capacity limits on the other hand restrict the total number of panels that a single
subscriber can purchase (Chwastyk and Sterling, 2015). Both forms of participation restrictions attempt to ensure
that one subscriber who uses a lot of power, like a large company, cannot subscribe to the entirety of a project.
A final aspect of community solar program design that has garnered much attention in the literature is the
uncertainty of interconnection and customer acquisition. The relative opaqueness, cost, and length of the siting
and interconnection process can increase the uncertainty for developers and financiers, and slow the speed of
program rollout. States that have caps on net metering project sizes in addition to limits on how much energy
production can be credited also, “increase the risk and may slow or halt solar project development”, if developers
are uncertain about whether or not their development will qualify (National Renewable Energy Laboratory, 2014).
In terms of customer acquisition, reports have pointed to a tradeoff between the number of subscribers needed to
fully subscribe a shared solar project and risk of under subscription (Chwastyk and Sterling, 2015). In order to
counter some of this risk many programs, especially in immature markets, have opted for contract lengths
between 20 and 25 years, despite customer preferences being between 5 and 10 years (Chwastyk and Sterling,
2015; Stanton and Kline, 2016; Trabish, 2017). Customers may balk at such long commitments if appropriate and
easy transfer options are not in place.
Even if every aspect of program design is considered in the creation or evaluation of a community solar program,
one must recognize that each of the decisions, “is made within the context of the greater regulatory and utility
regime, and can affect one another” (Chwastyk and Sterling, 2015).
2.3. The utility context for community solar

Not for Citation; Comments Welcome
6
Variety in program design presents additional challenges when trying to create cross-program comparisons
between community solar models. Typically, one could examine if the array is, “fully subscribed, if the program
returns value to all ratepayers in an economically balanced and equitable manner, and if the subscribers are
satisfied with the program” (Chwastyk and Sterling, 2015). However, program designers must also take into
account the utility structure in every context where community solar operates. Community solar is inherently
flexible since it must operate within different utility-business models that attract different community solar
models, and therefore offer different benefits to the utility and customer (Funkhouser et al., 2015; Trabish, 2017).
The most common differentiation in the literature is between utility-led and third party-led programs (Coughlin et
al., 2011).
In utility administered programs the utility is in charge of every aspect of community solar construction,
interconnection, design (subject to constraints by the legislature), operation, and billing. These programs are more
likely to occur in vertically integrated, regulated utilities than in deregulated states (Stanton and Kline, 2016).
Smaller municipal utilities (MUNIs), and electric cooperatives generally begin their foray into community solar
through programs of less than 500 kW, and contract out specific support services (billing, operations,
maintenance) (Chwastyk and Sterling, 2015). In Minnesota, electric cooperatives were the early adopters of
community solar, and offer a combination of up-front and pay-as-you-go payment options. Larger investor owned
utilities (IOUs) may begin with a pilot program but generally have larger programs of over 20 MW (Chwastyk
and Sterling, 2015). Finally, utility-led programs tend to use virtual net metering where the participant receives a
credit for their portion of the solar project (Coughlin et al., 2011).
As already explored above, the benefits to utilities in utility-led programs are significant. The utility maintains
control over the distributed generation project, demand continues to pass through the utility, RECs can be retired
against the utility’s RPS where applicable, and the utility can improve relations with its ratepayers (Funkhouser et
al., 2015; National Renewable Energy Laboratory, 2014). The utility would also qualify for rebates, incentives,
and modified accelerated cost recovery to buy down the costs of developing the community solar project. These
benefits could be indirectly passed on to participants since any participant would not qualify for many of the tax
credits available (Coughlin et al., 2011).
In third party or special purpose entity (SPE) programs community solar project developers partner with utilities
to develop, manage, and maintain the solar array, assigns kWh to utility accounts, or sells their electricity to the
utility through a PPA (Chwastyk and Sterling, 2015; Coughlin et al., 2011). The utility is charged with facilitating
the billing, interconnection, and management of the distribution system (Trabish, 2017). These programs
proliferate in regulated states with larger IOUs and shared solar policies as in Colorado and Minnesota. Nonprofit
third party community solar developments have also emerged where the project is wholly owned by the
subscribers. Though few in number they have been successful in developing community solar models that include
low and moderate income subscribers (Chwastyk and Sterling, 2015).
As opposed to utility-led programs, third party programs diminish the value to the utility that administers the
program. The utility either signs a PPA with a special purpose entity, or works with a developer by administering
the program (Chwastyk and Sterling, 2015; Coughlin et al., 2011). In both cases the utility does not own the solar
array. This is an important consideration when creating a program given the extent to which the utility could resist
such infringements into its territory by third party developers. Additional legislation may be required to facilitate
such development (Stanton and Kline, 2016). Finally, third party-led programs may still qualify for rebates,
incentives, and MACRS that can be retained by the developer, or once again passed onto participants indirectly
(Coughlin et al., 2011).
2.4. Access and equity in community solar
At the center of community solar is access for those without an adequate roof or finances. The definitions of
“access,” however, vary across jurisdictions. It can mean access to electricity where there wasn’t any before;
Not for Citation; Comments Welcome
7
access to ownership of renewable energy credits; access to the opportunity of owning solar; and access to the
financial benefits of owning solar.
There is also the issue of fairness, raised broadly, that low- to moderate-income (LMI) customers should have
access to the shared financial benefits of building new renewable energy infrastructure (Hoffman and High-
Pippert, n.d.). Research has found that median energy expenditures for low-income customers can account for
more than five percent of income in many major metro regions across the United States (Drehobl and Ross,
2016). Other research has found that electricity expenditures account for 9.92 percent of income for the lowest
quintile of earners (Sabol, 2016).
Community solar, in centralizing maintenance and finance to an offsite array, perceivably could mitigate risk and
costs for LMI customers. Using different financing structures, hybridized contracts, and recruiting different
subscriber types, community solar projects could spread financial risk more evenly among its subscribers
(Schroeder McConnell et al., 2016).
Amid growing interest in LMI customers, organizations such as the Interstate Renewable Energy Council (IREC)
have released policy recommendations to better include LMI customers in shared renewable energy projects,
though there are relatively few concrete examples of programs that target LMI customers (Schroeder McConnell
et al., 2016). IREC considers the importance of specificity in definitions of who LMI customers are and
programmatic structures, what financing mechanisms they should have access to, and what percentage of total
community solar garden capacity they should have subscription to.
Political power dynamics continue to play a role in community solar offerings, as the utility may seek us
community to maintain a current utility-customer financial relationship and a predictable return for their investors,
or a third-party may seek to weaken that same relationship (Funkhouser et al., 2015; Granqvist and Grover, 2016;
Rule, 2014). Further erosion of the utility rate-base by customer self-supplying electricity has led to worries over
the “utility death spiral,” where the utility collects less revenue, drives up rates, inducing more customers to self-
supply their energy, thereby exacerbating the cycle.
Debates over the fairness and potential cross-subsidies of solar net metering programs have also spilled into
community solar programs. Here, low-income customers are said to subsidize higher-income customers who have
the money or means to buy solar panels. Yet as one study determined for one hypothetical Southwestern electric
utility, federal subsidies for the low-income energy expenditures remain much higher than the potential rate
impacts of solar at even 10 percent of demand, where net-metered solar was predicted to increase rates by only
2.5 percent (Rule, 2014).
Who pays for what can be determined through multiple perspectives of fairness, whether the payer for clean
energy infrastructure be the polluter for his or her current pollution levels; the polluter for past and current
pollution levels; the beneficiary of pollution; or simply those who have the most means to pay for pollution
(Granqvist and Grover, 2016). In the electric grid where numerous cross-subsidies are incorporated to traditional
rate structures, distributive fairness can be examined in added contexts of energy security and economic
development.
In Minnesota’s community solar program, fairness is one of the main lenses in which the program was promoted
(Hoffman and High-Pippert, n.d.). Xcel Energy, a regulated vertical monopoly, had little to no solar in its
territory. Seeking to promote solar growth and a German-like energy transition, state legislators approved a
community solar program in 2013 with reimbursement through the Applicable Retail Rate, similar to Germany’s
feed-in tariff, which would over time transition to the Value of Solar rate, an avoided cost formula which adds in
the environmental benefits of supply solar to the grid.
The program was intended to be small, but the high reimbursement rate combined with fuzzy program
requirements led to an outpouring of applications for community solar gardens, more than 100-times the state’s
previous solar capacity. Rather than being subscribed to by mostly residents and plotted mostly within

Not for Citation; Comments Welcome
8
communities, most solar garden capacity remains taken up by large electricity users, and most solar gardens are
built in the country, away from towns and cities, according to anecdotal and early evidence from the utilities
commission.
Though adders to the Value of Solar rate are currently being considered for developers who recruit more
residential or LMI customers, current willingness to incorporate LMI customers remains limited to a few
developers who go beyond the minimum community solar program requirements.
2.5. Other interacting policy considerations
Outside of program design considerations, the utility structure, and government incentives and rebates, the
success of any community solar program has been found to depend on the interactions with the wider policy
context in which it operates. One such important prerequisite policy already discussed is virtual net metering.
Virtual net metering is the most common form of billing and reimbursing consumers for their share in a
community solar project (Chang et al., 2017; Funkhouser et al., 2015; National Renewable Energy Laboratory,
2014). Unlike its cousin net energy metering, virtual net metering allows participants in shared solar programs to
receive credit for their portion of off-site generation (National Renewable Energy Laboratory, 2014). Without this
or a similar policy in place states that specify on-site generation only community solar garden subscribers would
not be eligible to receive credit scaled by their portion of the energy. State net metering policy can also place caps
on the total amount of energy that can be credited, creating uncertainty for community solar financiers,
subscribers, and developers (National Renewable Energy Laboratory, 2014).
State and utility interconnection policies that are not overly complex or lengthy is another crucial policy
interaction to consider. Interconnection is “the process by which distributed energy resources are connected to the
electric grid” (Chang et al., 2017). National Renewable Energy Laboratory has emphasized that ensuring
community solar program are not subject to lengthy, uncertain, and complex application and approval process can
reduce risk and speed up roll out of community solar garden programs (National Renewable Energy Laboratory,
2014). Nowhere has this risk been more apparent than in Minnesota where the state’s main utility, Xcel Energy,
was forced to conduct an independent review of its interconnection and engineering review process in the wake of
mounting frustrations over slow program rollout (Denniston, 2016).
The last external policy interaction not yet reviewed is how community solar garden projects and program models
fit in the current rules and regulations about financial securities promulgated by the Securities and Exchange
Commission (SEC). A security is a stock, note, or investment contract, and in the past the SEC has issued a letter
of no action to one model of community solar stating that it did not necessarily provide an expectation of profit
(Feldman et al., 2015). A community solar project can submit a request to the SEC describing the business model
being used and presenting the technical and legal analysis of why the host believes the business model is not a
security (National Renewable Energy Laboratory, 2014). However, if deemed a security the project will require
additional time and accrue more expenses to ensure compliance, and upfront costs that many projects could not
support (Coughlin et al., 2011). On strategy suggested to avoid securities regulation it is suggested that capacity
should not exceed the annual generation of the subscriber by more than 120% since it then may not be deemed an
electric contract anymore since high overproduction and compensation allowances can undercut the argument that
a system electricity generation is designed for personal use (Chwastyk and Sterling, 2015; Feldman et al., 2015).
Another is to ensure that Marketing need to emphasize reducing a customer’s retail electricity bills over making a
profit (Feldman et al., 2015).
2.6. Where is community solar today?
Community solar has expanded significantly and there is now a community solar programs adopted in 15 states
and the District of Columbia. Nine of the fifteen programs (Colorado, Delaware, DC, Illinois, Maryland,
Massachusetts, New York, Rhode Island, and Vermont) were implemented in the context of existing net energy
metering programs, while the rest (California, Connecticut, Hawaii, Maine, Minnesota, New Hampshire, Oregon,

Not for Citation; Comments Welcome
9
and Washington) do not share explicit links between pre-existing net metering policies (Stanton and Kline, 2016).
The vast majority (73%) of the community solar projects in operation offered only upfront payments, while 17%
offered ongoing payments in 2015. In terms of customer payment options, 71% offered bill credits while 29%
provided separate line-item payments (Chwastyk and Sterling, 2015). Most of the community solar programs
created by state legislation establish maximum total community solar capacity limits, maximum capacity limits
for each participating project, minimum numbers of participants in each project, maximum amount of energy to
be generated per participant, and location requirements (Stanton and Kline, 2016).
Figure 3. History of community solar legislation adoption by states (Stanton and Kline, 2016).
3. Community Solar in Minnesota
Minnesota has long been on the forefront of community solar. But its program for the state’s largest utility has
gone through several reforms that have created uncertainty and slowed development. Still, with over 50
megawatts operating by the end of 2016, Minnesota has one of the country’s largest community solar programs in
the country. Beginning with programs in Minnesota, this paper seeks to fill the gap in understanding in how
community solar program design impacts who can access solar energy and the pace and magnitude of new solar
development.
Co-ops and municipal solar programs in Minnesota adopted community solar models in the early 2010s. Inspired
by the success of this program in other Minnesota utilities, and across the country, the Minnesota legislature
ordered the regulated utility Xcel Energy to implement a community solar program in 2013. This program drew
initial applications for over 1.7 gigawatts of photovoltaic capacity, equivalent to more than 100-times the current
annual solar installation in the state. Today, Xcel Energy’s community solar program in Minnesota is one of the
largest in the country. More information on Xcel’s Minnesota community solar program can be found in the
Appendix.
4. Studying Equity in Community Solar

Not for Citation; Comments Welcome
10
Community solar programs aim to achieve two related objectives: (a) increase the overall level of solar energy
deployment, and (b) broaden access to the benefits of adopting solar energy (Feldman et al., 2015). This project
will adopt these two goals as the central dimensions of analysis.
In summary, we propose to assess the following compound hypothesis for the Minnesota community solar
program:
Community solar programs have increased the overall level of solar deployment. However, this increase is
primarily due to favorable financial incentives for project developers. These policies have created financial
benefits for community solar subscribers, but these subscribers are primarily in the highest income brackets due to
restrictive barriers to subscription access. The control of renewable energy assets in community solar projects
resides primarily with large electric utilities that use community solar to achieve a wider array of objectives.
Testing aspects of this hypothesis across the utility territories in Minnesota (and then expanding to other states
with community solar programs) will allow us to compare the validity of the aspects of this hypothesis in relation
to elements of program design to identify best practices.
5. Cross-subsidization to support community solar in Minnesota co-ops
In this section, we present the methodology and results of the first part of our study to assess the degrees of cross-
subsidization resulting from program design decisions in the Minnesota cooperative utilities that have developed
community solar programs.
Over 15 cooperatively owned utilities (co-ops) in Minnesota have developed community solar programs. We
collected project characteristics and subscriptions offers for each of the co-op community solar programs. Project
characteristics included total project size and approximation for project costs based on National Renewable
Energy Lab’s System Advisor Model (NREL, 2017). Subscription offer information includes subscription costs
and terms (e.g. fixed, up-front charges and length of contract). We also collect current (residential) electricity
rates for each co-op.
With this data, we calculate the degree of cross-subsidization between each co-op’s electricity customers to
support the costs of community solar development. In general, cross-subsidization is a major concern throughout
utility-side investments – not just in electricity, but in principle for all forms of large public infrastructure
(Faulhaber, 1975). In electricity, rate cases regularly discuss concerns about cross-subsidization and other forms
of cost pass-through.
Community solar gardens represent a particular kind of utility-side investment. This is because benefits/costs
accrue to two types of demand-side actors: subscribers and nonsubscribers. Understanding of cross-subsidization
is also complicated by the presence of two supply-side actors: utilities and solar developers/owners.
What follows is an analytic frame for understanding cross-subsidization in the context of community solar garden
investment.
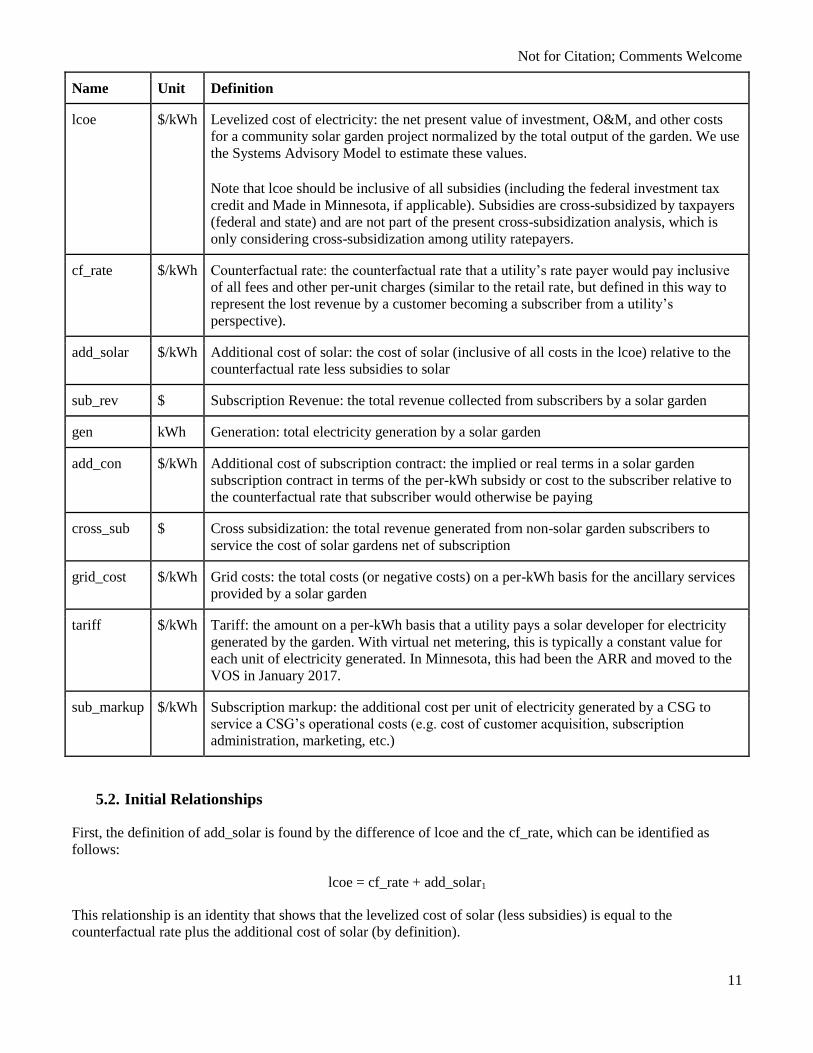
5.1. Variable Definitions
The variables used to investigate cross-subsidization are defined in the table below:
Not for Citation; Comments Welcome
11
Name Unit Definition
lcoe $/kWh Levelized cost of electricity: the net present value of investment, O&M, and other costs
for a community solar garden project normalized by the total output of the garden. We use
the Systems Advisory Model to estimate these values.
Note that lcoe should be inclusive of all subsidies (including the federal investment tax
credit and Made in Minnesota, if applicable). Subsidies are cross-subsidized by taxpayers
(federal and state) and are not part of the present cross-subsidization analysis, which is
only considering cross-subsidization among utility ratepayers.
cf_rate $/kWh Counterfactual rate: the counterfactual rate that a utility’s rate payer would pay inclusive
of all fees and other per-unit charges (similar to the retail rate, but defined in this way to
represent the lost revenue by a customer becoming a subscriber from a utility’s
perspective).
add_solar $/kWh Additional cost of solar: the cost of solar (inclusive of all costs in the lcoe) relative to the
counterfactual rate less subsidies to solar
sub_rev $ Subscription Revenue: the total revenue collected from subscribers by a solar garden
gen kWh Generation: total electricity generation by a solar garden
add_con $/kWh Additional cost of subscription contract: the implied or real terms in a solar garden
subscription contract in terms of the per-kWh subsidy or cost to the subscriber relative to
the counterfactual rate that subscriber would otherwise be paying
cross_sub $ Cross subsidization: the total revenue generated from non-solar garden subscribers to
service the cost of solar gardens net of subscription
grid_cost $/kWh Grid costs: the total costs (or negative costs) on a per-kWh basis for the ancillary services
provided by a solar garden
tariff $/kWh Tariff: the amount on a per-kWh basis that a utility pays a solar developer for electricity
generated by the garden. With virtual net metering, this is typically a constant value for
each unit of electricity generated. In Minnesota, this had been the ARR and moved to the
VOS in January 2017.
sub_markup $/kWh Subscription markup: the additional cost per unit of electricity generated by a CSG to
service a CSG’s operational costs (e.g. cost of customer acquisition, subscription
administration, marketing, etc.)
5.2. Initial Relationships
First, the definition of add_solar is found by the difference of lcoe and the cf_rate, which can be identified as
follows:
lcoe = cf_rate + add_solar1
This relationship is an identity that shows that the levelized cost of solar (less subsidies) is equal to the
counterfactual rate plus the additional cost of solar (by definition).

Not for Citation; Comments Welcome
12
In practice, add_solar may be more usefully calculated by separating out grid_cost, changing this identity so that
the additional cost of solar is net of grid costs/benefits that are external to ratepayers and solar developers.
lcoe = cf_rate + add_solar + grid_cost
Second, there is a relationship between subscription revenue and rates:
sub_rev/gen = cf_rate + add_con
This relationship shows that the per-unit of generation revenue from subscriptions (from the point of view of
developers) is equal to the per-unit revenue from electricity generation and the additional revenue from
subscription contracts. There is an implicit assumption in here that the contract terms all have a built-in (virtual)
net metering provision where electricity purchased (indirectly) through CSG subscriptions are virtually net
metered by the utility.
Third, the cf_rate has several sub components:
cf_rate1 = wholesale_rate
cf_rate2 = wholesale_rate + markup1
cf_rate3 = wholesale_rate + markup1 + markup2
cf_rate4 = wholesale_rate + markup1 + markup2 + markup3
This decomposition of the cf_rate illustrates the complexity of rate design in electricity markets. Here the
sequential markups represent: (1) the wholesale rate, (2) the average revenue rate (wholesale_rate + markup1), (3)
the retail rate (wholesale_rate + markup1 + markup2), and (4) the retail rate net of fixed charges for renewable
energy wholesale_rate + markup1 + markup2 + markup3.
For the purposes of understanding the counterfactual rate for solar gardens, the relevant counterfactual is the one
representing the revenue that a utility loses as a result of a utility customer becoming a CSG subscriber. In the
presence of virtual net metering, the relevant counterfactual is cf_rate3. The relevant counterfactual might
change, if for example, one were to use the cross-subsidization analysis framework below for a utility-scale solar
project (where power generation offsets electricity on the wholesale market).
Fourth, in principle, the tariffs paid to developers can be thought of as:
tariff = cf_rate + sub_rev / gen
This relationship implies that developers are able to fully pass through the difference between tariffs and the
counterfactual rates to subscribers. In reality, there may be operational costs, so that more accurately, this
relationship is:
tariff = cf_rate + sub_rev / gen + sub_markup
sub_markup includes, but is not limited to, factors such as customer acquisition, subscription administration, and
marketing costs.
5.3. Cross-Subsidization Analysis
With the assumption of zero profits, we can equate total costs and revenues in the system (from the perspective of
the developer). This assumption is reasonable given the competitive environment in CSG subscription offers.

Not for Citation; Comments Welcome
13
Total cost in the system is the sum of the solar garden project development and cost of servicing contracts.
Total revenue in the system is the sum of total electricity sales to subscribing customers (on the retail market) and
cross-subsidization from nonsubscribers. This is expressed as follows:
tariff * gen + grid_costs * gen = cf_rate * gen + cross_sub
Rearranging:
cross_sub = tariff * gen + grid_costs * gen + - cf_rate * gen
cross_sub / gen = tariff + grid_costs - cf_rate
Substituting for tariff cancels cf_rate:
cross_sub / gen = cf_rate + sub_rev / gen + sub_markup + grid_costs - cf_rate
cross_sub / gen = sub_rev / gen + sub_markup + grid_costs
This expression states that the revenue generated from non-subscribers per unit of electricity generated by a CSG
is equal to the unit cost of generating electricity from the CSG plus the per-unit revenue from subscribers less the
counterfactual rate that would have been paid for by subscribers.
This relationship shows that, all else equal, as subscription revenue increases (e.g. a CSG contract offers a 3
cent/kWh offer to subscribers instead of a 2 cent/kWh offer), the cross subsidization amount increases.
This relationship also shows that as project costs decrease (e.g. if solar gardens are built at larger scale with lower
unit cost, the cross subsidization rate decreases).
And finally, as the counterfactual rates that would have been paid for by subscribers goes down (e.g. if electricity
prices decrease), then the cross subsidization rate increases (assuming tariffs to developers stay constant) because
now a lower share of required costs to cover the project (and subscriptions) can be raised by the net metered
electricity generation from the garden.
5.4. Results
The dependency between subscription contracts and cross-subsidization can be understood as the relationship
between add_con (the additional (per kWh) cost of subscription contracts, i.e. the per-kWh cost or benefit borne
by subscribers) and the ratio of cross_sub to total project cost (lcoe multiplied by gen). This ratio represents the
percent of a community solar project’s costs borne by non-subscribers.
Based on the derivations above, there should be an approximately linear relationship between the cost of
subscription contracts and the cross-subsidization ratio. This would imply that as contracts become more
favorable to subscribers, the costs imposed on non-subscribers increases. (Note that a utility-scale solar project
financed and operated by the utility would have add_con = 0 and a cross-subsidization ratio of 1).
Figure 4 shows the subscription terms and cross-subsidization ratios for 15 Minnesota co-ops with community
solar programs.

Not for Citation; Comments Welcome
14
Figure 4. The relationship between contract terms in a community solar program and the rate of cross-
subsidization.
The average cross-subsidization rate across co-op CSG programs (weighted by project capacity) is 98%, meaning
that the average community solar program shifts 2% less of the total cost of the project to non-subscribing
ratepayers (as opposed to subscribers) for an equivalent solar development.
As expected, subscription contracts that pay subscribers as part of subscription contracts (left of the vertical axis)
have cross-subsidization rates greater than 1. This implies that these contracts must actually raise more revenue
from utility customers than required to finance the solar garden (utility customers must also raise the cost of
paying subscribers). We find that the utility that imposes the greatest per-unit charges on its customers to support
community solar has a 124% cross-subsidization ratio, meaning that the utility’s customers in principle would
have their rates increased to cover 124% of the costs of the solar garden (in order to have to impact on utility
profits).
Programs that charge subscribers fees for subscribing impose lower costs than a utility-operated solar project.
Five of the 15 utilities studied have cross-subsidization rates less than 1. The program with the lowest cross-
subsidization rate only must in principle raise rates on its customers to cover 57% of the project costs (in order to
have to impact on utility profits). This suggests that the five community solar programs with cross-subsidization
rates less than 1 have developed programs that shift financing costs onto subscribers and have thus lowered the
rate impacts of deploying solar projects at this scale.
Greater degrees of cross-subsidization from utility ratepayers to cover the subscription benefits to community
solar subscribers has equity implications. Based on anecdotal evidence, community solar subscribers tend to be
wealthier than non-subscribers. This is because project developers selecting subscribers and marketing

Not for Citation; Comments Welcome
15
subscriptions actively screen applicants to minimize risks associated with subscriber retention. From the utility’s
perspective, in a fluid, efficient community solar subscription market, there is little financial risk from offering
subscription contracts. But because subscriber acquisition costs may be high, volatility in subscribers increases
utility costs. Therefore, subscribers have developed criteria, such as credit score minimums, that limit access to
community solar to only wealthy customers. Further, due to financing constraints in some (but not all)
subscription contracts, subscribers may also be required to pay in cash or take out private loans, which also would
limit access to subscribers to wealthier households.
6. Next steps
The next steps for this project will be to improve our understanding of the performance of community solar
programs and how key performance metrics relate to the design decisions of community solar programs. Key
metrics will assess the effectiveness of community solar programs in increasing total solar deployments levels as
well as the equity in deriving benefits from community solar programs. These next steps will draw on a
comparative approach across community solar programs in utilities within Minnesota and in other states.
The next steps of this project will rely on a combination of original datasets, publicly available datasets, privately
shared proprietary datasets, and original case studies. This project will apply a variety of social science methods,
both quantitative and qualitative. The primary methods will be economic and financial. We are developing
financial cash flow models of both subscriber and solar developer decisions. These models will inform an
economic search model of community solar adoption that is parameterized with the demographic and subscription
data we are collecting. The basis for this model will be adoption decision models that have been used in the
literature to assess residential rooftop solar adoption (Bollinger and Gillingham, 2012; Islam, 2014; Labay and
Kinnear, 1981; Rai and Robinson, 2015; Wolske et al., 2017). This structure will allow us to assess the economic
benefits of solar adoption under the various financing models available to subscribers and the empirical adoption
factors that affect access to the benefits of the program.
We are taking several approaches to assessing the relationship between community solar program design and
overall solar deployment. An econometric regression discontinuity approach will allow us to quantify how
announcements of changes in the Minnesota program have affected developer applications for new community
solar projects. We also plan to use a theoretical discrete choice model to identify the key determinants of the
subscriber community solar adoption decision. These econometric approaches will help identify the impact of
design changes in the Minnesota community solar program in Xcel Energy’s territory on overall deployment
levels.
We are also taking several approaches to assessing the second dimension: the relationship between community
solar program design and access to benefits. First, we will assess the distribution of economic benefits through
financial cash-flow models of community solar project developers and household subscribers. We plan to
parameterize these models with the data collected on subscription contracts and demographic data. This would
allow for a quantification of overall economic benefits as well as economic benefits by income groups. A critical
piece of this analysis is to understand the overall rate impacts of mandated tariffs paid to community solar
programs – we will quantify rate impacts by building on the large literature that has examined this question in the
context of traditional energy capital investments (Joskow, 1998). A major concern underlying this part of the
analysis is that despite increasingly favorable economics of community solar subscriptions, factors associated
with lower income levels (particularly liquidity constrains, limited access to credit, and information barriers)
regressively bias the distribution of benefits created by community solar programs. Second, we will assess the
decision-making power of individuals and communities. We plan to quantify this dimension by studying cross-
subsidization rates, renewable energy credit markets and asset control patterns. Interviews with stakeholders will
help operationalize this dimension qualitatively and will help inform a power analysis of how community solar
projects are designed, developed, and operated.

Not for Citation; Comments Welcome
16
Appendix
This appendix is a primer on the energy policy context of community solar programs. We review the literature on
electricity policy, solar energy economics, solar energy finance, the adoption of solar energy, equity in access to
solar energy, and community solar programs.
1. Electricity Policy Primer
In the United States, power production and distribution are separated. Energy is produced by regulated
monopolies, which have been broken up by the introduction of co-ops and municipal power grids. Most states
have a public utilities commission (PUC) which regulates the generation and distribution of power. Within these
states, utilities may be regulated or deregulated. A regulated utility controls a vertically-integrated power system,
from the plants that produce the power to the meter on a subscriber’s property. Deregulated utilities only control
the system to which other entities interconnect power generation, and which delivers power to subscribers.
Electrification benefits the economy and health of a state’s citizens, but requires responsible management to
regulate its production and distribution. In recent decades, promoting renewable energy in contrast to more
traditional methods has become a goal of policymakers across America and the world. The methods used by each
institution vary based on the resources and needs of the region, as well as political opinions about the relevance of
climate science and the health effects of pollutants. Policy tools discussed in this paper will fall into the general
categories of mandated generation capacities which force utilities to modernize their resources, and price
mechanisms that use market tools to encourage utilities to change their methods of production.
Generating electricity requires high upfront costs with paybacks expected over years or decades. For example,
solar panel arrays require materials and personnel for construction, but once they are established the costs of
maintenance are minimal. To encourage utilities and developers to create new power generation facilities,
policymakers have implemented finance mechanisms that incentivize development. Examples of these financing
mechanisms include net metering and investment tax credits.
1.1. Policies to incentivize renewable electricity
Production tax credits (PTCs) reimburse production facilities that generate renewable energy by providing them
with tax credits per unit energy produced. In America, this tax credit provided $0.015/kWh in 1993 dollars to
wind-powered facilities, and half that amount to solar and other renewable facilities, for their first ten years of
operation (Department of Energy, n.d.). This benefit only applied to solar facilities that went online before 2016,
and is no longer offered (Department of Energy, n.d.).
Investment tax credits (ITCs) are designed to offset the high upfront costs of renewable energy. The United States
government offers a tax credit equal to 30% of the expenditures on equipment that uses solar energy to generate
electricity (Department of Energy, n.d.). This credit will decrease starting in 2020, diminishing to 10% by 2022
(Department of Energy, n.d.). In America, ITCs are paired with depreciation deductions, which allows them to
recover the cost inflicted by the reduction in value of the property over time. The major downside of ITCs is lost
revenue for the governments that implement them (Timilsina et al., 2012).
The Public Utility Regulatory Policies Act of 1978 (PURPA) mandates that utilities purchase power from
qualifying facilities, including small production facilities (Federal Energy Regulatory Commission, 2016a). To
qualify, a small facility must produce less than 80MW of power through renewable means. PURPA is the law that
first recognized the right of non-utility entities to own the means of power production, and in doing so broadened
the marketplace. Under PURPA, non-utility entities that can produce power at a lower price than the utility can
produce it are guaranteed to have the power purchased at “avoided cost,” or the cost of generating the power in-
house at the utility (Federal Energy Regulatory Commission, 2016b).

Not for Citation; Comments Welcome
17
PURPA led directly to the implementation of net metering (defined below), which is a process through which
households and businesses can be reimbursed for the power they generate on their property. Prior to PURPA,
there was no federally-mandated policy saying that utilities needed to purchase or interconnect this power.
Most states have implemented policies that promote renewable energy. The subset of these policy options relevant
in the Minnesota context are discussed below.
A renewable energy portfolio standard (RPS) is imposed when electricity suppliers are mandated to have a certain
percentage of their electricity supply coming from renewable energy sources (Timilsina et al., 2012). These
standards establish a trading regime such that companies which do not meet their burden of renewable capacity
may purchase from those with renewable energy .production above the mandated value. Some states, like New
Jersey in 2010, have indicated that within their state’s overall renewable portfolio, a particular fraction must come
from solar power (Timilsina et al., 2012). A 2007 law sets Minnesota’s RPS goal at 25% renewable energy
production by 2025, and a 2013 law mandated 1.5% solar in Minnesota by 2020 and 10% by 2030 (Department of
Energy, n.d.).
A feed-in tariff (FiT) is a premium or tariff or payment added to the cost of new or renewable electricity
production which may not be competitive with the price of conventional generation (Timilsina et al., 2012). As of
early 2010, this policy was in use by nations on five continents to ensure that more expensive technologies still
produce a profit for the producer, and to signal to investors that long-term investment in these new products
would be supported by user purchasing (Timilsina et al., 2012). A 2008 report by the Commission of the
European Communities found that FiT is the most effective policy instrument to promote solar, wind, and biogas
technologies (Timilsina et al., 2012). Finally, a FiT implemented without consideration of the interconnection
costs for new solar plants could increase transmission costs across the market by forcing the grid to adjust the way
it manages power (Timilsina et al., 2012). FiTs are often designed to fluctuate with the market, but this changing
payment level can risk uncertainty changing payment levels can increase uncertainties for investors and increase
overall market risk (Timilsina et al., 2012).
For all their benefits, a FiT cannot subsidize the high upfront cost of installing technology like solar power; as a
result, it tends to drive electricity rates upwards for all consumers in the short term, in order to cover the cost of
constructing the solar facility (Timilsina et al., 2012). Examples from Taiwan show that external factors like the
upfront cost of installing solar, or limited space availability, can reduce the impact of FiT sponsorship for small-
scale (0-10kW) solar (Couture et al., 2015).
Net metering allows households and commercial establishments to sell the excess power generated via rooftop
solar or industrial processes back to the grid (Timilsina et al., 2012). This kind of metering pays the subscriber for
their power at the same retail tariff for which they would otherwise purchase power from the grid (Timilsina et al.,
2012).
1.2. Data privacy and the electricity sector
The electric utility industry has historically been a data-driven enterprise, and increasing competition within the
market has driven utilities to classify as trade secrets information that they might previously have shared (Vine,
1997). Investor-owned utilities in particular see customer-related information, including energy efficiency and
avoided capacity costs, as a corporate asset (Vine, 1997). This imbalance of information can limit market
competition, offset the regulatory balance between utilities and public utility commissions, and limit the ability of
policymakers to make plans that reflect the current state of the energy industry (Vine, 1997). In general,
commissions will allow utilities to classify consumer data if disclosure would not aid the public interest, or would
harm the utility, or if the commission is working under too heavy an administrative burden (Vine, 1997).
In December, 2016, Minnesota’s Public Utilities Commission (MNPUC) received a briefing on the discussion of
Consumer Energy Use Data (CEUD), in which some parties advocated for increased access to better benchmark

Not for Citation; Comments Welcome
18
energy use, and others argued in favor of protecting consumers’ privacy (O’Grady, 2016). Among the problems
considered by the discussion, the panel considered how an individual might gain access to their own CEUD, and
what aggregation rule would be appropriate for a group of people, such that no individual’s power consumption
patterns could be inferred from the averaged data (O’Grady, 2016). Since this discussion, MNPUC has been
engaged in the process of defining a consent form for consumers to release their CEUD to outside entities (MN
Docket 12-1344).
2. Economics of Solar Energy
A limited number of consumers can support the high upfront finance requirements of solar, despite declining costs
and favorable national, state, and local policies (Asmus, 2008).
2.1. Solar energy costs and benefits
Historically, solar energy module costs (the costs of the actual solar panels) have declined faster than nearly any
other energy technology (Nemet, 2006). However, the U.S. Department of Energy estimates that the non-
hardware costs, or “soft” costs, comprise 64% of the total installation cost of a new solar power system (U.S.
Department of Energy, n.d.). Module costs have declined faster than balance-of-system costs, and prices of
installed solar systems still vary widely – by one estimate, U.S. solar system prices span more than a factor of four
(Nemet et al., 2017). While prices of solar have declined, simultaneously, financial incentives have been adopted
by many states and countries, and in many places where solar is adopted, the net present value of installing solar,
once accounting for incentives, is positive (Borenstein, 2015).
Absent policies, however, the net present value of solar relative to efficient natural gas generation may actually be
negative in many places, including sunny California (Borenstein, 2015). Lowering the costs of solar energy to be
cost competitive may require further innovation (Schmalensee, 2015). One consideration in assessing the private
costs of solar adoption is the rate of pass-through of financial incentives for solar adoption. Estimates of pass-
through vary considerably, from less than 20% to nearly 100% (Borenstein, 2015; Dong et al., 2014; Henwood,
2014; Podolefsky, 2013).
In addition to system costs, solar energy imposes additional external costs. The costs of acquiring new customers
for whom there are private net benefits of adopting solar energy remain quite high.
Further, there are costs to the electric grid operator for integrating the intermittent generation of solar energy
(Hirth et al., 2015). On the other hand, there may be additional benefits for adopting solar energy to the grid
operator due to the distributed nature of solar generation (Kaundinya et al., 2009).
Finally, solar energy has no direct air pollution or greenhouse gas emissions and therefore reduces pollution levels
when solar energy replaces conventional generation. Deploying solar energy is seen as a key strategy as part of a
transition to a more sustainable global energy system.
2.1. Compensating solar energy generation with net metering
Compensation for electricity generation from solar energy depends on two general classes of factors: the
opportunity cost of reducing electricity purchases from a utility and the payments received from a utility
purchasing the electricity. In other words, the incentive to adopt solar energy varies based on the default
electricity price consumers pay and the payment consumers (now generators of electricity) receive for selling
electricity back to the grid.
One key policy to compensate solar energy producers is net energy metering (NEM). NEM is a policy adopted (in
some form) by 47 states (DSIRE, 2013) that effectively compensates owners of solar energy generators. NEM
works by effectively “running the meter backwards” such that electricity bills reflect only the electricity

Not for Citation; Comments Welcome
19
consumed net of electricity generated. In effect, NEM allows customers to pay an electric bill for only their
consumption net of their own solar generation. States with NEM often also include bill charges for fixed charges,
which are meant to compensate the utility for their backup capacity and distribution infrastructure2.
NEM increases the benefits for distributed generation relative to utility-owned solar generation. NEM effectively
compensates solar generation at the retail rate of electricity. Solar energy owned by utilities and sold in markets is
sold in wholesale markets and is therefore compensated at the (much lower) wholesale rate.
Net metering policies vary in their design. Some states have adopted a real-time approach to net metering where
electricity generation is compensated in relation to the real-time electricity prices (typically electricity prices are
significantly higher during period of peak demand, such as the middle of a hot day).
The opportunity cost of avoided electricity consumption also varies by the rate structure set by states for different
types of consumers. For example, large industrial electricity consumers typically face prices closer to wholesale
prices, lowering the opportunity cost of adopting distributed generation. As another example, some states, like
California, have adopted tiered pricing schedules (where the marginal price of electricity increases in
consumption). This scheme increases the incentive for large electricity consumers to adopt distributed generation.
2.2. The value of solar
The previous section described the variety of designs for compensation schemes for distributed generation based
on variants of NEM. Conceptually, NEM compensated customers for their own avoided costs of purchasing
electricity. Value of solar (VOS) provides an alternative conceptual basis for compensating distributed generation
based on the net benefits provided back to the grid. NEM approaches and VOS approaches are likely to converge
in perfect markets with competition, low transaction costs, fully internalized externalities, etc. Real-world
electricity markets are far from this ideal, and there are therefore real differences in NEM and VOS rates.
VOS rates are calculated in bottom-up engineering studies of the different dimensions of benefits. The primary
components of VOS are avoided costs associated with generation (fuel costs, capacity costs, operation and
maintenance costs), avoided costs associated with transmission and distribution, and avoided environmental costs.
(Taylor et al., 2015) Conceptually, VOS rates may also include locational benefits related to the particular grid-
reliability benefits of distributed generation (Kaundinya et al., 2009).
VOS calculations are in their early stages. The first implementation of VOS concepts in actual rate setting was in
the revised rate structure for Minnesota’s community solar gardens in Xcel Enegy’s territory, beginning January
1, 2017.
3. Financing Solar Energy
Deploying solar energy is likely to be a critical strategy in the transition to more sustainable urban and regional
energy systems. A key challenge in accelerating the adoption of solar energy is developing financing models that
can support the high up-front capital costs of purchasing and installing solar panels. Innovation in “finance and
business solutions to expand access to capital” is a major focus of public policies to address the non-hardware
costs of installing solar power (U.S. Department of Energy, n.d.).
4. Understanding the Solar Adoption Decision
2 In states with increasing rate structures, NEM may provide a greater benefit than in states with flat rate structures if
produced energy is accounted for equivalently to consumed energy. This is the case in California for residential solar
consumers (Borenstein, 2015).
Not for Citation; Comments Welcome
20
Electric utilities supply energy to consumers: this is the basic premise of the electric grid since it was constructed.
But in recent history, distributed power systems such as rooftop solar are physically, economically, and socially
evolving this century-old power delivery system into a flexible, two-way grid where consumers can choose to
produce and consume their own energy.
Despite for the means for actors other than the electric utility to produce energy, political power dynamics
embodied in grid actor characteristics such as NIMBYism and electric utility financial needs have discouraged
sustainable levels of renewable energy development (Funkhouser et al., 2015; Wüstenhagen et al., 2007).
Recognizing this, countries such as Germany have initiated customer participation and community ownership
policies, making community energy projects a cornerstone of their climate policies (Kalkbrenner and Roosen,
2016).
As coevolutionary frameworks suggest that technological transitions are acted through multi-level interactions
from social and political transformations, as well as financial and technological ones, citizen engagement becomes
a key link in niche-level technology uptake (Foxon, 2011; Kallis and Norgaard, 2009; Warren and McFadyen,
2010; Wolsink, 2007). In this framework, citizen engagement and small-scale solar development rises from the
niche level, affecting and affected by complex energy regimes above.
Currently, social networks, psychological perceptions, and socioeconomic characteristics are understood to be
correlated with different levels of distributed solar photovoltaic uptake (Bauner and Crago, 2015; Bollinger and
Gillingham, 2012; Dharshing, 2017; Rai et al., 2016; Wolske et al., 2017; Zhang et al., 2016). The uptake levels
can be increased by proximity to other solar arrays, financial incentives that decrease uncertainty about the
investment returns from the solar array, and pro-social or -environmental attitudes that diffuse within community
organizations and geographic areas (Noll et al., 2014).
Broken down by type of customer and solar array, it becomes clearer that different subgroups of utility customers
till uptake different types of solar photovoltaic technologies at different rates. Different corporate cultures lead to
decisions to own or lease solar panels on their buildings (Hoffman and High-Pippert, 2014). Evidence from
residential solar adoption in California, suggest that adopting customers are disproportionately wealthy, despite
this effect declining in the last few years (Bornhoft, 2017). The California experience also indicates that there is
little evidence that third-party ownership has been disproportionately utilized by low-income customers, despite
the less restrictive financing constraints that third-party ownership affords. A number of state regulatory
commissions have judged that solar programs, perceived as benefiting mainly wealthier customers, must try to
provide equal access to customers without adequate roofs or credit scores (Funkhouser et al., 2015).
One survey also showed that potential solar customers also differed in their sensitivities between rooftop and
community solar, with those who preferred community solar appearing more sensitive to price (Smart Electric
Power Alliance, 2016). Community solar customers were further shown to prefer community solar models that
were different from current offerings: less upfront cost, shorter contract terms, on-bill financing, and local
location were all given preferences.
Concern over utility customer equity has rolled into community solar programs, whose customers appear again
different from other solar consumers. Early surveys show that while very few are aware of community solar,
potential customers (or in this case, subscribers) show that showings of trust and local pride, combined with a
perceived financial and environmental benefit, could be enough to move an individual toward community solar
adoption (Hoffman and High-Pippert, 2014; Smart Electric Power Alliance, 2016).
5. Xcel’s Minnesota Community Solar Garden Program
The statute which created community solar in Minnesota Xcel takes up only two pages. Adopted May 15, 2015,
its language contains features which contain the essential players, goals, and puzzles of the policy (Bergan, 2014).
First and foremost, the statute establishes the scope of community solar. The legislature directed Xcel Energy to

Not for Citation; Comments Welcome
21
create a plan to operate community solar gardens by September 30, 2013 at the latest, and gave the Minnesota
Public Utilities Commission (MNPUC) power to approve their plan for public use (State of Minnesota, n.d.). The
final set of players relevant in the community solar garden scene in Minnesota are the developers of the solar
gardens, which could be Xcel Energy or any other organization.
The goals of the community solar program are also established in the statute. Xcel’s plan for community solar in
Minnesota must:
“Reasonably allow for the creation, financing, and accessibility of community solar gardens;”
“Establish uniform standards, fees, and processes for the interconnection of community solar facilities ...”
“Not apply different standards to utility and nonutility community solar garden facilities;”
“Be consistent with the public interest” (State of Minnesota, n.d.).
Together, these goals directed Xcel to build an ecosystem for solar which offered subscribers within its area the
ability to subscribe to community solar gardens, and which gave other electricity developers an equal footing to
generate power to be connected to Xcel’s grid. These goals set a general direction for community solar, while
allowing the utility to define a program that met its internal goals for power consistency and increases to grid
capacity. However, the leeway allowed by the general language of these goals also allowed room for disputes
between Xcel and MNPUC over the correct interpretation of the statute.
Xcel had established a framework for the program by, but due to an overwhelming number of applications (over
1GW by September, 2015), but it did not approve any sites for construction immediately. While HF 729 was
enacted on May 21, 2013, implementation of the policy began in September of that year when Xcel filed their
plan for the program (State of Minnesota, n.d.). The PUC required Xcel to begin crediting subscribers for their
solar subscription within 180 days of MNPUC approval of their plan (State of Minnesota, n.d.).
MNPUC approved Xcel’s plan for community solar gardens on August 7, 2014 (Bergan, 2014), and applications
poured in quickly. The statute indicated that “There shall be no limitation on the number or cumulative generating
capacity of community solar garden facilities,” but also indicated that “[each] solar garden must have a nameplate
capacity of no more than one megawatt” (State of Minnesota, n.d.).
Solar garden developers and Xcel disagreed on the interpretation of these policy elements. Some developers
assumed that they could co-locate as many 1MW solar gardens on the same plot of land as they wanted,
bypassing the cap written into the policy, and filed applications accordingly. Xcel argued that the legislation was
clear in the way it capped the capacity of any site at 1MW (citation needed). In June 2015, MNPUC ruled that
applications submitted by September 25 of that year could co-locate up to 5MW on the same site, and that
subsequent applications would be limited to 1MW on each site (Vine, 1997). This decision was followed by a
rapid spike in application submissions prior to the September deadline, as well as an increase in the number of
withdrawn applications. See Figure 5 for a graphical representation of applications and key decisions.

Not for Citation; Comments Welcome
22
Figure 5. Community solar project proposals and development pipeline in Xcel’s Minnesota program
with key policy developments noted (original figure).
More recently, Xcel and MNPUC have implemented a change from the adjusted retail rate (ARR) for community
solar to the value of solar (VOS) rate. This VOS rate pays subscribers less for the output of their panel, but
includes adders that break down the gains and losses of a new panel based on its location, the sort of fuel it
offsets, and why it is valuable to the utility.
The statute establishing the community solar garden program called upon Xcel to “reasonably allow for ...
accessibility of community solar gardens” and to make a plan “consistent with the public interest” (State of
Minnesota, n.d.). The lack of new applications in the three months since the implementation of the VOS tariff on
January 1, 2017, might indicate that developers have not found a way to make this new structure produce the
same benefits that drew them to the program in previous years (White, 2017).
While the political rhetoric around the initial development of the Xcel community solar program had suggested
that the program would be developed to prioritize residential subscriptions, the first 59 MW of project
development was dominated by commercial, not residential, subscribers. While 62% of subscribes in this initial
batch were residential electricity customers, they represented only 13% of total subscribed solar capacity. This
implies that the average commercial subscriber, subscribed to over 10-times the capacity of the average residential
subscriber.
References
Anadon, L.D., Chan, G., Harley, A.G., Matus, K., Moon, S., Murthy, S.L., Clark, W.C., 2016. Making
technological innovation work for sustainable development. Proc. Natl. Acad. Sci. 113, 9682–9690.
doi:10.1073/pnas.1525004113
Asmus, P., 2008. Exploring New Models of Solar Energy Development. Electr. J. 21, 61–70.
doi:10.1016/j.tej.2008.03.005
Bauner, C., Crago, C.L., 2015. Adoption of residential solar power under uncertainty: Implications for renewable
energy incentives. Energy Policy 86, 27–35. doi:10.1016/j.enpol.2015.06.009
Bergan, S., 2014. Initial Rate for Minnesota Community Solar Gardens Set (Almost) - Renewable + Law [WWW
Document]. Renew. Law. URL http://www.lawofrenewableenergy.com/2014/02/articles/solar/initial-rate-
for-minnesota-community-solar-gardens-set-almost/ (accessed 3.28.17).
Bollinger, B., Gillingham, K., 2012. Peer effects in the diffusion of solar photovoltaic panels. Mark. Sci. 31, 900–
912.

Not for Citation; Comments Welcome
23
Borenstein, S., 2015. The Private Net Benefits of Residential Solar PV: The Role of Electricity Tariffs, Tax
Incentives and Rebates. National Bureau of Economic Research.
Bornhoft, W., 2017. Solar Gardens Growing In Northfield, Other Minnesota Towns [WWW Document].
Northfield MN Patch. URL http://patch.com/minnesota/northfield/solar-gardens-growing-northfield-
other-minnesota-towns (accessed 3.24.17).
Chang, V., Goldenberg, C., Hoskins, J., Lassiter, S., Li, Z., Nakatani, E., Oluwafemi, S., Safford, H., 2017. Solar
Gardens in the Garden State: Community Solar Recommendations for New Jersey.
Chwastyk, D., Sterling, J., 2015. Community Solar: Program Design Models. Solar Electric Power Association.
Coalition for Community Solar Access, 2016. Community Solar Policy Decision Matrix.
Coughlin, J., Grove, J., Irvine, L., Jacobs, J.F., Phillips, S.J., Moynihan, L., Wiedman, J., 2011. Guide to
community solar: Utility, private, and non-profit project development.
Couture, T., Jacobs, D., Rickerson, W., Healey, V., 2015. The next generation of renewable electricity policy:
How rapid change is breaking down conventional policy categories (No. NREL/TP-7A40-63149).
National Renewable Energy Laboratory.
Denniston, J., 2016. Report on Solar*Rewards community interconnection process: Community solar gardens.
Xcel Energy, MNPUC Docket NO. E002/M-13-867.
Department of Energy, n.d. Renewable Electricity Production Tax Credit (PTC) | Department of Energy [WWW
Document]. Renew. Electr. Prod. TAX CREDIT PTC. URL https://energy.gov/savings/renewable-
electricity-production-tax-credit-ptc (accessed 3.28.17a).
Department of Energy, n.d. Business Energy Investment Tax Credit (ITC) | Department of Energy [WWW
Document]. URL https://energy.gov/savings/business-energy-investment-tax-credit-itc (accessed
3.28.17b).
Department of Energy, n.d. Renewable Energy Standard | Department of Energy [WWW Document]. URL
https://energy.gov/savings/renewable-energy-standard-3 (accessed 3.28.17c).
Dharshing, S., 2017. Household dynamics of technology adoption: A spatial econometric analysis of residential
solar photovoltaic (PV) systems in Germany. Energy Res. Soc. Sci. 23, 113–124.
doi:10.1016/j.erss.2016.10.012
Dong, C., Wiser, R., Rai, V., 2014. Incentive Pass-through for Residential Solar Systems in California. Berkeley
CA Lawrence Berkeley Natl. Lab.
Drehobl, A., Ross, L., 2016. Lifting the High Energy Burden in America’s Largest Cities: How Energy Efficiency
Can Improve Low Income and underserved Communities.
DSIRE, 2013. Renewable Portfolio Standard Policies - RPS_map.pdf [WWW Document]. URL
http://www.dsireusa.org/documents/summarymaps/RPS_map.pdf
EIA, 2017. Electric Power Monthly.
Faulhaber, G.R., 1975. Cross-Subsidization: Pricing in Public Enterprises. Am. Econ. Rev. 65, 966–977.
doi:10.2307/1806633
Federal Energy Regulatory Commission, 2016a. FERC: Qualifying Facilities - What is a Qualifying Facility?
[WWW Document]. URL https://www.ferc.gov/industries/electric/gen-info/qual-fac/what-is.asp
(accessed 3.28.17).
Federal Energy Regulatory Commission, 2016b. FERC: Qualifying Facilities - What Are the Benefits of QF
Status? [WWW Document]. URL https://www.ferc.gov/industries/electric/gen-info/qual-fac/benefits.asp
(accessed 3.28.17).
Feldman, D., Brockway, A., Ulrich, E., Margolis, R., 2015. Shared Solar: Current Landscape, Market Potential,
and the Impact of Federal Securities Regulation (Technical Report No. NREL/TP-6A20-63892). National
Renewable Energy Laboratory.
Foxon, T., 2011. A Coevolutionary Framework for Analysing a Transition to a Sustainable Low Carbon
Economy. Ecol. Econ. 2011, 2258–2267. doi:10.1016/j.ecolecon.2011.07.014
Funkhouser, E., Blackburn, G., Magee, C., Rai, V., 2015. Business Model Innovations for Deploying Distributed
Generation: The Emerging Landscape of Community Solar in the US. Energy Research & Social Science
90.
Geels, F.W., 2002. Technological transitions as evolutionary reconfiguration processes: a multi-level perspective
and a case-study. Res. Policy 31, 1257–1274. doi:10.1016/S0048-7333(02)00062-8
Not for Citation; Comments Welcome
24
Geels, F.W., Schot, J., 2010. The dynamics of transitions: a socio-technical perspective -- a multi-level
perspective on transitions, in: Grin, J., Rotmans, J., Schot, J. (Eds.), Transitions to Sustainable
Development: New Directions in the Study of Long Term Transformative Change. Routledge, New York,
pp. 18–28.
Granqvist, H., Grover, D., 2016. Distributive fairness in paying for clean energy infrastructure. Ecol. Econ. 126,
87–97. doi:10.1016/j.ecolecon.2016.02.012
Henwood, K., 2014. Subsidy Pass-through in Residential Solar Markets. Chic. IL Univ. Chic. Work. Pap.
Hirth, L., Ueckerdt, F., Edenhofer, O., 2015. Integration costs revisited – An economic framework for wind and
solar variability. Renew. Energy 74, 925–939. doi:10.1016/j.renene.2014.08.065
Hoffman, S., High-Pippert, A., n.d. Community Solar Programs and the Democratization of the Energy System.
University of St.Thomas.
Hoffman, S.M., High-Pippert, A., 2014. Sharing the Sun: Attitudes, Early Adopters and Community Solar
Projects.
IEA, 2016. World Energy Outlook 2016. OECD Publishing.
Interstate Renewable Energy Council, 2016a. Shared Renewable Energy for Low- to Moderate-Income
Consumers.
Interstate Renewable Energy Council, 2016b. State Shared Renewable Energy Program Catalog [WWW
Document]. URL http://www.irecusa.org/regulatory-reform/shared-renewables/state-shared-renewable-
energy-program-catalog/ (accessed 2.7.17).
Islam, T., 2014. Household level innovation diffusion model of photo-voltaic (PV) solar cells from stated
preference data. Energy Policy 65, 340–350. doi:10.1016/j.enpol.2013.10.004
Joskow, P.L., 1998. Electricity Sectors in Transition. Energy J. 19, 25–52.
Kalkbrenner, B.J., Roosen, J., 2016. Citizens’ willingness to participate in local renewable energy projects: The
role of community and trust in Germany. Energy Res. Soc. Sci. 13, 60–70. doi:10.1016/j.erss.2015.12.006
Kallis, G., Norgaard, R., 2009. Coevolutionary Ecological Economics. Ecol. Econ. 2010, 690–699.
doi:10.1016/j.ecolecon.2009.09.017
Kaundinya, D.P., Balachandra, P., Ravindranath, N.H., 2009. Grid-connected versus stand-alone energy systems
for decentralized power—A review of literature. Renew. Sustain. Energy Rev. 13, 2041–2050.
doi:10.1016/j.rser.2009.02.002
Labay, D.G., Kinnear, T.C., 1981. Exploring the Consumer Decision Process in the Adoption of Solar Energy
Systems. J. Consum. Res. 8, 271. doi:10.1086/208865
National Renewable Energy Laboratory, 2014. Community Shared Solar: Policy and Regulatory Considerations
(No. NREL/BR-6A20-62367).
Nemet, G.F., 2006. Beyond the learning curve: factors influencing cost reductions in photovoltaics. Energy Policy
34, 3218–3232. doi:10.1016/j.enpol.2005.06.020
Nemet, G.F., O’Shaughnessy, E., Wiser, R., Darghouth, N., Barbose, G., Gillingham, K., Rai, V., 2017.
Characteristics of low-priced solar PV systems in the U.S. Appl. Energy 187, 501–513.
doi:10.1016/j.apenergy.2016.11.056
Noll, D., Dawes, C., Rai, V., 2014. Solar Community Organizations and active peer effects in the adoption of
residential PV. Energy Policy 67, 330–343. doi:10.1016/j.enpol.2013.12.050
NREL, 2017. System Advisor Model (SAM). National Renewable Energy Laboratory.
O’Grady, K., 2016. In the Matter of a Commission Inquiry into the Privacy Policies of Rate Regulated Energy
Utilities.
Podolefsky, M., 2013. Tax evasion and subsidy pass-through under the solar investment tax credit. Univ. Colo.
Boulder Work. Pap.
Rai, V., Reeves, D.C., Margolis, R., 2016. Overcoming barriers and uncertainties in the adoption of residential
solar PV. Renew. Energy 89, 498–505. doi:10.1016/j.renene.2015.11.080
Rai, V., Robinson, S.A., 2015. Agent-based modeling of energy technology adoption: Empirical integration of
social, behavioral, economic, and environmental factors. Environ. Model. Softw. 70, 163–177.
doi:10.1016/j.envsoft.2015.04.014
Rule, T.A., 2014. Solar Energy, Utilities, and Fairness. San Diego J. Clim. Energy Law 6, 115–148.
Not for Citation; Comments Welcome
25
Sabol, P., 2016. FROM POWER TO EMPOWERMENT - Plugging Low Income Communities Into The Clean
Energy Economy.
Schaffer, D., 2015. Solar garden options rolling out for Xcel Energy customers in Minnesota. Star Trib.
Schmalensee, R., 2015. The future of solar energy: A personal assessment. Energy Econ. 52, S142–S148.
doi:10.1016/j.eneco.2015.08.012
Schroeder McConnell, E., Baldwin Elder, S., Passera, L., Elder, B., 2016. Shared Renewable Energy for Low-to
Moderate-Income Consumers: Policy Guidelines and Model Provisions. Interstate Renewable Energy
Council.
Smart Electric Power Alliance, 2016. What the Community Solar Customer Wants.
Stanton, T., Kline, K., 2016. The Ecology of Community Solar Gardening: A ‘Companion Planting’ Guide (No.
16-07). National Regulatory Research Institute.
State of Minnesota, n.d. 216B.1641 Community Solar Garden.
Taylor, M., McLaren, J., Cory, K., Davidovich, T., Sterling, J., Makhyoun, M., 2015. Value of Solar: Program
Design and Implementation Considerations. Natl. Renew. Energy Lab.
Timilsina, G.R., Kurdgelashvili, L., Narbel, P.A., 2012. Solar energy: Markets, economics and policies. Renew.
Sustain. Energy Rev. 16, 449–465. doi:10.1016/j.rser.2011.08.009
Trabish, H., 2017. Subscriptions or sales: Which community solar approach promises the best growth? Util. Dive.
U.S. Department of Energy, n.d. SunShot [WWW Document]. URL https://energy.gov/eere/sunshot (accessed
2.7.17).
Vine, E., 1997. Confidential Data in a Competitive Environment: Setting a Regulatory Agenda. Lawrence
Berkeley National Laboratory, The Electricity Journal.
Walker, G., Hunter, S., Devine-Wright, P., Evans, B., Fay, H., 2007. Harnessing Community Energies:
Explaining and Evaluating Community-Based Localism in Renewable Energy Policy in the UK. Glob.
Environ. Polit. 7, 64–82. doi:10.1162/glep.2007.7.2.64
Warren, C.R., McFadyen, M., 2010. Does community ownership affect public attitudes to wind energy? A case
study from south-west Scotland. Land Use Policy 27, 204–213. doi:10.1016/j.landusepol.2008.12.010
White, S., 2017. Xcel 13-867 Compliance Filing 2017-03-10.
Wolsink, M., 2007. Planning of renewables schemes: Deliberative and fair decision-making on landscape issues
instead of reproachful accusations of non-cooperation. Energy Policy 35, 2692–2704.
doi:10.1016/j.enpol.2006.12.002
Wolske, K., Stern, P., Dietz, T., 2017. Explaining Interest in Adopting Residential Solar Photovoltaic Systems in
the United States: Towards an Integration of Behavioral Theories. Energy Res. Soc. Sci. 2017, 134–151.
doi:http://dx.doi.org/10.1016/j.erss.2016.12.023
Wüstenhagen, R., Wolsink, M., Bürer, M.J., 2007. Social acceptance of renewable energy innovation: An
introduction to the concept. Energy Policy 35, 2683–2691. doi:10.1016/j.enpol.2006.12.001
Zhang, H., Vorobeychik, Y., Letchford, J., Lakkaraju, K., 2016. Data-driven agent-based modeling, with
application to rooftop solar adoption. Auton. Agents Multi-Agent Syst. 30, 1023–1049.
doi:10.1007/s10458-016-9326-8