the political economy of decentralized approaches to...
TRANSCRIPT

IIIEE Theses 2016:15
The political economy of decentralized approaches to rural electrification in Tanzania: Implications for agro-industry co-generation projects
Shamim Zakaria
Supervisors
Philip Peck
Yacob Mulugetta
Thesis for the fulfilment of the Master of Science in Environmental Sciences, Policy & Management (MESPOM)
jointly operated by Lund University – University of Manchester - University of the Aegean – Central European University
Lund, Sweden, June 2016

2
Erasmus Mundus Masters Course in
Environmental Sciences, Policy and
Management
MESPOM
This thesis is submitted in fulfilment of the Master of Science degree awarded as a result of successful completion of the Erasmus Mundus Masters course in Environmental Sciences, Policy and Management (MESPOM) jointly operated by the University of the Aegean (Greece), Central European University (Hungary), Lund University (Sweden) and the University of Manchester (United Kingdom).
© You may use the contents of the IIIEE publications for informational purposes only. You may not copy, lend, hire, transmit or redistribute these materials for commercial purposes or for compensation of any kind without written permission from IIIEE. When using IIIEE material you must include
the following copyright notice: ‘Copyright © Shamim Zakaria, IIIEE, Lund University. All rights reserved’ in any copy that you make in a clearly visible position. You may not modify the materials without the permission of the author.
Published in 2016 by IIIEE, Lund University, P.O. Box 196, S-221 00 LUND, Sweden,
Tel: +46 – 46 222 02 00, Fax: +46 – 46 222 02 10, e-mail: [email protected].
ISSN 1401-9191

3
Table of Contents
ABBREVIATIONS ........................................................................................................................ 5
ACKNOWLEDGEMENTS ......................................................................................................... 10
ABSTRACT ................................................................................................................................. 12
EXECUTIVE SUMMARY .......................................................................................................... 13
1 INTRODUCTION .............................................................................................................. 15
1.1 PROBLEM DEFINITION ............................................................................................................................. 18 1.2 RESEARCH QUESTION .............................................................................................................................. 21 1.3 METHOD ..................................................................................................................................................... 21 1.4 LIMITATIONS AND SCOPE ........................................................................................................................ 22 1.5 AUDIENCE .................................................................................................................................................. 23 1.6 DISPOSITION .............................................................................................................................................. 24
2 LITERATURE ANALYSIS ................................................................................................. 25
2.1 BIOMASS COGENERATION ...................................................................................................................... 25 2.2 POLITICAL ECONOMY APPROACHES ...................................................................................................... 27 2.3 TANZANIA .................................................................................................................................................. 32
2.3.1. Country Profile ......................................................................................................................................... 32 2.3.2. A historical perspective ............................................................................................................................. 35 2.3.3. Energy mix .............................................................................................................................................. 38 2.3.4. Sector Structure ........................................................................................................................................ 40 2.3.5. Policy and Regulatory Framework: ........................................................................................................... 45 2.3.6. Barriers for Renewable Energy Penetration ............................................................................................... 49
3 RESULTS AND ANALYSIS ............................................................................................... 51
3.1 SUGAR ......................................................................................................................................................... 51 3.2 SISAL ............................................................................................................................................................ 56 3.3 RICE HUSK .................................................................................................................................................. 59 3.4 POLITICAL-ECONOMY ANALYSIS ............................................................................................................ 65
4 DISCUSSION ...................................................................................................................... 76
5 CONCLUSIONS ................................................................................................................. 77
BIBLIOGRAPHY ........................................................................................................................ 79
APPENDIX A: INTERVIEWEES .............................................................................................. 87
APPENDIX B: SAMPLE OF GUIDING QUESTIONS ............................................................ 89
APPENDIX C: BIOENERGY PATHWAYS .............................................................................. 94
APPENDIX D: APPLIED PEA FRAMEWORK ....................................................................... 95
APPENDIX E: MAP OF TANZANIA ....................................................................................... 97
APPENDIX F: AGRICULTURAL INITIATIVES OVER THE YEARS .................................. 98
APPENDIX G: GOT STRATEGIES, PLANS AND POLICIES ................................................ 99
APPENDIX H: TANESCO EXISTING MAIN GRID ........................................................... 100
APPENDIX I: 2015 AND 2016 TARIFF STRUCTURE .......................................................... 102
APPENDIX J: PLANTATION PARAMETERS AND PRODUCTION DATA...................... 105
APPENDIX K: SISAL VALUE CHAIN, COMPANIES AND PRODUCTION DATA .......... 107

4
APPENDIX L: GRID CONNECTED CAPACITY TANZANIA AS OF 2014 ......................... 110
List of Figures
Figure 1-1: Africa's Energy Landscape
Figure 1-2: Achieving the objectives of TDV 2025
Figure 2-1: PEA framework for power sector
Figure 2-2: United Republic of Tanzania population trends and projections 1950-2100
Figure 2-3: Institutional framework and market structure of the electricity sector
Figure 3-1: Organizational structure of the sugar industry
Figure 3-2: Potential entry points for agro-industries within the ESI structure
List of Tables
Table 2-1: Categorization of political-economy approaches
Table 2-2: Key upstream gas projects in Tanzania
Table 2-3: Power Generation Capacity in 2013
Table 2-4: TANESCO’s timeline: key events and ownership dynamics
Table 2-5: ESI Reform Strategy Phases and Timeline
Table 2-6: Tanzania REFiT Design Features
Table 2-7: Barriers of renewable energy in Tanzania
Table 3-1: Installed rice husk biomass plants so far
Table 3-2: Potential entry points for upcoming agro-industries stakeholders interviewed within the ESI structure
Table 4-1: Installed generation capacity for 2012 and planned 2030 installed capacity by source type according to PSMP
Table 4-2: Summary of the investment requirements for VSPPs, SPPs and IPPs
Table 4-3: Shares/costs of capacity and generation by type of producer: Tanzania 2013

5
Abbreviations AfDB – African Development Bank
AGRICEN - Agro-industries and Clean Energy in Africa
ASDP – Agricultural Sector Development Program
BAU – Business as Usual
Bcm – billion cubic metres
BEE – Bagamoyo EcoEnergy Ltd
BEST - Biomass Energy Strategy
BRN – Big Results Now Initiative
CAADP – Comprehensive Africa Agriculture Development Programme
CCM – Chama cha Mapenduzi
CFC – Common Fund for Commodities
DAC – Development Assistance Countries of the OECD
DARESCO – District Electricity Supply Company
DECC – Department of Energy and Climate Change
DIY – Do it yourself
DSE – Dar es Salaam Stock Exchange
DFID – Department for International Development
EEP – Emergency Power Producers
EJ – Exajoules
EPPs - Emergency Power Producers
ESI - Electricity Supply Industry
EWURA – Energy and Water Utilities Regulatory Authorities
FAO – Food and Agriculture Organization
FID – Final Investment Decision
FIT – Feed-in Tarriff

6
GDP – Gross Domestic Product
GEF – Global Environment Facility
GET FiT – Global Energy Transfer Feed in Tariff
GoT – Government of Tanzania
GWh – Gigawatt hours
HPS – Husk Power Systems
IIIEE – International Institute for Industrial Environmental Economics
IEA – International Energy Agency
IMF – International Monetary Fund
IMO – Independent Market Operator
IRENA – International Renewable Energy Agency
IPPs – Independent Power Producers
IPTL – Independent Power Tanzania Limited
ISI – Import-substituting industrialization
TRA – Tanzania Revenue Authority
KSC – Kilombero Sugar Company
KSE – Kagera Sugar Estate
kWh – Kilowatt hours
LCOE - levilized cost of electricity
MAFC – Ministry of Agriculture Food Security and Cooperatives
MCC – Millennium Challenge Corporation
MDBs – Multilateral Development Banks
MEM – Ministry of Energy and Minerals
MES – Mkonge Energy Systems
MIM – Mkonge Investment and Management Company
MOF – Ministry of Finance

7
MSE – Mtibwa Sugar Estate
Mt – Metric tonne
MTPY – million tons per year
MW - Megawatt
NBES – National Biomass Energy Strategy
NEP - National Energy Policy
NGO – Non-Governmental Organization
NGP – National Gas Policy
NORAID – Irish Northern Aid Committee
NPEP – New Political Economy Perspective
NREP – National Renewable Energy Policy
NSGPR - National Strategy for Growth and Reduction of Poverty
NSSF - National Social Security Fund
NRDS - National Rice Development Strategy
ODI – Overseas Development Institute
OECD – Organisation for Economic Co-operation and Development
PEA - Political-Economy Analysis
PMORALG – Prime Minister's Office Regional Administration and Local Government
- President’s Office Planning Comission
PPA – Power Purchase Agreement
PPP – Public-Private Partnership
PSMP - Power System Master Plan
RE – Renewable Energy
REA – Rural Enegy Agency
REDD – Reducing Emissions from Deforestation and Forest Degradation in Developing Countries
REF – Rural Energy Fund

8
REFiT – Renewable Energy Feed in Tariff
RERE – Renewable Energy for Rural Electrification
REMP - Renewable Energy Master Plan
SBT – Sugar Board of Tanzania
SAGCOT – Southern Agricultural Growth Corridor for Tanzania
SDGs – Sustainable Development Goals
SE4ALL – Sustainable Energy for All
SIDA – Swedish International Development Cooperation
SISO – Sisal Smallholder and Outgrower
SMEs – Small and Medium-Sized Enterprises
SOEs – State Operated Enterprises
SPPs – Small Power Producers
SPPA – Standardized Power Purchase Agreements
SPPT – Standardized Power Purchase Agreements and Tariffs
SREP – Scaling up Renewable Energy Programme Investment Plan
SSA – Sub-Saharan Africa
SSMPs – Sustainable Solar Market Packages
TaTEDO – Tanzania Traditional Energy Development Organization
TANESCO – Tanzania Electric Supply Limited
TANU – Tanganyika African National Union
TAREA - Tanzania Renewable Energy Association
Tcf – Trillion cubic feet
Tcm – trillion cubic metres
TCMT – Transformation and Change Management Team
TDBP – Tanzania Domestic Biogas Programme
TGDC – Tanzania Geothermal Development Company Limited

9
TPC – Tanganyika Planting Company
TPDC – Tanzania Petroleum Development Corporation
TSB – Tanzania Sugar Board
TSC – Tanganyika Sugar Corporation
UN – United Nations
UNDP – United Nations Development Program
UNIDO – United Nations Industrial Development Organization
USD – United States Dollar
TAFSIP – Tanzania Agriculture and Food Investment Plan
TDV – Tanzania Development Vision 2025
Tshs – Tanzanian Shillings
URT – United Republic of Tanzania
USAID – United States Agency for International Development
UNDP – United Nations Development Program
UNHCR – United Nations High Commission for Refugees
UNECA – United Nations Economic Commission for Africa
VPO – Vice President’s Office
VSPPs – Very Small Power Projects
WB – World Bank
WWF – Worldwide Fund for Nature
ZnZ – Zanzibar

10
Acknowledgements I would like to extend a special thanks to both my supervisors (Professor Philip Peck and Professor Yacob Mulugetta) for providing me with the needed support to accomplish this task. I would also like to acknowledge my interviewees for taking the time to sit down and discuss several aspects of my research.
A special thanks to the Executive director of Green Resources Limited for extending her network of contacts in the energy sector during my field work in Tanzania. I also appreciate the opportunity to participate in the Agro-industries and Clean Energy in Africa (AGRICEN) annual meeting and for insights I got during those few days in Uganda on agro-industries and renewable energy in other SSA countries.
I would also like to acknowledge Salim Kombo for his support and valuable input throughout this writing process and data collection. I would also like to thank Andrew Barnett, Gwamaka Mwalemba and Dr Julia Terrapon-Pfaff for providing me with information and valuable feedback on my research.
Special thanks to my fellow batch 10 MESPOMERs for their friendship and support. Last but not least I would like to acknowledge the unwavering support provided by my family throughout this process and my pursuit of this programme.

11

12
Abstract Based on the context of a developing country, this research engages key identified political-economy aspects that influence the operations and performance of the electricity supply industry in Tanzania. Departing from this political-economy perspective, this paper explores dencentralized approaches to rural electrification through agro-industry co-generation and influencing factors behind the slow pace of cogeneration. Extensive literature review and interviews at government, ministry and ago-industry level provide insights on needed incentives and disincentives to enable up scaling co-generation in the sugar, sisal and rice agro-industries in Tanzania. The research finds that the power sector remains highly influenced by political interference in pursuit of state driven agendas and to some extent donor relations. The utility TANESCO remains financially unstable, providing a disincentive for private sector investments needed for decentralized approaches to electrification. Electricity generation remains largely under this fully state-owned utility. This does not paint a hopeful picture for agro-industries that are looking to scale up operations in the context of no clear renewable energy strategy at national level and unclear signals from the government. In the immediate future, gas remains a key priority even with its accompanying uncertainties. Regulations need to be more firm to provide a strong clear signal to agro-industry investors and private sector at large.
Keywords: rural electrification; Tanzania; decentralized approaches; political-economy.

13
Executive summary Most countries in Africa acknowledge that a two track approach is needed to enable greater access to grid-based electricity especially to those in rural and remote communities. Both decentralized and centralized tracks are necessary should set development aspiration in Tanzania be attained. In line with the 2025 Tanzania Development Vision (TDV) the plan to provide electricity to 50 percent of the population by 2025 is guided by five year development plans to ensure implementation of set goals. The country remains highly endowed with great untapped renewable energy potential. As an economy that developed on the backbone of the agricultural sector, it is not fully capitalizing on the potential of the sector and particularly biomass for cogeneration in the agro-industry sub-sector. Cases in countries like India, Nepal and Mauritius have proven that agro-industries such as sugar, tea, rice have a great potential to augment electrification in rural areas.
The number of agricultural initiatives geared towards value addition and modernization of the agricultural sector in Tanzania indicate recognition by decision makers of the historical importance of the sector and the future need for this sector. However, the pace of commercialization and modernization is not as fast even with the pertinent need to increase employment and maintain relevance of this sector which currently employs up to 76.5% of the country’s labour force.
Biomass cogeneration in the Tanzanian agro-industrial sector remains slow paced even after several studies have proven the theoretical and technical potential of different crops (Gwang’ombe 2004; Gwang’ombe and Mwihava 2005; Abdallah et al. 2010; Julia Terrapon-Pfaff 2012; Camco 2014; AfDBa 2015).The benefits of cogeneration in agroindustry are clear and the incentive is there seeing they already have a need for steam in some processing operations but the set targets for installed capacity by resource type seem biased towards big projects such as gas, coal and hydro that retain power within a centralized track of increasing access to grid electricity.
As a key driver of any economy, the power sector needs to be financially sustainable to perform its functions and reliably deliver to dependent sectors such as industries and households. For successful development a reliable electricity supply industry (ESI) remains a necessary pre-condition (iisd 2014). That being said the first research question, departing from a political ecomony perspective tries to address why Tanzania fails to harness existing resources in an economically efficient way and draws out potential implications for TDV 2025 targets. The second research question follows on from the first one to explore if the broader political eonomy factors trickle down to influence the scale of operations and prioritization of biomass for electricity or heat generation in agro-industries.
That two research questions addressed are as follows:
Why has the Electricity Supply Industry in Tanzania struggled to provide reliable power to facilitate state development aspirations?
What incentives and disincentives are needed to enable up-scaling of agro-industry co-generation in Tanzania?
Methodologies for data collection included literature analysis, informal and formal semi-structured interviews and site visits. Eleven formal semi-structured interviews were conducted with stakeholders at government level, ministry level, agro-industries (sugar, rice and sisal) and a prominent non-governmental NGO.

14
The analysis of the political economy of decentralized approaches to rural electrification in Tanzania was based on a framework for power sector analysis by Barnett et al. (2016). This particular political-economy framework is currently being applied in a five year research programme known as Agro-industries and Clean energy (AGRICEN) that is exploring how agro-industries in SSA( Uganda, Malawi, Ethiopia and Kenya) could contribute to improving rural energy access (UCL 2016; Y. Mulugetta, personal communication, 11 March 2016). Therefore it is fitting for use in this research based on Tanzania, another SSA country. With regards to addressing the first question this research find that the Tanzania electricity supply industry and its related developments cannot be isolated from political influences in the country. Evidence for this is seen in the rate of turnover of Ministers of Energy (MEM) in the country and the association of political leaders as high up as the Prime Minister in big corruption scandals related to procurement practices in the ESI. As MEM has oversight over the utility (TANESCO), and the GoT remains the only shareholder of the utility, one therefore cannot overlook the potential linkages and influences. Decisions at MEM remain ad hoc and influenced by government officials and these trickle down and influence MEM’s responsibilities as the body with oversight over utility operations. The utility is lacking a commercial orientation and is being operated as a tool for pursuing state interests as they relate to maintaining donor and development partner relations and state interests. Incompetencies in terms of making economically sound decisions and not giving enough power to the regulator EWURA, an entity meant to be neutral and independent, means that regulatory oversight is inconsistent and in some cases lacking. Lack of a national renewable energy policy and regulations specific to it, means that penetration of renewables remains largely unguided. The ESI reforms are yet to be fully taken under the wing of the Incumbent President and at utility level progress seems to be slow in terms of getting TANESCO out of its financial disability. Organizational and technical capabilities need to be improved at TANESCO, MEM and the MOF needs to take more initiative as the institution that allocates the funds to the energy sector.
From the agro-industry perspective, the willingness is there at least to the extent of selling excess electricity generated to the grid but this willingness is not well facilitated by the right incentives. That said with regards to the second question this research finds that while agriculture commercialization has been guided by so many intiatives since independence and agriculture remains a key sector, it seems to still fall back in terms of productivity and value addition. For agro-industries that are willing to engage in selling electricity to the grid, lack of standardized contracts and guidance for generation that goes beyond 10 MW presented a disincentive. As a result negotiations between investors and TANESCO tend to be mostly long and unfruitful.
The GoT is sending mixed signals to private sector investors on two fronts. First the GoT while recognizing the need for a decentralized track for increasing access to grid electricity, it remains the central body in electricity generation and ownership of infrastructure through the state-owned utility TANESCO. Secondly, for investors looking to supply electrity via mini-grids and micro-grids, the clear large scale investments prioritization presented the guiding document for grid power presents yet another disincentive. Decentralized approaches are still marginalized and while the REA has done a lot of work in the last few years it remains short on finance.The priority at regulatory and decision making level in the immediate term remains to be the gas sector and in the long run coal and large hydro will join the gas sector. More needs to be done to send the right signals to private sector and to incentivize a competitive agro-industry.

15
1 Introduction A staggering 1.2 billion people globally in 2013 did not have access to electricity (IEA 2016). This is about 17 percent of global population. Approximately 80% of whom are in rural areas. Access to electricity is one aspect but another 1 billion people globally have access to electricity but via unreliable networks (United Nations Foundation 2013). This poses the question of the quality and reliability of electricity supply. In Africa, only one third of the continent has access to electricity. With 600 million people with no electricity access and with this number expected to rise to 700 million by 2030, it remains home to the largest number of people with no electricity access (IEA 2011; UNEP 2015). Figure 1 below gives an overview of the continent’s energy landscape in terms of population, annual GDP, percentage of population with access to electricity and per capital electricity consumption (IRENA 2015). Different regions globally have different challenges and therefore will have different priorities for energy planning.
North Africa performs better both in terms of percentage of population with access to electricity (98 percent) and per capita electricity consumption (1574 KWh per capita) (IRENA 2015). East Africa’s per capital consumption is lower at 91 KWh per capita and access remains at 23 percent. According to the Ministry of Energy and Minerals (MEM), Tanzania1 (located in East Africa) only has 24 percent of the mainland population electrified and a national electricity access2 rate of only 36 percent in 2014. In rural areas in Tanzania 2014 electrification rates drop to as low as 7 percent of the population and electricity access rate3 drop to 11 percent (MEM 2014; AfDBa 2015).Per capita electricity consumption in the country in 2014 was at 104.79 kWh, this has developed from 97 kWh in 2010 and as low as 58.2 kWh in 2000 (AfDBa 2015; PDB 2013b).
Access to modern energy services4 is clearly recognized as a pre-requisite for development and a catalyst for economic growth (Sokona et al. 2012; MEM 2015). While key for creating an enabling environment for economic growth and improved social equality, access to modern energy by itself does not suffice in eradication of poverty (UNIDO 2009). In Tanzania, the need for energy access to pursue better economic growth and human development is portrayed in the alignment of the countries goal to increase energy generation capacity with the vision to upgrade Tanzania from a least developed country to a middle income country by 2025. The need for modern energy access to achieve development goals such as poverty eradication that extend beyond the energy sector is clearly set out in several frameworks that govern the country's development path (URT 1999; URT 2010) Diversification of energy sources is
1 This refers only to mainland Tanzania and excludes all aspects of semi-autnomous Zanzibar and its energy sector. The
energy sector in Zanzibar falls under the Ministry of Land, Housing, Water and Energy of the autonomous region and is not run by the United Republic (that is Mainland Tanzania and Zanzibar). The energy sector in Tanzania (Mainland is under the Mnistry of Energy and Minerals (MEM 2015).
2 For statistical purposes, the GoT uses two definitions of electricity access: (i) at household level: 1 connection implies 1
household connected to electricity; and (ii) at community level: access implies that any person within 600 metres of the low voltage distribution line(s) (33 kV, 11 kV or 0.4 kV) has access to electricity services (MEM 2015).
3 Electricity access rate is ”the percentage of population with electricity access calculated as % of households with a
connection to an electricity service” (MEM 2015).
4 According to IEA (2016), there is no universally agreed upon definiton for modern energy services but most of the existing
definition share some commonalities. These common aspects in defining modern energy services include; household having access to a minimum level of electricity, access to modern energy that allows productive economic activity such mechanical power for textile, agriculture and industries .having access to modern energy for public services such as health facilities, street lighting and schools and lastly household access to sustainble and more safter cookign and heating fuels and stoves (IEA 2016).

16
necessary in parallel with increasing generation capacity in Tanzania.In light of the above, exploring renewable energy resources makes sense especially as the portfolio for renewable energy technologies becomes increasingly competitive (IEA 2013). Furthermore, traditional energy sources are increasingly becoming unacceptable, unreliable and unaffordable (WFC, 2012).
Figure 1-1: Africa's energy landscape (Source: IRENA 2015).
Different nations and regional blocs may have different incentives behind exploration of renewable energy (RE) sources and hence diversification of their energy mixes. Key drivers include global climate change concerns over continued use of unsustainable non-renewable resources, energy security and energy access (ESD 2007). Depending on where one is, some concerns may be of higher priority than others. For some, energy security is a key driver while for others it is still as basic as ensuring access to reliable and affordable modern energy services for all. At an intergovernmental level, energy access is being promoted through one of the seventeen Sustainable Development Goals (SDG’s) adopted in 2015. The SDGs set several goals addressing different issues (health, education and climate change amongst others), aimed at protecting the planet, eradicating poverty and improving living standards for all (UN 2016). The seventh SDG is set to ensure “access to affordable, reliable, sustainable and modern energy for all” by 2030 (UN 2016). Specific targets within this goal include amongst others increasing the share of renewables sources in the global energy mix. Also with the same objective in mind but driven by a mix of different stakeholders from civil society to private sector and government under the UN Secretary General, the Sustainable Energy for All (SE4All) echoes a similar message of ensuring access to modern energy for all is realized by 2030 (SE4All 2016). The other two global objectives besides increasing access associated with this initiative include improving energy efficiency and again increasing the share of renewables in the total energy mix also within the targets of the seventh SDG. Tanzania is one of the few countries in Africa to get a head start on adopting the SE4All initiative and as of December 2015 the nation submitted both its Action Agenda and Investment Prospectus under this initiative. It joins the Gambia and Kenya that also fall within the well advanced

17
countries with regards to submission of these two key guiding documents for country level implementation of the energy agenda (AfDB 2015b; WWF 2016). Both these global initiatives see energy access for all as key to achieving any nation’s sustainable development aspirations. While the 2014 Africa energy outlook report projects 1 billion people in Sub-Saharan Africa (SSA) gaining access to electricity by 2040, one still has to consider the rapid population growth in the region. “It is also the only region in the world where the number of people living without electricity is increasing, as rapid population growth is outpacing the many positive efforts to provide access” (IEA 2014) The picture is rather bitter-sweet as 530 million people in the region are said to remain without access to electricity by 2040 particularly in rural areas (IEA 2014). Rapid population growth can make it difficult for developing nations to meet the set development targets. In Tanzania four frameworks are key to ensuring broad economic growth and human development. These include the overarching Tanzania Development Vision 2025 that sets the platform for achievement of several sector goals within it enabling the economic structural change needed for its realization. The other three frameworks that build on the broad TDV 2025 and enable implementation of it are: the National Strategy for Growth and Reduction of Poverty 2010/11- 2014/15 (NSGRP), the Long Term Perspective Plan 2011/12-2024/25 and the Five Year Development Plan 2010/11-2015/16 (UNDP 2015). Set to ensure Tanzania moves up from being one of the countries with the lowest per capita income USD 640 in 2014 to one with a per capita income of at least USD 3000 by the year 2025, these frameworks are setting the path for a higher level of human development. (MEM 2014). Realization of the 2050 vision according to studies by IGC (2012) and ESRF (2014) will change the pattern of economic growth, from low-agricultural productivity towards becoming semi-industrialized. In line with this the service sector will play a bigger role. Figure 1-2 provides an overview of the planned transformation as projected by the President’s Office Planning Comission (POPC). Each period in the implementation of the TDV 2025 has a set out development plan with a particular theme and set targets.
Figure 1-2: Achieving the objectives of TDV 2025 ( Source: URT 2012).

18
The paper draws out political economic influences in the Tanzanian context and how these impact delivery of reliable electricity to cater to the countries development aspirations as highlighted above. To industrialists in the country unreliable and expensive electricity supply is the greatest threat to progress (Deloitte 2015). For a country that is gearing to have a competitive manufacturing sector employing 40 percent of the sector by 2020 as per the incumbent President’s manifesto and a competitive agro-industry sector, meeting energy demand is pertinent (Ikulu 2015; URT 2012). For countries like India, the agro-industry sector has enabled increased modern energy access to rural communities and Mauritius has also managed to capaitalize on the sugar industry alone with co-generation in Mauritius at 40 percent (Dasappa 2011; Pode 2016).
For a country whose agricultural sector employes over half of the population (most of this in rural areas), there seems to be a mismatch between jexisting potential (theoretical and technical) and the practicies and targets set for biomass cogeneration in 2030. The aim of this paper is to first set out the broader issues influencing the economically inefficient nature of electricity generation using domestic resources. Then departing from a political economy point of view, explore to what extend political interferences in sector operations and economic inefficiencies associated with this might trickle down to biomass cogeneration activities and the slow pace of scaling up operations.
1.1 Problem definition
Set to expidite economic growth and enable development as per 2025 TDV, the Government of Tanzania (GoT) has targets of increasing the percentage of population connected to electricity from 24 percent in 2014 to 50% by 2025 and at least 75% by 2033 (MEM 2014). Ensuring at least 75 percent electrification by 2030 is reiterated in the country’s SE4ALL targets within the first global goal of universal access to modern energy services according to this global initiative. To facilitate electrification targets is the plan to increase installed capacity from 1500 MW to 10000 MW by 2025 (MEM 2014). That is a 6-fold increase from existing capacity based on 2014 figures.
Currently commercial energy supply (petroleum and electricity) is mostly from imported oil. Over 90 percent of the non-commercial energy supply comes from unsustainable use of traditional biomass on which rural communities are heavily reliant on (MEM 2014). With demand for electricity growing at 10 to 15 percent on average annually, the Government of Tanzania (GoT) has to plan strategically while taking into account that the size of the population it has to enable energy access to is not static.
Most national strategies on scaling up rural electrification in Africa reiterate the need for a two track approach as the best way of enabling greater access to grid-based electrification in the long run. This according to the World Bank (2014) entails a mix of a centralized and decentralized track. The first path is the more familiar and traditional approach in most African nations, driven by National Government entities. In this approach a national utility, the Energy ministry and/or a rural energy agency are key in ensuring grid electrification either collectively or individually (variations exist). Here electrification is mainly5 through extenstion of national grid. The second approach, for which most countries in Africa, Tanzania included have minimal experience with is electrification driven by private entrepreneurs, community user groups or cooperatives operating isolated mini-grids or small generators
5 In the centralized approach grid extension is the primary means of electricity provision but this does not entirely exclude
other means.

19
(using fossil fuels, renewable fuels or hybrid systems) providing power to one or more local community (World Bank 2014).
Implementation of the decentralized track via minigrids for rural areas where grid extension is limited in most SSA countries requires clear and credible policies and regulations should the key players in this approach per take in it (World Bank 2014). While the government has acknowledged the need for grid together with off-grid solutions due to limitations presented by geographical, demographic and financial aspects, the country seems to still lean on the traditional centralized track and engagement with the decentralized track remains limited. The structure of the ESI in Tanzania is such that electricity generation, transmission, distribution and sale of electricity to consumers is dominated by National Government entities. Studies have shown that in several African countries the power sector as driven by a national utility can involve use of political leadership influence to ensure the existing utility work in the national interest (World Bank 2016). Tanzania is no exception with an electricity supply industry (ESI) with a utility whose only shareholder is the government. Several studies indicate that decisions in the energy sector have been highly politicized with several big corruption scandals in procurement of generation power implicating prominent politicians, domestic industrialists, high level government officials and multi-national companies in illegal activities (Gray 2015; Gratwick et al. 2006).
The fact that the energy sector planning process is highly politicized, poses a concern for the attainment of a generation capacity of 10000 MW by 2025 and subsequently the move to a middle income country. Impartial and sound decisions are instead replaced with decision based on power relations and political incentives domestically and also through external influences (World Bank 2016).Energy governance and finance in developing countries tends to be influenced by development aid and international institutions (Moner-Girona et al. 2016). Tanzania is no exception. As one of the top 10 recepients of aid from OECD Development Assistance Countries (DAC), it is therefore of political significance for the country to maintain relations with key donors based on development partnerships (The Royal Institute of International Affairs 2016). Power sector reforms and projects geared to increase generation capacity are on the way in Tanzania at least in theory but flexibility of decisions faces international influences as is the case in many African countries.
International pressures call for a transition to low carbon development paths (AfDBb 2015). In this light the TDV 2025 is set on the foundation of sustainable development principle that calls for progression of current generation while ensuring the future generation remains well catered for by existing natural resources in the country (URT 1999; REDD Desk 2016). That being said together with other planned developments, Tanzania is looking to tap into the largely unexploited renewable energy potential ranging from hydropower, biomass, geothermal, wind and solar. Large hydro is the one energy source that plays a major role in the countries renewable energy mix but it is vulnerable to droughts. According to AfDBa (2015), Tanzania’s total generation capacity from renewable energy (excluding large hydro) is only about 4.9% including captive generation in sugar, tannin and sisal factories, solar and small hydro plants. Therefore what is regarded as existing renewable generation is mostly from large hydro. Room exists for use of more small-scale decentralized renewables in the energy mix to cater to remote rural areas.
For an economy that remains highly dependent on agriculture (28.8 percent of GDP in 2014) a case can be made for capitalization of the sector (via sustainable biomass use) to ensure the set goals of increasing renewable energy and ensuring rural electrification are met (UNDP 2015; Deloitte 2015). Agriculture employs most of the Tanzanian labor force (76.5% of total

20
employed) (UNDP 2015). This is above the share of those employment in agriculture as a percentage of total employment in SSA as a whole which is at 59.6%. The agricultural sector provides field and process residues post-harvesting that can be used to cater for industrial energy needs and household needs provided the right incentives are in place. Agricultural residues to generate energy is a relatively less risky bioenergy pathway as it avoids the conflict of interest with other land uses and land use changes ( Terrapon-Pfaff 2012) .
The Tanzanian agro-industry sector has great potential and incentive for engaging in rural electrification using agricultural residues (Abdallah 2010). Existing and potential sources of agricultural residues include sugar, coffee, sisal, rice, cashewnut, maize, coconut, cotton and banana (Gwang’ombe 2004; Terrapon-Pfaff 2012). According to the AfDBa (2015) the needed biomass feedstock is abundant. Estimates presented in the country's profile place sugar bagasse 6 at 1.5 million tons per year (MTPY), sisal and rice husk7 both at 0.2 MTPY and lastly coffee husk at 0.1 MTPY (AfDBa 2015).
While the agro-industries seem to have sufficient feedstock based on these estimates, and the incentives is there as the activities in most agro-industries have a demand for process heat/steam the targets set by energy planners do not match the existing potential. The targets in the 2012 Power System Master Plan (PSMP) for biomass cogeneration8 by 2030 involve increasing from 35 MW installed capacity in 2014 to only 64 MW by 2035 (MEM 2015). This target implies an addition of only 1 MW every 6 months in the 21 years from 2014 to 2035. Within the sugar industry alone potential for bagasse co-generation expansion is in the order of 30 to 40 MW with the current plant capacity (Camco 2014). While the GoT maintains it has huge plans for sugar expansion, its biomass co-generation targets are not reflective of the existing potential in the country. This 2035 target does not even double the 2014 capacity, whereas targets for other energy sources are relatively more ambitious. The prepared Biomass Energy Strategy (BEST) clearly attests to the lack of prioritization of biomass and specifically co-generation by the MEM (Camco 2014). The draft National Energy Policy (NEP) 2015 acknowledges that “there are some inconsistent efforts from different orgnisations of generating electricity from agricultural wastes such as sisal wastes and rice husks” (MEM 2015: p17).There is a clear disconnect between the existing potential and the minimalistic planned biomass co-generation targets ahead of attaining the TDV 2025. While part of this disconnect has been answered by studies on the theoretical and technical potentials of biomass co-generation in specific agro-industries, political-economic dynamics of the energy sector as a whole and how these might potentially explain marginalization or deprioritization of biomass co-generation in the Tanzanian agro-industry remains largely unexplored.
The nature of the power sector is argued to make it particulary vulnerable to corruption abuses and the political economy of African countries contributes to enabling shortsighted, incoherent and prone to corruption policies in the sector (Barnett et al. 2016). The power
6 Bagasse is shredded and crushed sugarcane left over from sugar production (World Bank 2014).
7 Rice husk is the outer most protective layer of the paddy grain that is left as residue after separation from the rice grain
during the milling process (Pode 2016).
8 Cogeneration is an electricity generator that produces electricity and captures process heat for altenatives productive
purposes (World Bank 2014) . Either fossil fuel or renewable sources (such as bagasse) would be used to generate electricity in a cogen system. In a conventional power plant this process heat would normally be wasted as it is released into rivers or cooling towers but a cogen system therefore allows capturing of this waste heat from electricity generation process . Agro-industries such as sugar estates already have an existing need for process heat for mill operations, therefore the incentive to also generate electricity is there espcially if there is room to sell this to the grid. Productive use of exhaust heat in cogeneration saves a considerable amout of fuel relative to running separate sources of industrial heat and electricity.

21
sector in Tanzania is no stranger to large corruption scandals associated with public finance and non-transparent contacts. According to the Royal Institute of International Affairs (2016) eight ministers of energy and minerals have resigned or been sacked since 1995 after being implicated in corruption scandals.
Political interfeance has been linked to the power sector performance in Tanzania on several aspects (Gatwick 2006; World Bank 2014; World Bank 2016). The political nature of planning in the power sector and ad hoc actions set by MEM, TANESCO and EWURA in addressing poor performance in the sector, leave room for questioning the influence of the political economy on the slow pace of agro-industries and their role in enabling rural electrification. For a country currently geared for industrialization of local manufacturing sector and creation of more competitive agro-processing sector as reitarted by the incumbent President and the TDV 2025 time line, it seems pertinent that solutions are found that fill this gap.
A political-economy analysis (PEA) would allow an understanding of why electricity supply sub-sector plans that are beneficial to the economy and society at large are difficult to implement. Understanding this would allow one to guage the extent to which electrification and generation targets within TDV 2025 are realistic withinin the local political and institutional context. Plus it would allow for suggestion of solutions by exploring incentives needed and disincentives to be removed with the agro-industries to scale up operations.
1.2 Research question
Prevalence of political influence and incentives in power sector decisions and poor ad hoc planning is slowing down the process of effectively increasing generation capacity. In line with set development goals in the country, the two research questions addressed in this paper are as follows;
Why has the Electricity Supply Industry in Tanzania struggled to provide reliable power to facilitate state development aspirations? A key driver of any economy the power sector needs to be financially sustainable to perform its functions and reliably deliver to dependent sectors such as industries and households. For successful development a reliable electricity supply industry (ESI) remains a necessary pre-condition (iisd 2014). That being said the first research question, departing from a political ecomony perspective tries to address why the Tanzania fails to harness existing resources in an economically efficient way and draws out potential implications for TDV 2025 targets.
What incentives and disincentives are needed to enable up-scaling of agro-industry co-generation in Tanzania?
1.3 Method
Several methods were used to gather data, to reduce inevitable uncertainty and to provide a more comprehensive picture as multiple methods allow for triangulation. In this particular case the aim of triangulation was to facilitate better understanding of the topic and to some extent to examine consistency of data sources (Denzin 1987; Patton 1999). In this paper, triangulation allows for comparisons between different viewpoints between agro-industrial stakeholders and national entities responsible for the ESI.
Firstly, a detailed review of existing literature and scientific reports on Tanzania’s development plans, energy sector and electricity sub-sector was done. This allowed for a broad

22
understanding of the planned development path for the country and linkages between development goals and planned energy investment plans. This also allowed an understanding of key players in the energy sector at large and existing agro-industries.
Secondly, informal interviews were conducted with experts and researchers at NGO’s, research think tanks and companies involved in renewable energy projects to get a better understanding of the context and also get information and contacts of other key stakeholders and relevant institutions in the power sector. Thirdly, formal semi-structured interviews were conducted with a selection of eleven key stakeholders using guiding questions (Appendix B) .Most of the interviews were one on one. However, for some institutions, interviewees felt it best to involve all relevant people available at the time for better gathering of information based on their areas of specialization.Snowballing techniques where used to identify further stakeholders to interview and data sources. Regarded as one of the broader definitions provided amongst stakeholder theorists, Freeman (1984) defines a stakeholders within a firm’s environment as “any group or individual who can affect or is affected by the achievement of the organization’s objectives”. The organization and list of interviewed stakeholders is on Appendix A. The selection process was guided by the theory of stakeholder identification and salience developed by Mitchell et al. (2007) that argues for existence of classes of stakeholders and develops variables that can be used to identify these stakeholders. The theory is based on selection of relevant stakeholders based on them possessing at least one of the following attributes or variables; power, legitimacy and urgency. It argues for existence of classes of stakeholders based on; “the stakeholder power to influence the firm, the legitimacy of the stakeholders claim on the firm and the urgency of the stakeholder’s claim on the firm” (Mitchell et al. 2007: p854).
At government level, an interview was conducted at Vice Presidents Office (VPO) Environment Division9, providing insights on the direction of renewable energy and particularly low carbon development paths in various sectors in Tanzania. The VPO’s influences all stakeholder activities and links agricultural and energy sector operations to broader international agenda’s such as climate change. In addition, sectoral level actors were interviewed to give insights on regulations, rural electrification, electricity generation, transmission and distribution. The stakeholders include Ministry of Energy and Minerals (MEM), Energy and Water Utilities Regulatory Authorities (EWURA), Tanzania Electric Supply Limited (TANESCO) and the Rural Enegy Agency (REA) respectively.
At agro-industry level interviewed stakeholders included, the Tanganyika Sugar Corporation (TPC) in Kilimanjaro Region; Mkonge Energy Systems (MES) based in Tanga Region and Husk Power Systems (HPS). Other stakeholders interviewed include the Sugar Board of Tanzania (SBT) and Tanzania Traditional Energy Development Organisation (TaTEDO). And lastly, provided it was possible within the time-frame, observations were done during site visits to better understand the surrounding environment and context.
1.4 Limitations and scope
This paper will focused on agro-industries as platforms for rural electrification and increasing access to clean energy in Mainland Tanzania10 only. Specific agro-industries looked at include
9 The Environment Division was under the Ministry of Natural Resources and Tourism in 1991 and got pushed to the VPO’s
in 1995 to give the management of environment agenda better management and priority. The Director of Environment is has to oversee three areas within the Environment Division. These include the Environmental Pollution Control Section; Enviromental Assessment Section and Environmental and Natural Habitat Conservation Section (VPO 2010).
10 This is because as a semi-autonomous region Zanzibar governs its own energy sector and implements separate policies and
plans with regards to its own energy system (MEM 2015).

23
both those with on-going and upcoming energy projects with operations looking to generation electricity or heat from agricultural residues.
Geographically this paper is limited to electrification in rural areas only. National 2012 census indicate that up to 70 percent of the population live in rural areas. The vastness and low population density of the country amongst other constraints, limits most grid power access to urban areas.
Agricultural residues in the context of this study includes only crop process11 residues and excludes animal manure feedstock. While by definition agricultural residues include animal manure feedstock, a study by Terrapon-Pfaff et.al. (2012) sheds light to the lack of practical feasibility associated with acquiring sufficient wet dung (animal manure) to utilize as feedstock. This is due to the domination of the livestock sub-sector in Tanzania with small scale free-range farmers as opposed to large commercial scale and dairy farmers. According to FAO & AGAL (2005) 99 percent of the livestock belongs to traditional farmers. Biomass feedstock used in the projects investigated is only crop based.
Industry stakeholders interviewed were only limited to two sugar, one sisal, and one rice operation. Specific agro-industry projects within different crop categories in the country would allow for engagement with the broader issues but also some specific dynamics within the specific domestic crop markets. These stakeholders all generate electricity or have the potential to generate electricity and capture waste heat as a secondary activity to sugar processing, sisal processing and rice farming.
While the above, agro-industry sectors covered during interviews allow for diversity across the sector due to the specific nature of each sector generalization across the entire sector might be limited. While sugar estates might be regarded as similar in operation (all use bagasse to generate electricity for at least some operations within the estate), differences exist based on historical context, ownership structure, capacity and surrounding geographical influential factors.
1.5 Audience
My thesis is meant to provide insights to energy sector stakeholders (policy and decision makers) and stakeholders in the agricultural sector and industries associated with this sector. By investigating the key driver and barriers to scaling up of agro-industrial operations and generation of electricity or heat from process waste, the thesis provides an understanding of bottlenecks and a first step towards addressing existing bottlenecks.
Policymakers based on insights from industry might be able to better facilitate incentives for expansion of existing operations and further investment in the Tanzanian agro-industrial sector. A political-economy analysis would enable existing agro-industry sector actors and those considering energy investment in this area to better understand the context and limitations of Government entities responsible for electrification in the country. A PEA allows agro-industries to understand what going beyond food processing and internal electricity generation means within the local political and institutional context and under the oversight of a politicized ESI.
11 Different crops have varying residues,but two key distinctions can be made between field and process residues. Field
residues are those that remain in the field after harvesting. Process resdiues are a result of crop processing (Terrapon-Pfaff et al. 2012).

24
1.6 Disposition
Chapter 1 presents the nature of the problem in this research. Focusing on two research questions addressing why the status quo is as it and what can be done to improve it, this chapter goes on to elaborate on methodolody for data collection, methods, limitations and the targeted stakeholders or audience.
Chapter 2 starts with a broad review of literature on biomass as an energy source and then dives into specific cases within the agro-industry sector. Here, key influencial studies in the field and cases of countries that have extensively explored agroindustries and clean energy services are presented. After that the chapter moves into the specific Tanzania country context and elaborates on the energy sector structure, key stakeholders and institutions and legal and regulatory frameworks. Towards the end, barriers for renewable penetration in Tanzania are drawn out so as to allow understanding of contraints.
Chapter 3 presents both the results and analysis. Literature review analysis is applied together with interviews to establish findings. A political economy framework is applied.
Chapter 4 discusses and reflects on results, analysis and the research process.
Chapter 5 summarizes the main findings and recommendations going forward.

25
2 Literature analysis
2.1 Biomass Cogeneration
In order to address the issues stated above, a variety of solutions have been proposed, including biomass energy. Biomass12 resources, which can either be plant or animal organic matter can be exploited by humans for different purposes. When plant based material or biomass is utilized to generate energy (electricity, heat or fuels) it is commonly referred to as bioenergy (McCormick, 2007). Extensive studies by Berndes et al. (2003) and Hoogwijk et al. (2005) explore biomass energy potential under different scenarios. Different definitions of biomass exist and these influence the variation of results from different studies. The geographical areas covered, feedstocks considered and timeframes influence biomass potential (Thrän et al. 2010). A study on biomass potential by Kaltschmitt et al. 2009 further breaks this term into four categories; theoretical, economic, technical and implementation potential (Thrän et al. 2010). Berndes et al. (2003) does a review of 17 studies and the estimates varied from 100 EJ/yr to above 400 EJ/yr. Whereas Hoogwijk et al. (2005) got estimates in 2050 between 311-657 EJ/yr, and between 395-1115 EJ/yr for 2100. Unlike the review of 17 studies, Hoogwijk et al. (2005) focused only on the geographical and technical potential of energy crops from the timeframe 2050-2100. Even though differences exist for biomass potential due to uncertainties associated with crop yields and land availability, several studies have clearly shown that bioenergy has the widest diversity of energy products (McCormick 2007; Thrän et al.2010). The land limitation to biomass as feedstock for renewable energy is related to the multi-functionality of land. When one produces bioenergy from agricultural residues this limitation is not relevant. However, when producing energy crops13 on agricultural production systems, land issues become highly relevant. Land has too many already existing competing uses such as food production, livestock feed, timber, fiber production, climate protection and nature conservation (Popp et al. 2014). Global biomass trends based on a RE roadmap for 2030 prepared by IRENA (2015) indicates that biomass use globally will grow at an annual rate of 3.7% between 2010 and 2030. This is twice the rate of growth of biomass between 1990 and 2010. Therefore room exists for biomass accounting for a bigger chunk of the global energy mix as global demand is expected to double from to 108 EJ by 2030 from only 53 exajoules (EJ) in 2010. However, while biomass is clearly recognized as an important feedstock for renewable energy, it is just as clear that for a transformation towards a sustainable energy supply to be achieved, the application of biomass needs to change (UNDP 2000; IEA, 2009; Thrän et al. 2010; Sokona et.al. 2012; IRENA 2015). Traditional, mostly unsustainable uses of biomass such as wood-burning fires and cooking stoves results in health implications for the user related to indoor air quality and environmental implications (Hoogwijk et al. (2005); IRENA 2015; Karlberg et.al. 2015). This is particularly relevant for Asia and SSA whose populations substantially rely on solid biomass for cooking.
12 Biomass is carbon based and the carbon is absorbed from the atmosphere as carbon dioxide (CO2) by plants using energy
from the sun.
13 Energy crops are scpifically grown crops for energy generation purposes (fuel, electricity or heat) on agricultural lands.

26
Currently up to 80% of the population in SSA still depends on traditional biomass for cooking which entails the use of foraged wood in inefficient stoves. In SSA biomass has to support a great fuel demand from an energy sector that is 80-90% based on traditional biomass (IEA 2016). Not all existing biomass is used for energy purposes and therefore bioenergy production is in competition with other priority applications such as food and fodder (European Commission 2005; Karlberg et al. 2015). These competing needs place great pressure on biomass resources. In East Africa unsustainable over exploitation of ecosystems is already greatly attributed to the competing demands on biomass. (Karlberg et al. 2015). According to Berndes et al. (2003) this competition between biomass resource uses and competition between alternative technologies and primary energy sources ultimately influences biomass energy potential. With this in mind, a transition from traditional uses of biomass to modern14 uses is imperative. Modern renewable technologies, particularly modernization of biomass use, offers potential to empower local communities in rural areas. Biomass resources cannot always be directly used to generate energy. Different conversion technologies (thermochemical, biochemical and mechanical) come into the picture depending on the raw material or feedstock used and the final product required (European Commission 2005; McCormick, 2007). When biomass feedstock is converted into high-quality energy carriers, such as electricity and liquid fuels for transportation as illustrated on Appendix C, it is regarded as modern energy. A good example of one is using sugarcane as feedstock for ethanol production in Brazil (Khatiwada et al. 2016). The rest of this literature review will be restricted to only to agricultural residues (non-woody biomass) as per Appendix C on biomass categorization. Agricultural residues unlike energy crops15 for electricity generation is relatively less risky conditional upon there being no major competitive uses for the feedstock. The ability of agro-industries to reliably deliver cleaner energy services for their own use and provide energy for rural communities is conditional upon creation of an enabling environment for investment to take off. An enabling business climate is a prerequisite for prosperity of entrepreneurs and eventually for economic development (UNIDO 2011). A workshop by FAO on enabling environments for agro-industries and agro-businesses identifies a need for investment in sufficient infrastructure, research and development technology transfer, legal and regulatory frameworks and financial services for success of agro-industries. In addition, macroeconomic and political stability, human resources, efficient land markets and tenure systems are also relevant (FAO 2008). UNIDO (2011) reitariates some of these factorsas core pillars of agro-business development in Africa. Assessing Tanzania’s potential to take this agro-industrial path to support rural electrification requires identification of the above features within the country. The pertinent need to explore all avenues for rural household electrification in Africa is obvious (IEA 2011). Huge disparities exist between rural areas and urban areas, with those lacking modern energy access mostly being in rural areas in SSA and in Tanzania. In SSA, rural
14The distinction between modern and traditional biomass use is determined by the output or final product of the conversion
process.The distinction between modern and traditional biomass use is determined by the output or final product of the conversion process (Hoogwijk et al. 2005).
15 Energy crops are specifically grown crops for energy generation purposes (fuel, electricity or heat) on agricultural lands. These face a relatively greater risk when used to generate energy due to competitive land use as scarcity of arable land increases. Scarcity of arable land places food security at risk, which creates a much bigger problem especially for developing countries.

27
household electrification is less than 10 % (ESD 2007). The residential sector is the largest consumer in Africa with about 60% of total energy consumption (Sokona et al. 2012). This, according to Sokona et al. (2012), is indicative of limited or low level of energy supplies for productive applications. While supply side approaches tend to be the focus when it comes to electricity access, these could be complemented with demand side approaches provided the willingness exists. Agro-industries such as sugar, tea, tobacco and coffee are well situated to benefit small and medium-sized enterprises by generating electricity and other fuels from their waste. Sugar bagasse (a sugar by-product) can be used to generate electricity. This energy could be used to self-supply SMEs operation and also supply energy to surrounding local communities (UNECA 2006; FAO 2008; Smithers 2014).A good established example with regards to agro-industries and energy generation is Mauritius, which generated about 25 percent of its electricity from the sugar agro-industry by 1998 (bagasse-based and heat generation) as early as 1998 (UNECA 2006). The process was indirectly driven by an investment by the World Bank/GEF sugar bioenergy project. Dispersing 6 million USD for sugar mills to improve efficiency and provide bagasse for power generation between 1994 and 1996 had several ripple effects .One of the implications of this investment is bagasse power plants by sugar mills within the project and even those not in the project took up the challenge. As a result bagasse electricity generation increase from 70 GWh/yr in 1992 to 118 GWh/yr by 1996. More recent statistics put power from sugarcane co-generation in Mauritius at 40 percent (Dasappa 2011). Policy implications included the development of a guiding framework for independent power producers (IPPSs) (UNECA 2006). This energy can be feedback to the grid provided the utility has the take up capacity. However, there is a growing consensus that both centralized and decentralized (off-grid and isolated) approaches are needed to deliver both sustainable and reliable energy access in rural communities (IRENA 2015). In Tanzania key existing and potential crops (food and cash crops) that can generate residues for energy processing include rice, coffee, sisal, sugar, chasewnuts, maize, coconut, cotton and banana . Variations on the theoretical and practical potential exist. Process residues are said to have more potential than field residues in terms of logistics of utilizing the biomass. The cogeneration potential in Tanzania remains largely unexploited with the most developed activities being in the sugar sector. However, a pilot project in Hale started operations using sisal residuesas feedstock to generate biogas via anaerobic digestion (Terrapon-Pfaff et al. 2012). Plans are underway to expand operations in the sisal sector.
2.2 Political economy approaches
Meeting electricity needs organizational and technical organization capacity that is mostly lacking in developing countries (Barnett et al. 2016). In attempts to improve service delivery in several sectors (energy, infrastructure, water, health), the development community has progressively developed different frameworks to allow for better understanding of context. Frameworks for analysis can have several dimensions; social, technical, political and economic. Specific to attaining development, arguments have been made for considerations of both political and social aspects in determining development outcomes.
“One of the main weaknesses of recent development discourse has been its detachment from political and social realities”. Landell-Mills et.al. (2007 p1).
The donor attention given to political economy frameworks had initially been so as to improve on previous blanket interventions and allow for more useful and context specific interventions.

28
Currently, political economy analysis (PEA) frameworks are pressured to have operational relevance and go beyond simply informing donors of what interventions not to apply to what contexts. In addition, the development community was beginning to struggle with why after so much effort and support, so many well developed ideas and plans related to international development do not lead to successful and fruitful realizations The African power sector is no different, with donor investment and support not resulting grand improvements (Barnett 2014). Reforms in the electricity sub-sector and lack of progress in shifting to low carbon development paths via renewable energy cannot simply be explained by the traditional factors such as lack of technical and financial capacity. Underlying ‘political-economy’ bottlenecks are increasingly being associated with the lack of progress in the electricity sub-sector and delivery of services within it (Barnett 2014). A study by ODI (2011) explores the evolution of political economy frameworks from its more academic rooted origins as it develops to involve more applied approaches. They them try to do an assessment of the applicability of these frameworks in the water supply and sanitation sector. They also argue that while financial and technical aspects are just as important, a great deal of the shortfalls with service delivery in this sector can also be attributed to power and inequality aspects and lack of political will and poverty (World Bank 2008; ODI 2011). Therefore understanding underlying political system is important. The same arguments is presented by ODI (2013b) regardless of the variations in these public sectors, certain political and governance related opportunities and constraints surround delivery of services in these sectors. PEA is a means of understanding these political and economic processes than may become constraints or provide opportunities. As defined by Collinson (ed) (2003 p3) “Political economy analysis is concerned with the interaction of political and economic processes in a society: the distribution of power and wealth between different groups and individuals, and the processes that create, sustain and transform these relationships over time” This definition was later adopted by the Organisation for Economic Co-operation and Development (OECD) and Department for International Development (DFID) and it is the definition applied in this paper. Originating from amongst several academic disciplines and going as far back as the early 19th Century, the early reflections on blending political with economic aspects are seen in the work by Karl Marx, Adam Smith and David Richardo amongst others. These early definitions of PEA therefore were are the center of the field of economics. This ‘new political economy perspective’ (NPEP) or as referred to by Landell-Mills et.al. (2007) is tailored to meet challenges of international development and reflects the recognition by those in the donor communities that traditional explanations will not suffice. This NPEP is a move away from traditional academic nature of linkages between political and economic institutions and processes to a more multi-disciplinary approach (Landell-Mills et.al. 2007). It aspires to meet these developmental challenges by taking the academic origins of PEA into consideration and blending them with the ‘new institutional economics’ plus the study of cultural norms, ethnicity and social processes (Barnett 2014). Political nature of developmental processes requires a unique approach and location specific research to ensure clear understanding of local contexts. Development outcomes are greatly influenced by political processes, dynamics of different decision makers, incentives and motivations behind them and both formal and informal institutions and structural features of developing countries (ODI 2011; Barnett 2014). Analysis of the political-economy according

29
to ODI (2011) can be done at three different levels and each of these has its strengths and weaknesses; Macro-level country analysis: provide broader background information and can be a good starting point for more focused analysis in the future. Most applied for sensitization to a country context. Meso-level sectoral or cross cutting analysis: likely to enable better understanding of interests and incentives within a sector but can also be limited in its approach as it forgoes linkages between national level and sector level operations. Micro level problem driven analysis: the potential for achieving operational relevance is high conditional upon a clear definition of the ‘problem’. This level of analysis according to ODI (2013a) allows one to go beyond simply pointing out ‘salient features of the political context in which development interventions take place” However, by zooming into a specific problem one is overlooking broader level (regional, national, international) political and economic influences. It is therefore not recommended for practitioners to treat one of the levels as an alternative to others. Generally the tendency as one at doing a narrower or more specific analysis, is to do so within a broader macro-level analysis. Different tools used within most applied PEA has the following core common analysis components; instituions, actors, incentives and structural factors. Actors are stakeholders (either individuals or organizations) with interest or influence on the issue in question. Incentives are punishments and rewards perceived by individuals to be related to their actions and those of others .Ostrom et al. (2002). According to Ostrom et al. (2002) these are generated within institutions and can be pervasive or not. They can be material or non-material incentives. Generally good institutions incentivize coordination and wealth creation and if institutions do not exist or those than do are bad, self-seeking and socially perverse outcomes might be incentivized. They are external stimuli. Institutions are rules of operation that govern behavior of actors. These may be formal as well as informal rules. They tend to be more susceptible to change in the medium terms than structural features. Examples include political and public administration processes. (DFID 2004; Moncrieffe and Luttrel 2005). Structural features or factors set out the context within which the analysis needs to be applied and highlight systemic constraints on what is possible within this set out context. These features include demographic, geographical, historical, economic and social characteristics that influence political systems and the state (ODI 2013a). These factors are not readily influenced due to either the needed timescale for change or the fact that they are be determined outside the country. DLP (2014) present a distinction of PEA intro three approaches as indicated on Table 2-1 that differs from the layering approach as presented above. There are first generation, second generation and third generation approaches.The authors argue for a different way of thinking of the association between politics and development that is not so caught up in fitting this unpredictable complex dynamic into a set of tool kits as had been the case as approaches developed over time from first to third generation. “Thinking and working politically is not a framework or a toolkit. It does not fit easily into a log frame. It is a mindset and approach that requires a person to live and breathe it.” DLP (2014 p4).

30
DLP (2014) criticize the manner in which current PEA approaches have become about the economics of politics focusing on understanding behavior as driven by incentives. The authors portray current PEA approaches as lacking the analytical tools for understanding the core underpinnings of politics of development. PEA is critized as lacking the distinctive political nature of politics as illustrated in interests, power, ideas, agency, the role of contingency and the subtleties of building and sustaining coalitions (DLP 2014).
Table 2-1: Categorization of political-economy approaches (Source: Adopted from DLP 2014; ODI 2011).
PEA Category Features Key analysis components
First Generation set in the early 1990’s and mainly addressed issues of ‘governance’
Technical, administrative, managerial, capacity building and public sector management.
Second Generation
Managed to get away from the managerial approach of assessment based on a set of criteria -they ‘brought politics back in” exemplified by DFID’s country level drivers of change analysis, SIDA’s Power Analysis and the Dutch SGACA work
Historical, structural, institutional and political elements that shaped the context within which actors worked.
Third Generation
Combines elements of the first and second generation and are highly influenced by assumption, methods and concepts central to the field of economics. Political economy become economics of politics, and less about political analysis.
Institutional incentives and how they shape behavior to produce positive or dysfunctional development outcomes.
While different varations of political economy frameworks have recently been extensively applied, one cannot set aside the relevance of socio-technical theoretical/conceptual frameworks for improving understanding of processes of service delivery in the energy sector as a whole. Social realities after all do determine the outcomes of development. A complex relationship exists between the different stakeholders with regards to the success of renewable projects in developing countries. Several theoretical/conceptual frameworks have been applied by recent studies to try and better understand the existing dynamics. Ahlborg and Sjöstedt (2015) take a socio-technical approach to try establish a conceptual understand small scale rural electrification in Tanzanian villages. This study provides a good case study of how developers can deal with economic challenges and the need for local ownership in order to achieve sustainable electricity supply. This theoretical perspective is relevant in pointing out the co-evolution of technology and society and the complex relationship between technological change and multi-actor processes (Ahlborg and Sjöstedt 2015). The analysis of the political economy of decentralized approaches to rural electrification in Tanzania would be based on the NPEP. The analysis going forward would be problem specific (micro-level problem driven analysis) but drawing on larger power sector level and national and regional factors that influence the operations of the ESI in Tanzania. The PEA by Barnett et al. (2016) is currently being applied in a five year research programme known as Agro-industries and Clean energy (AGRICEN) that is exploring how agro-industries in SSA( Uganda, Malawi, Ethiopia and Kenya) could contribute to improving rural energy access (UCL 2016; Y. Mulugetta, personal communication, 11 March 2016). A more elaborate description of the PEA is provided on Appendix D.

31
The framework follows key four stages. The first stage is to identify the problem16 at hand.
Stage 2 is the diagnosis stage which draws out what features of the political economy enable persistence of the identified problem. This is where the four key components analysis components common to most PEA frameworks feature in the three interlinked sub-components within the second stage. These three sub-components of analysis in stage 2 include 2a: analysis of systemic factors 2b: analysis of actors and their decision-logics, their motivations and the power they have to pursue their goals 2c: analysis of dynamism, complexity and uncertainty. Here my particular analysis would mostly lean on sub-components 2a and 2b.
Stage 3 on Prognosis goes forward to try and bring out what practitioners sometimes refer to as ‘theories of change’. The sub-components within this then are identification of potential for change and likely source and pathways of change.
Stage 4 on Interventions attempts to now bring in the operational relevance aspects by understanding means of potentially shifting patterns of incentives in a manner than promotes change. This is therefore where entry points for action and recommendations come in as analytical sub-components. This will be covered to some extend as recommendations.
While recognizing that covering all components of the framework in depth within the timeframe of this paper is unrealistic, this framework will nevertheless be used to guide the stages of analysis the political economy of Tanzania and how it might influence scaling up of agro-industries operations in Tanzania and broader attainment of generation and electrification targets within the TDV 2025.
1. PROBLEM IDENTIFICATION
2.DIAGNOSIS
3. PROGNOSIS
4. INTERVENTION
Figure 2-1: PEA framework for power sector (Source: Adopted from Barnett et al. 2016).
16 A problem is understood as a specific difficulty, vulnerability or challenge encountered in pursuing a development objective
(Barnett 2015).
Systemic Factors
Dynamism, complexity and
uncertainty
Actors, power relaions
an decision logics
Likely sources and
pathways of change Overall likelihood of
change
Entry points for action Recommendations

32
2.3 Tanzania
2.3.1. Country Profile
Located in East Africa (Longitudes 29o and 41o East, and Latitudes 1o and 12o South), and officially known as the United Republic of Tanzania (URT) seen on Appendix E came to existence after the union of Mainland Tanzania (formerly known as Tanganyika) and Zanzibar (ZnZ) in April 1964.
Mainland Tanzania came into existence after Tanganyika becoming independent in 1961 under the leadership of Julius Kambarage Nyerere, who was a philosopher and a politician referred to by many in Swahili as Baba wa Taifa (Father of the Nation) or Mwalimu (Teacher). The main political party led by Mwalimu then known as the Tanganyika African National Union (TANU) was a party of mostly farmers, civil servants and teachers. This is now known as Chama cha Mapinduzi (CCM) in English ‘Revolutionary Party’ formed in 1977 (NBS 2015). It remains the only party to hold office since 1961 when it was still known as TANU till this very day under incumbent President John Pombe Magufuli. He is the 5th president of Tanzania and was elected into office in 2015. A presidential term last five years in Tanzania and the limit for each candidate is two terms. Tanzania has managed to generally hold peaceful election and transition processes over the years since colonial hand-over.
Zanzibar located in the Indian Ocean, 30k km off the coast of Mainland Tanzania is semi-autonomous and consist of the Zanzibar archipelago with many small island but two relatively large ones are Unguja and Pemba. Zanzibar has an area of about 2500 sq. km (NBS 2015). Prior to the Union Zanzibar has a long history of sultan ruling and Arab influence under the Sultanate of Oman. In the 19th Century, partly due to the political impetus associated with the movement to abolish slave trade (which was prominent in Zanzibar) the British Empire took over (Coulson 2013). After the British Protectorate was phased out in 1963 this enabled formation of full-government in Zanzibar, the first President of Zanzibar (Abeid Amani Karume) took over. However this was only after the overthrow of the last of the Sultan ruler during revolution of Zanzibar in January of 1964 (Coulson 2013).
Going forward in this paper, Tanzania would only refer to Mainland Tanzania and any references to the energy sector would also be limited to Mainland Tanzania. Mainland Tanzania alone has an area of about 883,600 sq km including 61500 sq km of inland water and a population of 43,625,354 according to the 2012 National Census (NBS 2015). The URT had a population of 44.9 million people based on 2012 National Census. More recent statics put the estimated population at 53 million in 2015 and the country is expected to have 64 million and 83 million people by 2025 and 2035 respectively (AfDBa 2015; MEM 2014). Figure 2-2 gives a good overview of population trend in mainland Tanzania and Zanzibar since 1950 and projections to 2100 (UN 2015).
Year 1950 2015 2030 2050 2100
Population 7650 000 53470 000 829 27 000 137136 000 299 133 000
Figure 2-2: United Republic of Tanzania population trends and projections 1950-2100 (Source: UN 2015).
At an annual population growth rate of 2.7 percent, Tanzania is adding about 1.2 million people per annum, which can put pressure of service delivery by GoT. Also the country’s’ population juvenescence nature can become a potential problem or an opportunity depending on

33
employed and education levels levels (UNDP 2015). Currently 44 percent of the population is below 15 years of age, which means if current employment opportunities are not sufficient and education quality remains low, the nation will struggle in attaining human development goals (UNDP 2015; TIC 2014). Key to our topic at hand is how the GoT would manage to attain electrification targets within TDV 2025, with the country projected to have one of the highest population growth rates between 2015 and 2050 (UN 2015). It joins 8 other countries17 that are expected to contribute to 51 percent of the world’s population increase between 2015 and 2050.
The capital city of Tanzania is Dodoma and there are 25 administrative regions (PMORALG 2014). The country only has two big cities, the commercial capital of Dar es Salaam and Mwanza on the shores of Lake Victoria. Dar es Salaam also serves as a huge port for the nation and also for surrounding land locked nations such as DRC, Malawi, Burundi, Uganda, Zambabwe and others.
According to the NBS (2015) primary economic activities mainly involve agriculture and mining with a share of 35 percent of GDP at current prices for Tanzania Mainland. Secondary activities entail manufacturing mainly, plus gas, electricity and water. These take about 20.8 percent share of GDP at 2014 prices. .And lastly under tertiary activities we have the service sector (i.e. retail and wholesale trade, communications and these take the largest GDP share at 44. 2 percent at 2014 prices (NBS 2015).
Agricultural Sector
Agriculture even with a relatively declining role still remains the backbone of the economy.Economic growth in the country has mainly been carried by this sector throughout history. According to the Ministry of Agriculture Food Security and Cooperatives (MAFC), agriculture accounts for 27 percent of GDP, a drop 28.8 percent of GDP in 2014 and in 2013 it was at 31.2 percent and in 2010 it was lower at 24 percent of the GDP in 2010 (UNDP 2015; Deloitte 2015). The country has a dual agricultural system with both small-scale farmers who are the dominant group and some commercial large scale farmers. Agriculture entails four sub-sectors within it; crops, fishing, livestock and forestry and hunting, but crops take the lion’s share of the sector. Average farm sizes for the prominent small-scale farmers depending on the location may range from 0.2 to 2.0 hectares (MAFC 2015). Key food crops include rice, maize, sorghum, bananas, plantains, potatoes, oil seeds, horticultural crops and fruits. Export crops mainly include coffee, cashewnut, sisal, tobacco, tea, cloves, spices and cotton (PBD 2016).
The sector employing most of the Tanzanian labor force (76.5% of total employed). This sector alone determines up to 70 percent of rural households income and this is where majority of the population lies (TIC 2014). The sector is above the share of those employment in agriculture as a percentage of total employment in SSA as a whole which is at 59.6%. This being said, one would anticipate key improvements in this sector to facilitate employment for the majority youthful population, but other factors prevail that are hindering increase productivity in this sector. The sector is not expanding as rapidly in terms of value addition of supply chain and foreign currency earnings.
17 The other 8 countries include India, Nigeria, Pakistan, Democratic Republic of Congo, Ethiopia, United States, Indonesia
and Uganda by order of contribution to the global population increase between 2015 and 2050 (UN 2015).
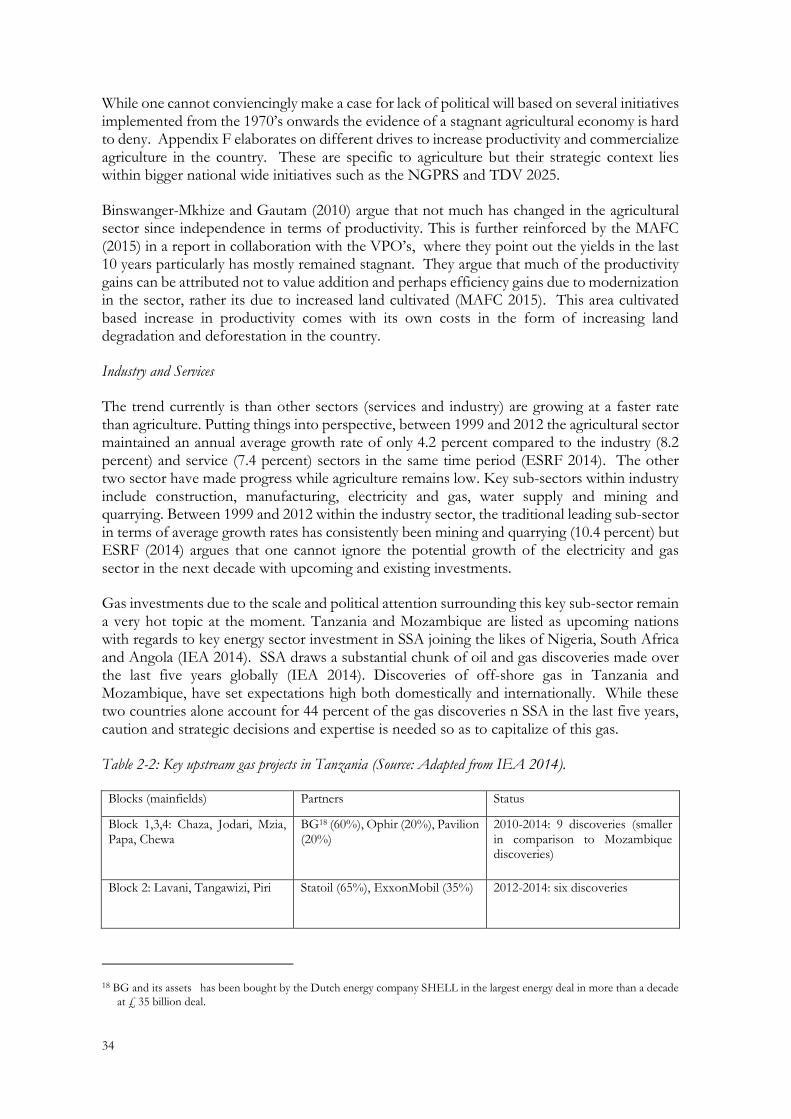
34
While one cannot conviencingly make a case for lack of political will based on several initiatives implemented from the 1970’s onwards the evidence of a stagnant agricultural economy is hard to deny. Appendix F elaborates on different drives to increase productivity and commercialize agriculture in the country. These are specific to agriculture but their strategic context lies within bigger national wide initiatives such as the NGPRS and TDV 2025.
Binswanger-Mkhize and Gautam (2010) argue that not much has changed in the agricultural sector since independence in terms of productivity. This is further reinforced by the MAFC (2015) in a report in collaboration with the VPO’s, where they point out the yields in the last 10 years particularly has mostly remained stagnant. They argue that much of the productivity gains can be attributed not to value addition and perhaps efficiency gains due to modernization in the sector, rather its due to increased land cultivated (MAFC 2015). This area cultivated based increase in productivity comes with its own costs in the form of increasing land degradation and deforestation in the country.
Industry and Services
The trend currently is than other sectors (services and industry) are growing at a faster rate than agriculture. Putting things into perspective, between 1999 and 2012 the agricultural sector maintained an annual average growth rate of only 4.2 percent compared to the industry (8.2 percent) and service (7.4 percent) sectors in the same time period (ESRF 2014). The other two sector have made progress while agriculture remains low. Key sub-sectors within industry include construction, manufacturing, electricity and gas, water supply and mining and quarrying. Between 1999 and 2012 within the industry sector, the traditional leading sub-sector in terms of average growth rates has consistently been mining and quarrying (10.4 percent) but ESRF (2014) argues that one cannot ignore the potential growth of the electricity and gas sector in the next decade with upcoming and existing investments.
Gas investments due to the scale and political attention surrounding this key sub-sector remain a very hot topic at the moment. Tanzania and Mozambique are listed as upcoming nations with regards to key energy sector investment in SSA joining the likes of Nigeria, South Africa and Angola (IEA 2014). SSA draws a substantial chunk of oil and gas discoveries made over the last five years globally (IEA 2014). Discoveries of off-shore gas in Tanzania and Mozambique, have set expectations high both domestically and internationally. While these two countries alone account for 44 percent of the gas discoveries n SSA in the last five years, caution and strategic decisions and expertise is needed so as to capitalize of this gas.
Table 2-2: Key upstream gas projects in Tanzania (Source: Adapted from IEA 2014).
Blocks (mainfields) Partners Status
Block 1,3,4: Chaza, Jodari, Mzia, Papa, Chewa
BG18 (60%), Ophir (20%), Pavilion (20%)
2010-2014: 9 discoveries (smaller in comparison to Mozambique discoveries)
Block 2: Lavani, Tangawizi, Piri Statoil (65%), ExxonMobil (35%) 2012-2014: six discoveries
18 BG and its assets has been bought by the Dutch energy company SHELL in the largest energy deal in more than a decade
at £ 35 billion deal.

35
According to IEA (2014), gas investments present a good window for governments to earn revenue and improve their fiscal position and re-invest in infrastructure and other sectors. To benefit the public. The nature of ownership in this sector, makes the task of making gas investments in Tanzania benefit Tanzanians difficult. The level of foreign investment is very high and most labour tends to be foreign too. The IEA (2014) sees having an efficient tax regime in line with gas developments as a more likely pathway for developing nations to benefit from gas discoveries.
Low level of domestic consumption of gas in both countries in Tanzania due to limitations of an almost non-existent distribution infrastructure makes it very difficult for the GoT to make a case for the domestic market only. Only 0.02 percent (1 billion cubic metres (bcm) was consumed in both countries in 2012, while recoverable gas from the discoveries were in excess of 5 trillion cubic metres (tcm) (IEA 2014). Most of the local consumption was in Tanzania.
While the gas sub-sector within industry sector shows huge potential, domestic expectation management might be necessary considering the timescale for take-off of these projects and the uncertainties surrounding gas developments domestically ( World Bank 2016; OECD 2014). The on-going production from Songo Songo field, discovered in 1974, became commericially operational 30 years later. The second on-shore discovered at Mnazi Bay in 1982 only started commericial production 24 years later in 2006 (Tanzania Government Portal 2013). More recent onshore gas discoveries were made in Mkuranga, Kiliwani, Mtwara-Ntorya in 2007, 2008 and 2012 respectively (World Bank 2016). As of March 2015 off-shore (deep sea) discoveries werwe at 55.5 Tcf, but it is argued that onshore delivered and availability of this gas for power generation is unlikely anytime before 2022-24 (World Bank 2016). This projection is based on the following; the slow progression of previous early discoveries, the fact that gas is a realtively more challenging fossil fuel to develop due to low energy density that makes end product transportation very costly; regulatory and legal framework uncertainties as constitutional review is on-going; the expectations of direct domestic benefits of gas which requires distribution infrastructure that is currently none existant and the need to large immediate anchor clients before rapid domestic gas use can occur (IEA 2014; World Bank 2016). The set operational dates a lot later than envisioned by companies involved, but the reality is that up to now no final investment decision (FID) has been made on any of the upstream projects on Table 2-2 above.
Revival of local industries might enable manufacturing activities to pick up in the coming years depending on whether or not the incumbent President lives up to his promising manifesto. The president has made commitments to fight corruption and revival of local industries to ensure that manufacturing accounts for about 40 percent of employment by 2020 (Ikulu 2015). In his speech inaugurating the 11th parliament session, emphasis was placed on industrialization with the recognition of the need to ensure electricity supply is improved (Ikulu 2015). In Appendix G a comprehensive picture of government led strategies and plans for human development, poverty reduction and acceleration of specific energy sources is provided. The tables show the 199 early TDV 2025 to the more current strategies in line with their vision for the country to achieve middle income status by 2025.
2.3.2. A historical perspective
A German colony between 1885 and 1918, Tanganyika now Tanzania subsequently fell under the British Protectorate after World War I (Edwards 2014). Holding six single party elections
36
between 1965 and 1990, TANU under the first president, was the only political party then, before the country transformed to a multi-party system. Nyerere remained in power in one way or another for nearly 30 years. He stared as prime minister in 1961 and was president for 23 years (1962 to 1985). He stepped down giving room for potential transition away from his socialist centrally driven regime to a more liberal market economy only in 1985. However, even then he still remained the head of the country’s political party (CCM) until 1990.
Lofchie (2014) argues that in order to understand the trajectory of modern Tanzania’s political economy, one has to acknowledge the great level of influence Nyerere had on the country’s economic and political affairs (Lofchie 2014). Aligned with him or not in agreement with his regime or against it, his towering influence was something difficult even for his critics to deny.
In 1963 Nyerere introduced a socialist economic framework to guide the country towards self-reliance and prosperity particularly for the lowest class and poorest in society. He was committed to ensuring a classless society and building a nation where individualism would come secondary to the greater good of society at large (Edwards 2014). His ideal scenario envisioned a society where justice for society at large would prevail over any individual wealth accumulation and profit maximization (Lofchie 2014).
The Swahili word Ujamaa was first used by Nyerere in a political context in a 1962 pamphlet written by him titled Ujamaa-the basis of African Socialism (Coulson 2013). The enduring image of Tanzania from the international community was because of Nyerere’s individualistic character and his reputation as a humanitarian socialist. Even when Tanzanians locally did not agree with his socialist regime, some still saw appeal in him as a non-corruptible person in comparison to the generations of leaders that follow him.
The 1967 Arusha Declaration a guiding document to guide formation of a socialist society makes a statement to commit Tanzania to ‘socialism and self-reliance’ in Swahili “Ujamaa na Kujitegemea” (Edwards 2014). This was immediately followed by a wave of nationalization of key sector as guided by policy of socialism within the declaration that calls for state ownership of ‘means of production’. According to Edwards (2014) the list of ‘means of production” entailed everything from water, minerals, news outlets, banks, export trade, oil, land, forests, wholesale trade, machine tools, motor cars, textiles, large plantations, iron and steel, large factories providing key inputs to industry and cement.
In 1969 Collective Villagization was also part of the commitment to achieve rural development. Nyerere’s collective villagization entailed rural population reallocated into socialist villages. Land of these villages is socially owned and there is collective farming and eventual earning of income for all from products of farmland (Lofchie 2014). These villages were supposed to become a reality by first becoming collective settlements, then establishing collective farming on socially owned land and eventually upon maturity be able to provide food and income for all from collective farming in place of family farming. However, while 5000 villages had been formed by 1974 most of them did not make it to maturity as there was social resistance from people to participate in the socialist lifestyle the president envisioned (Lofchie 2014). While his 1967 statement was for ujamma being voluntary much of what place upon implementation was compulsory and entailed some coercive action by administrators (Coulson 2013; Lofchie 2014).
Nyerere’s personal vision to ensure the poorest in society had improvement living standards did not align well with his economic framework. On the contrary the poorest in society, which entailed the majority of small-holder farmers in rural communities, seemed to suffer instead.

37
Agriculture being mainly dominated by small-scale farmers had not changed till this very day and majority of the country’s population still does reside in the rural areas.
After this upheaval period of people being reallocated, 1974 came in with a serious agricultural crisis that forced Tanzania to import even basic food staples. Tanzania was able to do this due to its ability to obtain extensive donor support over the years and Nyerere’s convincing power (Ngasongwa 1992).
Between mid-1960s and mid-1980s there was a period of economic decline experience by many African countries. Tanzania remains unique in its persistence on blaming the poor performance including the agricultural food crisis on poor climatic conditions and not so much on the poor policy choices that prevailed them. Other than Nyerere’s poor choice of economic policy result in poor agricultural performance, Tanzania’s development was guided by development economics. The essence of development economics was than countries should rely on industry and expansion of it to push all other sectors. Import-substituting industrialization (ISI) which is the strategy that development policies in Tanzania were mostly aligned with, was in contradiction to Nyerere’s rural development agenda. The ISI model as driven by development economists, meant that agriculture was being taxed highly to facilitate subsidization of industries in urban areas and supply capital (Lofchie 2014). Small-scale farmers were then suffering in attempts to implement and sustain this strategy.
Sustaining the atmosphere of civil peace for so long even when the economy was in poor condition is said to be facilitated by post-independenc public policies implemented by the GoT that it may have not intentionally implemented with this outcome in mind. Language, geographical factor and colonial rule influences all contributed to sustaining the turbulence free atmosphere (Lofchie 2014).
The ability for this East African nation to unite and fight for independence has partly been attributed to the country speaking a common language Swahili .Practically every Tanzanian spoke Swahili as a second language and most as a first. This enabled trade, travel and engagement of political discourse than extended beyond ethnic boundaries (Edwards 2014).
Further reinforcement of the collaborated peaceful mood was enabled by the general geographical advantages that Tanzania had. To begin with colonial Tanzania and early post-independence Tanzania, was a land abundant society. Vast area of arable agricultural land minimized chances of conflicts between ethnic groups as fertile land was a resource in abundance. Of course while variations exist with regards to quality of land and suitability for different crops types, it was not to a point of having one communities land needs prevailing at the expense of another community.
Abundance of fertile land was one aspect, but the distribution of this fertile land near perimeters, along borders with neighboring countries and not within the one key city and trade center of Dar es Salaam helped. Dar es Salaam is not a city located in the center of the country’s most fertile land. Unlike Nairobi, Tanzania’s fertile land is on the outskirts on the country. It also helps that the ethnic group of Dar es Salaam (the Zaramo) has long gotten accustomed to the mixed cultural roots of the city with no single ethnic group dominating the cultural, economic or economic aspects (Lofchie 2014).
This lack of ethnicity based turbulence in Tanzania relative to a lot of other countries can also be attributed to the nature of the German Colonial rule. Unlike the British, German colonial practice did not reinforce traditional authorities rooted within ethnic identities. They choose

38
administrators based on a central recruitment system not a system based on traditional authorities. The centrally chosen mixed group of administrators would then be sent to regions in the country to which they have no common ethnic relations to. The akidas had to communicate to communities in a common language hence the wise-spread use of Swahili (Lofchie 2014).
Lack of ethnicity influence politics and society was something that TANU post-independence worked to eliminate via policies intended to mix cultures and the fact that the British was not permitted to turn Tanganyika into a colony under the League of Nations Mandate, meant no ethnically based tactics were used pre-independence when Tanganyika was a protectorate of the British.
It was not until 1986 than Tanzania under President Ally Hassan Mwinyi singed its first IMF agreement. This country remained in this dire state for a while before signing its first agreement. This signaled the beginning of one of Tanzania’s major transformation over the last 30 years (Ngasongwa 1992). This was the beginning of the official movement from a state-ownership regime to a market based systems. Tanzania managed to carry out this transition without any conflict or political turbulence (Lofchie 2014).
The country transitioned back to a multi-party system only in February of 1992 (Ngasongwa 1992). A major transformation that allowed for its first multi-party election contensted by more than one political party. The 1995 election placed the third President (Benjamin William Mkapa) in power. These elections were followed by a wave of privatization of previously nationalized entities (Edwards 2014).
2.3.3. Energy mix
Tanzania’s national electricity access rate was only 36 percent in 2014 and the percentage of population electrified was only 24 percent (MEM 2014). A distinction is made when referring to energy access and electrification rate. Energy access set above as 36 percent is defined as proximity to the grid and may include people within grid but not connected for several reason a common one being the inability to afford connection costs. Electrification rate normally refers to those actually connected to grid. The per capita consumption is as low as 104.79 kWh per year (AfDBa 2015). This is less than half the consumption of low income countries but a growing population and productive investment is resulting in increased consumption. The electricity demand of the country is expected to substantially rise with the anticipated population increase and as Tanzania moves towards becoming a middle income country by 2025. This aim to raise the country’s status is stipulated in Tanzania’s Development Vision (TDV) 2025 which was launched in 1999. With such an ambitious vision, the Ministry of Energy and Minerals (MEM) has set a target of 50% electrification by 2025 and 75% by 2033 to compliment the aim of it being a middle income country by 2025 (MEM 2014). In line with the 2025 and 2033 electrification targets above, investment in the energy sector is necessary. At least, three main things in relation to the energy production and consumption patterns need to change so as to reach closer to the 75 percent electrification target. Firstly, scaling up electricity generation capacity is necessary. At the moment the country has an installed electricity generation capacity of about 1500 MW (with slight variations depending on source used). According to MEM (2013) in the PSMP installed capacity was 1,466MW.

39
AfDBa (2015) country profile puts installed capacity at 1591.02 MW in early 2014 and the newly developed action agenda for SE4ALL puts installed capacity at 1550 MW and of this 1466 MW is available on the grid (MEM 2015). This figure tends to have slight variations based on reviews of the PSMP. An updated 2016 version is currently being worked on and hence this figure could fluctuate again. .
The majority of the existing installed generation capacity is from large-hydropower at 553 MW (65 percent installed capacity) followed by thermal generation by oil (456 MW) and by natural gas (501 MW)> Thermal generation takes 35 percent of installed capacity (TANESCO 2014). Biomass energy only has 27 MW and small hydro is at 13 MW of the existing installed generation capacity in the country (MEM 2015). Having said that, while keeping up with an average annual demand growth of 10 to 15 percent the country needs to have an installed capacity of at least 10000 MW to reach 2025 targets in line with projected population increase (TGDC 2014; MEM 2014). Hydropower not only dominates overall energy generation but also the renewable energy generation capacity of the country. Heavy reliance on hydro puts the electricity supply sub-sector in a very vulnerable position due to droughts. In 2009, 2010 and 2012 serious shortfalls on electricity supply due to long droughts resulted in major power shortages .The utility then made a decision to engage ad hoc emergency power producers (EPPs). Recent strategy for generation by the utility has been a more mix hydro thermal programmer but hydropower still takes the lion’s share even with its decreasing trend over the years. Statistics show a decline in large hydropower available capacity share by almost two thirds between 2002 and 2006 from 98 percent to 40 percent and now it is at 35 percent (AfDBa 2015). In addition to economic losses incurred by economic sectors and business sales engaging EPP’s requires the utility to incur more costs due to the relatively expensive price at which they buy power from them (MEM 2014). TANESCO is cheaper than from IPPs and EPPs due to the utilities assets utilizing relatively cheaper fuel stock for powering its turns. According to the PDB (2013b), the EPPs and IPPs rely on more expensive fuel stock such as jet fuel, heavy fuel and diesel to generate energy whereas the utility relies on cheaper hydro and natural gas. EPP’s according to Table 2-3 constitute 13 percent of overall installed capacity and IPPs have 26 parent (MEM 2013b). Secondly, the country needs to diversify its energy portfolio. Excluding large hydro, only 4.9% of renewable energy from other sources such as small hydro, solar and most recently, captive generation in sugar, sisal and tannin (AfDBa 2015). With this said, the country’s renewable energy potential remains largely untapped room exists for development of other renewable resources especially considering the vulnerability of hydro to droughts and the existing mismatch between generation sites and high demand areas (AfDBa 2015). Figure 3 below indicates a hydropower generation capacity of 553 MW all generated by Tanzania Electric Supply Company (TANESCO). Tanzania’s power sector centers on TANESCO. With 59 percent of the generation capacity, it remains the country’s main electricity generator, transmitter and distributor. While having a very central system, Tanzania is an economy that greatly encourages private sector engagement and hence the other players as indicated on Table 2-3 below. Other power generation stakeholders include independent power producers (IPPs), emergency power producers (EPPs) and small power producers (SPPs).

40
Table 2-3: Power Generation Capacity in 2013 (Source: AfDBa 2015; MEM 2013a)
Lastly, existing biomass applications need to change. A transition is required from unsustainable traditional biomass uses to modern use of biomass resources, if the 75% electrification target is to be met. Currently, almost 90% of the population uses traditional biomass with majority of energy use still being for residential purposes (MEM 2016). This entails a broad spectrum of biomass resources from burning of scrubs and pruning particularly in rural areas to a massive consumption of charcoal in urban areas As much as 80 percent of the primary energy consumption in Tanzania is by households which according to (Camco 2014) account for 90 percent of the country’s wood energy demand.. Household energy in urban areas is dominated by use of charcoal in inefficient cooking stoves with an estimate of 20% of household energy use (Camco 2014). The commercial capital of Dar es Salaam takes the lead with at least 70% of households using charcoal. The National Energy Policy 2003 calls for a more efficient use of all existing biomass resources. The country has a National Biomass Energy Strategy (NBES) established in April 2014 to provide guidance on ensuring sustainable biomass energy supply in place of current unsustainable uses of biomass. In addition, it is set to find means of efficiency improvement in the use of biomass and ensure an enabling institutional environment while promoting access to affordable and appropriate alternative energy sources (Camco 2014). Implementing this strategy once fully fledged would entail reducing key unsustainable uses of biomass which at the moment are charcoal (especially for urban centers like Dar es Salaam) and fuel wood mostly used in rural areas (MEM 2015). Between 2001 and 2007 two key trends were observed. The proportion of households using biomass fuels to cook rose (93-96 percent) and at the same time those in Dar es Salaam using electricity to cook declined by half. This indicates growing unstainable biomass applications. These two consumption patterns of biomass have serious implications for deforestation and degradation in Tanzania. Projects by BEST indicate doubling of charcoal demand by 2030 from the 2012 value of 2.3 million tonnes of charcoal if the status quo remains constant (Camco 2014).
2.3.4. Sector Structure
The structure of the energy sector and the electricity sector in Tanzania is still very much traditional in the sense that it remains mainly the responsibility of key national government entities to generate transmit and distribute electricity. For the most part power supply is perceived as a social service and the utility in Tanzania is therefore not run so much as a profit making organ but mostly as a service provider. According to the World Bank (2014) in the traditional approach in most African countries, a national utility, the Energy ministry and/or a rural energy agency are key in ensuring grid electrification either collectively or individually (variations exist) . In Tanzania key bodies in the power sector are the MEM, EWURA, REA and TANESCO.

41
In Tanzania the MEM is in charge of policy creation to ensure an enabling environment for stakeholder investment. The Ministry is has oversight over several sub-sector within energy and minerals. Within the energy division there are 5 sub-divisions which include petroleum, electricity, new and renewable energy, energy development and gas utilization section. A commissioner is appointed to head the five sub-divisions. Within the minerals division another commissioner is selected to have oversight over several sub-divisions. EWURA is the regulating body. It ensures implementation of regulations related to electricity, water, petroleum and natural gas (EWURA 2016). Its activities include review of tariffs set, monitoring standards and performance related to safety and licensing. It oversees all technical and economic regulation of the sector categories mentioned (EWURA 2016). REA is an autonomous body under MEM responsible for improving modern energy access in rural areas in mainland Tanzania (REA 2016). REA and its supporting Rural Energy Fund (REF) was developed in line with stipulations in the 2005 Rural Energy Act. Rural electrification realization is supported by funding from international donor or via a levy (of up to 5 percent) on electricity sales from commercial generation to the grid. Other sources include government budgetary allocation done annually and perhaps as interest of investment returns and perhaps any consultancy services and publications by REA (REA 2016). Prior to REA becoming operational in 2007, rural electrification used to fall under the MEM. The utility TANESCO is a government parastatal under MEM established in 1964. TANESCO, a vertically integrated utility is in-charge of the main grid and other isolated mini-grids (18 mini-grids). Appendix H gives the structure of existing main grid (GRID map from TANESCO) and the existing 18 mini-grids and there capacities and number of units. The 18 isolated mini-grids which are mostly small diesel fuelled plants account for about 78 MW with capacities ranging from 250kW to 2500 kW. Two of the 18 isolated grids not run by diesel are gas plants with a total capacity of 25 MW. These are the Mtwara and Somanga plant with 18000 kW and 7500 kW respectively as indicated on Appendix H. The long run plan is to connect the mini-grids/isolated grids to the main grid. At least that is what the GoT envisions. For the most part in the history of the utility, generation remained a monopoly of the utility. The government became a sole shareholder in the company after acquiring shares in two private enterprises (Tanganyika Electric Supply Company Limited (TANESCO) and District Electricity Supply Company (DARESCO) that eventually merged to form TANESCO. These shares were purchased between 1964 and 1975. This take back by government from private enterprise ownership that has been there since 1931, was driven by the country wide agenda to nationalize that followed the 1967 Arusha Declaration. Only in 1992, did Tanzania liberalize the energy market allowing independent power producers (IPPs) to feature in the electricity supply sub-sector (WFC 2012). Energy market liberalization only managed to introduce two IPPs. Independent Power Tanzania Ltd (IPTL) and Songas, took about a decade to develop generation capacity and these IPPs failed to prevent power shortages during the prolonged drought periods (WFC 2012). This was when historically Tanzania was slowing finding its way into liberal markets from a very centrally planned system. After the 1995 elections the push for privatization took on a new pace with the planned divesture of many state operated enterprises (SOE’s).Pressure from the World Bank (WB) resulted in the formation of a National Energy Policy in 2003 to allow privatization of the energy sector and orientation towards a more commercially run utility (WFC 2012).
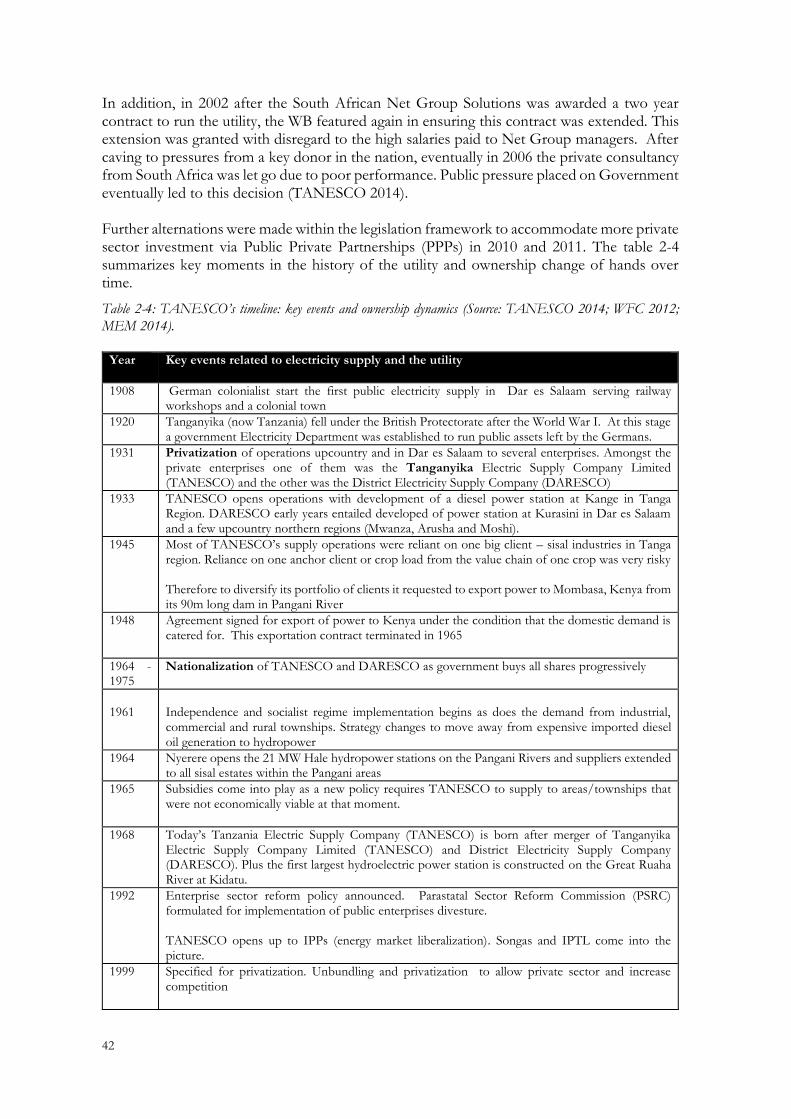
42
In addition, in 2002 after the South African Net Group Solutions was awarded a two year contract to run the utility, the WB featured again in ensuring this contract was extended. This extension was granted with disregard to the high salaries paid to Net Group managers. After caving to pressures from a key donor in the nation, eventually in 2006 the private consultancy from South Africa was let go due to poor performance. Public pressure placed on Government eventually led to this decision (TANESCO 2014). Further alternations were made within the legislation framework to accommodate more private sector investment via Public Private Partnerships (PPPs) in 2010 and 2011. The table 2-4 summarizes key moments in the history of the utility and ownership change of hands over time.
Table 2-4: TANESCO’s timeline: key events and ownership dynamics (Source: TANESCO 2014; WFC 2012;
MEM 2014).
Year Key events related to electricity supply and the utility
1908 German colonialist start the first public electricity supply in Dar es Salaam serving railway workshops and a colonial town
1920 Tanganyika (now Tanzania) fell under the British Protectorate after the World War I. At this stage a government Electricity Department was established to run public assets left by the Germans.
1931 Privatization of operations upcountry and in Dar es Salaam to several enterprises. Amongst the private enterprises one of them was the Tanganyika Electric Supply Company Limited (TANESCO) and the other was the District Electricity Supply Company (DARESCO)
1933 TANESCO opens operations with development of a diesel power station at Kange in Tanga Region. DARESCO early years entailed developed of power station at Kurasini in Dar es Salaam and a few upcountry northern regions (Mwanza, Arusha and Moshi).
1945 Most of TANESCO’s supply operations were reliant on one big client – sisal industries in Tanga region. Reliance on one anchor client or crop load from the value chain of one crop was very risky Therefore to diversify its portfolio of clients it requested to export power to Mombasa, Kenya from its 90m long dam in Pangani River
1948 Agreement signed for export of power to Kenya under the condition that the domestic demand is catered for. This exportation contract terminated in 1965
1964 -1975
Nationalization of TANESCO and DARESCO as government buys all shares progressively
1961
Independence and socialist regime implementation begins as does the demand from industrial, commercial and rural townships. Strategy changes to move away from expensive imported diesel oil generation to hydropower
1964 Nyerere opens the 21 MW Hale hydropower stations on the Pangani Rivers and suppliers extended to all sisal estates within the Pangani areas
1965 Subsidies come into play as a new policy requires TANESCO to supply to areas/townships that were not economically viable at that moment.
1968 Today’s Tanzania Electric Supply Company (TANESCO) is born after merger of Tanganyika Electric Supply Company Limited (TANESCO) and District Electricity Supply Company (DARESCO). Plus the first largest hydroelectric power station is constructed on the Great Ruaha River at Kidatu.
1992 Enterprise sector reform policy announced. Parastatal Sector Reform Commission (PSRC) formulated for implementation of public enterprises divesture. TANESCO opens up to IPPs (energy market liberalization). Songas and IPTL come into the picture.
1999 Specified for privatization. Unbundling and privatization to allow private sector and increase competition

43
2002 Net Group Solutions (South African private consultancy) runs TANESCO for two years. The extension under WB pressure is given for another two years.
2005 de-specified for privatization due to economic and technical reasons
2006 Net group Solutions services are terminated on the basis of poor performance
1996-2006
Uncertainties associated with privatization partly led to no investment in generation, transmission or distribution systems. The moment the utility was placed on list of parastatals specified for privatization, TANESCO was not permitted to invest in system development
2014 Strategy geared to unbundling of the utility in phases is developed. The Electricity Supply Industry Reform Strategy and Roadmap 2014 – 2025 is set to gradually unbundle utility between 2014 and 2025. It sets immediate, short-term, medium term and long term targets in line with the TDV 2025.
TANESCO acts as a “single buyer” from IPPs post 1992 market liberalization and SPPs after introduction of the program. This purchased electricity is sold to TANESCO customers. In the zones on Figure 2-3 below under the Renewable Energy Agency (REA), IPPs can also sell power directly to customers without having to engage TANESCO.
Figure 2-3: Institutional framework and market structure of the electricity sector (Source: AfDBa 2015; TGDC 2014).
The Electricity Supply Industry (ESI) Reform Strategy and Roadmap 2014 – 2025 is set to gradually unbundle the utility in four stages between 2014 and 2025. It sets immediate (2014-2015), short-term (2015-2018), medium term (2018-2021) and long term (2021-2025) targets in line with the TDV 2025. The four phases within the set four time frameworks broadly involve an initial internal turnaround in the immediate term, then partial to complete unbundling in the short to medium term, followed by a full horizontal and vertical unbundling of the utility. These are also presented on Table 2-5 below.
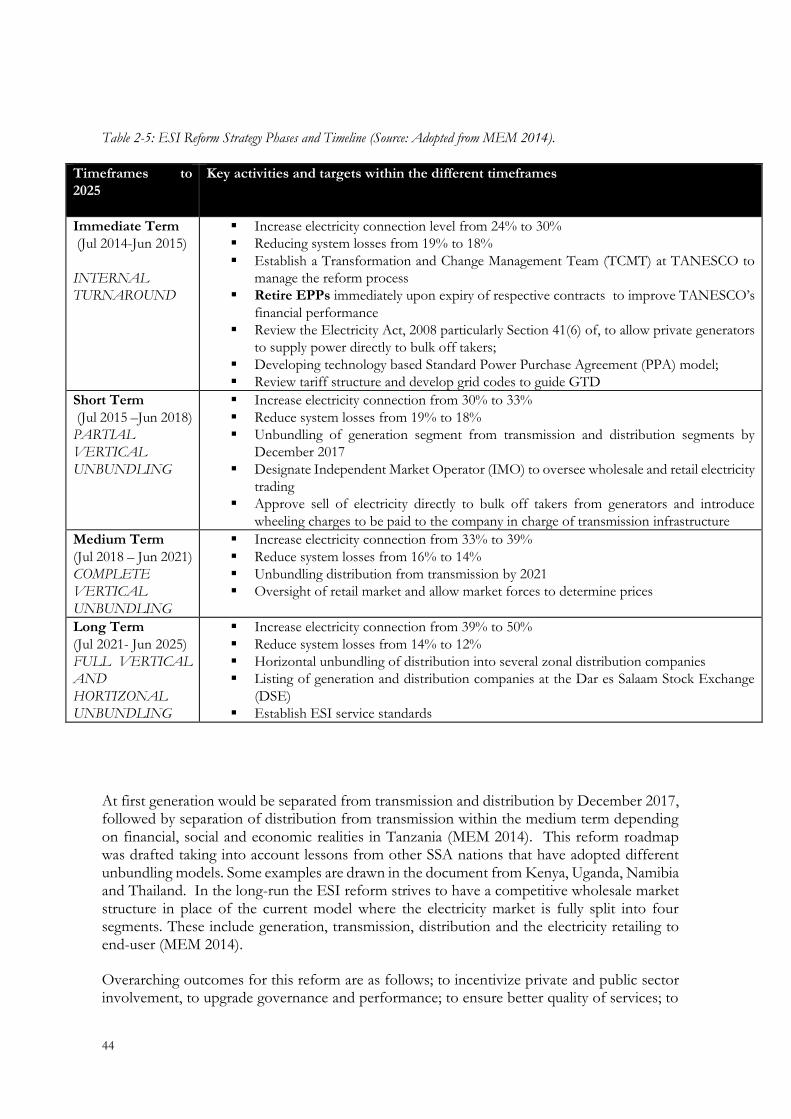
44
Table 2-5: ESI Reform Strategy Phases and Timeline (Source: Adopted from MEM 2014).
Timeframes to
2025
Key activities and targets within the different timeframes
Immediate Term
(Jul 2014-Jun 2015)
INTERNAL
TURNAROUND
Increase electricity connection level from 24% to 30%
Reducing system losses from 19% to 18%
Establish a Transformation and Change Management Team (TCMT) at TANESCO to
manage the reform process
Retire EPPs immediately upon expiry of respective contracts to improve TANESCO’s
financial performance
Review the Electricity Act, 2008 particularly Section 41(6) of, to allow private generators
to supply power directly to bulk off takers;
Developing technology based Standard Power Purchase Agreement (PPA) model;
Review tariff structure and develop grid codes to guide GTD
Short Term
(Jul 2015 –Jun 2018)
PARTIAL
VERTICAL
UNBUNDLING
Increase electricity connection from 30% to 33%
Reduce system losses from 19% to 18%
Unbundling of generation segment from transmission and distribution segments by
December 2017
Designate Independent Market Operator (IMO) to oversee wholesale and retail electricity
trading
Approve sell of electricity directly to bulk off takers from generators and introduce
wheeling charges to be paid to the company in charge of transmission infrastructure
Medium Term
(Jul 2018 – Jun 2021)
COMPLETE
VERTICAL
UNBUNDLING
Increase electricity connection from 33% to 39%
Reduce system losses from 16% to 14%
Unbundling distribution from transmission by 2021
Oversight of retail market and allow market forces to determine prices
Long Term
(Jul 2021- Jun 2025)
FULL VERTICAL
AND
HORTIZONAL
UNBUNDLING
Increase electricity connection from 39% to 50%
Reduce system losses from 14% to 12%
Horizontal unbundling of distribution into several zonal distribution companies
Listing of generation and distribution companies at the Dar es Salaam Stock Exchange
(DSE)
Establish ESI service standards
At first generation would be separated from transmission and distribution by December 2017, followed by separation of distribution from transmission within the medium term depending on financial, social and economic realities in Tanzania (MEM 2014). This reform roadmap was drafted taking into account lessons from other SSA nations that have adopted different unbundling models. Some examples are drawn in the document from Kenya, Uganda, Namibia and Thailand. In the long-run the ESI reform strives to have a competitive wholesale market structure in place of the current model where the electricity market is fully split into four segments. These include generation, transmission, distribution and the electricity retailing to end-user (MEM 2014).
Overarching outcomes for this reform are as follows; to incentivize private and public sector involvement, to upgrade governance and performance; to ensure better quality of services; to

45
improve operational efficiency to allow for a more competitive sub-sector; to increase access and connection; to reduce the financial burden the utility is currently under and finally to promote regional electricity trading (MEM 2014; TANESCO 2014).
Other relevant sectoral players aligned with geothermal developments and the highly debated gas sector exist. Recent developments in the geothermal sector have resulted in the existence of the Tanzania Geothermal Development Company Limited (TGDC) in 2013. TGDC is a government public company in charge of setting a path and 25 year strategic plan for development of existing geothermal resources. At the moment estimates put Tanzania’s geothermal potential at at least 5000 MW, which would potentially be development in light with the TDV 2025. The GoT has prepared a Scaling up Renewable Energy Programme (SREP) Investment Plan as led by the MEM with support from development banks. The SREP investment plan is set to propel large scale development of renewables. Tanzania is a pilot county in the SREP in low income countries. The plan is to develop at least 100 MW of geothermal with set funding from the AfDB and actual development by the private sector. This will significantly impact the 2030 set installed capacity targets and will potentially be indicated on the updated version of the PSMP. In light of continuing discoveries of gas in Tanzania, another key institution in large scale energy development in the country is the Tanzania Petroleum Development Corporation (TPDC). This is a government parastal established in 1969, it is involved in development of the both the early gas developments in the country. These are the Songo Songo Island and Mnazi Bay discoveries in 1974 and 1982 respectively (TPDC 2014). Recent discoveries of both on and offshore gas are estimated to be around 42.7 TCF (7.5 billion barrels of oil equivalent – BoE) as of June 2013 (URT 2013). Other than the obvious big investors the private sector in Tanzania is very much encouraged and it includes existing six IPP and EPP projects that are on-going in the country. The investors related to these are Songas, Aggreko and Symbion contributing to about 40% of the grid’s generation capacity (AfDBa 2015). The country has a well-established framework for SPPs (less that < 10 MW) supported by another key stakeholder in the energy sector (i.e. donors). Donors such as the Swedish International Development Cooperation (SIDA) amongst many others have been very influential. The framework for SPPs was funded by SIDA and administered by the World Bank (SIDA 2014). The French Development agency has recently established a credit line for renewable energy of €20 million for renewable energy. Non-governmental organizations also play a role in encouraging and facilitating renewable energy plus faith-based organizations also utilize renewable energy in rural area for community needs (AfDBa 2015). A particular NGO interviewed during field work is the Tanzania Traditional Energy Development Organization (TaTEDO). Is a sustainable energy development non-governmental organization funded by different country partners (Netherlands, SIDA, NORAD, US AID, UN HCR, EEP etc). It is based in Dar es Salaam and with projects in over 10 regions country wide and over 20 years working on sustainable energy projects in the country. The NGOs’ mission is to ensure access to sustainable energy technologies and address aspects of poverty reduction and environmental conservation by reducing use of unsustainable enery sources (TaTEDO 2012).
2.3.5. Policy and Regulatory Framework:

46
Several policy and regulatory frameworks exist to govern energy generation and supply. They include: the National Energy Policy (2003); the Rural Energy Act (2005); Electricity Act (2008); Energy and Water Utilities Authority Act 2001 and 2006; Public Private Partnerships Act (2010); Standardized Power Purchase Agreement & Tariffs (2008) (<10 MW) under the Electricity Act (2008) (AfDBa 2015).
Tanzania’s first legislative indication of acknowledgement of the need for a renewable energy pathways was first established in the National Energy Policy in 2003, in response to pressure from multilateral organizations favoring a more commercial and private sector orientation to energy development (MEM 2016;WFC 2012). With a focus on rural electrification and provision of renewable energy in 2005 the Rural Energy Act came into the picture. This act established the Rural Energy Fund, Rural Energy Board and an autonomous body at Ministry of Energy and Minerals known as the Rural Energy Agency (REA 2016). Other aspects of the energy sector are regulated through the Electricity Act 2008, Public Private Partnership Act 2010, Energy and Water Utilities Authority Act 2001 and 2006; and the Petroleum Act 2008 (AfDBa 2015). Furthermore, a renewable energy feed in tariff (REFIT) was established in 2008 (WFC 2012). The GoT via MEM and in collaboration with the World Bank is making room for the private sector participation in accelerating energy access to the Tanzanian population (EWURA 2016). Due to low electrification level and dispersed populations the standard REFIT based upon a very capable grid and utility does not work for some African countries (WFC 2012). Tanzania has managed to establish a REFIT that addresses the above limitations by focusing on mini-grid projects. A year later in 2009 the Small Power Producer (SPP) program came into the picture to allow interconnection and sell of power to main grid and mini-grids in country (EWURA 2016). MEM within the framework of EWURA introduced Standardized Power Purchase Agreements (SPPA) and established standardized contracts. In 2010 a Standard Tariff Methodology was adopted. The Standardized Power Purchase Agreements and Tariffs (SPPA/T) together with other supporting documents were established to guide small gird and off grid power producers and distributors (WFC 2012). The SPPA and SPPT are restricted to renewable projects between 100kW and 10 MW. A summary of the features of the feed-in-tariff is provided on Table 2-6. It is EWURAs responsibility to establish the tariffs, give licenses and it is also expect to grantee perseveration of floor prices for the entire payment duration (15 years) (Moner-Girona et al. 2016). The REFIT tailored for decentralized minigrids is based on avoided cost methodology and not differentiated based on technology. The avoided cost principle for establishing tariffs determines a tariff that is comparable to cost of alternative options available to the buyer. (EWURA 2016; Moner-Girona et al. 2016). Differentiated tariffs take long and plus the additional investment (cost) required to set tariffs above avoided cost was not available.Even with the mentioned constraints, it was important for the government to establish a very simply the government was eager to just get things started. Also setting tariffs above avoided cost needs more investment which was lacking.

47
Avoided cost methodology is being used so as to reduce the pinch cost wise of consumers but experts say it comes at a cost. The flat rate approach is said to encourage the proliferation of only the most competitive (lowest cost) renewable energy technology (Moner- Girona et. al. 2016). Civil society (such as the Tanzania Renewable Energy Association- TAREA) and developers have echoed the same concerns that by basing the REFIT on mini-hydro power project the country is prioritizing hydro by default. This is likely because the levilized cost of electricity (LCOE) for mini-hydro differs from other technologies and therefore limiting the range of renewable energy technologies (WFC 2012). The existing tariffs for SPPs depending on whether they are main grid connected or mini-grid connected and on whether it is the dry or wet season are presented on Appendix I. The new 2016 electricity tariff (SPPT) order is also seen on the same Appendix I. However, it must be noted that these new tariff figures are not operational until officially gazetted/ published. According to EWURA (2016) the legal status of the 2016 approved Electricity (Development of SPPs) Rules and SPPT is only attained once the documents are gazetted. The FIT is in Tanzanian shillings with a payment duration of 15 years and TANESCO as the single buyer (Moner-Girona et.al. 2016). While managing to keep tariffs low relative to other East African countries like Kenya and Uganda, the utility is not profitable. Low tariffs are enabled by subsidization by the government. Consumer tariffs are regulated at national or regional level and local utilities at different areas charge end-user below cost of production (Moner-Girona et.al. 2016). With regards to the 18 isolated diesel run power stations (mini-grids) owned by the utility, the government incurs a cost of up to 36 million US$ annually, losing US$ 0.42 per generated kW (Moner-Girona et al. 2016). The affordability aspect with regards to consumers creates a very difficult situation in terms of electricity supply.
Table 2-6: Tanzania REFiT Design Features (Source: Adopted from WFC 2012: Moner-Girona et al. 2016).
REFIT design features Tanzania 2008 FIT
Integrated with policy targets Does not have a set target for total MW or percentage of renewable energy to be generated
Tariff differentiation No technology, fuel type, application or size differentiation. Only differentiation is for GRID CONNNECTED or MINI-GRID and based on SEASONALITY
Payment based on and payment duration
Avoided cost (based on average of short-run and long-run marginal costs). The basis for the avoided cost in the long-term for Tanzania grid power (after adjustment for losses) is the long-run marginal cost. This is so because the plan is to link all isolated mini-grids to the main grid in the long run.
Payment structure A floor is set at the price in the year the contract was signed and a cap is set at 150 percent (adjusted in accordance with the Consumer Price Index) of the tariff price in the year the PPA was signed
Cost Recovery Because generators are paid tariffs that are below the marginal cost of new electricity procurements, there are arguably few or zero costs to recover
Commodity & amount purchased Electricity (100%)
Purchase and Dispatch requirements
Guaranteed purchase provided technical requirements are met
Buyer Utility (TANESCO) and IPPs. Renewable energy generators can sell wholesale or retail.
Contract issues Standardized contract (Power Purchase Agreement)

48
Interconnection Guarantee Eligible generators that meet technical requirements are guaranteed access to the grid. Maximum that can be exported is limited by voltage level at which connection is made
Interconnection costs Generators must pay for the cost of interconnection
Payment Currency and duration Tanzanian Shillings (15 years payment)
Triggers and adjustments REFIT tariffs are recalculated every year based on the given years budgeted avoided
TANESCO in attempt to minimize burden of cost on final consumers (ratepayer) uses avoided cost methodology instead of technologically differentiated tariff system. The technology differentiated tariff system allows for the underlying assumption of different technologies needing varying support levels to be worthwhile the investment and incentive the potential investor. Nevertheless the existing flat rate (i.e. not differentiated based on fuel type, technology or application) has attracted some investors. SPPA has managed to incentivize several investors to engage in electricity generation to sell to the main national grid or isolated grids. According to Moner-Girona et al. (2016) up to 40.1 MW of SPPA have been approved. The composition is split between 15.6 MW biomass, hydro 22.5 MW, solar 2 MW. Of the approved 40.1 MW approved to date, about 22.5 MW is already being supplied to the main grid (Moner-Girona et al. 2016). Another 32 SPPs projects are in the preparation phase still. Four out of the 10 approved are for isolated mini-grids with 1 solar of 2 MW, 2 hydro power (8.5 MW) and 3 biomass plants (5.1 MW). Another three are underway split between 2 hydropower project of 4.1 MW and 1 solar project of 1 MW (Moner-Girona et al. 2016). Further incentives within the SPP frameworks for rural electrification particularly include; relatively higher FiT for those connection to isolated grids than to national grid. Plus investors within SPP engaged in delivering electricity directly to final consumers, they are permitted to propose their own end-user tariff (Moner-Girona et al. 2016). Even though the framework for SPPs provides incentives such as standardized tariffs and simplified license application processes for SPPs and the FIT provides incentives for small producers more investment is needed in improving legislation and regulation for decentralized renewable projects (World Bank 2014; Moner-Girona et al. 2016). For instance, SPPs licensing is done solely by EWURA as the country does not have a renewable or sustainable energy agency. In addition, renewable energy producers with a capacity beyond that covered by the FIT are not provided with any incentives.Investors have also pointed out to a risk associated with the FiT being in local currency. Exchange rate fluctuations could outweigh any incentives for investment in SPPs. Unlike the traditional FiT scheme that quickly picked up and allowed for sufficient entrants into the market to enable a retail competitive approach, investor tend to investment in SSA as one of very high risk. To address the existing and perceived regional risks associated with renewable energy investments, it is recommended that Tanzania could adopt a Global Energy Transfer Feed in Tariff (GET FiT) as is the case in Uganda. The GET FiT concept allows transfer of FiT premium payments to cover the premium needed by generators that is above the avoided cost currently being applied in Tanzania (Rickerson et. al. 2013). This transfer would be from external funds (international sponsors) to enable FiT rates based on cost of generation through the national .government and utility. In Uganda the premium is covered by the several donors such as the Department of Energy and Climate Change (DECC); the Norwegian and German

49
Governments, the UK Department for International Development (DFID) and the Africa Infrastructure Trust Fund of the European Commission (Deutsche Bank AG 2013). In addition broader sector-wide legislative shortfalls exists in areas such as geothermal energy where the Act is yet to be finalized and the draft 2015 renewable energy policy is yet to be approved. Futhermore no specific regulations exist for renewable energy power producers that do not fit into the SPP program developed by the Ministry. That is renewable energy projects exceeding the 10MW upper limit for SPPs.
2.3.6. Barriers for Renewable Energy Penetration
For a country with no published renewable energy policy it is not difficult to see why the renewable energy sector development might face certain challenges. No clear targets exist country wide to set aims for a certain percentage of renewables in the energy mix in line with the TDV 2025. While future energy development plans entail renewable energy projects, there is no clear picture of what percentage of the 10000 MW the government is aiming for by 2025 will be renewables. The SREP has a target set to ensure renewables consist of up to 14 percent (complemented by 26 percent large hydro) of the energy mix by 2015. The growing consensus on the need for both grid and off-grid solutions ensure access to reliable and sustainable modern energy services is cemented by the energy structure of Tanzania. While grid solutions still dominate, studies have shown a population split based on grid, mini-grid and off-grid solutions. A planning exercise aimed at earmarking investments required to further electrification targets sees mini-grids and off-grid solutions playing key role in rural electrification. The National Electrification Program Prospectus study foresees mini-grids serving 20% of rural population and 30% being off-grid solutions (iED 2014). However this requires tackling the existing technical and financial limitations faced by the grid that paint a very bleak future for mini-grid developers if not tackled (WFC 2012; Ahlborg and Sjöstedt 2015). The barriers presented on Table 2-7 below therefore apply to both grid and off-grid decentralized systems, as the latter are said to play a big role and complement national grid in the future especially in rural areas of Tanzania (Ahlborg and Hammar 2015).
Table 2-7: Barriers of renewable energy in Tanzania (Source: Modified from AfDBa 2015; Hammar and Ahlborg
2015; Ahlborg and Sjöstedt 2015).
Dimensions Barriers Primary relevance
Institutional, policy, regulatory and legal frameworks
Project developers face too much risk (currency risk), resource uncertainty
All renewable energy
No clear direction from government on future renewable investment. The countries Power Supply Master Plan (PSMP) provides only a limited hydro focus
All renewable energy
Economic and financial issues
Uncertainty of revenues to those selling power to TANESCO due to existing financial burdens of utility
Grid connected IPPs and SPPs
Limited ability of rural residents to pay to connect to electricity
Mini-grids and off-grid
Limited resource assessment work All renewable energy

50
Knowledge and capacity
Very high pre-investment and transaction costs (i.e. feasibility studies etc.)
All renewables especially SPPs and mini-grids
Lack of enforcement capacity over extraction activities in forests
Biomass
Lack of access to affordable and better alternatives to fuel wood and charcoal
Biomass
Table 2-7 points out some of the key gaps with regards to providing an enabling environment for renewable energy projects to flourish in Tanzania. Lack of clear signals on future direction of power-generation investment planning creates risks for project developers. The recent gas discoveries off the coast of Tanzania will have implications for the energy landscape in the near future. According to the AfDBa (2015), the country is set to be focused on gas with a switch to a mixture of gas, coal and renewable energy (inclusive of large hydro) in the long term. The above statement is cemented by the fact that the government has invested in two gas fired plants (380 MW capacity) and is prioritizing a gas pipeline in Mtwara. Further assessment of implications of gas discoveries on the energy landscape is needed and it is not very clear how much of this will be for local consumption.
Tanzania has the potential to ensure modern energy services are extended to more people especially those in rural communities but existing technical, financial, economic and social barriers will need to be addressed. PEA are approaches to try and explore beyond these tranditional explanations for why sector operations are not working as they should.

51
3 Results and Analysis Interviews conducted using the set of mostly open ended questions so as to facilitate addressing of the two research questions;
Why has the Electricity Supply Industry in Tanzania struggled to provide reliable power to facilitate state development aspirations (TDV 2025)?
What incentives and disincentives are needed to enable up-scaling of agro-industry co-generation in Tanzania?
Interviews conducted at industry levels included two sugar, sisal and rice agro-industries. Details of literature analysis and findings from interview sessions with stakeholders will be presented in each sub-heading below. Collective findings from agro-industry stakeholders addressing the two broad areas of enquiry above will be summarized on a Table 3-2. Interview findings from other stakeholders will be drawn out in the section on PEA based on relevance in line with the set guiding framework.
3.1 Sugar
All sugar in Tanzania is produced from sugarcane and it is currently the biggest agro-processing industry in the country (Mwainuka and Mlay 2015). Today the nation has four key sugar processing companies namely; Tanganyika Planting Company (TPC), Kagera Sugar Limited (KSL), Kilombero Sugar Company (KSC), with two sugarcane estates and two factories, and Mtibwa Sugar Estate (MSE) (Sutton and Olomi 2012; Radobank 2013). A summary of key parameters related to area, out grower involvement and key challenges are presented on Appendix J. Small scale producers also exist in the Tanzania sugar sector. The Tanzanian government has shares in TPC (25%) and KSC (25%), while MSE and KSL are fully owned by local private estates.
Sugar production in Tanzania began in 1924 with TPC producing granular sugar at small scale level at that time. Only in 1936 did large scale production take off. Prior to that, jaggery19 production took place in Kilombero and Mtibwa valleys. After TPC started large scale production two other key sugar companies followed in 1961 (Kilombero Sugar Estate) and in 1962 (Mitbwa Sugar). Post independence, Kilombero I was the largest sugar project and it began as an out-grower programme. Mtibwa also started out as an outgrower project.
The increasing trend of production in the early 1990’s had been attributed to privatization of sugar estates previously run by the government. Kagera Sugar Limited privatized in 2001 was not operational before being specified for privatization. The existing cane fields had become bushland and the factory itself was not in good shape and required major rehabilitation post Uganda invasion of Tanzania in October 1978. The war that followed lasted 8 months during Iddi Amin regime (Acheson-Brown 2001; SBT 2014). The sugar industry employs at least 14000 people directly and provides secondary employment to another 80,000 people.
The structure of the industry features smallscale farmers who grow most of the sugar in etates owned by sugar processing factories. However, contracted outgrowers exist, who sell grown sugarcane to mills. Outgrowers are represented by associations namely Kagera Sugarcane
19 Jaggery is a concentrated product of cane juice with no crystal or molasses separation. It is a traditional whole cane sugar
that is unrefined and variations in colour exist from golden brown to dark brown. It can be used with or in place of granular sugar (Sutton and Olomi 2012).

52
Growers Association, Kilombero Cane Growers Association, Mtibwa Out-growers Association and Ruembe Out-growers Assocation as indicated on Figure 3-1 showing the organization of the Tanzania sugar sector. A sugarcane research Institute exists exploring aspects of agronomic improvements and how best to control diseases and pests. At national level all outgrowers have a representative body called the Tanzanian Suar Cane Growers Association.
Figure 3-1: Organizational structure of the sugar industry (Source: Sutton and Olomi 2012).
Sugar production increased in the year’s post-independence then decline again after nationalization of all factories in 1967 on the Arusha Decleration coming into effect.Production increased steadily again after end of nationalization (1986) and privatization kicked in again. An annual average of 49000 mt was producted between 1961 and 1965 and this increased to about 115200 mt between 1976 and 1980. Production increase upon privatization was from 135535 mt in 2001 to 263461 in 2010 as indicated on Appendix J on sugar production (2000/01 – 2014/15).
However, much of the increase in the last decade has been attributed not to increased productivity but rather an increase in cultivated area. According to FAO (2013) the area under cultivation increased by 15 percent (from 20000 ha to 23000 ha) and cane production over the same period increased by 17 percent (2.3 million tons to 2.7 millions). Tanzania’s low sugar yields relative to other countries in East Africa has mostly been attributed to lack of sufficient irrigation of plantations and having outgrowers that rely mainly on rain-fed agriculture. The GoT under BRN targets to increase sugar production by 150000 MT (PDB 2013a).
That being said the country still maintains a long trend of sugar shortages with demand exceeding supply and the country having to rely on importation. The SBT of Tanzania is responsible for regulation and provision of importation licenses. Sugar demand or consumption annually is at 420 000 tonnes and production is only at 320000 tonnes annually. Therefore rougly 100,000 tonnes are covered by imports. Direct domestic consumption is greater than industrial consumption and the demand keeps growing (A. Mwankemwa 12 April 2016).
Tanzania’s long standing domestic sugar shortages and the decision to permit importation has several implications. Under former President Kikwete, shortfalls in sugar resulted in the GoT

53
permitting duty-free imports of sugar by trading companies at the expense of local estates and outgrowers (ODI 2014). This results in serious complains by growers and producers with regards to reduced cash flow. This decision also counters efforts under the Big Results Now Initiative to increase large scale commercial sugar investments. Under the BRN initiative investments earmarked include 25 large scale commercial paddy and sugarcane fields (16 of the 25 districts idenfied are for sugarcane fields) (PDB 2013b).
In theory at least, export of sugar to individuals is not permitted due to domestic shortages. However exceptions exist as up to 10 percent of total annual production can be exported by sugar producers to other producers within the East African Common Market Mechanism (SBT 2014).
Previously the GoT had also implemented a ban on exports in 2011 in attempts to counter the inflation in the domestic market and sugar shortages resulting from illegal smuggling of sugar to Uganda and Kenya. The fact that a kilo of sugar earned a higher amount in equivalent Tanzanian Shillings (Tshs) in the neighbouring countries also complicated matters then (personal communication, 12 April 2016).
Recent regulatory developments that are creating turbulence in the domestic sugar market relate to the announcement by the incumbent president of Tanzania that importation regulation and handing out of licenses will be done with oversight from the State House directly and not the SBT. Stating potential mismanagement and corruption in handing out permits, the president was sympathetic with local producers who are normally on a tough spot upon flooding of the market with illegal subsidized sugar imports.
He introduced tighter “restrictions or control” on the basis of imported sugar harming local industries as sometimes licences are issued even when domestic supply is sufficient and that the quality of imported brands do not meet human consumption standards.
This move has resulted in what may be a false shortage in the market and a resulting price hike due to “scarcity’. The SBT maintains that there is no sugar shortage and that its simply hoarding by traders who are against the ban and want to create a hike in the market so more import permits are provided. This was in February 2016. Opposition parties have also taken the opporutunity to put blame on what they claim to be the Presidents wrong and uninformed decision this May. While an indicative price of 1800 Tshs was announced sometime in March by the SBT Director General, the market has observed retail price hikes of up to between Tshs 2600 and 4000 per Kilogramme. The GoT then opted to take charge of imports to deal with on-going shortages and actively search for those hoarding sugar. It remains unclear to what extent the current shortage is as a result of market distrotions by traders or a direct consequence of the ban imposed.
All four sugar producers above use bagasse (fibrous cane residue) to generate power in their boilers. The generated power is used for internal processing activities for all mills, with some supplying to employees homes within the estate and only (TPC) is selling to the grid. Generation of sugar from bagasse in all mills is normally restricted to the operational season (8 months roughly) and during off-season (3 months or so) all mills rely on power from the grid as all mills are grid connected (Gwangómbe 2004).
While TPC has managed to sell its power to the grid, KSE is said to be in discussion with the utility to do so but so far these negotiations have not been fruitful. On the other hand, MSE and KSL simply do not produce enough bagasse to suffice producing sufficient power to also

54
sell to the grid (personal communication, 25 April 2016). However, this year KSL has declared plans to expand it operations. The Director General announced this year that while current production has reached 60000 tonnes annually, plans are on the way to double production by 2018 provided they manage to secure the USD 68 million loan they are waiting for.
The case of TPC
TPC is the second largest sugar producer contributing to abou 25 percent of total production (A. Mwankemwa, personal communication, 12 April 2016). It is managed by SUKARI Investment Company which is registered in Mauritius and owned by Deep River Bean Champ Ltd, a Mauritius company and Sucriere de la Reunion (a Frech company) (Johnson and Seebaluck 2012). Seeing it is not fully private, the board members entail members from Mauritius Owner Company, members from French owner company and two members appointed by government.
Beteween 2004 and 2005 TPC made a decision to installed capacity of 17.5 MW which exceeded their internal needs which were at most in the range of 8 MW (World Bank 2014). Driven by the unrealiblity of TANESCO’s power supply which was needed for irrigation operations prior to upgrading of boiler and availability of abundant feedstock with no competitive use the co-generation facility was established. In the first year the new upgraded boiler generated about 10 GWh.
TPC approached TANESCO to discuss electricity sell to grid as early as 2006 when they upgraded their boiler due to estate expansion extra energy requirements. However the utility by then was not very keen, rendering the decision to install beyond needed capacity a little risky. Negotiations went on for years with contentions over how much the TANESCO should pay TPC. This all become clearer once the regulator EWURA released in 2010 the guidelines specifying the standard tarrif methodology under the SPP program introduced in 2009. These guide the process of setting tarrif for SPPs looking to connect to the grid.
Finally in 2010 a SPPA was signed for sell of 9 MW to TANESCO. Currently TPC connected to the grid uses bagasse from production process for its stream or process heat needs during the production process and electricity needs. It also supplies employee homes within the estate and 9 MW goes to the grid. Majority of the electricity consumption goes to running the irrigation pumps, as TPC does not rely on an outgrower scheme. Irrigation consumes about 5 MW equal to the amount used by the mill. Considering the dry nature of the Moshi town, outgrowers relying solely on rain would struggle and the quality of cane would not be up to standard (interview). Therefore all of the 8000 hectares of sugarfields are watered by irrigation pumps under the cost of the factory.
A study on how How Small Power Producers and Mini-Grids Can Deliver Electrification and Renewable Energy in Africa particularly referes to advantages within TPC that made it relatively easy for them to acquire an SPPA almost immediately (World Bank 2014). These specifc advantages include; the utility sub-station was only 10 km away so very little investment was needed to connect to TANESCO; TPC has internal need for process heat and steam during its production which meant a boiler to generate electricity was already in play internally and therefore connecting and signing a SPPA was easy; sufficient biomass to input into boiler; an existing source of finance (strong balance sheets made it easier to acquire local or foreign bank loans). Easier to get money from lenders already aquinted with TPC and it operations via previous loans for other activities.
The authors argue for it not always being easy for SPP developers to get funding if they do not have an already existing finance source that is aquinted with its operations and present of a

55
strong balance sheet in an already existing commercial entity. Unlike TPC other developers not in agro-industrial factories have to rely on project financing which is hard to come by as lenders find it more risky as they cannot rely on borrowers other assets should the project fail to take off and repay debt
TPC announced earlier this year plans to investment on farm extension and machinery to
increase production from current 85000 tonnes to 110000 tonnes by 2017. Factory expansion
operations are on-going to accommodate the increasing production. Also tree plantations are
in the early stages. In 8 to 9 years to come TPC will be generating a bit over double the amount
of energy they are generating now. A solar power project potentially in the long run.
Developing patnerships and expanding industries under the TPC umbrella that could utilize
excess power from TPC is under consideration. TPC is considering having a distillery for
molasses and a small fertilizer plants.
Agro-EcoEnergy Ltd
Agro EcoEnergy Ltd is a subsidiary of the Swedish based EcoEnergy Africa AB registered in
2007. Agro EcoEnergy Ltd is a private agro industrial company setting up a project in
Bagamoyo known as the Bagamoyo EcoEnergy Ltd (BEE) with plans for a sugar project to
accommodate domestic shortages in sugar. Originally the plan was for ethanol development
for export to Europe but the financial crisis and the lack of market readiness in Africa resulted
in a change of ownership and plans (personal communication, 28 April 2016). Now the plan
is for sugar production, plus ethanol production from molasses on 45000 hectares of land
acquired through the GoT. It is a two phased agricultural industry project. Phase one would
involve crushing 1 million tonnes of cane from built factory and develop an outgrower scheme.
This upon further expansion would be increased to 1.5 million tonnes crushed cane. Phase
two is to have a distillery for ethanol (10 million cubic metres annually) from molasses and the
boiler would be used for electricity (enough for 100,000 rural households consuming
1000KWh/year) (Agro EcoEnergy 2014).
Previous plans were to export ethanol but targeted importer in Europe due to a changing
consciousness of renewable fuels in Europe has reduced importation of ethanol. Therefore
current plans would not entail ethanol exportation instead it will be used for potentially the
following; low blending into gasoline; cooking stoves or to sell it as drinking alcohol.
Preferenance is for cooking stoves ethanol use depending on the price also because it would
have the environmental benefit on reducing unsustainable biomass consumption through
charcoal production (personal communication, 28 April 2016). The project is set for financing
with the AfDB.
The idea upon full operation is to sell 100000 MWh to TANESCO after internal operations
consumption. On initially approaching the Minster of Energy and Minerals two years back
(2014), the recommendation what that instead of selling bagasse generated power to the utility,
Agro EcoEnergy should buy grid power from the utility. Eventually the price TANESCO
offered was too low at US 8 cents while they were buying from EPP at US cents 40 to 45.
Small power projects were getting 10-11 US cents. The company then did not fall under
requirements for the SPPA because it is not a dedicated power project as the energy is being
used for some other primary activity (steam for mill operations). They have to get and negotiate
for their own 12 MW PPA this is not a standard contact.

56
3.2 Sisal
Introduced as a commercial crop in 1893 in Tanga region by a German agronomist, sisal (Agave sisalana) grew to become one of Tanzania’s most established and oldest commercially organized crop chain and the main plantation plant in the country ( J.Shamte, personal communication, 18 April 2016). Tanzania at independence was the largest sisal grower globally and the largest foreign exchange earner employing over 1,000,000 permanent and casual workers (Coulson 2013; J.Shamte, personal communication, 18 April 2016). The country’s transport and port facilities also developed in parallel with the growth of the industry.
The distinct nature of the plant makes it easy to grow as it is not prone to drought conditions that most rain-fed agricultural crops face. It can grow on most soil types except clay and can be harvested twice a year for a duration of about 12-15 years after planting (FAO 2016; J.Shamte,personal communication, 18 April 2016). Depending on the location it can produce 180-240 leaves and while up to 90 percent of the leave content is moisture the fleshy pulp of the leaves is rigid and firm (FAO 2016).
In the years immediately post-independence Tanzania had a prominent position in sisal export. About 234,000 tons were produced in Tanzania in 1964 several regions in the country. Regions growing this crop native to Mexico, included Tanga, Kilimanjaro, Iringa, Singida, Mara, Lindi, Mtwara, Shinyanga, Singida, Coast and Morogoro (FAO 2013). .It was the largest exporter of sisal whose leaves via wet or dry decortications produce natural hard fibers which has several traditional and modern high value applications (Mshandete et al. 2013). The market for natural fiber later declined with the production of largely subsidized synthetic fiber (developed in the 1960’s) in North America and Europe and also poor economic policies (J.Shamte, personal communication, 18 April 2016)
Like all other key agricultural sub-sectors post announcement of the Arusha Declaration, nationalization of 60 percent of sisal industry whose estates were most owned by foreign investors prior to that took place in 1967. This was followed by the 1990s privatization wave nationally and hence the sisal industries previously nationalized became private enterprises again. However, by the 2000 only 8.8 percent (20489 tons) of the 1964 peak values was being produced. In 2015, Tanzania produced 40001 tons of sisal fiber, almost twice the amount in 2000 as indicated on Appendix K showing fiber production from 2000 to 2015 (TSB 2013; Y. Mssika, personal communication, 2 May 2016 ). Key global producers and exporters are Brazil which exports raw fiber and manufactures goods of up to 100,000 tonnes and, Kenya exports 20,000 tons and Tanzania exports 15000 tons (FAO 2016).
Globally the use of natural fibres is growing and this is resulting in value addition for sisal products and an extended use beyond the traditional applications. This revival of the market for natural fibres at global level was further cemented by the United Nations making 2009 the International Year of Natural Fibres (FAO 2016). There is an overall increasing awareness in line with low carbon path development agendas of the fact that natural fibres are environmentally friendly.
Innovation on uses of natural fiber are resulting in an increasing use of sisal in furniture, construction and even as composite car materials (FAO 2016). Traditional uses of this crop include spinning and weaving the fiber into twine, ropes, yarn and strings and these can in turn be woven into mats, carpets and the like (Katani Ltd 2014b). However, traditional applications for the fiber face competition from synthetic fibers but room exist four use of fibres at higher value applications.

57
Domestically, Tanzania is gearing to capitalize on this re-surfacing interest in natural fiber and a revitalize sisal supply chain in the country (FAO 2009). Currently the sisal industry remains very wasteful as only 2 percent of the sisal plant is used for fiber production and the remaining 98 percent of the plant biomass (waste) is flushed away (Katani Ltd 2014b). Efforts are being made to utilize the biomass amounting to up to 15 million tons annually more effectively (FAO 2009).
While the structure of sisal production still remains largely estate based (plantation crop), efforts are on the way to enable more smallholder and out grower schemes engagement in the sisal value chain (See Appendix K for sisal value chain). At the moment Tanzania remains the fourth largest exporter of sisal but it has a vision for 2030 were it sees the industry production 1,000,000 tons of sisal fiber and products (J. Shamte, personal communication, 18 April 2016). Realization of this vision is based on targets of annually production of 100,000 tons annually by 2021. As of 2012 the country started implementing a 10-year production plan.
Vision 2030 for the sisal sector seeing the country capitalizing on the 100 years of commercial production experience of this crop and the flexible nature of the crop to generate up to US$ 500,000,000 million annually by 2030. The sector is projected to employee over 500,000 people from the current 100,000 in line with this market outlook. The market outlook is also promising as prices for the crop seem to have stabilized since 2010 and currently a ton of sisal fiber goes for between $1900 and $2000.
Having once held the prominent position in terms of the quality and quantity of sisal fiber it produced and exported the country already has the foundations of the crop system and what it takes to get it to the international markets.
In addition, the fact that majority of estates in Tanzania unlike the global leader Brazil are plantation based and not smallholder farming is something the industry is banking on to surpass Brazil by 2030 ( J.Shamte, personal communication, 18 April 2016). Brazil is looking to adapt a centralized plantations system as is the case in Tanzania. The extensive land availability, flexibility of sisal as a crop and the fact that is has been listed as a priority crop in the 2009 Government initiative (known is Swahili as Kilimo Kwanza) aimed at modernizing and commercializing the agricultural sector gives the Tanzania sisal industry a competitive advantage (personal communication 18 April 2016; Katani Ltd 2014c). All existing sisal producers and estates are provided in Appendix K. Also included in Appendix K are the production figures from 2000 to 2015.
In addition, existing local investors (owning about to 65% of the industry) argue for this vision being a reality on the grounds of existing sisal estates are all established natural farm centres and the skills and knowledge needed is availalbe. All sisal estates are grid connected and have sufficient water needed for processing and have access routes ( weather or tarmac roads) (J. Shamte, personal communication, 18 April 2016).
The Sisal Board of Tanzania is geared towards re-establishing the Tanzania’s global market position as a global producer and exporter of one of the highest grade fibres as used to be. This is to be done in parallel with establishing alternative value added products and allowing for better utilization of waste from the industry. That being said the 2030 vision includes utilization of residue waste products to generate electricity, organic fertilizer and industrial alcohol. According to ( J.Shamte, personal communication, 18 April 2016)the braoder plan is to generate electricity from biogas plants of up to 500 MW, 6000000 tons of organic fertilizer and 1200 million liters of industrial alcohol (J.Shamte, personal communication, 18 April 2016).

58
MES case
Allowing for cleaner integral utilization of sisal waste (which consists up to 98% of sisal plant), UNIDO, the Common Fund for Commodities (CFC), TSB and the sisal industry have funded a sisal waste substrate based plant to generate biogas, electricity, process heat and fertilizer.
This mono-sisal plant is the first of its kind globally operating at commercial scale with a capcity of 300 KW. It is run by Mkonge Energy Systems (MES) a subsidiary of Katani Limited in Tanga Region. MES came into existence in 2008 with 80 percent of its shares under Katani Ltd. And the other 20 percent under a Chinese company called Chengdu DeTong Environmental Engineering Company (Katani Ltd 2014c).
The mother company Katani Limited was registered in 1996 and has several subsidiary companies and operates five sisal estates in Tanga Region (Korogwe District) on 25000 hectares of land and 10 decorticating factories. The company acquired all its assets from a previous government parastatal during the privatization wave upon poor performance when managed under central planning. All Katani Limited facilities are located within 150 km of the nearest port and therefore facilitating logistics of export via Tanga Port in North Eastern Tanzania. The GoT through a pension fund (National Social Security Fund) owns 49 percent of the company and the rest is by local Tanzanian investors, the other 51 percent is split between local investors trhough Afrika Mpya Limited and another 80 local investors and sisal professionals retain ownership of the company through Mkonge Investment and Management Company (MIM) (J. Shamte, personal communication, 18 April 2016; Katani Ltd 2014c).
Katani Limited also aims at increase local ownership of the industry via schemes that incorporate more small-holder farmers to this very centralized sisal farming structure. The company runs a contract farming scheme called sisal smallholder and outgrower (SISO) scheme (Katani Ltd 2014a). Basically the Katani small-holder model permits samllholders to farm on estate land and provides them with the necessary technical assistance and on haversting the estate owner’s process and market the fiber. The farmers profits from returns on fibre sales after deductions for the support inputs provided by the estate
Within the Katani Limited umbrella, MES deals specifically with renewable energy project development. These range from hydropower, wind, solar and biomass, currently with a collective installed capacity of 135 MW the majority (125 MW) of this is mini-hydro projects (J.Shamte, personal communication, 18 April 2016). The company strives to add value and better utilize the 98 percent of the plant that is traditionally just flushed away as waste, they aim to utilize at least 80 percent of the plant in the next 10 years (PC).
Sucessful operation of this first commericial mono-sisal biogas plant built in 2007 in Hale estate (Tanga Region) has been instrument in changing the perception of the industry. It has also proven that in anaerobic digestion sisal can be a good quality substrate (Terrapon-Pfaff et al. 2012). That being said, future plans involve replication of the same plant at a capacity of 1 MW in all 5 estates by Katani Limited. After that the company will explore extending this to all sisal estates with the potential to target estates in other producer countries suc has Kenya, Madagascar, Mozambique and South Africa (Katani Ltd 2014c).
Plans are on the way to sell some of the electricity to the grid via the SPP program, negotiations are currently on-going with the utility to sell 10 MW (J.Shamte, personal communication, 18 April 2016). Plus in the much longer term, the company might consider selling gas into the big gas line projects in the pipeline from Uganda that will transverse Tanga Region. However

59
this is dependent of gas prices then. Broadly, there is room to generate up to 400 MW of electricity in rural communities and perhaps supply gas for cooking and lighting (J.Shamte, personal communication, 18 April 2016).
3.3 Rice husk
Rice is a key food crop in the country after cassava and maize and is mostly dorminated by small-holder farmers occupying 74 percent of rainfed cultivated area, irrigated rice is only 20 percent an large scale is minimal at only 6 percent (FAO 2015).
Rice is grown in two key regions of Mbeya and Morogoro and most of what is grown is marketed domestically as the country has been a net rice imported for quite sometime now. Rice deficit in Tanzania was at 1.15 million tonnes in 2009 With an increase in the the per capita consumption in the first half of the 21st century from 20.5 kg to 25.4 kgs, so did the amount of imports between 2001 and 2004. Urban areas are key target markets with Dar es Salaam city alone consuming 60 percent of the produced food crop. Production between 2001 and 2012 increased mostly due to increase in area cultivated, but also as a consequence of the imposed tarrif on imports in 2005 of up to 75%. Imports were partly encouraged because of the high local price of rice and between 2001 and 2004 imports constituted up to 16.5 percent, which fell to 5.2 percent between 2005 and 2011.
The rice industry has been associated with informal trading as a kilo of rice sales at a higher price in neigibhouring countries which are also close to the main producdting areas. Also there is general preference for the aromatic good quality Tanzanian rice in the region and it enjoys a 15 percent price premium over imported variaties. Rice export in Tanzania (both formal and informal) are mainly to Kenya, Rwanda, Uganda and Burundi but sometimes it goes as far as Malawi and Zambia (FAO 2015). This is seen in existing disparities in official export figures reported internally in Tanzania as compared to figures reported by the neighbouring importing countries. Official the GoT has previously employed the use of bans for exports under arguing on the grounds of food security concerns but this has had consequenses as it creates uncertainty of supply for importers, it perpetuates existence of a black market, discourages furutre investors and it might negatively influence farmgate prices for farmers in surplus production areas as customers decline (FAO 2015).
With projections showing an increasing deficit to up to 2.84 million tons by 2020 measures need to be taken to increase rice production beyond increasing the amount of land cultivated. Productivity of agriculture in Tanzania has been consistently low but measures to increase production are slowly picking up under different initiatives. For instance the Government has established a National Rice Development Strategy (NRDS) aimed at doubling production by 2018 and commercialization of existing sub-sector which would entail a move to more large scale farming in place of small holder farming. Under the BRN initiative plans were set for to increase rice production 290000 MT with private sector engagement (PDBa 2013).
When the paddy grain is separated from the rice graind during milling, the leftover outermost lyater of the grain is termed ricek husk. AfDBa (2015) Tanzania country profile puts annual rice husk feestock availability at 0.2 MTPY. . Rice husk is said to have significant calorific value with a ton of rick husk capable of generating electric power of approximately 800 kWh (Pode 2016). This means options to add value to the rice supply chain by generating electricity from communities from rice husk are very promising It also helps that it is not of great nutritional value and therefore there is no large competing use for it as animal food (Pode 2016). Husks from milling have traditionally been used as fuel for cooking, for paving or

60
landfill applications, as a fertilizer additive, for partition boards and even for biochar production (Pode 2016).
Key growers (China and India amongst others) are already for generating husk electricity for mill operations and for household lighting in rural areas and other high value industrial applications (Pode 2016). However, only a small portion of rice husk globally is being used for electricity generation and the potential remains laregely unexploited.
Husk Power Systems (HPS)
Originating from India, Husk Power System (HPS) is currently pursuing decentralized electrification in rural Tanzania via rice husk and solar power for household consumption. HPS combines electrification with inclusive rural development to empower communities despecified for grid extension is not an economically viable option or the communities are too poor to pay (HPS 2016). Suceeding in challenging conventitional perceptions that rural electrification is not sufficient profitable to make a strong business case, a group of friends set up HPS in India in 2007 (Bhattacharyya 2014). The first plant installed in Africa was in Uganda. In Africa they used any dry woody biomass that is conventiently available on their gasifier systems depending on context provided the moisture content is minimal (maize cops, rice husk, wood chips) (A.Eyinade, personal communication, 20 April 2016).Table 3-1 provided details of projects.
HPS has several biomass development projects with local partners in Tanzania under 100 kW. So far it has installed three biomass plants in three rural communities but plans exist to explore hybrid systems with solar (day) and biomass (night) to extend the number of hours of electricity. HPS mono- systems need two operators to maintain and run only 6 to 10 hours on continuous mode. Funded by investors (debt and equity) but they also leverage grants.

61
Table 3-1: Installed rice husk biomass plants so far (Source: A.Eyinade, personal communication, 20 April 2016).
Capacity of biomass plant
Date installation completed and location
Partner Target customers Comment
32 Kilowatt rice husk based plant
November 2014 Malolo Village (Kilosa District in Morogoro)
Ruaha Power Company Limited
Households It was set to be commissioned by early February 2016 Grid extension misinformation: might need to reallocate this (uncertainty of grid aspect)
40 KVA biomass plant
May 2015 Nyakagomba Village (Geita District in Geita Region)
GVEP international
At least 50 households + trading centres + teachers trading college
Plan is to serve 100 more people
40 KVA rice husk biomass plant
November 2015 Kongwa Village (Morogoro rural District in Morogoro Region)
150 households + small traditing centre
Close to reaching 2016 second quarter target of 100 people. Morogoro is a key rice growing area
The company does not aim to connect to the grid but operates on strickly a decentralized system regards of faced challenges of grid extension uncertainty associated with off-grid projects in Tanzania. The local partners approach leaders at district level and ward level to get buy-in and HPS maintains relations at a higher level (regional and national level) (A.Eyinade, personal communication, 20 April 2016). The company also imports their biomass gasification plants for sell to other local investors.

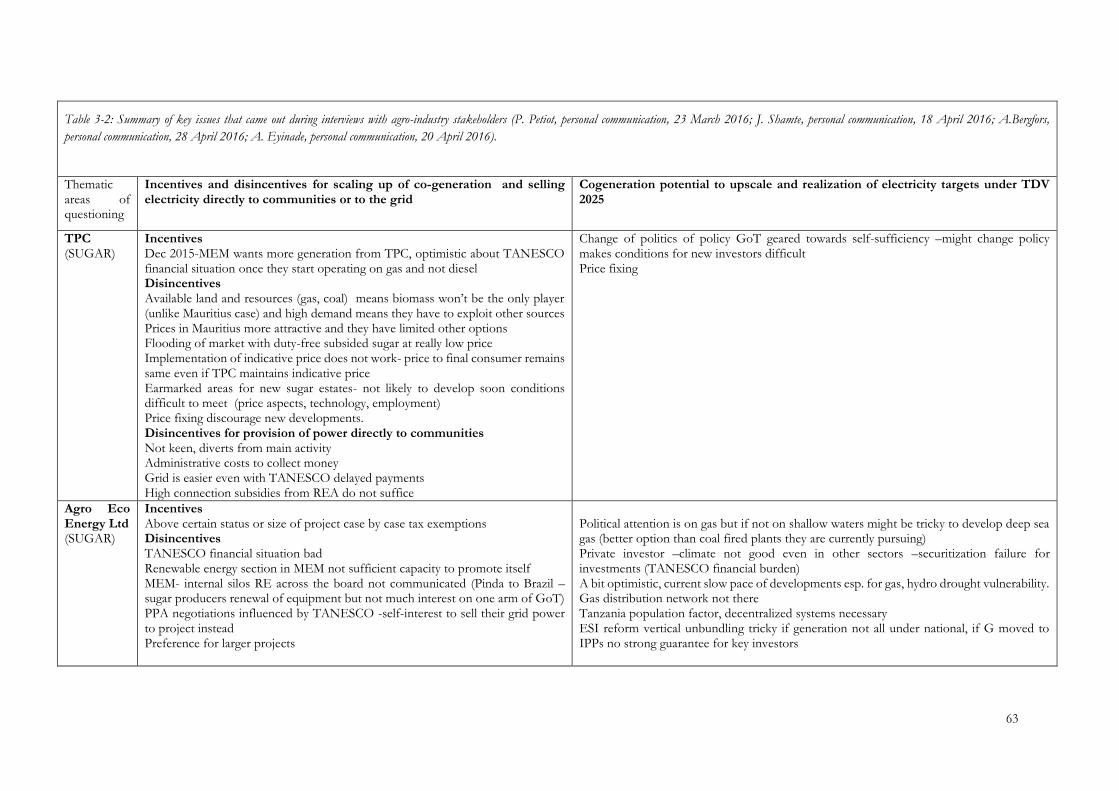
63
Table 3-2: Summary of key issues that came out during interviews with agro-industry stakeholders (P. Petiot, personal communication, 23 March 2016; J. Shamte, personal communication, 18 April 2016; A.Bergfors,
personal communication, 28 April 2016; A. Eyinade, personal communication, 20 April 2016).
Thematic areas of questioning
Incentives and disincentives for scaling up of co-generation and selling electricity directly to communities or to the grid
Cogeneration potential to upscale and realization of electricity targets under TDV 2025
TPC (SUGAR)
Incentives Dec 2015-MEM wants more generation from TPC, optimistic about TANESCO financial situation once they start operating on gas and not diesel Disincentives Available land and resources (gas, coal) means biomass won’t be the only player (unlike Mauritius case) and high demand means they have to exploit other sources Prices in Mauritius more attractive and they have limited other options Flooding of market with duty-free subsided sugar at really low price Implementation of indicative price does not work- price to final consumer remains same even if TPC maintains indicative price Earmarked areas for new sugar estates- not likely to develop soon conditions difficult to meet (price aspects, technology, employment) Price fixing discourage new developments. Disincentives for provision of power directly to communities Not keen, diverts from main activity Administrative costs to collect money Grid is easier even with TANESCO delayed payments High connection subsidies from REA do not suffice
Change of politics of policy GoT geared towards self-sufficiency –might change policy makes conditions for new investors difficult Price fixing
Agro Eco Energy Ltd (SUGAR)
Incentives Above certain status or size of project case by case tax exemptions Disincentives TANESCO financial situation bad Renewable energy section in MEM not sufficient capacity to promote itself MEM- internal silos RE across the board not communicated (Pinda to Brazil –sugar producers renewal of equipment but not much interest on one arm of GoT) PPA negotiations influenced by TANESCO -self-interest to sell their grid power to project instead Preference for larger projects
Political attention is on gas but if not on shallow waters might be tricky to develop deep sea gas (better option than coal fired plants they are currently pursuing) Private investor –climate not good even in other sectors –securitization failure for investments (TANESCO financial burden) A bit optimistic, current slow pace of developments esp. for gas, hydro drought vulnerability. Gas distribution network not there Tanzania population factor, decentralized systems necessary ESI reform vertical unbundling tricky if generation not all under national, if G moved to IPPs no strong guarantee for key investors

64
MES (SISAL)
REA does not have enough funding Incentives Sisal sector 10 year strategy for increased production and out growers to benefit locals Disincentives Banks RE risky, very high interest rates SPP do not necessarily meet criteria for funding from big institutions Utility not business oriented Local awareness and capacity needs lacking
Optimistic about a utility turn around and reforms but policy needs to better accommodate investors TDV 2025 is possible
HPS (RICE)
Incentives REA useful but limited Buy-in from rural communities is there – villages offer land for free for gasifier set up Regulation amongst the best around- light handed regulation for very small power producers (registration with EWURA made easy for projects under 1 MW) Disincentives Very low population density, even if feedstock is present distance between households influence mini-grid cost Very high interest rate on loans and tenure short- RE risky Grid extension uncertainty –had to reallocate Kilombero plant 10 months for small mini/micro grid EIA
Political influence (MPs) –grid extension information not bullet proof Regulation wise the country is doing well relative to other regions Government political determination will determine progress if TDV 2025 will be achieved

65
3.4 Political-economy analysis
Guided by the PEA framework by Barnett et al. (2016), this section will explore four stages of the framework as it relates to specific issues in the Tanzanian power sector and sugar, sisal and rice agro-industry energy generation projects.
Problem Identification
At large, the country’s plan to provide electricity to 50 percent of the population by 2025 seems too ambitious for most in line with controversies surrounding key sectors that the PSMP has set out to cater to electricity in the immediate term and long term. In addition the country remains highly endowed with great untapped renewable energy potential. As an economy that developed on the backbone of the agricultural sector, it is not fully capitalizing on this potential of biomass for cogeneration and electricity supply via the decentralized track.
The number of agricultural initiatives geared towards value addition and modernization of the agricultural sector indicate recognition by decision makers of the historical importance of the sector and the future need for this sector. However, the pace of commercialization and modernization is not as fast even with the pertinent need to increase employment and maintain relevance of this sector which currently employs up to 76.5% of the countries labour force. A disconnect exists between the theoretical relevance of this sector and the implementation of actions to indicate its significance for a nation whose majority of the population is the youth.
Biomass cogeneration in the agro-industrial sector remains slow paced even after several studies have proven the theoretical and technical potential of different crops (Gwang’ombe 2004; Gwang’ombe and Mwihava 2005; Abdallah et al. 2010;Terrapon-Pfaff 2012; Camco 2014; AfDBa 2015).
The benefits of cogeneration in agroindustry are clear and the incentive is there seeing they already have a need for steam in processing operations but the set targets for installed capacity by resource type seem biased towards big projects such as gas, coal and hydro that retain power within a centralized track of increasing access to grid electricity.
Tanzania like most countries in Africa understands that a two track approach is needed for enabling greater access to grid-based electrification. This is reiterated in the 2015 National Investment Prospectus and the REA is even gearing to prepare a REMP aimed at earmarking areas were off-grid solutions would be needed to supplement the grid solutions in the PSMP. The eventual plan according to the utility is linking isolated mini-grid developments to the main national grid. Political interference domestically and external international factors have been linked to performance of the power sector either with regards to IPPs procurement, EPPs procurement decisions and operational aspects of the national utility.
While socio-technical studies have been conducted to establish the missing link between cogeneration potential and set targets, an exploration of political economy influences, internal and external, national and international would allow better understanding of influencing factors of generation in the ESI and if these influences trickle down to the slow pace of agro-industry biomass co-generation.

66
Diagnosis
Political nature of developmental processes requires a unique approach and location specific research to ensure clear understanding of local contexts. Development outcomes are greatly influenced by political processes, dynamics of different decision makers, incentives and motivations behind them and both formal and informal institutions and structural features of developing countries (ODI 2011; Barnett 2014). External factors
Tanzania’s development trajectory since post-independence years cannot be isolated from development aid and international institutions. It has been considered by several studies as one most aid dependent country in SSA. Between 1980’s and first half of the 1990’s, foreign aid as share of GDP grew from one sixth of GDP to one-fourth of GDP (Lofchie 2014).
The ability of Tanzania to solicit donor funds has its foundations back when Nyerere was in power. On an individual level he can be regarded a key economic assets when it comes to maintain donor relations. The continued democratic peaceful nature of the country has managed to sustain the key donors. Historically consistent donor support is partly blamed for the prolonged time between dire conditions of Tanzania under poor economic policy choices associated with implementation of ISI under the socialist regime and implementation of the first reform steps to transition towards market economy 1986 (Lofchie 2014). It is sometimes regard as ‘toxic aid’ based on the part played by it in sustaining these counterproductive policies (Edwards 2014).
Government expenditure and delivery of public services still remains to a great extent at the mercy of donor money. One-third of government spending between 2007 and 2011 was from donor funds but the trend shows that it has declined between 2012 and 2014. As one of the top 10 recipients of aid from OECD Development Assistance Countries (DAC), it is therefore of political significance for the country to maintain relations with key donors based on development partnerships (The Royal Institute of International Affairs 2016). Tanzania is split between its donor dependence for development and the aspiration for self-reliance as influence by commitments in the 1967 Arusha Declaration.
However donors are becoming more creative in finding ways to use their position to navigate domestic issues. Donors now models of budget support in Tanzania show a transition from non-earmarked general budget support to sector specific directed support. This raises new voices calling for a change of business as usual based on foreign finance aid being pervasive and intruding into domestic policy ( ). The recent budget 2015-2016 calls for a move towards less donor reliance.
This relationship and new donor-recipient approach trickles down to the energy sector and creates inflexibilities within it related to policy reforms and regulations (Moner-Girona et al. 2016). Tanzania is no exception. However, the REA a semi-autonomous body under the MEM and therefore reports to the Ministry has a REF whose funding comes from budget allocation from MOF based upon submitted planned investment for the particular financial year. This is the same budget that is heavy donor dependent. AfDBa (2015) further cements the fact that sector international aid funding is here to stay for a while with multi-year sector commitments 2016-2017 totaling US $ 1 billion with $350 million allocated to RE.

67
However the importance of Tanzania to the donor policy objectives is proven by the fact that even with corruption scandals associated with public funds in the country, the most that happens is it gets suspended but not necessarily discontinued. Tanzania is crucial for key flagship US development programs operate in Tanzania. For instance Tanzania has been receiving funds under US based Milleneum Challenge Corporation (MCC) since the beginning of the first compact funds in 2008 that ended in 2013 making it the largest signed compact ($ 698.1 million) in the history of MCC then. Sucessful implementation of the first program had MCC geared for the second compact with a specific power sector focus likely to contribute to broader goals of a bigger Power Africa initiative by President Barack Obama (MCC 2016). The MCC second compact ($473 million) aimed at investments in policy, regulatory and institutional reforms plus infastrucuture was suspended this yea. The Zanzibar election conduct was central to this decision with the board of directors citing nullification of elections results as not meeting the free and fair elections and democracy criteria for MCC partner countries. This funding was earmarked for specific areas of investment and do not impact rural electrification funding.
Breaking away from donor-models of reform in Tanzania would not happen anytime soon based on the historical trend and the power and legitimacy given to donors. The WB for instance have been cited on several occasions to be the pressure behind several reforms in the energy sector from the opening of the energy sector to private investment in 1992 lifting utility state monopoly on generation to the formation of the country’s first National Energy Policy in 2003.
Liberalization of the energy sector in 1992 has only managed to contract two very costly IPPs (Songas and IPTL) under contracts surrounded by controversy, non-transparency and poor planning (Gratwick et al. 2006). However, internal pressures associated with drought and power crisis in the country also played a role. In addition in 2002 the WB also pressured for extension of a management contract of TANESCO by South African Net Group Solutions regardless of the poor performance of this company (TANESCO 2014). “This company did not do much to develop the energy infrastructure but rather focused on improving fee collection efficiency” (personal communication, 25 April 2016). In addition the developed SPPs framework was funded by SIDA and administered by the WB (SIDA 2014).
Public vs Private Sector
The need for the above pressures from donor communities and development partners for the energy sector reforms goes to show the deep rooted nature of the socialist pro-nationalization regime and how it might still persist in today’s economic policy. This is further re-emphasized in what the said to be Government’s fluctuating commitment to private sector in the electricity supply sub-sector. A study of IPPs in SSA by the World Bank (2016) draws on evidence showing that while in paper at least the Government seems to be consistent in its message to the private sector investment in adopted policies, the central nature of TANESCO and linkages to government and ownership of installed capacity might say otherwise. Appendix L shows grid installed capacity and highlights ownership with most of existing generation still under TANESCO.
Majority of the planned projects related to upcoming generation are still very much going to be built and owned by TANESCO which is 100% government owned. Furthermore it does not help that TANESCO holds two positions that present a conflict of interest as sole buyer of power from all

68
other generators (IPPs, EPPs, and SPPs) and also a key generator of electricity. The structure of below highlights the central position and the potential platforms were agro industries (as IPPs or SPPs) come in and linkages to TANESCO.
In addition, in the cases were generation engages the private sector, there is a bias for public-private partnerships with generation remaining on infrastructure owned by TANESCO which has depreciated. This arm’s length nature of engaging the private sector is said to be an unwritten policy formalized through letters from EWURA to the energy minister (World Bank 2016). In 2008, when Electricity Act (2008) reignited faith in the states commitment to private sector commitment, but then political interference and the non-competitive nature that followed EPPs procurement and the push for four other state owned power projects says otherwise (MEM 2011; World Bank 2016). The planned ESI reform for the unbundling of the utility is another set reform that highlights existing concerns pointed out that relate to the nature of engagement with private sector .It has been highlighted that while the reform document had not been publicly announced concerns exist amongst the few in energy sector involvement about generation being handed over to private foreign investors instead of local private investors (personal communication, 12 April 2016). Here general public concerns over foreign private investors comes in and bring to question to what extent is the GoT committed to private sector and how open is the general public to this especially in light of the new inward focus local industry facelift promises that are carried in the incumbent president’s manifesto.
Figure 3-2: Potential entry points for upcoming20 agro-industries stakeholders interviewed within the ESI structure (Source: Adopted from TGDC 2014).
20 TPC has a signed PPA under SPPA and HPS is too small for SPP, so it falls under VSPPs (not included on the structure above).
Agro EcoEnergy
Ltd?
MES?

69
Political frustrations over yet another power crisis resulted in rushed decisions, resulted in yet another rushed ad hoc decision by MEM and this was prior to EWURA getting review oversight over all projects within the Power System Master Plan21. These historical nature of planning in this sector being outsourced to consultants and TANESCO plus the consequences of poor decision of TANESCOs part in previous contacts will influence development towards the 10000 MW generation capacity by 2025 target.
Table 4-1: Installed generation capacity for 2012 and planned 2030 installed capacity by source type according to PSMP (Source:
Adopted from MEM 2015; Camco 2014; AfDBa 2015; personal communication 11 April 2016).
Source Installed Capacity 2012 (MW)
Installed Capacity 2030 (MW)
Comments, Vulnerabilities or contention factors
Natural Gas 501 2584 Uncertainty of gas development More challenging to develop than other fossil fuels, might require a ready market (anchor clients with huge demand) for it to be worth the infrastructural investment public domestic expectations vs. export oriented development tensions
Coal 2200
HFO/GO/Diesel 456 676
Total fossil fuels 957 5460
Large Hydro 553 2954 drought vulnerability resulting in poor decisions to take on IPP’s and EPPs under political interference
Wind 100 Compared to solar, relatively low penetration due to time and capital needs for pre-assessments before FID but tax exemptions also provided wind technologies.
Solar 6 120 Has had largest uptake/ penetration due to flexibilities of scale (micro-grids, mini-grids, household level DIY22 systems and tax exemptions have helped.
Small Hydro 13 17 Most projects under 1st generation SPP framework are mini-hydro as the REFiT is based on avoided cost methodology and LCOE for mini-hydro differs from other RE technologies
Biomass co-generation
35 67 The draft National Policy speaks to biogas projects but not so much to progress in cogeneration
21 The PSMP is subject to updating to include geothermal developments planned and specify other soures, so the total for 2030 would
likely increase. Work on an updated 2016 version is on-going (personal communication, 11 April 2016).
22 DIY solar systems can be bought through agents and installed by a customer on their own but consultative approaches exist. Solar
systems use and training is also incorporated syllabus of the Vocational Educational and Training Authority (VETA), a well established technical school in the country. Prior to that a solar association and network was established allow technial solar capacities to grow in the country . All this was enabled by support from MEM working with NGO’s and enterprenuers (personal communication 11 April 2016).

70
MEM liquid biofuel and biogas development, biomass cogeneration on backseat
Total RE 593 3258 This figure excluding large-hydro is only 304 MW No approved National Renewable Policy
Other non-classified
272
TOTAL 1558 8990 Likely to increase on inclusion of additional wind and geothermal planned investments upon updating of PSMP
Expected to have the second highest installed capacity at (2584 MW) as per Table 4-1 the gas discoveries in the country depending on newly draft policies and regulations are expected to generate fiscal revenue or allow for a domestic gas to power development (IEA 2014). However, unlike hydro which under BAU scenario would be the only RE developed the GoT has not mastered the technicalities or organizational skills needed for onshore gas, let alone the new territory of off-shore gas. Gas developments portray yet another source of tension and a government stuck between quick more practical approaches based on existing local capacity to export and the strong public expectations for directly felt effects of gas (IEA 2014).
Your average Tanzanian wants to be able to utilize abundant energy sources in his/her state, indirect fiscal revenue effects do not allow a sense of ownership for the wider public. However, the country does not have the capacity the set up the expensive distribution network needed and for investment planned for potential market the timescale to realizing the production of gas is not any time before 2020.
The 2013 National Gas Policy (NGP) and the draft National Energy Policy (NEP) released January 2015 points out in a few sections that draw out the importance of domestic markets obligations ( NGP Section 3.1.2 and NEP Section 3.5.3) and the necessary set up on a mechanism to guarantee prioritization of domestic over export market. The section that follows this (NEP Section 3.5.4) emphasized local content and national participation. While the inclusion of these set out a guidelines for accommodation the wider public expectations, the subsequent regulations under this influence actual implementation. Under this draft the MEM still reiterating ensuring an enabling environment for private sector in development of modern energy services.
Rent-seeking opportunities exist along the entire value chain of the power sector (Bannet et al. 2016). The very nature of the power sector and big projects enable centralized opportunities for huge rent extraction at different phases from energy and equipment procurement to collection of revenues (personal communication, 28 April 2016). The decentralized electrification track as referred to by World Bank (2016) enables non-governmental entities to get engaged and further lifts the state monopoly on generation. This implies some shift in the government’s power to communities, NGO’s and private enterprises.
In addition there is a profitability element in play. Prior to formation of REA, rural electrification was under MEM was not well guided and lacked a clear taskforce for implementation (personal communication, 11th April 2016). It was not profitable for the MEM and hence the separation of it from core activities of the Ministry (personal communication, 5 April 2016). The 2003 NEP called for proper facilitation of rural electrification and this perpetuated formation of the REA in charge of rural off-grid electrification. However, relevant for the non-profitability nature of TANESCO’s operation

71
mode is the fact that this of rural electrification component feeds back to the utility once the project is up and running. The 2003 NEP, clearly calls for private sector investment but REA’s annual report financial year 2013/2014 still reports as a key challenge lack of sufficient private sector investment in rural energy projects.
The preferable for large scale generation projects over sources more suited for decentralization is clearly visible on Table 4-1 above. Gas is earmarked for immediate energy needs in the country with long term needs seeing a mixture between gas, coal and large hydro with minimal contributions from solar, wind and biomass (as indicated by the pattern on Table 4-1) (AfDBa 2015).
RE is yet to take center stage in the Tanzanian energy landscape. While expected to be updated to include geothermal investments, the PSMP seems at first glance to have a big share of renewables (3258 MW). However, minus large hydro the renewables share comes down to only 304 MW. To a great extend the country is not stepping away from drought vulnerable large hydro. In addition, the renewable energy operations and planning remains largely unguided with no existing approved National Renewable Energy Policy. Regulations for investors with projects below 10 MW installed capacity exist but a lot is lacking on incentives and a FiT for those above 10 MW. Initiatives for several small solar and mini-hydro and biogas by different organizations on the ground exist but they are not streamlined which can be counterproductive and depend on spot funding.
The SREP Investment Plan under MEM supported by Multilateral Development Banks (MDBs) is set to facilitate renewable energy focused investments. The SREP Investment plans calls for renewable energy consisting of up to 14 percent of the energy mix (complemented by 26 percent large hydro). However, upon questioning no clarity was provided or acknowledgment or accountability of this documented target. This reinforces lack of a much needed clear strategy for renewable energy and as a results the RE market in Tanzania becomes this place whoever has funding dictates different strategies for different rural electrification projects (personal communication, 25 April 2016).
There key areas of national priority for development identified via consultations and a set of national criteria include; geothermal and renewable energy for rural electrification (RERE) and alternative biomass supply options (MEM 2013b). The first two were pushed forward to the project document, strategy development and regulation preparation phase with altenrative biomass supply options taking a back seat. While RERE is renewables its focus is only on sustainable solar market packages (SSMPs), micro grids and mini grids (MEM 2013). The set plan then was for alternative biomass supply options to first be guided by preparation of a BEST and action plan and implementation to be taken upon availability of additional SREP resources ‘if” they become available (MEM 2013b).
Sector level priorities
A quick glance at the BEST indicates a trend of selective biomass prioritization by MEM. The prioritization is at regulatory level and also at operationalization level. MEM is only mainly involved in liquid (biofuels) and gaseous (biogas) biomass. The biogas focus is also manly perpetrated by development partners cashing in highly on it and driving initiatives such as the Tanzania Domestic Biogas Programme (TDBP) which is private sector led. On top of this MEM send a request in its 2013-2014 budgetary submission to the MOF for up to MEM TZS 20 billion for biogas support and none has been allocated for co-generation since 2012 (Camco 2014).

72
Meanwhile the draft NEP 2015 acknowledges what they called “inconsistent efforts from different orgnisation of generation electricity from agricultural wastes such as sisal wastes and rice husks”. The 2003 NEP has no mention of it because by then no clear methodology of determining tarrifs was adopted till 2008. This provided a hindrance factor in the early years when TPC installed a new boiler and had started talking to TANESCO about selling to the grid.
Within the existing energy structure as presented on Figure x, co-generation investors have to two entry points for participation. The first is as IPPs if they have over 10MW and tariff and PPA will be negotiated with TANESCO and the second is under the SPP program (I MW to 10MW) were they would sign a clearly EWURA designed and regulated SPPA.
Existing regulations create incentives and disincentives depending on the scale of potential co-generation operations. The latter SPPA pathway is the more predictable and established and one that has been international praised as the best23 in the region (Climatescope 2015). It has encouraged SPPs to sell to main grid and isolated grid with higher tariffs being offered for sell of electricity to isolated grids. Also for SPPs below 1 MW (hereinafter referred to as Very Small Power Projects (VSPPs)), Tanzania has opted to apply partial deregulation for ease and simplicity of getting operations running (World Bank 2014). This means VSPPs unlike SPPs do not need to apply for a license from EWURA, and simply submit a form with details on business registration, location, fuel, technology and electricity produced.
Table 4-2: Summary of the investment requirements for VSPPs, SPPs and IPPs (World Bank 2014; World Bank 2016;
EWURA 2016; personal Communication 11 April 2016; personal Communication 20 April 2016).
VSPPs (<100 kW) SPPs (100 kW- 10 MW) IPPs (>10 MW)
EWURA license to generate and sell
No generation license needed, provide basic details of location, business license from TRA,
Generation license needed Generation license
Pricing
Tariffs determined by investor if not connecting to grid
Set tariffs for grid and off-grid (mini-grid). Adjusted for seasonality (Wet and dry season).
Negotiated on a case by case basis. Guidelines titled “Model PPA Agreements” released by MEM (4th August 2015) as issued to EWURA are used to facilitate negotiations between the power off-taker and investors for seven energy technologies (Geothermal, gas, oil, coal, wind, solar and hydro).
Competitive bidding
N/A 2nd generation SPP framework approved wind and solar technologies competitive bidding (29th February 2016). Only effective once 2016 approved SPP rules and SPPT are gazetted.
As exemplified by Songas and IPTL contracts, preference is for negotiations and not competitive processes for procurement
23 The Climatescope is an organization that provides assessmsent of investment climates for clean energy developments in terms of
policy and finance so as to guide where clean energy investment is and where it can be directed to. The ranking is based on a number of criteria for 55 countries globally. Tanzania scores well in the enabling framework criteria basedon the SPPAs for grid and isolated grids (Climatescope 2015).

73
Incentive for investors
Incentive in the sense of EWURA not having much oversight over tariffs for retail customers Creates room for exploitation of desperate rural communities needing electricity. EWURA ‘may’ review retail tariff if they receive a petition signed by 15 percent of households in the SPPA service area
encourages SPPs and private sector engagement in RE projects
Room for large investors provided they agree on tariff
Disincentive for investors
Affordability struggles at community level
Agro-industry cogenerators discouraged to sell to communities directly. Less administrative aspects when selling to grid.
Discourages private sector, negotiations not fruitful and the process is long and unguided (no approved RE policy).
Changes to tariff determination on gazetting of 2016 electricity rules for SPP development and SPPT
N/A SPPs executed before August 2015 - avoided cost tariffs shall be applicable. SPPs executed after August 2015 specific to hydro and biomass -technology based tariffs shall apply.
N/A
Larger than 10 MW investors take a different more uncertain pathway to getting things on the ground. The lack of incentives for renewable projects greater than 10 MW, in a way sets an ‘invisible cap”” on investment potential in this area.
A study on lessons to be learned from IPPs in SSA points to failure of Tanzania to harness its domestic resources economically efficiently on the basis of the following three key features of the sectoral practices. The first is lack of up-to-date and coherent planning. The second is portrayed in to the practice of contracts set up inclusive of the allocation of private and public funds. The third is the already touched on wavering commitment to private sector engagement (World Bank 2016). The road taken by IPTL and Songas procurement and take off was surrounded by non-transparency, corruption implicating the high level politicians, non-competitive practices and while both being IPPs terms of agreement differed because of lack of standard IPP terms and conditions (Gray 2015; Gratwick et al. 2006), Implicated in the public procurement IPTL scandal include the then incumbent Minister of Energy and the former Minister plus the Prime Minister then Edward Lowassa, who was the opposition candidate in Tanzania’s 2015 elections that brought in the current President Magufuli (Gray 2015).
Table 4-3: Shares/costs of capacity and generation by type of producer: Tanzania 2013 (World Bank 2016; personal communication, 11 April 2016).

74
Table 4-3 goes to show evidence of the shortfalls of MEM, incompetence of the MOF and TANESCO when it comes to costing and execution of well-planned economically efficient decision with regards to the ESI. The utility cost ($/kWh) is low on account of subsidization from the GoT. TANESCO’s unit cost is a function only o running costs with exclusion of financial costs and depreciation (World Bank 2016). This makes a comparative comparison between TANESCO and private sector based on similar technology and comparable load factors. Customers of TANESCO do not incur any charges for capital costs of utility owned plants but this cost is still incurred (World Bank 2016). EPPs and IPTL have extensively contributed to the current financial situation of the utility, which is in turn dis-incentivizing investors as concerns are raised with regards to the creditworthiness of the utility (WFC 2012; Deloitte 2015; personal communication, 11 April 2016).
The MOF has on several occaisons also been blamed as the main budgetary fund allocator for all country investments, as lacking the technical capacibilities to weigh in during these inefficient procurements. High energy costs and unreliable power supply are said to inturn threaten industrialization goals (Deloitte 2015). TANESCO has phased out all EPPs in line with planned reforms but the utility needs assistance to clear its current debt. At the same time, cogeneration existing and potential investors cite existing development and commercial banks very high interest rates associated with short tenure periods as a key bottleneck. This raises the question on how investors are to acquire funding while situated between a rock and a hard place.
Prognosis and Interventions
Specific agroindustry aspects also come into play. Within the sugar industry concerns over the instablility of the market translate into the industry not having as many huge investors since independence. While plans are set under agricultural initiatives for scaling up and commericialzation, progress is slow. Investors are also concern about what they regards as price fixing by the SBT, but the SBT continues to insist that the price given is simply indicative.
In the sisal sector, the potential for upscaling exists but in line with government selective prioritization within the biomass sector. This means most of the developments here are earmarked for biogas generation and not so much co-generation systems. However, with regards to gasification sisal seems to have a more promising future and less controlled market relative to the sugar indicative price aspect, illegal smuggling and decision to import duty free subsidized sugar. However, an analytical distinction with regards to how sugar and energy generation co-exist, points to three models of sugar industry co-generation. Sugar estates that generate electricity or heat for internal processes and supply to some employees within the estate (model 1) , those that manage to generate enough for internal operations and sell to the grid (model 2) and those that can generate sufficient power to supply surrounding communities directly (model 3). TPC falls under model two at the moment and points out to lack of incentive to sell to the communities around based on administrative costs it would entail and that it would divert them too much from their main activities. Therefore while managing to create incentives

75
to sell to the grid through SPP projects regulations at the moment do not provide incentives to sell to communities directly.
Affordability of the part these mostly poor rural communities presents a key bottleneck even for TANESCO which is already indirectly subsidizing connection costs and its electricity users do not pay for any of its capital costs. Access to electricity increased from 13 to 24 percent between 2008 and 2012 after the connection fee reduction introcuded (IEA 2014). Connection fees in ruban ares were cut by 40 percent and by 60 percent in rural Tanzania. This goes to the level poverty of the communities to be served by agro-industries and to emphasize on why more incentives are needed before this can take place.
For investors like Husk Power System, the low population density and affordability on the part of the customers present technical and financial challenges. Decentralized systems are best if a population is well concentrated and therefore extending mini or micro-grid connectivity remains relatively cheap and the investor can at least break even. However, VSPPs like HPS have some flexibility of the process of getting licenses and tarrif setting is done by them so this might present an incentives for future off-grid VSPPs.
The incumbent President bring a lot of promise to the nation and new drive going forward. However, he cannot push everything himself and alliances within the political party do not necessary align with his vision. No clear direction has been provided yet by him with regards to the energy sector but it is acknowledged that while the focus is local industries and revival of manufacturing revamping the ESI is necessary and the ESI reform would need to go forward. However, his election of the same Minister of Energy who has to resign over corruption allegation does not send the right signal to investors and some do not see this aligning with his positive acceptance so far (personal communication, 28 April 2016).
So far the President has proven to be anything but business as usual (BAU), this also means the country’s regulatory foundation is shifting and investors need work within it. The draft 2015 Renewable Energy Policy and the draft 2015 NEP have a lot to say with regards to local content and domestic market prioritization. While it is too early to tell, this new pace of things at high government level presents a potential pathway for change and for at least minimizing corruption loopholes in the system.
76
4 Discussion This research analysis was guided by PEA framework by Barnett et al. (2016), a framework being used for country-level studies that require extensive time. Therefore while provided a means of systemizing what is a rather complex issue, shortfalls exist in the depth and coverage of the four stages of the framework. The problem identification aspect was covered extensively but to a great extent diagnosis was mainly limited to sub-components 2a and 2b on establishing features that sustain the problem and drawing out key players and their motives and power. Potential pathways of change are identified but to a very limited extent.
For purposes of better triangulation insights might have been provided with interviews conducted with Funders (Development and Commercial Banks, Development Partners) to get there opinion on the donor-reform model and influences in decision making in the power sector. Also so as to explore how they approach loan applications from renewable energy investors and assessment of risks plus interest rates determination. Private sector coalitions such as the Tanzania Private Sector Foundation would have added more weight to concerns by agro-industry sector investors.
The research zoomed in three different types of agro-industries which was useful for diversity purposes but this may in turn limit in depth insights from invidivial agro-industries and how they related to surrounding communities. This might have added value on understanding aspects of agro-industry provision of electricity directly to communities.
All that said, PEA is an attempt to move away from traditional explanations of why sectors operations are not working but traditional reasons still remain relevant especially in the case of renewable energy penetration in Tanzania. Therefore a mix of both socio-technical and PEA would provide for more rich insights into incentives and disincentives for scaling up agro-industry cogeneration and pathways for change to allow for decentralized approaches to rural electrification.

77
5 Conclusions Having looked at the energy and agro-industry perspectives as they relate to the political eonomy context of Tanzania the following are the key aspects drawn out with regards to the two research questions;
Why has the Electricity Supply Industry in Tanzania struggled to provide reliable power to facilitate state development aspirations?
Power sector development in Tanzania cannot be isolated from political influences in the country. Evidence for this is seen in the rate of turnover of Ministers of Energy in the country and the association of political leaders as high up as the Prime Minister in big corruption scandals related to procurement practices in the ESI. As MEM has oversight over Tanzania, and the GoT remains the only shareholder of the utility, one therefore cannot overlook the potential linkages. Decisions at MEM remain ad hoc and influenced government officials and these trickle down to MEM’s responsibilities as the body with oversight over utility operations. The utility is lacking a commercial orientation and is being operated as a tool for pursuing state interests as they relate to maintaining donor and development partner relations and state interests. Incompetencies in terms of making economically sound decisions and not giving enough power to EWURA, an entity meant to be neutral and independent, means that regulatory oversight is inconsistent and in some cases lacking. The lack of a broad renewable energy policy and regulations specific to it, means that penetration of renewables remains largely unguided. The ESI reforms are yet to be fully taken under the wing of the Incumbent President and at utility level progress seems to be slow in terms of getting TANESCO out of its financial disability. Organizational and technical capabilities need to be improved at TANESCO, MEM and the MOF needs to take more initiative as the institution that allocates the funds for ESI projects that are not moving at the pace needed for TDV 2025.
What incentives and disincentives are needed to enable up-scaling of agro-industry co-generation in Tanzania?
Agriculture commercialization has been guided by so many intiatives since independence. However, while it remains a key sector for the economy, it seems to still fall back in terms of productivity and value addition to activities within it. The sugar sector has not changed much since independence with only four major investors and the new ones currently in play struggle with disincentives related to regulatotion if they fall under IPPs. There is no established standard contract for generation that goes beyond 10 MW and this results in long and unfruitful negotiations between investors and TANESCO.
The GoT is sending mixed signals to private sector investors on two fronts. First the GoT while recognizing the need for a decentralized approach for increasing access to grid electricity, it remains largely stuck in being the central body in electricity generation and ownership of infrastructure. An unwritten policy seems to exist to facilitate preference of public-private partnerships and preference has been for non-competitive arrangemetns. This does not encourage investors. Secondly, for private sector investors looking to enlarge decentralized approaches by electrity provision via mini-grids and micro-grids, the clear large scale investment prioritization is a disincentive. Decentralized approaches are still marginalized and while the REA has done a lot of work in the last few years it remains short on finance. Agro-industries in Tanzania have the intention to get involved at least to the extent of selling power to the grid under SPP (seeing it has a clear procument and standard contracts), but broader government deprioritization of biomass resources and specifically co-generation render large

78
scale extensive co-generation unlikely in the near future. The priority at regulatory and decision making level in the immediate term remains to be the gas sector and in the long run coal and large hydro will join the gas sector.

79
Bibliography Abdallah, S. M., Nygaard, I., & Mackenzie, G. A. 2010. Business Models for Rural Electrification from Agro-Industries - The Case of Kenya, Tanzania, Rwanda, and Malawi: Revised version. European Commission,(PACEAA Deliverable D2).
Acheson-Brown, D.G. 2001. The Tanzanian Invasion of Uganda: A Just War?. International Third World Studies Journal and Review 12:1-11.
African Development Bank (AfDB). 2015a. Renewable energy in Africa; Tanzania country profile. Abidjan: African Development Bank.
African Development Bank (AfDB). 2015b. RSE4ALL Africa hub annual report. Abidjan: African Development Bank.
Agro EcoEnergy. 2014. Agro EcoEnergy. Retreived from: http://www.ecoenergy.co.tz/home/.
Ahlborg, H. and Hammar, L. 2015. Drivers and barriers to rural electrification in Tanzania and Mozambique - Grid-extension, off-grid and renewable energy technologies. Energy Research and Social Science 5: 45–54.
Ahlborg, H. and Sjostedt, M. 2015 Small-scale hydropower in Africa: Socio-technical designs forrenewable energy in Tanzanian villages. Energy Research & Social Science 5:20–33.
Barnett, A. 2014. Political considerations relevant to Energy and Economic Growth. A Literature Review. Brigton: The Policy Practice.
Barnett, A., Stockbridge, M. and Kingsmill, W. (2016). Policy Practice Brief 10 – Political Economy of Africa’s Power Sector. Retrieved from: http://thepolicypractice.com/publicationspage/.
Berndes, G., Hoogwijk, M., & van den Broek, R. 2003. The Contribution of Biomass in the Future Global Energy Supply: A Review of 17 Studies. Biomass and Bioenergy 25: 1-28.
Bhattacharyya, S.C. 2014. Viability of off-grid electricity supply using rice husk: A case study from South Asia. Biomass and Bioenergy 68:44-54.
Binswanger-Mkhize, H.P. and Gautam, M. 2010. “Towards an Internationally Competitive Tanzanian Agriculture.” World Bank Draft Report, 22 March, Dar es Salaam.
Camco Clean Energy (Tanzania) Limited. 2014. Biomass Energy Strategy (BEST) Tanzania: Tanzania Biomass Energy Strategy and Action Plan, Final Report. Dar es Salaam: Camco Clean Energy (Tanzania) Limited.
Coulson, A. 2013. Tanzania: A Political Economy. New York: Oxford University Press.

80
Dasappa. S. 2011. Potential of biomass energy for electricity generation in Sub-Saharan Africa. Energy for Sustainable Development 15: 203–213.
Deloitte Tanzania Limited. 2015. Tanzania budget insight 2015; diving deep. Dar es Salaam: Tanzania.
Denzin, N.K. (1978). Sociological Methods. New York: McGraw-Hill.
Deutsche Bank AG. 2013. GET FiT in Uganda Observations and open issues from a financial perspective. Policy Paper: Natural resources. Frankfurt: Deutsche Bank AG.
Developmental Leadership Program (DLP). 2014. From Political Economy to Political Analysis. Birmingham: Developmental Leadership Program.
Department for International Development (DFID). 2004. Drivers of Change public information note. London: Department for International Development.
Economic and Social Research Foundation (ESRF). 2014. What growth pattern is needed to achieve the Objective of Tanzania’s Development Vision–2025? THDR 2014: Background Paper No. 5 ESRF Discussion Paper 59. Dar es Salaam: Economic and Social Research Foundation.
Edwards, S. 2014. Toxic Aid: Economic Collapse and Recovery in Tanzania. New York: Oxford University Press.
Electricity and Water Regulatory Authority (EWURA). 2016. Small Power Projects. Retrieved from: http://144.76.33.232/?page_id=461.
Energy for Sustainable Development Limited (ESD). 2007. Energy planning in sub- Saharan Africa – facing the challenges of equitable access, secure supply and climate change. Wiltshire: Energy for Sustainable Development Limited.
European Commission. 2005. Biomass: Green Energy for Europe. Luxembourg: Office for Official Publications of the European Communities.
Food and Agriculture Organization (FAO). 2008. Enabling Environments for agribusiness and agro-industry development in Africa. Rome: Food and Agriculture Organization.
FAO and AGAL. 2005. Livestock sector brief; United republic of Tanzania. Rome: Food and Agriculture Organization and Livestock Information, Sector Analysis and Policy Branch.
Food and Agriculture Organization (FAO). 2009. Fibre stories; Sisal starts a comeback in Tanzania. Retrived from: http://naturalfibres2009.org/en/stories/sisal.html.
Food and Agriculture Organization (FAO). 2016. Future Fibres; Sisal. Retrieved from: http://www.fao.org/economic/futurefibres/fibres/sisal/en/.
Food and Agriculture Organization (FAO). 2013. Potential constraints to smallholder integration into the developing sisal value chain in Tanzania. Joint meeting of the thirty-seventh session of the intergovernmental group on hard fibres, Negombo, Sri Lanka, 5 - 7 November 2013.

81
Freeman, R. E. 1984. Strategic management: A stakeholder approach. Boston: Pitman.
Gratwick, K., Ghanadan, R. and Eberhard, A. (2006). Generating power and controversy: Understanding Tanzania’s independent power projects. Journal of Energy in Southern Africa 17(4): 39-56.
Gray, H.S. 2015. The political economy of grand corruption in Tanzania. African Affairs 114 (456): 1-22.
Gwang’ombe, F. (2004). Renewable Energy Technologies in Tanzania: Biomass Based Cogeneration. Nairobi: African Energy Policy Research Network.
Gwang’ombe, F and Mwihava, N. 2005.Renewables in Tanzania: Status and Prospects of Biomass-based Cogeneration and Geothermal Technologies; AFREPREN/FWD Occasional Paper No. 27. Nairobi: AFREPREN/FWD.
Hoogwijk, M., Faaij, A., Eickhout, B., de Vries, B., & Turkenburg, W. C. 2005. Potential of Biomass Energy out to 2100 for Four IPCC SRES Land-use Scenarios. Biomass and Bioenergy 29:225-257.
Ikulu. 2015. Jamhuri ya Muungano wa Tanzania .Tovuti Rasmi ya Rais Ofisi ya Rais – Ikulu. Retrieved from: http://www.ikulu.go.tz/index.php/media/speech/2043.
Innovation Energie Développement (iED) .2014. The National Electrification Program Prospectus. Franchville: Innovation Energie Développement.
International Energy Agency (IEA). 2009. Bioenergy e a Sustainable and Reliable Energy Source. A Review of Status and Prospects. IEA Bioenergy Executive Committee, Paris. International Energy Agency.
International Energy Agency (IEA). 2011. World Energy Outlook. Paris: International Energy Agency.
International Energy Agency (IEA). 2013. Medium-term Renewable Energy Market Report 2013. Paris: International Energy Agency.
International Energy Agency (IEA). 2014. Africa Energy Outlook; A focus of energy prospects in Sub-Saharan Africa. World Energy Outlook Special Report. Paris: International Energy Agency.
International Energy Agency (IEA). 2016 (January 15). Energy access database. Retrieved from: http://www.worldenergyoutlook.org/resources/energydevelopment/energyaccessdatabase/.
International Growth Centre (IGC). 2012. Attaining Middle Income Status. Tanzania: Growth and Structural Transformation Required to Reach Middle Income Status by 2025. London: International Growth Centre.
International Institute for Sustainable Development (iisd). 2014. A Financially Sustainable Power Sector: Developing assessment methodologies. Manitoba: International Institute for Sustainable Development.

82
International Renewable Energy Agency (IRENA). 2015. Africa 2030: Roadmap for a Renewable Energy Future. Abu Dhabi: International Renewable Energy Agency.
Katani Ltd. 2014a. Profile. Retrieved from: http://www.katanitz.com/index.php?page=profile.
Katani Ltd.2014b. Sisal farming [Sisal, SISO scheme, Best practices]. Retrieved from: http://www.katanitz.com/index.php?page=sisalfarming.
Katani Ltd. 2014c. Mkonge Energy Systems Limited (MeS). Retreived from: http://www.katanitz.com/index.php?page=mes.
Karlberg, L., Holger H., Flores-López, F., Goetz, A. and Matuschke, I. 2015. Tackling Biomass Scarcity—from Vicious to Virtuous Cycles in Sub-Saharan Africa. Current Opinion in Environmental Sustainability 15: 1–8.
Khatiwada, D., Leduc, S., Silveira, S. and McCallum, I. 2016. Optimizing Ethanol and Bioelectricity Production in Sugarcane Biorefineries in Brazil. Renewable Energy 85: 371–386.
Landell-Mills, P., Williams, G. and Duncan, A. 2007. Policy Practice Brief 1: Tackling the Political Barriers to Development: The New Political Economy Perspective.
Lofchie, M.F. (2014). The Political Economy of Tanzania: Decline and Recovery. Pennsylvania: University of Pennsylvania Press.
Moncrieffe, J. and Luttrell, C. 2005. An Analytical Framework for Understanding the Political Economy of Sectors and Policy Arenas. ODI, London.
McCormick, K. 2007. Advancing Bioenergy in Europe : Exploring Bioenergy Systems and Socio-
Political Issues. IIIEE Dissertations: 2007:2. Lund : Lund University, 2007 (Lund : KFS).
Millenium Challenge Corporation (MCC). 2016. Tanzania Compact. Retrieved from: https://www.mcc.gov/where-we-work/program/tanzania-compact.
Ministry of Agriculture, Food Security and Cooperatives (MAFC). 2015. Annual Report for Financial Year 2014/15. Dar es Salaam: Ministry of Agriculture, Food Security and Cooperatives.
Ministry of Energy and Minerals (MEM). 2011. Joint Energy Sector Review for 2010/2011. Dar es Salaam: Ministry of Energy and Minerals.
Ministry of energy and minerals (MEM). 2013a. Power System Master Plan: 2012 Update. Dar es Salaam: Ministry of Energy and Minerals.
Ministry of energy and minerals (MEM). 2013b. Scaling Up Renewable Energy Programme- Investment Plan for Tanzania. Dar es Salaam: Ministry of Energy and Minerals.
Ministry of energy and minerals (MEM).2014. Electricity Supply Industry Reform Strategy and Roadmap 2014 – 2025. Dar es Salaam: Ministry of Energy and Minerals.

83
Ministry of energy and minerals (MEM).2015.Tanzania’s SE4ALL Action Agenda. Dar es Salaam: Ministry of Energy and Minerals.
Ministry of energy and minerals (MEM). 2016. Energy sector: the energy sector overview. Retrieved from: https://mem.go.tz/energy-sector/.
Mitchell, R.K., Agle, B.R., and Wood D. J. 1997. Toward a theory of stakeholder identification and salience: defining the principle of who and what really counts. Academy of Management Review 22(4): 853–886.
Moner-Girona, M., Ghanadan, R., Solano-Peralta, M., Kougias, I., Bódis, K., Huld, T., and Szabó, S. 2016. Adaptation of Feed-in Tariff for remote mini-grids: Tanzania as an illustrative case. Renewable And Sustainable Energy Reviews 53:306-318.
Mshandete, A.M., Kibazohi, O. and Kivaisi, A.K. 2013. Tanzania Sisal Industry: Auditing and Characterization of Sisal Post-Harvest Wastes as a Bio-Resource for Bio- Refining. International Journal of Pure Applied Sciences and Technology 14(2): 84-94.
National Bureau of Statistics (NBS) 2015. Tanzania in Figures 2014. Dar es Salaam: National Bureau of Statistics.
Ngasongwa, J. 1992. Tanzania Introduces a Multi-Party System. Sheffield: TROAPE Publications Ltd.
Ostrom, E., Gibson, C., Shivakumar, S., and Andersson, K. 2002. Aid, incentives, and sustainability: an institutional analysis of development cooperation. Stockholm: Sida.
Overseas Development Institute (ODI). 2011. Analysing the Governance and Political Economy of Water and Sanitation Service Delivery. London: Oversees Development Institute.
Overseas Development Institute (ODI). 2013a. Applied political economy analysis: A problem-driven framework. London. Overseas Development Institute.
Overseas Development Institute (ODI). 2013b. The political economy of electricity distribution in developing countries. London. Overseas Development Institute.
Overseas Development Institute (ODI). 2014. East African prospects: An update of the political-economy of Kenya, Rwanda, Tanzania and Uganda. London. Overseas Delopment Institute.
Patton, M.Q. 1999. Enhancing the quality and credibility of qualitative analysis. Health Services Research 34 (5):1189-1208.
Pode, R. 2016. Potential applications of rice husk ash waste from rice husk biomass power plant. Renewable and Sustainable Energy Reviews 53:1468–1485.
President’s Delivery Bureau (PDB). 2013a. Agriculture; Agriculture NKRA Oveview. Retrieved from: http://www.pdb.go.tz/agriculture.html.

84
President’s Delivery Bureau (PDB).2013b. Energy; Energy NKRA Overview. Retrieved from: http://pdb.go.tz/energy.html.
Prime Minister’s Office Regional Administration and Local Government (PMORALG) .2014. Tanzania Mainland. Retrieved from: http://aadb.pmoralg.go.tz/regions.php.
Radobank. 2013. Rabobank Industry Note #386, Tanzania Sugar, Foreign Investors Need Enabling Environment: Utrecht: Radobank.
Rural Energy Agency (REA). 2016. About REA. Retrived from: http://rea.go.tz.dnnmax.com/AboutUs/AboutREA/tabid/144/Default.aspx.
REDD Desk. 2016. National Vision 2025 (Tanzania). Retrieved from: http://theredddesk.org/countries/plans/national-vision-2025-tanzania.
Swedish International Development Cooperation Agency (SIDA).2014. Renewable energy helps rural development. Retrieved from: http://www.sida.se/English/where-we-work/Africa/Tanzania/examples-of-results/Renewable-energy-helps-rural-development/.
Smithers, J. 2014. Review of sugarcane trash recovery systems for energy cogeneration in South Africa. Renewable and Sustainable Energy Reviews 32: 915–925.
Sokona, Y. Mulugetta, Y. and Gujba, H. 2010. Widening energy access in Africa: towards energy transition. Energy Policy 47 (1): 3-10.
Sugar Board of Tanzania (SBT). 2014. Factories. Retrieved from: http://www.sbt.go.tz/index.php/factories.
Sutton, J. and Olomi, D. 2012. An enterprise map of Tanzania (Vol. 3). London: International Growth Centre in association with the London Publishing Partnership.
Sustainable Energy for All (SE4ALL). 2016. January 2016. Retrieved from: http://www.se4all.org/.
Tanzania Electric Supply Company Limited (TANESCO). 2014. Corporate Business Plan 2015. Dar es Salaam. Tanzania Electric Supply Company Limited.
Tanzania Geothermal Development Company Ltd (TGDC).2014. Geothermal Development in Tanzania –Status Report. Dar es Salaam: Tanzania Geothermal Development Company.
Tanzania Government Portal. 2013. Documents. Retrieved from: http://www.egov.go.tz/documents/.
Tanzania Investment Centre (TIC). 2014. Tanzania Investment Guide 2014-15. Dar es Salaam: Tanzania Investment Centre.
Tanzania Traditional Energy Development Organization (TaTEDO). 2012. TaTEDO Profile. Retrieved from: http://www.youfly.co.tz/tatedo/aboutus.php?p=641.

85
Tanzania Sisal Board (TSB).2013. General sisal statistics. Retrieved from: http://www.tsbtz.org/index.php/sisal-statistics.
Terrapon-Pfaff, J.C. 2012. Linking energy- and land-use systems: energy potentials and environmental risks of using agricultural residues in Tanzania. Sustainability 4:278-293.
Terrapon-Pfaff, J., Fischedick, M. and Monheim H. 2012. Energy potentials and sustainability—the case of sisal residues in Tanzania. Energy for Sustainable Development 16 (3): 312–319.
The Royal Institute of International Affairs. 2016. Politics and Development in Tanzania: Shifting the Status Quo. London: The Royal Institute of International Affairs.
Thrän, D., Seidenberger, T., Zeddies, J. and Offermann, R. 2010. Global biomass potentials: resources, drivers and scenario results. Energy for Sustainable Development 14(3):200-205.
United Nations (UN). 2016. Sustainable Development Goals. January 2016. Retrieved from: https://sustainabledevelopment.un.org/?menu=1300.
United Nations Development Programme (UNDP). 2000. World Energy Assessment; Energy and the Challenges of Sustainability. New York: United Nations Development Programme.
United Nations Development Programme. (UNDP). 2015. Tanzania Human Development Report 2014: Economic Transformation for Human Development. Dar es Salaam: United Nations Development Programme.
United Nations Economic Commission for Africa (UNECA). 2006. Sustainable energy: a framework for new and renewable energy in Southern Africa. Addis Ababa: United National Economic Commission for Africa.
United Nations Environment Programme (UNEP). 2015. Developing Effective Off-Grid Lighting Policy – Guidance note for governments in Africa. Nairobi: United Nations Environment Programme
United Nations Foundation. 2013. Achieving universal energy access. Retrieved from: http://www.unfoundation.org/what-we-do/issues/energy-and-climate/clean-energy-development.html?referrer=https://www.google.com/.
United Nations Industrial Development Organization (UNIDO). 2011. Agribusiness for Africa’s prosperity. Vienna: United Nations Industrial Development Organization.
United Nations (UN). 2015. World Population Prospects: The 2015 Revision. New York: United Nations.
United Republic of Tanzania (URT). 1999. Tanzania Development Vision 2025 Dar es Salaam: Planning Commision.
United Republic of Tanzania (URT). 2010. National Strategy for Growth and Reduction of Poverty II, NSGRP II. Dar es Salaam. Ministry of Finance and Economic Affairs.

86
United Republic of Tanzania (URT). 2012. The Long-Term Perspective Plan 2011/12-2025/26 Dar es Salaam: President’ Office Planning Commission.
University College London (UCL). 2016. Agro-industries and Clean Energy in Africa (AGRICEN). Retrieved from: https://www.ucl.ac.uk/steapp/research/projects/agricen.
United Republic of Tanzania (URT). 2013. The National Natural Gas Policy of Tanzania 2013. Dar es Salaam.
Vice President’s Office (VPO). 2010. The Environment Division. Retrieved from: http://www.vpo.go.tz/environment/utawala.php.
World Bank. 2008. The Political Economy of Policy Reform: Issues and Implications for Policy Dialogue and Development Operations. Washington D.C.: World Bank.
World Bank. 2014. From the Bottom Up: How Small Power Producers and Mini-Grids Can Deliver Electrification and Renewable Energy in Africa. Washington D.C.: World Bank.
World Bank. 2016. Independent Power Projects in Sub-Saharan Africa; Lessons from Five Key Countries. Washington D.C.: World Bank.
World Future Council (WFC). 2012. Powering Africa through feed-in tariffs; advancing renewable energy to meet the continents electricity needs. Hamburg: World Future Council.
World Wildlife Fund (WWF). 2016. Looking at challenges to Sustainable Energy for All Action Agenda in Tanzania. Retrieved from: http://wwf.panda.org/wwf_news/?256870/Looking-at-challenges-to-Sustainable-Energy-for-All-Action-Agenda-in-Tanzania.

87
APPENDIX A: INTERVIEWEES
Informal interviews/discussions
Greyson Kakigwa, 23 March 2016, Tanganyika Plantations Corporation (TPC)
Ian Shanghvi, 18 March 2016, Economic and Social Research Foundation (ESRF)
Email Correspondance
Dr. Hoseana Lunogelo, 30 March 2016, Former Executive Director ESRF.
Dr. Julia Terrapon-Pfaff, 10 March 2016, Wuppertal Institute for Climate, Environment and
Energy.
Engineer Matthew Joseph Matimbwi, 15 March 2016, Tanzania Renewable Energy
Association (TAREA).
Roselyne Mariki, 16 March 2016, Green Resources Ltd (Sao Hill Estate).
Yunus Mssika, 2 May 2016, Tanzania Sisal Board (TSB).
Jem Riggall, 4 April 2016, Ngombeni Power Ltd.
SBT
MEM EWURA Policy Direction
TANESCO REA
VPO Environment Division
MAFC
Agro-industries
Sugar
Sisal
Rice
NGO’s
SBT

88
FORMAL SEMI-STRUCTURED INTERVIEWS
Stakeholder Group Institution/Company Name Individual
or Group
Date of
Interview
(2016)
Centralized Electrification
Approach (Traditional)
entities :National Government
Entities
Ministry of Energy and Minerals (MEM) 2 11 April
Tanzania National Electric Supply
Company (TANESCO)
1 25 and 28
April
Rural Energy Agency (REA) 2 5 April
Government Environment
Entity
Vice President’s Office (VPO);
Environment Assessment Section
1 20 April
Multi-Sectoral Regulatory
Authority
Energy and Water Utilities Regulatory
Authority (EWURA)
2 20 April
Industry Regulatory Authorities Sugar Board of Tanzania (SBT) 1 12 April
Industry Actors- (sugar, sisal and
rice)
(grid connected and isolated grid
systems)
Tanganyika Plantations Corporation
(TPC)
2 23 March
Agro EcoEnergy Ltd 1 28 April
Mkonge Energy Systems (MES) 1 18 April
Husk Power Systems (HPS) 1 20 April
NGO Tanzania Traditional Energy Development
Organization (TaTEDO)
1 25 April
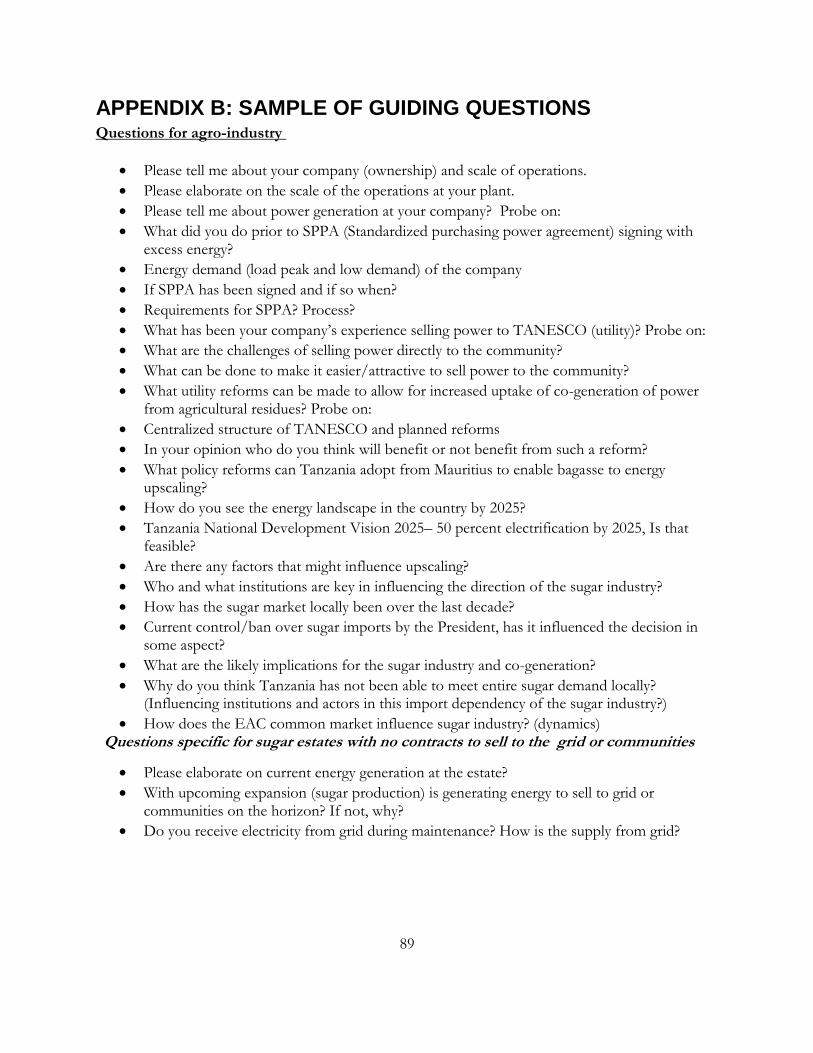
89
APPENDIX B: SAMPLE OF GUIDING QUESTIONS Questions for agro-industry
Please tell me about your company (ownership) and scale of operations.
Please elaborate on the scale of the operations at your plant.
Please tell me about power generation at your company? Probe on:
What did you do prior to SPPA (Standardized purchasing power agreement) signing with excess energy?
Energy demand (load peak and low demand) of the company
If SPPA has been signed and if so when?
Requirements for SPPA? Process?
What has been your company’s experience selling power to TANESCO (utility)? Probe on:
What are the challenges of selling power directly to the community?
What can be done to make it easier/attractive to sell power to the community?
What utility reforms can be made to allow for increased uptake of co-generation of power from agricultural residues? Probe on:
Centralized structure of TANESCO and planned reforms
In your opinion who do you think will benefit or not benefit from such a reform?
What policy reforms can Tanzania adopt from Mauritius to enable bagasse to energy upscaling?
How do you see the energy landscape in the country by 2025?
Tanzania National Development Vision 2025– 50 percent electrification by 2025, Is that feasible?
Are there any factors that might influence upscaling?
Who and what institutions are key in influencing the direction of the sugar industry?
How has the sugar market locally been over the last decade?
Current control/ban over sugar imports by the President, has it influenced the decision in some aspect?
What are the likely implications for the sugar industry and co-generation?
Why do you think Tanzania has not been able to meet entire sugar demand locally? (Influencing institutions and actors in this import dependency of the sugar industry?)
How does the EAC common market influence sugar industry? (dynamics) Questions specific for sugar estates with no contracts to sell to the grid or communities
Please elaborate on current energy generation at the estate?
With upcoming expansion (sugar production) is generating energy to sell to grid or communities on the horizon? If not, why?
Do you receive electricity from grid during maintenance? How is the supply from grid?

90
Questions for REA
How did rural electrification look like prior to REA in 2007?
What incentives brought about formation of REA?
How many off-grid projects under REA?
Key challenges for REA operations?
Any co-generation from SMEs in the agro-industrial sectors selling directly to communities?
Who owns existing co-generation projects? Local or foreign private investors?
How feasibly is selling power directly to communities from existing agro processing activities (sugar, sisal, rice?)
What are the cost implications to selling directly to local communities’ vs selling to grid?
Why is co-generation not picking up as quickly in agro-industrial sector with such huge biomass raw material?
Are there any country wide factors or sectors factors that might influence upscaling of co-generation?
How sustainable has funding for your operations been over the years? Probe on:
Seeing you are funded by development partners and GoT, how has recent MCC fund withdraw affect operations?
How sustainable is funding from development partners?
Is funding determined annually through Government budget for the sector as a whole or is it split between rural and urban from the get-go?
Who are these development partners?
Progress of applying for funding and getting additional funding, criteria?
Who within REA then determines which projects to fund? Is the Ministry involved at all? How autonomous is REA in funding decisions?
How has TANESCO performance been so far? Probe:
How do you think TANESCOs centralized role is influencing service delivery?
Future reforms of TANESCO (vertical unbundling), how will they impact REAs operations? Does REA remain autonomous?
Has there been any resistance to the planned reforms?
Do you think this reform is likely to take place by 2050?
Newly announced competitive bidding for solar and wind, is that likely to be the case for all other renewables between 1- 10MW in the future?
How do you see the energy landscape in the country by 2025? (Renewable? Gas?)
To what extend are decentralized (mini-grid and off grid) solutions likely to come in the future? Push & pull factors?
Are the Tanzania National Development Vision 2025 electrification and generation targets realistic?
To what extent do you think co-generation will contribute to the achievement of the targets over the next remaining 9 years to 2025?
Are there renewable energy targets within the 2015 ‘Scaling up Renewable Energy Programme document realistic? : Are we anywhere close to this said 14 percent in terms of

91
renewables? To what extend is renewable uptake a priority of REA and/or Ministry of Energy? What is the status of SREP?
Questions for EWURA
How is EWURA funded?
Specific responsibilities
How many SPPA signed so far?
Is there room in the future with TANESCO reforms for investors to sell directly to consumers in the future or is this going to remain under REA? (as is they sell to main grid or isolated grids – belonging to TANESCO?)
Challenges so far? Key bottlenecks?
What percentage of the existing SPPA signed by local investors and what proportion is foreign private investors? Is there an attempt to establish a balance between local and foreign private investors?
Avoided cost tariff vs competitive biddings- key issues with both?
Incentives for competitive bidding approach for wind and solar? Is this going to be the case for others?
How many applications did you get upon starting this SPPA? Incentives behind this. Any issues with existing contracts or is this working?
What is the status with Kilombero sugar estate? (Does it supply power to the grid and vice versa during maintenance of plant?
How do you see the energy landscape in the country by 2025? (Renewable? Gas?)
To what extend are decentralized (mini-grid and off grid) solutions likely to come in the future? Push & pull factors?
Are the Tanzania National Development Vision 2025 electrification and generation targets realistic?
To what extent do you think co-generation will contribute to the achievement of the targets over the next remaining 9 years to 2025?
Questions for MEM
The target for renewables for 2015 according to the ‘SREP 2013’ investment plan design:Are we anywhere close to this said 14 percent in terms of renewables minus hydro? Is it a typo?
What actions/reforms is MEM taking to facilitate private sector investment in the renewables?
How are funds allocated to projects within the ministry (renewables, non-renewables? Rural?) or is this determined by MOF directly?
How do you see the energy landscape in the country by 2025? Will gas play a bigger role with new discoveries?
Tanzania National Development Vision 2025 targets? How realistic are they?
Is this access to electricity or connectivity per household and how do you determine this?
To what extent do you think renewables will contribute to the achievement of the targets over the next remaining years to 2025?

92
Why is co-generation not picking up as quickly in agro-industrial sector with such huge biomass raw material? Are there any country wide factors or sectors factors that might influence upscaling of co-generation?
Lack of incentive to develop mini-grid projects due to uncertainty of when the grid expansion reaches the project area; to what extent does this influence investment by private sector in mini-grids?
How is uncertainty of grid extension impacting future investment? Does TANESCO reform involve mapping out areas where the grid won’t make it?
TANESCO retirement of EPP, progress? And how is this done? Wait out contracts to end or pay outs?
MEM responsibility to review Electricity Act- amendments sent to Parliament? Progress?
So supply side based, how is progress on demand side management (energy efficiency) as part of reform?
Any foreseeable challenges in separation of G from D and Transmission? Questions for VPO: Environment Division
Agricultural sector evolution over time (key reforms in sector historically?) Key constraints to sector industrialization?
Declining % of GDP but still employing largest number of people? Why?
Are there any country wide factors or sectors specific factors (agriculture) that act as disincentives for upscaling of co-generation?
Sugar sector seems to be increasing production with TPC expanding by 11% production in 2017 (95000-110,000 tonnes) and Kagera (60000- 120000 tonnes over next three years). Sisal production to double to 100,000 tons (10 year plan since 2012) from current 40000 tons in 2015- Why is direct sale of electricity to communities not anywhere in the picture? Why are there no other major estates?
To what extent is low carbon development a priority? Progress so far with climate smart agriculture taskforce?
To what extent are people aware of CC impacts on agriculture?
Adaptation and mitigation initiatives so far?
SREP programme –targets? Link to SE4ALL Action Agenda?
How aligned is SE4ALL to TDV 2025? SE4All involvement –Progress? COP participation?
Biomass co-generation targets in developed Action Agenda (35 MW 2012 base year to only 67 MW 2030). Why slow uptake?
Questions for Sugar Board of Tanzania
Role of sugar board? Do all producers report on a regular to board? Structure?
Relation to Ministry of Agriculture? How is the Ministry engaged?
Current sugar at large scale and small scale producers? Ownership? Private or Public?
Do they all generate own energy? From baggase fired power stations? Other than TPC, who else has a contract for selling power to grid? Kilombero 2MW under discussion? Do they need consent from board to expand to selling to grid?
Does the grid reach these places at all? How big or fluctuating is there powerload?
Production figures 2010-2015 for Kilombero, Kagera, Mthibwa and TPC?

93
Price variations over the years
Current change to 1800 tshs? What is this based on? Cost of production?
Sector performance over the years. Kagera expansion? TPC expansion?
Sugar sector is growing with TPC expanding by 11% production in 2017 (95000-110,000 tonnes) and Kagera (60000- 120000 tonnes over next three years). Why is direct sale of electricity to communities not anywhere in the picture? Or in Kagera’s case sale to communities?
Common East African market mechanism, how does that come into play?
Eco Energy Sugar Project in Bagamoyo? Why did that not take off?
Key Challenges with sugar growth? Why can’t we cater to demand domestically 100%?
Why has generation of electricity from sugar estates not taken place at a much bigger and faster pace? The technology is well known (Mauritius, Nepal, India)?
How much do we export if any? Latest accurate figure for imports?
Current importation reinforcement by Magufuli. Ban or Control? Media distortions. Who issues special importation license?
Questions for TANESCO
How is the utility structure of operations?
How is the current status of G, T, D?
Renewable energy investment plans?
Existing electricity generation from agro-industrial sector and supply to grid or communities
What cost implications are there for the investor wanting to supply to the grid?
Any future interest for further investment in energy generation from agro-industries?
Status of Bagamoyo Eco-energy project? Kilombero Sugar Estate, SPPA contract?
Elaborate on reforms? Reasons behind planned reforms (vertical unbundling)?
Reforms and phasing out of Emergency Power Producers, How?
How is the utility funded?
To what extent is the sub-sector currently subsidized? Reforms and influence on subsidies?
Any private sector involvement in reform process?
With the establishment of SPPA, do you see more investment in co-generation?
What other factors might be acting as disincentives for upscaling of co-generation from agro-industry? What can be done to enable upscaling?
Set 2025 TDV targets for generation, how realistic are these targets?
To what extend do you see renewables playing a role in rural electrification?
Is the utility considering setting clear plans on what areas the national grid will get to and those where the grid wont in rural areas?

94
APPENDIX C: BIOENERGY PATHWAYS (Source: Modified from McCormick 2007)
BIOMASS RESOURCES
Woody biomass
-Forestry residues
-Trees shrubs, bushes
-Energy crops (such as
willow and eucalyptus)
Non-woody biomass
-Agricultural residues
-Energy crops (Such as
sugarcane, maize,
rapeseed, sunflower)
Processed waste
-Municipal solid waste
- Used frying oil (UFO)
-Animal waste, sewage
sludge
Processed fuel
- Pellets, briquettes, woodchips - Charcoal
-Producer gas, bio-oil,
bio-gas, bio-ethanol,
bio-diesel
HEAT
AND ELECTRICITY
FUEL
FOR TRANSPORT
CONVERSION TECHNOLOGIES
Thermochemical conversion
-Combustion (heat)
-Gasification (producer gas)
-Pyrolysis (bio-oil)
Biochemical conversion
-Digestion (bio-gas)
-Fermentation distillation
(bio-ethanol)
Mechanical Conversion
-Extraction Esterification (bio-
diesel).

95
APPENDIX D: APPLIED PEA FRAMEWORK 1) Problem identification
Define the problem on which to focus your work.
2) Diagnosis This part of the analysis attempts to identify and analyse the features of the political economy that generate and contribute to the persistence of the problem. It has three interlinked components: (2a) analysis of systemic factors; (2b) analysis of actors and their decision-logics, their motivations and the power they have to pursue their goals; and (2c) analysis of dynamism, complexity and uncertainty.
2a) Systemic factors: Understanding features of the context relevant to the problem What economy- and society-wide factors need to be taken into account to understand the problem? Focus in particular on
deep-seated foundational factors that are hard to change within the country or in the short/medium term; and
formal and informal institutions (political, economic and social) – or the Rules of the Game What are the formal rules and laws bearing on the problem under question? To what extent are they adhered to and enforced? How does the system of political competition affect the problem? What are the informal rules bearing on the problem under study?
2b) Actors, power relations and decision-logics – This component of the analysis begins with a simple mapping of stakeholders and the networks and power relations that exist between the interest groups that are relevant to the problem. Then it looks more closely at the motivations of key individuals and organisations with a view to a better understanding of the scope for or resistance to relevant change. Who are the main interest groups? How and why do they act under present conditions? What are the relationships among interest groups? Are there relevant analytical concepts that provide some insight into actors’ motivations or decision logics, and hence the potential for change?
2c) Dynamism, complexity and uncertainty – The purpose of this component of the analysis is to acknowledge and identify potential sources of dynamism in the systemic features and decision logics described above and to provide a qualification on the firmness of the predictions that can be made on the basis of the ‘hard’ PE analysis. What elements of dynamism, actual or potential, are present in the context? Are we dealing here with a complex change process in which there is significant uncertainty?
3) Prognosis On the basis of the above analysis in Part 2, this section attempts to assess the potential for change, and to identify likely sources and pathways of change. Note that some analysts use the term ‘theories of change.’ The importance of this step is to make the link between the analysis (Part 2) and possible interventions (Part 4).
3a) What are the likely sources and pathways of change? Identify likely or feasible change processes arising from a combination of collective action, socio-economic trends and institutional change. Consider how change may happen over time, where first-round changes may create new possibilities that did not initially exist.
3b) What is the overall likelihood of change? On the basis of the above, identify scenarios for future change, and make judgements on the relative probability of these alternatives under varying conditions.

96
4) Interventions – How can particular actors help to shift the pattern of incentives in a manner that promotes change?
4a) Entry points for action What are the most promising entry points for action on the part of key actors (e.g. international agencies)?
4b) Recommendations What specific operational recommendations arise from the analysis?

97
APPENDIX E: MAP OF TANZANIA
(Source: National Bureau of Statistics 2015)
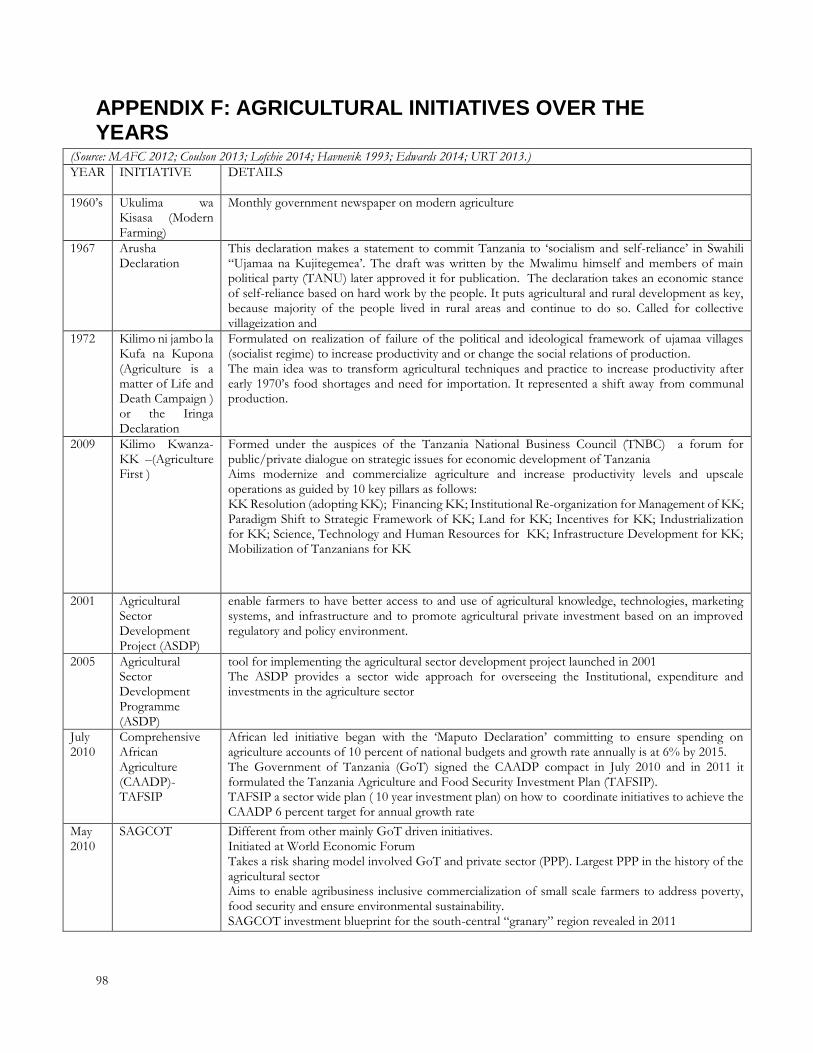
98
APPENDIX F: AGRICULTURAL INITIATIVES OVER THE YEARS
(Source: MAFC 2012; Coulson 2013; Lofchie 2014; Havnevik 1993; Edwards 2014; URT 2013.)
YEAR INITIATIVE DETAILS
1960’s Ukulima wa Kisasa (Modern Farming)
Monthly government newspaper on modern agriculture
1967 Arusha Declaration
This declaration makes a statement to commit Tanzania to ‘socialism and self-reliance’ in Swahili “Ujamaa na Kujitegemea’. The draft was written by the Mwalimu himself and members of main political party (TANU) later approved it for publication. The declaration takes an economic stance of self-reliance based on hard work by the people. It puts agricultural and rural development as key, because majority of the people lived in rural areas and continue to do so. Called for collective villageization and
1972 Kilimo ni jambo la Kufa na Kupona (Agriculture is a matter of Life and Death Campaign ) or the Iringa Declaration
Formulated on realization of failure of the political and ideological framework of ujamaa villages (socialist regime) to increase productivity and or change the social relations of production. The main idea was to transform agricultural techniques and practice to increase productivity after early 1970’s food shortages and need for importation. It represented a shift away from communal production.
2009 Kilimo Kwanza- KK –(Agriculture First )
Formed under the auspices of the Tanzania National Business Council (TNBC) a forum for public/private dialogue on strategic issues for economic development of Tanzania Aims modernize and commercialize agriculture and increase productivity levels and upscale operations as guided by 10 key pillars as follows: KK Resolution (adopting KK); Financing KK; Institutional Re-organization for Management of KK; Paradigm Shift to Strategic Framework of KK; Land for KK; Incentives for KK; Industrialization for KK; Science, Technology and Human Resources for KK; Infrastructure Development for KK; Mobilization of Tanzanians for KK
2001 Agricultural Sector Development Project (ASDP)
enable farmers to have better access to and use of agricultural knowledge, technologies, marketing systems, and infrastructure and to promote agricultural private investment based on an improved regulatory and policy environment.
2005 Agricultural Sector Development Programme (ASDP)
tool for implementing the agricultural sector development project launched in 2001 The ASDP provides a sector wide approach for overseeing the Institutional, expenditure and investments in the agriculture sector
July 2010
Comprehensive African Agriculture (CAADP)-TAFSIP
African led initiative began with the ‘Maputo Declaration’ committing to ensure spending on agriculture accounts of 10 percent of national budgets and growth rate annually is at 6% by 2015. The Government of Tanzania (GoT) signed the CAADP compact in July 2010 and in 2011 it formulated the Tanzania Agriculture and Food Security Investment Plan (TAFSIP). TAFSIP a sector wide plan ( 10 year investment plan) on how to coordinate initiatives to achieve the CAADP 6 percent target for annual growth rate
May 2010
SAGCOT Different from other mainly GoT driven initiatives. Initiated at World Economic Forum Takes a risk sharing model involved GoT and private sector (PPP). Largest PPP in the history of the agricultural sector Aims to enable agribusiness inclusive commercialization of small scale farmers to address poverty, food security and ensure environmental sustainability. SAGCOT investment blueprint for the south-central “granary” region revealed in 2011

99
APPENDIX G: GOT STRATEGIES, PLANS AND POLICIES YEAR STRATEGY/PLAN/ POLICY
Government
driven strategies
and plans and
policy
development
1999 Tanzania’s Development Vision (TDV) 2025
2010/11 -
2014/15
National Strategy for Growth and the Reduction of Poverty II - MKUKUTA II
Nov 2010
Guidelines for Sustainable Liquid Biofuels in Tanzania
June 2012 The Tanzania’s Long-term Perspective Plan (LTPP) 2011/12 – 2025/26
Five Year Development Plan
(2011/12 - 2015/16)
May 2013 Power Systems Master Plan (PSMP) 2012
UPDATE for 2016 currently being worked on
Nov 2012 MEM Strategic Plan from 2011/12-2015/16
2012/2013 Joint Energy Sector Review (JESR)
April 2013 Big Results Now Phase I (BRN) Initiative 2013-2016
May 2013 Scaling-up Renewable Energy Programme (SREP) – Investment Plan for Tanzania
Sept 2013 Energy Subsidy Policy
Oct 2013 The National Natural Gas Policy of Tanzania
April 2014 Biomass Energy Strategy (BEST) for Tanzania
June 2014 Electricity Supply Industry (ESI) Reform Strategy and Roadmap 2014-2025
July 2014 National Electrification Program Prospectus
July 2014 Preparation of National Energy Efficiency Program for Tanzania
Dec 2015 Tanzania’s Sustainable Energy for All (SE4ALL) Action Agenda
Dec 2015 Tanzania SE4ALL Investment Prospectus
Jan 2015 The Draft National Energy Policy
Coming up Rural Electrification Master Plan (REMP)
Private Sector
Led
Dec 2008 Tanzania Domestic Biogas Programme (TDBP)
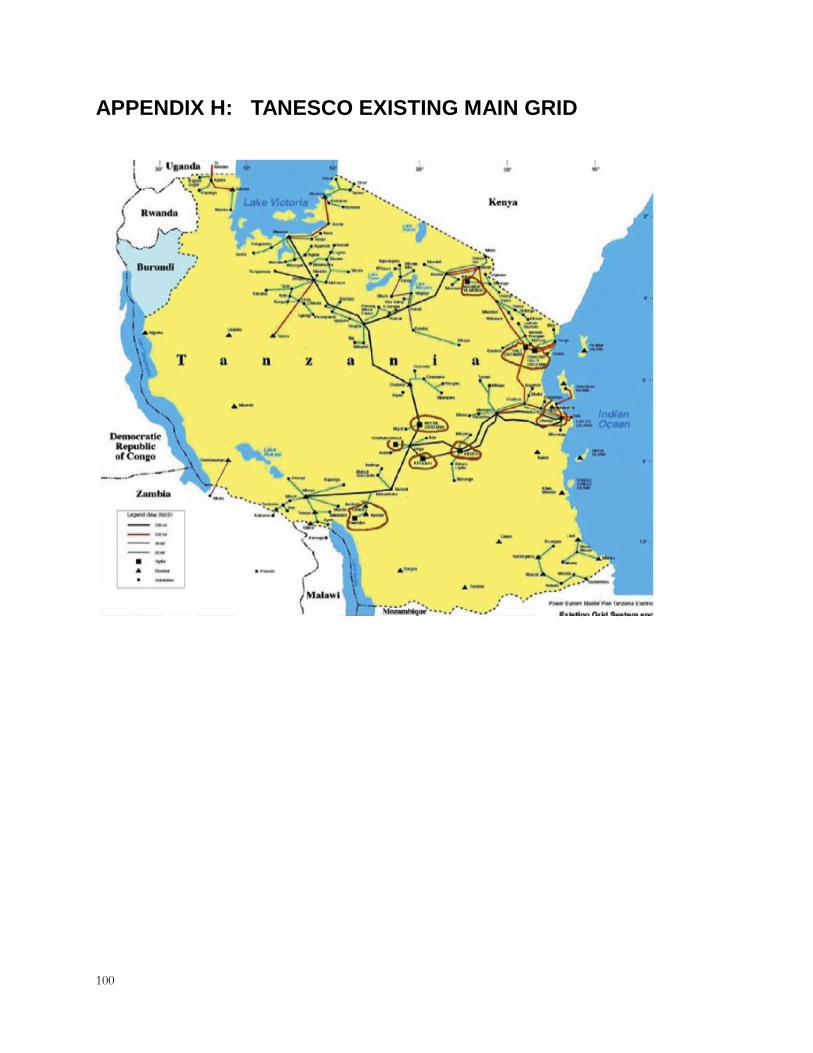
100
APPENDIX H: TANESCO EXISTING MAIN GRID

101
Isolated Power Stations under TANESCO (Source: TANESCO 2015).
S/N Station No. of Units
Unit Capacity (kW)
Capacity (kW)
1 BIHARAMULO 2 424 848
2 BUKOBA 4 640 2,560
3 KASULU 2 1,250 2,500
4 KIBONDO 2 1,250 2,500
5 KIGOMA 5 2 4 3
1,250 1,000 640 500
12,310
6 LIWALE 2 424 848
7 LOLIONDO 4 1,250 5,000
8 LUDEWA 2 1
510 250
1,270
9 MAFIA 2 2
660 640
2,600
10 MBINGA 2 1,000 2,000
11 MPANDA 2 2
660 640
2,600
12 NAMTUMBO 1 340 340
13 NGARA 2 476 952
14 SONGEA 2 1 1 3
1,800 1,915 660 640
8,095
15 SUMBAWANGA 4 1,250 5,000
16 TUNDURU 2 2
640 350
1,980
17 SOMANGA 3 2,500 7,500
18 MTWARA 9 2,000 18,000
TOTAL 76,431

102
APPENDIX I: 2015 AND 2016 TARIFF STRUCTURE GOVERNMENT NOTICE No. ………….. PUBLISHED ON …………
THE ELECTRICITY ACT,
(CAP.131)
ORDER
(Made under Section 23)
________
THE ELECTRICITY (STANDARDIZED SMALL POWER PROJECTS TARIFF) ORDER, 2016
citation 1. This Order may be cited as the Electricity (Standardized Small Power Projects Tariff) Order, 2016.
Commencement 2. This Order shall take effect from 1st April 2016.
Interpretation 3. In this Order unless the context otherwise requires:
“competitive bidding process” means the competitive method to procure power projects above 1 MW and up to 10 MW using wind and solar technologies that shall be prescribed in the Electricity (Development of Small Power Projects) Rules 2016;
“Isolated Mini-Grid” means an electricity transmission and distribution network physically isolated from the Main-Grid;
“Main Grid” means the interconnected electricity transmission network of Mainland Tanzania, to which the largest cumulative capacity of electricity generating facilities are connected; and
“Small Power Producer” (“SPP”) means an entity generating electricity in the capacity between one hundred kW up to ten MW using renewable energy, fossil fuels, a cogeneration technology, or some hybrid system combining fuel sources mentioned above and either sells the generated power at wholesale to a DNO or at retail directly to a customer or customers. An SPP may have an installed capacity greater than ten MW but shall only export power at the interconnection point not exceeding ten MW.
Approved tariffs 4. – (1) The Standardized Small Power Purchase Tariff for hydro and biomass projects of up to 10MW which are connected to the Main Grid and Isolated Mini-Grid shall be as shown in the First Schedule.
(2) The Standardized Small Power Purchase Tariff for solar and wind projects of up to 1MW, connecting to the Main Grid and Isolated Mini-Grid is as shown in the Second Schedule.
(3) The Standardised Small Power Purchase Tariff for SPPs that may opt, in terms of Rule 39 of the Electricity (Development of Small Power Projects) Rules 2016 to continue using the year 2008 avoided cost tariff setting methodology, shall be as shown in the Third and Fourth Schedules.
(4) Tariffs for solar and wind projects, of above 1MW and up to 10MW, connecting to the Main Grid and Isolated Mini-Grid will be determined through a competitive bidding process.

103
Revocation 5. This Order revokes the Electricity (Standardized Small Power Projects Tariff for Year 2015), Order Number 015-025.
FIRST SCHEDULE
Standardized Small Power Projects Tariff for Hydro and Biomass SPPs
Minihydro Power Plant Biomass Power Plant
Size (up to) Approved Tariff (US$/kWh) Size (up to) Approved Tariff (US$/kWh)
100kW 0.155
150kW 0.146 200kW 0.179
200kW 0.141 300kW 0.169
250kW 0.140 400kW 0.161
500kW 0.134 500kW 0.157
750kW 0.129 750kW 0.149
1MW 0.123 1MW 0.147
2MW 0.115 2MW 0.138
3MW 0.108 3MW 0.128
4MW 0.102 4MW 0.126
5MW 0.098 5MW 0.123
6MW 0.095 6MW 0.120
7MW 0.091 7MW 0.118
8MW 0.088 8MW 0.118
9MW 0.084 9MW 0.117
10MW 0.081 10MW 0.117

104
SECOND SCHEDULE
Main Grid and Isolated Mini Grid Connected Tariff for Solar and Wind SPPs up to 1MW
Description Approved Tariff
(US$/kWh)
Standardized Small Power Purchase Tariff for Solar and Wind projects
of up to 1MW connected to the Main Grid 0.165
Standardized Small Power Purchase Tariff for Solar and Wind projects
of up to 1MW connected to the Mini Grid 0.181
THIRD SCHEDULE
Main Grid Connected Tariff Using Avoided Cost Principle
Description
2015 Tariff
(TZS/kWh)
2016 Approved
Tariff
(TZS/kWh)
Percentage
Change
Standardized Small Power Purchase Tariff 190.94 190.46 -0.25%
Seasonally adjusted
Standardized SPPT
Payable in
Dry season 229.13 228.58 -0.25%
Wet season 171.85 171.42 -0.25%
FOURTH SCHEDULE
Isolated Mini Grid Connected Tariff Using Avoided Cost Principle
Description 2015 Tariff
(TZS/kWh)
2016 Approved Tariff
(TZS/kWh)
Percentage
Change
Standardized SPP Tariff 490.39 477.16 -3.40%
................................., 2016. ..... ..............................
Felix Ngamlagosi
Director General

105
APPENDIX J: PLANTATION PARAMETERS AND PRODUCTION DATA
Key Parameters for four main Sugar Plantations in Tanzania (Source: Adopted from
Rabobank 2013) KSE TPC MTIBWA KSL
Majority owners Ilovo Terreos/Clei group
Superdoll Superdoll
Region Morogoro Kilimanjaro Morogoro Kagera
Distance to port (km
350 450 250 1500
Outgrower cane (ha)
12000 No outgrowers Not known (high potential)
4082
Mill capacity (TCM0
245 150 150 120
Future plans Expansion from current 95,000 tonnes to 110000 tonnes by 2017
Increase production
Consolidation Expansion from 60000 tonnes to 120000 tonnes by 2018
Challenges Increase output Water availability (spend a lot of energy on irrigation)
Power supply Zero growers
Sugar production 2015 (metric tons)
125374 99373 23724 55536

106
Sugar Production in Tanzania (2000/01-2014/15) (A. Mwankemwa, personal communication, 12 April 2016).

107
APPENDIX K: SISAL VALUE CHAIN, COMPANIES AND PRODUCTION DATA
Sisal Value Chain (Source: TSB 2013)
Existing Sisal Companies and Estates in Tanzania (Y. Mssika, personal
communication, 2 May 2016)
S/No COMPANY/ESTATE
1 AFRICAN FIBRES (T) lTD
Pangawe Estate
Ubena Estate
2 AGROTANGA ENT.
Muheza/Kitisa Estate
3 AMBONI PLANTATIONS LTD
Mwera Estate
Sakura Estate
Kigombe Estate
4 AMC LTD
Bombuera Estate
Kwamgwe Estate
5 CHINA STATE FARMS (T) LTD
Kisangata Estate
Rudewa Estate
6 COALTAIL ENTERPRISES LTD

108
Amboni Estate
7 D.D. RUHINDA &CO.LTD
Mkumbara Estate
8 FIBRE & PRODUCTS (T) LTD
Lucy Estate
9 GOMBA AGR.INDUSTRIES LTD
Gomba Estate
Mswaha Estate
10 KAUZENI(1988) PLANTATIONS
Mhinduro Estate
11 KIHONDA PRISON FARM
12 KWASHEMSHI ESTATE LTD
Kwashemshi Estate
13 LE-MARSH ENTERPRISES
Mnazi Estate
14 L.M. INVESTMENTS
Ndungu Estate
15 LIM-PUMA LIMITED
Mtindiro Estate
16 MARUNGU SISAL ESTATE
17 MOHAMED ENTERPRISES
Alavi Estate
Bamba Estate
Fatemi Estate
Hassani Estate
Hussein Estate
Kwalukonge Estate
Lanconi Estate
Mabogo Estate
Mazinde Estate
Mjesani Estate
18 MTAPWA SISAL ESTATE
19 NEW KIMAMBA FIBRES LTD
Kimamba Fibres
20 NEW MSOWERO FARMS LIMITED
Alidina Estate
Msowero Estate
21 SAGERA ESTATES LTD
Lugongo Estate
22 KUMBURU SISAL PLANTATIONS
Kumburu Estate
23 KATANI LIMITED (SISO SMALLHOLDER FARMERS)
Hale Estate
Magoma Estate

109
Magunga Estate
Mwelya Estate
Ngombezi Estate
24 UNICORD (T) LTD
Toronto Estate
25 SFI TANZANIA LTD
Kwaraguru Estate
Kwamdulu Estate
Sisal production in Tanzania 2000-2015 (Source: Y. Mssika, personal communication, 2 May
2016)
TANZANIA SISAL BOARD
SISAL FIBRE PRODUCTION FOR 2002-2015
YEAR PRODUCTION (TONS)
2002 23,641
2003 23,858
2004 26,957
2005 27,793
2006 30,933
2007 33,327
2008 33,028
2009 21,060
2010 34,766
2011 34,527
2012 35,589
2013 37,357
2014 38,164
2015 40,001
TOTAL 441,001

110
APPENDIX L: GRID CONNECTED CAPACITY TANZANIA AS OF 2014
(Source: World Bank 2016).