the political economy of economic growth in india, · pdf filethe political economy of...
TRANSCRIPT
email: [email protected] Effective States and Inclusive Development Research Centre (ESID) School of Environment and Development, The University of Manchester, Oxford Road, Manchester M13 9PL, UK
www.effective-states.org
ESID Working Paper No. 44
The political economy of economic growth in India, 1993-2013
Kunal Sen1, Sabyasachi Kar2 and Jagadish Prasad Sahu3
December, 2014
1IDPM, The University of Manchester, UK Email correspondence: [email protected] 2Institute of Economic Growth, India Email correspondence: [email protected] 3Institute of Economic Growth, India Email correspondence: [email protected]
ISBN: 978-1-908749-44-4

The political economy of economic growth in India, 1993-2013
1
Abstract
We examine the political economy causes of India’s growth acceleration in the early 1990s, the periods of high growth in the 1990s and early 2000s, and the subsequent slowdown since 2011, drawing from the ESID conceptual framework (Pritchett and Werker 2013) and periodisation of growth episodes (Kar et al. 2013a). We argue that India’s post-reform growth experience can be separated into three distinct growth episodes. The first growth episode, from 1993 to 2002, was characterised by a set of predictable informal (and relatively open) relationships (which we call ‘ordered deals’) between political and economic elites. The second episode was from 2002 to 2010; deals in this period became increasingly closed, leading to negative feedback effects from accountability institutions, the middle class and non-elites, along with structural retrogression of the economy. The third episode, beginning in 2011, was one of an incipient growth deceleration, and was characterised by increasingly disordered deals. Our analysis of the Indian growth experience provides support for the conceptual framework we have used here and our other ESID growth studies. The wider implication of our analysis is that economic growth in most developing country contexts remains episodic and prone to collapse, as institutions do not evolve over the growth process, and in many instances, deteriorate.
Keywords: economic growth, boom and bust, India, deals, institutions
Acknowledgements
We are grateful for comments received from participants in the workshop: ‘Beyond Policy Paralysis’, held in New Delhi in July 2014. We particularly thank Barbara Harriss-White, Pratap Bhanu Mehta and two reviewers of this paper for their comments. The usual disclaimer applies.
Sen, K., Kar, S. and Sahu, J. (2014) The political economy of economic growth in India, 1993-2013. ESID Working Paper No. 44. Manchester, UK: University of Manchester. Available at www.effective-states.org
This document is an output from a project funded by the UK Aid from the UK Department for International Development (DFID) for the benefit of developing countries. However, the views expressed and information contained in it are not necessarily those of, or endorsed by, DFID, which can accept no responsibility for such views or information or for any reliance placed on them.

The political economy of economic growth in India, 1993-2013
2
1. Introduction
For much of the 1990s and 2000s, India was seen as the ‘new kid on the block’ among countries that were growth success stories, and was one of the three fastest growing economies in the world, along with China and Vietnam (Sen 2009). This narrative of India’s emerging growth miracle came to a sudden stop in 2011-2014, as growth slowed down considerably. The conventional wisdom on why economic growth in India stagnated usually attributes the growth slowdown to a combination of internal factors, such as the ‘policy paralysis’ that befell the central government in recent years and increased macroeconomic uncertainty, and external factors, such as the slowdown in global economic growth since 2008. In this paper, we provide a different reading of India’s growth experience in the 1990s and 2000s, emphasising political economy and institutional factors that have received less scholarly and media attention in the current discourse on India’s economic stagnation. We do so by situating the growth experience of India within a wider understanding of the nature of economic growth in developing countries that we have developed in earlier ESID papers (Pritchett and Werker 2013, Sen 2013). As we have argued in Kar et al. (2013a), a view of economic growth that is more consistent with the stylised facts of economic growth is one that takes economic growth as movements between different growth phases, rather than characterised by a ‘steady state’ rate of economic growth.1 Massive discrete changes in growth are common in developing countries, and most developing countries experience distinct growth episodes: growth accelerations and decelerations or collapses (Pritchett 2000, Kar et al. 2013a). If economic growth in developing countries is strongly episodic, it is not surprising that India’s growth has followed a similar pattern. But why do we see such ‘boom and bust’ economic growth in developing countries? In this paper, we first provide a summary of the conceptual framework that we have developed elsewhere (Pritchett and Werker 2013, Sen 2013) on why we see what we call ‘boom and bust’ growth in developing countries.2 We then identify India’s growth episodes, using standard statistical methods to identify structural breaks in India’s GDP per capita time-series, again drawing from our previous work (Kar et al. 2013b). Using this method, we show that India’s post-independence growth experience can be divided into three phases: (1) a period of slow growth till 1993; (2) a period of growth acceleration from 1993 to 2002; and (3) a period of further acceleration in economic growth from 2002 onwards. Based on more recent GDP data, we argue 1 As Jones and Olken (2008: 582) point out, ‘almost all countries in the world have experienced rapid growth lasting a decade or longer, during which they converge towards income levels in the United States. Conversely, nearly all countries have experienced periods of abysmal growth. Circumstances or policies that produce ten years of rapid economic growth appear easily reversed, often leaving countries no better off than they were prior to the expansion.’ 2 This paper is part of a suite of ESID papers that examines the political determinants of episodic growth, using a common framework and methodology. For other papers in this suite, see Kelsall and Seiha (2014) and Said (2014. For a detailed account of the framework that we use in this paper, see Pritchett and Werker (2013) and Sen (2013). For an exposition of the stylised facts of ‘boom and bust’ growth in developing countries, see Kar et al. (2013a).

The political economy of economic growth in India, 1993-2013
3
that India has entered a period of an incipient growth deceleration from 2011 to date. We then set out the stylised facts of India’s growth experience, followed by a description of India’s political history. We then apply our framework of ‘boom and bust’ growth to India’s growth experience, arguing that the institutional causes of India’s growth in the 1993–2002 growth episode were different from those observed for the 2002–2010 growth episode. Using our framework, we also provide an argument for why India’s economic growth slowed down in the post-2011 period.
2. A framework for understanding ‘boom and bust’ growth
As the recent empirical literature on economic growth shows, economic growth in many developing countries involves discrete and quantitatively massive transitions between periods of high growth, periods of negative growth, and periods of stagnation (Kar et al. 2013a). To fix our ideas on transition paths around growth regimes, we provide a simple sketch of these transition paths in Figure 1 below. Using a rough and ready way to demarcate growth regimes, we classify growth regimes into four categories: 1. a growth regime which we call ‘miracle growth’, where the average increase in
per capita income is 5 percent per annum or more; 2. a growth regime which we call ‘stable growth’, where the average increase in per
capita income is between 0 and 5 percent per annum;
3. a growth regime which we call ‘stagnant growth’, where the average increase in
per capita income is around 0 percent per annum; and 4. a growth regime we call ‘growth crisis’, where the average change in per capita
income is negative. Growth acceleration is the transition from stagnation or crisis to stable growth or miracle growth. The ability of a country to stay in stable growth or miracle growth in period t+1 if it has experienced the same in period t determines its ability to avoid growth collapses and maintain positive growth. It is necessary to understand the factors of both these processes to characterise a country’s growth process. Figure 1 makes this clear. It is not obvious that the factors that lead to growth acceleration will lead to growth maintenance as well, as Rodrik (2005: 3) argues:
‘igniting economic growth and sustaining it are somewhat different enterprises. The former generally requires a limited range of (often unconventional) reforms that need not overly tax the institutional capacity of the economy. The latter challenge is in many ways harder, as it requires

The political economy of economic growth in India, 1993-2013
4
constructing a sound institutional underpinning to maintain productive dynamism and endow the economy with resilience to shocks over the longer term.’ Figure 1. Transition paths between growth phases
Source: Authors’ illustration. Once we view economic growth as transitions between the above growth phases, and in particular, the transitions from crisis/stagnant growth to stable/miracle growth, the key questions that need to be addressed are: 1. What are the institutional determinants of growth acceleration? 2. How are they different from the institutional determinants of growth maintenance? We turn to these two questions next.
2.1 Institutional determinants of ‘boom and bust’ growth
What explains the move of the economy from regimes of stagnation or crisis to regimes of stable or miracle growth? Following the work of Acemoglu and Robinson (2008) and other new institutional economists, the conventional economic explanation for economic growth to occur is that formal institutions such as written contracts, laws that protect private property and properly functioning courts, need to emerge. However, in most developing countries, with weak institutional environments, even if formal institutions exist, they are unlikely to be enforced properly. More important in the explanation of growth acceleration is the existence of informal institutions, in the form of personalised relationships between political and economic elites, which we call the ‘deals’ space. A deal is defined as:

The political economy of economic growth in India, 1993-2013
5
‘a specific action between two (or more) entities in which actions are not the result of the impersonal application of a rule but rather of characteristics or sanctions of specific individuals which do not spill over with any precedential value to any other future transaction between other individuals’ (Pritchett and Werker 2013: 45).
Economic growth is likely to accelerate when there is a movement in the deals space from disordered to ordered deals, defined as deals that, once negotiated between investors and state officials, are honoured. In this case, investors can be assured that the political elite can deliver on the deals they make with the latter. On the other hand, disordered deals are deals between investors and the political elite where there is no certainty that the deal will be delivered. Through ‘ordered deals’, the state can ensure that investors commit to the investment decision and engage in production, so that rents can be generated through the production process. Investors need to consider this commitment to ‘ordered deals’ credible. In other words, investors must believe that the state or its agents will not renege on its implicit or explicit promise not to expropriate all or most of the rents accruing from the production process in the future, especially after investors have made investment decisions involving sunk costs in fixed capital. Investors also need to commit to share a part of their rents to the state (or its constituents, such as politicians) and when states raise revenues from taxes, to pay the state the necessary taxes (Sen 2013). What now explains the ability of the economy to stay in a positive growth process and for growth not to slow down or collapse? The move from growth acceleration to growth maintenance would depend on the movement in the deals space from closed ordered to open ordered deals, or from disordered deals to open ordered deals. We define ‘open deals’ as deals that are widely available to all investors, large or small, and not confined to an elite or a small group of favoured investors (Pritchett and Werker 2013). On the other hand, ‘closed deals’ are offered by the political elite only to a small group of investors. An ordered deals environment, even if closed, may be able to sustain growth for a considerable period. But for growth to be sustained over the long run, the deals space must – while maintaining order – also become more open. This is because openness in the deals space drives economic competition and facilitates new firm entry, which leads to structural transformation as countries produce more complex products and as resources shift from low productivity sectors to high productivity sectors and firms (Pritchett and Werker 2013). We set out the deals space in a 2x2 matrix, as in Figure 2 below, and show how it relates to different phases of growth. A shift from disordered deals to ordered deals is associated with growth acceleration; and a shift from closed ordered to open ordered deals is associated with growth maintenance.

The political economy of economic growth in India, 1993-2013
6
Figure 2. The deals space
Closed deals Open deals
Kickstarting growth
Disordered deals
Only those with political connections can make deals, and even they cannot be certain that officials will deliver.
Anyone can make a deal, but no-one is certain that officials will deliver.
Ordered deals
Only those with political connections can make deals, but they can be confident that officials will deliver
Anyone can make a deal, and they can be certain that officials will deliver.
Maintaining growth
Source: Authors’ illustration, based on Pritchett and Werker (2013). However, there is nothing pre-ordained in the evolution of institutions that suggests the move from closed ordered or disordered deals to open ordered deals is linear. As economic growth originates in a country, two feedback loops occur from the growth process to the deals space. These feedback loops can be either positive or negative; in other words, whether with further economic growth, the deals space may turn from being open ordered to being closed ordered or being disordered. The first of these feedback loops is economic in nature, and would depend on the ‘rents-space’, or the structure of economic opportunities in the economy. We characterise the rents- space in Figure 3, categorising the economic structure of the economy in a 2x2 matrix, in two dimensions – whether the sectors in the economy are in exporting and/or import-competing sectors or not affected by international trade; and whether the sectors are characterised by high rents (that is, excess profits) or are competitive.

The political economy of economic growth in India, 1993-2013
7
Figure 3. The rents space
High rent Competitive
Export-oriented or
import-competing
Rentiers
Natural resource exporters
Magicians
Manufacturing and service exporters, other agricultural exporters
Domestic market Powerbrokers
Legislative monopolies or oligopolies, natural monopolies or oligopolies
Workhorses
Traders, retailers, subsistence farmers, the informal sector
Source: Pritchett and Werker (2013). We call the export-oriented high rent sectors ‘Rentiers’ (the upper left cell of the 2x2 matrix), and the competitive tradeable sectors ‘Magicians’ (the upper right cell of the 2x2 matrix). We call the monopolistic or oligopolistic domestically oriented or non-tradeable sectors ‘Powerbrokers’ (the lower left cell of the 2x2 matrix), and the competitive domestically oriented sectors ‘Workhorses’ (the upper right cell of the 2x2 matrix). Rentiers are more likely to be natural resource-exporting sectors and Magicians are likely to be manufacturing sectors, such as apparel and electronics, as well as tradeable service sectors, such as information technology (IT). Powerbrokers are likely to be real estate, construction, infrastructure, utilities and telecommunications, while Workhorses are likely to be smallholder agriculturists and the informal manufacturing and services sectors. We would expect the types of private sector actors more likely to push for closed deals than open deals would be firms in the ‘Rentier’ and ‘Powerbroker’ sectors, as these firms would lose out in an open deals environment, where rents in these sectors dissipate with new firm entry or from more open and transparent regulatory institutions. Since in these sectors the state plays a large role in allocating licences and controlling the entry of new firms, firms in these sectors are likely to strike close personalised relationships with the political elite, to capture the process of licence allocation or to create artificial barriers to entry. On the other hand, firms in the ‘Magician’ and ‘Workhorse’ sectors are more likely to push for open deals than closed deals, for three reasons.3 First, these sectors are the
3 Treating tradeable sectors such as pharmaceuticals and IT as Magician sectors, which are mostly interested in ‘open deals’, is clearly a simplification. These sectors have also benefited from government protection and preferential allocation of licences in the case of the pharmaceuticals sector. However, given the relatively free entry to these sectors since 1991, and that these sectors benefit from the competitive pressures and firm dynamism that an ‘open deals’ environment would bring with it, most firms would be likely to push for an ‘open deals’ environment in these sectors.

The political economy of economic growth in India, 1993-2013
8
most dynamic and ‘creative destruction’ is most likely to occur here, and firms in these sectors would benefit the most from an open deals environment. Secondly, given the inherent contestability of these sectors and the presence of a large number of economic actors, a closed deals space that excludes many of these actors is not likely to find political traction. Finally, these two sectors depend on an efficient Powerbroker sector for cheap and high quality inputs to their production process, such as well functioning roads and reliable electricity provision, and would benefit from the competitive pressures that an ‘open deals’ environment would bring to Powerbroker firms. Therefore, if the growth acceleration episode is biased towards the Rentier and Powerbroker sectors (say, due to a commodity price boom, or the high growth of non-tradeable sectors such as infrastructure and real estate), the economic feedback loop through the rents space could have a negative effect on the deals environment, making it more closed. On the other hand, a growth acceleration episode biased towards the Magician and Workhorse sectors is more likely to lead to further opening of the deals space. The second of the feedback loops would be mostly political in nature, and would depend on how influential groups, such as civil society, judiciary, the middle class and the media, view the growth process, as well as how non-elites mobilise themselves against elements of the growth process that they see as politically illegimate. Particularly in countries with strong civil society presence and electoral politics, the political feedback loop can be negative if the deals environment underpinning the growth episode is seen as exclusionary or if the nature of economic growth is highly predatory. The political feedback loop can lead to changes in the distribution of power, as groups such as civil society, the middle class and those excluded from the growth process begin to gain de facto political power, with greater political mobilisation and pushback from accountability institutions such as the judiciary and the media. Therefore, while a shift from a disordered deals environment to a closed ordered deals environment is often necessary for growth to accelerate, the political feedback effect may turn negative if the deals space remains closed for too long, especially in democracies. If the positive growth episode is underpinned by closed ordered deals that do not become open over time, both economic and political feedback loops are likely to turn negative and the closed ordered deals environment may become increasingly disordered, ending the positive growth episode. On the other hand, economic and political feedback loops can be positive if the deals space becomes increasingly open, and the Magician and Workhorse sectors become increasingly important in the growth process, leading to structural transformation, as new firms, products and industries emerge in the growth process. In this case, the positive growth episode will carry on, and sustained economic growth will result. We

The political economy of economic growth in India, 1993-2013
9
Figure 4. A framework for understanding ‘boom’ and ‘bust’ growth
Source: Authors’ illustration.
1.DISTRIBUTIONOFPOWER
DISORDEREDTOCLOSEDORDERED
DISORDEREDTOOPENORDERED
GROWTHACCELARATION
ORDEREDTODISORDERED
CLOSEORDEREDPERSIST
OPENTOCLOSEORDERED
CLOSETOOPENORDERED
GROWTHCOLLAPSE
GROWTHSTAGNATION
GROWTHPERSISTENCE
PHASEONE
PHASETWO
DEALSSPACE GROWTHOUTCOME
FEEDBACKLOOPS

The political economy of economic growth in India, 1993-2013
10
depict the different possibilities in Figure 4, which sets out visually our framework for understanding ‘boom’ and ‘bust’ growth.
3. Identifying India’s growth episodes
Before we examine the causes of boom and bust growth in India, we first need to periodise India’s growth and, in particular, establish when their growth accelerations and decelerations occurred. We follow our own procedure, set out in Kar et al. (2013a, b). This procedure differs from previous approaches that have attempted to identify the timing of India’s growth acceleration, which have either been ad hoc, in that they have simply eyeballed the data to establish the timing of the break (such as Sen 2007), or used a statistical method (Bai and Perron 1998) mechanistically (such as Balakrishnan and Parameswaran 2007). Our approach combines the statistical approach with an economic filter to provide a more unified way of establishing breaks in GDP per capita data.4 Our procedure identifies 1993 as the beginning of the first growth acceleration episode, and 2002 as the beginning of the second growth acceleration episode. In India, GDP per capita growth accelerated in 1993 to 4.23 percent per annum (ppa) versus a predicted rate of 2.34 ppa and then accelerated again in 2002 to 6.29 ppa versus a predicted rate of 2.91 ppa. The net present value (NPV) (at a 5 percent discount rate) of the additional output from the 2002 growth acceleration was USD 2.65 trillion (PPP). The NPV of output gained from the 1993 acceleration was USD 1.05 trillion. Therefore, the total NPV gained from growth accelerations since 1993 was USD 3.7 trillion. Taken together, India’s two growth accelerations added about USD 4,000 in PPP terms to the average Indian’s income, as compared to the counter-factual of what the income would have been without the two growth accelerations.
4. Growth and structural transformation in the Indian economy
In this section, we put together a set of stylised facts about the Indian economy, which we will then use a background to our arguments on the nature of India’s growth experience in the 1990s and 2000s. Based on our periodisation, the economic growth experience of India since independence can be best viewed as three distinct growth regimes: (a) a period of low growth from 1950 to the early 1990s (though there were growth spurts in the late 1980s, they did not last long enough to be considered as a genuine break in trend growth); (b) growth acceleration since the early 1990s; and (d) a period of high growth since the early 2000s. We follow this periodisation for the rest of this section, when we present other aspects of India’s growth experience since the 1950s.
4 The question of timing of turning points in India’s economic growth is a controversial issue (see Ghate and Wright 2012). Most previous studies on structural breaks in growth rates in India find evidence of breaks in the late 1970s. Our procedure shows a possible growth break in 1979, but that this break is not significant enough statistically.

The political economy of economic growth in India, 1993-2013
11
We plot India’s real GDP per capita growth in Figure 5 (five-year moving average to smooth out spikes in growth rates). As is clear from the Figure, economic growth starts increasing steadily since the 1990s to 2010. However, economic growth declines sharply in the period 2011-2013 (the most recent year for which we have GDP data), and the average for these three years is 3.35 percent, as compared to 6.33 percent in 2002-2010. While the economic growth slowdown may well be a temporary one, we will argue later in the paper that the decline in economic growth may well be medium-term and, thus, that it constitutes a growth deceleration phase. Figure 5. India’s economic growth (percentage annual change in per capita
GDP 1961-2013, five-year moving average)
Source: World Bank, World Development Indicators 2014, for 1960-2012, and IMF’s World Economic Outlook for 2013, our calculations. Kar et al. (2013a) also analyse the nature of the Indian growth experience through a series of graphs. Figure 6a depicts that a linear trend cannot explain the volatile growth experience of the Indian economy. There are obvious breaks in the Indian GDP per capital growth rates. Figure 6b illustrates the fact that India has done fairly well in terms of GDP per capita compared to other developing countries in the world, given its initial level of income per capita. India has reached the rank of 38 out of 104 countries in 2010, from 21 in 1960. Figure 6c shows the short-run growth rates (measured by first difference in the log of GDP per capita) as well as the long-run growth rates (measured by moving average) of the Indian economy. It clearly shows that the short-run growth rates are much more volatile than the long-run growth rates. Figure 6d demonstrates that growth rates are normally distributed and India has done

The political economy of economic growth in India, 1993-2013
12
reasonably well in terms of GDP per capita growth rates. Its growth has never been negative as compared to other countries in the world. For a majority of times, Indian growth rates fall in the 2-4 percent category, while few instances of rapid growth are observed in Indian context. Figure 6a. Overall, 10- and five-year growth rates, India
Source: Kar et al. (2013a). Figure 6b. Initial and final per capita income, India
Source: Kar et al. (2013a).

The political economy of economic growth in India, 1993-2013
13
Figure 6c. First difference and five-year moving average growth rates, India
Source: Kar et al. (2013a). Figure 6d. Distribution of all eight-year growth rates, India versus the world
Source: Kar et al. (2013a).

The political economy of economic growth in India, 1993-2013
14
Figure 6e. Structural breaks in growth rates, India
Source: Kar et al. (2013a).
Figure 6f. Cumulative change in per capita income over growth episode, India
Source: Kar et al. (2013a).
Figure 6e shows the two structural breaks in the GDP per capita growth rates in India. The first one occurred in 1993 and the other one in 2002 (Kar et al. 2013a). Compared to regime-1, the growth rate increased significantly in the second regime

The political economy of economic growth in India, 1993-2013
15
and reached an even higher level in the third regime. Figure 6f describes the magnitude of growth accelerations that occurred due to the structural breaks in the Indian growth rates. The first episode of growth acceleration was sustained for a period of nine years and the second for eight years. The first episode left GDP per capita higher, at 27 percent, than if growth had occurred at a counter-factual rate (see Pritchett et al. 2014 for more details). The second episode left GDP per capita at 24 percent higher than if GDP had grown at the counter-factual rate.
4.1 From aggregate to sectoral growth
Where have been the sources of growth across the three different growth regimes? We find that agriculture has shown a lack of dynamism across all three growth regimes (Table 1). The primary sector (agriculture and allied activities, plus mining and quarrying) as a whole has experienced a similar trend. In general, the primary sector has witnessed stagnation over the entire period. However, the mining sector data in the last regime have been grossly underreported (see Shah 2012). The manufacturing sector has experienced growth acceleration during both regime-2 and regime-3, although within this sector, registered manufacturing grew faster than unregistered manufacturing. The construction sector witnessed rapid growth during the third regime, with an average growth rate of 8.57 percent in 2002-2010, as compared to 5.61 percent in 1993-2001.The trade, hotels and restaurants sector showed strong growth in both periods, 1993-2001 and 2002-2010. The communication sector witnessed a surge in growth in 1993-2001, with an average growth rate of 15.73 during this period, compared with an average growth of 4.44 percent in 1951-1992 (this growth momentum was maintained in 2002-2010). The finance, insurance, real estate and business services sectors also witnessed strong growth in 1993-2001 and 2002-2010, driven mostly by growth in the banking and insurance sector and in business services (mostly information technology, IT). Overall, the growth accelerations of 1993-2001 and 2002-2010 were mostly due to growth in tradeable sectors, such as manufacturing and business services, and non-tradeable sectors, such as trade, hotel and restaurants, communication, and finance. 4.2 Structural change of the Indian economy
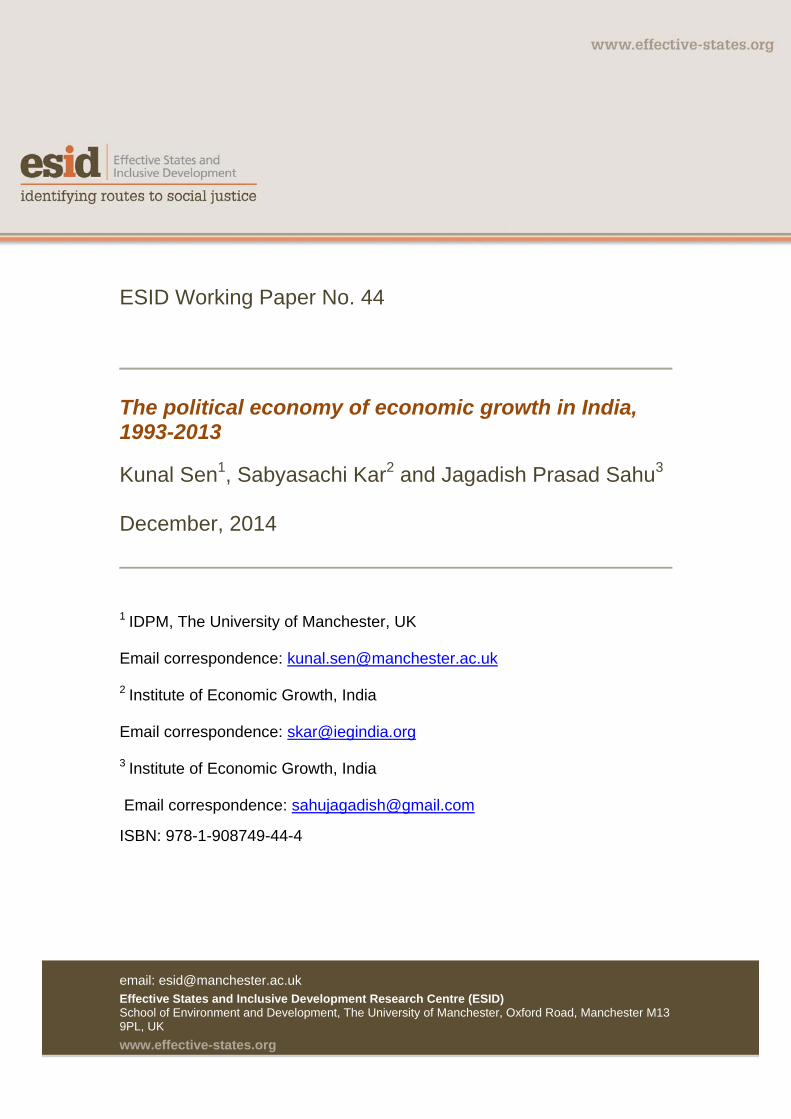
Figure 7 shows the sectoral distribution of aggregate GDP of the Indian economy. The share of agriculture in the total GDP has been consistently declining, from 37.2 percent in 1980-81 to 14.54 percent in 2010-11. On the other hand, both the industry and services sectors’ share in total output are continuously rising during the same period. While industry share has recorded relatively slow growth from 16.9 percent in 1980-81 to 18.4 percent in 2010-11, the services sector has undergone a rapid expansion over the years – 45.8 percent in 1980-81 to 67.1 percent in 2010-11.

The political economy of economic growth in India, 1993-2013
16
Table 1. Regime-wise average sectoral GDP per capita growth rates
Sl. no. Sector name 1951-92 1993-01 2002-10
1 Agriculture, forestry & fishing 0.59 1.30 1.46
1.1 Agriculture, incl. livestock 0.75 1.30 1.59
1.2 Forestry & logging -1.42 -0.07 0.20
1.3 Fishing 2.33 2.88 2.42
2 Mining & quarrying 3.41 2.21 3.42
3 Manufacturing 2.98 4.87 7.38
3.1 Registered 3.95 5.61 8.57
3.2 Unregistered 1.86 3.52 5.07
4 Electricity, gas & water supply 6.95 3.87 4.89
5 Construction 2.78 3.41 8.75
6 Trade, hotels & restaurants 2.80 6.54 7.64
6.1 Trade 2.78 6.36 7.69
6.2 Hotels & restaurants 2.94 8.66 7.30
7 Transport, storage & communication 3.58 7.42 11.05
7.1 Railways 1.95 2.02 6.17
7.2 Transport by other means 4.17 5.32 7.52
7.3 Storage 2.40 0.39 5.82
7.4 Communication 4.44 15.73 23.07
8 Financing, insurance, real estate & business services 2.85 5.86 8.46
8.1 Banking & insurance 5.69 7.37 11.17
8.2.1 Real estate, and ownership of dwellings 1.98 2.96 2.24
8.2.2 Business services (including IT) 3.29 14.96 13.56
9 Community, social & personal services 2.53 4.68 5.25
9.1 Public administration & defence 3.83 4.35 5.30
9.2 Other services 1.68 4.95 5.31
10 Primary (1+2) 0.75 1.38 1.68
11 Tertiary (6+8) 2.81 6.18 8.04
12 Infrastructure (4+7) 4.17 6.46 9.85
13 Agriculture (1) 0.59 1.30 1.46
14 Industry (2+3+4+5) 3.00 4.02 7.17
15 Services (6+7+8+9) 2.79 5.88 7.79
16 Total Gross Domestic Product (13+14+15) 1.86 4.15 6.42
Source: National Accounts Statistics, CSO.
The political economy of economic growth in India, 1993-2013
17
Figure 7. Sectoral distribution of GDP (in per cent of GDP)
Source: National Accounts Statistics (NAS), CSO. Table 2 depicts the industrial structure of the economy over the period 1981-2007. It is evident that the average shares of food, beverages & tobacco, textiles & apparel, and machinery in total manufacturing real gross value added (GVA) have declined over the period. The share of food, beverages and tobacco has declined from an average value of 15.3 percent in 1981-92 to 13.8 percent in regime-2 and to 11.1 percent in 2002-07. Machinery share has declined from 8.62 percent to 7.93 percent and further declined to 7.62 percent over the corresponding period. Textiles and apparel has witnessed a similar trend and has reached at 9.96 percent during 2002-07 from 12.12 percent during 1981-92. On the other hand, the shares of refined petroleum products, chemicals and metals have increased over the period. Although refined petroleum products share declined from 6.2 percent during 1981-92 to 5.6 percent during the period 1993-01, thereafter it has shown a rapid increase during the period 2002-07. The sub-group, namely ‘metals’ has experienced relatively slow
0%
10%
20%
30%
40%
50%
60%
70%
80%
90%
100%
1980‐811990‐91
2000‐012010‐11
Agriculture Industry Services

The political economy of economic growth in India, 1993-2013
18
but continuous increase in the share in total manufacturing gross valued added over the entire period. Sectors like non-metallic minerals, and motor vehicles & accessories have maintained roughly a constant share during the period. To sum up, Table 2 demonstrates that the resource-based sectors (except chemicals) have seen an increase at the expense of labour-intensive and human capital-intensive sectors. In other words, while the high rent sectors (natural resource-based sectors), such as petroleum refinery and metals, have seen an increase during the third growth episode, the labour-intensive sectors – like food and beverages, and textiles and apparel – have gone down during the same period.

The political economy of economic growth in India, 1993-2013
19
Table 2. Average share in total manufacturing real gross value added
Average
Food,
beverages
and
tobacco
Textiles
and
apparel
Refined
petroleum
products Chemicals Metals
Non-
metallic
minerals Machinery
Motor
vehicles
and
accessories Others
1981-92 15.33 12.12 6.19 17.68 15.72 4.43 8.62 3.42 16.49
1993-01 13.80 11.28 5.60 20.59 16.18 4.82 7.93 3.63 16.18
2002-07 11.09 9.96 13.03 17.83 17.27 4.80 7.62 3.50 14.90
Note: Authors’ calculation based on data from Annual Survey of Industries.

The political economy of economic growth in India, 1993-2013
20
4.3 Rentier, Magician, Powerbroker and Workhorse sectors
In Figure 8, we plot the relative importance of the Rentier, Powerbroker, Magician and Workhorse sectors, as reflected in their shares in GDP over time.5 We see that both the Powerbroker and Magician sectors have increased their importance in economic activity over time, especially in the post-2002 period. This has been mirrored by a steady decline in the Workhorse sector until 2002, followed by a sharp drop in the share of this sector in total output from 2002 onwards (the Rentier sector has marginally increased its importance in the post-2002 period). The fall in the share of the Workhorse sector, where most of India’s poor are located, has negative implications for a growth strategy that favours the working poor, and suggests that this sector had less of a role in influencing the deals environment in the post-2002 period. Since this sector has a strong interest in an open deals environment, the decline in this sector implied that one important source of pressure for open deals was gradually diminishing over time. On the other hand, the net effect on deals with the growing importance of the Magician sector (which characteristically asks for open deals) and the Powerbroker sector (which characteristically asks for closed deals) was less certain. Figure 8. Relative importance of Rentier, Powerbroker, Magician and Workhorse sectors
Source: Our calculations, from National Accounts Statistics, CSO.
5 We use GDP factor cost at constant price to calculate the shares of the four sectors. We only include sectors where much of the economic activity is produced by the private sector, as the rents-space as in Figure 3 does not apply to the public sector (in other countries, large firms in the public sector, such as Gazprom in Russia, could be considered to be part of the Rentier sector, given their close connection to the political elite – this is not the case in India, where there are no clear systematic direct links between the management of public sector companies and the political class). In the Rentier sector, we include Mining and Quarrying (only from 2002, as previous to this year, mining was under state ownership). For the Powerbroker sector, we include utilities, construction, communications and real estate (again, only from 2002, as previous to this year, these sectors were mostly under state ownership). For the Magician sector, we include registered manufacturing and business services (information technology). For the Workhorse sector, we include agriculture, forestry, fishing, unregistered manufacturing, trade, hotels and restaurants, transport by other means, storage, dwellings and other services.

The political economy of economic growth in India, 1993-2013
21
0
5
10
15
20
25
30
35
40
1950 1960 1970 1980 1990 2000 2010
GFCF PUB PCS HHS
1993 2002
4.4 Fixed capital formation and its components
For more than half a century, fixed investment rates have steadily gone up in India (Figure 9 and Table 3). This has been driven mostly by fixed investment by the private sector, and also shows an upward trend over the entire period. It recorded a high growth in the second regime and even higher in the third regime. However, public sector fixed investment has fallen after a peak in the mid-1980s. There was a sharp fall in private corporate fixed investment in the latter half of the 2002-2010 growth episode. Figure 9. Sector-wise gross fixed capital formation as percentage of GDP
Table 3. Fixed investment rates, period average
Period GFCF PUB PCS HHS
1950-51 to 1992-93 17.07 8.17 2.46 6.44 1993-94 to 2001-02 25.35 8.42 7.50 9.43 2002-03 to 2010-11 32.05 8.18 10.85 13.02
GFCF: Gross Fixed Capital Formation, PUB: Public Sector GFCF, PCS: Private Corporate Sector GFCF, and HHS: Household Sector GFCF.

The political economy of economic growth in India, 1993-2013
22
4.5 Structural transformation
What happened to structural transformation during this period? Hidalgo et al. (2007) view structural transformation as the upgrading of products in a country’s economic structure such that firms in that country move over time to more complex products. Following this view, and using data on product complexity from the Atlas of Economic Complexity,6 we plot the five-year moving average of product complexity for India between 1993-94 and 2007-08 in Figure 7. We find that structural transformation (as captured in increasing product complexity) mostly increased during the 1993-2002 growth episode, but fell during the 2002-2010 episode. The move away from more complex products in the 2002-2010 period was also obvious in India’s export structure. In the early 1990s, before the reforms, agriculture and allied products, gems and jewellery, and readymade garments were the biggest merchandise export earners (Table 4). Over time, agriculture and allied products and readymade garments have become less important for the exports sector, while gems and jewellery has remained a major sector. During the same period, engineering goods have become a larger major export earner, while chemicals and related products have also remained important. However, since 2000-01, the share of petroleum products in total merchandise exports has increased significantly. As Figure 11 makes clear, there was a sharp increase in the share of exports from the Rentier sector, such as refined petroleum, and a decrease in the share of exports from Magician sectors, such as pharmaceuticals. Table 4. India’s merchandise exports, 1990–2010 (% of total exports in commodities) 1990-91 2000-01 2010-11
Agricultural products 14.57 9.66 6.36
Ores and minerals 4.21 1.87 2.27
Petroleum products 2.27 3.02 10.89
Leather 6.29 3.15 1.03
Chemicals 7.50 9.52 7.59
Engineering goods 9.77 11.03 15.29
Machinery and instruments 3.02 2.56 3.11
Transport equipment 3.02 2.56 3.11
Textiles 5.08 5.60 1.52
Garments 9.71 9.01 3.05
Gems and jewellery 12.70 11.94 10.64
Other commodities 21.85 30.09 35.13
Natural resource exports 21.04 14.55 19.53
Non-natural resource exports 78.96 85.45 80.47
Source: Reserve Bank of India, our calculations. Note: Natural resource exports = agricultural products + ores and minerals + petroleum products.
6 Online resource: http://atlas.cid.harvard.edu/

The political economy of economic growth in India, 1993-2013
23
Figure 10. Measure of structural transformation (Hausmann-Hidalgo measure of
economic complexity), five-year moving average
Source: Authors’ calculations, from Atlas of Economic Complexity.
Figure 11. India’s exports, 1995-2011
Source: Atlas of Economic Complexity.

The political economy of economic growth in India, 1993-2013
24
5. India’s political history
India became an independent nation on 15 August 1947. Prior to independence, a Constituent Assembly was convened to design a new Constitution. The Indian National Congress (INC), which formed the vanguard of the movement for independence from British rule, won most the seats in the Assembly, which served as the de facto parliament during the transition government (Adeney and Wyatt 2010). A new Constitution was designed in three years, and India became a sovereign, democratic republic after its Constitution came into effect on 26 January 1950. India adopted a federal parliamentary system, and the first elections were held in 1952. The INC won 364 out of 489 seats in the national parliament, and Jawaharlal Nehru became the first Prime Minister of independent India, an office that he held continuously until his death in 1964. During much of his lifetime, the INC was overwhelmingly the dominant political party (Joshi and Little 1994). Lal Bahadur Shashtri became the Prime Minister after Nehru’s death, but his tenure in office was cut short with his own death in January 1966, and a caucus of state chief ministers and INC party bosses secured the election of Indira Gandhi as Prime Minister. National elections were held in 1967, and though the INC won the elections again, for the fourth time in succession, its share in total seats fell from 73.1 percent in 1962 to 53.4 percent (Table 5). Following her re-election as Prime Minister, Indira Gandhi turned towards more populist policies, with the nationalisation of domestically owned commercial banks in 1969, and the adoption of the Monopolies and Restrictive Trade Practices (MRTP) Act, regulating closely the activities of Indian business houses. With increasingly popular support for Indira Gandhi, there was a split in the INC in 1969, with Indira Gandhi’s wing of the Congress Party, known as Congress (R), and the more conservative wing, known as Congress (O). In 1971, in the general elections, Indira Gandhi and the Congress (R) won a landslide victory, and secured a clear two-thirds majority in parliament. Just after the election, there was a crisis for the government, with the intervention of the Pakistan army in East Pakistan (now Bangladesh) leading to a severe refugee problem in Eastern India. When Pakistan launched an air attack across the Eastern border, the Indian army counter-attacked, leading to the unconditional surrender of the Pakistan army, and the formation of Bangladesh. While Indira Gandhi’s popularity increased substantially after the conclusion of the successful war, the economy was hit by a macroeconomic crisis in 1973 and 1974, with a sharp increase in oil process and the worsening of inflation. There was increasing unrest in the country, with food riots, student unrest and industrial disputes, culminating in 1974 in a threatened strike by two million railway employees in the public sector, which was the first political challenge to the national government by a trade union since independence. In 1975, Indira Gandhi declared a national emergency, suspending some democratic rights for two years. In 1977, for reasons which remain murky (Kohli 2012), Indira Gandhi rescinded the emergency and called for new elections. In this election, the Congress Party was comprehensively beaten, and a new anti-Indira coalition, led by the Janata Party, came to power. However, this new government was riven with factionalism and power struggles between individuals, leading to its collapse in 1979. Fresh elections were called, and Indira Gandhi returned to power in 1980.

The political economy of economic growth in India, 1993-2013
25
In the early 1980s, there was growing centre-state conflict and communal problems, particularly the separatist (and terrorist) problem among a section of Sikhs in Punjab (Joshi and Little 1994). In order to quell the separatist problem, Indira Gandhi launched an assault on the Golden Temple, the religious centre of the Sikh religion, which had become the terrorist headquarters. In revenge, she was assassinated by her bodyguards in 1984, and her son Rajiv Gandhi became the Prime Minister and called for new elections. The Congress Party won the 1984 elections with an overwhelming majority, riding on a huge wave of sympathy among the electorate for Rajiv Gandhi. However, the earlier support for the Congress dissipated over time, with growing regional and ethnic assertiveness, and allegations of corruption against the Congress, relating to the purchase of field artillery from the Swedish firm, Bofors. An anti-Congress political front began to emerge, and in the 1989 general elections, the Congress suffered an embarrassing defeat, and a coalition of parties, led by the Janata Dal, formed a minority government with outside support from the Hindu nationalist party, the Bharatiya Janata Party (BJP). This government did not last for very long, with the onset of the Gulf crisis in August 1990, as Iraq invaded Kuwait, and as the economy entered a turbulent period, with a balance of payments crisis. The immediate cause was the arrest of the leader of the BJP, L K Advani, who had embarked on a march with thousands of followers demanding that a temple should be built on the site of a mosque in Ayodha in Northern India. As the BJP withdrew support, the government collapsed, and new elections were held in 1991. The Congress came back to power, as a minority government, as it lacked the necessary seats for overall majority. The return to power of the Congress was helped in some part by the sympathy factor for Rajiv Gandhi, who was assassinated by Tamil militants, just a day after polling began. The new government implemented a major stabilisation-cum-structural adjustment programme soon after it came to office, effectively ending the command and control regime which had characterised Indian economic policy since independence. The 1990s saw the loss of power of the Congress once again in the 1997 elections to a Janata Dal-led coalition, and the emergence of the BJP as an important political force, which won the elections in 1998 and 1999, as the leading party in the National Democratic Alliance (NDA). In the 2000s, the Congress returned to power, as part of the United Progressive Alliance (UPA), winning elections in 2004 and 2009. Three features of India’s political history are important in our analysis of the political economy determinants of India’s economic growth. Firstly, India’s political settlement has decisively moved away from a dominant party settlement when the Congress Party was hegemonic for the first four decades since independence (except a brief period in the 1970s when they were in opposition, mostly as a backlash among the electorate, due to the emergency). Since the 1990s, there has been a variety of national-level political experiments to find a substitute for old Congress Party rule, with the decline in hegemony of the Congress, especially by the emergence of the BJP (Kohli 2012). As a consequence, the country has moved to a competitive clientelist political settlement, with two or more political groups jockeying for power, and where no political party (and its allies) is assured of victory in the national elections. This has consequences for the nature of the ‘deals’, and the time

The political economy of economic growth in India, 1993-2013
26
horizon of these deals, that political elites can offer to economic elites, which we will discuss in greater detail in later sections. Secondly, India’s political system has become increasingly fractionalised,7 particularly since the late 1980s (Figure 12). Along with this, over the same period there has been a decreasing share of seats of the majority party (no matter which party won the elections). This is because of the rise of regional parties, such as the DMK and AIDMK in Tamil Nadu, Shiv Sena in Maharashtra, the Janata Dal-U in Bihar, the Biju Janata Dal in Odisha and Trinamul Congress in West Bengal (Table 5). These parties have become important components of the ruling coalition, especially in the 2000s, and exert a significant influence on what the main ruling party (whether the Congress or the BJP) can or cannot do. Thus, unlike the classic competitive clientelist political settlements that characterise political systems in many parts of the world (such as Bangladesh and Ghana), India’s political system has become multi-polar, rather than bi-polar (Varshney 1999). As a consequence, the number of regional parties officially recognised in the national elections increased from 11 in 1957 to 30 in 2009, and the total number of recognised parties increased from 15 in 1957 to 230 in 2009. Given the veto power exerted by numerically small but powerful groups of politicians in regional parties that comprise ruling coalitions in the 2000s, the deals that economic elites have had to strike with political elites increasingly accommodated the interests of these parties, with implications for both the ‘ordered’ nature of these deals, as well as their ‘openness’. Again, we will explore the implications of the changing nature of deals since the 1990s, due to the increasing importance of regional parties, in later sections. Finally, as has been argued by Mehta and Walton (2014), there has been a clear shift in the cognitive maps held by national elites in the 60 years since independence. Cognitive maps are ‘the range of ideas and practical perspectives about what can be done, the expected consequences of action and the narratives of change’ (ibid. p. 5) – in the Nehruvian period, cognitive maps were shaped by the Soviet model of socialism, as well as the dependent nature of the Indian economy under British rule. This cognitive map shaped India’s development path in the decades since independence, with a clear emphasis in Indian policy circles on a modernising industrialising strategy, with the state playing a leading role in a mixed economy, and a belief in the inefficiencies of the private sector (Rodrik 2014). However, first gradually in the 1980s, and then more radically in the 1990s, this cognitive map changed, with states elites now supportive of market reforms, with the belief that India’s industries could compete internationally, and that deregulation was necessary to liberate economic growth (Mehta and Walton 2014). The shift in the cognitive maps of political elites, from being anti-market to being pro-market over the 1980s and 1990s, had consequences for India’s economic growth, as we will discuss later.
7 As measured by the probability that two randomly drawn members of parliament are from the same political party.

The political economy of economic growth in India, 1993-2013
27
Table 5. Seats held by political parties in national elections, 1952-2009
Year INC BJP Left JD/BLD Others
Share of ruling party in total seats
Share of others
Ruling party
1952 364 0 16 0 21 90.8 5.2 INC
1957 371 0 27 0 5 92.1 1.2 INC
1962 361 0 29 0 104 73.1 21.1 INC
1967 283 0 42 0 215 52.4 39.8 INC
1971 352 0 48 0 118 68.0 22.8 INC
1977 154 0 29 295 65 54.3 12.0 JP
1980 353 0 47 72 71 65.0 13.1 INC
1984 415 2 28 10 88 76.4 16.2 INC
1989 197 85 45 143 73 26.3 13.4 JD led coalition
1991 244 120 49 59 71 44.9 13.1
INC, minority govt
1996 140 161 44 46 152 8.5 28.0 JD led coalition
1998 141 182 41 0 179 29.7 33.0 BJP+
1999 114 182 37 0 210 33.5 38.7 BJP+
2004 145 138 53 0 207 26.7 38.1 INC+
2009 206 116 20 0 201 37.9 37.0 INC+
Notes: INC: Indian National Congress; BJP: Bharatiya Janata Party, JP: Janata Party, JD: Janata Dal; source: Election Commission of India.

The political economy of economic growth in India, 1993-2013
28
Figure 12. Measures of total fractionalisation and proportion of seats won by the majority party, national elections, 1975-2009
Note: Total fractionalisation measures the probability that two randomly chosen members of the parliament belong to two different parties. Source: Quality of Government Database, Gothenburg University. Accessed 1 February 2014.
6. Understanding the 1993-2002 growth episode
India’s political economy has been supportive of pro-business and pro-growth policies since the 1980s (Kohli 2012, Mehta and Walton 2014). When Indira Gandhi returned to power in 1980, the government’s economic policy focused on promoting economic growth. This led to a growing alliance between the political and economic elites. As Kohli (2012: 30-31) notes:
‘just after coming to power in January 1980, … Indira Gandhi let it be known that improving production was now her top priority. In meeting after meeting with private industrialists, she clarified that what the government was most interested in was production.’
Therefore, beginning in the 1980s, the Indian state clearly signalled to domestic capitalists its intention to credibly commit to an environment where private enterprise would be supported and growth-enhancing policies followed (De Long 2003, Rodrik and Subramanian 2004). This was reflected in changes in economic policies, such as the slow but steady liberalisation of import controls, especially on capital and intermediate goods. The shift in the relationship between political and economic elites from one of mutual distrust to a more
0
0.1
0.2
0.3
0.4
0.5
0.6
0.7
0.8
0.9
1975
1977
1979
1981
1983
1985
1987
1989
1991
1993
1995
1997
1999
2001
2003
2005
2007
2009
Total Fractionalisation
Majority Seats

The political economy of economic growth in India, 1993-2013
29
collaborative and synergistic relationship was further accentuated with the coming to power of Rajiv Gandhi in 1985. Gandhi took particular interest in modern sectors, such as IT and engineering, and tried to bring in new economic elites from these emerging sectors into the relationship that the political elite had with the business sector. In addition, with the rise of non-traditional business groups in southern and western India, there was a growing diversification of business ownership, leading to a broadening of the political connectivity of the business elite (Mehta and Walton 2014). Therefore, by the late 1980s, the macro-level deals environment had already become distinctly ‘ordered’ and more open, with the emergence of new economic elites in both modern sectors and in regions outside the industrial heartlands of Gujarat and Maharashtra.
6.1 The 1993 growth acceleration episode
Two further developments in the early 1990s led to a strengthening of the ordered nature of the deals environment, particularly at the micro level.8 First, the dismantling of the industrial licensing system in 1991 removed an important source of ‘disorder’ in the deals environment at the micro level. This development ensured that the approval of applications that firms made for their expansion or that new firms made to enter the industrial sector during the previous licensing regime no longer depended on the whims and fancies of individual bureaucrats in the government. Secondly, the removal of the import licensing system in the early 1990s for most commodities also meant that the highly discretionary and case-by-case nature of imports that were not on Open General Licence was done away with. As Bhagwati (1993: 50) noted:
‘the industrial-cum-trade licensing system … had degenerated into a series of arbitrary, indeed inherently arbitrary, decisions, where for instance one activity would be chosen over another simply because the administering bureaucrats were so empowered and indeed obligated to choose.’
The growth acceleration of 1993 was in great part due to the ‘ordered deals’ environment that had already taken shape in the 1980s and was enhanced by the dismantling of the industrial-cum-trade licensing system in 1991.9 These deals were largely open, as barriers of entry to many industries were removed. This was reflected in the entry of new firms in manufacturing and services, and especially in pharmaceuticals and IT (Alfaro and Chari 2009). At the same time, the Indian state’s collusive relationship with certain sections of the business elite in the pre-reform period remained, and may have been accentuated by the
8 This section and the next section are based on a set of key informant interviews we have done with economic actors, such as industrialists and business associations, as well as former bureaucrats in economic ministries and journalists, and document analysis. 9 It should be noted here that we are not comparing the deals environment of 1993-2002 just to the immediate pre-1993 period, where elements of ‘ordered deals’ could be observed, but to the entire period 1950-1993, which by and large was a disordered deals environment in India. For much of this period, there was significant investor uncertainty brought about by nationalisation episodes and the ambiguous attitude of the political elite towards private capital.

The political economy of economic growth in India, 1993-2013
30
rise of increasingly powerful regional business groups closely connected with regional political elites (Mehta and Walton 2014). Thus, during the 1990s, closed deals existed side by side with open deals and, consequently, many traditional industries (such as consumer durables) were still dominated by entrenched business groups that had emerged in the licence raj (Alfaro and Chari 2009). There is evidence from detailed firm-level analysis of the 1990s of significant dynamism in the corporate sector in this period. Harrison et al. (2012) find a large allocation of market share from less productive firms to more productive firms in the first half of the 1990s, but not in subsequent years. Mody, Nath and Walton (2011) find new significant entry of new firms in virtually all industrial sectors in the early to mid-1990s, which stops in the late 1990s, with very little new firm entry in the 2000s.10 Kathuria, Raj and Sen (2010) show that the improvement in productivity performance in the manufacturing sector in the 1990s was not confined to the formal sector, but encompassed the informal sector as well. The dynamism that one observes in the private sector in the 1990s is also reflected in indicators of growth and structural transformation, as noted in Section 4. Thus, in the 1993-2002 growth acceleration phase, economic growth was mostly driven by the exporting competitive sectors (such as IT and chemicals) and domestically oriented service sectors, such as hotels and restaurants (see Tables 1 and 2).11
7. Understanding the post-2002 growth episodes
There were two distinct growth episodes in the post-2002 period: (1) a further growth acceleration episode from 2002 to 2010; and (2) an incipient growth deceleration from 2011 onwards. We discuss the features of these two episodes in turn.
7.1 The 2002-2010 growth acceleration episode
In the 2002-2010 episode, India’s per capita economic growth (6.42 percent per annum) was faster than during 1993-2002 (4.15 percent per annum on average). However, there was a shift in the pattern of growth towards non-tradeable sectors such as construction, communications, and banking and insurance – the average growth rates of these sectors in 2002-2010 were 8.6, 23.1, and 11.2 percent, respectively, as compared to 3.4, 15.7 and 7.4 percent in 1993-2002 (see Table 1). Within the manufacturing sector, as discussed in Section 4, the importance of the refined petroleum sector in total gross real value added also increased sharply, with its share increasing from 5.6 percent in 1993-2001 to 13.0 percent in 2002-2007 (see Table 3). Also, as discussed in Section 4, there was also a shift in India’s exports towards more resource-intensive sectors, and a decline in the Hausmann-Hidalgo
10However, as Goldberg et al. (2010) show, much of the product churning in the 1990s was due to product additions rather than product shedding. In this sense, India’s experience of the 1990s with ‘creative destruction’ was more ‘creative’ and less ‘destruction’. 11 While the shift to a more ordered deals environment at the micro level was the key contributory factor, in our view, for the growth acceleration of 1993, there were also other important contributory factors, related to policy reforms, such as removal of barriers to entry in manufacturing, as well as the large increase in opportunity for the Magician and Workhorse sectors to grow.

The political economy of economic growth in India, 1993-2013
31
measure of structural transformation in this growth episode. Thus, economic growth in the second growth episode was qualitatively different from the first episode, in that it relied more on Rentier sectors (such as mining and petroleum refining) and other high rent Powerbroker sectors (such as telecommunications and real estate), along with a reversal in structural transformation of the economy (as reflected in decreasing product complexity of India’s exports). There was, however, strong growth in Magician sectors such as IT (or business) services. At the same time, there was a larger increase in new firm entry during the 1993-2002 episode than in the 2002-2010 episode – a 53 percent increase in new firms in the 1993-2002 episode, and 9.8 percent decrease in new firms in the post-2002 period, as seen in Table 5 (Alfaro and Chari 2009). Table 5. Entry of new firms, 1988-2005
Period Pre-1993 (1988-90)
Post-1993 (1995-98)
Post-2002 (2003-05)
Number of private firms
10,582 16,136 14,495
Growth in number of firms
52.5% -9.8%
Ratio of old firms 64% 39% 36%
Ratio of new firms 26% 52% 56%
Old-to-new firms ration
250% 75% 64%
Source: Calculated from Alfaro and Chari (2009), NBER Working Paper.
There was also a shift in the deals environment in this period from relatively open to closed deals. This was most evident in the increasing level of ‘crony capitalist’ deals that political elites struck with economic elites in ‘high rent’ natural resource sectors such as bauxite, coal, iron ore, manganese ore and natural gas, at both national and regional levels.12 In various ore-rich states, such as Jharkhand, Karnataka, Goa and Odisha, influential, politically connected business elites systematically underpaid mining royalties to state agencies (along with extracting iron and bauxite in excess of the amounts stipulated by the leases that the private mining firms held with the state governments). 13 There was a succession of such scams, highlighted by the media.
12 It is important to make the point that the rents that were obtained from deals in the Rentier and Powerbroker sectors do not always lead to outright corruption, as we have observed in other country contexts, such as in Korea. Economic rents, as conventionally defined, are the surpluses over cost of production to a factor of production. Except for Schumpeterian rents (which are due to innovation and are temporary, as they dissipate away with new firm entry), there is a discretionary aspect in how this surplus is generated, and typically it is the political elite which exercises this discretionary power. The high rents in the post-2002 growth episode were linked to this discretionary power, but not in all cases were these rents for private monetary gains (e.g. the allocation of land on a preferential basis to industrialists in states such as Gujarat). 13 While we do not do this in the paper, an avenue for further research is to quantify the extent of the relationship between economic actors and political elites in India, as has been done for Egypt recently (see Diwan et al. 2014).

The political economy of economic growth in India, 1993-2013
32
In 2010, the central government constituted a commission to investigate irregularities in the extraction, trade and transportation of iron ore and manganese ore across the country. It was headed by Justice M. B. Shah of the Supreme Court of India. The Commission found evidence of ‘enormous and large-scale multi-stage illegal mining of iron ore and manganese ore running into thousands of crores of rupees every year’ (Shah Commission 2012: 1). The Shah Commission also found clear evidence of collusion between ruling politicians at the state and national level and private mining firms, stating that ‘the State has “gifted” property of thousands of crores in the hands of private companies/firms/individuals’ (Shah Commission 2012: 604). There were similar concerns in the allocation of licences for coal deposit blocks to private firms by the central government in the period 2004-2011, which were done preferentially at lower than market rates, instead of a competitive bidding process, according to investigations on the nature of the allocation process by the Comptroller and Auditor General (CAG). The existence of ‘closed deals’ was not confined only to natural resource sectors; it was also evident in an infrastructural sector such as telecommunications. The latter sector witnessed impressive growth in the 1993-2002 growth episode, driven by high demand for mobile phones among a rapidly expanding middle class. In 2008, under the aegis of the Ministry of Telecommunications (MOT), the Department of Telecommunications (DoT) decided to allocate second generation (2G) spectrum licences to mobile phone operators on a first come first served (FCFS) basis at a price significantly below the market price. Later investigation by the CAG found clear evidence of insider information being passed to selected private firms on the timing of the FCFS announcement, as well as the very short time given to submit the applications (Guha Thakurta and Kaushal 2010). The CAG (2011) also found irregularities in the MOT’s selective interpretation of the recommendation of the telecommunications regulator, the Telecom Regulatory Authority of India (TRAI), which led it not to conduct a competitive bidding process for award of the 2G licences. The CAG estimated the loss to the Indian exchequer due to the under-pricing of 2G licences at over Rs 176,000 crores. There were four factors that led to the emergence of a closed deals environment in the post-2002 growth episode, as compared to a more open deals environment in the earlier growth episode. First, with increased demand for minerals originating from China, there was a sharp increase in the price of several minerals in the early to mid-2000s. This is evident from Figure 13 for iron ore; the price of this commodity increased rapidly from 2005 to 2010, before declining in 2011-2013. Consequently, increasing profits could be made in natural resource sectors, where the state had the power to allocate licences for production to private firms. (In contrast, after the 1991 economic reforms, licences were no longer required to start operations in manufacturing or in services sectors such as IT). Therefore, there were clear incentives for political elites to preferentially allocate these licences to selected economic elites on terms that were neither transparent nor the most economically competitive, in return for extra-legal monetary rewards.

The political economy of economic growth in India, 1993-2013
33
Figure 13. World price of iron ore, monthly, 1999 to 2013
Source: Index Mundi.14 Secondly, as rapid economic growth in the previous growth episode spurred an increase in demand for the services of infrastructural sectors such as telecommunications (naturally oligopolistic and characteristically high rent), political elites entered into rent-sharing arrangements with business groups that were awarded contracts to operate in these sectors. Strong private sector growth fuelled a similar surge in demand for commercial real estate, and there were increasing signs of ‘closed deals’ between political elites and real estate developers in the allocation of land for commercial real estate (Nagaraj 2013).15 This is evident from Figure 14, where one observes a clear increase in the proportion of wealth of Indian billionaires originating in the Rentier and Powerbroker sectors (primarily real estate, construction, mining, infrastructure) as compared to the Magician sector (manufacturing, IT), from 2002. Thirdly, with the increased fractionalisation of the political system at the national level (as we discussed in Section 5), and the growing importance of regional political elites in the coalition governments of the 2000s, ‘closed deals’ between these elites and powerful economic interests, both at the national and regional levels, become more prevalent in the post-2002 period. This was accentuated by the rapid turnover of governments and closely contested elections, both at the national and regional levels, which led to a shortening of the
14 http://www.indexmundi.com/commodities/?commodity=iron-ore, accessed 1 February 2014. 15 Our analysis suggests that while the end of the Licence Raj meant that the scope for rent-seeking among bureaucrats decreased, there was a countervailing upward pressure on rent-seeking behaviour with the rapid economic growth of the 1990s. This led to the possibility of high rents in sectors that were impacted by economic growth, such as real estate and telecommunications.

The political economy of economic growth in India, 1993-2013
34
Figure 14. Distribution of wealth of billionaires by sources of wealth, 1996-2012, India
Source: Gandhi and Walton (2012). time horizon of political elites, who were more interested in finding ways to extract rents to finance elections that they would have to fight in the immediate future. Fourth, related to the previous point, election campaigns became increasingly expensive, as in the competitive Indian political system political parties tried to outspend each other to attract voters with various inducements. Reforms in Indian election expenditure laws in 1975 and 2003 put the expenditures of parties and supporters of individual candidates outside the purview of the expenditure limits on these candidates and banned corporate donations. These led to increased informal financing of election campaigns, and a greater reliance on informal deals to finance costly election campaigns. This was also reflected in the increasing participation of criminals in electoral politics, as political parties preferred wealthy candidates who had the ‘deep pockets’ to finance their own campaigns. The growing reliance of informal private funding in the absence of state funding also meant that parties and politicians raised funds from businesses informally in return for discretionary contracts and regulatory favours (Gowda and Sridharan 2012).
7.2 Post-2010 growth slowdown
As is well known by now, Indian per capita economic growth slipped from 6.42 percent during 2002-10 to 3.4 percent over 2011–2013. It is, of course, possible to have a turnaround in the future that makes up for the slowdown, but in all probability – when we have sufficient time series data in future – this period would still show up as an episode of deceleration.16 In this section, we analyse in terms of our deals framework why this deceleration took place. The conventional analysis of this phenomenon attributed the slowdown to a combination of external and internal factors, namely the global economic slowdown or macroeconomic
16 In the Indian context, given that the slowdown has mostly occurred in key growth sectors such as manufacturing and tradeable services, this suggests that in terms of Figure 1 in our paper, this would be a transition from a rapid growth phase to a phase of growth stagnation, if the slowdown was to continue for a few more years.
The political economy of economic growth in India, 1993-2013
35
policy (mainly a tight monetary policy), or recessionary expectations as a result of these. However, these explanations are either inadequate or incomplete. For example, although the global slowdown and the resultant recessionary expectations are definitely important factors, the IMF (2014) finds that two-thirds of India’s slowdown is due to internal problems, and not to a worsening external environment. Similarly, tighter monetary policy is not really the problem, as shown by Tokuoka (2012) and Anand and Tulin (2014). An alternative explanation, based on institutional factors like ‘policy paralysis’ within the bureaucracy and loss of 'investor confidence' due to policy uncertainty over natural resources, have been put forward, both in the academic literature (Tokuoka (2012), Anand and Tulin (2014)) and in the popular media. However, these institutional explanations are completely ad hoc and hence incomplete, treating ‘policy paralysis’ and ‘low investor confidence’ as unexpected shocks rather than an outcome of the growth process itself. The deals framework, on the other hand, relates this institutional ‘paralysis’ to the negative feedback effects from the closed ordered deals that characterised the 2002–2010 growth episode. As we have discussed earlier, a closed deals environment that is thought to be exclusionary by the non-elites (e.g., one with high rates of profit, but not high on employment generation, or which involves aquisition of land from non-elites) can lead to a negative political feedback that challenges the political settlement between political and business elites. In terms of the institutional framework, these challenges may disrupt ordered deals, which may result in a disordered deals environment. In the Indian case, this effect became stronger because, together with the high rent in the closed deals sector, there were also major cases of corruption against the political elite. These cases of corruption were mostly observed in Rentier and Powerbroker sectors, where there were high rents to be shared between economic and political elites. As media accounts of corruption became widespread, and there was growing popular discontent at the flagrantly excessive levels of rents shared between political and economic elites in these deals, state legitimacy was being gradually eroded towards the end of the 2002-2010 growth episode. The negative feedback from the closed ordered deals environment in India during 2002-10 –that ultimately disrupted this orderliness post-2010 and turned it into a disordered deals environment – worked through two different channels. The first was through the mobilisation of the non-elites against both forced acquisition and corruption. There were strong social and political movements of the masses against the attempts by the political elite, in states such as Odisha and West Bengal, to obtain land through extra-legal and often coercive means for mining or for providing land to large business groups to set up manufacturing plants. The movement led by Anna Hazare is an important example of the mobilisation against corruption. All these cases significantly destabilised the ordered deals environment as they eroded the credibility of the political elites in terms of their capacity to deliver on the deals. The second channel that transmitted negative feedback on the institutional environment worked through the coming together of the accountability institutions – the CAG, the CBI and the judiciary. Important examples of this are the Supreme Court of India banning iron ore exports, and the CAG investigating corruption in the allocation of 2G and coal block licences. These again eroded the deals environment by raising the possibility of all deals being challenged and scrutinised legally, thus pushing the economy back to a disordered deals world – paradoxically by the action of formal accountability structures.

The political economy of economic growth in India, 1993-2013
36
All these developments made the ‘closed deals’ environment unsustainable towards the end of the first decade of the 2000s. In addition, with increasing uncertainty over the nature of deals, and as the ruling party at the centre lacked the authority to credibly commit to new deals in the face of both popular and legal challenges, deals became increasingly disordered as well.17 This is evident from the behaviour of investor perception of the risk of investment. After rapid improvement in the 1990s (except for a drop during 1998-2000) and during 2000-2005, investor perception of the viability of contracts started falling from 2006 onwards. This suggests that, towards the end of the 2002–2010 growth episode, investors were increasingly concerned about the credibility of deals (Figure 11). In addition, in Figure 15, we plot investors' perception of the viability of contracts, which captures the risk of expropriation – a measure of institutional quality widely used in the literature (e.g. Acemoglu et al. 2001), as well as the probability of the repudiation of contracts. We note a sharp drop in this measure of investors' perception of institutional quality pertaining to investment from 2011 onwards. Thus, the post-2002 episodes were qualitatively different from the 1993-2002 episode, in that the deals environment had shifted decisively from being open to being closed and, as we progressed into the 2000s, from ordered to disordered deals as well. This was also reflected in the increasing importance of natural resource sectors in India’s export basket, the importance of sectors such as construction in India’s economic growth, as well as a decline in structural transformation. As investor uncertainty increased, there was a fall in private corporate fixed investment in the second half of the 2000s and the rapid economic growth of the 2000s ended in 2010. It is premature to identify the slow growth period of 2011-2013 as the beginning of a growth deceleration episode, as there may well be a turnaround in economic growth in the post-2013 period. However, our discussion of the causes of ‘boom and bust’ growth in developing countries suggests that the decline in economic growth may well persist for some time to come and is not transitory.
17 The disorder was not limited only to the deals environment, as even in the rule-based world of taxation, the government brought in significant uncertainty by adopting retrospective taxation and General Anti-Avoidance Rules (GAAR).

The political economy of economic growth in India, 1993-2013
37
Figure 15. Evolution of investors’ perception of risks of investment in India
Note: the variable plotted is Investment Profile obtained from the International Country Risk Guide (ICRG) database, which captures the viability of contracts, the restrictions on repatriation of funds, and payment delays. Higher values imply lower risk. Source: Authors’ calculations from ICRG database.
Figure 16. Investors’ perception of the viability of contracts
Note: Higher values imply lower risk. Source: Authors’ calculations from ICRG database.
0.0
0.5
1.0
1.5
2.0
2.5
3.0
3.5
4.0
2001 2002 2003 2004 2005 2006 2007 2008 2009 2010 2011 2012 2013

The political economy of economic growth in India, 1993-2013
38
8. Conclusions
Sustained rapid economic growth of well over a decade is a feature that we do not observe frequently in developing countries. India’s per capita income gain over 1993-2011 is among the largest income gains in growth episodes witnessed in the developing world in the post-World War II period (Pritchett et al. 2014). Yet, there are clear signs that India’s growth acceleration ended in 2010. In this paper, we examine the political and institutional causes of India’s growth acceleration and its possible end. We argue that India’s post-reform growth experience can be separated into three distinct growth episodes: the first growth episode was from 1993 to 2002 and characterised by a set of relatively open ‘ordered’ deals between political and economic elites. The second episode was from 2002 to 2010 and deals in this period became increasingly closed, leading to pushback from accountability institutions and the middle class. The third episode, beginning in 2011, was one of an incipient growth deceleration, and was characterised by increasingly disordered deals. We argue that this is the outcome of two separate phenomena: 1. increasing political de-legitimation of the growth process that was seen as highly predatory and corruption-intensive; and 2. pushback from accountability institutions in the post-2010 period, leading to greater uncertainty in the deals environment in 2011-2014. Our analysis of the Indian growth experience provides support for the conceptual framework we have used here and our other ESID growth studies.18 The wider implication of our analysis is that economic growth in most developing country contexts remains episodic and prone to collapse, as institutions do not evolve over the growth process and, in many instances, deteriorate. Our analysis suggests that the move from limited access to open access orders (North et al. 2009), or from growth processes that rely on informal institutions to growth processes that rely on formal institutions, is not pre-determined or linear. Shifts back and forth from good transitions in growth to bad transitions in growth are common in developing countries with weak formal institutions; sustained rapid economic growth that can take a country from low-income to middle-income status still remains a distant possibility in many country contexts. The Indian case study illustrates the point that, even for a so-called miracle growth country such as India, growth reversals are very much possible, if institutions do not improve in the growth process.
18 See Pritchett and Werker (2013), Sen (2013), Kelsall and Seiha (2014) and Said and Singini (2014).

The political economy of economic growth in India, 1993-2013
39
References Alfaro, L. and Chari, A. (2009). ‘India transformed? Insights from the firm level 1988-
2005’. NBER Working Papers 15448, National Bureau of Economic Research, Inc.
Acemoglu, D., Johnson, S. and Robinson, J. (2001). ‘The colonial origins of
comparative development’, American Economic Review, 91, 1369-1401. Acemoglu, D. and Robinson, J. (2008). ‘The role of institutions in growth and
development’, Working Paper No. 10, Commission for Growth and Development, Washington, DC.
Adeney, K. and Wyatt, A. (2010). Contemporary India. London: Palgrave Macmillan. Anand, R. and Tulin, V. (2014). ‘Disentangling India’s growth slowdown’, IMF
Working Paper, www.imf.org. Bai, J. and Perron, P. (1998). ‘Estimating and testing linear models with multiple
structural change’, Econometrica, 66, 47-78. Balakrishnan, P. and Parameswaran, M. (2007). ‘Understanding economic growth in
India: A prerequisite’, Economic and Political Weekly, 14 July, 2915-2921. Bhagwati, J. (1993). India in Transition. Oxford: Oxford University Press. Comptroller and Auditor General (CAG, 2011). Report No. -19 of 2010-11 for the
period ended March 2010 Performance Audit of Issue of Licences and Allocation of 2G Spectrum by the Department of Telecommunications (Ministry of Communications and Information Technology). Available online at: http://www.saiindia.gov.in/english/home/Our_Products/Audit_Report/Government_Wise/union_audit/recent_reports/union_performance/2010_2011/Civil_%20Performance_Audits/Report_no_19/Report_no_19.html.
De Long, J. B. (2003). ‘India since Independence: An analytical growth narrative’, in
D. Rodrik (ed.), In Search of Prosperity: Analytical Narratives on Economic Growth, Princeton, NJ: Princeton University Press.
Diwan, I., P. Keefer and M. Schiffbauer (2014). ‘Cronyism and private sector growth
in Egypt’, mimeo. Gandhi, A. and Walton, M. (2012). ‘Where do India’s billionaires get their wealth?’
XLVII(40), 6 October, 1-15.

The political economy of economic growth in India, 1993-2013
40
Ghate, C. and Wright, S. (2012). ‘The “V-factor”: Distribution, timing and correlates of the great Indian growth turnaround’, Journal of Development Economics, 99(1), 58-67.
Goldberg, P., Khandelwal, A., Pavnik, N. and Topalova, P. (2010). ‘Multi-product and
product turnover in the developing world: Evidence from India’. Review of Economics and Statistics, 92(4), 1042-1049.
Gowda, R. and Sridharan, E. (2012). ‘Reforming India’s Party Financing and Election
Expenditure Laws’, Election Law Journal, 11(2), 226-240. Guha Thakurta, P. and Kaushal, A. (2010). ‘Underbelly of the great Indian telecom
revolution’, Economic and Political Weekly, 4 December 4, XLV(49), 49-55. Harrison, A., Martin, L. A. and Nataraj, S. (2012). ‘Learning versus stealing: How
important are market-share reallocations to India’s productivity growth’, World Bank Economic Review, 27(1), 2012-228.
Hidalgo, C., Klinger, L. Barabasi, A-L. and Hausmann, R. (2007). ‘The product space
conditions the development of nations’, Science, 307, 482-487. International Monetary Fund (IMF, 2014). India: Article IV Consultation, available at
www.imf.org. Jones, B. and Olken, B. (2008). ‘The anatomy of start-stop growth’, Review of
Economics and Statistics, 90(3), 582-587. Joshi, V. and Little, I. M. D. (1994). India: Macroeconomics and Political Economy,
1964-1991. Delhi: Oxford University Press. Kar, S., Pritchett, L., Raihan, S. and Sen, K. (2013a). The Dynamics of Economic
Growth: A Visual Handbook of Growth Rates, Regimes, Transitions and Volatility, Effective States and Inclusive Development (ESID) Research Centre: University of Manchester, available at: http://www.effective-states.org/.
Kar, S., Pritchett, L., Raihan, S. and Sen, K. (2013b). ‘Looking for a break: Identifying
transitions in growth regimes’, Journal of Macroeconomics, 38, 151-166. Kathuria, V. Raj, R. S. N. and Sen, K. (2010). ‘Organised versus unorganised
manufacturing performance growth in the post-reform period’, Economic and Political Weekly, XV(24), 55-64.

The political economy of economic growth in India, 1993-2013
41
Kelsall, T., and Seiha, H. (2014), ‘The political settlement and economic growth in Cambodia’, ESID Working Paper No.37, www.effective-states.org
Kohli, A. (2012). Poverty amid Plenty in the New India. Cambridge: Cambridge
University Press. Mehta, P. B. and Walton, M. (2014). 'Ideas, interests and the politics of
development change in India', Effective States and Inclusive Development Working Paper No. 36, www.effective-states.org.
Mody, A., Nath, A. and Walton, M. (2011). ‘Sources of corporate profits in India:
Business dynamism or advantages of entrenchment?’ in S. Bery, B. Bosworth and A. Panagariya (eds.), India Policy Forum 2010-2011. Washington, DC: Brookings Institute.
Nagaraj, R. (2013). ‘India’s dream run, 2003-2008: Understanding the boom and its
aftermath’, Economic and Political Weekly, XLVIII(20), 18 May, 10-18. North, D. N., Wallis, J. J. and Weingast, B. R. (2009). Violence and Social Orders.
Cambridge: Cambridge University Press. Pritchett, L. (2000). ‘Understanding patterns of economic growth: Searching for hills
among plateaus, mountains and plains’, World Bank Economic Review, 14(2), 221-250.
Pritchett, L. and Werker, E. (2013). ‘Developing the guts of GUT (Grand Unified
Theory): Elite commitment and inclusive growth’, ESID Working Paper No. 16, www.effective-states.org.
Pritchett, L., Sen, K., Kar, S. and Raihan, S. (2014). ‘Trillions gained and lost:
Estimating the magnitude of growth episodes’, ESID Working Paper No. 26, www.effective-states.org.
Rodrik, D. (2005). ‘Growth strategies’, in P. Aghion and S. Durlauf (eds.), Handbook
of Economic Growth. Amsterdam: Elsevier. Rodrik, D. (2014). ‘An African Growth Miracle?’, mimeo. Rodrik, D. and Subramanian, A. (2004). ‘From Hindu growth to productivity surge:
The myth of the Indian growth transition’, NBER Working Paper No. W10376. Said, J., and Singini, K. (2014). ‘The political economy determinants of economic
growth in Malawi’, ESID Working Paper No. 40, www.effective-states.org

The political economy of economic growth in India, 1993-2013
42
Shah Comission (2012). Final Report on Illegal Mining in the State of Goa, Government of India.
Sen, K. (2007). ‘Why did the elephant start to trot? India’s growth acceleration re-
examined’, Economic and Political Weekly, 43, 37-49. Sen, K. (2009), ‘What a long, strange trip it’s been: Reflections on the causes of
India’s growth miracle’, Contemporary South Asia, 2009, 17(4), 363-377. Sen, K. (2013). ‘The political dynamics of economic growth’, World Development, 47,
71–86. Tokuoka, K. (2012). ‘Does the business environment affect corporate investment in
India?’ IMF Working Paper No 12/70, www.imf.org. Varshney, A. (1999). ‘Mass politics or elite politics: India’s reforms in comparative
perspective’, in J. D. Sachs, A. Varshney and N. Bajpai (eds.), India in the Era of Economic Reforms (Delhi: Oxford University Press).

email: [email protected] Effective States and Inclusive Development Research Centre (ESID) School of Environment and Development, The University of Manchester, Oxford Road,
Manchester M13 9PL, UK www.effective-states.org
The Effective States and Inclusive Development Research Centre The Effective States and Inclusive Development Research Centre (ESID) aims to improve the use of governance research evidence in decision-making. Our key focus is on the role of state effectiveness and elite commitment in achieving inclusive development and social justice.
ESID is a partnership of highly reputed research and policy institutes based in Africa, Asia, Europe and North America. The lead institution is the University of Manchester.
The other institutional partners are:
• BRAC Institute of Governance and Development, BRAC University, Dhaka
• Center for Democratic Development, Accra
• Center for International Development, Harvard University, Boston
• Department of Political and Administrative Studies, University of Malawi, Zomba
• Graduate School of Development, Policy & Practice, Cape Town University
• Institute for Economic Growth, Delhi
In addition to its institutional partners, ESID has established a network of leading research collaborators and policy/uptake experts.