the political impact of media bias - econ l …econweb.umd.edu/~kaplan/wbpaper.pdfthe political...
TRANSCRIPT
The Political Impact of Media Bias
Stefano DellaVigna and Ethan Kaplan
Introduction
In a representative system of government, policy outcomes are affected by the political preferences and the beliefs of the voters. The media play a
key role in shaping these preferences and beliefs. They collect, summarize, and frame the information that voters use in their voting decisions.
As a result, many have expressed concern that the media may be able to systematically manipulate political beliefs. Media slant may bias voters and thereby bias policy decisions.
Concerns of this type are relevant in the United States (U.S.), given that over 70 percent of Americans believes that there is a great deal or a fair amount of media bias in news coverage (Pew 2004). Media bias is at least as common, if not more common, in countries with less media freedom than the U.S.
Is media bias necessarily a problem? The effect of media bias depends on how the audience processes the information presented by the media. If the audience is aware of the media bias and fi lters it from the information, distortions in reporting are unlikely to have large effects on voter beliefs (Bray and Kreps 1987). In this rational world, media bias does not persuade voters.
Alternate theories hold that media bias does persuade voters. This may occur because voters do not suffi ciently account for bias in the media (De Marzo, Vayanos, and Zwiebel 2003). This, in turn, may be a direct effect of the framing of the news (Lakoff 1987).
Ultimately, understanding the impact of media bias on voter beliefs and preferences is an empirical task. In this chapter, we fi rst review some of the
6
Bran Knight, Roumeen Islam, and participants of the World Bank conference on The Effects of Mass Media on Public Policy provided useful comments. Anitha Sivasankaran provided excellent research assistance.
79

80 Stefano DellaVigna and Ethan Kaplan
papers that have provided a measure of this impact. Most of these papers indicate that the media have a large impact. However, some of the fi ndings can also be explained by self-selection of voters into preferred media. For example, right-wing voters are more likely to expose themselves to right-wing media, giving an impression that the right-wing media persuades them. Other stud-ies provide evidence of an impact on self-reported voting, or stated voting in a laboratory experiment, as opposed to voting in actual elections.
In the rest of the chapter, we summarize the result of a natural experi-ment that addresses the question of the impact of media bias on political preferences. We draw on DellaVigna and Kaplan (2007), which examines the timing of the entry of the Fox News Channel into local cable markets and considers the impact of that entry on voting. Relative to DellaVigna and Kaplan (2007), we present new results on voter turnout for U.S. senatorial elections, as well as a more general analysis of persuasion rates.
Rupert Murdoch introduced the 24-hour Fox News Channel in October 1996. The channel expanded rapidly to reach 20 percent of U.S. cities and an audience of 17 percent of the population by June 2000 (Scarborough Research data). The decentralized nature of the cable industry induced sub-stantial geographical variation in access to the Fox News Channel. Since the channel is signifi cantly to the right of all other mainstream television networks (Groseclose and Milyo 2005), its introduction into a cable market is likely to have had a signifi cant effect on the available political infor-mation in that cable market. This is true whether the Fox News Channel represents the political center and the rest of the media the liberal wing, or whether it represents the right and the rest of the media the middle.
The entry of the Fox News Channel into the U.S. media market makes it likely that, on the one hand, the impact was plausibly large enough to be detected and, on the other hand, that it is possible to identify that impact separately from other confounding factors affecting elections.
In this chapter, we discuss our fi ndings on the impact of the Fox News Channel on voting patterns. The key fi nding is that we detect a signifi cant impact on voting for the Republican candidates. Media bias, therefore, affected voting, at least in the case of the Fox News Channel’s expansion. We discuss a variety of results ranging from the impact on the Republican vote share, the impact on voter turnout, regional variation in the impact, and the impact over a longer time horizon and on races that the channel did not explicitly cover.
To apply these results to other media markets, such as those in develop-ing countries, it is useful to obtain quantitative estimates of the persuasive
[AQ: Do you think it advisable to defi ne “right-wing” and “left-wing” and similar terms used throughout for a global audience?]

The Political Impact of Media Bias 81
impact of the media that are able to be generalized to other contexts. We use our estimates of the impact of the Fox News Channel to compute persua-sion rates, that is, the share of Democratic voters that switched to voting for Republican candidates because of exposure to Fox News. We also compute mobilization rates, that is, the share of nonvoters that turns out to vote because of exposure to the Fox News Channel. This section expands sub-stantially on the discussion of persuasion rates in DellaVigna and Kaplan (2007).
In our baseline calibration, we estimate that 4 to 8 percent of the audi-ence was persuaded to vote Republican because of this exposure. When we allow for a separate effect on nonvoters, we fi nd that the mobilization effect of the Fox News Channel may have accounted for one-sixth to one-hundred percent [AQ: confi rm large range] of the impact. We obtain simi-lar persuasion rates for the channel’s effect on U.S. senatorial elections. These estimates imply a sizeable impact of the media on political decisions. We conclude by discussing some limitations of our approach and some questions for future research on the impact of media bias on politics.
This chapter relates to the empirical literature on media bias (Herman and Chomsky 1998; Hamilton 2004; Groseclose and Milyo 2005; Puglisi 2004), as well as the theoretical literature on it (Mullainathan and Shleifer 2005; Gentzkow and Shapiro 2004). We provide evidence that exposure to media bias persuades voters, an implicit assumption underlying most of these papers.
Theoretical Predictions
We summarize here the key results of a model (DellaVigna and Kaplan 2006) that allows for two channels through which exposure to media news can affect voting. The fi rst channel captures rational learning and predicts that exposure to the media may have an impact on beliefs and voting only in the short-run. The second channel captures nonrational persuasion and implies that exposure to the media may affect beliefs and voting in the long-run.
We present fi rst the rational updating channel in the presence of a new media source whose bias may not be known. A media source injects bias into its coverage of a political candidate. For example, it reports more positive and less negative news about the Republican candidate. Rational viewers, knowing the exact extent of the bias, realize that bad news often is not reported and good news often is exaggerated. If the viewers have a good

82 Stefano DellaVigna and Ethan Kaplan
sense of the degree of the media source’s bias, they will take into account the bias and discount the news about the candidate. They will not on aver-age be persuaded by the biased news source.
The prediction differs if the bias of the media source is unknown. This is the case for television viewers who watch a new news source for the fi rst time. As in the case of the Fox News Channel, we consider the case of a new media source that is more positive to the Republicans than other media sources. Viewers watch reports about Republican candidates and fi nd the reports to be positive relative to what had been expected. Therefore, they alter their beliefs, thinking that the candidates are possibly high quality choices; also, however, they leave room for the possibility that the new media source might be biased to the right. Over time, as the viewers see a large number of positive reports about Republican candidates in com-parison with other media sources, they start to realize that the new media source’s bias is to the right of the average media source. Therefore, they take the updated bias into account when evaluating candidates. In the short run, therefore, they are persuaded by the new media source; in the long run, they learn about the bias and are no longer affected.
A second possibility is that nonrational viewers do not properly fi lter out the bias. For example, viewer may be able to learn the degree of the bias but do not realize the degree to which bias impacts reporting. System-atically then, this behavioral viewer places too little weight on the media source being biased and too much weight on the news reports of the media source. These behavioral viewers eventually learn the degree of bias of the media source but are nonetheless persuaded because they underweight the degree to which the bias of the source impacts news reports. In this behav-ioral scenario, the media has a permanent persuasive impact that does not decrease over time.
The two different theories—rational and behavioral—have similar short-run predictions but different long-run predictions. The fi rst predicts that the Fox News Channel’s effect will be temporary, and the second pre-dicts that it will be more lasting.
Estimates of the Impact of Media Bias
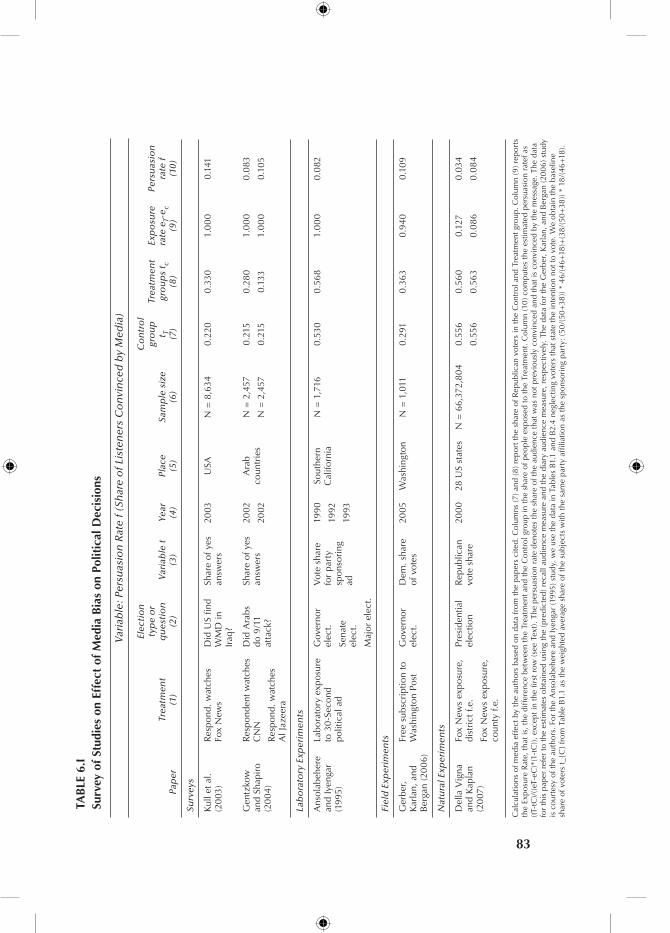
Table 6.1 summarizes a small number of key studies that examine the impact of media bias on political behavior and voting. The studies are grouped into four groups by the methodologies used: surveys, laboratory experiments, fi eld experiments, and natural experiments.
TAB
LE 6
.ISu
rvey
of
Stud
ies
on E
ffec
t of
Med
ia B
ias
on P
olit
ical
Dec
isio
ns
Var
iab
le: P
ersu
asio
n R
ate
f (Sh
are
of L
iste
ner
s C
on
vin
ced
by
Med
ia)
Pap
erTr
eatm
ent
(1)
Elec
tio
n
typ
e o
r q
ues
tio
n
(2)
Var
iab
le t
(3
)Ye
ar
(4)
Plac
e (5
)Sa
mp
le s
ize
(6)
Co
ntr
ol
gro
up
t T (7
)
Trea
tmen
t gr
ou
ps
t c (8
)
Exp
osu
re
rate
eT-
e c (9
)
Pers
uas
ion
ra
te f
(1
0)
Surv
eys
Kul
l et a
l. (2
003)
Res
pond
. wat
ches
Fo
x N
ews
Did
US
fi nd
WM
D in
Ir
aq?
Shar
e of
yes
an
swer
s20
03U
SAN
= 8
,634
0.22
00.
330
1.00
00.
141
Gen
tzko
w
and
Shap
iro
(200
4)
Res
pond
ent w
atch
es
CN
N
Res
pond
. wat
ches
A
l Jaz
eera
Did
Ara
bs
do 9
/11
atta
ck?
Shar
e of
yes
an
swer
s20
02
2002
Ara
b co
untr
ies
N =
2,4
57
N =
2,4
57
0.21
5
0.21
5
0.28
0
0.13
3
1.00
0
1.00
0
0.08
3
0.10
5
Lab
ora
tory
Exp
erim
ents
Ans
olab
eher
e an
d Iy
enga
r (1
995)
Labo
rato
ry e
xpos
ure
to 3
0-S
econ
d po
litic
al a
d
Gov
erno
r el
ect.
Sena
te
elec
t.
Maj
or e
lect
.
Vot
e sh
are
for
part
y sp
onso
ring
ad
1990
1992
1993
Sout
hern
C
alifo
rnia
N =
1,7
160.
530
0.56
81.
000
0.08
2
Fiel
d E
xper
imen
ts
Ger
ber,
Kar
lan,
and
B
erga
n (2
006)
Free
sub
scri
ptio
n to
W
ashi
ngto
n Po
stG
over
nor
elec
t.D
em. s
hare
of
vot
es20
05W
ashi
ngto
nN
= 1
,011
0.29
10.
363
0.94
00.
109
Nat
ura
l Exp
erim
ents
Del
la V
igna
an
d K
apla
n (2
007)
Fox
New
s ex
posu
re,
dist
rict
f.e.
Fox
New
s ex
posu
re,
coun
ty f.
e.
Pres
iden
tial
elec
tion
Rep
ublic
an
vote
sha
re20
0028
US
stat
esN
= 6
6,37
2,80
40.
556
0.55
6
0.56
0
0.56
3
0.12
7
0.08
6
0.03
4
0.08
4
Cal
cula
tions
of m
edia
eff
ect b
y th
e au
thor
s ba
sed
on d
ata
from
the
pape
rs c
ited.
Col
umns
(7) a
nd (
8) r
epor
t the
sha
re o
f Rep
ublic
an v
oter
s in
the
Con
trol
and
Tre
atm
ent g
roup
. Col
umn
(9) r
epor
ts
the
Expo
sure
Rat
e, t
hat i
s, t
he d
iffe
renc
e be
twee
n th
e Tr
eatm
ent a
nd t
he C
ontr
ol g
roup
in t
he s
hare
of p
eopl
e ex
pose
d to
the
Tre
atm
ent.
Col
umn
(10
) com
pute
s th
e es
timat
ed p
ersu
asio
n ra
tef a
s (tT
-tC
)/((
eT-e
C)*
(1-t
C))
, exc
ept i
n th
e fi r
st r
ow (
see
Text
). Th
e pe
rsua
sion
rat
e de
note
s th
e sh
are
of t
he a
udie
nce
that
was
not
pre
viou
sly
conv
ince
d an
d th
at is
con
vinc
ed b
y th
e m
essa
ge. T
he d
ata
for
this
pap
er r
efer
to t
he e
stim
ates
obt
aine
d us
ing
the
(pre
dict
ed) r
ecal
l aud
ienc
e m
easu
re a
nd t
he d
iary
aud
ienc
e m
easu
re, r
espe
ctiv
ely.
The
dat
a fo
r th
e G
erbe
r, K
arla
n, a
nd B
erga
n (2
006)
stu
dy
is c
ourt
esy
of t
he a
utho
rs. F
or t
he A
nsol
abeh
ere
and
Iyen
gar
(199
5) s
tudy
, we
use
the
data
in T
able
s B1
.1 a
nd B
2.4
negl
ectin
g vo
ters
tha
t sta
te t
he in
tent
ion
not t
o vo
te. W
e ob
tain
the
bas
elin
e sh
are
of v
oter
s t_
{C}
from
Tab
le B
1.1
as t
he w
eigh
ted
aver
age
shar
e of
the
sub
ject
s w
ith t
he s
ame
part
y af
fi lia
tion
as t
he s
pons
orin
g pa
rty:
(50
/(50
+38
)) *
46/(
46+1
8)+
(38
/(50
+38
)) *
18/(
46+1
8).
83
84 Stefano DellaVigna and Ethan Kaplan
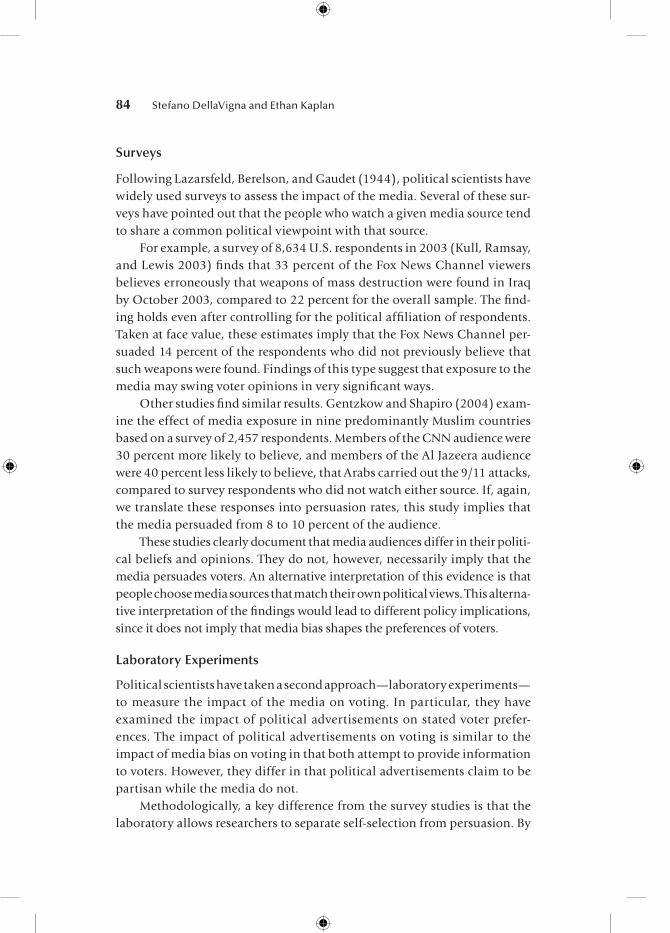
Surveys
Following Lazarsfeld, Berelson, and Gaudet (1944), political scientists have widely used surveys to assess the impact of the media. Several of these sur-veys have pointed out that the people who watch a given media source tend to share a common political viewpoint with that source.
For example, a survey of 8,634 U.S. respondents in 2003 (Kull, Ramsay, and Lewis 2003) fi nds that 33 percent of the Fox News Channel viewers believes erroneously that weapons of mass destruction were found in Iraq by October 2003, compared to 22 percent for the overall sample. The fi nd-ing holds even after controlling for the political affi liation of respondents. Taken at face value, these estimates imply that the Fox News Channel per-suaded 14 percent of the respondents who did not previously believe that such weapons were found. Findings of this type suggest that exposure to the media may swing voter opinions in very signifi cant ways.
Other studies fi nd similar results. Gentzkow and Shapiro (2004) exam-ine the effect of media exposure in nine predominantly Muslim countries based on a survey of 2,457 respondents. Members of the CNN audience were 30 percent more likely to believe, and members of the Al Jazeera audience were 40 percent less likely to believe, that Arabs carried out the 9/11 attacks, compared to survey respondents who did not watch either source. If, again, we translate these responses into persuasion rates, this study implies that the media persuaded from 8 to 10 percent of the audience.
These studies clearly document that media audiences differ in their politi-cal beliefs and opinions. They do not, however, necessarily imply that the media persuades voters. An alternative interpretation of this evidence is that people choose media sources that match their own political views. This alterna-tive interpretation of the fi ndings would lead to different policy implications, since it does not imply that media bias shapes the preferences of voters.
Laboratory Experiments
Political scientists have taken a second approach—laboratory experiments—to measure the impact of the media on voting. In particular, they have examined the impact of political advertisements on stated voter prefer-ences. The impact of political advertisements on voting is similar to the impact of media bias on voting in that both attempt to provide information to voters. However, they differ in that political advertisements claim to be partisan while the media do not.
Methodologically, a key difference from the survey studies is that the laboratory allows researchers to separate self-selection from persuasion. By

The Political Impact of Media Bias 85
randomly assigning subjects to groups watching different advertisements, researchers can estimate the causal impact of exposure to different political information.
In a classical study in this literature, Ansolabehere and Iyengar (1995) expose experimental subjects to 30-second political advertisements sup-porting a candidate or criticizing the opposite candidate. They elicit beliefs and voting intentions at the end of the experiment. The advertisements are embedded in longer news clips to make the exposure to the advertisement more credible and more externally valid.
While the impact of political advertisement differs for positive and neg-ative advertisements and depends on the content, in general Ansolabehre and Iyengar (1995) fi nd substantial effects of persuasion. We summarize the results of three experiments run in southern California involving adver-tisements for a gubernatorial race in 1990, a senatorial race in 1992, and a mayoral race in 1993. When the data are aggregated for the 1,716 subjects in these three experiments, the results indicate that exposure to one advertise-ment increases the stated vote share for the sponsoring party from .530 to .568. This is a sizeable persuasion effect, implying that the advertisements convinced 8 percent of the subjects who would not otherwise have done so to support the sponsoring party.
These experiments capture the causal effect of exposure to the media on voting intentions in the laboratory. It is less clear, however, that these fi ndings would translate into similar persuasion effects of the media in the fi eld. In the experiments, subjects state their voting intention immediately followed the advertising. If the impact of exposure to advertising is tempo-rary, advertisements in the fi eld would have a much more muted impact. In addition, these experiments do not measure actual voting. Statements of voting in the laboratory do not readily translate into actual votes. For example, survey respondents generally report much higher voting rates than appear in voting records. Finally, subjects may also respond differently in a laboratory setting, compared to the response in an election campaign.
For these reasons, while these experiments suggest very interesting pat-terns of the impact of the media, it is important to also collect evidence in the fi eld from media exposure in actual campaigns.
Field Experiments
Recently Gerber, Karlan, and Bergan (2006) performed a randomized experiment to look at the impact of media bias on voting patterns. In the fall of 2005, they randomly selected three groups of people from a county in

86 Stefano DellaVigna and Ethan Kaplan
Virginia at the time of the 2005 Virginia gubernatorial election. They gave a free subscription to the Washington Post (a purportedly left-leaning news-paper) to members of the fi rst group. [AQ: elaborate on “purportedly” and “right” and “left?] They gave a free subscription to the Washington Times (a purportedly right-leaning newspaper) to members of the second group. The third group was a control group whose members did not receive free subscriptions. A few months later, they surveyed the subscription recipi-ents and the control group members with respect to knowledge of current events, political viewpoints, and voting patterns. They found little statisti-cally signifi cant evidence on the impact of media bias on knowledge or viewpoints, but they did fi nd a signifi cant impact on self-reported voting.
The group assigned a subscription to the left-wing newspaper stated that they voted more heavily for the Democratic candidate in the Virginia gubernatorial election of 2005. They also fi nd that also the group assigned a subscription for the right-wing newspaper also voted more for the Demo-cratic candidate, albeit insignifi cantly so. They interpret decrease in sup-port for the Republicans by the group receiving the right-wing newspaper as due to an information provision (rather than bias) role for the media. The experiment took place at a time when a number of scandals reduced Republican popularity; exposure to these scandals reduced support for the Republicans.
A study of this type has a double advantage: it controls for self-selection by randomly allocating the newspapers, and it measures the impact in a real election. In this sense, it combines the advantages of the surveys and the advantages of the laboratory experiments. However, this study also has two drawbacks. First, the study does not measure actual voting, but only self-reported voting, which displays some known biases. Second, since fi eld experiments such as this are expensive to run, the sample size is necessarily small (1,011 subjects) and geographically concentrated in one county. This implies that the impacts of voting are assessed with substantial uncertainty and may not represent the impact over a different population.
The Impact of the Fox News Channel
We now report the results of a natural experiment on the exposure to media bias and its effects on voting. We summarize the results from the staggered timing of the entry of the Fox News Channel in local cable systems from DellaVigna and Kaplan (2007). In our view, natural experiments address the issues raised above for the other studies. As with the fi eld experiments

The Political Impact of Media Bias 87
and the surveys, we consider the impact of actual political information in the fi eld, avoiding the artifi cial setting of the laboratory. Unlike the above studies, we measure the impact using actual voting as opposed to self-reports. Finally, while the assignment of the media is not random as in the laboratory of fi eld experiments, we argue that it is quasi-random, allowing us to study the causal impact of media bias. Conditional on a set of controls, the availability of the new media of the Fox News Channel appears to be random.
Introduction to the Market
Rupert Murdoch introduced the 24-hour Fox News Channel in October 1996 to compete with CNN. Like CNN, it was offered via cable and, to a smaller extent, via satellite. The introduction has three features that make it a par-ticularly appropriate case to study to estimate the impact of media bias.
First, the expansion of the Fox News Channel was very fast. Thanks to an aggressive marketing campaign, a number of cable companies added the channel to their programming over the next four years. The geographical expansion was accompanied by a corresponding increase in the audience share. By June 2000, less than four years after the introduction, 17.3 percent of the U.S. population reported watching the Fox News Channel regularly. The speed of the expansion implies that the pre-Fox News Channel period (year 1996) and the post-Fox News Channel period (year 2000) are reason-ably comparable.
Second, the expansion was geographically differentiated. Cable mar-kets are natural monopolies with capacity constraints on the number of channels. The availability of the Fox News Channel in 2000 in a town depended on whether the local cable company decided to add it to the pro-gramming, possibly at the expense of another channel. Cable companies in neighboring towns adopted the Fox News Channel in different years, cre-ating idiosyncratic differences in access. This allows us to compare voting patterns in neighboring towns that are similar except for the availability of the channel. The comparison at a very fi ne geographical level makes it less likely that confounding factors affect the estimates. While we do not have an instrument for the availability of the Fox News Channel, we document below that its introduction appears to be idiosyncratic, conditional on a set of controls.
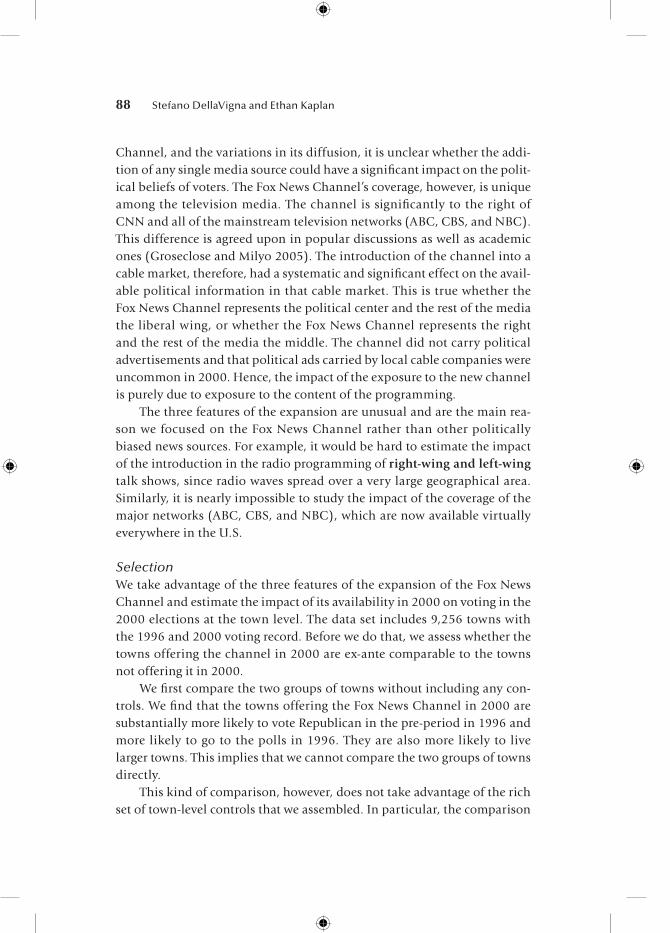
Third, the expansion altered the political news coverage in a cable market. Even given the sudden expansion and popularity of the Fox News
88 Stefano DellaVigna and Ethan Kaplan
Channel, and the variations in its diffusion, it is unclear whether the addi-tion of any single media source could have a signifi cant impact on the polit-ical beliefs of voters. The Fox News Channel’s coverage, however, is unique among the television media. The channel is signifi cantly to the right of CNN and all of the mainstream television networks (ABC, CBS, and NBC). This difference is agreed upon in popular discussions as well as academic ones (Groseclose and Milyo 2005). The introduction of the channel into a cable market, therefore, had a systematic and signifi cant effect on the avail-able political information in that cable market. This is true whether the Fox News Channel represents the political center and the rest of the media the liberal wing, or whether the Fox News Channel represents the right and the rest of the media the middle. The channel did not carry political advertisements and that political ads carried by local cable companies were uncommon in 2000. Hence, the impact of the exposure to the new channel is purely due to exposure to the content of the programming.
The three features of the expansion are unusual and are the main rea-son we focused on the Fox News Channel rather than other politically biased news sources. For example, it would be hard to estimate the impact of the introduction in the radio programming of right-wing and left-wing talk shows, since radio waves spread over a very large geographical area. Similarly, it is nearly impossible to study the impact of the coverage of the major networks (ABC, CBS, and NBC), which are now available virtually everywhere in the U.S.
SelectionWe take advantage of the three features of the expansion of the Fox News Channel and estimate the impact of its availability in 2000 on voting in the 2000 elections at the town level. The data set includes 9,256 towns with the 1996 and 2000 voting record. Before we do that, we assess whether the towns offering the channel in 2000 are ex-ante comparable to the towns not offering it in 2000.
We fi rst compare the two groups of towns without including any con-trols. We fi nd that the towns offering the Fox News Channel in 2000 are substantially more likely to vote Republican in the pre-period in 1996 and more likely to go to the polls in 1996. They are also more likely to live larger towns. This implies that we cannot compare the two groups of towns directly.
This kind of comparison, however, does not take advantage of the rich set of town-level controls that we assembled. In particular, the comparison

The Political Impact of Media Bias 89
is not limited to geographical neighbors and cable systems with a simi-lar number of channels. Next, we exploit the detailed town-level controls and introduce controls for the cable system and for county fi xed effects or congressional district fi xed effects. The introduction of these detailed geo-graphical controls (fi xed effects) implies that we compare towns with and without the Fox News Channel within a county and within a U.S. congres-sional district.
When we make the comparison conditional on these controls, there is no evidence that towns with higher Republican vote share in 1996, or higher turnout, are more likely to offer the Fox News Channel in 2000. Moreover, once we control for geographic heterogeneity and size of the cable system, the availability of the Fox News Channel in 2000 is uncor-related with town-level demographic controls from the 1990 and 2000 U.S. Census, such as population, income, ethnic composition, education, and unemployment rate.
To summarize the fi ndings, while overall the availability of the Fox News Channel is highly selective—the channel enters into larger markets and, given the town size, into more Republican areas—conditional on cable market size, the assignment to towns within an area (county or congressio-nal district) is essentially random. This implies that, as long as we include the controls for geography and cable size, we can estimate the causal effect of the introduction of a new media by comparing towns with and without the Fox News Channel in 2000.
Impact on Voting in Presidential Elections
Next, we come to the main analysis. We consider the impact of the entry of the Fox News Channel on the change in the Republican vote share between 1996 and 2000 at the town level, conditional on the control variables described. This strategy exploits the timing of the entry. By the November 1996 elections, the Fox News Channel had been launched in only a few markets; even in those markets, the launch was only one month before the elections. By the November 2000 elections, the channel had an audience that was smaller than, but nonetheless comparable to, that of CNN.
We compare the change in Republican vote share between 1996 and 2000 for towns with the Fox News Channel in 2000 and towns without the channel in 2000, weighting for number of voters. This uses a standard differences-in-differences methodology in that it compares the change over time (fi rst difference) for the towns with the Fox News Channel versus
90 Stefano DellaVigna and Ethan Kaplan
the towns without (second difference). This tests whether or not exposure to the channell, and more in general to politically biased media, leads to persuasion.
The results are reported in Table 6.2, column one. Formally, we esti-mate the specifi cation as follows:
v v dkR
kR
F kFOX
,2000es
,1996es,Pr ,Pr
,− = + +α β 2000 ΓΓXk g k+ +η ε (4.1)
where v vkR
kR
,2000es
,1996es,Pr ,Pr− denotes the change in the two-party Republican
vote sharebetween the year 1996 and the year 2000. The set of controls Xk includes town-level demographic variables from the 1990 and 2000 U.S. Census, as well as controls for features of the cable system in the town (number of channels provided and in the number of potential subscribers). In addition, the specifi cation includes a set of geographical fi xed effects hg, at the U.S. congressional district level in panel A and at the county level in panel B. The fi xed effects and the control help to ensure the comparability of towns with and without the Fox News Channel. In the specifi cation with district fi xed effects, we compare towns in the same congressional district, served by cable companies with similar features, and with similar demo-graphics. In the specifi cation with county fi xed effects we make the same comparison for towns within a county. Geographic neighbors are more likely to be comparable, in particular, if they share similar demographics and cable system features.
Our main fi nding is that the Fox News Channel had a signifi cant impact on the 2000 elections. The entry increased the Republican vote share in presidential elections by 0.4 percentage points with district fi xed effects (panel A) or 0.7 percentage points with county fi xed effects (panel B). The difference between the specifi cations with congressional district (panel A) and county fi xed effects (panel B) refl ect different geographic comparisons. In both specifi cations, the result is statistically signifi cant and robust to a variety of alternative specifi cations, alternative samples, and placebo speci-fi cations, documented in DellaVigna and Kaplan (2007). Column two in table 6.2 presents one such robustness check: We obtain very similar results if we control for the vote share in 1996, v k
R,1996
es,Pr , instead of taking the fi rst difference as in (4.1). Altogether, these results imply that exposure to the media shifted people’s voting in the direction of the media content.
How large is this effect of the media? Since the Fox News Channel was available in 2000 in about 35 percent of households, the impact is esti-mated to be 0.15 to 0.2 percentage points, or approximately 200,000 votes nationwide. While this vote shift is small compared to the nationwide shift
Q: renumber equations throughout?

The Political Impact of Media Bias 91
toward the Republicans of 3.5 percentage points between 1996 and 2000, it is still likely to have been decisive in the close 2000 presidential elections. Moreover, this impact may become larger over time as the channel’s audi-ence and diffusion grow.
Town Characteristics We examine how the Fox News Channel’s effect interacts with town char-acteristics, namely the number of channels, the share of population that is urban, and the political orientation of the congressional district (Della Vigna and Kaplan 2007).
The impact on voting was smaller in towns with more cable channels, which is consistent with a moderating effect of competition (Mullainathan and Shleifer 2005). The lower impact result could refl ect exposure to more balanced reporting (although CNN and the network news are available in all towns in the sample) or merely lower audience rates for the Fox News Channel when more channels are available. In either case, this suggests that the impact of media bias on voting would be larger in countries with a small number of media sources, as is the case in most developing countries.
We also fi nd that the impact of the Fox News Channel was signifi cantly smaller in rural towns, in the South, and in more Republican districts. All these results may be explained by the fact that in rural towns, in the South, and in Republican districts most people already voted Republican and the share of the population that could be convinced was smaller.
Persistence of Effects
A prediction of the model of persuasion described earlier is that the expo-sure to the Fox News Channel would have a persistent effect on voting rather than a temporary one. Instead, the model of rational learning pre-dicts that over time the effect should decay, as voters learn about the previ-ously unobserved bias.
We therefore study whether the impact of the Fox News Channel per-sists between the 2000 presidential election and the 2004 presidential elec-tion. In column three of table 6.2, we estimate the specifi cation as follows:
v v dkR
kR
F kFOX
,2004es
,2000es,Pr ,Pr
,− = + +α β 2000 ΓΓXk g k+ +η ε .
We fi nd that the availability of the channel in a town in 2000 is associ-ated with an insignifi cant .2 percentage point vote share increase between 2000 and 2004. The result is essentially identical with district fi xed effects
?

92
Q: s
/b U
.S. t
hro
ugh
ou
t?TA
BLE
6.2
Impa
ct o
f Fo
x N
ews
on V
otin
g
Vo
te s
har
e Tu
rno
ut
M
ain
res
ult—
pre
sid
enti
al
Pers
iste
nce
Se
nat
e Pr
esid
enti
al
US
Sen
ate
C
han
ge in
Pre
s.
Pr
es. R
ep.
US
Sen
ate
Log
chan
ge
Log
chan
ge
Rep
. 2-p
arty
Pr
es. R
ep.
2-p
arty
vo
te
Rep
. 2-p
arty
in
Pre
s.
in S
enat
e
vote
sh
are
: 2-
par
ty v
ote
sh
are
2004
– vo
te s
har
e in
tu
rno
ut:
tu
rno
ut:
Dep
. var
:. 20
00–1
996
shar
e in
200
0 20
00
2000
20
00–1
996
2000
–199
6
Pan
el A
: US
Ho
use
fi xe
d e
ffec
t (1
) (2
) (3
) (4
) (5
) (6
)
Ava
ilabi
lity
of F
ox N
ews
0.00
42
0.00
41
0.00
21
0.00
72
0.00
46
0.00
54
Via
cab
le in
200
0 (0
.001
5)**
* (0
.001
6)**
* (0
.002
0)
(0.0
026)
***
(0.0
039)
(0
.004
4)
Rep
ublic
an v
ote
shar
e in
199
6
0.93
62
0.
8295
1996
pre
side
ntia
l rac
e
(0.0
079)
***
(0
.011
1)**
*
Fox
New
s in
200
0 *
(New
Yor
k ra
ce)
0.
0039
(0.0
067)
Con
trol
var
iabl
es:
Cen
sus
cont
rols
: 199
0 an
d 20
00
X
X
X
X
X
X
Cab
le s
yste
m c
ontr
ols
X
X
X
X
X
X
US
Hou
se d
istr
ict fi
xed
effe
cts
X
X
X
X
X
X
Log
chan
ge in
vot
ing-
age
pop.
: 200
0–1
996
X
X
R2
0.75
33
0.98
24
0.62
81
0.97
68
0.61
51
0.69
93
N
N =
925
6 N
= 9
256
N =
860
5 N
= 8
192
N =
925
6 N
= 8
186

Pan
el B
: co
un
ty fi
xed
eff
ects
(1
) (2
) (3
) (4
) (5
) (6
)
Ava
ilabi
lity
of F
ox N
ews
0.00
69
0.00
68
0.00
19
0.00
71
0.01
78
0.01
58
Via
cab
le in
200
0 (0
.001
4)**
* (0
.001
4)**
* (0
.002
4)
(0.0
028)
**
(0.0
051)
***
(0.0
056)
***
Rep
ublic
an v
ote
shar
e in
199
6
0.94
32
0.
8432
1996
pre
side
ntia
l rac
e
(0.0
092)
***
(0
.014
6)**
*
Fox
New
s in
200
0 *
(New
Yor
k ra
ce)
–0
.001
7
(0.0
060
)
Con
trol
Var
iabl
es:
Cen
sus
cont
rols
: 199
0 an
d 20
00
X
X
X
X
X
X
Cab
le s
yste
m c
ontr
ols
X
X
X
X
X
X
Cou
nty
fi xed
effe
cts
X
X
X
X
X
X
Log
chan
ge in
vot
ing-
age
pop.
: 200
0–1
996
X
X
R2
0.81
19
0.98
65
0.69
41
0.98
29
0.68
63
0.74
74
N
N =
925
6 N
= 9
256
N =
860
5 N
= 8
192
N =
925
6 N
= 8
186
An
obse
rvat
ion
in t
he O
LS r
egre
ssio
ns i
n co
lum
ns (
1)–(
3) a
nd (
5) i
s a
tow
n in
one
of
the
28 U
.S.
stat
es i
n th
e sa
mpl
e. P
anel
A i
s es
timat
ed w
ith U
S H
ouse
dis
tric
t fi x
ed
effe
cts
and
Pane
l B
is
estim
ated
with
cou
nty
fi xed
eff
ects
. In
col
umns
(4)
and
(6)
, an
obs
erva
tion
in t
he O
LS r
egre
ssio
n is
a t
own
in o
ne o
f th
e U
S st
ates
with
a S
enat
e el
ectio
n in
the
yea
r 20
00.
In c
olum
n (1
), th
e de
pend
ent
vari
able
is
the
chan
ge i
n th
e tw
o-pa
rty
Rep
ublic
an v
ote
shar
e fo
r th
e 20
00 p
resi
dent
ial
elec
tion.
In
colu
mns
(2)
, th
e de
pend
ent v
aria
ble
is th
e tw
o-pa
rty
Rep
ublic
an v
ote
shar
e in
200
0. In
col
umn
(3),
the
depe
nden
t var
iabl
e is
the
2-pa
rty
Rep
ublic
an v
ote
shar
e fo
r th
e 20
04 p
resi
dent
ial
elec
tion
min
us t
he s
ame
vari
able
s fo
r th
e 20
00 e
lect
ion.
In
colu
mn
(4),
the
depe
nden
t va
riab
le i
s th
e tw
o-pa
rty
Rep
ublic
an v
ote
shar
e fo
r Se
nate
in
2000
. In
col
umn
(5),
the
depe
nden
t va
riab
le i
s th
e lo
g of
tur
nout
in
Pres
iden
tial
elec
tions
in
2000
min
us l
og o
f tu
rnou
t in
199
6. I
n co
lum
n (6
), th
e de
pend
ent
vari
able
is
the
log
of t
urno
ut i
n U
S Se
nate
ele
ctio
ns i
n 20
00 m
inus
log
of
turn
out
in i
n Pr
esid
entia
l el
ectio
ns i
n 19
96.
The
spec
ifi ca
tion
in C
olum
n (6
) dr
ops
6 ou
tlier
s (o
bser
vatio
ns w
ith a
cha
nge
in l
og
turn
out l
arge
r th
an 1
in a
bsol
ute
valu
e).
In c
olum
ns (4
) and
(6),
the
chan
ge in
log
votin
g-ag
e po
pula
tion
betw
een
1996
and
200
0 is
an
(unr
epor
ted)
con
trol
var
iabl
e. T
he v
aria
ble
“Ava
ilabi
lity
of F
ox N
ews
via
Cab
le
in 2
000”
is
a bi
nary
var
iabl
e th
at e
qual
s on
e if
Fox
New
s w
as p
art
of t
he t
own’
s lo
cal
cabl
e pa
ckag
e in
200
0. T
he C
ensu
s co
ntro
ls a
re 1
2 de
mog
raph
ic v
aria
bles
fro
m t
he
Cen
sus,
pre
sent
bot
h in
the
200
0 va
lues
and
in d
iffe
renc
es b
etw
een
2000
and
199
0. T
he C
able
sys
tem
con
trol
s ar
e de
cile
s in
the
num
ber
of c
hann
els
prov
ided
and
in t
he
num
ber
of p
oten
tial
subs
crib
ers.
Rob
ust
stan
dard
err
ors
clus
tere
d by
loc
al c
able
com
pany
in
pare
nthe
ses.
The
obs
erva
tions
are
wei
ghte
d by
tot
al v
otes
cas
t in
the
199
6 pr
esid
entia
l ele
ctio
n. *
sig
nifi c
ant a
t 10
perc
ent;
** s
igni
fi can
t at 5
per
cent
; ***
sig
nifi c
ant a
t 1 p
erce
nt
93

94 Stefano DellaVigna and Ethan Kaplan
(panel A) and with county fi xed effects (panel B). The effect therefore appears to be persistent, if not increasing over time. Persistence is consis-tent with the predictions of a model of nonrational persuasion; however, this result could also be due to greater audience exposure to the Fox News Channel over the period from 2000 to 2004.
Ideology versus Popularity
The previous fi ndings suggest that the channel had a signifi cant effect on the Republican vote share and on turnout in the presidential election. We now consider whether the effect extends to local politics not covered by the channel. This allows us to test whether the effect is candidate-specifi c and does not extend to local elections, or a general ideological shift, and should affect local elections. Senatorial elections in the U.S. are a good test in this respect, because a large majority of these races fail to get national coverage. These elections are similar to local elections, for which unfortunately no town-level data set is available. As a test of the ideology shift, therefore, we estimate whether exposure to the Fox News Channel affected the two-party vote share in the senatorial elections.
In addition, one or two senatorial races per year attract substantial national coverage, almost like presidential races. This allows us to compare the effect on races that were not covered, where only ideological shifts should matter, to the effect on covered races, where candidate-specifi c coverage also could matter. In 2000, the senatorial race that got the most coverage on the Fox News Channel by a wide margin was the Hillary Clinton-Rick Lazio race in New York. These two candidates had 99 mentions in the O’Reilly Factor and the Hannity & Colmes show in the two months prior to the 2000 elections, with most mentions critical of Hillary Clinton. All other senate candidates in the 2000 campaign combined received a total of 73 mentions, with Joseph Lieberman, who was typically mentioned because of his vice-presidential race, getting the lion’s share of these mentions.
We examine whether the Fox News Channel had an impact on the vote share in the senate elections, and whether it had a differential effect for the Clinton-Lazio race. In table 6.2, column four, we estimate as follows:
v v dkR
kR
F kFOX
,2000Sen
,1996es, ,Pr
,= + +α α βΡ 2000 ++ ∗ + + +φ η εF kFOX
NY k g kd d X, ,2000 Γ (4.2)
where v kR
,2000Sen, is the two-party vote share in the senatorial elections in
2000. The coeffi cient bF indicates the effect of the Fox News Channel on senatorial races other than New York, and fF indicates the differential
The Political Impact of Media Bias 95
effect for the featured New York race. This specifi cation controls for the 1996 presidential vote share.1 We fi nd that the Fox News Channel signifi -cantly increased the Republican vote share for the senate by 0.7 percentage points b̂F = .0072 (panel A) and b̂F = .0071 (panel B). Interestingly, the effect is as large as that on the presidential elections. Additionally, the effect is not signifi cantly larger for the one senatorial race that the Fox News Channel covered heavily, the New York race between Hillary Clinton and Rick Lazio (f̂F = .0039 in panel A and f̂F = –.0017 in panel B ). Thus, the channel appears to have induced a generalized ideological shift, as opposed to a candidate-specifi c popularity effect.
Impact on Turnout
The signifi cant impact of the Fox News Channel on voting in presidential and senatorial elections could have occurred through two mechanisms. First, the channel’s entry convinced Democratic voters to vote for Republi-can candidates. Second, the entry attracted new Republican voters. To pro-vide evidence on the two mechanisms, we study the impact of the Fox News Channel on voter turnout, as measured by the number of people going to the polls. To the extent that the persuasion effect was purely due to a change in the minds of Democratic voters, we would not expect an increase in turnout.
In table 6.2, column 5, we estimate as follows:
t t d Pk k F k
FOX, , , ln2000 1996 2000
Pres Pres− = + +α β γ oop Pop Xk k k g k, ,ln ,2000 1996( ) − ( )⎡⎣
⎤⎦ + + +Γ η ε
(4.3)
where t k t,Pres is the log total votes in town k in year t: t Vk t k t
TOT, ,
,lnPres Pres= ( ). The change in this measure over time is the percent change in total votes cast. This specifi cation controls for the percentage change in the voting-age town population over time, ln(Popk,2000) – ln(Popk,1996), since increases in popu-lation increase the number of votes cast.
We obtain somewhat different answers using our two benchmark spec-ifi cations. The estimates with county fi xed effects (panel B) imply that the availability of the Fox News Channel increased turnout to the polls by 1.78 percent, a large and signifi cant effect. This estimate would imply that the effect on voting was mainly though mobilization of Republicans. The effect is still positive, but smaller and statistically insignifi cant using congressio-nal district fi xed effects (panel A). This latter estimate would imply that the impact operated mainly through convincing Democratic voters.

96 Stefano DellaVigna and Ethan Kaplan
In table 6.2, column six, we estimate the impact on turnout in U.S. senatorial elections. We estimate an equation parallel to specifi cation (6.3) with the change in turnout between the senatorial elections in 2000 and the presidential elections in 1996, t tk k, ,2000 1996
Sen Pres− , as a dependent variable. We fi nd that the entry increased turnout in senatorial elections by .54 per-cent with district fi xed effects (panel A) or by 1.58 percent with county fi xed effects (panel B). These estimates parallel the estimates of turnout for presidential elections, with a signifi cant impact in the specifi cation with county fi xed effects.
Overall, the Fox News Channel’s entry into a market appears to have mobilized voters. However, the evidence for this is not as consistent as for the effect on vote share.
Persuasion Rates of the Media
Overall, we fi nd a sizeable impact on the vote share for Republicans and on turnout. These estimates, however, do not tell us how effective the Fox News Channel was in convincing Democrats who were exposed, nor does it tell us how effective the channel was in mobilizing latent Republicans. Measures of the persuasiveness of the media depend, among other things, on the size of the audience in 2000. The smaller the audience, the larger the persuasion effect associated with the half percentage point impact on vote share. To generalize the results to other media markets, includ-ing possibly those in developing countries, it is useful to obtain quanti-tative estimates of effective persuasiveness of the media per individual exposed.2 What share of the public exposed to a media source changes its opinions in the political direction of the media source? While the impact may not easily generalize to very different media markets, in principle the estimates of persuasion rates can be applied to other similar media markets.
In this section, we compute the effectiveness of the Fox News Channel in convincing non-Republican viewers to turn out and vote Republican. This substantially extends computations in DellaVigna and Kaplan (2007) where we assumed that the Fox News Channel convinced the same percent-age of Democrats and nonvoters to vote Republican, and where we used only the vote share and not the turnout estimates to compute the persua-sion rate. We generalize the previous approach by (1) allowing for differen-tial infl uence rates on Democrats and on nonvoters and (2) using turnout estimates in addition to vote share estimates.

The Political Impact of Media Bias 97
Setup
We compare the vote share vj in treatment towns exposed to the channel ( j = T) and control towns not exposed ( j = C). Before the exposure, a share r of the voting-eligible population votes Republican, a share d votes Demo-crat, and the remaining share (1 – r – d) does not vote. Since the two types of towns have similar political outcomes in the pre-Fox News Channel period conditional on a set of controls, we assume that r and d are the same in towns T and C.
A fraction e of the town population is exposed to the Fox News Chan-nel after the nationwide introduction. Exposure e is higher in treatment towns, that is, eT > eC ≥ 0. We allow for nonzero exposure eC in control towns because, for example, of the availability of satellites that broadcast the channel to subscribers in both towns.
The key parameters we use to capture the effectiveness in affecting political behavior are the persuasion rate f and the mobilization rate m. The Fox News Channel persuades a fraction f of the Democrats in the audi-ence, ejd, to vote Republican. In addition, the channel mobilizes a fraction z of the nonvoters in the audience, ej(1 – r – d) , inducing it to vote. Of these mobilized voters, fm is the percentage of who turn out to vote for Republi-cans, with 0 ≤ fm ≤ 1.
vr fe d me f r d
r d me r djj j m
j
=+ + − −( )
+ + − −( )1
1 (6.1)
The number of Republicans in town j is equal to the number of Republicans in the town before the entry, r, plus the percent of exposed Democrats who were persuaded, fej d, plus the share of the mobilized voters that turn out for the Republicans, mej fm(1 – r – d).
The denominator in expression (5.1) is the turnout in town j:
tj = r + d + mej(1 – r – d). (6.2)
The turnout in town j is affected by the entry through the mobilization effect m on nonvoters.
Using expression (5.2) for the turnout tj, we can compute the mobi-lization rate m. Subtracting tC from tT and re-arranging, we obtain the following: m
t t
e e r dT C
T C
=−
−( ) − −( )1.
This expression is easily interpretable. The percent of those mobilized by the Fox News Channel to vote is equal to the difference in turnout across
98 Stefano DellaVigna and Ethan Kaplan
treatment and control towns, divided by the differential in the number of treated individuals (the differential exposure rate multiplied by the size of the nonvoting population).
We can calculate the persuasion rate f given the mobilization rate m of Fox News, provided that we make assumption about fm. The other variables vj, tj, r, d, and ej are observed. We report the solution for f in the appendix.
Persuasion Results
We now provide results for the mobilization rate m and the persuasion rate f for different specifi cations. In particular, we estimate mobilization and persuasion rates for both presidential elections and senatorial elections, using the specifi cations with district fi xed effects (table 6.2, panel A) and the specifi cations with county fi xed effects (table 6.2, panel B). This pro-vides a broad array of estimates of the impact of the media.
To obtain these estimates, we need measures for the parameters vT , VC, tT, tC, r, d, eT , and eC. We use the specifi cations in table 6.2 and summary sta-tistics reported in DellaVigna and Kaplan (2007) to estimate the vote shares VT and vC and the turnout rates tT and tC. We estimate the pre-Fox News Channel share of Democrats and Republicans r and d using the average voting patterns in the data. Finally, we document the audience rates eT and eC using measures of the audience of the Fox News Channel according to Scarborough Research data. According to the benchmark audience measure of the recall audience and using the estimates with district fi xed effects, the exposure to the Fox News Channel e is 8.9 percentage points in the control towns and 21.7 percentage point in the treatment towns. The availability of the channel via cable thus increased its audience by about 12.8 percentage points. The estimated increase in audience is of about 8.6 percentage points for the specifi cation with county fi xed effects. We document further the estimates of these parameters in the appendix.
We estimate the persuasion rates and the mobilization rates under three different scenarios and report the results in table 6.3. The fi rst sce-nario, “Mobilization=Persuasion,” assumes that the persuasion rate f and the mobilization rate m are equal, that is, the effect on nonvoters is the same as the effect on Democratic voters. This is the assumption used for the estimates in DellaVigna and Kaplan (2007). For presidential elections, these assumptions imply that the Fox News Channel persuaded 3.4 per-cent of voters in the specifi cation with district fi xed effects or 8.4 percent of voters in the specifi cation with county fi xed effects to vote Republican.

TAB
LE 6
.3
Pers
uasi
on a
nd M
obili
zati
on R
ates
Esti
mat
ed
Esti
mat
ed
Imp
lied
Im
plie
d
Geo
grap
hic
co
ntr
ols
ef
fect
of F
ox
effe
ct o
f Fo
x p
ersu
asio
n
mo
bili
zati
on
(fi
xed
eff
ects
) use
d
New
s o
n v
ote
N
ews
on
ra
te f
of t
he
rate
m o
f th
eA
ssu
mp
tio
ns
for C
alib
rati
on
fo
r th
e es
tim
ates
sh
are
turn
ou
t m
edia
m
edia
(1
) (2
) (3
) (4
) (5
)
Pane
l A: p
resi
dent
ial e
lect
ions
Mob
iliza
tion
= p
ersu
asio
n D
istr
ict fi
xed
effe
cts
0.00
42
0.00
46
0.03
4 X
Mob
iliza
tion
100
% fo
r R
ep.
Dis
tric
t fi x
ed e
ffect
s 0.
0042
0.
0046
0.
025
0.04
6
Mob
iliza
tion
56%
for
Rep
. D
istr
ict fi
xed
effe
cts
0.00
42
0.00
46
0.05
4 0.
046
Mob
iliza
tion
= P
ersu
asio
n C
ount
y fi x
ed e
ffect
s 0.
0069
0.
0178
0.
084
X
Mob
iliza
tion
100
% fo
r R
ep.
Cou
nty
fi xed
effe
cts
0.00
69
0.01
78
–0.0
52
0.26
3
Mob
iliza
tion
56%
for
Rep
. C
ount
y fi x
ed e
ffect
s 0.
0069
0.
0178
0.
115
0.26
3
Pane
l B: U
S Se
nate
ele
ctio
ns
Mob
iliza
tion
= p
ersu
asio
n D
istr
ict fi
xed
effe
cts
0.00
72
0.00
54
0.05
4 X
Mob
iliza
tion
100
% fo
r R
ep.
Dis
tric
t fi x
ed e
ffect
s 0.
0072
0.
0054
0.
062
0.04
5
Mob
iliza
tion
56%
for
Rep
. D
istr
ict fi
xed
effe
cts
0.00
72
0.00
54
0.09
6 0.
045
Mob
iliza
tion
= p
ersu
asio
n C
ount
y fi x
ed e
ffect
s 0.
0071
0.
0158
0.
079
X
Mob
iliza
tion
100
% fo
r R
ep.
Cou
nty
fi xed
effe
cts
0.00
71
0.01
58
–0.0
25
0.19
6
Mob
iliza
tion
56%
for
Rep
. C
ount
y fi x
ed e
ffect
s 0.
0071
0.
0158
0.
122
0.19
6
This
Tab
le r
epor
ts th
e es
timat
ed p
ersu
asio
n ra
te a
nd m
obili
zatio
n ra
te o
f the
med
ia im
plie
d by
the
Fox
New
s es
timat
es. T
he p
ersu
asio
n ra
te is
defi
ned
as
the
shar
e of
Dem
ocra
tic v
oter
s th
at a
re c
onvi
nced
to v
ote
Rep
ublic
an d
ue to
exp
osur
e to
Fox
New
s. T
he m
obili
zatio
n ra
te is
defi
ned
as
the
shar
e of
non
-vot
ers
that
are
con
vinc
ed to
vot
e du
e to
exp
osur
e to
Fox
New
s.
The
Tabl
e pr
esen
ts th
e re
sult
for
thre
e ty
pes
of e
stim
ates
. The
fi rs
t est
imat
e, “
Mob
iliza
tion
=Pe
rsua
sion
,“ a
ssum
es th
at m
obili
zatio
n ra
tes
equa
l per
suas
ion
rate
s (th
at is
, the
effe
ct o
f Fox
N
ews
on n
on-v
oter
s is
the
sam
e as
the
effe
ct o
n D
emoc
rats
). Th
e se
cond
est
imat
e, “
Mob
iliza
tion
100%
for
Rep
.,“ a
ssum
es th
at m
obili
zatio
n ra
tes
can
diffe
r fr
om p
ersu
asio
n ra
tes,
and
th
at a
ll m
obili
zed
non-
vote
rs v
ote
for
the
Rep
ublic
ans.
The
thi
rd e
stim
ate,
“M
obili
zatio
n 56
% fo
r R
ep.,“
ass
umes
tha
t mob
iliza
tion
rate
s ca
n di
ffer
from
per
suas
ion
rate
s, a
nd t
hat 5
6%
of m
obili
zed
non-
vote
rs v
ote
for
the
Rep
ublic
ans
and
44%
for
Dem
ocra
ts (t
his
is b
ased
on
the
com
posi
tion
of th
e Fo
x N
ews
audi
ence
). Th
e fo
rmul
as a
nd p
aram
eter
s us
ed to
cal
cula
te
the
impl
ied
mob
iliza
tion
rate
and
the
impl
ied
pers
uasi
on r
ate
are
deta
iled
in th
e A
ppen
dix.
In
Pan
el A
, the
est
imat
ed e
ffec
t of F
ox N
ews
on t
he v
ote
shar
e is
the
coe
ffi c
ient
on
the
Fox
New
s va
riab
le in
the
Pres
iden
tial v
ote
shar
e re
gres
sion
(C
olum
n (1
) in
Tabl
e II
), an
d th
e es
timat
ed e
ffec
t on
tur
nout
is
the
coef
fi cie
nt o
n th
e Fo
x N
ews
vari
able
in
the
Pres
iden
tial
turn
out
regr
essi
on (
Col
umn
(5)
in T
able
II)
. W
e pr
esen
t se
para
te e
stim
ates
usi
ng U
S H
ouse
dis
tric
t fi x
ed e
ffec
ts (
Pane
l A in
Tab
le II
) and
cou
nty
fi xed
eff
ects
(Pa
nel B
in T
able
II).
In P
anel
B, t
he e
stim
ated
eff
ect o
f Fox
New
s on
the
vote
sha
re is
the
coef
fi cie
nt o
n th
e Fo
x N
ews
vari
able
in t
he U
s Se
nate
vot
e sh
are
regr
essi
on (
Col
umn
(4)
in T
able
II)
and
the
est
imat
ed e
ffec
t on
tur
nout
is
the
coef
fi cie
nt o
n th
e Fo
x N
ews
vari
able
in t
he U
S Se
nate
tu
rnou
t reg
ress
ion
(Col
umn
(6) i
n Ta
ble
II).
99
Q: s
/b U
.S. t
hro
ugh
ou
t?

100 Stefano DellaVigna and Ethan Kaplan
Intuitively, to obtain the estimate of the persuasion rate we rescale the effect on the vote share (.42 and .69 percentage points, respectively) by the 12.8 percentage point differential audience rate.3 For senatorial elections, the estimates imply persuasion rates of 5.4 percent for district fi xed effects and 7.9 percent for county fi xed effects. These estimates indicate sizeable per-suasive effects of the media.
A drawback of this fi rst approach is that it predicts an increase in turnout due to the Fox News Channel that is signifi cantly smaller than the observed large increase in the specifi cations with county fi xed effects (table 6.2, panel B, column fi ve). The larger impact on turnout may be due to higher mobilization rates m compared to the persuasion rates f. In addi-tion, the newly mobilized voters may have in part voted for the Democratic party, implying that fm is smaller than 1. In this section, we extend our previous work to separate out a mobilization effect on nonvoters from a persuasive effect on Democrats.4
In the second scenario, which we label “Mobilization 100% for Rep.,” we allow for different persuasion rate f and mobilization rate m. We also assume that all the nonvoters that the Fox News Channel mobilizes vote Republican, that is, fm = 1. The results are quite similar for presidential and senatorial elections, but differ depending on the unit of the fi xed effects (district or county). The estimated mobilization rates m are large with county fi xed effects (26.3 for presidential and 19.6 percent for senatorial) and sizeable with district fi xed effects (4.6 percent for presidential and 4.5 percent for senatorial). The estimates of the mobilization rates in turn affect the estimates of the persuasion rates. In the specifi cation with county fi xed effects, the large mobilization rates render the persuasion rates small, or even slightly negative. If the Fox News Channel had a large effect of con-vincing nonvoters to vote Republican, this fully explains the vote share results, even without any effect on converting Democratic voters. The esti-mates of persuasion rates with district fi xed effects are less affected by this scenario since the estimated mobilization rates are lower.
This second scenario, while allowing for a separate turnout and con-version effect, requires the turnout effect to benefi t only Republican can-didates. However, it is possible that a fraction of the nonvoters that is mobilized votes for Democratic candidates. To quantify this, in the third scenario, “Mobilization 56% for Rep.,” we assume that 56 percent of mobi-lized nonvoters vote for the Republicans and 44 percent for Democrats, that is, we assume fm = .56. This breakdown, while arbitrary, is based on

The Political Impact of Media Bias 101
the observation that, according to Scarborough data, 56 percent of the Fox News Channel’s audience is self-declared Republican. We assume that this breakdown also holds for the newly mobilized voters. Under this scenario, we obtain persuasion rates that are typically higher than under the other scenarios, ranging from 5.4 percent in presidential elections with dis-trict fi xed effects to 12.2 percent in senatorial elections with county fi xed effects. The reason is that under these assumptions, the increase in Republi-can vote share due to the Fox News Channel cannot be due to the effect on nonvoters, since nonvoters divide themselves fairly evenly across parties. The effect, therefore, has to be due to a large conversion effect of Democrats into Republicans.
Exposure to more conservative coverage had a sizeable effect on political choices of voters. Most scenarios imply a substantial role of the media in per-suading Democratic voters to vote Republican. However, if we take at face value the estimates indicating large turnout effects (and hence high mobilization rates), the data are also consistent with pure mobilization and no persuasion. While our best guess based on the different estimates is that exposure affected both margins, we leave fully differentiating between persuasive impacts of the media and mobilizing impacts of the media to future research.
Conclusions
The study on the impact of the Fox News Channel discussed in this chapter provides evidence on the extent to which the political content of a media source persuades and mobilizes potential voters.
We have compared this study to other studies in the literature that take different approaches to answering a similar question. We have argued that natural experiments in media exposure provide a combination of two desir-able features, quasi-random assignment of the media and a natural setting. In comparison, surveys also examine voting in the fi eld, but they cannot separate sorting from causal effect. Laboratory experiments provide a clean randomization, but they do so at the cost of an artifi cial setting. Field exper-iments can also provide randomization in the context of a real election, but it is often diffi cult to map the outcomes to real election variables.
Other studies use natural experiments to address the impact of the media on voting. Expansions of the New York Times in the 1990s (George and Waldfogel 2006) and of television between 1940 and 1972 (Gentzkow 2006) decrease turnout, while radio entry between 1920 and 1940 increases
Q: s/b The New York Times?

102 Stefano DellaVigna and Ethan Kaplan
turnout (Stromberg 2004). These studies analyze the link between media and voting from other vantage points.
A number of important questions are left unanswered, or only partially answered, by this and other studies on the impact of the media. We outline a few that we consider to be particularly important.*
• First, do the media mostly mobilize the “already convinced” or do they persuade voters to switch parties? We find evidence that the effect of the Fox News Channel was at least partly due to increased turnout of latent Republicans, the “already convinced,” but we cannot precisely evaluate the extent of this channel with precision.*
• Second, does media bias affect other behavior beyond voting? It would be interesting to consider the impact on other politically charged deci-sions, such as the degree of political activism, propensity to contribute money to political causes, or military conscription rates. [AQ: pre-sumably you are referring to non-U.S.?]
• Third, who is most likely to be persuaded by the media? A large litera-ture in political science tries to determine when political preferences are formed, including whether young people are most affected by polit-ical messages. In this chapter, we did not have access to individual data and hence could not test these hypotheses.*
• Fourth, does exposure to the media change policy? We have not directly examined the impact on policy making.*
• Fifth, why do the media have an effect on voting? We have provided some evidence to distinguish rational updating from nonrational per-suasion, but we cannot draw fi rm conclusions. Understanding the exact channels of media infl uence is important both from policy and research perspectives.
Appendix
Using expressions (5.1) and (5.2), we can derive the difference in the vote shares as follows:
v vr fe d me f r d
t
r fe d me f rT C
T T m
T
C C m− =+ + − −( )
−+ + −1 1 −−( )d
tC
Multiplying by tT tC and subtracting off r(tC – tT), we get the following:
v v t t r t t
fe dt me f r d tT C T C C T
T C T m C
−( ) − −( ) =
+ − −( ) −1 ffe dt me f r d tC T C m T− − −( )1
Q: need footnote for *’s or delete?
Q: renumber equations throughout?

The Political Impact of Media Bias 103
Subtracting the terms involving fm and dividing by d(eT tC – eCdtT), we get the following:
fv v t t
d e t e t
r t t
d e t e tT C T C
T C C T
C T
T C C
=−( )
−( ) −−( )− TT
m r dmf
d( ) − − −( )1
Finally, using the defi nition of tj, we note that eT tC – eCtT = (eT – eC)(r + d). Substituting this expression, we can simplify, combine terms, and solve for the infl uence rate f as follows:
fv v
t t
r dd e e
m r d fr
r dT CT C
T C
m
=−( ) +
−( ) −− −( ) −
+⎛⎝⎜
1⎞⎞⎠⎟
d (7.1)
Expression (7.1) has two components, and is roughly interpretable as the effect of the Fox News Channel on vote share vT – vC per exposed Demo-cratic, minus the increase due to Republican turnout. The fi rst term says that the higher the impact of the Fox News Channel on the vote share per exposed Democrat, the higher the infl uence rate f. The second term sub-tracts the impact of mobilized nonvoters. This second term can be positive or negative depending upon whether mobilization is biased towards the Republicans or the Democrats (that is, whether fm – r/(r + d) is greater or less than zero and how large its magnitude is).
As mentioned in the text, if we restrict fm = 1 and impose f = m, we can simplify (7.1) to the formula we used in DellaVigna and Kaplan (2007), which also corresponds to our “mobilization = persuasion” case in table 6.3. This formula is as follows:
fv v t t
d e eT C T C
T C
=−( )
−( )Estimation
We compute mobilization and persuasion rates for different specifi cations and using different assumptions. We measure vT – vC as the impact of the Fox News Channel on the two-party Republican vote share. In our county fi xed effects specifi cations, we use 0.0069 for presidential elections and 0.0071 for senatorial elections. In our congressional district fi xed effects specifi cation, we use 0.0042 for presidential elections and 0.0072 for sena-torial elections. We measure TC, turnout in the control towns, as 0.5600 for the presidential elections and 0.5167 for senatorial elections. We measure TT , turnout in the treatment towns, as the turnout in the control town plus the turnout effect of the Fox News Channel. For presidential elections, it

104 Stefano DellaVigna and Ethan Kaplan
is (1 + 0.0178)*0.56 = 0.5700 for county fi xed effect specifi cations and (1 + 0.0046)*0.56 = 0.5626 for district fi xed effects specifi cations. Similarly, for senatorial elections, this is (1 + 0.0158) * 0.5167 = 0.5247 for county fi xed effect specifi cations, and for district fi xed effect specifi cations it is (1+0.0054) * 0.5167 = 0.5195.
The exposure rates eT and eC do not depend upon whether we are look-ing at senatorial or presidential elections. The exposure rate for control towns eC was 0.0262 * 3.43 = 0.089866, whereas the exposure rate for treat-ment towns eT is (0.0262 + 0.0371)*3.43 = 0.2171 with district fi xed effects and (0.0262 + 0.0251) * 3.43 = 0.1760 with county fi xed effects.
We take our estimates of Republicans (r) and Democrats (d) from the population-weighted average of Republicans and Democrats in our sample. The variable d is the share of Democrats in the population before the entry of the Fox News Channel, computed as the two party-vote share of Demo-crats multiplied by turnout. The same is true for calculating r, the share of Republicans in the population. In presidential elections, d is equal to 0.547*0.56 = 0.2537 and r is equal to 0.453*0.56 = 0.3063. Thus, 1 – r – d is equal to the percentage of eligible voters that does not turn out, which is equal to 0.44. In senatorial elections, d is equal to 0.5469*.0.5167 = 0.2826 and r is equal to 0.4531 * 0.5167 = 0.2341. Thus. 1 – r – d is equal to the percentage of eligible voters that does not turn out, which is equal to 0.4833.
Notes 1. The results are similar if we control for the 1994 senatorial vote share instead.
The disadvantage of this specifi cation is that it restricts the sample to 2,037 towns in fi ve states.
2. Of course, the effective persuasiveness per individual of the media can vary across countries due to differences in political systems, educational systems, competitiveness of media markets, political orientation of the media, and many other factors.
3. A more restrictive audience measure implies that availability of the Fox News Channel via cable increased the channel’s audience by 2.5 to 3.7 percentage points. These audience numbers imply persuasion effects between 11 and 28 percent. We report results using these measures in DellaVigna and Kaplan (2007).
4. The mobilization effect on nonvoting Republicans could also be a persuasive effect on latent nonvoting Democrats.

The Political Impact of Media Bias 105
ReferencesAnsolabehere, Stephen, and Shanto Iyengar. 1995. Going Negative: How Attack Ads
Shrink and Polarize the Electorate. New York: Free Press.Bray, Margaret, and David Kreps. 1987. “Rational Learning and Rational Expecta-
tions.” In Arrow and the Ascent of Modern Economic Theory, ed. G. Feiwel. Lon-don, Macmillan.
DellaVigna, Stefano, and Ethan Kaplan. 2006. “The Fox News Effect: Media Bias and Voting.” Working Paper W12169. Cambridge: National Bureau of Eco-nomic Research.
DellaVigna, Stefano, and Ethan Kaplan. 2007. “The Fox News Effect: Media Bias and Voting.” Quarterly Journal of Economics. Vol. 112, No.3: 1187–1234
DeMarzo, Peter, Dimitri Vayanos, and Jeffrey Zwiebel. 2003. “Persuasion Bias, Social Infl uence, and Uni-Dimensional Opinions.” Quarterly Journal of Econom-ics. Vol. 115, No. 3: 910–968.
Gentzkow, Matthew. 2006. “Television and Voter Turnout.” Quarterly Journal of Economics. Vol 121, No. 3: 931–72.
Gentzkow, Matthew, and Jesse Shapiro. 2004. “Media, Education, and Anti-Americanism in the Muslim World.” Journal of Economic Perspectives. Vol. 18, No. 3: 117–33
George, Lisa, and Joel Waldfogel. 2006. “The New York Times and the Market for Local Newspapers.” American Economic Review. Vol. 96, No. 1: 435–47
Gerber, Alan S., Dean Karlan, and Daniel Bergan. 2006. “Does The Media Matter? A Field Experiment Measuring The Effect of Newspapers on Voting Behavior and Political Opinions.” Yale Economic Applications and Policy Discussion Paper No. 12
Groseclose, Timothy, and Jeff Milyo. 2005. “A Measure of Media Bias.” Quarterly Journal of Economics. Vol. 120, No. 4: 1191–1237.
Hamilton, James T. 2004. All the News That’s Fit to Sell. Princeton: Princeton Uni-versity Press.
Herman, Edward, and Noam Chomsky. 1998. Manufacturing Consent: The Political Economy of the Mass Media. New York: Pantheon Books.
Kull, Steven, Clay Ramsay, and Evan Lewis. 2003. “Misperceptions, the Media, and the Iraq War.” Political Science Quarterly. Vol. 118, No. 4: 569–98.
Lakoff, George. 1987. Women, Fire and Dangerous Things. Chicago: University of Chicago Press.
Lazarsfeld, Paul, Bernard Berelson, and Hazel Gaudet. 1944. The People’s Choice. New York: Duell, Sloan & Pearce.
Mullainathan, Sendhil, and Andrei Shleifer. 2005. “The Market for News.” Ameri-can Economic Review. Vol. 95, No. 4: 1031–53.
Puglisi, Riccardo. 2006. “Being The New York Times: the Political Behavior of a Newspaper.” Working Paper 573801, March 10, 2006. SSRN
Stromberg, David. 2004.”Radio Impact on Public Spending.” Quarterly Journal of Economics. Vol. 119, No. 1: 189–221.
