the political mechanisms of housing bubbles presented to
TRANSCRIPT
1
The Political Mechanisms of Housing Bubbles
Presented to the Department of Government
in partial fulfillment of the requirements for the degree with honors
of Bachelor of Arts
Harvard College March 2015
2
TABLE OF CONTENTS
CHAPTER 1: INTRODUCTION AND LITERATURE REVIEW 3
INTRODUCTION 3 LITERATURE REVIEW 6 HYPOTHESIS 20
CHAPTER 2: THEORY 23
HYPOTHESIS REVISITED 23
CHAPTER 3: METHODS AND QUANTITATIVE EVIDENCE 34
COUNTRY DATA SET 34 METHODS OF DATA ANALYSIS 34 DEPENDENT VARIABLE DATA 36 INDEPENDENT VARIABLE DATA 38
CHAPTER 4: STATISTICAL RESULTS AND DISCUSSION 50
STATISTICAL RESULTS 50 MULTIVARIATE REGRESSION AND INTERACTIONS 76 REVISED UNDERSTANDING OF HYPOTHESIS 77
CHAPTER 5: CASE STUDIES 82
INTRODUCTION TO CASE COUNTRIES 82 CASES 83
CHAPTER 6: CONCLUSION 101
APPENDIX 104
WORKS CITED 105
3
Chapter 1: Introduction and Literature Review
1.1 Introduction
“Few economists saw our current crisis coming,” asserts Nobel prize-
winning American economist Paul Krugman. Guided by a “notion that investors
and consumers are rational and that markets generally get it right,” most
economists believed that the existence of a central bank was the only safeguard
necessary for preventing “catastrophic failures in a market economy” (Krugman
“How did Economists”, 3). Financial sophistication and complicated risk-sharing
mechanisms were thought to be heralds of a time immune from major financial
disruption. The belief that “bubbles just don’t happen,” that price increases were
driven by fundamental economic factors, was shattered as uncertainty about the
true underlying value of mortgage-backed securities threatened to take down the
American financial system and sent ripples through the world financial order (8).
Economists, policy-makers, and elected officials are still trying to make sense of
exactly how they got it so wrong. It is generally accepted that financial
deregulation played a major role in the financial crisis. With fewer rules
governing banking behavior, financial institutions were able to operate in more
profitable, and riskier, manners. The creation of complex securitizing
mechanisms, difficult for most non-insiders to understand, ostensibly served to
avoid any sort of far-reaching market disaster and the innovation was embraced in
an environment characterized by faith in efficient asset pricing. When it became
evident that the market hadn’t in fact properly priced many securitized assets,
their true value was hard to determine amid the complexity. Deregulation had
4
fostered risk taking and made it more difficult to determine value when the
markets were proved incorrect.
Of particular interest to those seeking answers, and someone to blame, is
the role political actors played in promoting potentially harmful practices and
policies. By deregulating and relinquishing tight oversight, politicians enabled
financial institutions to make the choices that proved fateful for the economic
system. What caused them to do this? It is within this discussion of political
incentives facing economic policy-makers that this paper is written.
The financial crisis, in part due to the traumatic American experience with
sub-prime mortgages, is particularly associated with deregulated and riskier home
lending. Americans paid steep prices for homes as values climbed in the early
2000s, only to be underwater when the market corrected and their home was
worth less than their debt. The United States was not the only country to
experience a significant increase in home prices. Countries across the developed
world, most notably Ireland and Spain, experienced large increases in home
values, only to see those values plummet at the dawn of the crisis. While the
occurrence of a financial crisis in financial systems deemed crisis-proof presents
perhaps the largest of macroeconomic puzzles, this paper is concerned with the
causes of one critical aspect of this puzzle, the astonishing house price
appreciation experienced by most developed economies in the 2000s.
5
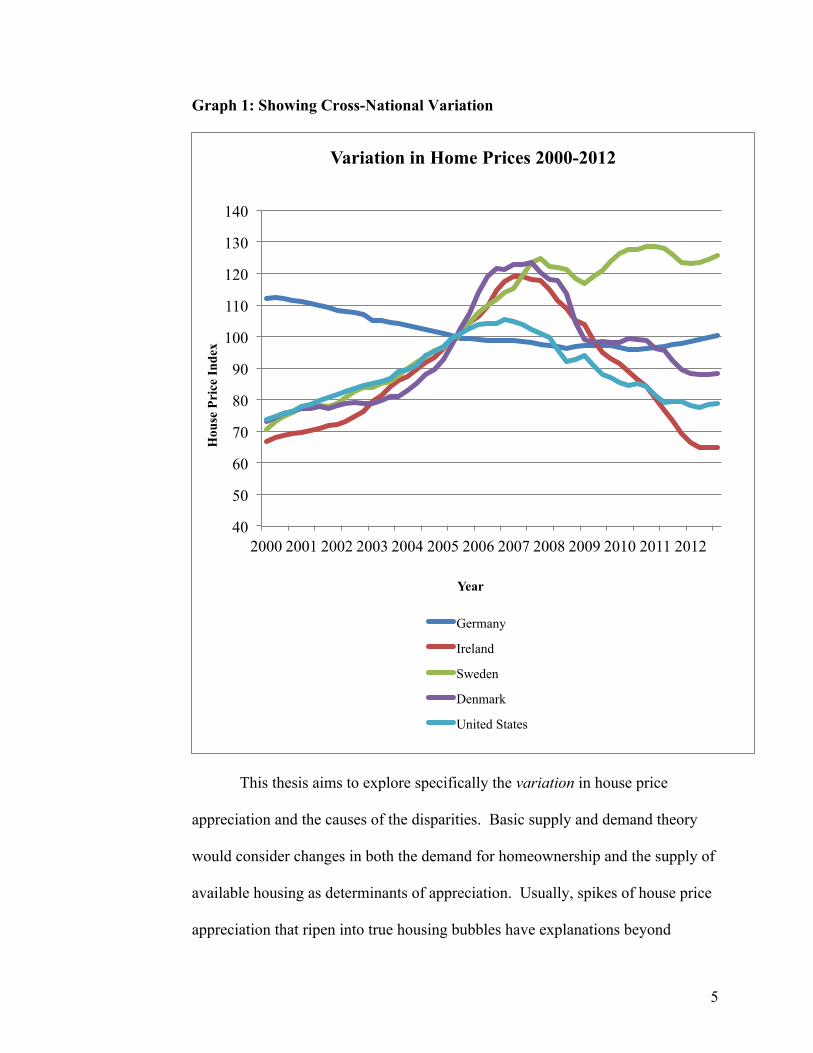
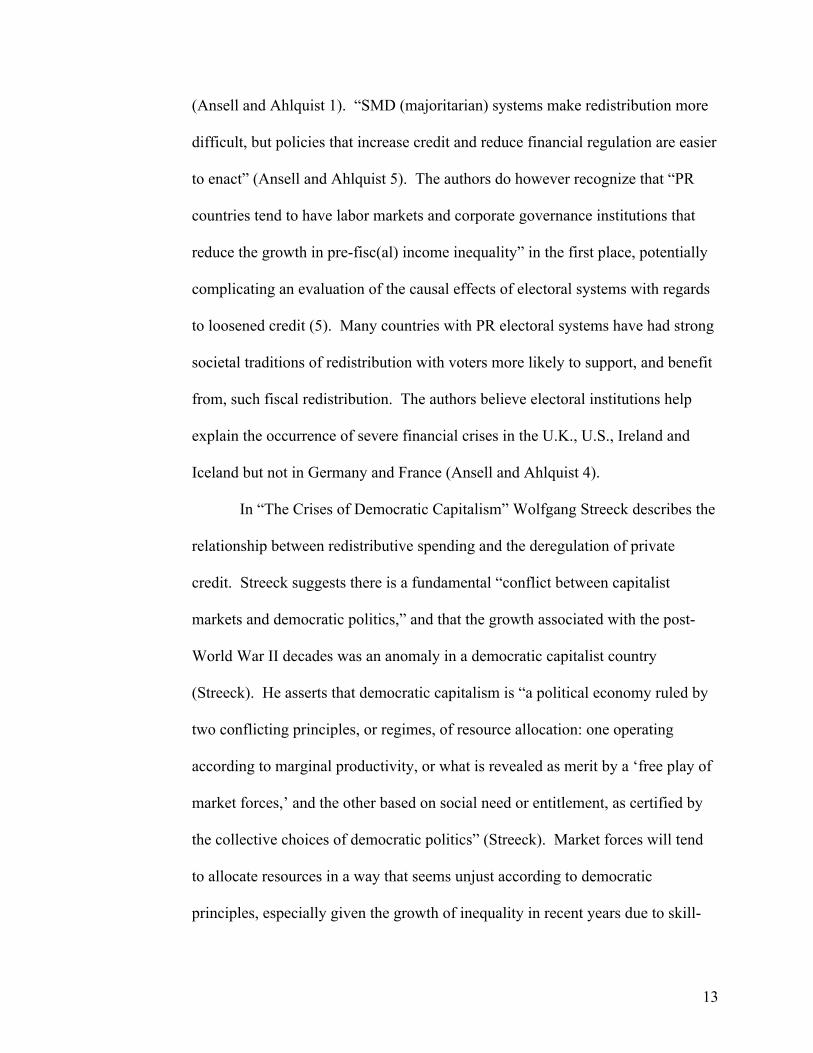
Graph 1: Showing Cross-National Variation
This thesis aims to explore specifically the variation in house price
appreciation and the causes of the disparities. Basic supply and demand theory
would consider changes in both the demand for homeownership and the supply of
available housing as determinants of appreciation. Usually, spikes of house price
appreciation that ripen into true housing bubbles have explanations beyond
40
50
60
70
80
90
100
110
120
130
140
2000 2001 2002 2003 2004 2005 2006 2007 2008 2009 2010 2011 2012
Hou
se P
rice
Inde
x
Year
Variation in Home Prices 2000-2012
Germany
Ireland
Sweden
Denmark
United States
6
changes in supply and demand caused by “natural” shifts in income,
demographics, and construction costs. To inform the analysis, it is necessary to
begin by examining existing research on the cause of house price appreciation
resulting in bubbles. Most of the literature is U.S. centric, where the nationwide
housing bubble and subsequent crisis played an integral role in bringing the global
financial system to its knees in the 2000s. But this thesis moves beyond the U.S.
and offers an examination across developed countries. The thesis will consider
what types of political economies may be more prone to an asset bubble in the
housing sector, based on the institutional incentives politicians have to pursue
policies that are conducive to the formation of bubbles. By considering and
weighing existing explanations for house price appreciation, with a mind towards
institutional and structural patterns amongst advanced political economies, the
thesis will look at the forces impacting political decision-making as a way to
explain varying outcomes in the housing sectors of the developed world.
1.2 Literature Review
In “Manias, Panics, and Crashes,” Charles Kindleberger, appropriating
significantly from Hyman Minksy, puts forth five stages of a bubble. First, there
is a displacement: “a shock that changes horizons, expectations, (or) anticipated
profit opportunities” (59). A displacement is something that alters expectations: a
change in technology, regulation, or time horizons. Second comes the boom, a
time of rising confidence in which demand for the asset in question is rising in
anticipation of further increases in value. Next, euphoria creates irrational
7
environments for economic decision-making. “Asset price bubbles – at least the
large ones – are almost always associated with economic euphoria” (115). This
step is quite crucial: individual investors, borrowers, and lenders are making
seemingly rational choices in response to recent conditions of prolonged, and
therefore unsustainable, increases in asset prices. These individuals are victims of
a euphoric environment that has been distorted by a paradigm shift due to the
displacement. The fourth step is crisis, in which insiders begin to see the writing
on the wall and try to decrease exposure. Finally, revulsion sets in within the
economy: banks decrease lending and households consume cautiously (39).
Kindleberger characterizes asset bubbles as scenarios in which individuals
are making choices based on a surrounding euphoric environment attributable to
some disruption in the economy. More broadly, this paper will consider real
estate asset bubbles as potential outcomes of rational decision-making by policy-
makers and governments, in which politicians contribute to creating an
environment that normalizes a shift in expectations that causes an asset bubble. It
is limiting to characterize housing bubbles as episodes of shortsightedness by
borrowers, lenders, and investors as part of a systematic irrationality influenced
solely by exogenous “displacements” of the status quo. A more sophisticated
view contemplates the extent to which decision-makers and institutions are
themselves structuring the environment in which bubbles may occur as a
consequence of rational decisions. It is useful to consider the role governments
play in the growth of credit or maintenance of credit standards that could
contribute to house price appreciation and ultimately a bubble. It is possible that
8
calculated, endogenous shifts in policy act as the disruptive force changing the
behavior of economic actors. There are incentives for governments and
politicians to deregulate financial operations, expand credit and encourage
household borrowing and homeownership. The hoped-for benefits, as discussed
below, may overshadow the potential costs to individuals and an economy if asset
prices were to rise at unsustainable rates and a recession or crisis was to occur
upon readjustment. In other words, socially suboptimal outcomes could emerge
from rational choices by decision-makers. What benefits do politicians, policy-
makers, and the institutions they control receive from relaxed credit conditions
and an accumulation of private debt?
One set of arguments about political incentives for deregulation concerns
the size and importance of a country’s financial sector to the economy, and how
that affects housing finance and credit. Torben Iversen and David Soskice argue
that governments “hone relevant regulatory systems for the benefit of their
advanced economic sectors (and) promot(e) the interest of their high value-added”
industries (“Modern Capitalism” 37). “Comparative institutional advantage led
the U.S. and U.K. governments to be concerned with regulatory environments that
promoted, among other things, their innovative and high-risk financial sectors,” at
the same time export-oriented countries like Japan and Germany crafted
regulation to support manufacturing and exports (“Modern Capitalism” 35).
Because political parties build reputations on their ability to spur economic
growth, policy-makers are incentivized to insure national economies perform well
9
by trying to enhance the “comparative institutional advantage” of their economies
(Iversen and Soskice, “Modern Capitalism” 39).
The Iversen-Soskice argument is that it is the electoral incentives that
cause politicians to promote their advanced sectors. But the political influence of
these sectors may be an independent driver of policies. This is the view of Simon
Johnson and James Kwak and others who support a ‘too big to fail’ perspective on
the recent financial crisis. They suggest that financial institutions, especially the
large investment banks, have too much power and reach. This power is translated
into regulatory environments that accommodate the profitable, riskier activities of
such banks. Problematically, the scope of large American financial institutions
allows them to operate under the assumption of an implicit bailout from the larger
fiscal entity. As we have seen, the costs to society of the failure of a large
American financial juggernaut are so high that governments will intervene to keep
the banks functioning. “Wall Street banks are the new American oligarchy – a
group that gains political power because of its economic power, and then uses that
political power for its own benefit” (Kwak and Johnson 22).
Benjamin Keys, Tanmoy Mulherjee, Amit Seru, and Vikrant Vig
examined the relationship between securitization and lending criteria in the
United States. The authors’ results “confirm that lender behavior in the subprime
market did change based on the ease of securitization” (354). The implication is
that deregulation and securitization lead to less responsible financial decisions by
“increase(ing) the distance between borrower and investor” (356). The more
financial intermediation between a homebuyer and the eventual holder of his
10
securitized mortgage, the less likely that investor will have accurate information
about the true creditworthiness of the borrower and the value of the asset. The
authors summarize: “This finding resonates well with concerns surrounding the
subprime crisis that, in an environment with limited disclosure on who holds what
in the originate-to-distribute chain, there may have been insufficient ‘skin in the
game’ for some lenders” (355).
Similarly, Leonard Seabrooke and Herman Schwartz focus less on the size
and/or power of a financial sector, and more on its level of mortgage
securitization. The authors differentiate between financially “liberal” and
financially “repressed” housing markets, identified independent of their sizes
(Seabrooke and Schwartz 238). They emphasize that mortgage securitization
determines financial institutions’ exposure to risk. In countries with liberal
housing finance markets that allow significant securitization of mortgages, banks
“shift interest rate risk off their books and onto the buyers of mortgage-backed
securities” (Seabrooke and Schwartz 249). When banks are able to pass along
potential downsides, they “make large, long-term, fixed interest loans” at a
smaller spread, increasing access to home loans (Seabrooke and Schwartz 253).
Alternatively, when housing finance markets are repressed, banks “ration lending
and borrowers avoid debt in order to control their balance sheet risks.” “Banks
that cannot securitize mortgages typically shift the bulk of risk to the borrower,”
charging higher interest rates on loans with shorter duration (Seabrooke and
Schwartz 253). The consequence is more constrained and conservative credit
availability. Seabrooke and Schwartz’s work underscores the importance of
11
regulations, but does not however explain the underlying conditions that drive
levels of regulation and securitization.
A second group of arguments about the incentives for loosened credit
revolves around a country’s level of social spending and redistributive activity in
its national economy. Peter Hall suggests institutional shifts in the neo-liberal
period changed the way governments approached macroeconomic growth. The
stagnant 1970s discredited Keynesian activist policies, viewed as mechanisms for
class solidarity, and economic elites turned towards a more monetarist view of
macroeconomic management. This move was associated with “class de-
alignment, rising electoral volatility, and the emergence of a cleavage that dilutes
the class character of political contestation” (Hall 10). Keynesian policies, and
the social solidarity underpinning them, lost the ideological support of political
coalitions. This breakdown in class compromise, embodied by Reagan and
Thatcher, informed the growth strategies of liberal market economies
characterized by weak unions and fluid labor markets. Crucially, legislative
proposals for social spending in liberal market economies became politically
costly. Governments can only respond to rising income inequality within their
“institutional architecture” (Hall 7). In countries like the U.S., where legislating
increased social spending is a daunting task, expanding credit is an effort to
equalize consumption in the face of ever-growing income inequality.
Raghuram Rajan furthers this idea. Confronted with difficult legislative
barriers to combatting inequality, politicians “have looked for other ways to
improve the lives of their voters. The most seductive answer has been easier
12
credit” (79 Rajan). Government-subsidized credit is significantly less politically
costly than outright redistribution. Rajan suggests “politicians love to have banks
expand housing credit, for credit achieves many goals at the same time” (79).
Increased home values make households “feel wealthier” and create profits and
employment in the financial, real estate brokerage, and construction sectors
(Rajan 79). “Easy credit has large, positive, immediate, and widely distributed
benefits, whereas the costs all lie in the future” (Rajan 80). While financial sector
regulation and oversight has been crafted in developed economies to attempt to
combat this shortsightedness, politicians in the U.S. and elsewhere in the lead-up
to the recent financial crisis were able to work around such regulations to pursue
policies of easy credit for homebuyers.
Ben Ansell and John S. Ahlquist argue that the applicability of the “Rajan
Hypothesis,” as they call it, depends on the institutional structure of the country.
Building on recent literature on the distributive effects of electoral institutions
(Rogowski and Kayser 2002, Persson and Tabellini 2005, Chang et al. 2010,
among others) they believe the “relationship between inequality in market income
and private sector credit to be conditional on electoral institutions” (5).
“Politicians respond to widening income disparities in the most (politically) cost-
effective ways, given the institutional structure in which they are embedded”
(Ansell and Ahlquist 5). Specifically, politicians in proportional representation
(PR) electoral systems will respond to income inequality with “fiscal
redistribution,” while countries with single member district electoral methods
(SMD) will tend to address inequality with “credit and consumption stimulus”
13
(Ansell and Ahlquist 1). “SMD (majoritarian) systems make redistribution more
difficult, but policies that increase credit and reduce financial regulation are easier
to enact” (Ansell and Ahlquist 5). The authors do however recognize that “PR
countries tend to have labor markets and corporate governance institutions that
reduce the growth in pre-fisc(al) income inequality” in the first place, potentially
complicating an evaluation of the causal effects of electoral systems with regards
to loosened credit (5). Many countries with PR electoral systems have had strong
societal traditions of redistribution with voters more likely to support, and benefit
from, such fiscal redistribution. The authors believe electoral institutions help
explain the occurrence of severe financial crises in the U.K., U.S., Ireland and
Iceland but not in Germany and France (Ansell and Ahlquist 4).
In “The Crises of Democratic Capitalism” Wolfgang Streeck describes the
relationship between redistributive spending and the deregulation of private
credit. Streeck suggests there is a fundamental “conflict between capitalist
markets and democratic politics,” and that the growth associated with the post-
World War II decades was an anomaly in a democratic capitalist country
(Streeck). He asserts that democratic capitalism is “a political economy ruled by
two conflicting principles, or regimes, of resource allocation: one operating
according to marginal productivity, or what is revealed as merit by a ‘free play of
market forces,’ and the other based on social need or entitlement, as certified by
the collective choices of democratic politics” (Streeck). Market forces will tend
to allocate resources in a way that seems unjust according to democratic
principles, especially given the growth of inequality in recent years due to skill-
14
biased technological change. Governments are therefore forced to weigh
“democratic claims for protection and redistribution” against the “claims for
compensation from the owners of productive resources,” a group on whom
successful economic operation and growth relies. In times and places where it is
difficult for governments to publicly spend to meet the demands for redistribution,
leaders will opt for private credit to try to meet citizens’ demands for opportunity.
He summarizes: “Instead of the government borrowing money to fund equal
access to decent housing, or the formation of marketable work skills, it was now
individual citizens who, under a debt regime of extreme generosity, were allowed,
and sometimes compelled, to take out loans at their own risk with which to pay
for their education or their advancement.” Streeck does not say much about
differences across countries, but the argument suggests that countries with less
distributive social policies are likely to have institutions with a vested interest in
the easy availability of credit.
Peter Hall and David Soskice’s Varieties of Capitalism (VOC) theory,
though not specifically addressing home price appreciation, serves to synthesize
arguments about social spending and financial sector sophistication and power
with regard to credit conditions. The authors focus on the firm as the primary
economic decision-maker in an economy, identifying how institutional
frameworks inform and are shaped by firm strategy. By observing institutional
design surrounding firms in the developed Organization for Economic
Cooperation and Development (OECD) countries, Hall and Soskice identify
certain patterns of economic organization. They and their other contributors make
15
a “core distinction” between two groups or “clusters”: liberal market economies
(LMEs) and coordinated market economies (CMEs) (8). In LMEs, “firms
coordinate their activities primarily via hierarchies and competitive market
arrangements,” and outcomes are primarily driven by supply and demand. CMEs
are more insulated from market forces, as “firms depend more heavily on non-
market relationships to coordinate their endeavors with other actors and to
construct their core competencies” (Hall and Soskice 8). Outcomes in CMEs “are
more often the result of strategic interaction among firms and other actors” (Hall
and Soskice 8). Hall and Soskice suggest that institutions will have specific and
varying functions and orientations to support the respective strategies of the firm
in each economy.
Crucial is the idea of “complementarities between institutions located in
different spheres of the political economy” (Hall and Soskice 17). The concept of
institutional complementarities suggests “nations with a particular type of
coordination in one sphere of the economy should tend to develop complementary
practices in other spheres as well” (Hall and Soskice 17). The presence of an
institution in a certain form, signals the likelihood that a corresponding version of
another institution will be present. When economic institutions are effectively
complimentary “the economic returns to the system as a whole are greater than its
component parts alone would generate” (Hall and Soskice 27). In this way firms
act as the “agent(s) of economic adjustment,” creating the incentive for
corresponding institutions to evolve and emerge to fit their needs, as well as
fostering institutions that guide national economic goals and capacities (Hall and

16
Soskice 1). As an example, CMEs and LMEs vary in the way in which firms are
able to innovate. A capacity for radical innovation in LMEs allows them to be
successful in “fast-moving technology sectors,” such as biotechnology, finance,
and software, while incremental innovation in CME firms fosters competitiveness
in “capital goods, such as machine tools and factory equipment” (Hall and
Soskice 39). The authors view the development of these complementarities as the
reason for significant variations, particularly in the last few decades, in economic
structure across countries and the divergence of the respective economic spheres
in which these countries have been able to excel.
Importantly in the context of this paper and the topic of relaxed credit,
VOC theory suggests that, because of the returns to institutions that are
complimentary, there will emerge patterns of correlation between welfare state
and financial sector types across the OECD countries. LMEs will tend to have
stronger, more liberal financial sectors paired with low levels of social spending
compared to other OECD countries. CMEs on the other hand will tend to have
financial sectors oriented towards the dominant trade and export sectors,
concerned with effectively financing firm operations and long-term returns rather
than short-run financial market conditions. CMEs will also tend to have strong
social spending mechanisms, both in the form of employment protection and in
the form of insurance against loss of income, as they incentivize workers to invest
in specific skills by mitigating the risk of prolonged unemployment as a result of
this specialization (Estevez-Abe et al). LMEs consistently have lower levels of
social spending, but also more mobile skills. The effect of both the financial
17
sector and social spending on house price appreciation seem to be reinforcing in
this framework. The narrative surrounding the U.S. is the best example of an
archetypal LME that experienced a housing bubble. The story would suggest the
American government catered to its large, dominant, and politically powerful
financial sector, loosening regulation and encouraging borrowing to provide a
supply of capital to American financial institutions with which they could
innovate and seek maximum returns. At the same time, low interest rates and
less-stringent lending criteria expanded easy credit for households to spur
consumer demand in an attempt to equalize consumption in the face of rising
inequality.
The VOC framework is related to and reinforces arguments by Iversen and
Soskice, referenced above, about governments catering to the dominant sectors of
their economies. According to VOC theory, governments and policy-makers are
incentivized to orient themselves towards their value-added sectors wherein their
firms are most successful. For CMEs, this largely means maintaining export
competitiveness for their exportable, traded goods sector. For LMEs however,
fast-moving, innovative industries, such as financial services, are economically
dominant, politically powerful and the sectors whose successes are most
important to the success of governments and elected officials. In their efforts to
promote financial sectors in LMEs, governments are motivated to allow financial
innovation and high-risk investments. LME countries also tend to be net
importers of capital. A main reason is that access to cheap credit, by increasing
the supply of loanable funds within the country with which financial institutions
18
can finance home purchases, benefits the industry and drives up domestic demand
and imports. They provide surplus countries with ample investment opportunities,
counter-balancing trade deficits.
The VOC literature is thus related to discussions of global macroeconomic
imbalances and their effect on the occurrence and severity of the crisis. In “Lost
Decades,” Menzie Chinn and Jeff Frieden discuss conditions in which significant
demand for foreign capital in the U.S. was met by a growing supply of foreign
loanable funds. The American government was borrowing to cover fiscal deficits
in the U.S. in the early 2000s, partly the result of the Bush Tax Cuts. Those same
tax cuts “boosted consumer spending” and “Americans began borrowing to
supplement their incomes, in expectation of future economic growth” (Chinn and
Frieden 40). Chinn and Frieden identify three source categories of capital used
for the “debt-financed consumption” (47). First were traditional sources of
developed country capital investments, looking for safe American investments
after getting burned by Russian and Argentinian defaults. Second were the oil-
exporting countries with large sovereign wealth funds. Finally, manufacturing
countries in Asia holding external surpluses, most conspicuously China, were
significant suppliers of capital to the U.S. (Chinn and Frieden). The same is true
of Germany and other northern European countries. With investors of this supply
of loanable funds involved in a “search for yield,” American financial institutions
had strong incentives to innovate and create high-return investments to maintain
the flow of capital into the U.S. (Chinn and Frieden 113). The American pattern
of capital flows was replicated in many European countries that were benefitting
19
from Eurozone membership that lowered borrowing costs so significantly that real
interest rates were negative in some countries (Chinn and Frieden 97). In this
view, house price appreciation is a story of capital seeking high returns in
countries, like the U.S., that benefitted from the capital inflows that allowed them
to borrow and consume over GDP.
Another important political economy lens through which to examine
housing bubbles is the political role of homeowners in a country. Mircea Popa
(2013) suggests there is a simple relationship between the number of homeowners
and house price appreciation. Popa asserts the more homeowners in a country,
“the more ‘artificial’ price appreciation will emerge from the political process”
(2). Using “a basic electoral model, relying on the logic of the median voter
theorem,” Popa uses “utility maximization by rational voters and politicians” to
explain a preference for relaxed credit regulation (2). House price appreciation
occurs as a result of policies subsidizing the buying of homes, namely the
“relaxation of credit regulation, which makes more credit available than would be
the case in a non-distorted market” (Popa 5). The subsidization allows
homeowners to reach for more expensive assets, and effectively increases their
household wealth as the value of their real estate asset appreciates. The cost of
the subsidy offered to homeowners is eventually distributed to all members of
society, in the form of a bail out to financial intermediaries responsible for
providing the subsidy when loans become non-performing. “Intermediaries
engage in these transactions because they know taxpayers as a whole cannot
commit to not paying back the debt,” either to domestic institutions or foreign
20
creditors (Popa 6). Thus all taxpayers will bear the tax burden, on a delay, of the
subsidy to only those members of society who are able to take advantage of the
homeownership subsidy. Electorally, the “median voter will determine the
amount of subsidy and price appreciation that is generated, by setting her
marginal cost for the subsidy equal with her marginal benefit from house price
appreciation” (Popa 8). The outcome will be a result of the share of homeowners
in the population: the more homeowners, the more likely the median voter will
benefit from appreciation, and the more likely politicians will ensure that credit
criteria favors homeowners.
It also seems necessary to consider any effects on home prices that arise
from specific homeownership policies. These policies could include the size of
the mortgage tax deductions, the regulation of loan-to-value (LTV) ratios, and the
presence of government-sponsored agencies (GSE) such as Fannie Mae and
Freddie Mac in the United States. Homeowner policies may be related to the size
of the homeownership political coalition identified by Popa. Through a look at
homeownership patterns, country-specific electoral factors may prove to be just as
important as broad cross-country institutional mechanisms.
1.3 Hypothesis
Although all of the above arguments appear relevant to the observed
variation in house price appreciation in the 2000s, none seem to be sufficient by
themselves to explain the observed pattern in housing bubbles. As we might
expect, several liberal market economies such as Ireland, the U.S. and the U.K.
saw very large bubbles, which did in fact burst. This is not true for Canada

21
however, where there was sustained appreciation without a subsequent decline in
home prices. A prototypical coordinated market economy like Germany
experienced no bubble, CMEs like the Netherlands and Sweden did. Given that
these countries have large welfare states, it suggests that it is not always true that
redistribution substitutes for deregulation of financial markets. Likewise while
many countries with high ownership rates did experience large bubbles, others
such as Italy, Belgium, and Finland did not. The goal of this thesis, building on
work done in Government Department coursework, will be to explore connections
within the above strains of literature and suggest under what conditions they apply
in advanced democracies (focusing on a set of eighteen Organization for
Economic Cooperation and Development (OECD) member countries).
A key argument in this thesis is that in order to understand the politics of
housing bubbles, it is necessary to consider the impact of both organized group
interests and electoral politics, and how the two condition each other. The most
relevant group politics revolve around the financial sector, its strength and
political clout dictated by its size and importance to an economy. Household
political decision-making on the other hand involves choices based on benefits
received from the government’s social spending and the real and perceived
economic advantages of being a homeowner. These relationships will be
explored with a mindfulness of political economy classifications as outlined in
VOC theory, contemplating the extent to which outcomes are conditioned by
broader institutional conditions. This thesis predicts that house price appreciation
outcomes are a result of political parties weighing two political incentives: (1) to
22
promote the advanced sectors of the economy to stimulate growth and cultivate a
reputation for good economic governance, and (2) to concentrate scarce
government resources on pivotal portions of the electorate. Given specific
national institutional and structural profiles, these incentives lead to distinct
policies and policy outcomes, which explain the observed pattern of housing
bubbles.
23
Chapter 2: Theory
2.1 Hypothesis Revisited
This thesis will analyze the causes of house price appreciation, specifically
the importance policy-makers place on both the promotion of powerful economic
sectors crucial to national economic health and the electoral returns from targeting
specific constituencies. Expressly, it will test the hypothesis that the occurrence
and magnitude of a housing bubble is positively related to the political and
economic power of a national financial sector, negatively related to levels of
social spending and redistribution, and positively related to national
homeownership rates. In addition to these relationships, it will use the VOC
classifications to test the extent to which certain archetypes of contemporary
democratic capitalism are more likely to experience house price appreciation.
These associations, and their conjectured causal mechanisms, are reiterated and
outlined below building upon the seminal contributions of the authors considered
in the literature review.
2.1.1 Independent Variables
Financial Sector
The reasoning of the case for the financial sector’s contribution to a
bubble is as follows. Large, competitive financial sectors will hold more political
power with policy-makers and regulators. If a financial sector is particularly
integral to the national economy and comparatively advantageous in the
international market, governments will be incentivized to ensure its success by
24
regulating in its favor and facilitating its profitability. In the words of Iversen and
Soskice: “Governments provide and/or underwrite an institutional framework
which enables advanced sector companies to develop and carry forward their
comparative advantages” (Iversen and Soskice, “Politics & Capitalism” 9).
Crucially, this government incentive also translates into deregulation and fewer
limitations on the sector’s activity, allowing for more lucrative and riskier
financial operations. The search for returns in a deregulated environment
translates into a demand for more mortgages, at times given to buyers with
questionable creditworthiness. Ever more complicated ways of mitigating risk
allegedly serve to prevent anything but idiosyncratic default risk. Deregulation
also allows banks to find creative ways to move risk off of their own balance
sheets (credit default swaps in the U.S. are an excellent example), thereby
decreasing leverage ratios that could limit further borrowing. The relaxed
underwriting standards and demand for mortgage assets breed an environment of
loose mortgage lending criteria and house price speculation. But when the first
signs of a problem become apparent, the information asymmetry created by the
complexity of the derivative products and securitization schemes make it virtually
impossible to assess, and the consequences of adverse selection threaten to
paralyze the market (Beltran and Thomas).
Social Spending
National governments that have inherited relatively weak social protection
systems are likely to face more electoral discontent in the middle and lower
classes than those countries with robust legislated social spending. Intuitively,
25
countries with weaker welfare states have more unequal societies, particularly in
recent decades. Even if politicians wish to create a more redistributive social
policy, changes to welfare policies are quite electorally difficult. Governments in
these more unequal societies with low levels of social spending may therefore be
more likely to respond to this dilemma by facilitating private debt rather than
increasing public spending. In other words, the state will work to make private
credit more available as a substitute when public programs fall short. Thus
progress, mobility, and the accumulation of assets are achieved by relying on a
household’s future earnings rather than the government’s. Housing is a
particularly salient part of this narrative; as home prices go up in response to
relaxed credit conditions, households feel effectively wealthier, spend more as
consumers, and are less likely to take out their economic frustration on politicians.
Elected policy-makers have incentives to relax credit and encourage rising home
prices as the main source of household wealth. As Rajan purports, an “important
political response to inequality was populist credit expansion, which allowed
people the consumption possibilities that their stagnant incomes otherwise could
not support” (104). In addition to making owners feel wealthier and less
concerned about government redistribution, housing wealth may serve social
insurance purposes by creating equity that may be used to smooth out income
volatility (Ansell).
Homeownership Rates
High homeownership rates are an indication that homeowners are an
important political constituency to elected officials. The larger the portion of the
26
population represented by homeowners, the more likely an elected official on
either side of the political spectrum will be targeting a median voter who is a
homeowner. It is then more expected that the government will arrange for an
effective subsidy to homeowners, for example an especially low mortgage interest
rate or a tax subsidy. The logic does not necessarily require the median voter
theorem because in center-left and center-right coalitions, if the center represents
homeowners it is reasonable to think their interests will factor in to coalition
bargaining. Policies that incentivize homeownership and/or benefit homeowners,
such as mortgage tax deductions, high maximum LTVs, and government agencies
that promote homeownership, will be popular for politicians or necessary for
government formation. These are the same policies and institutions that can
create speculation in the housing market. Additionally, in countries where
homeownership is more prevalent, potential effects of a ‘culture’ of
homeownership are more significant.
2.1.2 The Relevance of VOC
The traditional political economy institutions in CMEs and LMEs, as
defined by Hall and Soskice, present a bifurcation: dominant, competitive
financial sectors paired with relatively low levels of social spending in LMEs and
less market-driven financial sectors oriented towards the traded sector paired with
relatively high levels of social spending in CMEs. All countries within this
framework will presumably orient politics and regulation towards the sectors and
industries in which their institutional framework renders them most competitive.

27
Given that the definitions of LMEs and CMEs address two groups of independent
variables in this paper’s examination, it is valuable to review more thoroughly
these two groupings and the mechanisms through which they would be more or
less prone to instances of significant house price appreciation.
Financial institutions, as the suppliers of capital, vary in size and system in
LMEs and CMEs. Companies and households in LMEs have access to capital
based on a traditional market, their credit-worthiness determined by “publicly
available financial data or current returns” (22). “Firms rely (more) on bond and
equity markets,” their cost of capital determined by the markets’ assessment of
their financial statuses (Hall and Soskice 67). Consistent with the primacy of
share price and current profitability on the capital markets, LME financial
“regulatory regimes are tolerant of mergers and acquisitions (M&A), including
the hostile (takeover)” (Hall and Soskice 27). The regulatory space within which
companies are able to engage in M&A activity, paired with the need to raise
capital in debt and equity markets creates demand for large investment banks that
play an advisory role as companies navigate the underwriting waters. That
demand facilitates the growth in size and economic power of investment banks
and other large financial institutions. “A highly developed stock market indicates
greater reliance on market modes of coordination in the financial sphere” (Hall
and Soskice 19). Market competition amongst banks combined with more relaxed
financial regulation incentivizes riskier, high-returning investments by financial
institutions. Importantly, LMEs tend to be importers of capital as savings flow
into those countries with financial systems able to provide the high returns
28
investors seek. This is reinforced by trade deficits that tend to be companions to
lax credit and buoyant domestic consumption. These deficits need to be
counterbalanced by the inflow of foreign capital that will end up as raw materials
for financial institutions.
Alternatively, capital markets in CMEs are likely to be more influenced
by non-market coordination, relying on information sharing and close-knit inter-
firm relationships. Companies in CMEs will have access to “patient capital,” as
banks and other capital sources seek long-term returns independent of current
corporate profitability (Hall and Soskice 22). In order to be convinced of the
value of their investments, banks and other providers of money are privy to
corporate “‘private’ or ‘inside’ information about the operation of the company”
not traditionally accessible to LME financial institutions (Hall and Soskice 22,23).
The result is a de-emphasis in CMEs of “share price or current profitability” so
integral to the operation of financial systems and the strength of the investment
banking sector in LMEs (Hall and Soskice 29). The increased access to non-
public information by CME capital providers also ensures more careful
monitoring and more transparency, in theory providing more protection against
potentially risky investments or market distortion.
LMEs and CMEs also demonstrate distinctly different orientations in
social policy and social spending. In a summary of Margarita Estevez-Abe,
Iversen, and Soskice’s chapter, Varieties of Capitalism’s introduction describes
the different welfare states attributable to LME and CMEs. “Virtually all liberal
market economies are accompanied by ‘liberal’ welfare states,” as defined by
29
Gosta Esping-Andersen, that “emphasi(ze)… means-‐‑testing and low levels of
benefits” (Estevez-Abe et al 50,51). CMEs on the other hand spend significantly
more on social policy. The VOC literature presents one explanation for this
marked difference by focusing on the kind of labor demanded by the differing
corporate strategies in the two types of countries. Corporate strategies in LMEs
“tend to require” “general, rather than specific, skills,” and enjoy the benefits of
fluid labor markets (5). Also in LMEs, limited levels of social protection
“reinforce the fluid labor markets that firms use to manage their relations with
labor” (Estevez-Abe et al 51). CMEs’ companies more often have “production
regimes that require a workforce equipped with high levels of industry-‐‑specific
skills” (Estevez-Abe et al 51). Social policy must compensate workers for
engaging in the specific kind of training companies require for their success,
“given the risk that, if they are laid off and must take employment in another
sector, they may never realize their investment” (Estevez-Abe et al). Generous
unemployment benefits “assure workers that they can weather an economic
downturn without having to shift to a job in which their investment in specific
skills does not pay off” (Estevez-Abe et al 51). “High levels of employment
protection tend to reflect higher levels of non-market coordination in the sphere of
industrial relations” (19). Employment protection is just one illustration of firm-
centered increased social spending found in CMEs.
Why should CMEs, whose institutional complementarities imply strong
patterns of social spending and cooperative, more coordinated financial sectors,
experience fewer and less severe instances of unsustainable house price
30
appreciation? The decreased dominance and market-dependence of financial
institutions in CMEs diminishes their economic and political power, reducing the
likelihood that regulation and policy will be favorable to the development of
excessively lenient credit conditions (Hall and Soskice 36). Secondly, higher
levels of social spending in CMEs, most of which entered the 20th century with
lower levels of inequality, reduce the incentives to policy-makers to use easy
credit to businesses and households as a tool to stimulate and equalize
consumption in the face of rising inequality. These two effects can be expected to
reinforce each other, causing less severe occurrences of housing ‘bubbles’ in
CMEs than in LMEs.
Considering how quantitative outcomes in this thesis map onto accepted
country classifications like those in the VOC literature will help explore the
predictive nature of the results. In other words, it will help the thesis explain not
only the facts contributing to the probability of a housing bubble, but also what
other factors those political economies may have in common and the roles they
play in a broad view of the global economy. As stated above, VOC theory is also
important to understanding arguments about macroeconomic imbalances and the
flow of capital from CMEs to LMEs.
But VOC does not have a clear account of electoral politics. In Hall and
Soskice, governments somehow always end up doing what is “complementary” to
the economy, but there is no account of political parties, electoral systems, or
what it is politicians are trying to achieve. This is something that has been
developed in much greater detail subsequently (see Iversen and Soskice (2006;
31
2009) and Cusack, Iversen, and Soskice (2007)), but not in the context of the
financial crisis. From an electoral politics perspective one might think of
“complementary” government policies as driven by “economic voting”, where
voters reward governments that produce good economic performance (e.g.,
Lewis-Beck; Powell and Whitten). That logic would engage the VOC notion of
“comparative institutional advantage” in a very straightforward manner. In
addition, however, political parties and governments also cater to voters’
distributive interests (Rehm 2011, and Rehm and Kitschelt 2006). These vary by
income, skills, risk-exposure, and so on, but for the purpose of understanding
housing bubbles they also vary by homeownership (Popa). As it turns out,
homeownership rates are not correlated to VOC categories like financial sector
and social spending are (see Table 1). Depending on the observed statistical
salience of the VOC classification, homeownership may therefore explain cases
that don’t follow the predicted patterns one might expect based on VOC.
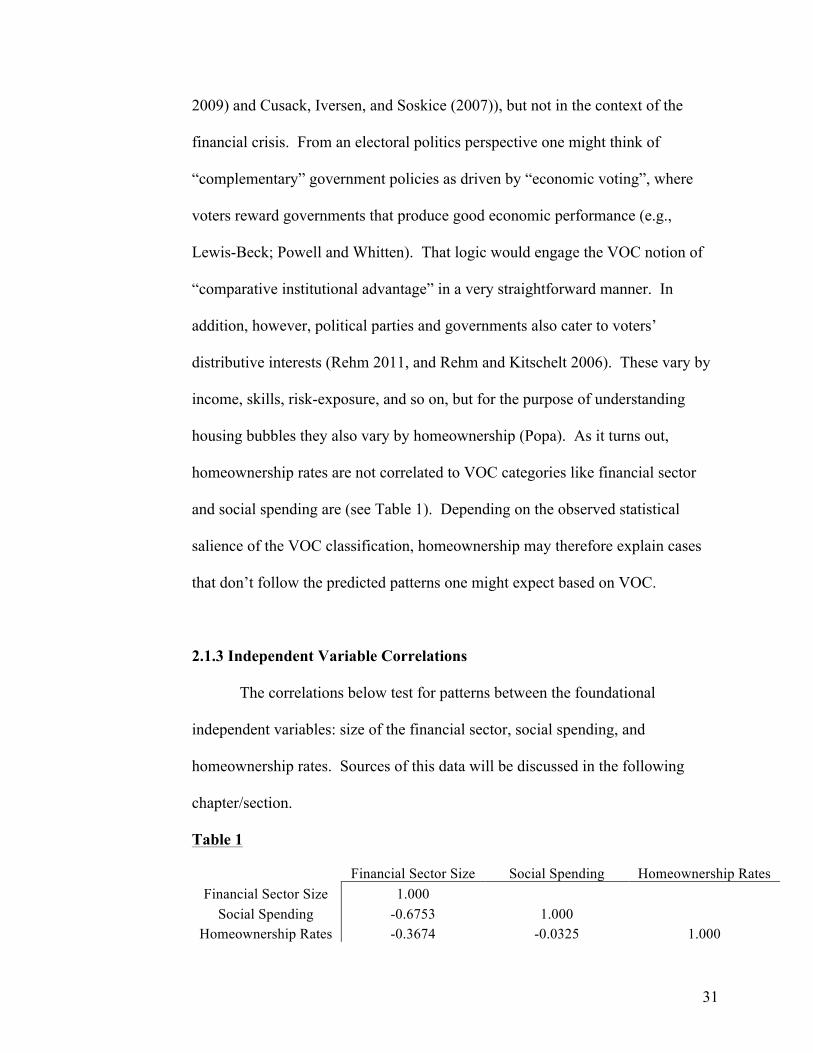
2.1.3 Independent Variable Correlations
The correlations below test for patterns between the foundational
independent variables: size of the financial sector, social spending, and
homeownership rates. Sources of this data will be discussed in the following
chapter/section.
Table 1
Financial Sector Size Social Spending Homeownership Rates
Financial Sector Size 1.000 Social Spending -0.6753 1.000
Homeownership Rates -0.3674 -0.0325 1.000

32
The correlation outcomes among the foundational independent variables
indicate a couple important points. There is a strong negative relationship
between financial sector size and social spending amongst the country data set
(see below), corroborating the underlying assumption of the VOC. However
there is no significant correlation between homeownership and either social
spending or financial sector size. Therefore if all three strains of causal
mechanism were to emerge as important explanatory factors, homeownership
rates could complicate the predictive nature of VOC.
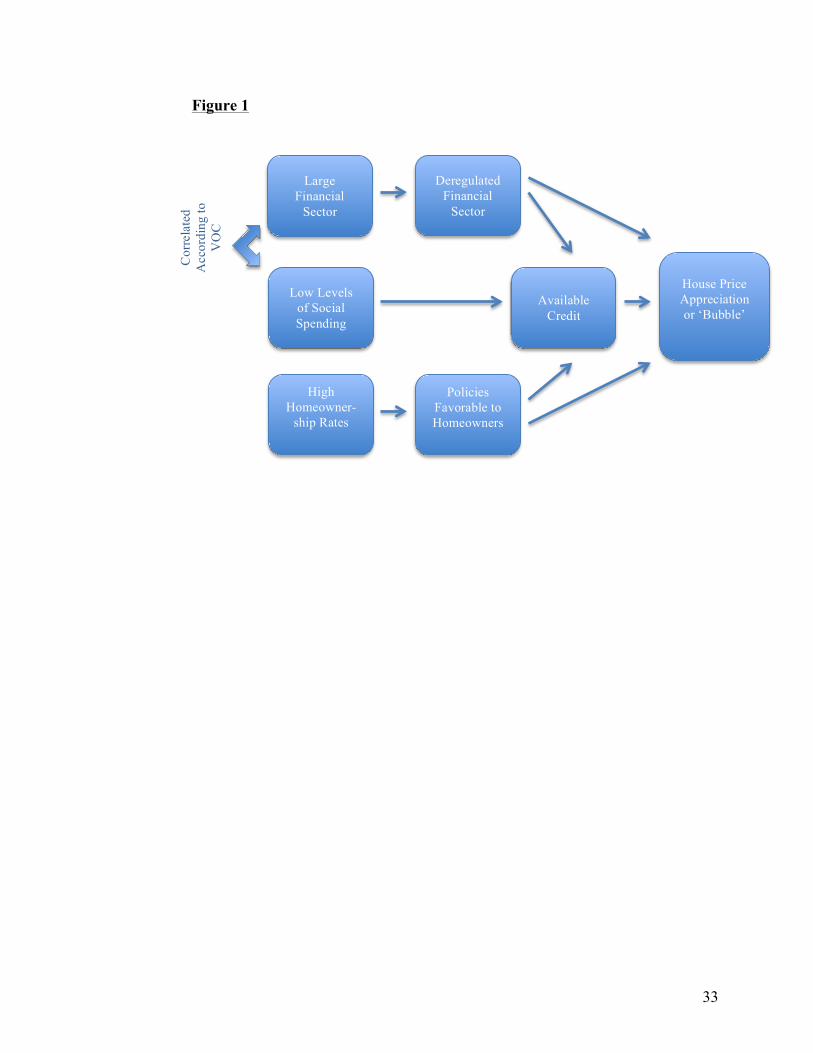
2.1.4 Initial Model of Hypothesis
Figure 1 below is a visual representation of the hypothesis showing the
three main strands of independent variables: financial sector, social spending, and
homeownership rates. Arrows indicate conjectured direction of causality. The
strong negative correlation between the size of the financial sector and the level of
social spending established in the previous section is denoted on the model as
well.
33
Figure 1
Cor
rela
ted
Acc
ordi
ng to
V
OC
Large Financial
Sector
Deregulated Financial
Sector
Low Levels of Social Spending
High Homeowner-
ship Rates
Policies Favorable to Homeowners
House Price Appreciation or ‘Bubble’
Available Credit
34
Chapter 3: Methods and Quantitative Evidence
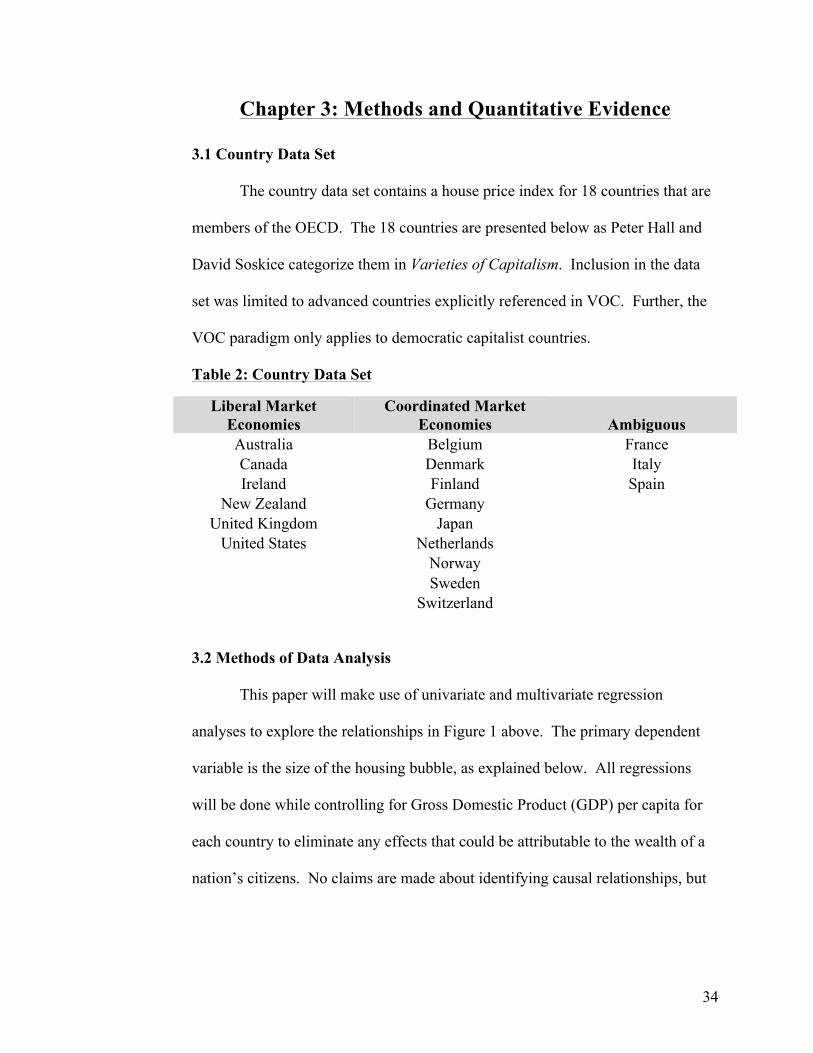
3.1 Country Data Set
The country data set contains a house price index for 18 countries that are
members of the OECD. The 18 countries are presented below as Peter Hall and
David Soskice categorize them in Varieties of Capitalism. Inclusion in the data
set was limited to advanced countries explicitly referenced in VOC. Further, the
VOC paradigm only applies to democratic capitalist countries.
Table 2: Country Data Set
Liberal Market Economies
Coordinated Market Economies Ambiguous
Australia Belgium France Canada Denmark Italy Ireland Finland Spain
New Zealand Germany United Kingdom Japan United States Netherlands
Norway
Sweden
Switzerland
3.2 Methods of Data Analysis
This paper will make use of univariate and multivariate regression
analyses to explore the relationships in Figure 1 above. The primary dependent
variable is the size of the housing bubble, as explained below. All regressions
will be done while controlling for Gross Domestic Product (GDP) per capita for
each country to eliminate any effects that could be attributable to the wealth of a
nation’s citizens. No claims are made about identifying causal relationships, but
35
the presence or absence of correlations corresponding to the hypotheses explained
above will speak to how plausible these hypotheses are.
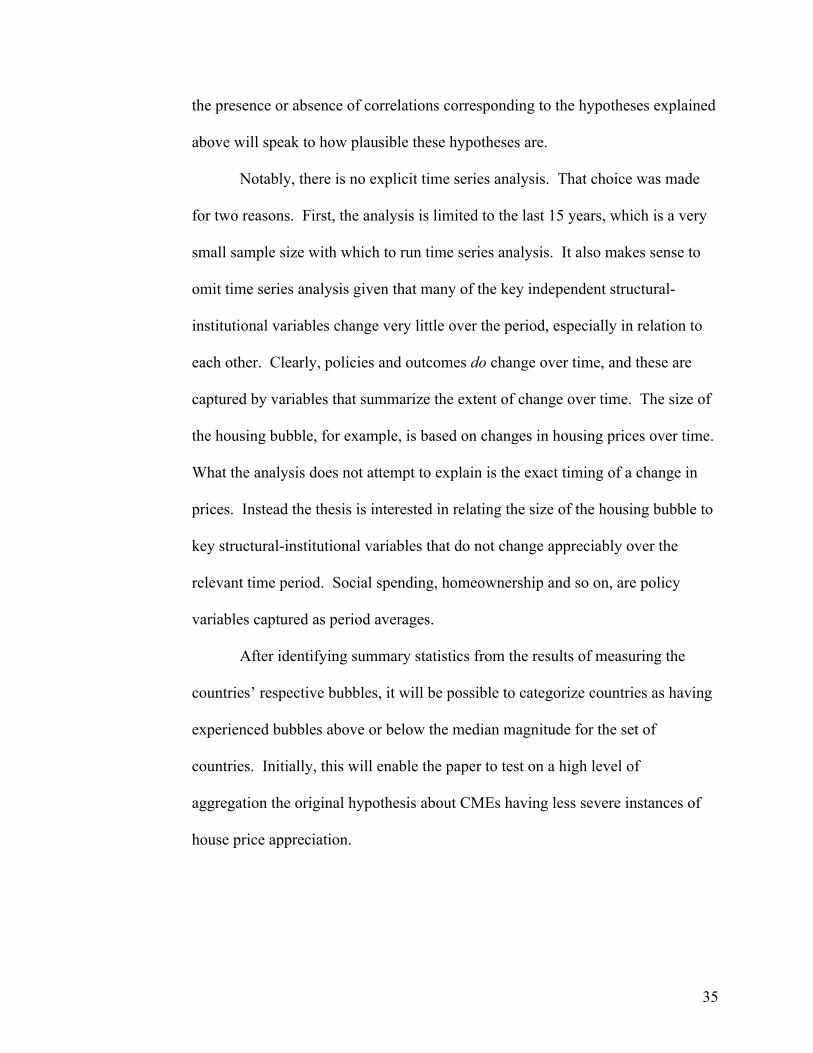
Notably, there is no explicit time series analysis. That choice was made
for two reasons. First, the analysis is limited to the last 15 years, which is a very
small sample size with which to run time series analysis. It also makes sense to
omit time series analysis given that many of the key independent structural-
institutional variables change very little over the period, especially in relation to
each other. Clearly, policies and outcomes do change over time, and these are
captured by variables that summarize the extent of change over time. The size of
the housing bubble, for example, is based on changes in housing prices over time.
What the analysis does not attempt to explain is the exact timing of a change in
prices. Instead the thesis is interested in relating the size of the housing bubble to
key structural-institutional variables that do not change appreciably over the
relevant time period. Social spending, homeownership and so on, are policy
variables captured as period averages.
After identifying summary statistics from the results of measuring the
countries’ respective bubbles, it will be possible to categorize countries as having
experienced bubbles above or below the median magnitude for the set of
countries. Initially, this will enable the paper to test on a high level of
aggregation the original hypothesis about CMEs having less severe instances of
house price appreciation.

36
3.3 Dependent Variable Data
House price indices for the selected group of countries were collected
from the Dallas Federal Reserve’s database. Prices were indexed with 100 equal
to 2005 price levels. For each year beginning with 2000 through 2012, a
country’s annual price index was compared to its average annual price index for
the five years then ended. The absolute values of the differences for each of the
thirteen years were summed, with the resulting total representing the measure of
the country’s housing price bubble used herein. This measure of the bubble using
moving averages captures both the magnitude of rising prices before the advent of
the financial crisis and their subsequent decline, if any. Moving averages also
avoid the measure becoming very sensitive to a particular year.
Not all countries in the data set experienced a bubble-like rise and fall of
values over the relevant period. A couple countries experienced price
depreciation, while others saw their prices rise without a significant disruption. A
true ‘bubble’ describes a scenario in which prices rise at an unsustainable rate,
only to decrease again after the bubble has burst. The moving average calculation
is meant to capture particularly fast or volatile price increases and decreases, but
does not quantitatively incorporate the direction of price changes or whether the
country experienced a decline. The measurement of the dependent variable will
be referred to as “measure of bubble,” but in the course of the analysis attempts
will be made to use more precise terms when referring to a country’s specific
experience with their home prices.

37
The year 2000 was chosen as a starting point in calculating the magnitude
of house price appreciation for the following reasons.
1. The 2000s are a period characterized by strong house price appreciation
across most of the developed world. While countries in the data set
experienced other spikes in home prices prior to this period, the
occurrence of a strong global pattern suggests that using a consistent time
period, rather than instances of bubbles at different times, effectively
controls for other common factors that occur, which enables a better look
at variation.
2. The early 2000s is considered the height of deregulation and the beginning
of severe financial speculation, and thus the appropriate period to consider
the role of politics in the growth and wider scope of activity of the
financial sector. A prominent herald of this period was the repeal of
Glass-Steagall in the United States in 1999, “which allowed commercial
banks to get into the investment banking business and thereby take on
more risks” (Krugman).
3. The VOC literature, originally published in 2001, implies a focus on the
period following much deregulation and institutional change in the 1980s.
For example, the United Kingdom pre-Thatcher would not be considered a
liberal market economy. To evaluate the relevance of the VOC
classifications, it makes the most sense to consider the last 15 years,
during which the most build-up to the global financial crisis occurred.
38
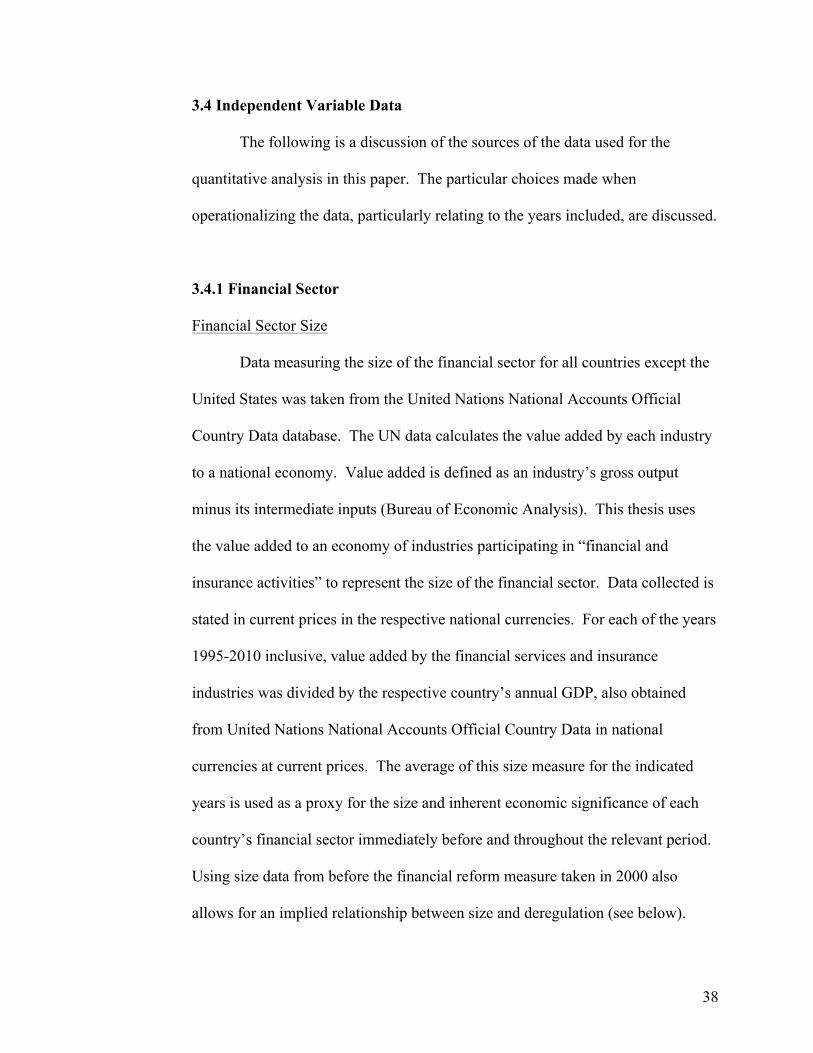
3.4 Independent Variable Data
The following is a discussion of the sources of the data used for the
quantitative analysis in this paper. The particular choices made when
operationalizing the data, particularly relating to the years included, are discussed.
3.4.1 Financial Sector
Financial Sector Size
Data measuring the size of the financial sector for all countries except the
United States was taken from the United Nations National Accounts Official
Country Data database. The UN data calculates the value added by each industry
to a national economy. Value added is defined as an industry’s gross output
minus its intermediate inputs (Bureau of Economic Analysis). This thesis uses
the value added to an economy of industries participating in “financial and
insurance activities” to represent the size of the financial sector. Data collected is
stated in current prices in the respective national currencies. For each of the years
1995-2010 inclusive, value added by the financial services and insurance
industries was divided by the respective country’s annual GDP, also obtained
from United Nations National Accounts Official Country Data in national
currencies at current prices. The average of this size measure for the indicated
years is used as a proxy for the size and inherent economic significance of each
country’s financial sector immediately before and throughout the relevant period.
Using size data from before the financial reform measure taken in 2000 also
allows for an implied relationship between size and deregulation (see below).
39
The United States data was pulled from the North American Industry
Classification System (NAICS). The United States Census Bureau collects
NAICS data to classify businesses in the United States economy into various
industries. Any businesses considered “finance and insurance” were included in
calculating the value added to the economy from the financial sector. Statistics
collected from NAICS were also at current prices in U.S. currency.
Financial Deregulation
To measure financial deregulation, this paper will use an index of financial
reform set forth by Abdul Abiad, Enrica Detragiache, and Thierry Tressel in a
paper published by the IMF in 2008. Their measure of “financial reform,”
essentially a proxy for financial liberalization, “records financial policy changes
along seven different dimensions: credit controls and reserve requirements,
interest rate controls, entry barriers, state ownership, policies on securities
markets, banking regulations, and restrictions on the capital account” (3).
“Liberalization scores for each category are then combined in a graded index that
is normalized between zero and one,” with zero representing the “highest degree
of repression” (Abiad Erica and Tressel 3,4). This paper will use the financial
reform index from 2000, the first year of price appreciation with which the
analysis is concerned, to treat deregulation as a precondition to rising prices in the
early 2000s.
40
3.4.2 Social Spending and Inequality
Two measures of social spending, and one measure of inequality, will be
tested for an effect on house price appreciation.
Social Spending
Social spending is quantified using social expenditure as a percent of
GDP. This statistic is taken from the OECD’s Social Expenditure Database
(SOCX). Two different values will be used: an average of the percentages from
1998 through 2007 and a single percent value from 2000 or the year closest to
2000 for which there is data. This is an effort to capture levels right at the
beginning of the period of concern, as well as understand the differences among
countries for the entire period.
The second measure of social spending is the expected benefit index
formulated by Lyle Scruggs, a professor of Political Science at University of
Connecticut, in his piece titled “The Generosity of Social Insurance, 1971-2002.”
The expected benefit index is calculated as the product of the replacement rate
and the coverage rate for unemployment insurance, sickness benefits and pension
benefits. The index ranges from zero to three, with zero representing the weakest
benefits and three the most generous. The measures are from 2002, and data is
available for all countries with the exception of Spain.
Income Inequality
The Gini coefficient is a measure of income inequality that makes use of a
Lorenz curve. A coefficient with G equal to zero would mean every person in
society earns the same amount of money while the closer the coefficient is to one
41
the more unequal the society. Gini coefficient data was obtained from the OECD
Income Distribution Database, supplemented by the World Bank’s World
Development Indicators for Switzerland. The value calculated by the source
represents disposable income, post taxes and transfers, for the total population.
The variables used for the Gini Coefficient are the average of available data from
1998-2007, as well as from the year 2000 or the year closest to 2000 for which
there is data.
3.4.3 Homeownership
Homeownership Rates
Rates of homeownership in European countries were obtained from
Eurostat, the statistical office of the European Union, and represent the
distribution of population by owner tenure status. Data for the non-European
countries in the data set was collected from their respective national census
websites and represents the percent of households/dwellings with owner tenure
status. Available values from 1995-2007 were averaged, with a minimum of three
measurements within that period obtained for all countries except Switzerland,
which was estimated based on subsequent years. Popa also relied on Eurostat, but
used 2002 figures rather than an average over a period.
Policies Related to Homeownership
This thesis contemplates that higher homeownership rates will result in a
greater prevalence of policies favorable to homeowners. Examples of such
homeowner policies were quantified using “Housing Markets and Structural

42
Policies in OECD Countries,” written by Dan Andrews, Aida Caldera Sanchez,
and Asa Johansson for the OECD’s Economic Department. The following are the
statistics that will be used in the analysis, all of which were calculated by the
authors based on responses to the OECD Housing Market Questionnaire. The
values used are for 2009, and thus this paper assumes there were few changes in
the nature of these variables in the last decade.
Figures for tax relief on mortgage debt “take into account if payments on
mortgage debt are deductible from taxable income and if there are any limits on
the allowed period of deduction or the deductible amount, and if tax credits for
loans are available” (Andrews 40). Countries without any tax relief are given a
value of zero. Values are conceived as tax wedges, effectively the difference
between market interest rates and the after-tax debt financing costs.
Transaction costs in buying and selling a home include transfer taxes,
registration fees, notarial and other legal fees, and typical real estate agency fees.
The authors again calculated the figures from the OECD Housing Market
Questionnaire.
Degree of rent control in the private market indicates “the extent of controls of
rents, how increases in rents are determined and the permitted cost pass-through
onto rents in (a) country”. This includes “whether rents can be freely negotiated
between the landlord and the tenant, coverage of controls on rent levels, and the
criteria for setting rent levels (market based, utility/cost based, negotiation based
or income based” (Andrews 47). The larger the homeownership base, the less
likely the government would prioritize rent control.

43
It should also be mentioned that credit availability is itself a homeownership
policy. The above discussions focus on policies that incentivize homeownership
through avenues that are not primarily credit related. It is quite possible that the
most important manifestation of favorable polices towards homeowners is
captured by the available credit variable. Relaxed credit criteria are the only
effective subsidies suggested by Popa. This analysis is meant to build on Popa’s
argument by considering homeownership’s impact on non-credit variables as
well.
3.4.4 Measures of Available Credit/Credit Policies
A measure of changes in levels of household long-term debt relative to
GDP will be used to represent available credit and (relaxed) credit policies in
establishing their relationship to house price appreciation.
Homebuyers are typically constrained by down payment requirements and
the amount of the monthly payment they can afford when shopping for a home.
There are two main contributing factors determining the amount of credit a buyer
will obtain when purchasing a home. The loan-to-value (LTV) ratio represents
the maximum percentage of a home purchase price that banks are willing to lend
to homebuyers. The larger the LTV ratio, the smaller the down payment required
from the buyer at the time of purchase. High LTVs incentivize homeownership
by decreasing the upfront cash a buyer must have, and transferring the financial
burden into the future. The larger the sum of money a buyer can borrow, the
higher the purchase price he/she will be willing to pay, especially if the
44
prospective buyer is optimistic that continued appreciation will increase his equity
beyond the original down payment.
The lower the interest rate charged for a mortgage, the smaller the
borrower’s monthly payment. The monthly payment also drives a borrower’s
evaluation of the purchase price: a lower interest rate will make a buyer more
likely to assume a greater principal obligation. Again, if the prospective buyer
has the expectation of future appreciation, he is more likely to choose financing
beneficial in the short run on the assumption that accumulated home equity will
make other options available later. However interest rates, driven by complex
domestic forces and varying significantly by loan product (fixed vs. adjustable
rate, etc.), are problematic to aggregate and meaningfully compare across
countries.
In light of the considerations discussed above, the expansion of available
credit will be operationalized using the percent change in outstanding household
long-term debt as a percentage of GDP between 2000 and 2007. Although the
figures include other kinds of household long-term debt, most of the value is
comprised of mortgage debt. (The mortgage component was not available for all
the countries in the data set.) The inclusion of other debt does not seem a major
concern, given that the availability of credit for other purposes is likely to be
correlated with accessibility of mortgage credit. The statistics were taken from
OECD iLibrary. All percent changes are from 2000 to 2007 except Ireland and
Switzerland. Because Ireland is missing data for 2000, the figure used represents
45
a change from 2001 to 2007. Switzerland does not have available data until 2005,
so its percent change is only between 2005 and 2007.
The change in the level of outstanding long-term household debt is
positive for almost all countries in the data set. The figures can be thought of as
having three component parts: effects due to favorable credit criteria (interest
rates and LTV), effects due to changes in home prices, and effects due to changes
in the number of homes for which mortgages have been obtained (increasing
homeownership). In the real world, these three effects are interacting and
reinforcing. It is difficult therefore to determine how much of the change in long-
term household debt is exactly attributable to favorable credit conditions
independent of price changes and increases in ownership. However, one can
determine anecdotally that the credit conditions do impact long-term credit above
and beyond any price appreciation or increase in owned dwellings: for example
the United States experienced a 55 percent increase in the level of household
long-term debt between 2000 and 2007, while the national level of household
dwelling assets, which controls for prices and number of owned dwellings, only
increased 20 percent (OECDstat). The difference between levels of long-term
household debt and levels of household dwelling assets is not statistically relevant
when regressed against the measure of bubble. Data for the levels of household
dwellings are missing however for Ireland and Spain. Since those two countries
had particularly high levels of debt and house price appreciation, their exclusion
seems to complicate that analysis.
46
3.4.5 Inclusion of Housing Investment in Analysis
A variable of relevance that emerged from research is capital formation in
housing. Although not integrated into the initial hypothesis, the growth in the
housing stock seems an informative figure worth tracking through the analysis.
The data accumulated is a percent change in the volume of gross fixed
capital formation in housing between 1995 and 2007. Gross fixed capital
formation “is measured by the total value of a producer’s acquisitions, less
disposals, of fixed assets during the accounting period plus certain additions to the
value of non-produced assets (such as subsoil assets or major improvements in the
quantity, quality or productivity of land) realized by the productive activity of
institutional units” (UN statistics division). This statistic represents the level of
growth and investment in housing. These values were obtained from the OECD’s
data from its Economic Outlook #87. The volume (which is index based) rather
than current value of the capital formation was used. The use of volume should
more accurately measure investment because it is adjusted for concurrent price
appreciation that could inflate the figures. The analysis is most concerned about
the change in quantity of activity, not the prices at which that activity was valued
at the time. The figures for capital formation will be referred to conceptually as
‘housing investment’ in this paper.
Housing investment will inform our understanding of supply and demand
mechanisms during times of price appreciation. As a variable that represents
supply, increases in capital stock can be understood as both a response to demand
and price appreciation, and an indicator of how sustainable such appreciation
47
might be based on whether the increased supply has met, or exceeded demand.
Continued price appreciation in the presence of significant supply increases
suggests the real estate may have become a speculative investment strategy, as
investors purchase residential assets in which they do not plan to actually reside in
the anticipation of continued increases in values. It is also logical that housing
investment is encouraged by expanding favorable credit conditions, not just
through the demand created by homebuyers’ access to credit but also by the credit
terms available to homebuilders. If credit is made more available, residential real
estate developers can build at lower costs at the same time the prices at which
homes can be sold may be increasing. Several relationships involving housing
investment will be explored.
3.4.6 Varieties of Capitalism
Two regression analyses directly involve VOC.
Coordination Index
Three years after the initial publication of Varieties of Capitalism, Peter
Hall, with the help of Daniel Gingerich, constructed an index of coordination
based on the predictions of VOC. Components of the index include shareholder
power, dispersion of control (of firms), size of stock market, level of wage
coordination, degree of wage coordination, and labor turnover. Countries fell on
a scale of zero to one, with more coordinated economies earning higher values.
The index was compiled using statistics from 1990-1995. The connection
between the coordination index and the magnitude of the bubble will be tested.

48
Current Account Balance
Because an aspect of this paper’s engagement with VOC involves
macroeconomic imbalances in the developed world, the balance of the current
account as a percentage of GDP will also be included in the analyses. A country’s
current account records all current nonfinancial transactions between residents of
one country and the rest of the world. It consists of four sub categories: trade
account, service account, income account, and unilateral transfers account (Oatley
205). “Debits are balanced against credits to create an overall current-account
balance” (Oatley 206). A negative balance of the current account, or current
account deficit, indicates that the total payment by a country’s residents to
foreigners is greater than the total paid to a country’s residents by foreigners. The
capital account on the other hand registers financial flows and the purchases of
financial assets. The capital and current accounts are always “mirror images of
each other,” meaning a country with a current account deficit must be running a
capital account surplus (Oatley 207). The capital account surplus represents “a
willingness of residents of other countries to finance (a certain country’s)
expenditures in excess of income” (Oatley 207). For example, if residents of the
United States are consuming more than they are earning in income each year
(current account deficit), foreign money must be loaned to the United States,
through the sale of financial assets (surplus on the capital account) to cover their
consumption (Oatley 207).
Including the balance of the current account will assist the paper in
determining the effect of the magnitude and direction of capital flows. It will

49
additionally help quantify the bifurcation between CME and LME. According to
recent reflections on VOC and macroeconomic imbalances referenced earlier,
LMEs will tend to run current account deficits while CMEs will run current
account surpluses.
Current Account data was taken from the World Bank’s World
Development Indicators for all countries. The values are the current account
balance as a percent of national GDP. Annual balance figures were averaged for
the years 2005-2007, primarily as a result of limited data prior to 2005.

50
Chapter 4: Statistical Results and Discussion
4.1 Statistical Results
The following section is a discussion of the statistical results. Regression
results tables include coefficients and standard errors. The tables have dependent
variables listed horizontally along the top and independent variables listed
vertically down the left side.1
4.1.1 Price Appreciation Summary Statistics
Below is a summary of the dependent variable measure of home price
appreciation, or measure of bubble. Ireland represents the maximum value of
192.08, and Germany represents the minimum value of 33.01.
Table 3
Summary Statistics Mean 111.05 Median 115.94 Minimum 33.01 Maximum 192.08 Standard Deviation 35.36
4.1.2 Establishing the Relationship Between Available Credit and Price
Appreciation
Blue portions of the proposed causal model will be tested in this section.
1 I wish to thank Tess Wise of the Government Department and Steve White of the Economics Department for their help in analyzing the statistical output.
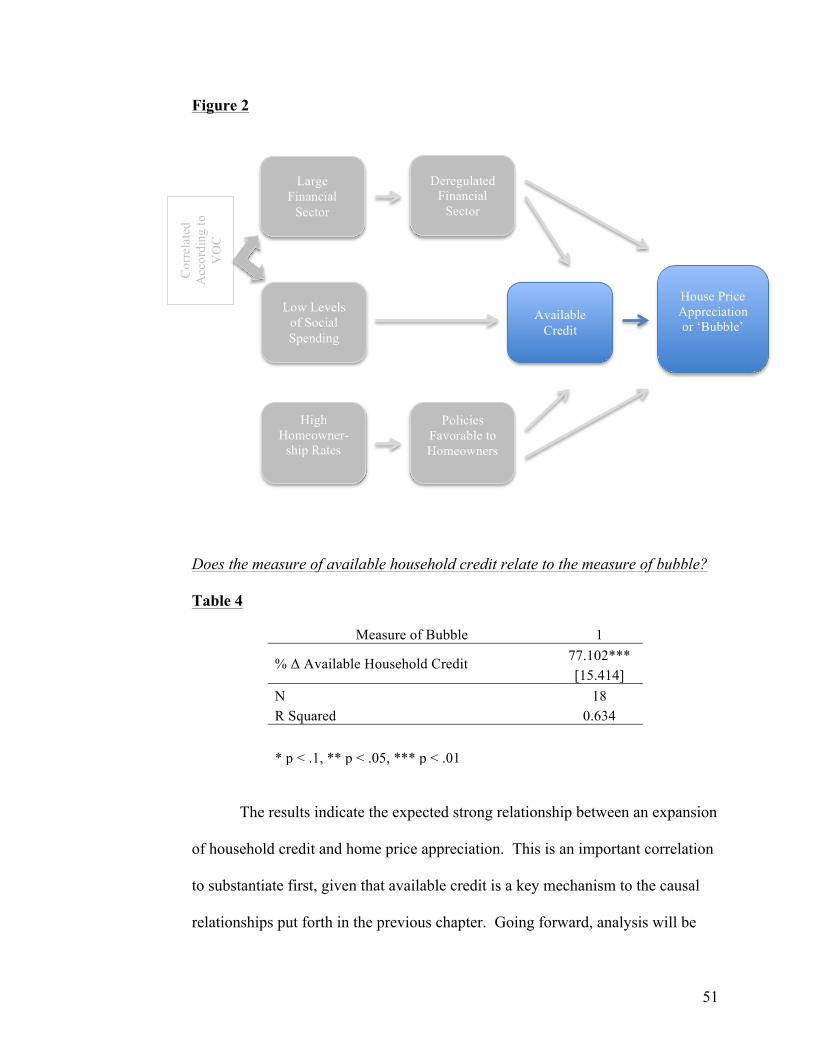
51
Figure 2
Does the measure of available household credit relate to the measure of bubble?
Table 4
Measure of Bubble 1
% Δ Available Household Credit 77.102*** [15.414]
N 18 R Squared 0.634 * p < .1, ** p < .05, *** p < .01
The results indicate the expected strong relationship between an expansion
of household credit and home price appreciation. This is an important correlation
to substantiate first, given that available credit is a key mechanism to the causal
relationships put forth in the previous chapter. Going forward, analysis will be
Cor
rela
ted
Acc
ordi
ng to
V
OC
Large Financial
Sector
Deregulated Financial
Sector
Low Levels of Social Spending
High Homeowner-
ship Rates
Policies Favorable to Homeowners
House Price Appreciation or ‘Bubble’
Available Credit
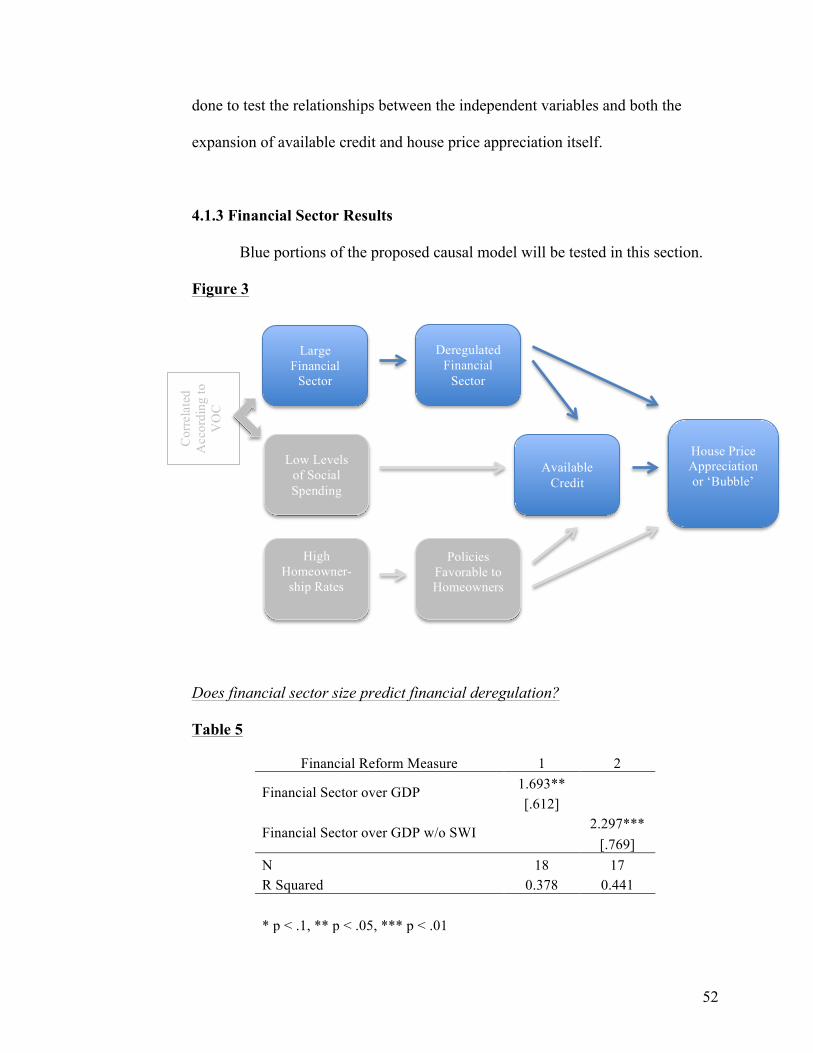
52
done to test the relationships between the independent variables and both the
expansion of available credit and house price appreciation itself.
4.1.3 Financial Sector Results
Blue portions of the proposed causal model will be tested in this section.
Figure 3
Does financial sector size predict financial deregulation?
Table 5
Financial Reform Measure 1 2
Financial Sector over GDP 1.693** [.612]
Financial Sector over GDP w/o SWI 2.297***
[.769]
N 18 17 R Squared 0.378 0.441
* p < .1, ** p < .05, *** p < .01
Cor
rela
ted
Acc
ordi
ng to
V
OC
Large Financial
Sector
Deregulated Financial
Sector
Low Levels of Social Spending
High Homeowner-
ship Rates
Policies Favorable to Homeowners
House Price Appreciation or ‘Bubble’
Available Credit
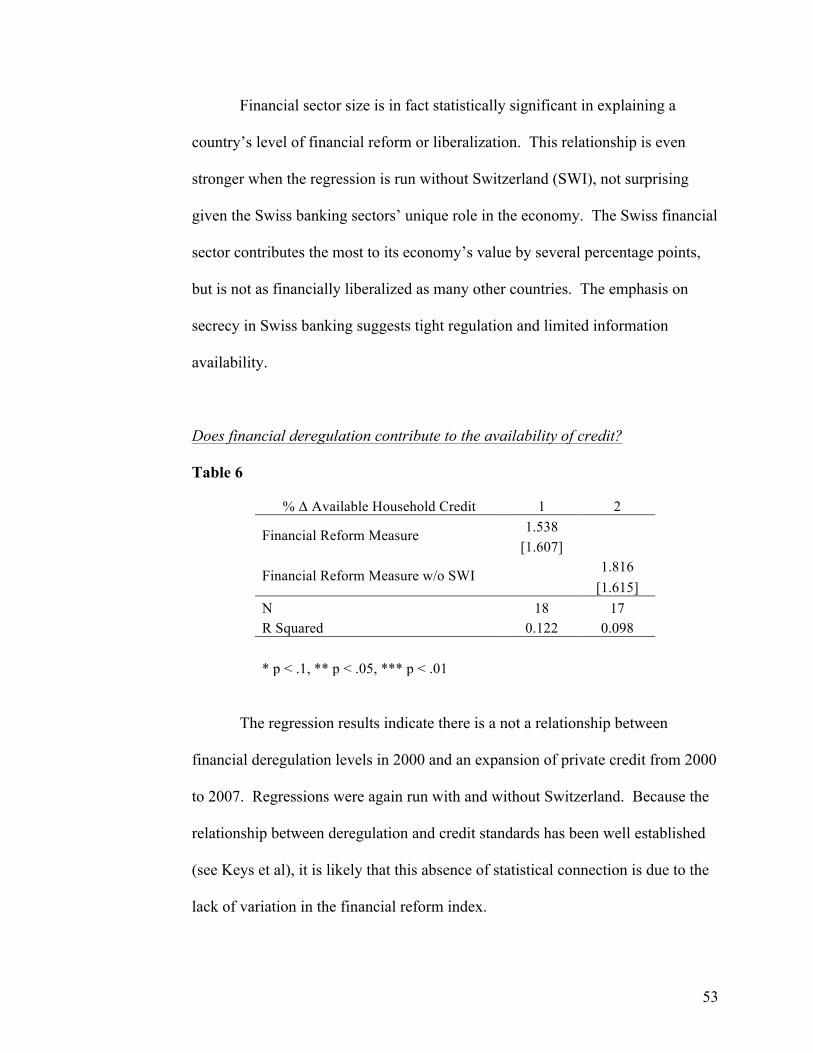
53
Financial sector size is in fact statistically significant in explaining a
country’s level of financial reform or liberalization. This relationship is even
stronger when the regression is run without Switzerland (SWI), not surprising
given the Swiss banking sectors’ unique role in the economy. The Swiss financial
sector contributes the most to its economy’s value by several percentage points,
but is not as financially liberalized as many other countries. The emphasis on
secrecy in Swiss banking suggests tight regulation and limited information
availability.
Does financial deregulation contribute to the availability of credit?
Table 6
% Δ Available Household Credit 1 2
Financial Reform Measure 1.538 [1.607]
Financial Reform Measure w/o SWI 1.816
[1.615]
N 18 17 R Squared 0.122 0.098
* p < .1, ** p < .05, *** p < .01
The regression results indicate there is a not a relationship between
financial deregulation levels in 2000 and an expansion of private credit from 2000
to 2007. Regressions were again run with and without Switzerland. Because the
relationship between deregulation and credit standards has been well established
(see Keys et al), it is likely that this absence of statistical connection is due to the
lack of variation in the financial reform index.

54
What explains house price appreciation?
Table 7
Measure of Bubble 1 2 3 4 5 6 7 Financial Sector over GDP
54.786
-668.041 [469.742]
[496.385]
Financial Sector over GDP w/o CHE
775.920
-5.789
[540.626]
[628.167]
Financial Reform Measure
293.773*
427.024**
186.658*
[142.378]
[170.396]
[92.708]
Financial Reform Measure w/o CHE
339.358**
340.340*
[128.498]
[170.628]
% Δ Available Household Credit
70.159***
[14.469]
N 18 17 18 17 18 17 18 R Squared 0.024 0.130 0.239 0.334 0.326 0.334 0.716
* p < .1, ** p < .05, *** p < .01
The above table indicates the relationships between financial sector size
and liberalization and the measure of bubble. Though financial sector size
doesn’t have a bearing on price appreciation according to these results, financial
reform does have an effect, especially when the analysis is performed without
Switzerland. Additionally, multivariate regressions (columns 5-7) indicate two
notable associations. First, columns 5 and 6 suggest that financial liberalization
contributes at some level to house price appreciation regardless of the size of the
financial sector. This is consistent with the hypothesis, as well as Seabrooke and
Schwartz’s discussion of securitization over size. Secondly, when change in
long-term household debt and financial reform are both regressed against the
measure of the bubble in column 7, percent change in household debt is a much
more important explanatory factor than financial liberalization – financial reform
is barely significant.
55
Financial Sector Results Discussion
Hypothesized effects of both the size of the financial sector and its level of
reform or deregulation are substantiated by the statistical results. Countries with
financial sectors that have historically added more value to the economy tend to
have been more deregulated in 2000, an informal starting point for the substantial
price appreciation in many countries. Additionally, with respect to those
countries that have indeed deregulated, regardless of size, it is more likely that
they 1) have experienced house price appreciation, and 2) the appreciation has
been unsustainable. This is consistent with the original hypothesis that there exist
incentives for policy-makers to deregulate financial sectors that are particularly
large and prominent, and that this liberalization is more likely to lead to relaxed
credit conditions and the appreciation of home prices.
The financial reform index however was not a predictor of credit
availability. Although this relationship was not statistically borne out in this
analysis, this is a seminal relationship in the narrative of the great recession.
Authors such as Keys et al have proved that more securitization has led to more
lax screenings of lenders, and thus more available credit. The failure of the
statistics to corroborate the association suggests a weakness in the data used to
analyze the effect of deregulation on available credit. It is possible that the
relatively low variation among the financial reform measures is a contributing
factor. Further, this paper is not willing to discredit the relationship between
liberalization and availability of credit, given the substantial literature supporting
the idea.
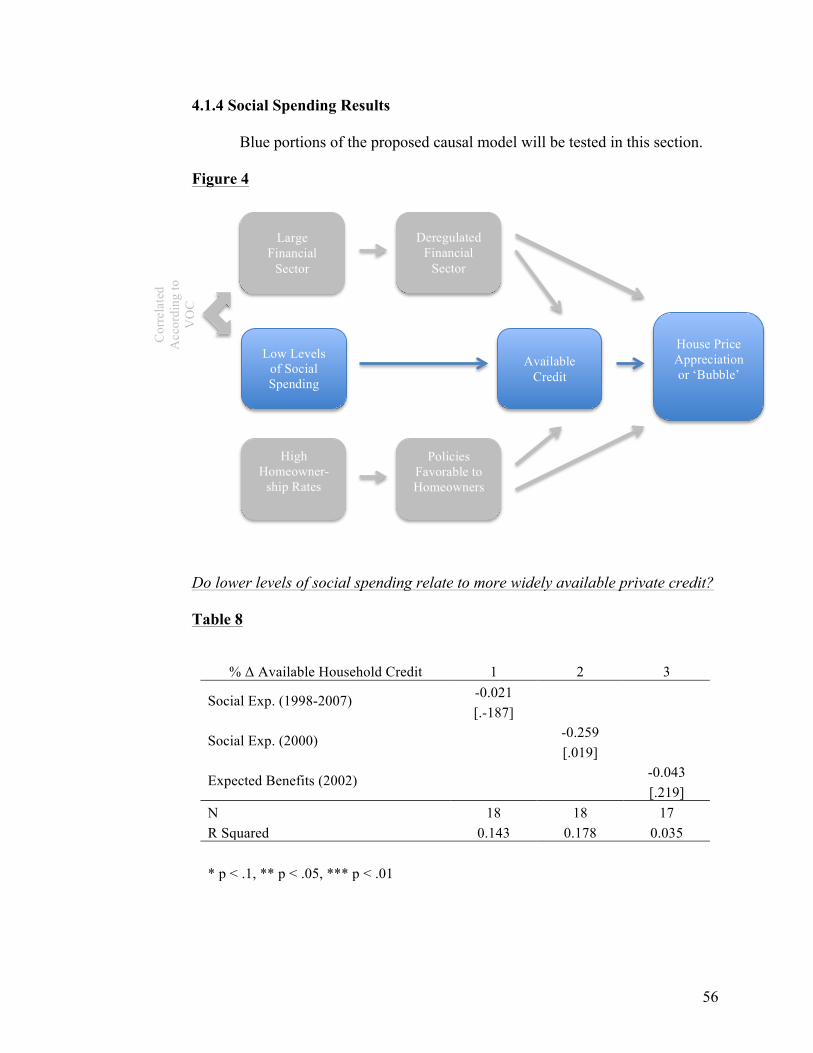
56
4.1.4 Social Spending Results
Blue portions of the proposed causal model will be tested in this section.
Figure 4
Do lower levels of social spending relate to more widely available private credit?
Table 8
% Δ Available Household Credit 1 2 3
Social Exp. (1998-2007) -0.021 [.-187]
Social Exp. (2000) -0.259
[.019]
Expected Benefits (2002) -0.043
[.219]
N 18 18 17 R Squared 0.143 0.178 0.035
* p < .1, ** p < .05, *** p < .01
Cor
rela
ted
Acc
ordi
ng to
V
OC
Large Financial
Sector
Deregulated Financial
Sector
Low Levels of Social Spending
High Homeowner-
ship Rates
Policies Favorable to Homeowners
House Price Appreciation or ‘Bubble’
Available Credit
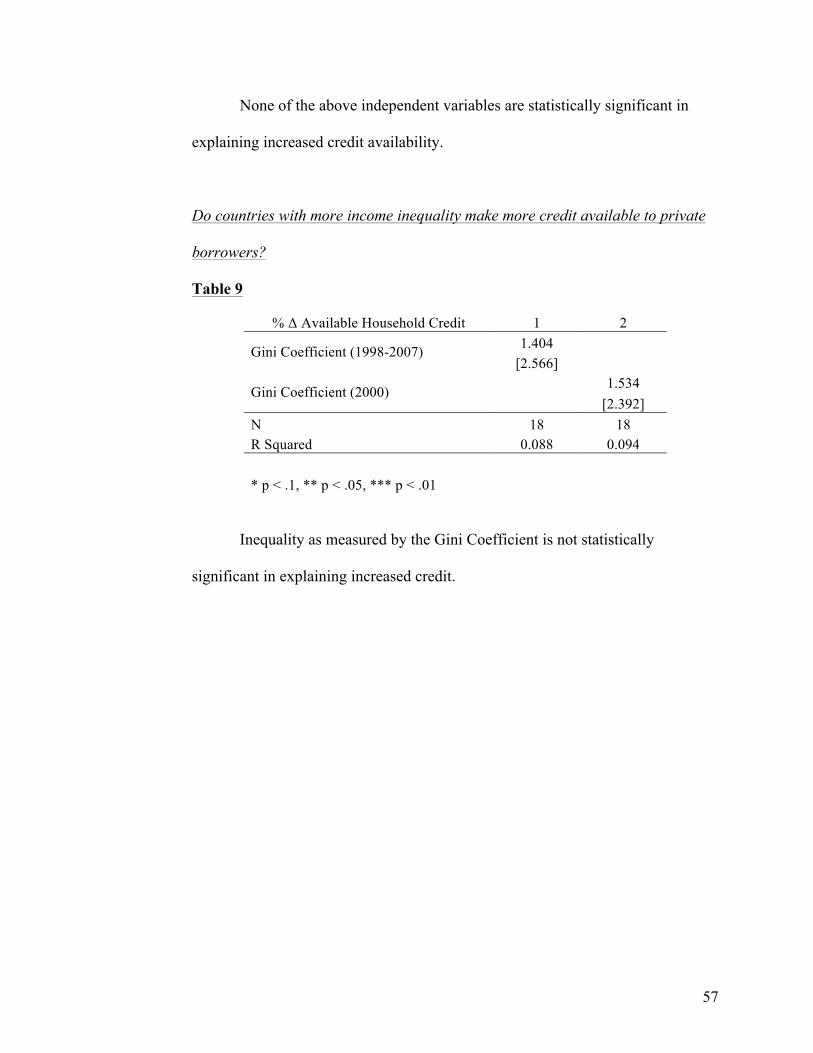
57
None of the above independent variables are statistically significant in
explaining increased credit availability.
Do countries with more income inequality make more credit available to private
borrowers?
Table 9
% Δ Available Household Credit 1 2
Gini Coefficient (1998-2007) 1.404 [2.566]
Gini Coefficient (2000) 1.534
[2.392]
N 18 18 R Squared 0.088 0.094
* p < .1, ** p < .05, *** p < .01
Inequality as measured by the Gini Coefficient is not statistically
significant in explaining increased credit.

58
What explains house price appreciation?
Table 10
Measure of Bubble 1 2 3 4 5
Social Exp. (1998-2007) -1.410 [1.860]
Social Exp. (2000) -1.792
[1.858]
Expected Benefits (2002) -1.666
[21.148]
Gini Coefficient (1998-2007) -54.362
[252.279]
Gini Coefficient (2000) 2.850
[236.392]
N 18 18 17 18 18 R Squared 0.059 0.080 0.003 0.026 0.023
* p < .1, ** p < .05, *** p < .01
None of the social spending and inequality independent variables explain
house price appreciation independent of the measure of available credit.
Social Spending Results Discussion
Social spending and inequality do not seem to explain variations in house
price appreciation at all. All variables had large P values and R squared values
less than 0.1. Existing work does find some support at the individual level that
housing wealth reduces support for social spending (Ansell), so the two appear to
substitute for each other to some extent in the minds of voters. It can also not be
ruled out that the fiscal constraints on social spending, which are felt everywhere,
have contributed to the pressure for liberalization. Streeck (2011), for example,
sees a common shift towards policies that ease private credit constraints as public
spending is capped. But the logic does not seem to provide much leverage on the

59
cross-national puzzle this thesis is trying to solve. In “A Liquidity Theory of
Social Policy Preferences,” Jacob Gerner Hariri, Amalie Sofie Jensen, and David
Dryer Lassen, posit that individuals and households that are liquidity constrained
are more likely to “support, and favor expanded, unemployment protection (and
social insurance more broadly), since such policies allow them to sustain
consumption even when income is temporarily low” (2). In their view,
employment risk and the disruption of spendable wealth is a risk that affects all
classes, with preferences for social spending indicated by the varying ability to
“privately bear it” (4). Further, the authors argue that home equity is illiquid, and
therefore a poor “cushion” against short-term health and employment risks (4).
“People with more exposure to future income losses are more likely to hold liquid
financial assets to draw upon in the event of a large drop in income” (12).
Although housing equity could potentially “substitute for liquid financial
holdings,” it is more difficult and costly to do so than other more liquid financial
vehicles (13).
The implication in their work is that those more concerned with their
ability to maintain consumption liquidity in the face of an income disruption will
be less likely to tie up wealth and equity in something as illiquid as housing.
However, if households can count on social insurance to cover their consumption
during illiquid times in the form of unemployment insurance, they will be more
inclined to invest their wealth in an asset like a home. Although their work is
beyond the scope of this thesis, it hints at an alternative understanding of the
connection between homeownership, homebuyers, and social insurance. The
60
initial hypothesis in this work was that low levels of social spending would spur
relaxed credit conditions, so households and individuals accumulate private debt
rather than rely on the state for social protection. Further, rising home prices and
household wealth is meant to spur consumption as homeowners feel richer
knowing they have an asset like a home. From the perspective of Hariri, Jensen,
and Lassen, residents of countries with high levels of unemployment insurance
will actually be more likely to maintain wealth in their homes than residents faced
with low unemployment insurance in their country. As a result, demand for
homes will be higher in countries with robust unemployment programs. The
forces of this paper’s hypothesis and the others’ work on liquidity suggest social
spending can have opposite affects on demand for homes. Though this paper will
not investigate this any further, it is a thought-provoking idea.
4.1.5 Homeownership Results
Blue portions of the proposed causal model will be tested in this section.
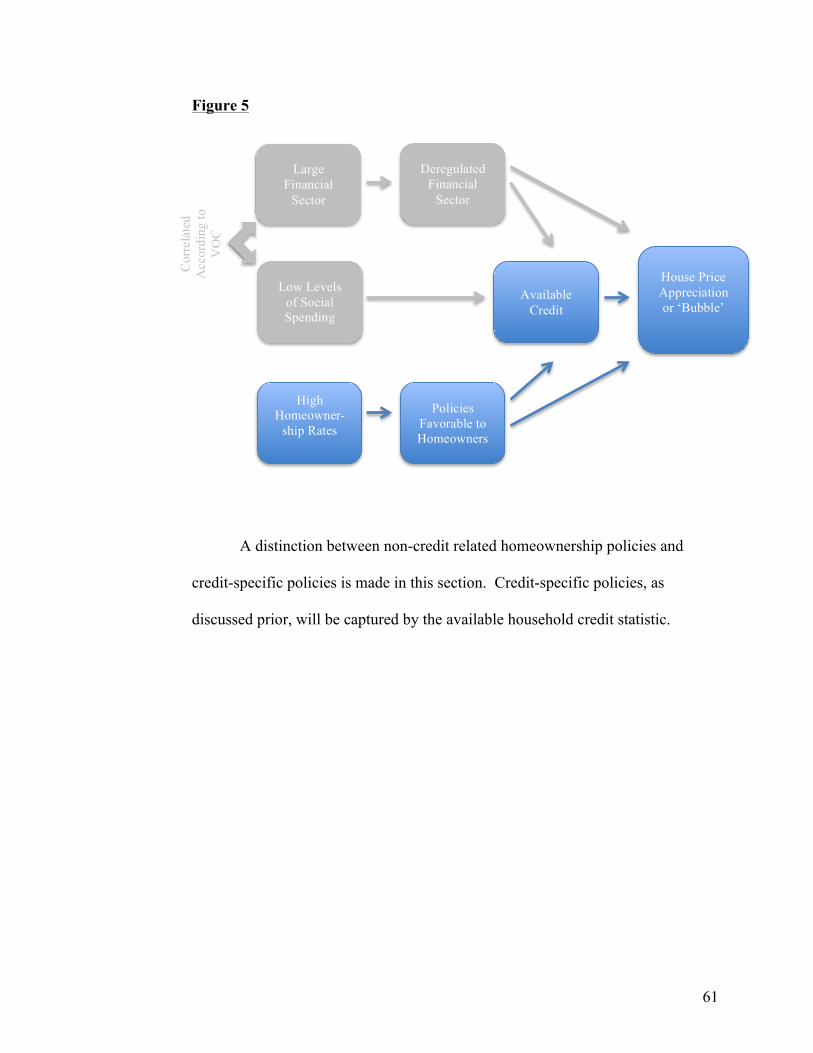
61
Figure 5
A distinction between non-credit related homeownership policies and
credit-specific policies is made in this section. Credit-specific policies, as
discussed prior, will be captured by the available household credit statistic.
Cor
rela
ted
Acc
ordi
ng to
V
OC
Large Financial
Sector
Deregulated Financial
Sector
Low Levels of Social Spending
High Homeowner-
ship Rates
Policies Favorable to Homeowners
House Price Appreciation or ‘Bubble’
Available Credit
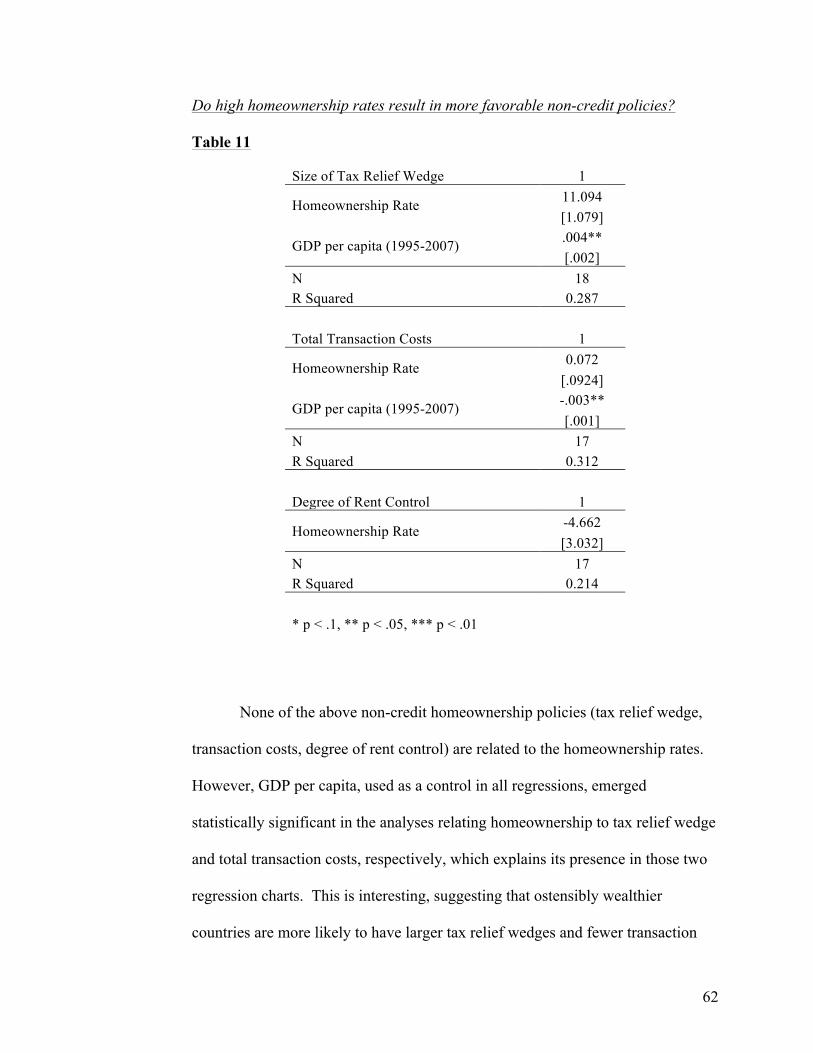
62
Do high homeownership rates result in more favorable non-credit policies?
Table 11
Size of Tax Relief Wedge 1
Homeownership Rate 11.094 [1.079]
GDP per capita (1995-2007) .004** [.002]
N 18 R Squared 0.287
Total Transaction Costs 1
Homeownership Rate 0.072 [.0924]
GDP per capita (1995-2007) -.003** [.001]
N 17 R Squared 0.312
Degree of Rent Control 1
Homeownership Rate -4.662 [3.032]
N 17 R Squared 0.214
* p < .1, ** p < .05, *** p < .01
None of the above non-credit homeownership policies (tax relief wedge,
transaction costs, degree of rent control) are related to the homeownership rates.
However, GDP per capita, used as a control in all regressions, emerged
statistically significant in the analyses relating homeownership to tax relief wedge
and total transaction costs, respectively, which explains its presence in those two
regression charts. This is interesting, suggesting that ostensibly wealthier
countries are more likely to have larger tax relief wedges and fewer transaction
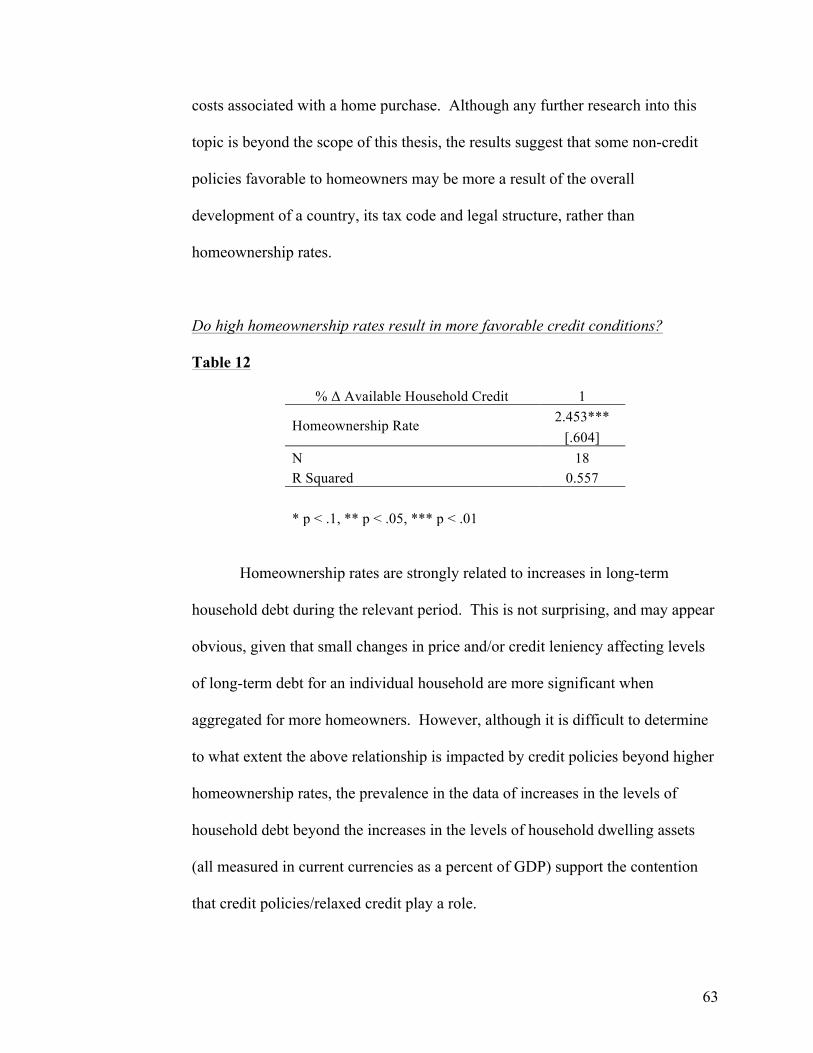
63
costs associated with a home purchase. Although any further research into this
topic is beyond the scope of this thesis, the results suggest that some non-credit
policies favorable to homeowners may be more a result of the overall
development of a country, its tax code and legal structure, rather than
homeownership rates.
Do high homeownership rates result in more favorable credit conditions?
Table 12
% Δ Available Household Credit 1
Homeownership Rate 2.453*** [.604]
N 18 R Squared 0.557
* p < .1, ** p < .05, *** p < .01
Homeownership rates are strongly related to increases in long-term
household debt during the relevant period. This is not surprising, and may appear
obvious, given that small changes in price and/or credit leniency affecting levels
of long-term debt for an individual household are more significant when
aggregated for more homeowners. However, although it is difficult to determine
to what extent the above relationship is impacted by credit policies beyond higher
homeownership rates, the prevalence in the data of increases in the levels of
household debt beyond the increases in the levels of household dwelling assets
(all measured in current currencies as a percent of GDP) support the contention
that credit policies/relaxed credit play a role.
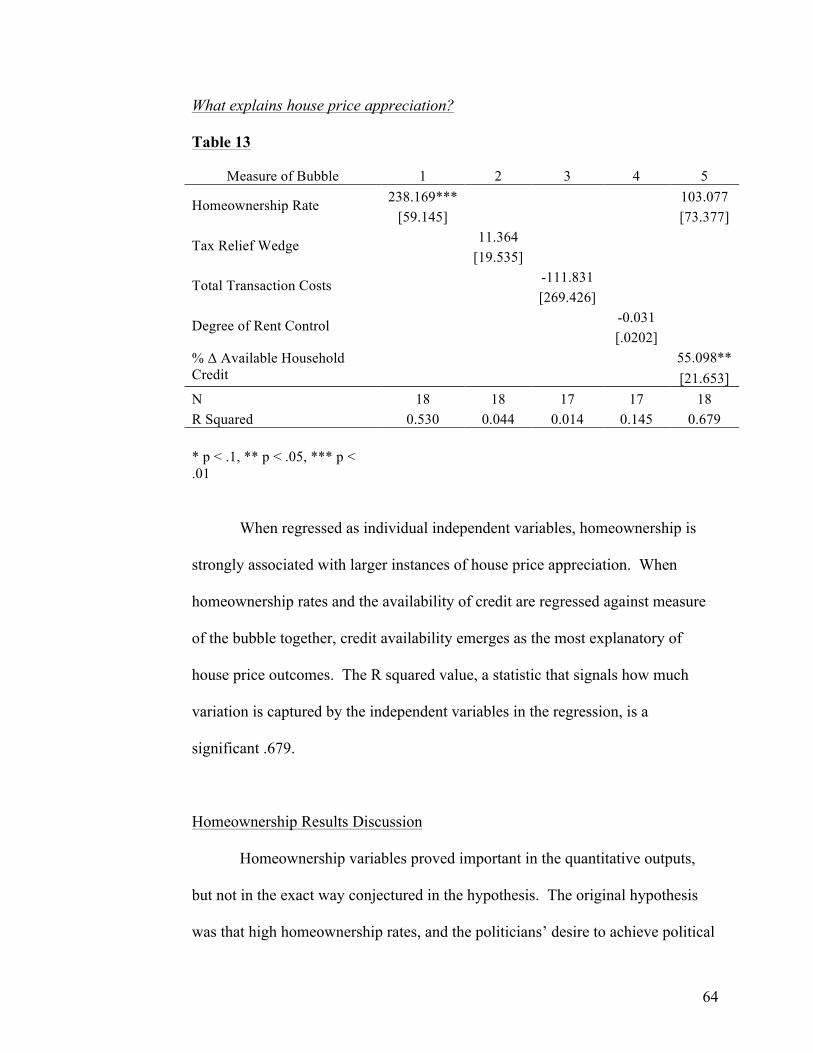
64
What explains house price appreciation?
Table 13
Measure of Bubble 1 2 3 4 5
Homeownership Rate 238.169***
103.077 [59.145]
[73.377]
Tax Relief Wedge 11.364
[19.535]
Total Transaction Costs -111.831
[269.426]
Degree of Rent Control -0.031
[.0202] % Δ Available Household
Credit 55.098**
[21.653]
N 18 18 17 17 18 R Squared 0.530 0.044 0.014 0.145 0.679
* p < .1, ** p < .05, *** p < .01
When regressed as individual independent variables, homeownership is
strongly associated with larger instances of house price appreciation. When
homeownership rates and the availability of credit are regressed against measure
of the bubble together, credit availability emerges as the most explanatory of
house price outcomes. The R squared value, a statistic that signals how much
variation is captured by the independent variables in the regression, is a
significant .679.
Homeownership Results Discussion
Homeownership variables proved important in the quantitative outputs,
but not in the exact way conjectured in the hypothesis. The original hypothesis
was that high homeownership rates, and the politicians’ desire to achieve political
65
favor with the constituencies they represent, would result in substantive policies,
credit related and not, favorable to homeowners. According to the data,
homeownership rates are not very good predictors of favorable non-credit
homeownership policies identified in this paper. However homeownership rates
are strong predictors of the expansion of available credit in a country, suggesting
the size of the homeowner constituency does affect the level of outstanding
household debt. The increases in the levels of household debt could be attributed
merely to increases in the rate of homeownership and/or price appreciation.
However for most countries the increase in the level of household debt outstrips
the increase in the level of total dwelling assets in the same period, which
effectively controls for homeownership and price.
It is likely that there are more specific credit mechanisms, or other
mechanisms altogether, through which homeownership rates may contribute to
house appreciation. High homeownership rates may also indicate the presence of
institutions purposed for maintaining credit availability at below-market rates.
The U.S. semi-private government-sponsored agencies Fannie Mae and Freddie
Mac, discussed in chapter five, are prime examples of this kind of organization.
So it is conceivable that the chosen policy measures do not fully capture the range
of regulatory mechanisms at the disposal of governments.
Still, it is striking that the effect of homeownership on bubbles is so
strong, while the effects on policy measures are so weak. It does suggest that one
look for other mechanisms. One such possibility is that high and/or rising home
ownership rates affect the perceived desirability of such ownership. If
66
increasingly more people are exposed to homeowners in their social network, it
may help spread a desire to own – a “culture” of homeownership. This culture
could include the pervasiveness of homeownership related programing and
coverage in the news. In the U.S., this includes television programming on Home
and Garden Television (HGTV) and Extreme Makeover: Home Edition, as well as
magazines like Better Home and Garden. National and social emphasis placed on
homeownership is reflected in the rhetoric of policy-makers. Rajan credits Bill
Clinton and an “activist congress” with promoting the expansion of affordable
housing in the 1990s (88). In Clinton’s words, “Expanding homeownership will
strengthen our nation’s families and communities, strengthen our economy, and
expand this country’s great middle class” (“National Home Ownership Strategy”).
George W. Bush, in office during the build-up of the American housing crisis,
reiterated the sentiment that homeownership is tied to “vitality in America”
(“America’s Ownership Society”). He said in 2002:
“I believe owning something is part of the American dream as
well…When we went to the new homes of the new homeowners…I saw
with pride firsthand, the man say, welcome to my home…He was a proud
man…and I want that pride to extend all throughout out country” (Speech
to Department of Housing and Urban Development).
If a culture of homeownership exists, those countries with high ownership rates
may also be the ones with the greatest leaps in demand as the culture spreads.
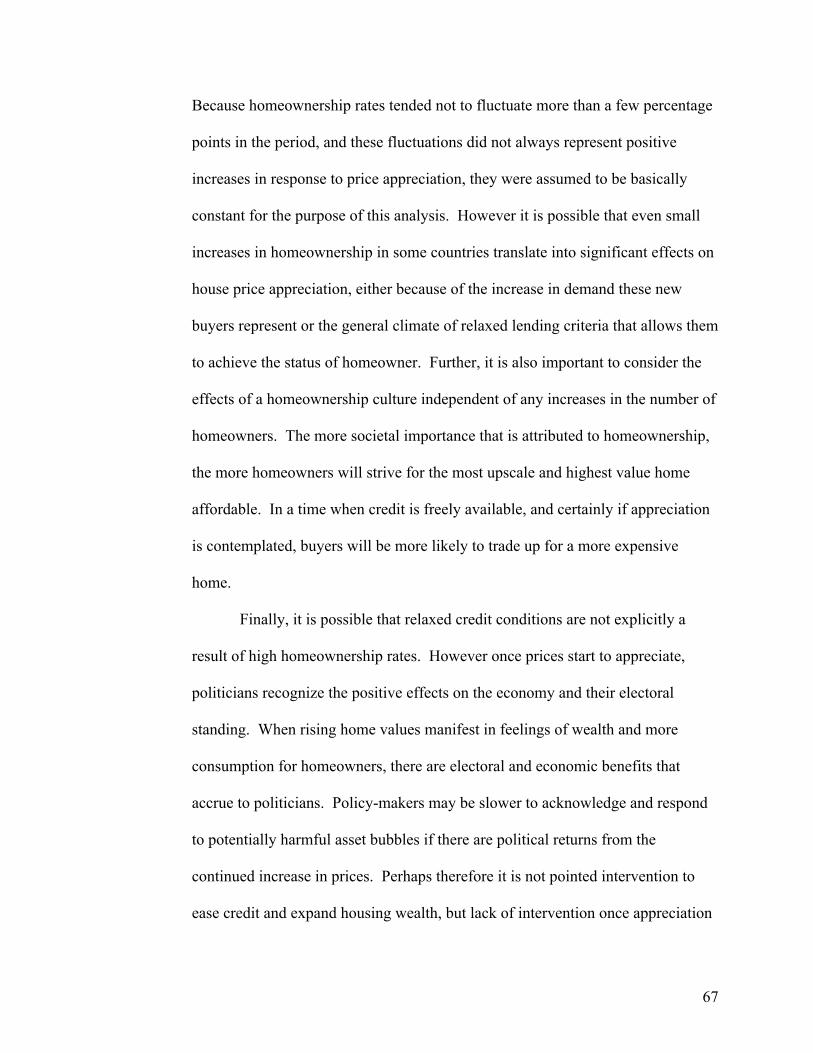
67
Because homeownership rates tended not to fluctuate more than a few percentage
points in the period, and these fluctuations did not always represent positive
increases in response to price appreciation, they were assumed to be basically
constant for the purpose of this analysis. However it is possible that even small
increases in homeownership in some countries translate into significant effects on
house price appreciation, either because of the increase in demand these new
buyers represent or the general climate of relaxed lending criteria that allows them
to achieve the status of homeowner. Further, it is also important to consider the
effects of a homeownership culture independent of any increases in the number of
homeowners. The more societal importance that is attributed to homeownership,
the more homeowners will strive for the most upscale and highest value home
affordable. In a time when credit is freely available, and certainly if appreciation
is contemplated, buyers will be more likely to trade up for a more expensive
home.
Finally, it is possible that relaxed credit conditions are not explicitly a
result of high homeownership rates. However once prices start to appreciate,
politicians recognize the positive effects on the economy and their electoral
standing. When rising home values manifest in feelings of wealth and more
consumption for homeowners, there are electoral and economic benefits that
accrue to politicians. Policy-makers may be slower to acknowledge and respond
to potentially harmful asset bubbles if there are political returns from the
continued increase in prices. Perhaps therefore it is not pointed intervention to
ease credit and expand housing wealth, but lack of intervention once appreciation
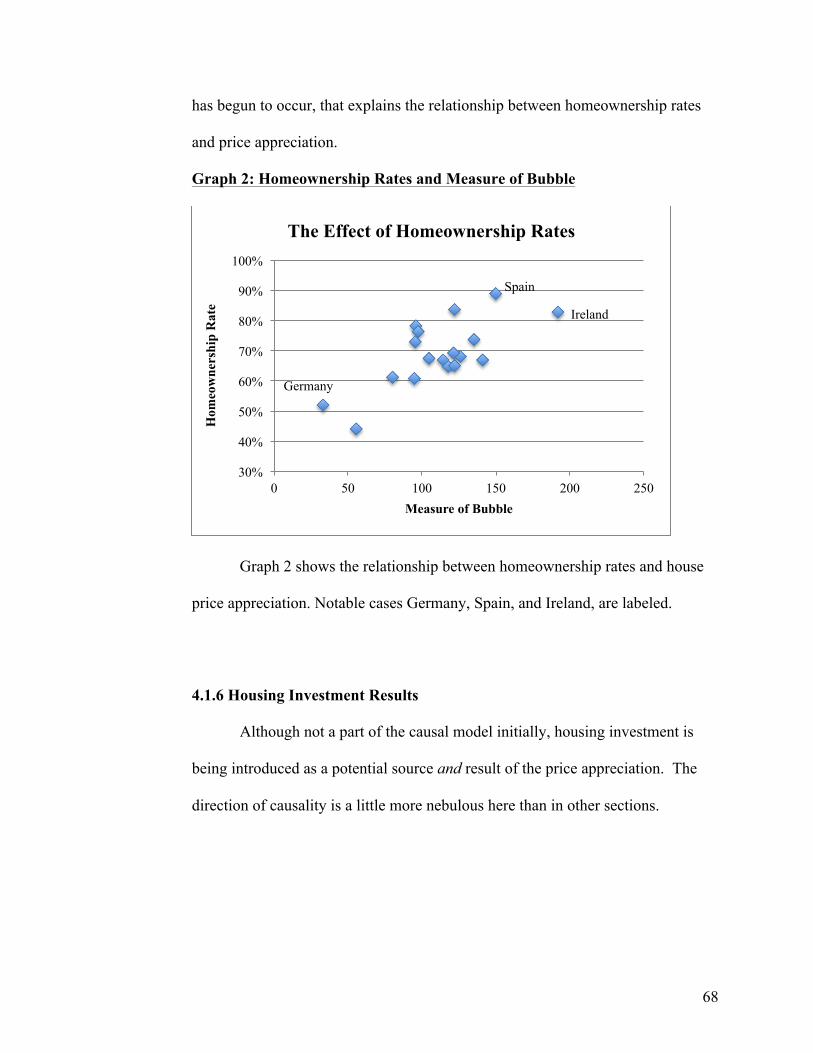
68
has begun to occur, that explains the relationship between homeownership rates
and price appreciation.
Graph 2: Homeownership Rates and Measure of Bubble
Graph 2 shows the relationship between homeownership rates and house
price appreciation. Notable cases Germany, Spain, and Ireland, are labeled.
4.1.6 Housing Investment Results
Although not a part of the causal model initially, housing investment is
being introduced as a potential source and result of the price appreciation. The
direction of causality is a little more nebulous here than in other sections.
Germany
Spain
Ireland
30%
40%
50%
60%
70%
80%
90%
100%
0 50 100 150 200 250
Hom
eow
ners
hip
Rat
e
Measure of Bubble
The Effect of Homeownership Rates

69
What is the relationship between housing investment and percent change in
available household credit?
Table 14
% Δ Available Household Credit 1
Housing Investment (% Δ 1995-2007) 48.572*** [9.170]
N 18 R Squared 0.660
* p < .1, ** p < .05, *** p < .01
There exists a statistically significant connection between housing
investment and credit availability in a country.
Do homeownership rates explain increased housing investment?
Table 15
Housing Investment (% Δ 1995-2007) 1
Homeownership Rate 3.443*** [1.105]
N 18 R Squared 0.393
* p < .1, ** p < .05, *** p < .01
Homeownership rates have a strong link to the extent to which investment
in housing increased from 1995 to 2007 in a country.
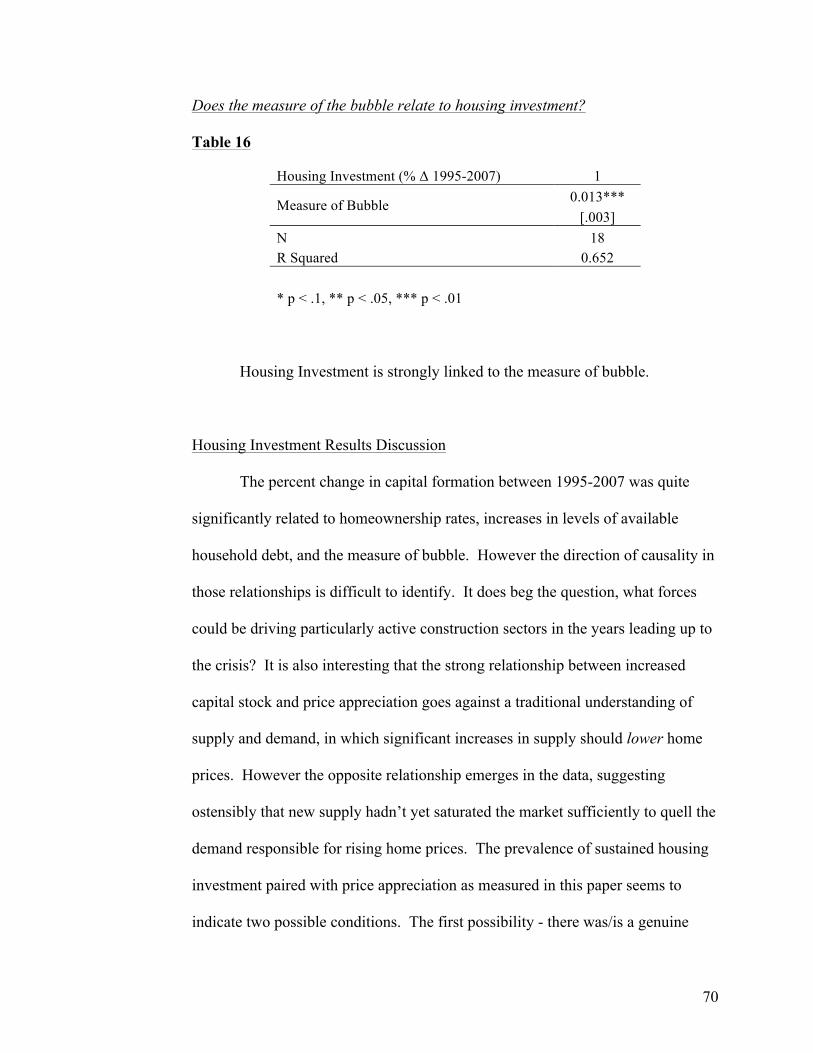
70
Does the measure of the bubble relate to housing investment?
Table 16
Housing Investment (% Δ 1995-2007) 1
Measure of Bubble 0.013*** [.003]
N 18 R Squared 0.652
* p < .1, ** p < .05, *** p < .01
Housing Investment is strongly linked to the measure of bubble.
Housing Investment Results Discussion
The percent change in capital formation between 1995-2007 was quite
significantly related to homeownership rates, increases in levels of available
household debt, and the measure of bubble. However the direction of causality in
those relationships is difficult to identify. It does beg the question, what forces
could be driving particularly active construction sectors in the years leading up to
the crisis? It is also interesting that the strong relationship between increased
capital stock and price appreciation goes against a traditional understanding of
supply and demand, in which significant increases in supply should lower home
prices. However the opposite relationship emerges in the data, suggesting
ostensibly that new supply hadn’t yet saturated the market sufficiently to quell the
demand responsible for rising home prices. The prevalence of sustained housing
investment paired with price appreciation as measured in this paper seems to
indicate two possible conditions. The first possibility - there was/is a genuine
71
dearth in quality supply of residences in the market, and that the supply is meeting
a real significant underlying demand. One might expect this to be the case in
countries that experienced a meaningful appreciation of prices without a dramatic
drop, like Sweden, Norway, and Canada. However in countries that had
significant housing investment increases and a large ‘burst’ bubble, demand was
driven by a speculative emphasis on real estate investments because values were
climbing - and were expected to continue to rise. Again, relaxed credit policies
and the lure of “trading up” in an appreciating market likely create demand
among both current and prospective homeowners. In this climate, there develops
a frenzy that goes beyond buyers routinely purchasing a family home. Investors
will buy properties, hoping to flip them at higher prices as values rose, and second
homes may seem at the time like smart economic decisions. When prices are
fueled by these temporary, less sustainable sources of demand attracted for the
most part by anticipated further price appreciation, the housing market is likely to
correct more severely. This correction is captured in the measure of bubble used
in this analysis. In this sense, it could be argued that prolonged supply increases
are not just a response to price increases, but also help sustain the speculative
activity that actively contributes to the appreciation. You might expect this
speculative activity to be higher in countries with higher homeownership rates,
which could explain the relationship between homeownership and housing
investment as well. Ireland is a prime example of this second outlined scenario.
This role of housing investment seems related to the cobweb theorem, in
which price fluctuations occur because the suppliers of a certain good, due to the
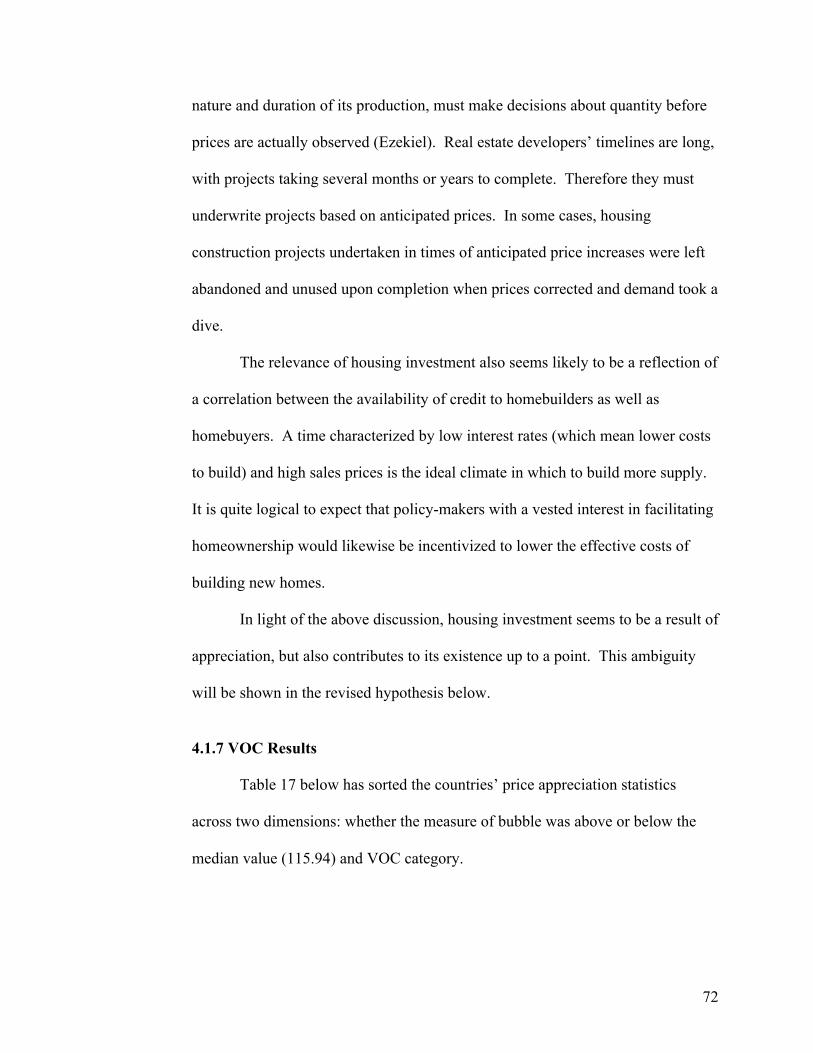
72
nature and duration of its production, must make decisions about quantity before
prices are actually observed (Ezekiel). Real estate developers’ timelines are long,
with projects taking several months or years to complete. Therefore they must
underwrite projects based on anticipated prices. In some cases, housing
construction projects undertaken in times of anticipated price increases were left
abandoned and unused upon completion when prices corrected and demand took a
dive.
The relevance of housing investment also seems likely to be a reflection of
a correlation between the availability of credit to homebuilders as well as
homebuyers. A time characterized by low interest rates (which mean lower costs
to build) and high sales prices is the ideal climate in which to build more supply.
It is quite logical to expect that policy-makers with a vested interest in facilitating
homeownership would likewise be incentivized to lower the effective costs of
building new homes.
In light of the above discussion, housing investment seems to be a result of
appreciation, but also contributes to its existence up to a point. This ambiguity
will be shown in the revised hypothesis below.
4.1.7 VOC Results
Table 17 below has sorted the countries’ price appreciation statistics
across two dimensions: whether the measure of bubble was above or below the
median value (115.94) and VOC category.
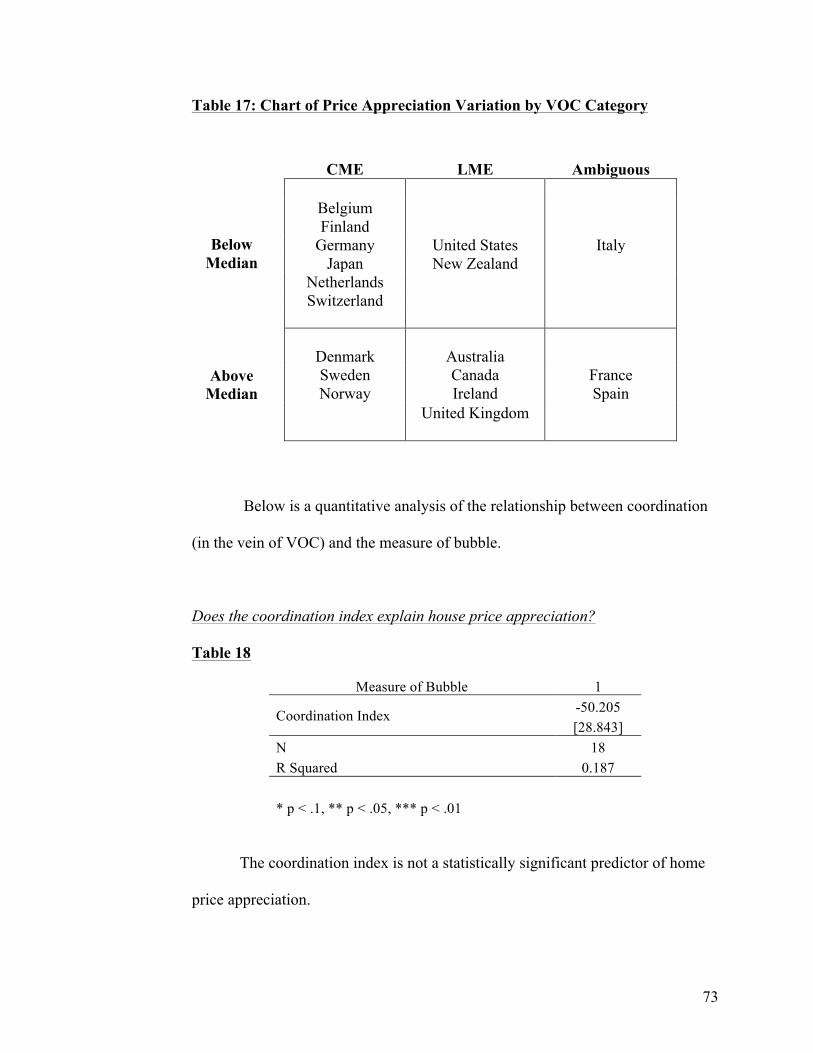
73
Table 17: Chart of Price Appreciation Variation by VOC Category
CME LME Ambiguous
Below Median
Belgium Finland Germany United States Italy Japan New Zealand Netherlands Switzerland
Above Median
Denmark Australia Sweden Canada France Norway Ireland Spain United Kingdom
Below is a quantitative analysis of the relationship between coordination
(in the vein of VOC) and the measure of bubble.
Does the coordination index explain house price appreciation?
Table 18
Measure of Bubble 1
Coordination Index -50.205 [28.843]
N 18 R Squared 0.187
* p < .1, ** p < .05, *** p < .01
The coordination index is not a statistically significant predictor of home
price appreciation.
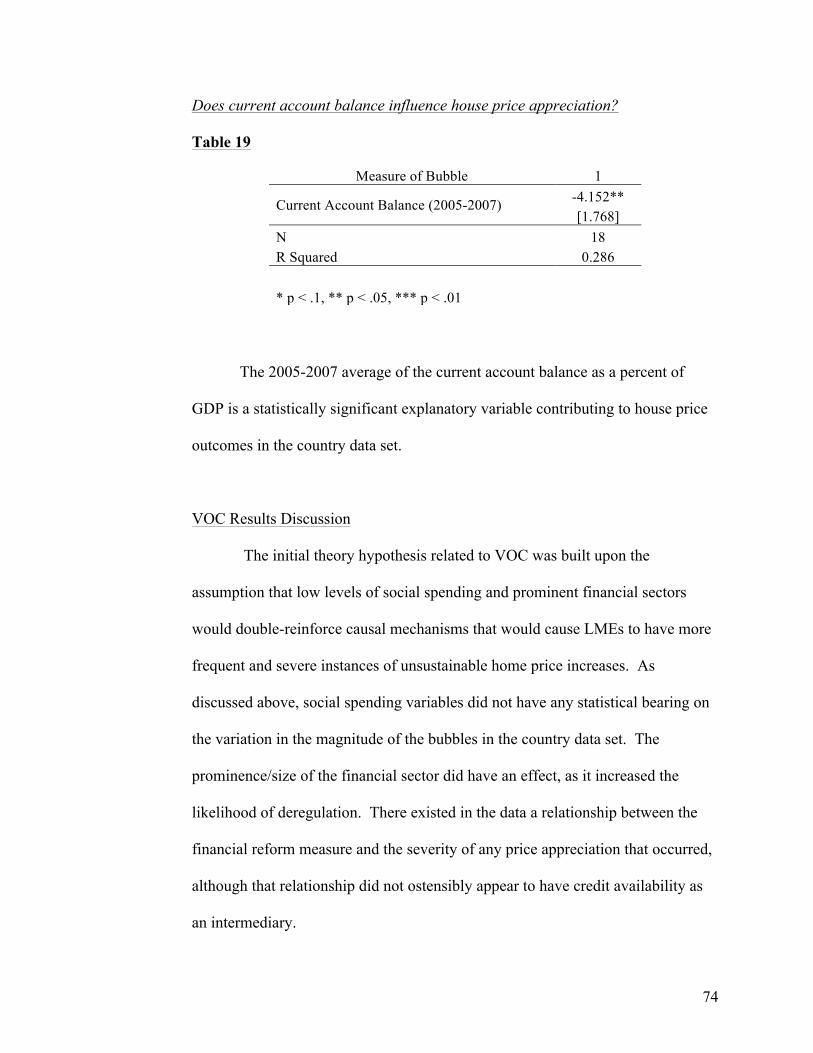
74
Does current account balance influence house price appreciation?
Table 19
Measure of Bubble 1
Current Account Balance (2005-2007) -4.152** [1.768]
N 18 R Squared 0.286
* p < .1, ** p < .05, *** p < .01
The 2005-2007 average of the current account balance as a percent of
GDP is a statistically significant explanatory variable contributing to house price
outcomes in the country data set.
VOC Results Discussion
The initial theory hypothesis related to VOC was built upon the
assumption that low levels of social spending and prominent financial sectors
would double-reinforce causal mechanisms that would cause LMEs to have more
frequent and severe instances of unsustainable home price increases. As
discussed above, social spending variables did not have any statistical bearing on
the variation in the magnitude of the bubbles in the country data set. The
prominence/size of the financial sector did have an effect, as it increased the
likelihood of deregulation. There existed in the data a relationship between the
financial reform measure and the severity of any price appreciation that occurred,
although that relationship did not ostensibly appear to have credit availability as
an intermediary.
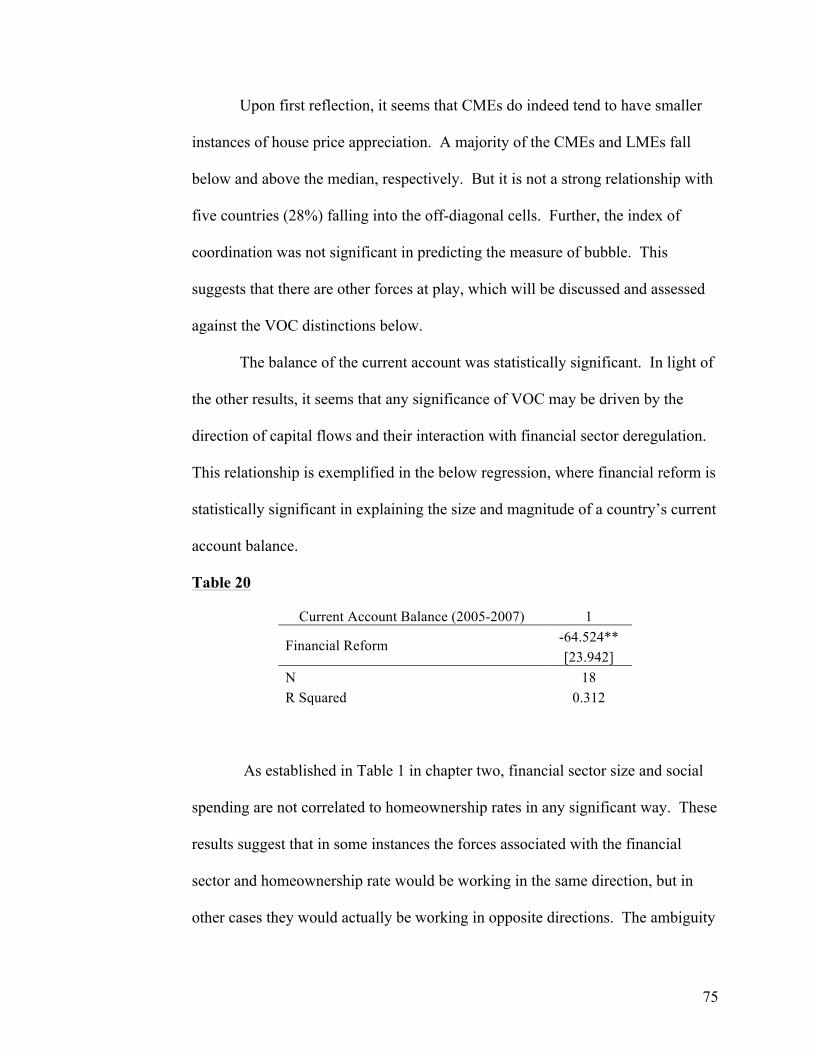
75
Upon first reflection, it seems that CMEs do indeed tend to have smaller
instances of house price appreciation. A majority of the CMEs and LMEs fall
below and above the median, respectively. But it is not a strong relationship with
five countries (28%) falling into the off-diagonal cells. Further, the index of
coordination was not significant in predicting the measure of bubble. This
suggests that there are other forces at play, which will be discussed and assessed
against the VOC distinctions below.
The balance of the current account was statistically significant. In light of
the other results, it seems that any significance of VOC may be driven by the
direction of capital flows and their interaction with financial sector deregulation.
This relationship is exemplified in the below regression, where financial reform is
statistically significant in explaining the size and magnitude of a country’s current
account balance.
Table 20
Current Account Balance (2005-2007) 1
Financial Reform -64.524** [23.942]
N 18 R Squared 0.312
As established in Table 1 in chapter two, financial sector size and social
spending are not correlated to homeownership rates in any significant way. These
results suggest that in some instances the forces associated with the financial
sector and homeownership rate would be working in the same direction, but in
other cases they would actually be working in opposite directions. The ambiguity
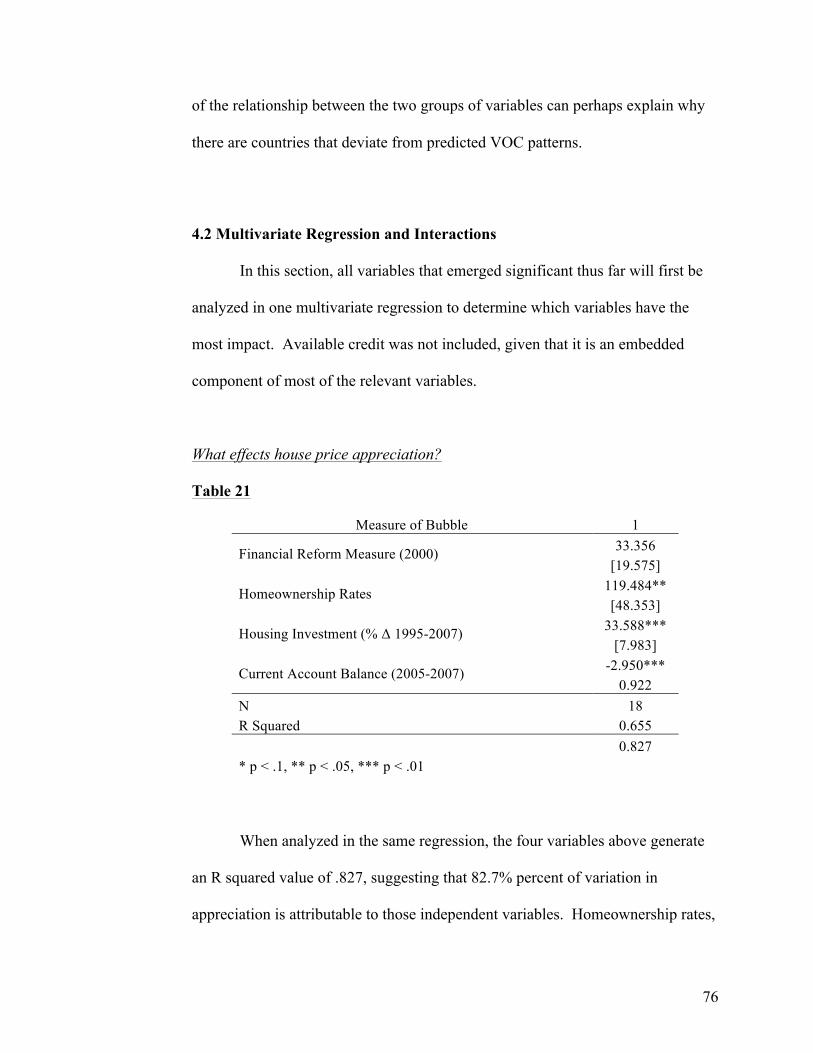
76
of the relationship between the two groups of variables can perhaps explain why
there are countries that deviate from predicted VOC patterns.
4.2 Multivariate Regression and Interactions
In this section, all variables that emerged significant thus far will first be
analyzed in one multivariate regression to determine which variables have the
most impact. Available credit was not included, given that it is an embedded
component of most of the relevant variables.
What effects house price appreciation?
Table 21
Measure of Bubble 1
Financial Reform Measure (2000) 33.356 [19.575]
Homeownership Rates 119.484** [48.353]
Housing Investment (% Δ 1995-2007) 33.588*** [7.983]
Current Account Balance (2005-2007) -2.950*** 0.922
N 18 R Squared 0.655
0.827 * p < .1, ** p < .05, *** p < .01
When analyzed in the same regression, the four variables above generate
an R squared value of .827, suggesting that 82.7% percent of variation in
appreciation is attributable to those independent variables. Homeownership rates,
77
housing investment, and current account balance all have unique affects on house
price appreciation outcomes.
Interaction Terms
Interaction between relevant independent variables was tested. None of
the interaction terms emerged as significant. The results can be found in
Appendix 1.
4.3 Revised Understanding of Hypothesis
Going forward, the foundational groups of independent variables can be
consolidated into just two: 1) the incentives to policy-makers to promote
advanced and powerful sectors and the resulting capital flows and 2) rates of
homeownership and the resulting national orientation towards homeownership. In
addition, housing investment can be viewed as a way to track both the strength of
the demand caused by appreciation and as fuel for speculative housing
investment.
Large financial sectors tend to be more liberalized, and liberalized
financial sectors are more likely to experience house price appreciation. Because
these financial sectors are likely to have a greater impact on the economy, the
government will ensure their profitability and success. Although not statistically
substantiated in the financial sector path of the initial causal model, availability of
credit remains part of the story in the revised hypothesis. Current account balance
has also proved statistically significant, which is consistent with the logic of the
original hypothesis. In countries where the financial sector is integral to
78
economic growth and health, financial systems will seek a supply of loanable
funds to be successful.
The effect of homeownership rates has proved more difficult to assess.
Homeownership rates are strongly related to the measure of home price
appreciation, but none of the tested non-credit policies supposedly deriving from
rates of homeownership proved significant to outcomes. It seems that three
mechanisms for the relationship between homeownership rates and house price
appreciation emerge. The first, which is indeed borne out statistically in the
analysis, is that credit conditions are more likely to be favorable for household
borrowers because of the electoral returns to policy-makers. Access to
homeownership can translate into feelings of wealth, more consumption, and less
electoral dissatisfaction related to distribution. Though the available credit
variable may be impacted by other factors, it does indicate increases in credit are
more likely where homeownership rates are higher. The second two proposed
mechanisms, although not proved statistically in the data, seem important to
understanding the aggregate narrative of appreciation. Culture effects, while hard
to measure, seem quite important, especially when considered in relation to the
U.S. The network effects of homeownership will be stronger when there are more
homeowners in society. Further, media and political rhetoric that can cause
people to reach for a ‘dream’ home and create more demand will be more
common in societies with a larger percentage of homeowners. Finally, even if
homeownership rates aren’t explicitly causing policy-makers to relax credit and
thereby fuel appreciation, they may be less incentivized to temper price
79
appreciation when homeownership rates are high. Policy-makers may be slower
to recognize and respond to potentially unsustainable price increases because
those increases make homeowners happier and are helpful to the economy in the
short run.
VOC has proved to be a helpful framework through which to examine
home price appreciation to the extent that it informs the argument about dominant
sectors and capital flows. However the significance of variables related to
homeownership and housing investment, which do not map on to VOC categories
and financial reform, are also important explanatory pieces of the puzzle. The
suggestion is that homeownership related variables complicate and help explain
CMEs and LMEs that do not follow a predicted pattern.
Housing investment has been added to the conception of the hypothesis.
Figures for this increase in capital stock over the time period are strongly related
to appreciation outcomes. It seems likely in some scenarios that increasing
investment is a result of, and lags, the pent-up demand also driving home price
appreciation. In other circumstances however, it approaches an oversupply in
response to speculative purchases by buyers who don’t plan to occupy the
residences full time or who are hoping to resell them under the assumption of
continued increases in value. Housing investment is also strongly related to
homeownership rates, suggesting unsurprisingly that larger numbers of
homeowners will create more demand for homes in times of booming prices.
On a high level, the data implies two mandates compelling policy-makers
that can lead to unsustainable home price appreciation: ensure the success of the
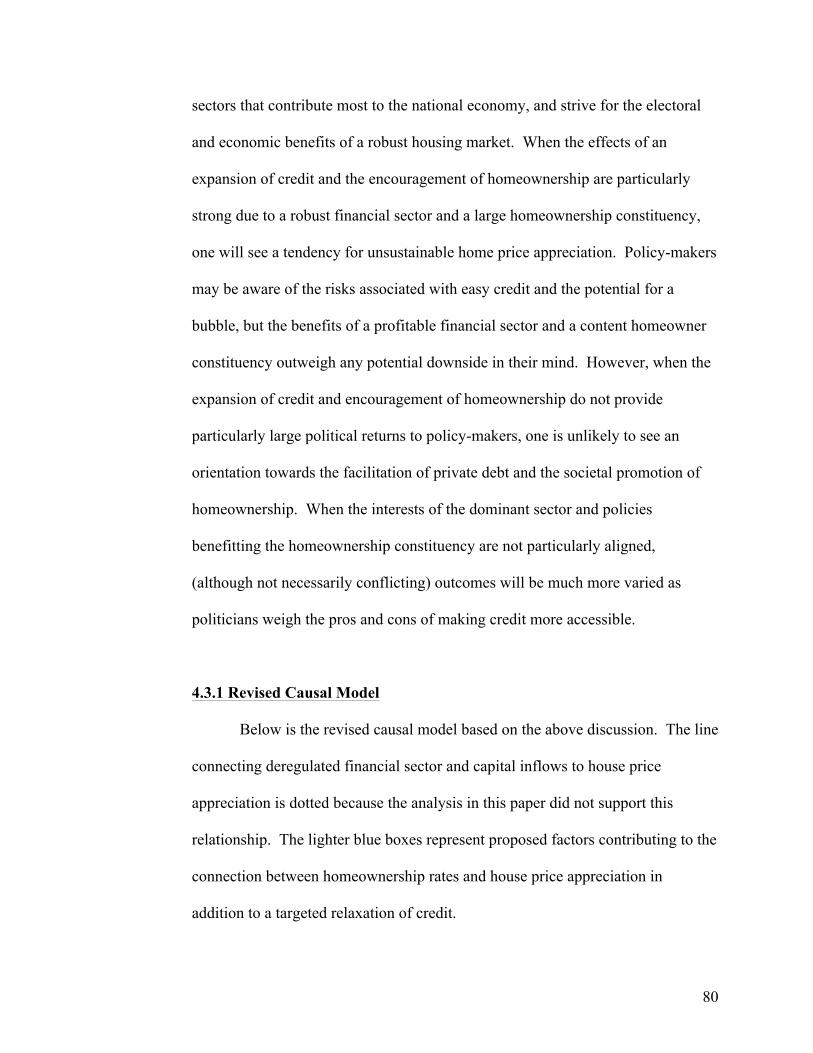
80
sectors that contribute most to the national economy, and strive for the electoral
and economic benefits of a robust housing market. When the effects of an
expansion of credit and the encouragement of homeownership are particularly
strong due to a robust financial sector and a large homeownership constituency,
one will see a tendency for unsustainable home price appreciation. Policy-makers
may be aware of the risks associated with easy credit and the potential for a
bubble, but the benefits of a profitable financial sector and a content homeowner
constituency outweigh any potential downside in their mind. However, when the
expansion of credit and encouragement of homeownership do not provide
particularly large political returns to policy-makers, one is unlikely to see an
orientation towards the facilitation of private debt and the societal promotion of
homeownership. When the interests of the dominant sector and policies
benefitting the homeownership constituency are not particularly aligned,
(although not necessarily conflicting) outcomes will be much more varied as
politicians weigh the pros and cons of making credit more accessible.
4.3.1 Revised Causal Model
Below is the revised causal model based on the above discussion. The line
connecting deregulated financial sector and capital inflows to house price
appreciation is dotted because the analysis in this paper did not support this
relationship. The lighter blue boxes represent proposed factors contributing to the
connection between homeownership rates and house price appreciation in
addition to a targeted relaxation of credit.
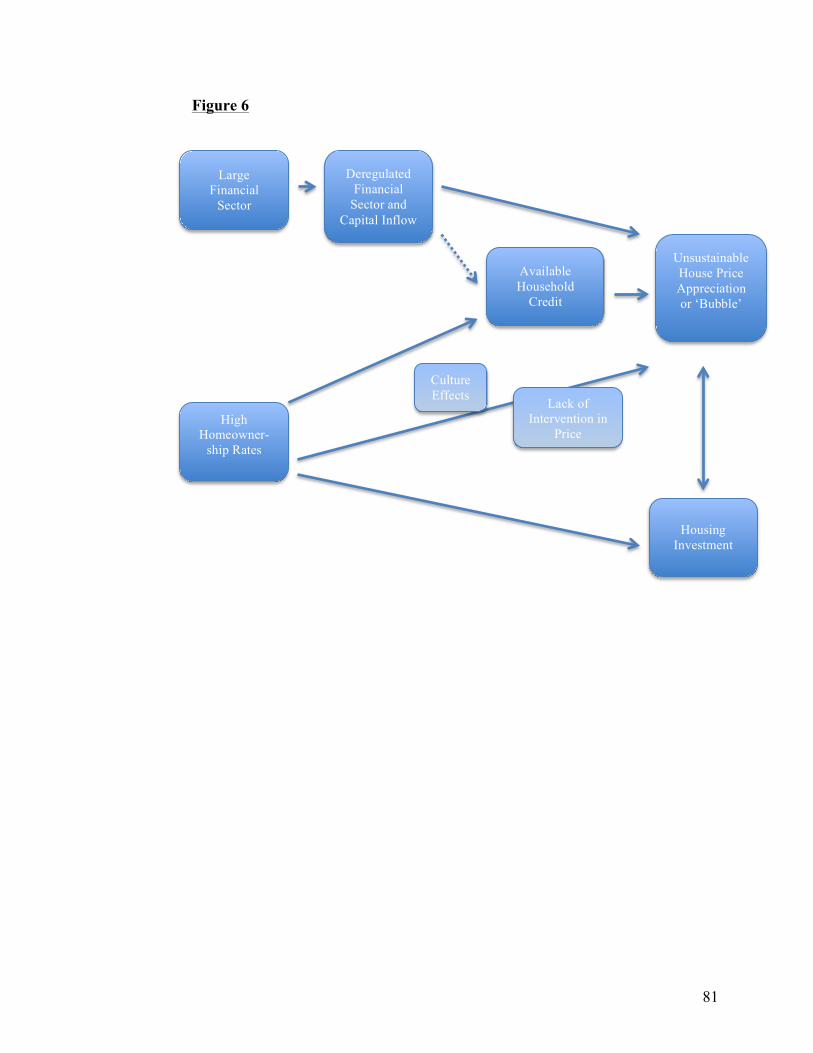
81
Figure 6
Housing Investment
Large Financial
Sector
Deregulated Financial
Sector and Capital Inflow
High Homeowner-
ship Rates
Unsustainable House Price Appreciation or ‘Bubble’
Available Household
Credit
Lack of Intervention in
Price Appreciation
Culture Effects
82
Chapter 5: Case Studies
5.1 Introduction to Case Countries
To further inform the analysis of variations in home price appreciation
using our revised understanding of contributing factors, the following section will
explore specific country cases. The work done up to this point has corroborated an
initial hypothesis that there is some relationship between a country’s classification
according to VOC and the presence of a housing bubble. The significance of the
VOC categorization with respect to house price appreciation seems to be derived
from the differences in the role of the financial sector in the economy and the
resultant direction of capital flows. Additionally however, high homeownership
rates, uncorrelated to a country’s financial sector or current account balance, also
emerged as significant contributing factors. Chapter four established an emphasis
moving forward on these two main threads of explanatory variables. A discussion
of specific countries is meant to further illuminate the mechanisms by which these
two variables interact to affect outcomes. The following sections will frame the
discussions of Germany, the United States, Ireland, and Sweden by considering
the extent to which they follow the pattern predicted by VOC financial sector
profiles and what role homeownership and housing investment play in their
outcomes. Germany and the United States fall well within traditional
understandings and predictions of a CME and LME, respectively. Ireland fit the
originally predicted pattern for an LME to an extreme. Finally Sweden represents
a ‘deviant’ CME that experienced a housing bubble. Additionally, the case
83
studies will provide an opportunity to address any factors that are deemed relevant
that were not quantified in earlier analyses.
5.2 Cases
5.2.1 Germany: Conforming Coordinated Market Economy
Germany, the archetypal CME in the VOC literature, actually experienced
home price depreciation during the period of concern. Germany’s financial sector
is the fifth smallest according to the measure used in this paper, with the average
financial activities’ value added equal to 4.2% of GDP for the sixteen years ended
with 2010, inclusive. It is also relatively regulated compared to other countries
considered in the paper, with a reform score of .905 in 2000 (the fourth lowest of
the country data set.) Related to the comparatively lower liberalization of the
sector, Germany had been running a current account surplus of around 5.8% of
GDP in the years 2005 - 2007, making it a net exporter of goods and capital.
Furthermore, Germany’s homeownership rate of 52% is the second lowest
average from 1995-2007 after Switzerland (44%) in the country data set. Based
on findings earlier in the paper, the low homeownership rate suggests that the
political constituency is small and unlikely to influence policy and decision-
making related to the availability of private credit or foster any culture effects
associated with homeownership that would incentivize particularly high demand
for homes.
Interestingly, Germany’s prices decreased at the same time that capital
formation in the housing sector decreased by 15%. A majority of the countries in
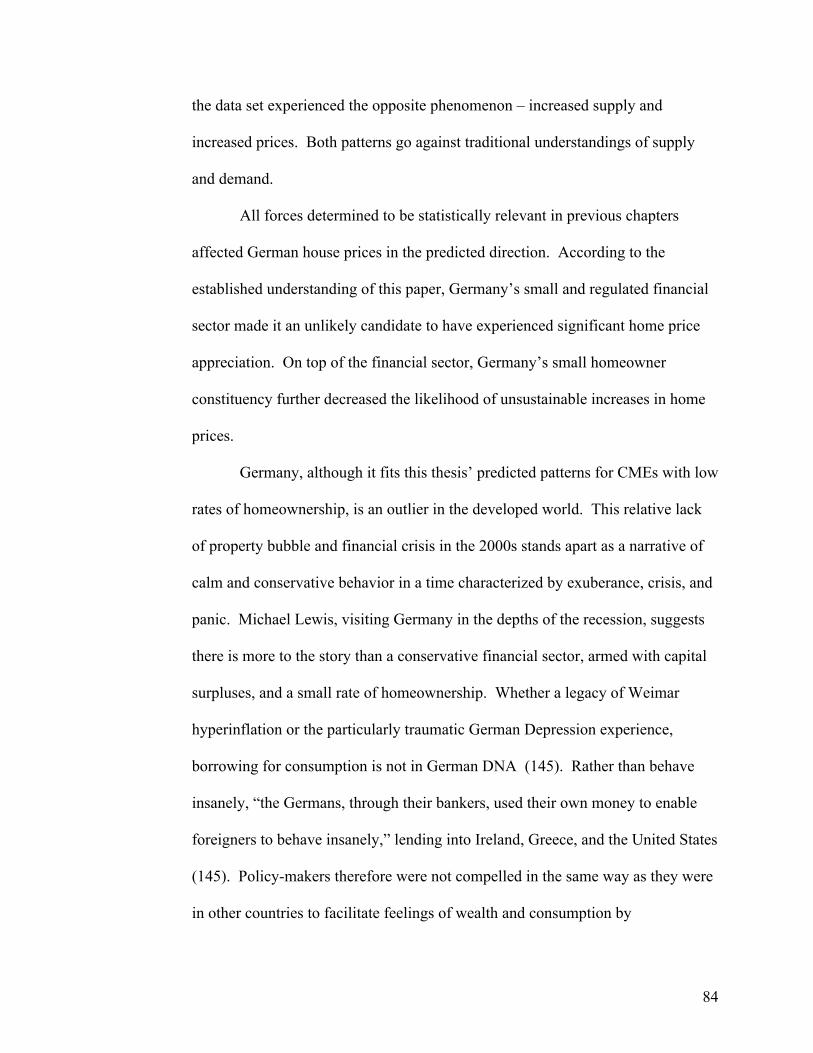
84
the data set experienced the opposite phenomenon – increased supply and
increased prices. Both patterns go against traditional understandings of supply
and demand.
All forces determined to be statistically relevant in previous chapters
affected German house prices in the predicted direction. According to the
established understanding of this paper, Germany’s small and regulated financial
sector made it an unlikely candidate to have experienced significant home price
appreciation. On top of the financial sector, Germany’s small homeowner
constituency further decreased the likelihood of unsustainable increases in home
prices.
Germany, although it fits this thesis’ predicted patterns for CMEs with low
rates of homeownership, is an outlier in the developed world. This relative lack
of property bubble and financial crisis in the 2000s stands apart as a narrative of
calm and conservative behavior in a time characterized by exuberance, crisis, and
panic. Michael Lewis, visiting Germany in the depths of the recession, suggests
there is more to the story than a conservative financial sector, armed with capital
surpluses, and a small rate of homeownership. Whether a legacy of Weimar
hyperinflation or the particularly traumatic German Depression experience,
borrowing for consumption is not in German DNA (145). Rather than behave
insanely, “the Germans, through their bankers, used their own money to enable
foreigners to behave insanely,” lending into Ireland, Greece, and the United States
(145). Policy-makers therefore were not compelled in the same way as they were
in other countries to facilitate feelings of wealth and consumption by
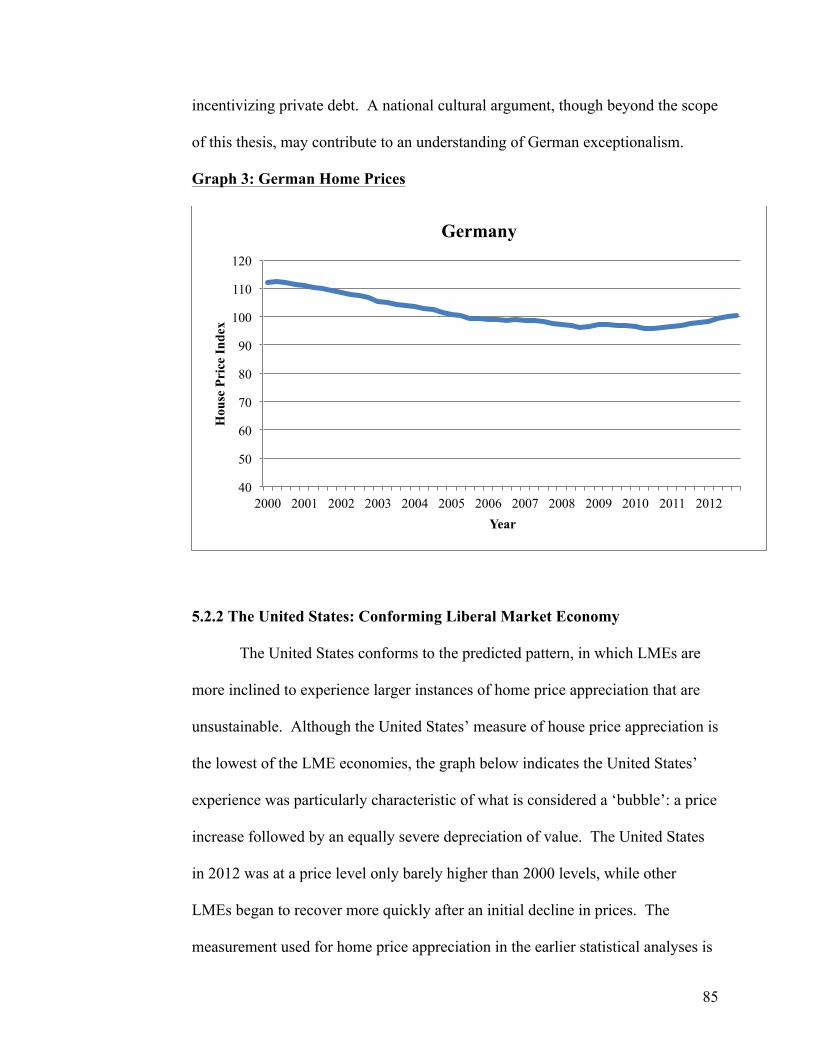
85
incentivizing private debt. A national cultural argument, though beyond the scope
of this thesis, may contribute to an understanding of German exceptionalism.
Graph 3: German Home Prices
5.2.2 The United States: Conforming Liberal Market Economy
The United States conforms to the predicted pattern, in which LMEs are
more inclined to experience larger instances of home price appreciation that are
unsustainable. Although the United States’ measure of house price appreciation is
the lowest of the LME economies, the graph below indicates the United States’
experience was particularly characteristic of what is considered a ‘bubble’: a price
increase followed by an equally severe depreciation of value. The United States
in 2012 was at a price level only barely higher than 2000 levels, while other
LMEs began to recover more quickly after an initial decline in prices. The
measurement used for home price appreciation in the earlier statistical analyses is
40
50
60
70
80
90
100
110
120
2000 2001 2002 2003 2004 2005 2006 2007 2008 2009 2010 2011 2012
Hou
se P
rice
Inde
x
Year
Germany
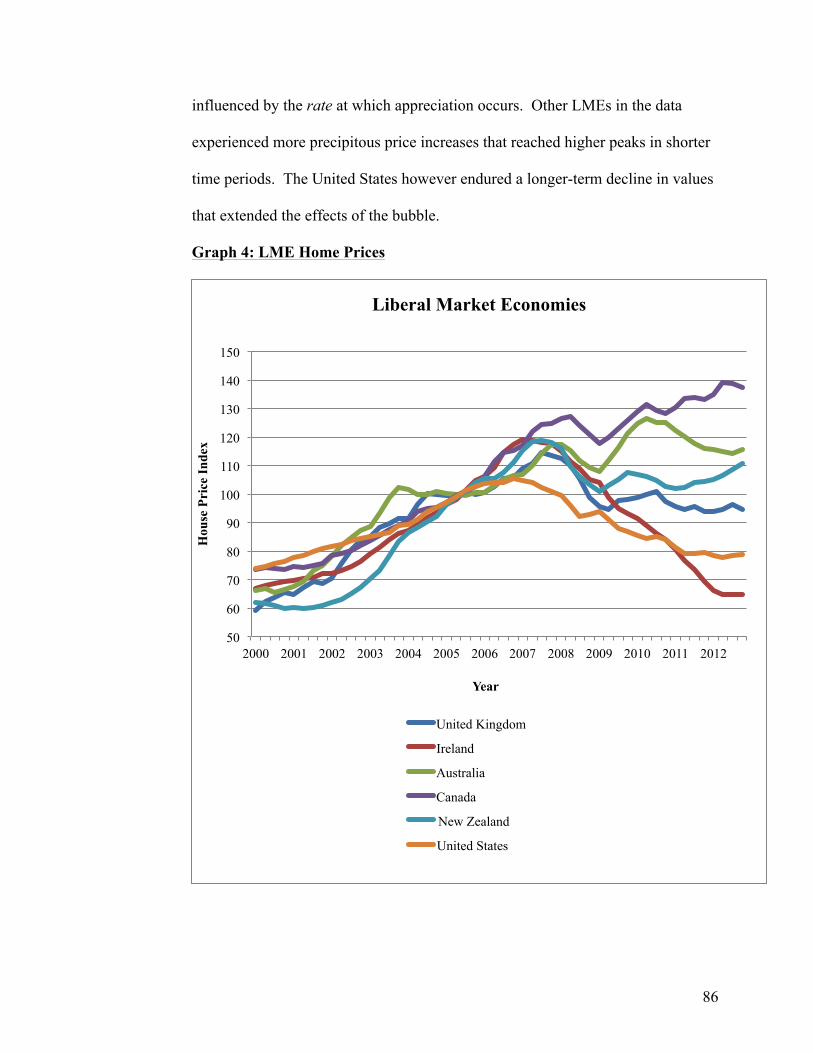
86
influenced by the rate at which appreciation occurs. Other LMEs in the data
experienced more precipitous price increases that reached higher peaks in shorter
time periods. The United States however endured a longer-term decline in values
that extended the effects of the bubble.
Graph 4: LME Home Prices
50
60
70
80
90
100
110
120
130
140
150
2000 2001 2002 2003 2004 2005 2006 2007 2008 2009 2010 2011 2012
Hou
se P
rice
Inde
x
Year
Liberal Market Economies
United Kingdom
Ireland
Australia
Canada
New Zealand
United States
87
The United States had a liberalized financial sector at the start of the
relevant period, with a 1.00 reform measure in 2000. Its financial sector also
represents a significant portion of the American economy, with value added for
the periods previously quoted at an average of 7.2% of GDP. Long-term
household liabilities as a percent of GDP increased 55.3% from 2000 to 2007.
Further solidifying its prototypical status as an LME, the United States ran current
account deficits at an average 5.49% of GDP in 2005-2007. In addition to
boasting a large and liberalized financial sector, the United States has relatively
high homeownership rates. It is worth acknowledging that the increase in housing
investment in the U.S. was below the median for the country data set. The United
States generally exhibits the qualities this paper has associated with an
unsustainable appreciation in prices. The United States experience with financial
sector power and liberalization and its political constituency of homeowners
seems woven into one narrative about the interaction between financial
deregulation, the American emphasis on homeownership, and the government-
sponsored agencies (GSEs) the Federal National Mortgage Agency and the
Federal Home Loan Mortgage Corporation, commonly known as Fannie Mae and
Freddie Mac, respectively.
In the United States, the early 2000s was characterized by “interrelated
pressures on bank profits – the foreign capital inflow, the Fed’s low-interest-rate
policy, the unusually narrow margin between short-and long-term rates” (Chinn
and Frieden 97). Chinn and Frieden suggest the government and the large
financial institutions had a “deep and mutual dependence” on one another (129).
88
The government needed access to domestic and international capital markets for
its own deficit spending, and relied on financial institutions to facilitate the
operations of the private sector. The financial sector relied on accommodating
regulation that would allow banks to profit in a climate of low interest rates.
The political power of the bank was visible in the mobility of personnel
“mov(ing) back and forth between Wall Street and Washington,” perhaps best
personified by the Henry Paulson, former head of Goldman Sachs, who was
Treasury Secretary at the time of the crisis (Johnson and Kwak 197). The
presence of investment bankers and traders in government was due in part to the
increasingly complex nature of financial services following the repeal of Glass-
Steagall – policy-makers valued the expertise of Wall Street graduates who
ostensibly understood the financial world. These officials in turn heavily
influenced policy, arguably lacking the requisite skepticism to properly regulate
their former employers. Thus large financial institutions, specifically investment
banks, used their resourcefulness to find returns wherever they were to be found.
Although subprime loans specifically were on the extreme end of the
“borrowing binge” that saw credit expand for all risk profiles, they played a key
role in de-railing the system and were emblematic of the American ideal of
homeownership. Subprime loans became more frequent in the 1990s as the
government made a conscious effort to expand homeownership for low-income
buyers. FICO scores allowed lenders to more accurately price based on credit-
worthiness and subprime borrowers had access to credit, albeit at higher rates
(Rajan 89). In the 2000s especially, subprime loans were integrated into
89
traditional mortgage-backed securities (MBS) and asset-backed securities (ABS),
occupying the lower tranches of the securitized mortgages. The MBS were
ostensibly safe, with senior holders buying in the AAA tranches and only those
seeking high returns purchasing the bottom tranches. No investor, or investment
bank, anticipated a systematic decrease in prices nationwide at the same time.
The increasingly complex securitized mortgages were built on the assumption of
imperfect correlation between defaults in the mortgage pool, with senior holders
insulated from idiosyncratic risk, but not aggregate risk (Foote). Mezzanine
tranches were re-securitized into collateralized debt obligations (CDOs), rated
AAA based again on the assumption of the randomized chances of default.
Investment banks, eager to move risk off their balance sheets so they could
purchase more liabilities, bought credit default swaps (CDS), that would require
the seller of the CDS to pay them a lump sum if a security defaulted. The
insurance agency American International Group (AIG) sold an especially large
amount of CDS. The complexity of securitized mortgages, insufficiently
monitored and regulated, increased just as home prices did, leading to an
inevitable adjustment that would be catastrophic for financial markets.
The Clinton administration had begun heavily advocating a joint public
and private sector push to increase homeownership in the 1990s, “arguing that the
financial sector should find creative ways of getting people who could not afford
homes into them, and the government would help or push wherever it could”
(Rajan 91). Bush continued to push for greater homeownership, and the
fulfillment of the “American Dream” of ownership (“America’s Ownership
90
Society”). Home ownership was rhetorically tied to personal dignity and
economic productiveness and contribution. Politicians were ready and willing to
use Fannie Mae and Freddie Mac to promote their homeownership agenda.
Fannie and Freddie were historically private companies that had always received
“special privileges in return for ensuring a sound system” (Foote). Fannie and
Freddie pooled prime and conforming (read: relatively safe) loans into MBS that
they then sold to investors. The GSEs also assumed credit risk from the investors
by guaranteeing a “timely payment” of interest and principal on the pooled
mortgages (Foote). Fannie and Freddie provided informal guidelines to
originators, signaling what loans they considered to fall within their more
conservative credit standards. The GSEs’ consistent purchase of mortgages
expanded the “secondary market” for mortgages, as they effectively encouraged
other investors to buy up MBS. They also increased the pool of capital which
originators could lend and effectively lowered the cost of borrowing with their
commitment to pay off investors (Chinn and Frieden 108). Fannie and Freddie
were quite active, and operated under an implicit guarantee by the federal
government that allowed them to borrow money at extremely low rates despite
operating with slim capital cushions. Although Fannie and Freddie did not create
structured MBS with subprime, jumbo, or non-conforming loans, they did use
their low cost of capital to hold those assets on their balance sheets. The purchase
of subprime mortgages continued to encourage homeownership, fulfilling the
government’s mandate, and was quite profitable for the GSEs (Foote).
91
When the home market turned down across the country and homeowners
began defaulting on their mortgages, the increased complexity that was meant to
protect investors made it instead impossible for investors to understand the true
value of their assets. Markets panicked and the liquidity in the whole economy
froze. AIG’s obligations to the banks that had purchased CDS threatened to bring
down the insurance agency, forcing a government bailout. Fannie and Freddie’s
balance sheet exposure to now toxic subprime assets further spooked the market
as investors wondered whether the GSEs were liquid enough to honor their
obligations on prime and conforming MBS.
The United States is a paradigmatic case of credit expansion and
homeownership being especially rewarding for policy-makers and their
orientation towards the financial sector and the homeownership constituency.
The financial sector was crucial in supporting the public and private sectors, and
in sustaining the overall health of the American economy. To ensure its success,
government officials allowed the sector to expand its operations in a climate of
deregulation. American politicians also identified important personal, social and
national benefits to incentivizing homeownership and encouraging the “American
dream,” insisting homeownership was something to strive for, particularly in
lower income communities (“America’s Ownership Society”). This paper would
suggest that the expansion of credit, and the leeway with which financial
institutions were able to securitize that credit, was a result of policy-makers
identifying political benefits from catering to the financial sector and making
more Americans homeowners.
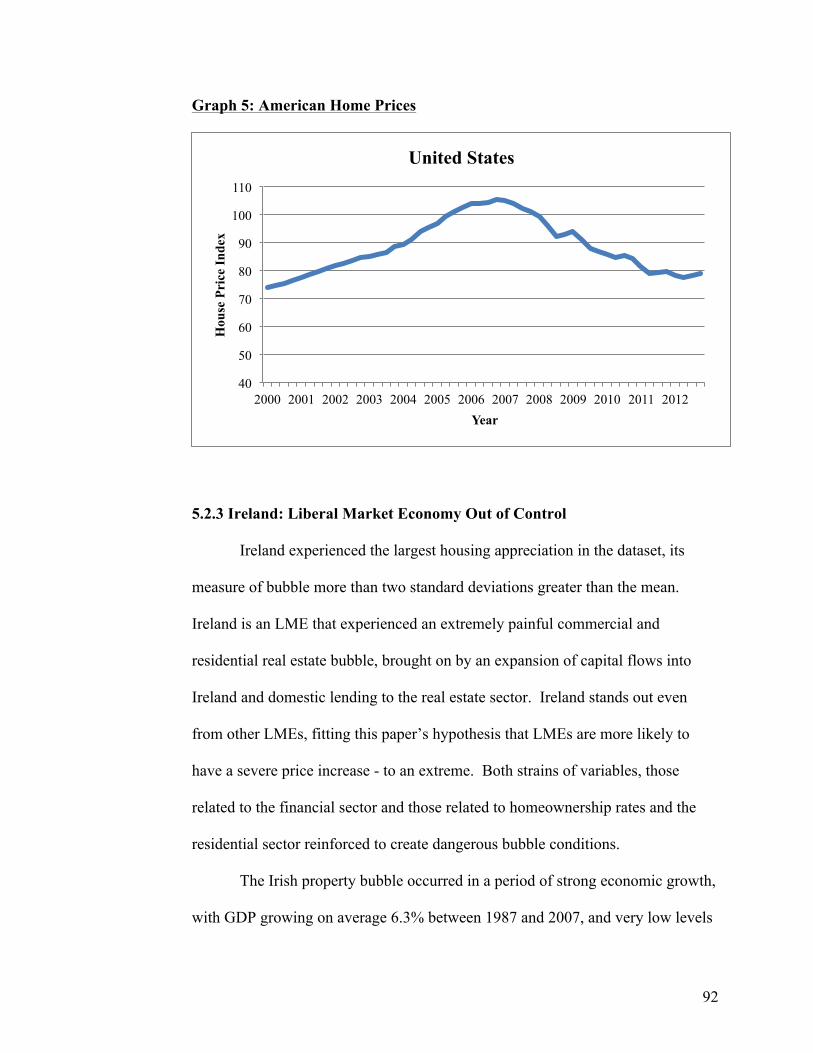
92
Graph 5: American Home Prices
5.2.3 Ireland: Liberal Market Economy Out of Control
Ireland experienced the largest housing appreciation in the dataset, its
measure of bubble more than two standard deviations greater than the mean.
Ireland is an LME that experienced an extremely painful commercial and
residential real estate bubble, brought on by an expansion of capital flows into
Ireland and domestic lending to the real estate sector. Ireland stands out even
from other LMEs, fitting this paper’s hypothesis that LMEs are more likely to
have a severe price increase - to an extreme. Both strains of variables, those
related to the financial sector and those related to homeownership rates and the
residential sector reinforced to create dangerous bubble conditions.
The Irish property bubble occurred in a period of strong economic growth,
with GDP growing on average 6.3% between 1987 and 2007, and very low levels
40
50
60
70
80
90
100
110
2000 2001 2002 2003 2004 2005 2006 2007 2008 2009 2010 2011 2012
Hou
se P
rice
Inde
x
Year
United States
93
of unemployment (Whelan 3). Over the period 1995-2007, the Irish financial
sector in particular added an average value measured as 8.0% of GDP, with
particularly large increases in the early 2000s. It was a construction boom that
fueled much of the growth in the financial sector and the economy at large in the
first decade of the 20th century. According to Karl Whelan, “Ireland still had a
relatively small housing stock” at the turn of the century (6). Initially strong
underlying demand for homes, combined with historically low borrowing costs
due to EMU membership, resulted in an explosion of residential building financed
with relatively cheap credit. The average current account balance from 2005-
2007 was a deficit of 4.0% of GDP. Capital formation in the housing sector
increased 152% from 1995 – 2007, the second largest measure of increased
capital formation in that period, and Ireland’s stock of dwellings increased from
1.4 million homes in 2000 to 1.9 million homes in 2008 (Whelan 6). “Tax
incentives favored property-owners, developers, builders, and bankers,” –
construction had become central to the economy and real estate related debt
flooded bank balance sheets (Dellepiane and Hardiman 24).
The Irish property bubble was financed by banks that were grossly
mismanaged and under-regulated. Liquid from very low borrowing costs on
international capital markets, the banks expanded their balance sheets
substantially beyond the value of domestic deposits through bond issuances to
international investors. Armed with this supply of loanable funds, they began
lending at high volumes to households and commercial developers. Mortgage
debt expanded from 16 billon euros in 2003 to 106 billion euros in 2008. Irish
94
banks were also extremely exposed to commercial real estate projects and
construction firms, with 128 billion euros outstanding to construction businesses
in 2008 (Whelan 11). Crucially, the balance sheets of Irish banks in 2008 were
filled with assets that could only be recovered if real estate prices had continued
to rise. The most exposed was Anglo Irish Bank, following by the Irish
Nationwide Building Society. It seems as their balance sheets grew, the banks
were employing less stringent credit criteria. As the 2000s progressed, “lending
decisions had begun to loose touch with reality” (Honohan 7). By 2006, two
thirds of loans to first-time buyers had LTVs greater than 90%, and a third were
receiving 100% LTVs (Honohan 2009). Balance sheet growth should represent
“a very simple warning sign used by most regulators to identify a bank exposed to
increased risk.” Each locally controlled bank in Ireland saw balance sheet growth
greater than 20% in at least one year, while Anglo Irish Bank had nine years of
balance sheet growth above 20% (Honohan 7). Policy-makers, in their “benign
neglect” of their regulatory duties, made no effort to limit real estate lending or
contain the price increases. As late as 2007, when the first economists in Ireland
publicly warned this would not be a soft landing, political parties were
campaigning on policies that would promote homeownership and further “fuel
prices” (Whelan 8). Home prices climbed at staggering rates, with the 82.8% of
the population experiencing unprecedented increases in the value of their homes.
The eventual correction was disastrous for an economy, and a national
psyche, built on the continued success of real estate. The solvency of the banks
relied on the integrity of their property-related assets. When prices crashed, Irish
95
banks were left with obligations to the foreign creditors, the financiers of the
boom, that they could not meet. Fatefully, and with little idea the true extent of
losses they had incurred, the Irish government guaranteed the banks in September
2008. Ireland would have years of harsh austerity, IMF/EU bailouts, and political
reckoning.
Ireland seems to fit very well into the revised hypothesis of this paper.
The Irish financial sector, especially after receiving the beneficial borrowing costs
associated with EMU membership, was increasing its reach in the economy. The
alarming balance sheet growth of the Irish banks, as well as the potion of that
growth attributable to property lending, remained unregulated by officials in
Ireland. Home price climbed at astonishing rates at the same time politicians
further encouraged with favorable lending and rhetoric emphasizing the
importance of home ownership.
How could this have happened? Lewis suggests the success of the Irish
economy had sewn the seeds of a historically un-Irish sentiment: optimism (91).
Homeownership, commercial and residential construction, and the miracle growth
in house prices became inseparable from feelings of national pride and Irish
solidarity. Lewis summarizes,
“Irish people will tell you that, because of their history of dispossession,
owning a home is not just a way to avoid paying rent but a mark of
freedom. In their rush to freedom, the Irish built their own prisons. And
their leaders helped them do it” (103).
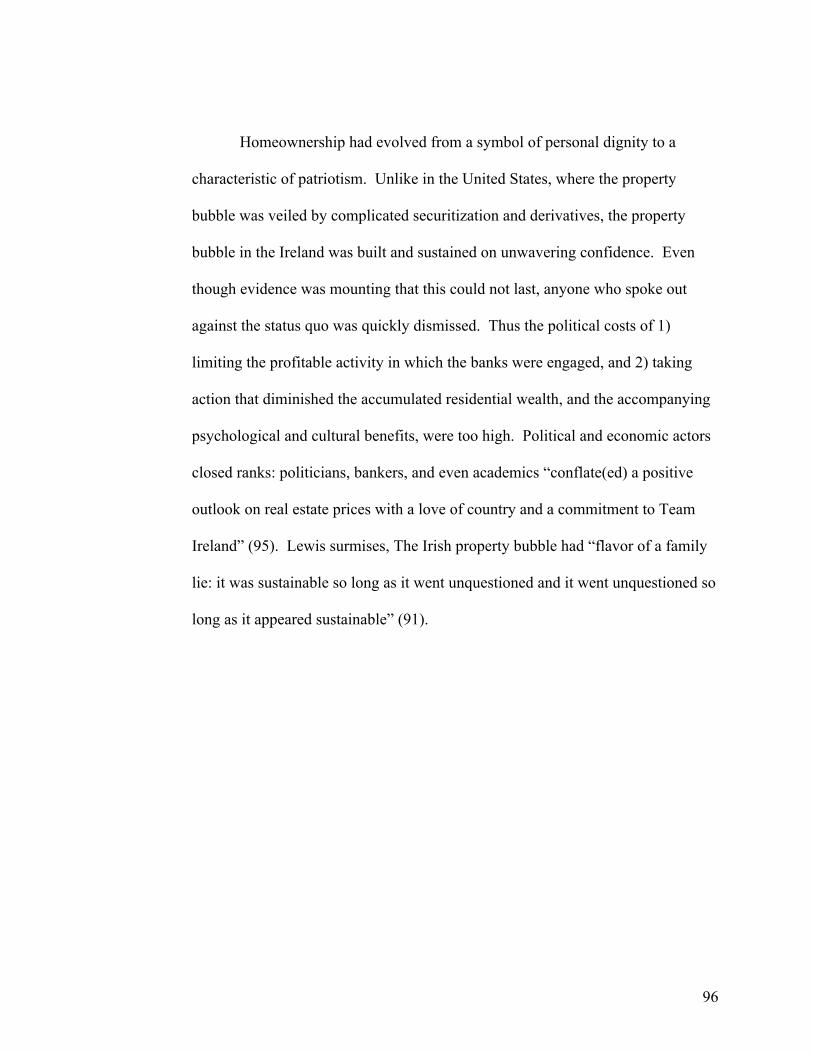
96
Homeownership had evolved from a symbol of personal dignity to a
characteristic of patriotism. Unlike in the United States, where the property
bubble was veiled by complicated securitization and derivatives, the property
bubble in the Ireland was built and sustained on unwavering confidence. Even
though evidence was mounting that this could not last, anyone who spoke out
against the status quo was quickly dismissed. Thus the political costs of 1)
limiting the profitable activity in which the banks were engaged, and 2) taking
action that diminished the accumulated residential wealth, and the accompanying
psychological and cultural benefits, were too high. Political and economic actors
closed ranks: politicians, bankers, and even academics “conflate(ed) a positive
outlook on real estate prices with a love of country and a commitment to Team
Ireland” (95). Lewis surmises, The Irish property bubble had “flavor of a family
lie: it was sustainable so long as it went unquestioned and it went unquestioned so
long as it appeared sustainable” (91).
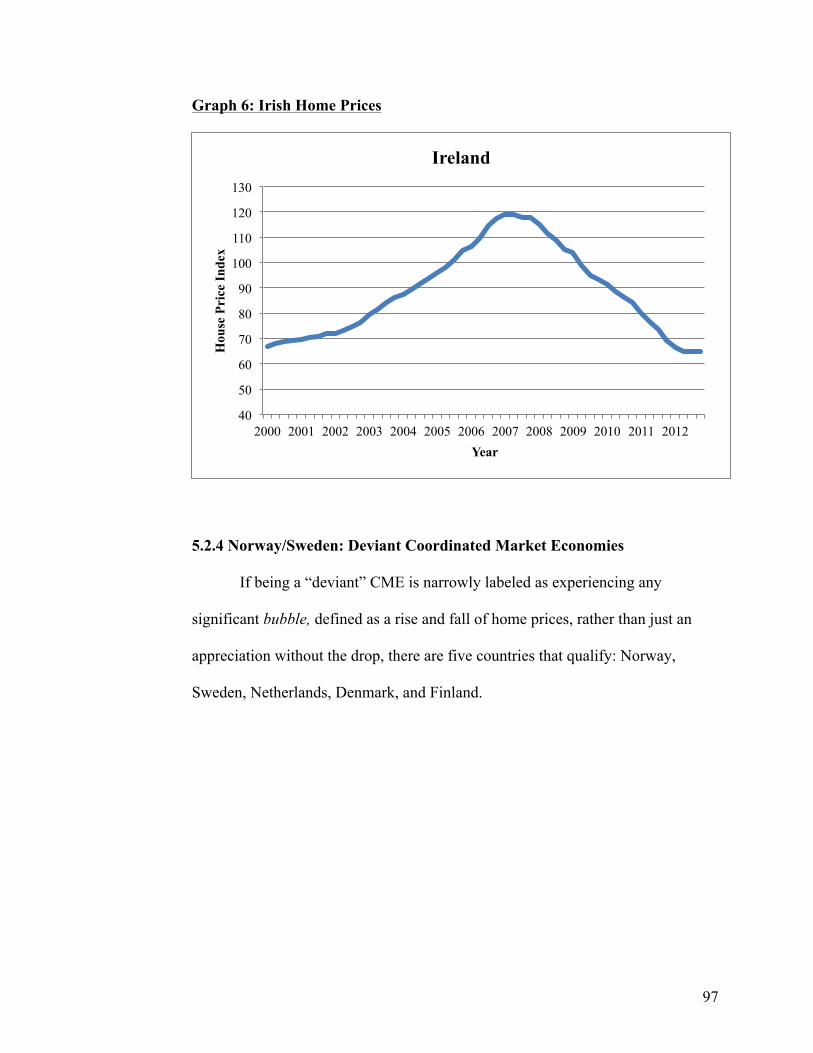
97
Graph 6: Irish Home Prices
5.2.4 Norway/Sweden: Deviant Coordinated Market Economies
If being a “deviant” CME is narrowly labeled as experiencing any
significant bubble, defined as a rise and fall of home prices, rather than just an
appreciation without the drop, there are five countries that qualify: Norway,
Sweden, Netherlands, Denmark, and Finland.
40
50
60
70
80
90
100
110
120
130
2000 2001 2002 2003 2004 2005 2006 2007 2008 2009 2010 2011 2012
Hou
se P
rice
Inde
x
Year
Ireland
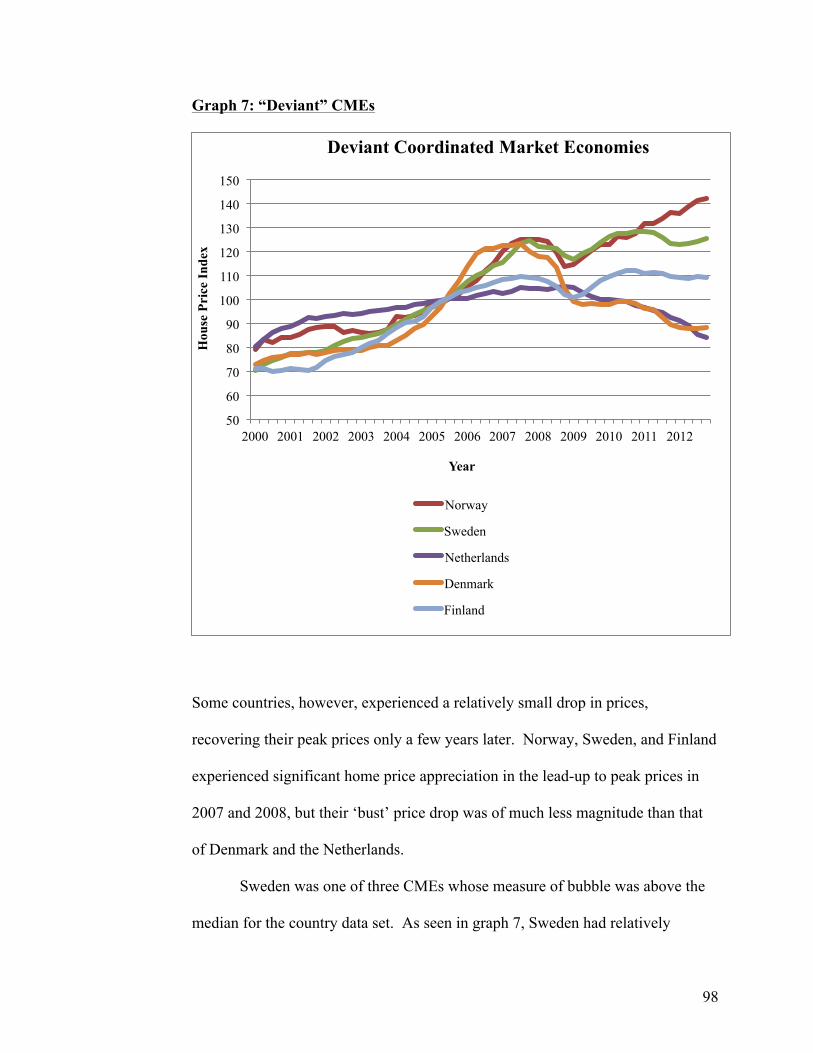
98
Graph 7: “Deviant” CMEs
Some countries, however, experienced a relatively small drop in prices,
recovering their peak prices only a few years later. Norway, Sweden, and Finland
experienced significant home price appreciation in the lead-up to peak prices in
2007 and 2008, but their ‘bust’ price drop was of much less magnitude than that
of Denmark and the Netherlands.
Sweden was one of three CMEs whose measure of bubble was above the
median for the country data set. As seen in graph 7, Sweden had relatively
50
60
70
80
90
100
110
120
130
140
150
2000 2001 2002 2003 2004 2005 2006 2007 2008 2009 2010 2011 2012
Hou
se P
rice
Inde
x
Year
Deviant Coordinated Market Economies
Norway
Sweden
Netherlands
Denmark
Finland
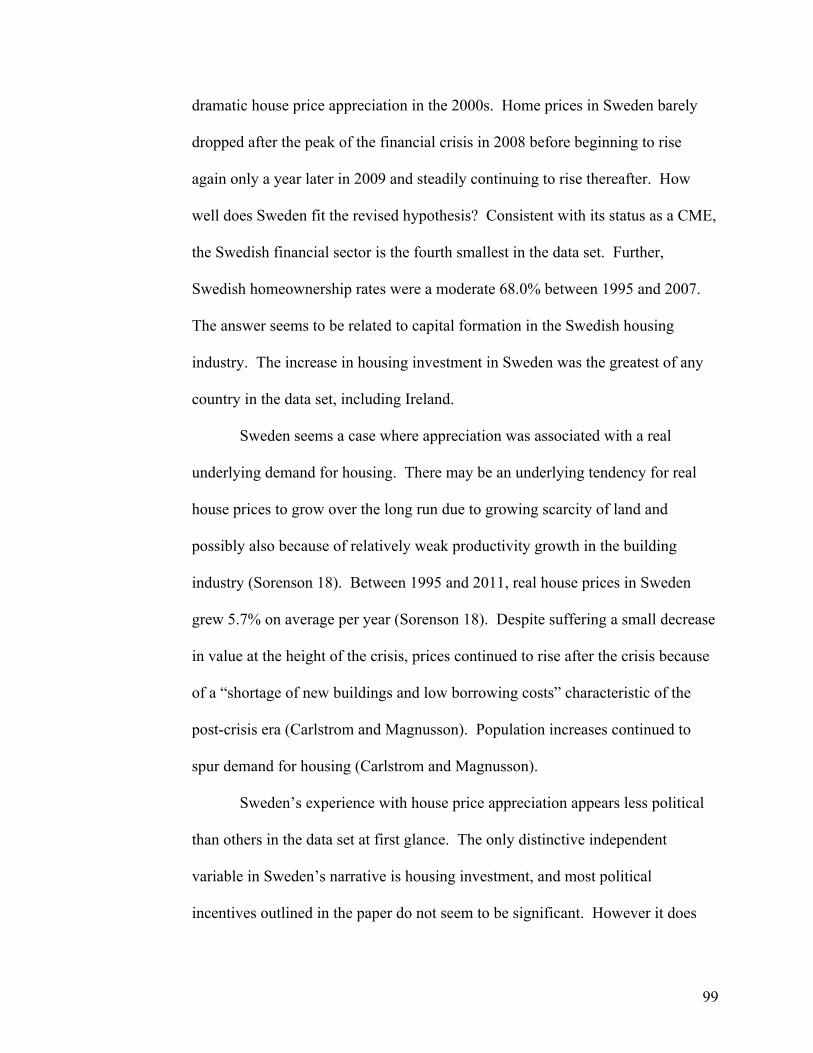
99
dramatic house price appreciation in the 2000s. Home prices in Sweden barely
dropped after the peak of the financial crisis in 2008 before beginning to rise
again only a year later in 2009 and steadily continuing to rise thereafter. How
well does Sweden fit the revised hypothesis? Consistent with its status as a CME,
the Swedish financial sector is the fourth smallest in the data set. Further,
Swedish homeownership rates were a moderate 68.0% between 1995 and 2007.
The answer seems to be related to capital formation in the Swedish housing
industry. The increase in housing investment in Sweden was the greatest of any
country in the data set, including Ireland.
Sweden seems a case where appreciation was associated with a real
underlying demand for housing. There may be an underlying tendency for real
house prices to grow over the long run due to growing scarcity of land and
possibly also because of relatively weak productivity growth in the building
industry (Sorenson 18). Between 1995 and 2011, real house prices in Sweden
grew 5.7% on average per year (Sorenson 18). Despite suffering a small decrease
in value at the height of the crisis, prices continued to rise after the crisis because
of a “shortage of new buildings and low borrowing costs” characteristic of the
post-crisis era (Carlstrom and Magnusson). Population increases continued to
spur demand for housing (Carlstrom and Magnusson).
Sweden’s experience with house price appreciation appears less political
than others in the data set at first glance. The only distinctive independent
variable in Sweden’s narrative is housing investment, and most political
incentives outlined in the paper do not seem to be significant. However it does

100
seem politicians’ behavior is being influenced by the state of home prices.
Measures to constrain prices are politically unpopular. A reduction of the tax
deductions on mortgage interest payments and a “general amortization
requirement” could reduce demand and quell price appreciation (Carlstrom and
Magnusson). As Roger Josefsson, chief economist at Danske Bank’s Swedish
unit in Stockholm summarized: “none of these measure will win any elections”
(Carlstrom and Magnusson). Sweden stands as an example of a bubble driven
largely by robust demand as a result of lagging supply. Although the price
appreciation wasn’t driven by political action the way it was in other countries,
the limited response seems to be explained by an unwillingness to enact policies
harmful to those who have accumulated household wealth.

101
Chapter 6: Conclusion
An original question posed in this thesis was: with a broad view, are there
countries with political economies more likely to experience housing bubbles?
The answer seems to be in the affirmative, but not as strongly along a CME/LME
axis as expected. The results of the analysis corroborate the hypothesis that
instances of house price appreciation are influenced by existing structural
conditions (financial sector, homeownership rates) and their interactions with
policy-makers. The results suggest politicians are driven by the desire to maintain
economic success by catering to important national sectors and to reap the
economic and electoral benefits of a satisfied homeowner constituency.
Results support arguments from Iversen and Soskice, Kwak and Johnson,
and others that suggest that a government’s tendency to support favored sectors
has implications on economic stability and asset prices. Further, while
confirming his argument for the role of homeownership rates, this thesis seems to
highlight areas for further development of Popa’s work. Although the above
analyses would suggest relaxed credit is a function of homeownership rates, the
strong relationship between homeownership and price appreciation suggests there
could be more to explore. These other contributing factors may include cultural
forces that promote homeownership, more influential at higher homeownership
rates, and/or an increased resistance by policy-makers to enact policies to slow
house price appreciation when a larger percent of the population owns a home.
The presence of cultural influences and political rhetoric seems particularly well
documented in the United States. Arguments about the effects of low levels of
102
social spending, although not borne out in the analysis, seem integrated into this
culture argument, at least in the case of the United States. Politicians in the 1990s
and 2000s especially put affordable homeownership, arguably as a substitute for
other government social spending and redistribution, on the political agenda. The
expansion of subprime lending, executed in response to government urging and
the exercise of its influence over Fannie and Freddie, certainly contributed to the
housing bubble in the U.S. However low levels of social spending may, without
the presence of the corresponding societal significant, incentivize people to select
away from homeownership and into more liquid investment assets, as suggested
by Hariri, Jensen, and Lassen. Any interaction between culture effects and social
spending seems to reiterate the varied effects by country of social spending on
appreciation outcomes.
The introduction of the cases further corroborates the hypothesis,
particularly in the relatively extreme cases of Germany and Ireland. While
Germany fits the hypothesized CME outcome, its experience is an outlier,
suggesting there may be other factors (perhaps cultural) contributing to the
trajectory of its home prices. Ireland’s experience was a perfect storm of sorts: a
financial sector incredibly important to continued growth but poorly regulated,
paired with a societal emphasis on real estate and homeownership fueled by low
borrowing costs. House price appreciation was considered a signal of Ireland’s
too long delayed global ascendancy. While fitting the thesis’ hypothesis well,
Germany and Ireland also emphasize the importance of country-specific factors.
103
In the end, each country’s unique experience with the financial crisis, and house
price fluctuations, is worthy of consideration.
Do the results have implications for the prevention of future traumatic
price appreciation? This question seems to bring VOC, and its implications for
governments’ treatment of dominant sectors, back to the forefront. The reckoning
with the recent financial crisis has certainly led to the establishment of more
regulations. However at the end of the day, politicians are driven by the desire to
get re-elected. The American financial sector, due in part to mergers that
occurred in the wake of the crisis, is as important to the American economy as
ever. Germany has resisted any inflation of domestic prices and wages, which
would help its struggling European partners, for fear that such an action would
decrease its international export competitiveness. Voters make decisions based
on short-run economic realities, and thus politicians will always be lured into
governing with shorter time horizons. On an international level, catering to high
value-add sectors can sustain dangerous macroeconomic bifurcation into
borrowers and lenders. This global positioning, particularly amongst the most
developed countries, has serious implications for domestic economic health and
the extent of economic interdependence in the modern scheme of international
finance.
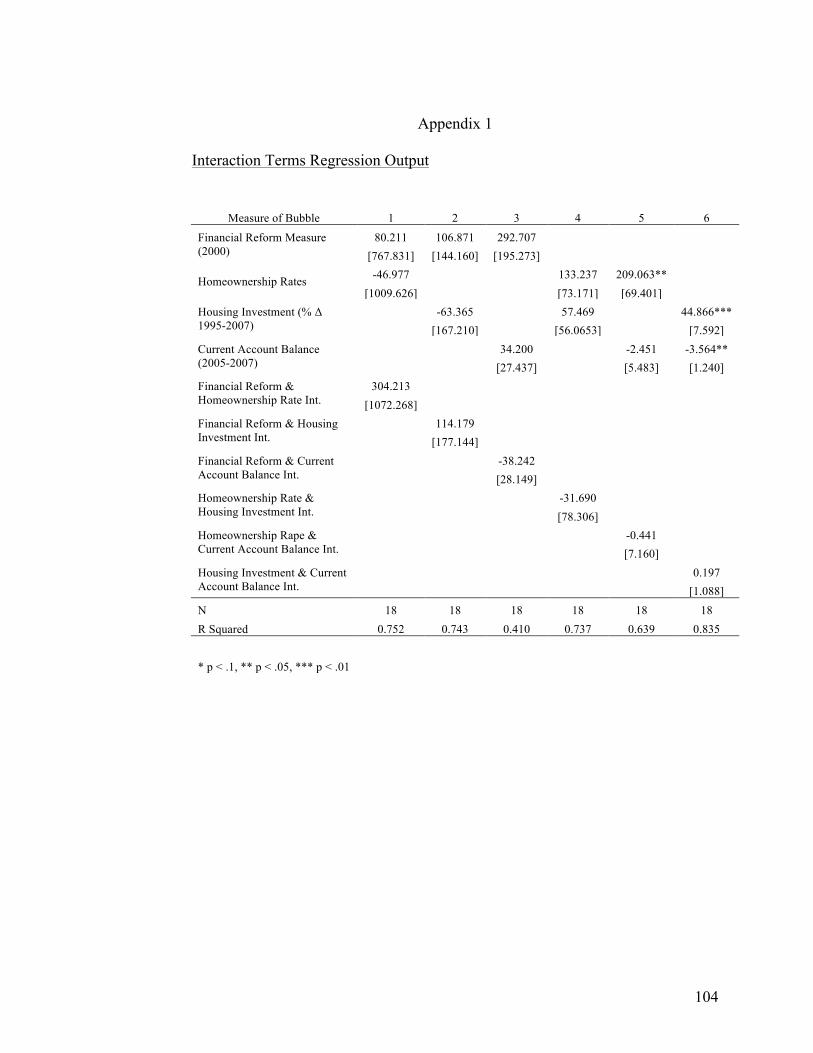
104
Appendix 1
Interaction Terms Regression Output
Measure of Bubble 1 2 3 4 5 6
Financial Reform Measure (2000)
80.211 106.871 292.707 [767.831] [144.160] [195.273]
Homeownership Rates -46.977
133.237 209.063** [1009.626]
[73.171] [69.401]
Housing Investment (% Δ 1995-2007)
-63.365
57.469
44.866***
[167.210]
[56.0653]
[7.592]
Current Account Balance (2005-2007)
34.200
-2.451 -3.564**
[27.437]
[5.483] [1.240]
Financial Reform & Homeownership Rate Int.
304.213 [1072.268] Financial Reform & Housing
Investment Int. 114.179
[177.144] Financial Reform & Current
Account Balance Int. -38.242
[28.149] Homeownership Rate &
Housing Investment Int. -31.690
[78.306] Homeownership Rape &
Current Account Balance Int. -0.441
[7.160] Housing Investment & Current
Account Balance Int. 0.197
[1.088]
N 18 18 18 18 18 18 R Squared 0.752 0.743 0.410 0.737 0.639 0.835
* p < .1, ** p < .05, *** p < .01
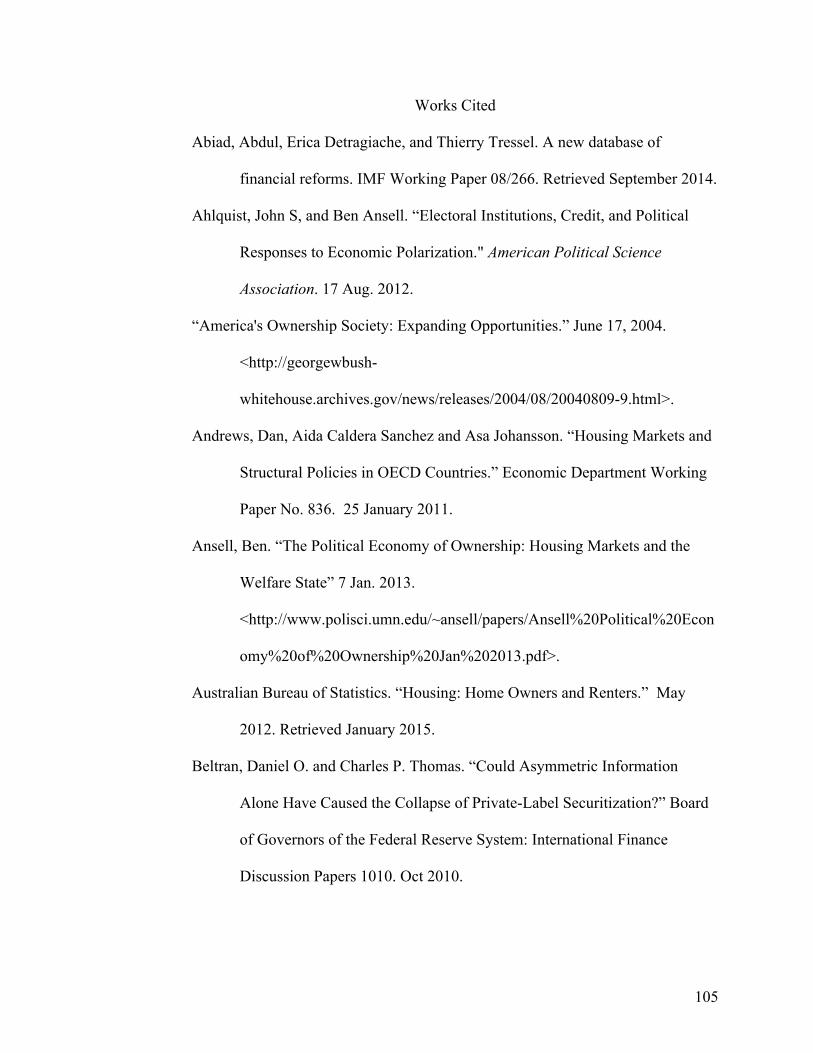
105
Works Cited
Abiad, Abdul, Erica Detragiache, and Thierry Tressel. A new database of
financial reforms. IMF Working Paper 08/266. Retrieved September 2014.
Ahlquist, John S, and Ben Ansell. “Electoral Institutions, Credit, and Political
Responses to Economic Polarization." American Political Science
Association. 17 Aug. 2012.
“America's Ownership Society: Expanding Opportunities.” June 17, 2004.
<http://georgewbush-
whitehouse.archives.gov/news/releases/2004/08/20040809-9.html>.
Andrews, Dan, Aida Caldera Sanchez and Asa Johansson. “Housing Markets and
Structural Policies in OECD Countries.” Economic Department Working
Paper No. 836. 25 January 2011.
Ansell, Ben. “The Political Economy of Ownership: Housing Markets and the
Welfare State” 7 Jan. 2013.
<http://www.polisci.umn.edu/~ansell/papers/Ansell%20Political%20Econ
omy%20of%20Ownership%20Jan%202013.pdf>.
Australian Bureau of Statistics. “Housing: Home Owners and Renters.” May
2012. Retrieved January 2015.
Beltran, Daniel O. and Charles P. Thomas. “Could Asymmetric Information
Alone Have Caused the Collapse of Private-Label Securitization?” Board
of Governors of the Federal Reserve System: International Finance
Discussion Papers 1010. Oct 2010.
106
Bush, George W. “Remarks by the President on Homeownership,” Department of
Housing and Urban Development. Washington DC. June 18, 2002.
Speech.
Chinn, Menzie D., and Jeffry A. Frieden. Lost Decades: The Making of America’s
Debt Crisis and the Long Recovery. New York: W.W. Norton &
Company, 2011. Accessed via ibooks.
Carlstrom, Johan and Niklas Magnusson. “Swedish Bubble Concern Grows with
Soaring Home Prices.” Bloomberg Business. 9 Oct. 2013. 5 March 2015.
Cusack, Thomas R., Torben Iversen, and David Soskice. “Economic Interests and
the Origins of Electoral Systems.” The American Political Science Review
101.3 (2007), pp. 373-391.
Dellepiane, Sebastian and Niamh Hardiman. “Governing the Irish Economy: A
Triple Crisis.” University College Dublin: Geary Institution Discussion
Paper Series. 21 Feb. 2011.
Estevez-Abe, Margarita, Torben Iversen, and David Soskice. "Social Protection
and the Formation of Skills: a Reinterpretation of the Welfare State."
Varieties of Capitalism: The Institutional Foundations of Comparative
Advantage. Ed. Peter A. Hall and David Soskice. Oxford Scholarship
Online, 2001.
Ezekiel, Mordecai. "The Cobweb Theorem". Quarterly Journal of Economics 52
(2): 255–280. (1938).
Federal Reserve Bank of Dallas. International House Price Database. Retrieved
September 2014.
107
Foote, Chris. "The Financial System: Opportunities and Dangers." Harvard
University. Science Center B, Cambridge, MA. 16 April 2014. Lecture.
Hall, Peter A. and Daniel W. Gingerich. “Varieties of Capitalism and Institutional
Complementarities in the Macroeconomy: An Empirical Analysis.” Max
Planck Institute for the Study of Societies Cologne: Discussion Paper. Sep
2004.
Hall, Peter. "The Political Origins of our Economic Discontents: Contemporary
Adjustment Problems in Historical Perspective." Politics in the New Hard
Times: The Great Recession in Comparative Perspective. Ed. Miles
Kahler and David Lake. Ithaca: Cornell University Press, 2013.
Hall, Peter, and David Soskice. "An Introduction to Varieties of Capitalism."
Varieties of Capitalism: The Institutional Foundations of Comparative
Advantage. Ed. Peter A. Hall and David Soskice. Oxford Scholarship
Online, 2001.
Hariri, Jacob, Amalie Sofie Jensen, and David Dreyer Lassen. “A Liquidity
Theory of Social Policy Preferences.” Prepared for American Political
Science Association 2014. 30 Oct. 2014.
Honohan, Patrick. "Resolving Ireland’s Banking Crisis." The Economic and
Social Review 40.2 (2009).
Iversen, Torben and David Soskice. “Distribution and Redistribution: The
Shadow of the Nineteenth Century.” World Politics 61.3 (2009), pp. 438-
486.
108
Torben Iversen and David Soskice, “Electoral Institutions and the Politics of
Coalitions: Why Some Democracies Redistribute More than Others.”
American Political Science Review 100.2 (2006), 165-81.
Iversen, Torben, and David Soskice. "Modern Capitalism and the Advanced
Nation State: Understanding the Causes of the Crisis." Coping with Crisis:
Government Reactions to the Great Recession. Ed. Nancy Bermeo and
Jonas Pontusson. New York: Russel Sage, 2012.
Iversen, Torben and David Soskice. “Politics and Capitalism”. Book manuscript,
Harvard University. 2015.
Johnson, Simon, and James Kwak. 13 Bankers: The Wall Street Takeover and the
Next Financial Meltdown. New York: Vintage Books, 2011. Accessed via
ibooks.
Keys, Benjamin J., Tanmov Mukherjee, Amir Seru, and Vikrant Vig. “Did
Securitization Lead to Lax Screening?” Quarterly Journal of Economics,
125.1 (2010).
Kindleberger, Charles, and Robert Z. Aliber. Manias, Panics, and Crashes. 6th
ed. New York: Palgrave MacMillan, 2011. Accessed via ibooks.
Krugman, Paul. The Return of Depression Era Economics. New York: W.W.
Norton & Company, 2009. Accessed via ibooks.
Krugman, Paul. "How Did Economists Get It So Wrong." The Times Magazine
Sept. 2, 2009.
Lewis-Beck, Michael S. “Does Economics Still Matter? Econometrics and the
Vote.” The Journal of Politics 68.1 (2006), pp. 208-212.
109
“National Home Ownership Strategy” Washington, DC: Department of Housing
and Urban Development, 1995. Chapter 4.
Norwegian Social Science Data Services. Comparative Political Dataset I.
Retrieved September 2014.
Oatley, Thomas. International Political Economy. Boston: Longman, 2006.
Organization for Economic Cooperation and Development. iLibrary Statistics.
Retrieved January 2015.
Organization for Economic Cooperation and Development. OECD Economic
Outlook No. 87: Statistics and Projections. Retrieved January 2015.
Popa, Mircea. “The Political Causes of Real Estate Bubbles,” Manuscript, 2013.
Powell Jr., G Bingham, and Guy D. Whitten. "A Cross-National Analysis of
Economic Voting: Taking Account of the Political Context." American
Journal of Political Science 37.22 (1993), pp. 391-414.
Rajan, Raghuram G. Fault Lines: How Hidden Fractures Still Threaten the World
Economy. Princeton: Princeton University Press, 2010. Accessed via
ibooks.
Rehm, Phillip. “Social Policy by Popular Demand.” World Politics 63.2 (2011),
271 -299.
Rehm, Phillip and Herbert Kitschelt. "New Social Risk and Political Preferences"
The Politics of Post-Industrial Welfare States: Adapting Post-War Social
Policies to New Social Risks. Ed Klaus Armingeon and Giuliano Bonoli.
New York: Routledge, 2006. 52-82.
110
Schwartz, Herman, and Leonard Seabrooke. "Varieties of Residential Capitalism
in the International Political Economy: Old Welfare State and the New
Politics of Housing." Comparative European Politics 6 (2008): 237-61.
Scruggs, Lyle. “The Generosity of Social Insurance, 1971–2002.” Oxford Review
of Economic Policy, 22.3 (2006).
Sorensen, Peter Birch. “The Swedish Housing Market: Trends and Risks.” Report
to the Swedish Fiscal Policy Council. May 2013.
Statistics Canada. “Owner Occupied Dwellings as a proportion of total dwellings
as a proportion of total dwellings and average dwelling value.” 1996.
Retrieved January 2015.
Statistics Japan: Ministry of Internal Affairs and Communication. 2008 Housing
and Land Survey. Retrieved January 2015.
Statistics New Zealand. “Census Quick Stats about Housing”. 18 March 2014.
Retrieved January 2015.
Streeck, Wolfgang. "The Crisis of Democratic Capitalism." New Left Review 71
(2011).
United Nations National Accounts Official Country Database. Retrieved January
2015.
United States Department of Commerce: Bureau of Economic Analysis.
Economic Accounts Information Guide.
United States Census Bureau: Census of Housing. “Historical Census of Housing
Tables.” Retrieved January 2015.
111
United States Census Bureau. North American Industry Classification System.
Retrieved January 2015.
Whelan, Karl. “Ireland’s Economic Crisis: The Good, the Bad, and the Ugly”.
June 18, 2013. Presented at Bank of Greece Conference.
World Bank. World Development Indicators. Retrieved November 2014.