the political sociology of the death penalty: a pooled ... · the political sociology of the death...
TRANSCRIPT

The Political Sociology of the Death Penalty: A Pooled Time-Series AnalysisAuthor(s): David Jacobs and Jason T. CarmichaelSource: American Sociological Review, Vol. 67, No. 1 (Feb., 2002), pp. 109-131Published by: American Sociological AssociationStable URL: http://www.jstor.org/stable/3088936 .
Accessed: 01/01/2015 20:37
Your use of the JSTOR archive indicates your acceptance of the Terms & Conditions of Use, available at .http://www.jstor.org/page/info/about/policies/terms.jsp
.JSTOR is a not-for-profit service that helps scholars, researchers, and students discover, use, and build upon a wide range ofcontent in a trusted digital archive. We use information technology and tools to increase productivity and facilitate new formsof scholarship. For more information about JSTOR, please contact [email protected].
.
American Sociological Association is collaborating with JSTOR to digitize, preserve and extend access toAmerican Sociological Review.
http://www.jstor.org
This content downloaded from 132.239.1.230 on Thu, 1 Jan 2015 20:37:18 PMAll use subject to JSTOR Terms and Conditions

THE POLITICAL SOCIOLOGY OF THE DEATH PENALTY: A POOLED TIME-SERIES ANALYSIS
DAVID JACOBS JASON T. CARMICHAEL Ohio State University Ohio State University
Despite the interest in the death penalty, no statistical studies have isolated the
social and political forces that account for the legality of this punishment. Racial or
ethnic threat theories suggest that the death penalty will more likely be legal in
jurisdictions with relatively large black or Hispanic populations. Economic threat
explanations suggest that this punishment will be present in unequal areas. Jurisdic-
tions with a more conservative public or a stronger law-and-order Republican party
should be more likely to legalize the death penalty as well. After controlling for
social disorganization, region, period, and violent crime, panel analyses suggest
that minority presence and economic inequality enhance the likelihood of a legal
death penalty. Conservative values and Republican strength in the legislature have
equivalent effects. A supplemental time-to-event analysis supports these conclusions.
The results suggest that a political approach has explanatory power because threat
effects expressed through politics and effects that are directly political invariably
account for decisions about the legality of capital punishment.
W HY IS THE death penalty present in some jurisdictions but not in others?
No other contemporary punishment is more severe, yet the literature is almost silent about the social and political influences that affect the legality of this punishment. A few informative case studies about attempts to change death-penalty provisions in particu- lar states have been published (Galliher and Galliher 1997; Haines 1996; Koch and Galliher 1993), but general tests of theoreti- cally derived hypotheses about this issue do not seem to exist. This gap in the literature
is puzzling because other aspects of the death penalty have been intensely investi- gated. Many studies assess the racial and other determinants of death sentences (Pater- noster 1991). The literature on deterrent ef- fects is equally substantial (Paternoster 1991). Yet little is known about the social and political forces that make capital pun- ishment legal.
In part because executions are such vivid demonstrations of state power, we focus on the political sociology of this punishment. Garland (1990) reveals some of the concep- tual promise of a political sociology of pun- ishment when he writes, "Penal law, at base, concerns itself with social authority and the governing claims of those with power. It re- inforces these claims by coercive sanctions as well as symbolic displays" (p. 123). Both Foucault (1977) and Garland (1990) see ex- ecutions as symbolic rituals that magnify political authority by forcibly reminding the populace of the immense coercive power be- hind the law. This theoretical interest in the links between politics and punishment sug-
Direct all correspondence to David Jacobs, Department of Sociology, Ohio State University, 300 Bricker Hall, 190 North Oval Mall, Colum- bus, OH 43210 ([email protected]). We thank Larry Baum, Doug Downey, Lowell Hargens, Joan Huber, and Ruth Peterson for their critical reading of prior drafts and Jim Moody for his in- valuable comments. We appreciate helpful ad- vice from Douglas Bearman, David Figlio, Bob Kaufman, and Jim Ziliak. All unreported analy- ses referred to in the text and the data are avail- able on request.
AMERICAN SOCIOLOGICAL REVIEW, 2002, VOL. 67 (FEBRUARY: 109-131) 109
This content downloaded from 132.239.1.230 on Thu, 1 Jan 2015 20:37:18 PMAll use subject to JSTOR Terms and Conditions
110 AMERICAN SOCIOLOGICAL REVIEW
gest that a void can be filled by using con- cepts borrowed from political sociology to explain the presence or absence of the death penalty.
The Weberians and the neo-Marxists, who stress coercive explanations for order, often see the criminal law and the state agencies that administer it as primarily serving the in- terests of the privileged. In this political view, an important (but not the only) use of the law is to maintain control over the "dan- gerous classes" who threaten social order (Chambliss 1964). If criminal sanctions are partially shaped by the need to control an underclass with much to gain from violence that reallocates resources, enhanced state co- ercion can be expected where this threat is most intense. The death sentence therefore should be legal in jurisdictions with substan- tial racial or economic cleavages. We test claims that the legality of the ultimate pun- ishment is shaped by such social divisions by estimating the relationships between underclass threat and the presence of the death penalty after controlling for other plausible explanations.
Punishment also may respond to com- pletely political influences. Conservatives and political parties that are more conserva- tive than their rival parties are more likely than their opponents to support harsh sanc- tions. Jacobs and Helms (1996) analyze changes over time in prison admissions and find that increases in the political strength of the law-and-order Republican Party pro- duced a subsequent growth in these rates. Sutton (2000) extends this finding by show- ing that expansions in the strength of con- servative political parties lead to larger prison populations in five advanced nations. These results suggest that the strength of the more conservative Republican Party or the strength of conservative public sentiments will influence decisions about the legality of capital punishment.
A related question we can begin to address concerns the primary source of political in- fluence. In many democracies the abolition of the death penalty was imposed on a reluc- tant public by political leaders (Zimring and Hawkins 1986). A British lawmaker com- ments that "in the case of capital punish- ment, legislators lead from the front" (Buxton 1974:245). But the United States is
an exceptional democracy-with frail par- ties, a weak bureaucracy, and democratically accountable state governments that decide many important criminal justice policies (Savelsberg 1994). These conditions give the U.S. public far more control over social policy than citizens have in more centralized democracies (Savelsberg 1994). In a popu- list democracy like the United States, a po- litically inactive public can be aroused by an intensely moral issue like capital punishment (Koch and Galliher 1993; Zimring and Hawkins 1986). The legality of the death penalty, rather than being imposed from above, may depend on public values and citizen pressures that force politicians to act. We examine these explanations by assessing the links between political partisanship, pub- lic ideology, and the presence or absence of capital punishment.
Hood (1998) lists many potential ac- counts, but he finds little evidence about this issue, so we hope that this analysis of the presence of the death penalty will fill an im- portant gap in the literature. Because execu- tions cannot occur in the absence of legal- ization, we begin to develop a political soci- ology of the ultimate sanction by focusing on the political and social conditions that give state courts the right to impose this sen- tence. Results from research designs that as- sess many hypotheses are more accurate (Johnston 1984, note 10). We therefore present exhaustive analyses, but this strategy means the next section must discuss multiple explanations. To show that conclusions about such an important issue do not depend on method, we present findings based on multiple specifications and different re- search procedures.
THEORETICAL EXPLANATIONS
Three general perspectives inform our un- derstanding of state behavior. A common ap- proach in political sociology treats public outcomes as the result of external social and economic forces that influence state deci- sions. This orientation yields hypotheses about the effects of social divisions. We be- gin by discussing the explanatory power of racial cleavages and economic inequality, partly because these threat explanations are so prominent in the literature. A micro ap-
This content downloaded from 132.239.1.230 on Thu, 1 Jan 2015 20:37:18 PMAll use subject to JSTOR Terms and Conditions

THE POLITICAL SOCIOLOGY OF THE DEATH PENALTY 111
proach focuses instead on individual belief systems. Political ideology may have strong effects on an intensely symbolic and moral issue like capital punishment. The most re- cent approach, exemplified by Evans, Rueschemeyer, and Skocpol (1984), sug- gests that the parochial interests of state of- ficials help determine political outcomes. Because politicians often act strategically and choose issues that increase their politi- cal support, we discuss the rationale for ac- counts that stress partisan tactics. We con- clude with the reasons for holding alterna- tive explanations constant.
RACIAL, ETHNIC, AND ECONOMIC
DIVISIONS
MINORITY THREAT. Conflicts about race once were and perhaps still are the most sa- lient feature of politics in the United States. Claims that the U.S. criminal justice system is not colorblind have stimulated many stud- ies about the ascriptive determinants of pun- ishment (for a review of literature on race and the death sentence, see Paternoster 1991). We use quantitative methods because no previous studies have used these methods to gauge the general relationships between minority presence and the legality of capital punishment.
Racial or ethnic threat theories suggest that enhanced minority presence leads to re- pression. Blumer (1958) and Blalock (1967) claim that dominant racial groups are intimi- dated by large minority populations. Greater minority presence threatens middle- and working-class whites, who respond with ef- forts to maintain their superior position. Fosset and Kiecolt (1989), Bobo and Hutchings (1996), and Taylor (1998) find that negative feelings about blacks are more common in areas with relatively more black residents. With the crime rate held constant, Liska, Lawrence, and Sanchirico (1982) find that fear of crime covaries with African American presence in cities. Many studies suggest that the perceived threats due to a larger racial underclass lead to enhanced ef- forts to control street crime. Cities with rela- tively large minority populations have more police officers (Jackson 1989; Jacobs 1979; Liska, Laurence, and Benson 1981), and higher arrest rates (Liska, Chamblin, and
Reed 1984). Time-series work shows that expansions in nonwhite presence lead to in- creased spending on jails and prisons (Jacobs and Helms 1999).
These findings suggest that whites from all classes successfully demand enhanced criminal punishments in areas with the larg- est minority populations. Such results, and the added finding that white support for capital punishment is closely associated with prejudice against blacks (Barkan and Cohn 1994), leads to the expectation that: A legal death penalty should be more likely in juris- dictions with high proportions of African Americans. In many states Hispanics occupy a minority niche similar to that of blacks, so we also expect that: The probability of a le- gal death penalty should be significantly greater in jurisdictions with relatively large Hispanic populations.
Both theory and empirical findings sug- gest that relationships between threat and re- pressive outcomes should be curvilinear. Taylor (1998) shows that many associations between minority presence and the racial at- titudes of whites depart from linearity, while Jackson (1989) finds nonlinear relationships between minority presence and police ex- penditures. Blalock's (1967 p. 128) theory predicts that minority threat will produce re- lationships between minority presence and repressive political decisions that are posi- tive, but these relationships will have an in- creasing slope. Blalock claims that such an increasing slope will be more likely when a dichotomous political outcome is at issue. Reed (1972) and Corzine, Creech, and Corzine (1983) study lynchings and find support for Blalock's expectations about in- creasing slopes.
Entirely political considerations also sug- gest that these relationships will take the nonlinear form stipulated by Blalock. If ra- cial divisions or other social forces explain the presence of the death penalty, these rela- tionships must go through intervening but unmeasured political processes. Yet politi- cians avoid irreversible policies that cannot be altered incrementally because such issues produce unresolvable conflicts and unhappy constituents (Oberschall 1973). The com- petitive nature of the agenda-setting process in legislatures provides another reason to think that the relationships between social
This content downloaded from 132.239.1.230 on Thu, 1 Jan 2015 20:37:18 PMAll use subject to JSTOR Terms and Conditions

11 2 AMERICAN SOCIOLOGICAL REVIEW
threat and the legality of the death penalty will not be linear. Busy representatives are compelled to ignore many important matters that compete for their attention. The forces we study therefore must reach thresholds sufficient to generate enough political pres- sure to make the legislature consider capital punishment. Opposition provides another reason for thinking that these relationships will be discontinuous. Political resistance typically exhibits sharp increases after the actors who seek legislative change accumu- late almost enough votes to prevail. For all of these reasons, we follow Blalock (1967) and the empirical findings and expect that the death penalty will be present or absent in a state if most of the forces we assess are above or below the thresholds needed to trig- ger successful political action.
ECONOMIC THREAT. Chambliss (1964), Chambliss and Seidman (1980), and Garland (1990) argue that punishment is shaped more by the menace of an economic underclass than by a racial or ethnic underclass. Weberians and neo-Marxists claim that dis- parities in economic resources create a po- tentially unstable social order that must be sustained by repression. Chambliss and Seidman (1980) write, "The more economi- cally stratified a society becomes, the more it becomes necessary for dominant groups to enforce through coercion the norms of con- duct that guarantee their supremacy" (p. 33). Because capital punishment is an extreme example of state coercion, the death penalty should be legal in the most economically stratified jurisdictions (Black 1989).
Garland (1990) completes this argument for a relationship between economic in- equality and punishment by claiming, "Where social power and authority are struc- tured upon class lines, . . . then punishment will reproduce the forms and figures of class even when its actions appear to transcend class divisions and protect those on the wrong side of the class divide" (p. 134). If Garland is right and punishment helps per- petuate an unequal class-based society, the most economically unequal jurisdictions with the greatest need for state coercion (Chambliss and Seidman 1980) should be more likely to legalize the death penalty. Al- though the key political actors could be from the middle- rather than the upper-class,
Stone (1987), captures most of the reasons for this expectation when he writes, "[Tihe criminal law was indeed in the last resort an instrument of the elite to protect their own and other people's lives by the use of selec- tive terror" (p. 250).
The logic of exchange provides another theoretical link between the degree of eco- nomic inequality and punitive measures. In societies in which production is coordinated by markets, exchange imbalances will be common. Violence that redistributes re- sources is one method dependent popula- tions may use to overcome their disadvan- taged position in unbalanced exchange rela- tionships (Blau 1964). This possibility should be obvious to prosperous citizens and to their political representatives. In areas in which economic differences between the poor and other groups are substantial, the menace of the "dangerous classes" will be greater and state officials may respond by legalizing the ultimate punishment.
The threat posed by an economic under- class is relational because it involves con- trasts between the resources of middle- and upper-income groups and the least prosper- ous groups (Jacobs 1979). Sharp differences in economic resources should enhance feel- ings of relative deprivation. Economic in- equality therefore produces both the motiva- tion and greater potential rewards for violent acts that redistribute goods. If this economic threat explanation is correct, we can expect that: Where economic inequality is most pro- nounced, jurisdictions will respond by mak- ing capital punishment legal. Because dis- putes about the explanatory power of minor- ity presence or economic inequality remain unresolved, we test both the racial-ethnic and the economic versions of threat theory.
EXPLICITLY POLITICAL EXPLANATIONS: IDEOLOGY AND PARTISAN STRATEGIES
IDEOLOGY. A different political account stresses public belief systems. A legal death penalty may be likely where conservative political ideologies that support harsh pun- ishments are more prevalent. Despite the plausibility of this claim, research that as- sesses the relationship between conservative public ideologies and the stringency of the criminal codes does not seem to exist.
This content downloaded from 132.239.1.230 on Thu, 1 Jan 2015 20:37:18 PMAll use subject to JSTOR Terms and Conditions

THE POLITICAL SOCIOLOGY OF THE DEATH PENALTY 113
An emphasis on punishment is consistent with conservative beliefs about individual accountability (Garland 1990). Conserva- tives see criminals as autonomous, rational, unfettered individuals who are responsible for their acts and therefore deserve punish- ment (Lacey 1988). Conservative views about crime rely on other concepts borrowed from the marketplace: "Punishment should be equivalent to the offense, so that justice consists in a kind of equity or fair trading which exchanges one harmful act for another which equals it" (Garland 1990:113).
Instead of stressing social arrangements that eliminate lawful alternatives, conserva- tives believe that reprehensible individual choices are the primary explanation for crime (Burnham 1970; Thorne 1990). If most crime results from unfettered choices, increases in the expected costs of law- breaking should be effective. This logic leads to the common conservative view that deterrence is the best remedy for lawless behavior. Thus, Molnar (1976) writes, "[I]f those who deserve it are not appropriately penalized, then the so-far guiltless tend to fall, by a kind of social gravitational pull, to lower levels of discipline and civilization" (p. 47). Conservatives use the same logic to justify a claim that the threat of the death penalty will save many innocent victims from criminal predation.' Because they see
human nature as fixed (Thorne 1990), many conservatives believe that the most vicious criminals cannot be reformed. Such perni- cious and incorrigible offenders must be ex- ecuted to ensure that they no longer can harm the innocent.
Liberals are much more optimistic about the potential for rehabilitation and believe that crime is caused by inequitable social conditions (Garland 2001; Thorne 1990). They are skeptical of harsh penalties and view social reform as the most effective and just remedy for lawlessness (Garland 2001; Taylor, Walton, and Young 1973). Studies in- variably show that liberal values are closely associated with an aversion to harsh punish- ments and hostility to the death penalty (Brillon 1988; Langworthy and Whitehead 1986; Taylor, Scheppele, and Stinchcombe 1979; Van Dijk and Steinmetz 1988). Lakoff (1996) contends that this disagreement be- tween liberals and conservatives about the morality of capital punishment is one of the most reliable dividing lines between these ideological camps. Because public support for the death penalty should be most intense where conservative values dominate, we ex- pect that: A legal death penalty should be more likely where conservative belief sys- tems are stronger than liberal belief systems.
PARTISAN STRATEGIES. A different set of political explanations focuses on the strate- gic behavior of politicians. Developments in political sociology suggest that political pro- cesses are not simple derivatives of social and economic arrangements (Evans et al. 1984). State managers often act autono- mously and support policies that will en- hance their parochial interests. Republican candidates can win elections by appealing to lower-middle-class and working-class voters who do not benefit from Republican eco- nomic policies (Blank and Blinder 1986; Hibbs 1987) if they campaign on a "wedge" issue-like law and order (Beckett 1997;
I Paternoster (1991) confirms the conclusions of virtually all other scholars by writing, "After years of research with different methodologies and statistical approaches, the empirical evidence seems to clearly suggest that capital punishment is not a superior general deterrent" (p. 241). Zimring and Hawkins (1986) give reasons for the public's continued support for capital punish- ment despite the absence of evidence that it is superior to imprisonment as a deterrent. They ex- plain public reactions after this penalty was abol- ished in other democracies with the following analogy:
In reality the death penalty is about as relevant to controlling crime as rain-dancing is to con- trolling the weather. So long as rain dances continue to be performed, as they have been since time immemorial, the belief that they have some influence on rainfall cannot be tested. When they cease to be performed, and the amount of precipitation remains unchanged in subsequent years, the ritual's influence dis- sipates. Similarly, as time passes after aboli-
tion and increases in violent crime do not ma- terialize, the felt necessity of the capital sanc- tion diminishes gradually. (1986:14-15)
Other scholars (e.g., Hood 1998) have claimed that repeated evidence showing that the death penalty is not a more effective deterrent than im- prisonment has little effect on public support for the death penalty.
This content downloaded from 132.239.1.230 on Thu, 1 Jan 2015 20:37:18 PMAll use subject to JSTOR Terms and Conditions

11 4 AMERICAN SOCIOLOGICAL REVIEW
Edsal and Edsal 1991), which divides the Democratic coalition.
An antistreet-crime agenda lets Republi- cans covertly appeal to antiminority senti- ments and attract less affluent voters who are more likely to be victims of street crime and who are more likely to live in or near areas in which violent crime is problematic. State- ments by Nixon administration officials re- veal that Republicans deliberately used such law-and-order appeals to gain support from racists (Edsal and Edsal 1991). By empha- sizing street crime and other problems readily blamed on a racially distinct under- class, conservatives can win elections by capturing votes from less prosperous citizens who resent the underclass (Edsal and Edsal 1991). Such law-and-order campaign tactics will help conservatives win elections even though conservatives continue to support economic policies that primarily benefit their affluent core supporters (Blank and Blinder 1986; Hibbs 1987). Claims that the Demo- crats are "soft on crime" therefore became a central part of Republican political campaign appeals after 1964 (Chambliss 1999).
Republican officeholders have repeatedly increased the severity of legal sanctions. Multiple findings show that Republican po- litical strength is associated with more re- pressive criminal justice outcomes (Jacobs and Carmichael 2001; Jacobs and Helms 1996, 1997, 1999). Because capital punish- ment has been a key issue in many state po- litical campaigns (Constanzo 1997) and be- cause Pierce and Radelet (1990-1991) claim that many politicians support the death pen- alty for strategic reasons, we expect that: Ju- risdictions with a Republican governor will be more likely to legalize the death penalty. The same logic suggests that: A legal death penalty will be more probable in states with substantial Republican strength in the legis- lature.
ALTERNATIVE ACCOUNTS: CONTROLS FOR SOCIAL DISORGANIZATION AND VIOLENT CRIME
Garland (2000) claims that enhanced de- mands for severe punishment are produced by social disorganization, which may ac- count for the presence of the death penalty after serious crime rates have been held con-
stant in the multivariate analyses. Some vio- lence that results from disorganization may not be captured by the violent crime or mur- der rates, but this violence may lead to greater public anxieties or resentments and enhanced political pressures for harsh pun- ishments (Garland 2001; Tyler and Boeck- mann 1997). It is important to hold such fac- tors constant because jurisdictions with rela- tively large minority populations or en- hanced economic stratification may legalize the death penalty, but not due to racial or economic threat. The public anxieties or re- sentments produced by social disorganiza- tion often appear where minority presence and economic stratification is most substan- tial. If disorganization effects are not held constant, we could not rule out the possibil- ity that citizens are responding to social dis- organization rather than to racial or eco- nomic threat when they successfully pres- sure their political representatives to legal- ize capital punishment.
Sampson (1987) and Sampson and Groves (1989) find that cities with relatively large proportions of female-headed families have relatively high violent crime rates. Substan- tial unemployment may heighten demands for severe punishments because the prosper- ous view the unemployed as a threat (Chambliss 1964) or because greater unem- ployment magnifies resentments against underclass offenders. But states with rela- tively large populations that live in or near large cities should be less likely to retain the death sentence because rural citizens often hold more punitive views about the most ap- propriate punishments for serious crime (Hagan 1977).
Geographic mobility interferes with the formation of group ties and solidarity. Out- siders inspire hostility and fear (Hale 1996), while community stability and an absence of strangers strengthens within-group ties and empathic feelings toward one's neighbors (Hale 1996). Citizens in jurisdictions with remarkably few outsiders therefore may be less willing to support executions. It follows that jurisdictions with extremely high pro- portions of residents who were born in a state should not be as likely to legalize capi- tal punishment.
Finally, it is crucial to hold the violent crime rates constant because greater politi-
This content downloaded from 132.239.1.230 on Thu, 1 Jan 2015 20:37:18 PMAll use subject to JSTOR Terms and Conditions

THE POLITICAL SOCIOLOGY OF THE DEATH PENALTY 115
cal support for capital punishment should be present where such crimes are more common. A primary justification for the death penalty is its purported deterrent ef- fect on those who are tempted to use illegal force to commit predatory acts. States with relatively high violent crime or murder rates therefore should be more likely to let their courts impose the death penalty. In the analyses that follow we hold each of these control variables constant in at least one model.
METHODS
RESEARCH DESIGN, DEPENDENT VARIABLES, AND ESTIMATION
RESEARCH DESIGN. In the primary analy- ses, we use state-level explanatory variables for 1970, 1980, and 1990 to explain the presence or absence of the death penalty in the 50 states in 1971, 1981, and 1991. Fol- lowing researchers in public policy we use one-year lags. If the sample is not confined to census years, the values of critical ex- planatory variables, such as the percentage of blacks or Hispanics and economic in- equality, must be estimated for the nine years between each census. To avoid mea- surement error and findings that would au- tomatically favor some hypotheses over oth- ers, we limit the sample to these 150 state- years.2 We begin the panel analyses in 1970 because the census did not enumerate His- panics or calculate income inequality before then.
DEPENDENT VARIABLES. In 1971, 41 states had the death penalty, but 9 did not. By 1981, the number of abolitionist states grew to 13; in 1991 the states without the death penalty grew to 14. Oregon legalized capital punishment between 1971 and 1981. New Jersey had the death penalty in 1971, but dropped capital punishment by 1981 only to make it legal again by 1991. Six other states (Kansas, Massachusetts, North Dakota, Rhode Island, New York, and Ver- mont) abolished capital punishment between
1971 and 1991. Eight states (Alaska, Ha- waii, Iowa, Maine, Michigan, Minnesota, West Virginia, and Wisconsin) never legal- ized capital punishment. All remaining states retained the death penalty during the three periods we analyze.3
Four years after its 1972 Furman v. Geor- gia decision (408 U.S. 238 [1972]) that tem- porarily outlawed capital punishment, the Supreme Court reversed course. In its 1976 Gregg v. Georgia (96 Sup. Ct. 2902 [1976]), Jurek v. Texas (428 U.S. 262 [1976]), and Profit v. Florida (428 U.S. 242 [1976]) decisions, the Supreme Court upheld the constitutionality of guided discretionary death-penalty statutes if states also added a separate independent procedure to determine sentence after a guilty verdict in capital cases.4 Not all death-penalty states immedi- ately complied with the substantial alter- ations to death-penalty law required by the Supreme Court. We present a supplemental event-history analysis of the time it took states to meet the Supreme Court's new re- quirements for a constitutional death penalty to find out if the factors associated with le- galization isolated in the panel analyses ex- plain how quickly the death penalty was "relegalized." If results from these supple- mental time-to-event regression analyses support the panel results, these findings
2Including periods separated by multiple years in a pooled time-series design reduces serial cor- relation and the effects of measurement error (Johnston and DiNardo 1997).
3 The over-time standard deviation in the pres- ence of the death penalty (see Table 1) shows that enough variation is present to use it as the de- pendent variable in panel analyses. Information about the legality of the death penalty was col- lected from various editions of The Sourcebook of Criminal Justice Statistics and checked with data in Bowers (1984) and Zimring and Hawkins (1986). The death penalty is coded as legal in a state if it is authorized for any criminal act.
I Guided discretionary procedures attempt to achieve sentencing equity across courts within a state by requiring that standardized instructions be given to juries. These instructions list various aggravating or mitigating factors that must be considered in a subsequent independent sentenc- ing phase in capital trials (Paternoster 1991; Zimring and Hawkins 1986). The Supreme Court required that states institute a separate sentenc- ing procedure to occur after a guilty verdict in capital cases so defendants would not have to partially admit guilt by introducing evidence about mitigating factors during the part of their trial that determined their guilt or innocence.
This content downloaded from 132.239.1.230 on Thu, 1 Jan 2015 20:37:18 PMAll use subject to JSTOR Terms and Conditions

11 6 AMERICAN SOCIOLOGICAL REVIEW
should produce much greater confidence in the conclusions.5
The presence or absence of the death pen- alty would not be as compelling if many states with a legal death penalty never used it. States with the death penalty failed to im- pose death sentences in only 14 of the 114 state-years covered by the death penalty in the five years during and after the time we measure its presence (1971-1975, 1981- 1985, 1991-1995). Half of the 14 non-death sentence state-years occurred in the 1971- 1975 period, when the anticipated 1972 Furman decision, that temporarily outlawed capital punishment, led to sharp reductions in the number of death sentences. From 1991 to 1995, only 2 of 35 death-penalty states did not impose this sentence. The mean number of death sentences in these three five-year periods in death-penalty states was 30.7 (af- ter 1980 and the reversal of the Furman de- cision, this mean rises to 39.4). If states al- low the death sentence, their courts use it. The legality of this punishment is not just a symbolic issue.6
Estimation. In the primary analyses we use a pooled time-series cross-sectional proce- dure because it captures both cross-sectional and longitudinal variation. An analysis sen- sitive to both kinds of variation will produce more efficient estimates. Most of the varia- tion in the presence of the death penalty is cross-sectional, but about a third involves over-time changes in the legality of this pun- ishment (see Table 1). In part because most-but by no means all-of this varia- tion is cross-sectional, we present supple- mental Weibull regression analyses of time to compliance with the Supreme Court's 1976 requirements for a constitutional death penalty to check the validity of our pooled time-series cross-sectional findings.
Because the presence or absence of the death penalty is a dichotomy, we estimate most of the pooled time-series cross-sec- tional models with a pooled complementary log-log procedure. In simplified notation the complementary log-log model takes the fol- lowing form:
log[-log(1 -P)] = a + B1X + . . . + BkX.
This estimator is appropriate when a di- chotomous dependent variable is skewed (Agresti 1990; Clayton and Hills 1993; Long 1997; Rotolo 2000). It gives results that are slightly stronger than probit or logit models. To show that the complementary log-log re- sults are not idiosyncratic, we report pooled time-series cross-sectional probit results as well. We use a population-averaged estima- tion procedure (Liang and Zeger 1986; Pendergast et al. 1996; Prentice and Zhao 1991; StataCorp 2000) that is closely analo- gous to random-effects.7 To control for pe-
5 This supplemental analysis is important be- cause most of the initial state decisions about the legality of capital punishment occurred many years before the information required for a plau- sible analysis was collected. The 1976 Supreme Court decisions are extremely useful because they forced the states to decide this issue again. If this time-to-event analysis shows that the same effects explain the presence of this penalty and the time it took to comply with the Supreme Court's requirements, objections about historical inheritance should be largely eliminated.
6 We do not present comparisons of the num- ber of executions to show that the death-penalty states often use this punishment because the fed- eral courts frequently interfered with these state decisions. The delay between death sentences and executions (often longer than 10 years) and the changes in the relevant legal and legislative decisions that occurred during this long period make valid state contrasts using the number of executions impossible. These difficulties also mean that the number of executions in a state cannot be used as a dependent variable in an analysis. The substantial time between sentence and execution creates severe estimation prob- lems. Adequate controls for the shifting influence of the federal courts during the substantial delays between sentence and punishment probably are not possible. The number of death sentences in the states is another potential dependent variable,
but the distinct nature of such a complex analy- sis means that this investigation must be reported in a different paper.
I Fixed-effects logit is inappropriate in this case because such an analysis would be restricted to 24 cases. In any event, fixed-effects estima- tion removes all cross-sectional variation, but we want to capture the factors that produce both cross-sectional and over-time jurisdictional dif- ferences. Although the population-averaged pro- cedure we use is almost identical to random-ef- fects, random-effects cannot be used because only less exhaustive models pass quadcheck tests. Random-effects procedures that analyze di- chotomies use the Gauss-Hermite quadrature to
This content downloaded from 132.239.1.230 on Thu, 1 Jan 2015 20:37:18 PMAll use subject to JSTOR Terms and Conditions

THE POLITICAL SOCIOLOGY OF THE DEATH PENALTY 117
riod effects, we include dummy variables for years and dummy variables for region to capture omitted factors like culture.
EXPLANATORY VARIABLE MEASUREMENT
Many of the theories we test predict discon- tinuous effects. When we use dummy vari- ables to capture these threshold effects, we first tested this specification by including both the dummy variable(s) and the explana- tory variable in its continuous form in the same panel analyses (not shown). If the coefficient(s) on the dummy variable(s) are significant, but the coefficient on the vari- able in continuous form is not, we have strong evidence that the relationship in ques- tion is discontinuous and that a dummy vari- able specification is the most appropriate way to operationalize such threshold effects (note 15 describes BIC and AIC tests that assess these dummy variable specifications). Explanatory variables are left in continuous form when this test shows that dummy vari- ables are ineffective. We avoid multiple runs and over-fitting by breaking the (ordered) continuous variables into equal fourths and calculating dummy variable thresholds based on a state's quartile score. Note that over-fitting is problematic because it pro- duces ungeneralizable results. If the thresh- olds we use for these dummy variables are effective largely because they have been over-fit to the presence of a legal death pen- alty in the pooled time-series cross-sectional panel analyses, they should not explain the alternative outcome in the supplemental time-to-compliance event-history analyses.
We assess minority presence with the per- centage of blacks and with the natural log of the percentage of Hispanics (some explana- tory variables are in natural-log form to cor- rect skewed distributions and ensure multi-
variate normality). Because the relationship between the percentage of blacks and the presence or absence of a death penalty should be discontinuous and because the test described above shows that a dummy speci- fication will be most appropriate, we use a dummy variable to represent this threat ef- fect. This dummy variable is scored 1 if the percentage of blacks in a state exceeds the median percentage black for all states (or 6.4 percent) and 0 otherwise.
We measure economic inequality with the Gini index computed on family incomes by the census. In most analyses we use a dummy variable coded 1 if the value of Gini was greater than the median Gini value (.369) but less than the 75th percentile score (.389), and a dummy variable coded 1 if a state's score on Gini exceeded the 75th per- centile for the states.
Residence in large communities (50,000 plus) is measured with the percentage living in metropolitan statistical areas. The pres- ence of outsiders is assessed with a dummy coded 1 if a state was in the highest quartile of the percentage of residents born in state (or a score greater than 75.3 percent). We gauge violent crime with the natural log of the Uniform Crime Report murder and vio- lent crime rates (alternative crime statistics are not available by region). We assess fam- ily disorganization with the natural log of the percentage of families with a female head, and we use the census unemployment rate.
Berry et al. (1998) view citizen ideology as the mean position on a liberal-conserva- tive continuum. To compute a measure that varies over time, they identify the ideologi- cal position of each member of Congress with ratings by interest groups (Americans for Democratic Action, Committee on Politi- cal Education) of that representative's vot- ing record. They estimate citizen ideology within each state by congressional district with the ideology score for the district's in- compute the log-likelihood and its derivatives. If
random-effects is appropriate, the estimates of the log-likelihood and the coefficients should not diverge by more than 1 percent when different quadrature points are tested. Only restricted ran- dom-effects models pass this test, so we use population-averaged estimation instead (although the less exhaustive random-effects models that pass this test give theoretically equivalent re- sults). All standard errors are corrected for
heteroskedasticity using White's (1980) method. We estimate with XTGEE complementary log- log and probit routines in Stata version 7 and cor- rect for potential autocorrelation with an ARI term. This estimator is robust to mispecification because the estimates are corrected for hetero- skedasticity.
This content downloaded from 132.239.1.230 on Thu, 1 Jan 2015 20:37:18 PMAll use subject to JSTOR Terms and Conditions

11 8 AMERICAN SOCIOLOGICAL REVIEW
cumbent representative and with an esti- mated score for that incumbent's challenger in the last election. Ideology scores for the incumbent are combined with estimated ide- ology scores for the challenger weighted by district election results to capture within-dis- trict ideological divisions. Berry et al. (1998) calculate state scores on liberalism- conservatism using the mean of these con- gressional district scores. Theory suggests that this variable's predictive power will be greatest when it is left in continuous form.
Republican strength is measured with a dummy variable coded 1 for the presence of a Republican governor and by a dummy variable coded 1 when the percentage of Re- publicans in a state's legislature exceeds 60 percent. We select this threshold because it is plausible that a dichotomous outcome like the death penalty would be more likely in areas in which the law-and-order party had a substantial legislative majority.
The prior discussion suggests that the co- efficients on three explanatory variables should be negative: the percentage living in metropolitan statistical areas, the dummy variable for the percentage born in the state, and the liberalism-conservative index (that gives liberal states a higher score) should be inversely related to the probability of a legal death penalty. We do not predict the sign on the dummy variables for region or period, and we use two-tailed significance tests for these effects. The coefficients on all remain- ing explanatory variables should be positive.
SPECIFICATION
One of the more general specifications of the panel models therefore is:
Death Penalty = bo+b1Percentage Black
+ b2Percentage Hispanic
+ b3Inequality + b4Born in State
+ b5Murder Rate + b6Ideology
+ b7Republican Legislature
+ b8Republican Governor
+ bgSouth + b1oNorth East
+ b11West + b121970
+ b131980. (1)
In additional analyses we control for the ef- fects of the percentage of female-headed families, the violent crime rates, the percent- age of residents living in a MSA, and the unemployment rate.8
ANALYSES
DESCRIPTIVE STATISTICS AND CROSS-TABULATIONS
Table 1 shows the expected signs along with the means and standard deviations across states and over time.9 These and other results show that there is enough over-time varia- tion in the dependent variable to conduct pooled time-series analyses. The over-time coefficient of variation (the standard devia- tion divided by its mean) for the death-pen- alty variable is .249, while the relevant chi-
8 Inferences about the relationships between the explanatory variables and the presence of the death penalty will be equivalent to those from any random-effects pooled time-series panel analysis that assesses the combination of cross- sectional and longitudinal variation in a depen- dent variable (see Johnston and DiNardo 1997). The best information about whether a explana- tory variable's effects in a panel analysis is mostly longitudinal or mostly cross-sectional can be found in Table 1. If most of the variation in an explanatory variable is cross-sectional, it's covariation with the dependent variable should be largely cross-sectional rather than longitudi- nal. An argument that these potential policy shifts are largely governed by the inertia of past decisions is plausible, but the supplemental du- ration analysis of state decisions to "relegalize" capital punishment should eliminate this objec- tion. In effect, the 1976 Supreme Court decisions forced the states that had the death penalty to again make decisions about adopting this punish- ment. In the panel analyses, what appears as a nondecision by states that kept the death penalty in fact involved significant legal changes. Note that such claims about historical inertia enhance the plausibility of Blalock's (1967) hypotheses about nonlinear relationships. If it is so difficult to alter inherited state decisions about capital punishment, increases in the social forces we as- sess probably would have to become more ex- treme to overcome this inertia when political vic- tory is imminent.
9 The standard deviations across time and space are calculated using the XTSUM procedure in Stata version 7.
This content downloaded from 132.239.1.230 on Thu, 1 Jan 2015 20:37:18 PMAll use subject to JSTOR Terms and Conditions
THE POLITICAL SOCIOLOGY OF THE DEATH PENALTY 119
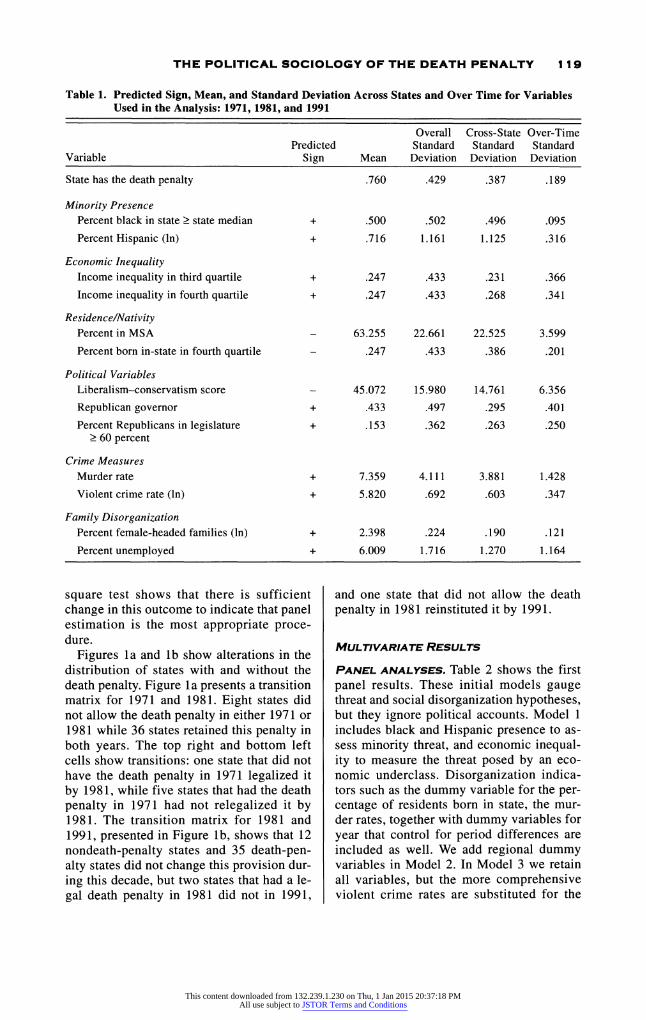
Table 1. Predicted Sign, Mean, and Standard Deviation Across States and Over Time for Variables Used in the Analysis: 1971, 1981, and 1991
Overall Cross-State Over-Time Predicted Standard Standard Standard
Variable Sign Mean Deviation Deviation Deviation
State has the death penalty .760 .429 .387 .189
Minority Presence Percent black in state 2 state median + .500 .502 .496 .095
Percent Hispanic (ln) + .716 1.161 1.125 .316
Economic Inequality Income inequality in third quartile + .247 .433 .231 .366
Income inequality in fourth quartile + .247 .433 .268 .341
Residence/Nativity
Percent in MSA - 63.255 22.661 22.525 3.599
Percent born in-state in fourth quartile - .247 .433 .386 .201
Political Variables
Liberalism-conservatism score - 45.072 15.980 14.761 6.356
Republican governor + .433 .497 .295 .401
Percent Republicans in legislature + .153 .362 .263 .250 > 60 percent
Crime Measures Murder rate + 7.359 4.111 3.881 1.428
Violent crime rate (In) + 5.820 .692 .603 .347
Family Disorganization Percent female-headed families (ln) + 2.398 .224 .190 .121
Percent unemployed + 6.009 1.716 1.270 1.164
square test shows that there is sufficient change in this outcome to indicate that panel estimation is the most appropriate proce- dure.
Figures la and lb show alterations in the distribution of states with and without the death penalty. Figure 1 a presents a transition matrix for 1971 and 1981. Eight states did not allow the death penalty in either 1971 or 1981 while 36 states retained this penalty in both years. The top right and bottom left cells show transitions: one state that did not have the death penalty in 1971 legalized it by 1981, while five states that had the death penalty in 1971 had not relegalized it by 1981. The transition matrix for 1981 and 1991, presented in Figure lb, shows that 12 nondeath-penalty states and 35 death-pen- alty states did not change this provision dur- ing this decade, but two states that had a le- gal death penalty in 1981 did not in 1991,
and one state that did not allow the death penalty in 1981 reinstituted it by 1991.
MULTIVARIATE RESULTS
PANEL ANALYSES. Table 2 shows the first panel results. These initial models gauge threat and social disorganization hypotheses, but they ignore political accounts. Model 1 includes black and Hispanic presence to as- sess minority threat, and economic inequal- ity to measure the threat posed by an eco- nomic underclass. Disorganization indica- tors such as the dummy variable for the per- centage of residents born in state, the mur- der rates, together with dummy variables for year that control for period differences are included as well. We add regional dummy variables in Model 2. In Model 3 we retain all variables, but the more comprehensive violent crime rates are substituted for the
This content downloaded from 132.239.1.230 on Thu, 1 Jan 2015 20:37:18 PMAll use subject to JSTOR Terms and Conditions

120 AMERICAN SOCIOLOGICAL REVIEW
States with the Death Penalty in 1981
No Yes Total
~~ No ~ 8 1 9 (88.9%) (11 1%) (100%)
~~ Yes ~~536 41 (12.2%) (87.8%) (100%)
D Total 13 37 50 (26%) (74%) (100%)
(a) 1971 Compared with 1981
States with the Death Penalty in 1991
No Yes Total
co N 1 2 1 1 3 (92.3%) (7.7%) (100%)
~~ Yes ~~ 2 35 37 (5.4%) (94.6%) (100%)
D Total 14 36 50 (28%) (72%) (1 00%)
(b) 1981 Compared with 1991
Figure 1. Transition Matrices of the Presence of Death-Penalty Laws: 1971 to 1981 and 1981 to 1991
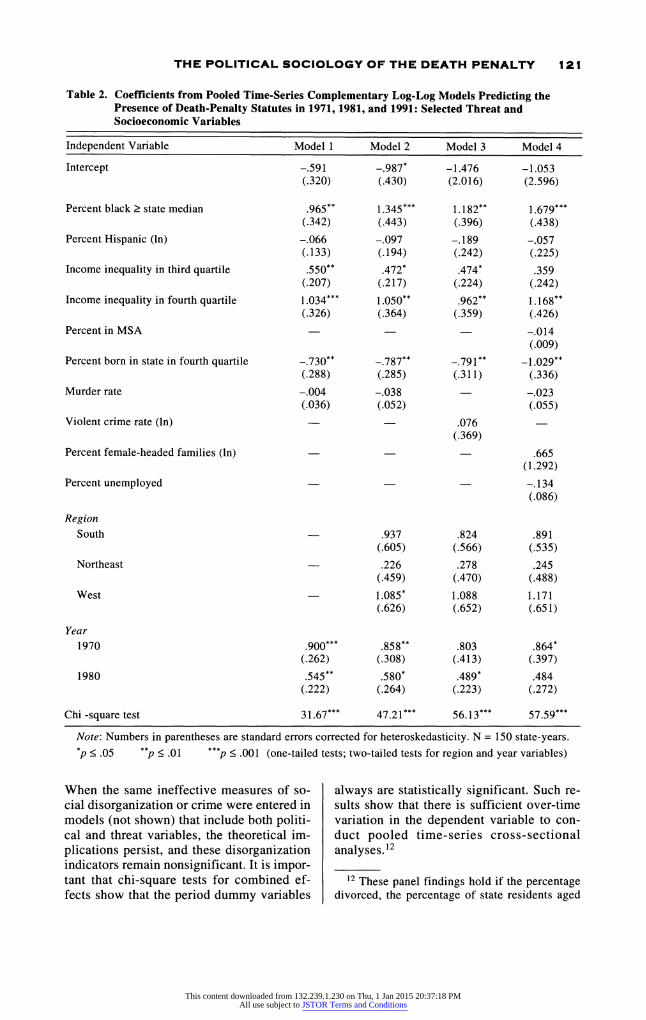
murder rates. In Model 4 we add the remain- ing disorganization variables.10
We find persistent evidence for threat ef- fects in these initial analyses. The most eco- nomically unequal states and states with the highest percentages of blacks are more likely
to have the death penalty, but Hispanic pres- ence is not significant (and this finding does not change if this continuous variable is recoded with dummy variables). Although the percentage born in state is an exception, the other social disorganization variables and either the violent crime rate or the mur- der rate do not influence this decision, and these conclusions persist when we enter these variables separately (in analyses not shown). But we do not know what will hap- pen when political effects are assessed.
Table 3 presents these findings. Model 1 includes the Berry et al. (1998) liberalism- conservatism index, the presence of a Re- publican governor, Republican dominance in the state legislature, and all variables that were significant in Table 2. In Model 2 we again add the three regional dummy vari- ables. The ineffective Republican governor variable is dropped in Model 3. Model 4 in- cludes the same variables used in Model 3, but this model is estimated with pooled time- series probit to find out what happens when the best model is estimated with a more con- ventional statistical procedure.
The presence of blacks and economic in- equality continue to explain the legality of the death penalty, but political effects have explanatory power as well. Liberal states are less likely than conservative states to allow the death penalty, and capital punishment tends to be legal in jurisdictions in which the Republican party has legislative majorities.11
1 Although leaving the threat and political variables in continuous form is a misspecification (for additional evidence, see note 15), the most theoretically important findings survive this test. Consider the following complimentary log-log equation with all variables but the percentage born in state, region, and year in continuous form:
Death Penalty = -1.81 +.078 Percentage Black (2.69) (.033)
+ 11.3 Gini - .901 Born in State (6.45) (.329)
- .030 Ideology (.01 1)
+ .017 Republican Legislature (.01 1)
+ .578 South +.859 (1970) +.143 (1980) (.629) (.313) (.243)
This (mis)specification using threat variables in continuous form, however, is not robust when additional controls are introduced.
10 The number of regressors in these models is appropriate because econometricians claim that exhaustive specifications are preferable. Johnston (1984) says:
It is more serious to omit relevant variables than to include irrelevant variables since in the former case the coefficients will be biased, the disturbance variance overestimated, and con- ventional inference procedures rendered in- valid, while in the latter case the coefficients will be unbiased, the disturbance variance properly estimated, and the inference proce- dures properly estimated. (p. 262)
This content downloaded from 132.239.1.230 on Thu, 1 Jan 2015 20:37:18 PMAll use subject to JSTOR Terms and Conditions
THE POLITICAL SOCIOLOGY OF THE DEATH PENALTY 121
Table 2. Coefficients from Pooled Time-Series Complementary Log-Log Models Predicting the Presence of Death-Penalty Statutes in 1971, 1981, and 1991: Selected Threat and Socioeconomic Variables
Independent Variable Model 1 Model 2 Model 3 Model 4
Intercept -.591 -.987* -1.476 -1.053 (.320) (.430) (2.016) (2.596)
Percent black 2 state median .965** 1.345*** 1.182** 1.679*** (.342) (.443) (.396) (.438)
Percent Hispanic (ln) -.066 -.097 -.189 -.057 (.133) (.194) (.242) (.225)
Income inequality in third quartile .550** .472* .474* .359 (.207) (.217) (.224) (.242)
Income inequality in fourth quartile 1.034*** 1.050** .962** 1.168** (.326) (.364) (.359) (.426)
Percent in MSA -.014 (.009)
Percent born in state in fourth quartile -.730** -.787** -.791** -1.029** (.288) (.285) (.311) (.336)
Murder rate -.004 -.038 -.023 (.036) (.052) (.055)
Violent crime rate (ln) - .076 (.369)
Percent female-headed families (In) .665 (1.292)
Percent unemployed -.134 (.086)
Region
South - .937 .824 .891 (.605) (.566) (.535)
Northeast - .226 .278 .245 (.459) (.470) (.488)
West 1.085* 1.088 1.171 (.626) (.652) (.651)
Year 1970 .900*** .858** .803 .864*
(.262) (.308) (.413) (.397)
1980 .545** .580* .489* .484 (.222) (.264) (.223) (.272)
Chi -square test 31.67*** 47.21*** 56.13*** 57.59***
Note: Numbers in parentheses are standard errors corrected for heteroskedasticity. N = 150 state-years. *p < .05 ** < .01 *** < .001 (one-tailed tests; two-tailed tests for region and year variables)
When the same ineffective measures of so- cial disorganization or crime were entered in models (not shown) that include both politi- cal and threat variables, the theoretical im- plications persist, and these disorganization indicators remain nonsignificant. It is impor- tant that chi-square tests for combined ef- fects show that the period dummy variables
always are statistically significant. Such re- sults show that there is sufficient over-time variation in the dependent variable to con- duct pooled time-series cross-sectional analyses. 12
12 These panel findings hold if the percentage divorced, the percentage of state residents aged
This content downloaded from 132.239.1.230 on Thu, 1 Jan 2015 20:37:18 PMAll use subject to JSTOR Terms and Conditions

122 AMERICAN SOCIOLOGICAL REVIEW
Table 3. Coefficients from Pooled Time-Series Complementary Log-Log and Probit Models Predicting the Presence of Death-Penalty Statutes in 1971, 1981, and 1991: Selected Threat, Socioeconomic, and Political Variables
Independent Variable Model 1 Model 2 Model 3 Model 4a
Intercept 1.814* 1.838 1.687 1.734 (.791) (1.066) (.932) (.952)
Percent black 2 state median 1.381 ** 1.760*** 1.709*** 1.570*** (.464) (.462) (.467) (.452)
Income inequality in third quartile .378* .374 .432* .402 (.213) (.240) (.201) (.278)
Income inequality in fourth quartile .938*** .938** 1.017** .961* (.294) (.326) (.331) (.429)
Percent born in state in fourth quartile -.895** -.914** -.952** -.886** (.327) (.356) (.352) (.395)
Liberalism-conservatism score -.049*** -.068*** -.067*** -.059*** (.013) (.018) (.017) (.015)
Republican governor -.137 -.141 (.190) (.229)
Percent Republicans in legislature .638** .867** .854** .726* 2 60 percent (.242) (.319) (.303) (.315)
Region South .964 .969 .897
(.564) (.562) (.553)
Northeast 1.144* 1.161 * 1.215* (.520) (.528) (.549)
West 1.272* 1.261 * 1.349* (.524) (.493) (.543)
Year 1970 .952** 1.050** 1.066** 1.156**
(.362) (.389) (.366) (.437)
1980 .213 .156 .177 .236 (.244) (.283) (.273) (.363)
Chi-square test 56.99*** 50.88*** 52.25*** 75.33***
Note: Numbers in parentheses are standard errors corrected for heteroskedasticity. N = 150 state-years. a Model 4 is estimated with pooled time-series probit.
*p < .05 p < .01 *** < .001 (one-tailed tests; two-tailed tests on region and year variables)
DURATION ANALYSES. An important ad- vantage of the period we study is the natural experiment conducted by the Supreme Count on the constitutionality of capital punish- ment that occurred in the first decade of the sample period. Recall that in 1976 the Su-
15 to 25, the four separate violent crime rates (as- sault, murder, rape, and robbery rates), on the percentage below the poverty line are included in the models. The largest correlation between any two explanatory variables in the best models (Models 3 and 4 in Table 3) is .60, and the maxi-
preme Court reversed its 1972 Furman deci- sion and let the states use the death penalty if they made significant alterations to their death-penalty statutes. Retentionist states differed in the time they took to comply, and
mum variance inflation score (VIF) is 3.06. The highest VIF score for any model is below 5 (VIF = 4.59 for Model 4 of Table 3), or the value that the most conservative statisticians use to indicate multicollinearity. The highest correlation be- tween two explanatory variables in any model is .626-between the percentage of female-headed
This content downloaded from 132.239.1.230 on Thu, 1 Jan 2015 20:37:18 PMAll use subject to JSTOR Terms and Conditions

THE POLITICAL SOCIOLOGY OF THE DEATH PENALTY 123
four death-penalty states had not altered their statutes by 1995. If the mostly cross- sectional panel results provide an accurate picture of the forces that produce a legal death penalty, similar factors should explain the time it took for states to conform to the Supreme Court's altered requirements. We employ Weibull regression to reexamine the determinants of support for capital punish- ment with this different research procedure.
We use 1970 explanatory variables, omit the states that did not have the death pen- alty, and analyze the years between the rel- evant court decisions in 1976 and state com- pliance up through 1995. The four death- penalty states that had not met the Supreme Court's requirements by 1995 are treated as censored. These analyses use specifications identical to those in the pooled time-series cross-sectional analyses except that we drop the nonsignificant Republican legislature variable and use instead the percentage of votes for the Republican presidential candi- date to assess the political strength of the law-and-order party. Nixon ran on a law- and-order platform (Beckett 1997; Edsal and Edsal 1991), so this measure should provide an equally valid indicator of the partisan- strength explanation for the legality of this punishment.
In Table 4 we again begin with a simpli- fied model and include the dummy variables that gauge the presence of blacks and eco- nomic inequality. Identical measures of po- litical ideology and regional effects, along with the new indicator of Republican strength are included in this model as well. The unemployment rates are added in Model 2. In Model 3 we drop unemployment and add the percentage of Hispanics and the mur- der rate. Model 4 includes the violent crime rate and the percentage of state residents liv- ing in large cities, but the percentage of His-
families and the violent crime rate. To see if col- linearity is masking these nonsignificant effects, we conduct a test for the joint significance of both variables, but this chi-square test is nega- tive. Such tests on other correlated but nonsig- nificant pairs of variables give the same results. The stability of the coefficients also suggests that collinearity is not present. If we increase lags by analyzing death-penalty presence two years after each census, all panel findings except Republican legislative strength persist.
panics and the murder rate are eliminated. The signs on explanatory variables should be the opposite of those in the panel analyses because a longer time to compliance with Su- preme Court requirements indicates dimin- ished support for the death penalty.
These duration findings largely duplicate the panel results. The same threshold mea- sures of black threat and economic inequal- ity explain time to compliance, and the same ideology measure again has an association in the predicted direction. The factors that are nonsignificant in the panel analyses of pres- ence of the death penalty do not explain this duration outcome, and the same four theo- retically important factors with explanatory power in Model 1 of Table 4 continue to matter after various controls are introduced in the last three models in Table 4.
The only notable contrast between the findings in the panel analyses and the dura- tion analyses concerns the way partisanship is measured. Republican legislative strength explains the presence of the death penalty in the panel analyses, but this indicator has no effect on time to compliance with the Su- preme Court's requirements. Instead, we find that public support for a law-and-order Republican presidential candidate explains this interval."3
13 In this duration analysis we ignore purely legislative changes and code only the time it took states to comply with the Supreme Court's direc- tives. We analyze 42 states because Oregon le- galized the death penalty after 1971. We use Weibull regression because it is the most appro- priate (and frequently used) estimator for such duration models (Greene 1993). The findings nevertheless persist if Model 1 is estimated with either exponential or Gompertz regression. At- tempts to use two-period means calculated on ex- planatory variables collected in 1970 and 1980 instead of data collected in 1970 failed due to col- linearity, but this problem is not present in the re- ported duration models since the maximum VIF in Model 1 is 4.15. The highest VIF is 4.94 for Model 3, a score that remains below 5. Most states responded quickly to the Supreme Court's requirements, so the lag between when the ex- planatory variables were measured and these leg- islative changes should not be problematic. Other explanatory variables included in the panel analy- ses do not predict this time-to-compliance out- come, and entering each of the control variables alone rather than in pairs does not alter these
This content downloaded from 132.239.1.230 on Thu, 1 Jan 2015 20:37:18 PMAll use subject to JSTOR Terms and Conditions

124 AMERICAN SOCIOLOGICAL REVIEW
Table 4. Coefficients from Weibull Regression Analyses Predicting the Time between New Supreme Court Requirements for a Constitutional Death Penalty and State Compliance: Selected Threat, Socioeconomic, and Political Variables
Independent Variable Model 1 Model 2 Model 3 Model 4
Intercept 2.148** 2.665** 2.125* .047 (.760) (1.017) (1.014) (2.290)
Percent black 2 state median -1.074* -1.098* -1.288** -1.490** (.578) (.550) (.490) (.438)
Percent Hispanic (In) .136 (.133)
Income inequality in fourth quartile -.474* -.435* -.468* -.394* (.240) (.256) (.252) (.232)
Percent in MSA - .001 (.010)
Liberalism-conservatism score .040** .043** .044** .041 **
(.015) (.017) (.016) (.016)
Percent voting Republican -.041 ** -.056** -.044** -.036** (.017) (.018) (.015) (.016)
Murder rate .021 (.062)
Violent crime rate (ln) .394 (.461)
Percent unemployed -.098 (.175)
Region South -.529 -.554 -.490 -.463
(.616) (.633) (.642) (.650)
North East -.559 -.613 -.677 -.659 (.990) (.993) (.895) (.883)
West -1.426** -1.329** -1.765** -1.719*** (.506) (.562) (.590) (.490)
Log-likelihood -53.18 -53.02 -52.52 -51.93
Chi-square test 41.77*** 44.56*** 43.93*** 45.71
Note: Numbers in parentheses are standard errors corrected for heteroskedasticity. Coefficients are cor- rected for unmeasured heterogeneity (or overdispersion). N = 42 states.
*p < .05 **p < .01 ***p < .001 (one-tailed tests; two-tailed tests for region variables)
The duration results eliminate a potential objection to the panel analyses. If the panel findings somehow are incorrect because they
assess contemporary factors that could not influence choices largely made in the distant past, these factors should not explain what happened when the Supreme Court forced the death-penalty states to redecide their capital punishment laws. Yet we find that the same threat and similar political hypotheses predict both the legality of the death penalty and time to compliance with the Supreme Court's demands for significant revisions to state death-penalty statutes. These similari- ties in the results from such different re- search procedures provide additional reasons
time-to-compliance results. We use the 1968 vote for Nixon because he ran
on a law-and-order platform and won by a nar- row margin in that election. The alternative Nixon victory in 1972 against McGovern was not a meaningful election because Nixon won by an extremely large margin and received votes from many people who would not have supported him if the Democrats had nominated a more viable candidate.
This content downloaded from 132.239.1.230 on Thu, 1 Jan 2015 20:37:18 PMAll use subject to JSTOR Terms and Conditions

THE POLITICAL SOCIOLOGY OF THE DEATH PENALTY 125
to think that political decisions about the le- gality of capital punishment respond to ra- cial and economic threat, conservative val- ues, and the strength of the law-and-order Republican party.
ADDITIONAL METHODOLOGICAL ISSUES.
We conducted sensitivity tests by removing, in separate panel analyses, each of the states that abolished or added the death penalty. The results persist in all eight trials (in one trial the dummy variable representing eco- nomic inequality in the third inequality quartile became nonsignificant). Correcting the standard errors for within-region inter- dependence produces only trivial changes in the results, so spatial autocorrelation prob- ably is not biasing the findings. Tests for sta- tistical interaction were negative, and we find little support for hypotheses about in- tervening effects."4 Different combinations of the variables entered in the reported mod- els also do not alter the findings.
Late 1970 state-level indicators of self- identification as a conservative or the pres- ence of religious fundamentalism derived from surveys can be used to determine if al- ternative indicators of public ideology pro- duce the same results as those reported. Equivalent pooled time-series cross-sec- tional panel models (not shown) restricted to
14 Path analysis, which is normally used to gauge indirect effects, is inappropriate in this study. Indirect effects cannot be assessed with mixed estimators by using complementary log- log estimation to assess the path to a dichoto- mous outcome like the death penalty and panel regression to estimate the paths to intervening continuous variables. Continuous indicators like ideology therefore cannot be specified as inter- vening variables. A more justifiable tactic in- volves dropping explanatory variables to see if the other coefficients increase in size. If we re- move economic inequality, the coefficient on the black dummy variable goes from 1.7 to 1.8, a 6- percent shift that is well within confidence bounds. If we remove Republican legislative strength, the coefficient on political ideology goes from .067 to .071, a 6.9-percent shift that again is within confidence bounds. Political ide- ology explains Republican legislative strength, but the total indirect relationship from ideology through Republican legislative strength to the death penalty is modest, and we find no evidence that race or economic inequality account for Re- publican strength.
the 1980 and 1990 periods indicate that the death penalty is likely to be legal in states with relatively more self-identified conser- vatives, but these findings suggest that reli- gious fundamentalism does not matter, and the other findings persist in these two-period analyses.
When we use dummy variables to assess the threshold effects suggested by theory, these specifications were tested by including both the dummy variables) and the continu- ous version of the explanatory variable in unreported analyses. Additional Akaike in- formation criterion (AIC) and Bayesian in- formation criterion (BIC) tests show that the models that use dummy specifications have stronger effects than models using explana- tory variables in continuous form."5 Such re- sults are plausible because threat explana- tions, political explanations, and prior re- search findings indicate that these relation- ships should be discontinuous. The largely equivalent duration findings that are based on the same dummy explanatory variables
15 We compared models with and without dummy codes using the AIC and BIC tests. Be- cause these tests cannot be used to compare the explanatory power of population-averaged mod- els, we estimated with a maximum likelihood complementary log-log procedure that is not cor- rected for the panel structure of the data, but we adjusted for the interdependent within-state scores (or scores for the same state at different times) with a less efficient cluster approach. All variables in the null model of these model con- trasts are in continuous form. In the second model of each pair, we substitute a variable coded using three dummy variables for the top three quartiles that represents each of the vari- ables coded with dummy variables in the re- ported analyses. In each of these contrasts, the results of the BIC and AIC tests strongly suggest that the variables in dummy form are the supe- rior specification. We repeated these tests with the collapsed dummy variables used in the re- ported models and again find the same results. Because the three regional dummy variables are not significant in this less efficient nonpanel cluster-corrected estimation procedure, we con- trol only for the South in these models. The point estimates from these analyses give us additional reasons to believe that threshold effects are present because the values of the coefficients on the dummy variables show the upward or down- ward trends that would be expected if threshold effects are present.
This content downloaded from 132.239.1.230 on Thu, 1 Jan 2015 20:37:18 PMAll use subject to JSTOR Terms and Conditions

126 AMERICAN SOCIOLOGICAL REVIEW
provide added reasons to believe that these specifications are generalizable because they account for different measures of support for capital punishment. Attempts to use dummy variables to assess the effects of the nonsig- nificant variables expressed in continuous form were not successful. Because the log transformations we use to eliminate skewed distributions do not alter the conclusions, the results do not appear to be distorted by arbi- trary coding decisions. If we adjust for the panel structure of the data in a different way, the last three panel models in Table 3 and all four event-history models in Table 4 pass the link test (Pregibon 1980) for specification error. 16
The predictive accuracy of the pooled time-series cross-sectional panel models is substantial. The best model gives 14 incor- rect predictions compared with 136 correct predictions yielding an prediction rate of 90.7 percent. The strong bivariate relation- ships, the stability of the results despite mul- tiple controls, and their persistence when subjected to multiple tests that use different specifications, estimation procedures, and research designs all suggest that these analy- ses have captured the most important state- level factors that influence political deci- sions about the legality of capital punish- ment.
CONCLUSIONS
SUMMARY AND DISCUSSION
The results corroborate threat and political explanations for jurisdictional decisions about the death penalty. As racial threat theorists like Blalock (1967) would expect, we find that states with the largest black populations are more likely to retain capital punishment after the amount of violent crime and many other explanations are held constant, but we find no evidence that His-
panic presence matters. Because we find dis- continuous effects, the racial threat results support Blalock's (1967) theoretical suppo- sitions about threshold effects. Perhaps the explanatory power of black threat compared with Hispanic threat should not be surpris- ing in light of the horrific conflicts about race that occurred throughout U.S. history.
The results provide strong support for the less prominent economic version of threat theory. We find that the death penalty is more likely to be present in jurisdictions in which economic inequality is most pro- nounced. Such findings corroborate theory- based claims (Chambliss and Seidman 1980; Garland 1990) that extreme economic differ- ences between the affluent and the poor in- crease the probability that capital punish- ment will be legal, although these economic divisions are not as visible as social divi- sions based on race. Both economic and ra- cial threat explanations for repressive mea- sures like a legal death penalty have an un- measured intervening political component. Successful demands for harsh punishments that result from these threats must be di- rected at the public officials who can change the criminal codes.
The results show that ideology helps to account for the presence or absence of capi- tal punishment. Greater public support for liberal policies leads to a reduced likelihood that the death sentence will be available to the courts. Some results suggest that juris- dictions in which the strength of the Repub- lican party in state legislatures has passed a threshold will be more likely to allow death sentences, but the party of the governor has no effect on this outcome. The latter finding is plausible. Governors decide the last ap- peal before an execution is carried out, so Republican governors have much stronger reasons to be ambivalent about the death penalty than Republican representatives who need not make the terrible final decision about an execution (Zimring and Hawkins 1986).
Republican legislative strength, however, does not account for time to compliance with the Supreme Court's revised requirements for a constitutional death penalty, but this duration outcome is explained by support for a Republican law-and-order presidential can- didate. One reason for this mild contrast con-
16 In these models, the standard errors are esti- mated by assuming that the three-period state scores are interdependent. Although this cluster correction results in estimates are less efficient than the panel estimates, the results are equiva- lent to those in Model 4 of Table 3. The link test cannot be used to test the specification of popu- lation-averaged models, so we again employ this alternative non panel estimator instead.
This content downloaded from 132.239.1.230 on Thu, 1 Jan 2015 20:37:18 PMAll use subject to JSTOR Terms and Conditions

THE POLITICAL SOCIOLOGY OF THE DEATH PENALTY 127
cerns public influence. Our findings on the delay between the Supreme Court's 1976 de- cisions and the alterations to state death-pen- alty laws suggest that this timing was influ- enced more by public support for law-and- order, but the presence of the death penalty is better explained by the partisan strength in the legislature. In any case, these comple- mentary findings are noteworthy because few results show links between politics and the punitive content of the criminal codes.
Although there is little research on the fac- tors that influence the legality of the death penalty, studies of the politics of formal so- cial control are starting to accumulate. Jacobs and Helms (1996) find that national expansions in Republican strength account for yearly increases in U.S. prison admis- sions. Cross-national results suggest that this finding has wider applicability: An increase in the strength of the most conservative po- litical parties in five advanced democracies produces growth in the proportion of the population that is incarcerated (Sutton 2000).
Evidence for threat effects seems to de- pend on how outcomes are decided. Neither riots nor expansions in minority presence explain prison admissions (Jacobs and Helms 1996), but both factors lead to in- creased spending on corrections (Jacobs and Helms 1999). These contrasts are plausible because as Garland (1990, 2001) claims and Balbus (1973) finds, decisions about impris- onment are relatively insulated from the public, in part because they are often made by appointed officials. Yet spending on cor- rections is determined by elected represen- tatives who face costs if they ignore public demands for harsh measures. The legality of the death penalty is decided by the same elected representatives. The links between race, economic inequality, and public values and the presence of the death penalty should therefore be stronger than the links between these factors and imprisonments for identi- cal reasons. In a direct democracy like the United States, elected officials who decide the legality of the death penalty must be more responsive to the public than the mostly unelected officials who control the size of prison populations.
The same distinction between political and bureaucratic-legal decision making may
provide some insight about the factors that lead to executions. For methodological rea- sons, a plausible state-level analysis of ex- ecutions is not feasible (see note 6). If this research were possible, the findings might show that forces external to governments such as threat or public sentiments do not explain executions as well as they explain the legality of capital punishment. Although governors decide the final appeal, the deci- sion to execute ultimately depends far more on the insulated workings of the legal sys- tem. After the death penalty has been legal- ized, the elected representatives in the leg- islature, who find it difficult to disregard public views, have little effect on execu- tions. In contrast to their influence on the legality of capital punishment, it is reason- able to expect that social threat and public ideology should not have such strong ef- fects on executions.
Most social disorganization hypotheses do not explain the legality of capital punish- ment, but the absence of migration is an ex- ception. The results show that jurisdictions with the most residents born in state are less likely to have the death penalty. High migra- tion rates reduce community solidarity and break interpersonal ties. The effects of this control variable probably can be attributed to hostility toward strangers (Hale 1996) and to a related disinclination to invoke the ulti- mate penalty against people who are more likely to be regarded as one's neighbors in jurisdictions with few outsiders. It is more surprising that our results offer no support for the plausible hypothesis that states with the most violent crime or murders will be more likely to retain the death penalty.
IMPLICATIONS
Investigations that employ aggregate data to investigate punitive outcomes can detect previously hidden relationships, and they can be used to link theoretical conceptual- izations about the nature of society to pun- ishment. This approach lets us use theories borrowed from core subdisciplines such as political sociology or stratification to inves- tigate the criminal sanctions administered by the state. In this study, we find evidence for three core perspectives in political sociol- ogy: Partisan tactical considerations, politi-
This content downloaded from 132.239.1.230 on Thu, 1 Jan 2015 20:37:18 PMAll use subject to JSTOR Terms and Conditions

128 AMERICAN SOCIOLOGICAL REVIEW
cal ideology, and social divisions influence political decisions about the legality of the death penalty.
As might be expected from the recent theoretical emphasis on the politics of pun- ishment and the Republican party's tactical emphasis on law and order, some findings suggest that states with strong Republican parties are more likely to legalize capital punishment. One objection to a conclusion that Republican political strength leads to harsh punishments concerns ideology. The political strength of the Republican Party may be based on preexisting conservative views that are the underlying cause of suc- cessful demands for the ultimate sanction. Yet the panel results show that sufficient Re- publican strength in state legislatures ex- plains the presence of the death penalty af- ter measures of political ideology have been held constant. Although it is difficult to make definitive comparisons about explana- tory power, particularly since both effects account for this outcome, the combined re- sults suggest that the relationships between political ideology and the presence or ab- sence of the death penalty are more robust than the associations between Republican Party strength and this sanction.
These findings begin to suggest a tentative answer to a question we posed in the intro- duction. At least in a populist direct democ- racy like the United States where social policy is less likely to be decided by unelected experts (Garland 2001; Savelsberg 1994), politicians do not seem to lead from the front when the death penalty is at issue, despite Buxton's (1974) claim. Instead, in contrast to more politically centralized Eu- ropean democracies (Savelsberg 1994), pub- lic views seem to be more influential in the United States when the death penalty is at issue. Such results suggest that those who seek increased democracy and find the death penalty to be abhorrent may be supporting policies that have contradictory implica- tions.
Social divisions that are external to the state are important as well. An economic cleavage that works through politics affects the decision to legalize the death penalty. Garland (1990) approvingly quotes Rusche ([1933] 1998) who writes, "The history of the penal system is . . . the history of rela-
tions (between) the rich and the poor" (Gar- land 1990:92). If this claim is correct, juris- dictions with the most substantial economic differences between middle- or upper-in- come groups and the least affluent should be more likely to let their courts use the ulti- mate punishment. Our findings support the economic version of threat theory because they show that capital punishment tends to be present where economic inequality is most pronounced.
But our most important results concern race. Findings that document a close rela- tionship between the presence of African Americans in a state and the presence of the death penalty may not be surprising, but they show how important the politics of racial di- vision and the racial foundations of punish- ment continue to be in the United States. Our results imply that the legality of the death penalty is not decided by colorblind politi- cal processes. The persistence of this link between race and capital punishment sug- gests that the destructive effects of the racial conflicts that have divided the United States since its inception have not yet been tran- scended, although the effects of race on pun- ishment probably are less conspicuous now than they were in the past.
More generally, findings that political fac- tors influence the legality of the death pen- alty show that the recent thrust in the theo- retical literature is correct. Such results con- firm claims by theorists that punishment re- sponds to a set of political acts that often have much to do with how majorities and their political representatives decide to man- age the threat posed by the "dangerous" classes. Another important implication con- cerns the possibilities for integrating re- search on punishment with core sociological theories. Our findings show that explana- tions borrowed from other sociological areas provide important insights about the factors that shape the ultimate punishment, at least in one advanced but still racially divided so- ciety.
David Jacobs is Professor of Sociology at Ohio State University. He uses a political economy ap- proach to explain crime control, economic strati- fication, and political outcomes. Recent orforth- coming publications include studies of the fac- tors that produce changes in the progressivity of
This content downloaded from 132.239.1.230 on Thu, 1 Jan 2015 20:37:18 PMAll use subject to JSTOR Terms and Conditions

THE POLITICAL SOCIOLOGY OF THE DEATH PENALTY 129
the tax codes, imprisonment rates, and the num- ber of felonious killings of police officers. He currently is studying the determinants of union density, criminal sentencing, and police strength.
Jason T. Carmichael is a Ph.D. student at the Ohio State University. His research focuses on crime and social control. He recently published a study on the factors associated with imprison- ment rates across states, and another on politi- cal explanations for lethal assaults against the police. His current projects include a study of the economic and social conditions associated with variations in jail use, and the factors influencing interracial homicides.
REFERENCES
Agresti, Alan. 1990. Categorical Data Analysis. New York: Wiley.
Balbus, Isaac. 1973. The Dialectics of Legal Re- pression. New York: Russell Sage.
Barkan, Steven E. and Steven F. Cohn. 1994. "Racial Prejudice and Support for the Death Penalty." Journal of Research in Crime and Delinquency 31:202-9.
Beckett, Katherine. 1997. Making Crime Pay: Law and Order in Contemporary American Politics. New York: Oxford University Press.
Berry, William D., Evan J. Ringquist, Richard C. Fording, and Russell L. Hanson. 1998. "Mea- suring Citizen and Government Ideology in the States." American Journal of Political Science 42:327-48.
Black, Donald. 1989. Sociological Justice. New York: Oxford University Press.
Blalock, Hubert M. 1967. Towards a Theory of Minority Group Relations. New York: Capri- corn.
Blank, Rebecca and Alan Blinder. 1986. "Macro- economics, Income Distribution, and Poverty." Pp. 180-208 in Fighting Poverty, edited by S. Danzinger and D. Weinberg. Cambridge, MA: Harvard University Press.
Blau, Peter. 1964. Exchange and Power in Social Life. New York: Wiley.
Blumer, Herbert. 1958. "Race Prejudice as a Sense of Group Position." Pacific Sociological Review 1:3-7.
Bobo, Lawrence and Vincent Hutchings. 1996. "Perceptions of Racial Group Competition." American Sociological Review 61:951-72.
Bowers, William J. 1984. Legal Homicide. Bos- ton, MA: Northeastern University Press.
Brillon, Yves. 1988. "Punitiveness, Status, and Ideology in Three Canadian Provinces." Pp. 84-1 10 in Public Attitudes to Sentencing, ed- ited by N. Walker and M. Hough. London, En- gland: Grover.
Burnham, James. 1970. "Notes on Authority,
Morality, Power." The National Review 123:1283-89.
Buxton, Richard. 1974. "The Politics of Criminal Law Reform: England." American Journal of Comparative Law 25:244-56.
Chambliss, William J. 1964. "A Sociological Analysis of the Law of Vagrancy." Social Problems 12:67-77.
. 1999. Power, Politics, and Crime. New York: Westview.
Chambliss, William J. and R. Seidman. 1980. Law, Order, and Power. Reading, STATE: Addison-Wesley.
Clayton, David and Michael Hills. 1993. Statisti- cal Models in Epidemiology. Oxford, England: Oxford University Press.
Constanzo, Mark. 1997. Just Revenge: The Costs and Consequences of the Death Penalty. New York: St. Martins.
Corzine, Jay, James Creech, and Lin Corzine. 1983. "Black Concentration and Lynchings in the South: Testing Blalock's Power-Threat Hypothesis." Social Forces 61:774-96.
Edsal, Thomas B. and Mary D. Edsal. 1991. Chain Reaction. New York: W. W. Norton.
Evans, Peter B., Dietrich Rueschemeyer, and Theda Skocpol. 1984. Bringing the State Back In. New York: Cambridge University Press.
Fosset, Mark A. and K. Jill Kiecolt. 1989. "The Relative Size of Minority Populations and White Racial Attitudes." Social Science Quar- terly 70:820-35.
Foucault, Michael. 1977. Discipline and Punish. London, England: Vintage.
Galliher, James M. and John F. Galliher. 1997. "'Deja Vu All Over Again': The Recurring Life and Death of Capital Punishment Legisla- tion in Kansas." Social Problems 44:369-85.
Garland, David. 1990. Punishment and Modern Society. Chicago, IL: University of Chicago Press.
.2000. "The Culture of High Crime Soci- eties." British Journal of Criminology 49:347- 75.
. 2001. The Culture of Control. Chicago, IL: University of Chicago Press.
Greene, William H. 1993. Econometric Analysis. New York: MacMillin.
Haines, Herbert H. 1996. Against Capital Pun- ishment: The Anti-Death Penalty Movement in America, 1972-1994. New York: Oxford Uni- versity Press.
Hagan, John. 1977. "Criminal Justice in Rural and Urban Communities." Social Forces 55: 597-612.
Hale, Christopher. 1996. "Fear of Crime: A Re- view of the Literature." International Review of Victimology 4:79-150.
Hibbs, Douglas. 1987. The American Political Economy. Cambridge, MA: Harvard Univer-
This content downloaded from 132.239.1.230 on Thu, 1 Jan 2015 20:37:18 PMAll use subject to JSTOR Terms and Conditions

130 AMERICAN SOCIOLOGICAL REVIEW
sity Press. Hood, Roger. 1998. "Capital Punishment." Pp.
739-76 in The Handbook of Crime and Pun- ishment, edited by M. Tonry. New York: Ox- ford University Press.
Jackson, Pamela Irving. 1989. Minority Group Threat, Crime, and Policing. New York: Praeger.
Jacobs, David. 1979. "Inequality and Police Strength: Conflict Theory and Social Control in Metropolitan Areas." American Sociological Review 44:913-25.
Jacobs, David and Jason T. Carmichael. 2001. "The Politics of Punishment Across Time and Space: A Pooled Time-Series Analysis of Im- prisonment Rates." Social Forces 80:91-121.
Jacobs, David and Ronald Helms. 1996. "Toward a Political Model of Incarceration." American Journal of Sociology 102:323-57.
. 1997. "Testing Coercive Explanations for Order: The Determinants of Law Enforce- ment Strength Over Time." Social Forces 75:1361-92.
. 1999. "Collective Outbursts, Politics, and Punitive Resources." Social Forces 77:1497- 1524.
Johnston, Jack. 1984. Econometric Methods. New York: McGraw-Hill.
Johnston, Jack and John DiNardo. 1997. Econo- metric Methods. New York: McGraw-Hill.
Koch, Larry W. and John F. Galliher. 1993. "Michigan's Continuing Abolition of the Death Penalty and the Conceptual Components of Symbolic Legislation." Social and Legal Studies 2:323-46.
Lacey, Nicola. 1988. State Punishment. London, England: Routledge.
Langworthy, Robert H. and John T. Whitehead. 1986. "Liberalism and Fear as Explanations for Punitiveness." Criminology 24:575-91.
Lakoff, George. 1996. Moral Politics. Chicago, IL: University of Chicago Press.
Liang, Kung-Yee and Scott L. Zeger. 1986. "Longitudinal Data Analysis Using General- ized Linear Models." Biometrika 73:13-22.
Liska, Allen E., Mitchell B. Chamblin, and Mark D. Reed. 1984. "Testing the Economic Produc- tion and Conflict Models of Crime Control." Social Forces 64:119-38.
Liska, Allen E., Joseph J. Lawrence, and Michael Benson. 1981. "Perspectives on the Legal Or- der." American Journal of Sociology 87:412- 26.
Liska, Allen E., Joseph J. Lawrence, and Andrew Sanchirico. 1982. "Fear of Crime as a Social Fact." Social Forces 60:760-71.
Long, J. Scott. 1997. Regression Models for Cat- egorical and Limited Dependent Variables. Thousand Oaks, CA: Sage.
Molnar, Thomas. 1976. Authority and Its En-
emies. New Rochell, NewYork: Arlington House.
Oberschall, Anthony. 1973. Social Conflict and Social Movements. Englewood Cliffs, NJ: Prentice-Hall.
Paternoster, Raymond. 1991. Capital Punishment in America. New York: Lexington Books.
Pendergast, J. F., S. J. Gauge, M. A. Newton, M. J. Lindstrom, M. Palta, and M. R. Fisher. 1996. "A Survey of Methods for Analyzing Clustered Binary Response Data." Interna- tional Statistical Review 64:89-118.
Pierce, Glen L. and Michael L. Radelet. 1990- 1991. "The Role and Consequences of the Death Penalty in American Politics." New York University Review of Law and Social Change 18:711-28.
Pregibon, Daryl. 1980. "Goodness of Link Tests for Generalized Linear Models." Applied Sta- tistics 29:15-24.
Prentice, Ross L. and Lue P. Zhao. 1991. "Esti- mating Equations for Parameters in Means and Covariances of Multivariate Discrete and Con- tinuous Responses." Biometrics 47:825-39.
Rotolo, Thomas. 2000. "A Time To Join, A Time to Quit." Social Forces 78:1133-61.
Rusche, Georg. [1933] 1998. "Labor Market and Penal Sanction." Pp. 61-71 in Crime and Po- litical Economy, edited by Ian Taylor. Brookfield, VT: Ashgate.
Reed, John Shelton. 1972. "Percent Black and Lynching." Social Forces 50:356-60.
Sampson, Robert J. 1987. "Urban Black Vio- lence." American Journal of Sociology 93: 348-82.
Sampson, Robert J. and W. Byron Groves. 1989. "Community Structure and Crime: Testing So- cial Disorganization Theory." American Jour- nal of Sociology 94:774-802.
Savelsberg, Joachim J. 1994. "Knowledge, Domi- nation, and Criminal Punishment." American Journal of Sociology 99:911-43.
StataCorp. 2000. Stata Statistical Software: Re- lease 7.0. College Station, TX: Stata Cor- poration.
Stone, Lawrence. 1987. The Past and Present Re- visited. London, England: Routledge and Kegan Paul.
Sutton, John. 2000. "Imprisonment and Social Classification in Five Common-Law Democ- racies, 1955-1985." American Journal of So- ciology 106:350-86.
Taylor, Marylee C. 1998. "How White Attitudes Vary with the Racial Composition of Local Populations." American Sociological Review 63:512-35.
Taylor, Douglas, Kim Lane Scheppele, and Arthur L. Stinchcombe. 1979. "Saliance of Crime and Support for Harsher Criminal Sanc- tions." Social Problems 46:413-24.
This content downloaded from 132.239.1.230 on Thu, 1 Jan 2015 20:37:18 PMAll use subject to JSTOR Terms and Conditions

THE POLITICAL SOCIOLOGY OF THE DEATH PENALTY 131
Taylor, Ian, Paul Walton, and Jock Young. 1973. The New Criminology. London, England: Routledge and Kegan Paul.
Thorne, Melvin J. 1990. American Conservative Thought Since World War II. New York: Greenwood.
Tyler, Tom R. and Robert J. Boeckmann. 1997. "Three Strikes and You Are Out, but Why?" Law and Society Review 31:237-65.
Van Dijk, Jan J. M. and Carl H. D. Steinmetz. 1988. "Pragmatism, Ideology, and Crime Con-
trol." Pp. 149-59 in Public Attitudes to Sen- tencing, edited by N. Walker and M. Hough. London, England: Grover.
White, Halbert. 1980. "A Heteroscedasticity- Consistent Covariance Matrix and a Direct Test for Heteroscedasticity." Econometrica 48:817-38.
Zimring, Franklin E. and Gordon Hawkins. 1986. Capital Punishment and The American Agenda. New York: Cambridge University Press.
This content downloaded from 132.239.1.230 on Thu, 1 Jan 2015 20:37:18 PMAll use subject to JSTOR Terms and Conditions