the pond biodiversity index “ibem” - ddd.uab.cat · we produced such a tool for small lowland...
TRANSCRIPT

Limnetica, 29 (1): x-xx (2008)Limnetica, 29 (1): 93-104 (2010)c© Asociacion Iberica de Limnolog�a, Madrid. Spain. ISSN: 0213-8409
The pond biodiversity index “IBEM”: a new tool for the rapidassessment of biodiversity in ponds from Switzerland.Part 1. Index development
Sandrine Angelibert, Veronique Rosset, Nicola Indermuehle & Beat Oertli∗
hepia Geneva, University of Applied Sciences Western Switzerland, technology, architecture, landscape.CH-1254 Jussy-Geneva, Switzerland.2
∗ Corresponding author: [email protected]
Received: 12/12/08 Accepted: 30/6/09
ABSTRACT
The pond biodiversity index “IBEM”: a new tool for the rapid assessment of biodiversity in ponds from Switzerland.Part 1. Index development
Due to legal requirements, nature managers increasingly have to carry out assessments of biodiversity for conservation purpo-ses. For ponds, a type of waterbody now widely recognized as an important reservoir for freshwater biodiversity, standardizedbioassessment methods are needed, but still rare. We produced such a tool for small lowland waterbodies in Switzerland: thePond Biodiversity Index (“IBEM”). This Index is the adaptation of a method used by researchers for assessing the biodiver-sity in ponds, PLOCH, which does not currently meet the requirements for routine use by nature managers because it is tooexpensive and requires a high skill level in taxonomic identi�cation. A method intended for practitioners has to be simple,standardized, cheap, adjustable, and consistent with the legislative framework. In order to ful�ll these requirements, the theo-retical and practical aspects of IBEM were developed with a group of representative end users including nature conservationmanagers, consultants, governmental organizations and taxonomic experts. To develop the method, we used a species datasetfrom 63 Swiss lowland ponds which included �ve taxonomic groups: aquatic plants, aquatic Gastropoda, aquatic Coleopte-ra, adult Odonata and Amphibia. The following topics were addressed: (i) the number and type of taxonomic groups whichshould be used for producing the index (is it possible to use surrogates?) (ii) the level of identi�cation for each taxonomicgroup (species? genus? family?) (iii) the sampling strategy (sampling technique, number of replicates), (iv) the calculation ofa unique index and the strategy for assessing its score, and (v) the transfer of this new method to end users. The new methodIBEM uses all �ve taxonomic groups, because a subset of groups did not produce reliable assessments of pond biodiversity.Identi�cation to genus level is required for four groups (aquatic plants, aquatic Gastropoda, aquatic Coleoptera, adult Odona-ta) and species level for Amphibia. The sampling methodology is based on the strati�ed random strategy used in the PLOCHmethod, but with a slight modi�cation in the number of samples per pond. The assessment follows the methodology adoptedby the European Water Framework Directive, and the ratio of the observed richness to a reference-based predicted richnessis translated into one of �ve quality categories for each pond. The �nal index is the mean of the �ve assessment scores. Tofacilitate the implementation of the IBEM method, a website (http://campus.hesge.ch/ibem) enables online calculation of theindex, and provides instructions on both sampling and assessment methodologies. Furthermore, training courses are organizedby the authors of the method for end users.
Key words: Bioassessment, monitoring, small waterbodies, nature conservation, practitioners, macroinvertebrates, aquaticplants, amphibians.
RESUMEN
El �ndice de biodiversidad “IBEM”: una nueva herramienta para evaluar la biodiversidad de charcas en Suiza. Parte I.Desarrollo del �ndice
Debido a requerimientos legales, es cada vez mas necesario que los gestores del medio ambiente lleven a cabo evaluacionesde la biodiversidad dirigidas a la conservacion de la naturaleza. Para las charcas, pequenas masas de agua ampliamente re-conocidas como importantes reservorios de diversidad biologica acuatica, los metodos normalizados de bio-evaluacion son

94 Angelibert et al.
necesarios, pero aun escasos. Para esta tipolog�a de pequenas masas de agua situadas a baja altitud en Suiza se ha elaboradoel �ndice de Biodiversidad de charcas (“IBEM”). Este �ndice es la adaptacion de un metodo utilizado por los investigadorespara evaluar la diversidad biologica en charcas, PLOCH, que no cumpl�a los requisitos para un uso rutinario por parte delos gestores del medio natural por ser demasiado caro y requerir un alto nivel de experiencia en la identi�cacion taxonomica.Un metodo destinado a estos profesionales tiene que ser sencillo, estandarizado, economico, ajustable y en consonancia conel marco legislativo. Con el �n de cumplir estos requisitos, los aspectos teoricos y practicos de IBEM se han desarrolladocon un grupo representativo de posibles usuarios, incluyendo gestores conservadores, consultores, organizaciones guber-namentales y expertos en taxonom�a. Para desarrollar el metodo, se ha utilizado una base de datos de 63 charcas Suizas,situadas en altitudes bajas, que incluye cinco grupos taxonomicos: plantas acuaticas, gasteropodos acuaticos, coleopterosacuaticos, odonatos adultos y an�bios. Se han estudiado los siguientes aspectos: (i) el numero y tipo de grupos taxonomicosque se deben utilizar (es posible el uso de sustitutos?) (ii) nivel de identi�cacion para cada grupo taxonomico (¿especie,genero, familia?) (iii) estrategia de muestreo (tecnica, numero de replicas), (iv) calculo de un �ndice unico y procedimientopara la asignacion de valores y (v) la transferencia de este metodo a los posibles usuarios. El nuevo metodo IBEM utilizalos cinco grupos taxonomicos, ya que un subconjunto de ellos no producir�a evaluaciones �ables de la diversidad biologicade la charca. La identi�cacion a nivel de genero es necesaria para cuatro de estos grupos (plantas acuaticas, gasteropodosacuaticos, coleopteros acuaticos, y odonatos adultos) y para los an�bios es necesario el nivel de especie. El muestreo sigueun diseno aleatorio estrati�cado, utilizado en el metodo PLOCH, pero con una ligera modi�cacion en el numero de muestraspor charca. La evaluacion sigue la metodolog�a adoptada por la Directiva Marco de Aguas, y la relacion entre la riquezaobservada y la del estado de referencia se traduce en una de las cinco categor�as de calidad para cada charca. El �ndice�nal es la media de las cinco puntuaciones de la evaluacion. Para facilitar la aplicacion del metodo IBEM, un sitio web(http://campus.hesge.ch/ibem) permite calculo del �ndice a traves de la red y proporciona instrucciones tanto de las metodo-log�as de muestreo como de la valoracion. Ademas, los autores han organizado cursos de formacion sobre el metodo para losusuarios.
Palabras clave: Indices bioticos, indicadores biologicos, pequenas masas de agua, conservacion de la naturaleza, medioam-bientalistas, macroinvertebrados, plantas acuaticas, an�bios.
INTRODUCTION
Ponds contribute in a unique way to aquatic bio-diversity, supporting as many species as riversor lakes, including many that are rare or threa-tened (Williams et al. 2004, Grillas et al. 2004,Nicolet et al. 2004, Oertli et al. 2004, Angeli-bert et al. 2006). In order to assess and monitorthese freshwater ecosystems, conservation plan-ners and nature managers need to have tools toeasily and rapidly evaluate the biological qua-lity of these aquatic habitats. These rapid biodi-versity assessment tools should be standardized,cheap and consistent with the legislative frame-work. However, such tools are still rare for ponds.Existing methods (e.g. Biggs et al., 2000; Ger-nes & Helgen, 2002; Boix et al., 2005; Chova-nec et al., 2005; Oertli et al., 2005; Solimini etal., 2008; Trigal et al., 2009; Menetrey Perro-tet, 2009) all have features hindering their use bypractitioners from Switzerland. For example, so-me methods apply only to a restricted geographi-cal region, others are too expensive, and many re-
quire a high level of skills in taxonomic identi�-cation (Indermuehle et al., 2004; Sandoz, 2006).In addition, in the absence of simple methodsto assess still waters, managers tend to misusemethods designed for running waters.
The Swiss-based pond biodiversity indexIBEM (from the French Indice de Biodiversi-te des Etangs et Mares) was developed to �ll thisgap. Following suggestions made by Green et al.(2005) to improve biodiversity monitoring, thedevelopment process relied strongly on consul-tations with stakeholders and took into accountthe needs of end users. According to these re-quirements, the new tool had to be: (i) simple interms of sampling and data processing, (ii) stan-dardized, (iii) adjustable, (iv) cheap and (v) euro-compatible. IBEM is based on a method for as-sessing the biodiversity in ponds originally usedby researchers: the PLOCH method (Oertli etal., 2005). PLOCH relies on the species richnessof �ve taxonomic groups: aquatic plants, aqua-tic Gastropoda, aquatic Coleoptera, adult Odona-ta and Amphibia. The choice of these indicator

The IBEM-Index: index development 95
groups has been discussed by Oertli et al. (2005)and supported by further studies (Auderset Jo-ye et al., 2004; Menetrey et al., 2005, 2008).To summarize, the �ve taxonomic groups (aqua-tic plants, aquatic Gastropoda, aquatic Coleop-tera, adult Odonata and Amphibia) ful�ll mostindicator-criteria stated by New (1995) and areecologically complementary with respect to theirlife cycle, their position in the food web, their ha-bitat preferences and their ways of dispersal (forfurther reading on the use of Odonata in bio-diversity assessments, see also Cordoba-Aguilar(2008)). The PLOCH method is relatively expen-sive to use (sampling, sorting and identi�cationtime) and requires species level taxonomic iden-ti�cation skills, and is therefore not suitable foruse by pond conservation practitioners.
A group of experts were consulted throughoutthe development of the IBEM-Index. This groupwas composed of �ve future end users and se-ven taxonomic specialists who were involved inall major decision making. In parallel, �ve teamsof nature conservation managers (three environ-mental consultant teams and two nature reservemanagement groups) tested both the practical andtheoretical aspects of the IBEM method. Theyassessed the method’s strengths and weaknesses,and identi�ed the key issues to be resolved beforesuccessful implementation. Three academic the-ses (Lezat 2006; Sandoz 2006; Frey 2007) were
Figure 1. Distribution of the 63 sampled lowland ponds (cir-cles) in Switzerland with location of the four 4 test ponds (blackcircles). Distribucion de las 63 charcas muestreadas en Suiza(c�rculos) con la localizacion de las 4 charcas de prueba (c�rcu-los negros).
furthermore carried out within the framework ofthe IBEM development. Cross-taxon and within-taxon surrogacies for the �ve taxonomic groupswere also explored using an existing, compatibledataset of 63 ponds. The aim was to determine(i) whether all or a subset of those groups weremandatory for a reliable biodiversity assessment,and (ii) whether a higher taxa approach could beimplemented, i.e. if species level identi�cationcould be replaced by genus or even family levelidenti�cation. The sampling and assessment me-thodologies were then adapted with respect to thechosen taxonomic level. Finally, strategies weredrawn up to implement this new method and ma-ke it easily available to end users.
METHODS
Study sites and practitioner teams
Testing of the method by practitioners was ca-rried out by �ve teams of nature managers: theenvironmental consultants GREN (Geneva, GE),AMaibach Sarl (Oron-la-Ville, VD), NATURA(Les Reussilles, JU) and two nature reserve ma-nagement groups (“Groupe d’Etude et de Ges-tion de la Grande-Caricaie” GEG (Yverdon-les-Bains, VD), and “Fondation des Grangettes/Musee Cantonal de Zoologie de Lausanne” (Lau-sanne, VD)). They applied the PLOCH method(detailed methodology described in Oertli et al.,2005) to assess the biological quality of fourponds located in different regions of WesternSwitzerland (La Grande Caricaie FR, Les Gran-gettes VD, Rouelbeau GE, La Combe TabeillonJU, Fig. 1). These ponds were sampled during2005 or 2006. Experts in the taxonomy and eco-logy of the selected taxonomic groups took partin workshops to provide additional support for thedevelopment of the method: P. Prunier, R. Jugeand J.-B. Lachavanne (aquatic plants), P. Stucki(Gastropoda), G. Carron (Coleoptera), A. Maibach(Odonata) and S. Zumbach/KARCH (Amphibia).
For the development of the IBEM-Index, a da-taset of 63 Swiss lowland ponds (Fig. 1) with analtitudinal range of 305 to 967 m.a.s.l. was used,constituting a subset of the data collected during

96 Angelibert et al.
the PLOCH project (Oertli et al., 2000; 2002)by the Laboratory of Aquatic Ecology and Bio-logy (LEBA) of the University of Geneva. Themain pond characteristics are given in Appendix1. Sampling of biodiversity (aquatic plants, aqua-tic Gastropoda, aquatic Coleoptera, adult Odona-ta and Amphibia) and measurements of around100 environmental variables were carried out fo-llowing standardized procedures (detailed infor-mation in Oertli et al., 2005).
Developing the IBEM-Index
How many taxonomic groups are required for anaccurate assessment?
In order to investigate if one or more taxonomicgroups can be discarded from the �ve sampledgroups without losing accuracy in the global as-sessment (cross-taxon surrogacy), we measuredthe PLOCH quality class (bad, poor, modera-te, good and high) for 63 lowland ponds, basedon species level data (i) for all �ve taxonomicgroups, and (ii) for all the possible combina-tions using less than �ve groups (n = 30 com-binations). The performance of these 30 combi-nations was then assessed by the percentage ofponds remaining in the same quality class asthat produced by considering all �ve taxonomicgroups (e.g.% of correctly classi�ed ponds).
Choice of taxonomic resolution: species, genusor family?
Species level identi�cation is a time consumingand hence expensive task that requires high ta-xonomic skills often lacking in end users (en-vironmental consultants and other nature mana-gers). For this reason we investigated if speciesrichness could be replaced by genus or even fa-mily richness without losing the relevance of theindex for 63 lowland ponds. This within-taxoninvestigation on surrogacy was carried out intwo steps. Firstly, we tested within-taxon corre-lations, between species, genus or family rich-ness. True richness was calculated by sample-based Jackknife-1 (Burnham & Overton, 1979)estimation for vegetation, Gastropoda and Co-
leoptera. True Odonata richness was estimated byabundance-based Chao-I (Chao, 1984), as the mi-nimal number of replicates (samples) requestedby Jackknife-1 was not available for this group.Jackknife-1 and Chao-1 are both non-parametricestimators, which assess true species richness re-lying on the observed richness measured in the�eld; the use of such true richness estimators re-duces bias linked to heterogeneous sampling ef-fort due to non-exhaustive sampling. The true ri-chness was estimated at all the taxonomic levels(i.e. species, genus and family). A good surroga-te (genus or family richness) should have a goodcorrelation with species richness. The identi�ca-tion levels presenting a low correlation (r2 va-lues below 0.75) were therefore discarded fromfurther analysis. Secondly, the accuracy of theremaining potential surrogates was evaluated bytheir ability to correctly assess pond biodiver-sity. This was done by comparing the real qualityclass of 63 lowland ponds (PLOCH species le-vel assessment) with the quality classes obtainedwith combinations of the different identi�cationlevel (species, genus, family). The performanceof the combinations was evaluated by the percen-tage of the 63 ponds remaining in the same qua-lity class as that produced by considering identi-�cation at the species level for the 5 taxonomicgroups (e.g.% of correctly classi�ed ponds).
Number of samples
The aim of sampling is to gather the observed ta-xonomic richness (Sobs) reaching at least 70% oftrue pond richness (Strue). This level is suf�cientfor subsequently estimating the true richness withrichness estimators. The number of samples (ve-getation plots or macroinvertebrate sweep netsamples) to be collected was assessed with datafrom 63 Swiss lowland ponds. By means of Es-timateS software (Colwell, 2005), 63 accumula-tion curves of Sobs were drawn and Strue was com-putedby thenon-parametric Jackknife-1 estimator(Burnham & Overton, 1979) to compensate forthe bias of a non-exhaustive sampling. This da-ta was then used to estimate the mean number ofsamples necessary to gather at least 70% of Strue(i.e. PLOCH method, Oertli et al., 2005).

The IBEM-Index: index development 97
Prediction of reference conditions
Biodiversity was assessed by calculating the ra-tio between the observed condition and an unim-paired reference condition. This ratio allowed theclassi�cation of the pond into one of �ve qua-lity classes: bad, poor, moderate, good and high(e.g. the methodology presented in theWFD (EC,2000)). As the -Index is based on taxonomic ri-chness, reference conditions stand for conditionsenabling high potential richness. We predict-ed these reference conditions with GeneralizedAdditive Models (GAMs; Hastie & Tibshirani,1990; Lehmann et al., 2002) built on the rela-tionship between environmental variables and ta-xonomic richness of the �ve indicator groups.Statistical details on the GAM-procedure usedare described by Oertli et al. (2005).
RESULTS
Test of the method by practitioners
The �ve teams of practitioners (environmen-tal consultants and nature reserve managementgroups) all endorsed the concept of a standar-dized sampling approach. They highlighted theusefulness of the rapid assessment index andits euro-compatibility (according to the WFDmethodology). However, two speci�c questionswere raised concerning the proposed taxonomicidenti�cation level (species level) and the num-ber of taxonomic groups to be sampled (�ve). Isspecies identi�cation compulsory for all the bio-logical groups or could genus or even family leveldata do? Could one group (or several groups) beleft aside, depending on the skills of the staff in-volved in the assessment of a given pond? Theseissues were taken into account and tested duringthe further development of the index (see below).Additional questions concerned the fieldworkmethodology, for example the sampling periods tobe chosen or the strategy for sample distribution.These remarks led tomethodological changes in thenewmethod (see Indermuehle et al., 2009).
Furthermore, cost reduction was a central is-sue raised by practitioners during this prelimi-nary test stage. Is it possible to enhance the me-
thod’s cost-effectiveness without affecting thequality of the results? An effort was therefore ma-de to reduce the time necessary for a completepond biological assessment.
Training opportunities were another concernof the practitioners. Above all, they wanted to im-prove �eldwork standardisation (sampling tech-nique and methodology), but also develop theirtaxonomic identi�cation skills.
It was therefore decided to implement an on-line support system, with the objective of impro-ving the use of the index. This interactive website(http://campus.hesge.ch/ibem) contains documents,illustrations and video tutorials, as well as anonline index calculator. Training courses, targe-ted at nature reserve managers and consultantsare also part of the strategy to facilitate imple-mentation of the method in Switzerland.
Developing the index
Cross-taxon investigation: how many taxonomicgroups?
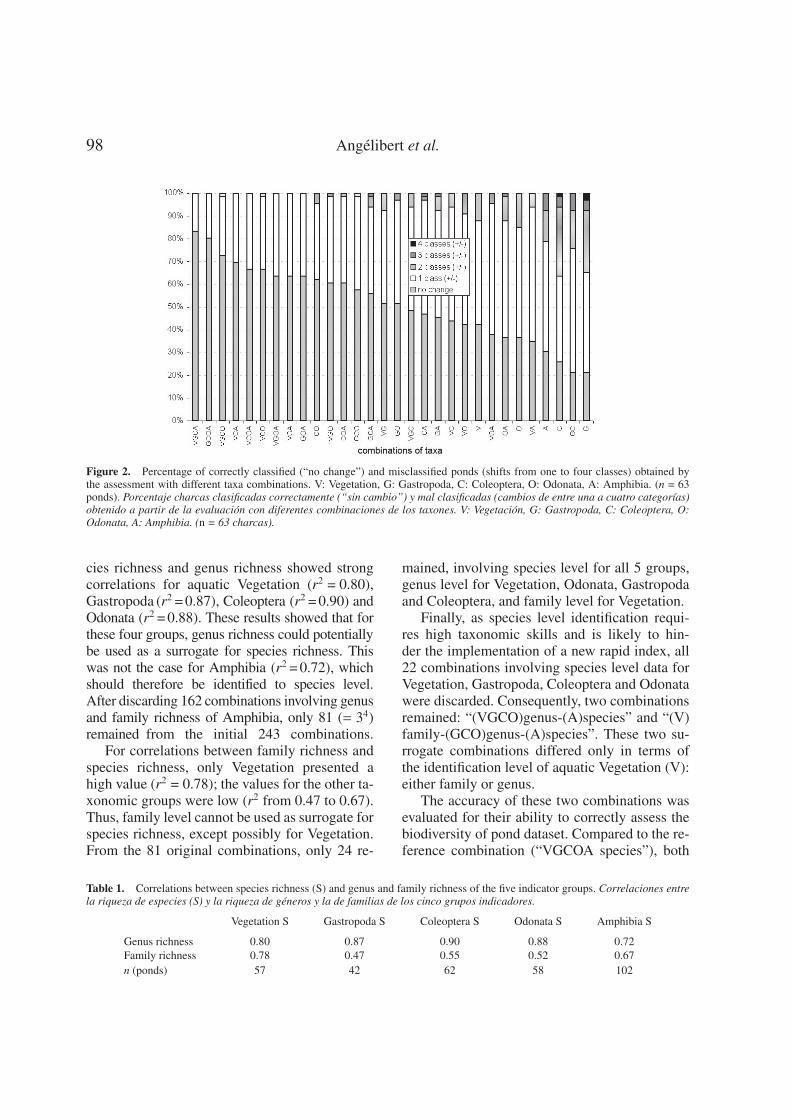
The cross-taxon surrogacy test (with species leveldata) (Fig. 2) showed that the four taxa combi-nation VGCA performed best when compared tothe reference combination (VGCOA, for: Vegeta-tion, Gastropoda, Coleoptera, Odonata, Amphi-bia) with 83% of the ponds correctly classi�edand 17% with only a one-class shift. GCOA per-formed second best (80% of the ponds correctlyclassi�ed), followed by VGCO (73%) and VCA(70%). All single taxa performed badly, with lessthan 45% of the ponds correctly classi�ed.
In conclusion, at least four taxonomic groupswould have to be retained for a reliable assessment,either with the combination VGCA (i.e. withoutOdonata) or GCOA (i.e. without aquatic Vegetation).
Within-taxon investigation: species, genus or fa-mily level?
A total of 243 (= 35) potential combinations wereavailable for this within-taxon investigation, de-pending on the identi�cation level (species, ge-nus or family) of the �ve taxonomic groups.
The �rst step was to test correlations betweenspecies, genus or family richness (Table 1). Spe-
98 Angelibert et al.
Figure 2. Percentage of correctly classi�ed (“no change”) and misclassi�ed ponds (shifts from one to four classes) obtained bythe assessment with different taxa combinations. V: Vegetation, G: Gastropoda, C: Coleoptera, O: Odonata, A: Amphibia. (n = 63ponds). Porcentaje charcas clasi�cadas correctamente (“sin cambio”) y mal clasi�cadas (cambios de entre una a cuatro categor�as)obtenido a partir de la evaluacion con diferentes combinaciones de los taxones. V: Vegetacion, G: Gastropoda, C: Coleoptera, O:Odonata, A: Amphibia. (n = 63 charcas).
cies richness and genus richness showed strongcorrelations for aquatic Vegetation (r2 = 0.80),Gastropoda (r2 =0.87), Coleoptera (r2 =0.90) andOdonata (r2 =0.88). These results showed that forthese four groups, genus richness could potentiallybe used as a surrogate for species richness. Thiswas not the case for Amphibia (r2 =0.72), whichshould therefore be identified to species level.After discarding 162 combinations involving genusand family richness of Amphibia, only 81 (= 34)remained from the initial 243 combinations.
For correlations between family richness andspecies richness, only Vegetation presented ahigh value (r2 = 0.78); the values for the other ta-xonomic groups were low (r2 from 0.47 to 0.67).Thus, family level cannot be used as surrogate forspecies richness, except possibly for Vegetation.From the 81 original combinations, only 24 re-
mained, involving species level for all 5 groups,genus level for Vegetation, Odonata, Gastropodaand Coleoptera, and family level for Vegetation.
Finally, as species level identi�cation requi-res high taxonomic skills and is likely to hin-der the implementation of a new rapid index, all22 combinations involving species level data forVegetation, Gastropoda, Coleoptera and Odonatawere discarded. Consequently, two combinationsremained: “(VGCO)genus-(A)species” and “(V)family-(GCO)genus-(A)species”. These two su-rrogate combinations differed only in terms ofthe identi�cation level of aquatic Vegetation (V):either family or genus.
The accuracy of these two combinations wasevaluated for their ability to correctly assess thebiodiversity of pond dataset. Compared to the re-ference combination (“VGCOA species”), both
Table 1. Correlations between species richness (S) and genus and family richness of the �ve indicator groups. Correlaciones entrela riqueza de especies (S) y la riqueza de generos y la de familias de los cinco grupos indicadores.
Vegetation S Gastropoda S Coleoptera S Odonata S Amphibia S
Genus richness 0.80 0.87 0.90 0.88 0.72Family richness 0.78 0.47 0.55 0.52 0.67n (ponds) 57 42 62 58 102

The IBEM-Index: index development 99
Table 2. Percentage of correctly classi�ed ponds for sevendifferent indices. V: Vegetation, G: Gastropoda, C: Coleoptera,O: Odonata, A: Amphibia. Porcentaje de charcas correctamen-te clasi�cadas para siete �ndices diferentes. V: Vegetacion, G:Gasteropodos, C: Coleopteros, O: Odonatos, A : An�bios
Index% of correctlyclassi�ed ponds
(VGCO)genus-(A)species 88%(VGCA)species 83%(V)family-(GCO)genus-(A)species 82%(GCOA) species 79%(VGC)genus-(A)species 72%(GCO)genus-(A)species 72%(V)family-(GC)genus-(A)species 65%
combinations produced satisfying results. The“(VGCO)genus-(A)species” combination perfor-med best, with 88% of the ponds correctly clas-si�ed compared to 82% for the “(V)family-(GCO)genus-(A)species” combination. In both ca-ses, pondsmisclassi�ed only shifted one category.
Taking into account both the cross-taxon and thewithin-taxon investigations
Based on the two previous tests, which inclu-ded discarding some groups and changing thetaxonomic identification level, seven combinations
were considered for the most relevant index(Table 2): “(VGCO)genus-(A)species” and “(V)fa-mily-(GCO)genus-(A)species” (i.e. the two bestcombinations based on all �ve indicator groups),and 5 combinations involving only four indica-tor groups at different taxonomic levels (see pre-vious sections). The combination “(VGCO)ge-nus-(A)species” performed better than the otherindices, with respect to the percentage of co-rrectly classi�ed ponds (88%, Table 2). The se-cond best option was “(VGCA) species”, but thiscombination was discarded because it was basedon species level data and was therefore less sui-table for a rapid index. The combination “(V)fa-mily-(GCO)genus-(A)species” was second equalin effectiveness, but was discounted as it reliedon family level data for Vegetation. Family le-vel identi�cation for plants is likely to be lessintuitive and therefore more time consuming forgeneralists used to genus level identi�cation. Itwas deemed important for the development ofthe Index to �nd a reasonable trade off betweenease of use (e.g. genus level identi�cation) andrelevance for biological assessment; and conse-quently combinations which classi�ed less than80% of sites correctly were considered inadequa-te as indices. For these reasons, the combination
(a) (b)
Figure 3. Mean number of samples necessary to gather at least 70% of Strue as a function of pond area. (a) Aquatic vegetation.Equation of the relationship: n= 30 – 29.1 ∗ log10 (area) + 8.6 * (log10 (area))2. (b) Macroinvertebrates (Coleoptera and Gastropoda).Equation of the relationship: n= 15.5 – 10.5 ∗ log10 (area) + 2.7 * (log10 (area))2. Numero medio de muestras necesarias para obteneral menos el 70% del Strue en funcion del area de la charca. (a) Vegetacion acuatica, ecuacion de la funcion: n= 30 – 29.1 ∗ log10(area) + 8.6 * (log10 (area))2. (b) Macroinvertebrados (Coleoptera y Gastropoda), ecuacion de la funcion: n= 15.5 – 10.5 ∗ log10(area) + 2.7 * (log10 (area))2.

100 Angelibert et al.
“(VGCO)genus-(A)species” was ultimately cho-sen for the IBEM-Index.
Number of samples
The genus accumulation curves of vegetation andmacroinvertebrates (Gastropoda and Coleoptera)(Sobs) and the associated curves of Strue were com-puted for 63 ponds. This was then used to estima-te the mean number of samples required to reach70% of Strue, in relation to the surface area ofeach of the 63 ponds. These results were used toproduce the relationship between pond area andthe number of samples to be collected (Fig. 3).
Prediction of reference conditions
In order to de�ne the reference conditions andassess the taxonomic richness of the �ve indi-cator groups, �ve predictive models were produ-ced. The relation between environmental varia-bles and the richness of the �ve taxonomic groupswas modelled with GAMs. Out of more than 100local and regional environmental variables, a sub-
set of 15 was selected as potential predictors forthe stepwise selection within the GAM procedu-re. GAMs integrated 12 of these variables, withfour to �ve predictors for each model (Table 3).Area represented the most important contributionto all models, except for Coleoptera, with a con-tribution between 0.63 and 0.93. The other pre-dictors were mean depth, shoreline development,percentage of pond surface shaded by trees, per-centage of woodland in the pond’s surrounding(in a 50-m buffer zone), altitude, �sh presen-ce, proportion of pond area covered by �oating-leaved or submerged vegetation, water conducti-vity, turbidity, and nutrient concentration (trophicstate). Three variables were not integrated in the�ve GAMs: pond connectivity (a measure of iso-lation from other waterbodies), percentage ofagriculture in the catchment area, and pond age.
These �ve models were used to predict re-ference conditions, i.e. highest possible richnessfor each type of pond. For predicting these �-ve richness values for a given pond, 6 of the 12variables, describing the pond typology, have tobe measured in the �eld: pond area, mean depth,
Table 3. Selected predictors and validation diagnostic of the �ve GAM models for aquatic Vegetation, Gastropoda, Coleoptera,Odonata and Amphibia. The range of measured values is presented in Appendix 1. The models were evaluated using percentageof explained deviance (%D), simple variation coef�cient (r1), and cross-validation coef�cient (r2). All models were selected withthreshold p < 0.05. Predictores seleccionados y diagnostico de validacion de los cinco modelos GAM para vegetacion acuatica,gasteropodos, coleopteros, odonatos y an�bios. El rango de valores medidos se presenta en el apendice 1. Los modelos fueronevaluados utilizando el porcentaje de desviacion explicada (% D), el coe�ciente de variacion (r1), y el coe�ciente de validacioncruzada (r2). Todos los modelos fueron seleccionados con p < 0.05.
Area#
Meandepth#
SI#
Shade#
Woodland#
Altitude#
Fish
Floatingveget.
Subm
.veget.
Conductivity
Transparency
PNC
%D
r 1 r 2
Vegetation 0.63 0.57 0.35 0.73 0.33 0.29 0.53 0.37Gastropoda 0.93 0.82 0.59 0.39 0.68 0.37 0.61 0.43Coleoptera 0.65 0.40 0.30 0.42 0.32 0.61 0.51Odonata 0.77 0.67 0.36 0.22 0.62 0.80 0.73Amphibia 0.78 0.66 0.32 0.34 0.20 0.46 0.29
Area: log10(area); SI: shoreline index (de�ned in Appendix 1); shade: percentage of pond surface area shaded; woodland: percentage ofwoodland in a 50m radius from the pond edge; �sh: �sh presence; �oating veget: proportion of pond surface area covered by �oating-leavedvegetation; subm. veget.: proportion of pond surface area covered by submerged vegetation; PNC: trophic state (de�ned in Appendix 1).# Variables to be measured for the IBEM pond assessment.Area: log10(area); SI: desarrollo del per�metro (de�nido en el Apendice 1); shade: porcentaje de area de la charca sombreada; woodland:porcentaje de terreno forestal en un radio de 50 m desde el borde de la charca; �sh: presencia de peces; �oating veget.: proporcion de super�ciede la charca cubierta por vegetacion de hojas �otantes; subm. veget.: proporcion de super�cie de la charca cubierta por vegetacion sumergida;PNC: estado tro�co (de�nido en el Apendice 1).# Variables que deben ser medidas para la evaluacion de las charcas con el IBEM.

The IBEM-Index: index development 101
shoreline index, percentage of pond surface shaded,percentage of woodland in a 50m radius fromthe pond edge, and altitude. The other 6 variablesare potential indicators of pond degradation andare consequently not to be measured on the field:they are set to their “optimal” value, i.e. allowingthe highest possible taxonomic richness for eachtaxonomic group (see Indermuehle et al., 2009).
Cost of the implementation of the IBEM method
The investigations and tests carried out alwayskept in mind that one of the major requests ofpractitioner was low cost. Every effort was there-fore made to reduce the time necessary for a com-plete pond biological assessment. Time reductionwas achieved mainly by allowing a higher ta-xonomic identi�cation level for four taxonomicgroups (i.e. genus instead of species). Anothernoticeable gain was obtained by replacing macro-invertebrate sorting in the laboratory (Gastropodaand Coleoptera) with �eld sorting. For one sam-ple, the reduction in time is about 60% (from 120minutes to 45 minutes). Overall, the time nee-ded to calculate the IBEM-Index was reduced by50% compared to the PLOCH method (50 hoursfor a 5000 m2 waterbody, instead of 100 hours).
DISCUSSION
The IBEM-Index was developed in close colla-boration with future end users in order to meettheir needs. The overall aim was to create a sim-ple, standardized, rapid index to routinely assesspond biodiversity. By pursuing this aim, an im-portant issue arose in de�ning reasonable tradeoff between ease of use (e.g. avoiding specieslevel identi�cation), low cost, and relevance tobiological assessment. During the developmentof the index, each trade off was weighted-upin order to optimize the �nal assessment tool.For example, the combination “(VGCO)genus-(A)species” was chosen over “(VGCOA)species”even though its performance was slightly worse.Thiswas because it required lower taxonomic skills(often lacking in end users) and was less timeconsuming. As time is money, and funding for bio-
diversity assessments is generally lacking, addres-sing the cost issue was essential for a new index.
Cost reduction was one of the most importantconcerns raised by practitioners during the preli-minary test stage. Therefore, this was the focusof effort to reduce the time necessary for a com-plete pond biological assessment. Approximately50 hours are necessary to calculate the Index for a5000 m2 waterbody, including sampling and da-ta processing. Routine monitoring of biologicalquality for running water is in the same range ofcosts. For example, a half-yearly assessment of astream section with the IBGN Index (AFNOR,1992) is estimated to require the same amount oftime (i.e. 50 hrs) for one year.
Another important new feature of the IBEM-Index is its interactive online tutorial website(http://campus.hesge.ch/ibem) with online indexcalculation, developed to enhance the use of theindex. Training courses, targeted at nature reser-ve managers and consultants, are also part of thestrategy to facilitate implementation of the me-thod in Switzerland.
To summarize, the IBEM method is a tool forthe rapid assessment of the biological quality ofSwiss lowland ponds developed for practitioners(see Indermuehle et al., 2009). It produces an indexby assessing the taxonomic richness of a givenpond as an indicator of its overall biodiversity,and is therefore particularly useful for compa-ring ponds in local or regional scale assessments.The index may also, in time, be used for mo-nitoring conservation actions and policy issues.The IBEM-Index has been designed to meet thespeci�c needs of practitioners, and, as an index,constitutes a new tool for nature conservation.
ACKNOWLEDGEMENTS
The IBEM-Index was developed with supportfrom: Groupe d’Etude et de Gestion de laGrande-Caricaie (GEG), Fondation des Granget-tes, Musee Cantonal de Zoologie de Lausan-ne, Swiss Amphibian and Reptile ConservationProgramme (KARCH), University of Geneva-Laboratoire d’Ecologie et Biologie Aquatique(LEBA), Laboratoire des technologies de l’In-

102 Angelibert et al.
formation (Haute Ecole de Gestion de Geneve),Consulting of�ces AMaibach Sarl, Aquabug,Aquarius, GREN, and Natura.
The study of the Swiss ponds, which made thedevelopment of the IBEM-Index possible, wassupported by many partners: The Swiss FederalOf�ce for the Environment (FOEN), Cantons ofGeneva, Jura, Vaud and Lucerne, Research com-mission of the Swiss National Park and HES-SO// University of Applied Sciences Western Swit-zerland (RCSO RealTech). Moreover we are gra-teful for the data provided by the Swiss Bio-logical Records Center (CSCF) and the SwissFloristic Database (CRSF).
Many thanks to the following persons for theirvarious contributions: Celine Antoine, Domini-que Auderset Joye, Diana Cambin, Gilles Carron,Emmanuel Castella, Jessica Castella, Michael dela Harpe, Raphaelle Juge, Jean-Bernard Lacha-vanne, Anthony Lehmann, Simon Lezat, Natha-lie Menetrey, Jane O’Rourke, Patrice Prunier,Corinne Pulfer, Nathalie Rimann, Mirko Saam,Lionel Sager, Emilie Sandoz. Furthermore, weare grateful to Helen Keeble and Pascale Nicolet(Pond Conservation) for improving the Englishstyle of the manuscript, as well as to two anony-mous reviewers for their helpful comments.
REFERENCES
AFNOR. 1992.Determination de l’Indice BiologiqueGlobal Normalise (IBGN). NF T90-350, 9 pp.
ANGELIBERT, S., N. INDERMUEHLE, D. LU-CHIER, B. OERTLI & J. PERFETTA. 2006. Whe-re hides the aquatic biodiversity in the Canton ofGeneva (Switzerland)? Arch. Sci., 59: 225-234.
AUDERSET JOYE, D., B. OERTLI, R. JUGE & J.-B. LACHAVANNE. 2004. Evaluation ecologiquedes etangs du Bois de Jussy, Departement del’Interieur, de l’Agriculture et de l’Environnementdu Canton de Geneve (Service des forets, de la pro-tection de la nature et du paysage), University ofGeneva, Geneva. 24 pp + appendix.
BIGGS, J., P. WILLIAMS, M. WHITFIELD, G.FOX & P. NICOLET. 2000. Biological techniquesof still water quality assessment: phase 3. Me-thod development. Environment Agency, Bristol.147 pp.
BOIX, D., GASCON, S., SALA, J., MARTINOY,M., GIFRE, J. & X.D. QUINTANA. 2005. A newindex of water quality assessment in Mediterra-nean wetlands based on crustacean and insect as-semblages: the case of Catalunya (NE Iberian pe-ninsula). Aquatic Conserv: Mar. Freshw. Ecosyst.,15: 635-651.
BURNHAM, K. P. & W. S. OVERTON. 1979. Ro-bust estimation of population size when captu-re probabilities vary among animals. Ecology,60: 927-936.
CHAO, A. 1984. Nonparametric estimation of thenumber of classes in a population. ScandinavianJournal of Statistics 11: 265-270.
CHOVANEC, A., J. WARINGER, M. STRAIF, W.GRAF, W. RECKENDORFER, A.WARINGER-LOSCHENKOHL, H. WAIDBACHER & H.SCHULTZ. 2005. The Floodplain Index – a newapproach for assessing the ecological status ofriver/�oodplain-systems according to the EU Wa-ter Framework Directive. Large Rivers, 15: 169-185.
COLWELL, R. K. 2005. EstimateS: Statistical esti-mation of species richness and shared species fromsamples. Version 7.5. User’s Guide and applicationpublished at: http://purl.oclc.org/estimates.
CORDOBA-AGUILAR, A. (ed) 2008. Dragon�ies-Damsel�ies: Model Organisms for Ecological andEvolutionary Research. Oxford University Press.Oxford, UK. 304 pp.
[EC EUROPEAN COMMISSION.] 2000. DirectiveNo 2000/60/EC of the European Parliament and ofthe Council. Of�cial Journal of the European Com-munity L 327. 72 pp.
FREI, M. 2007. Erfassung von Libellen (O. Odona-ta) an stehenden Kleingewassern-ein Methoden-vergleich. Diploma thesis, University of Basel, Ba-sel. 58 pp.
GERNES, M. C. & J. C. HELGEN. 2002. Indexof Biotic Integrity (IBI) for large depressio-nal wetlands in Minnesota. Report USEPA, CD-995525-01. 59 pp + appendix.
GREEN, R. E., A. BALMFORD, P. R. CRANE, G.M. MACE, J. D. REYNOLDS & R. K. TURNER.2005. A framework for improved monitoring ofbiodiversity: Responses to the World Summit onSustainableDevelopment.Conserv.Biol., 19: 56-65.
GRILLAS, P., P. GAUTHIER, N. YAVERCOVSKI& C. PERENNOU. 2004. Mediterranean tempo-rary pools. Vol. 1, Issues relating to conservation,

The IBEM-Index: index development 103
functioning and management. Station Biologiquede La Tour du Valat, France. 119 pp.
HASTIE, T. J. & R. J. TIBSHIRANI. 1990. Genera-lized Additive Models. Chapman & Hall: London.335 pp.
INDERMUEHLE, N., B. OERTLI, N. MENETREY& L. SAGER. 2004. An overview of methods po-tentially suitable for pond biodiversity assessment.Arch. Sci., 57: 131-140.
INDERMUEHLE, N., S. ANGELIBERT, V. ROS-SET & B. OERTLI. 2010. The pond biodiversityindex IBEM: a new tool for the rapid assessmentof biodiversity in ponds from Switzerland. Part 2.Methods and examples of application. Limnetica,29: 105-120.
LEHMANN, A., J. M. OVERTON & J. R. LEATH-WICK. 2002. GRASP: generalized regressionanalysis and spatial prediction. Ecol. Model.,157: 189-207.
LEZAT, S. 2006.Biodiversite des etangs: Test de qua-lite de la methode PLOCH-2, Volet Invertebres.Bachelor Thesis, University of Applied Sciencesof Western Switzerland, Jussy, Geneva. 69 pp.
MENETREY, N., L. SAGER, B. OERTLI & J. B.LACHAVANNE. 2005. Looking for metrics to as-sess the trophic state of ponds. Macroinvertebratesand amphibians. Aquatic Conserv: Mar. Freshw.Ecosyst., 15: 653-664.
MENETREY N., B. OERTLI, M. SARTORI, A.WAGNER & J. B. LACHAVANNE. 2008. Eutro-phication: are may�ies (Ephemeroptera) good bio-indicators for ponds? Hydrobiologia, 597: 125-135.
MENETREYPERROTET,N. 2009.Elaboration d’unemethode d’evaluation de la qualite ecologiquedes petits plans d’eau basee sur les commu-nautes de macroinvertebres. Terre & Environne-ment, 83: 170 pp.
NEW, T. R. 1995. Introduction to Invertebrate Con-servation Biology. Oxford University Press. NewYork. 194 pp.
NICOLET, P., J. BIGGS, G. FOX, M. J. HODSON,C. REYNOLDS, M. WHITFIELD & P. WIL-
LIAMS. 2004. The wetland plant and macroin-vertebrate assemblages of temporary ponds in En-gland and Wales. Biol. Conserv., 120: 261-278.
OERTLI, B., D. AUDERSET JOYE, E. CASTELLA,R. JUGE & J.-B. LACHAVANNE. 2000. Diver-site biologique et typologie ecologique des etangset petits lacs de Suisse. Laboratoire d’Ecologie etde Biologie aquatique de l’Universite de Geneve etOFEFP. 434 pp.
OERTLI, B., D. AUDERSET JOYE, E. CASTELLA,R. JUGE, D. CAMBIN & J.-B. LACHAVAN-NE. 2002. Does size matter? The relationship bet-ween pond area and biodiversity. Biol. Conserv.,104: 59-70.
OERTLI, B., D. AUDERSET JOYE, N. INDER-MUEHLE, R. JUGE, J.-B. LACHAVANNE. 2004.FirstEuropeanPondWorkshop.Arch. Sci., 57: 69-72.
OERTLI, B., D. AUDERSET JOYE, E. CASTELLA,R. JUGE, A. LEHMANN & J.-B. LACHAVAN-NE. 2005. PLOCH: a standardized method for sam-pling and assessing thebiodiversity in ponds.AquaticConserv: Mar. Freshw. Ecosyst., 15: 665-679.
SOLIMINI, A., M. BAZZANTI, A. RUGGIERO &G. CARCHINI. 2008. Developing a multimetricindex of ecological integrity based on macroinver-tebrates of mountain ponds in central Italy. Hydro-biologia, 597: 109-123.
SANDOZ, E. 2006. Comparaison de deux methodesd’evaluation de la qualite biologique des etangs(PLOCH et NPS). Application a l’etang de Font(Grande Caricaie, FR), Bachelor Thesis, Univer-sity of Applied Sciences of Western Switzerland,Jussy, Geneva. 130 pp.
TRIGAL, C., GARCIA-CRIADO, F.,FERNANDEZ-ALAEZ, C., 2009. Towards a multimetric index forecological assessment of Mediterranean �atlandponds: the use of macroinvertebrates as bioindica-tors. Hydrobiologia 618: 109-123.
WILLIAMS, P., M. WHITFIELD, J. BIGGS, S.BRAY, G. FOX, P. NICOLET & D. SEAR. 2004.Comparative biodiversity of rivers, streams, dit-ches and ponds in an agricultural landscape inSouthern England. Biol. Conserv., 115: 329-341.

104 Angelibert et al.
Appendix 1. Mean values and ranges of 12 variables characterizing 63 ponds. Valores medios y rangos de las 12 variables utilizadaspara la caracterizacion de las 63 charcas.
Variable Unit Mean Minimum Maximum Median
area m2 7939 66 58064 3100mean depth cm 154 32 850 109shoreline index (D)a 1.5 1.0 2.6 2.0
conductivity µS cm−1 446 61 856 254transparency cm 39 4 60 50
trophic class (PNC)b class 3.33 2 4 3.67�oating-leaved vegetation % 35 0 100 49submerged vegetation % 41 0 100 52altitude m.a.s.l. 542 305 967 423pond shadec class 2.2 1 4 3.1woodland (50 m environment) % 37 0 100 50�sh (1: absence; 2: presence) class 1.65 1 2 1.83
a Shoreline index: D = L/(2 ∗ √(π ∗ S), with L = shoreline length (m), S = pond area (m2), π= 3.141b Trophic class PNC: trophic class indicated by total phosphorus, total nitrogen and conductivity: (1) oligotrophic, (2) mesotrophic,(3) eutrophic, (4) hypertrophicc Pond shade: percentage of pond surface area shaded. Four classes: (1) 0%, (2) > 0-5%, (3) > 5-25%, (4) > 25-100%a Desarrollo del per�metro: D = L/(2 ∗ √(π ∗ S), donde L = per�metro (m), S = area de la charca (m2), π= 3.141b Categor�as tro�cas PNC: categor�a tro�ca indicada por el fosforo total, nitrogeno total y conductividad (1) oligotro�co, (2) me-sotro�co, (3) eutro�co, (4) hipertro�co.c Sombreado de la charca: porcentaje de super�cie de la charca sombreada. Cuatro categor�as: (1) 0%, (2) > 0-5%, (3) > 5-25%,(4) > 25-100%

Limnetica, 29 (1): x-xx (2008)Limnetica, 29 (1): 105-120 (2010)c© Asociacion Iberica de Limnolog�a, Madrid. Spain. ISSN: 0213-8409
The pond biodiversity index “IBEM”: a new tool for the rapidassessment of biodiversity in ponds from Switzerland.Part 2. Method description and examples of application
Nicola Indermuehle, Sandrine Angelibert, Veronique Rosset & Beat Oertli∗
hepia Geneva, University of Applied Sciences Western Switzerland, technology, architecture and landscape.CH-1254 Jussy-Geneva, Switzerland.2
∗ Corresponding author: [email protected]
Received: 12/12/08 Accepted: 30/6/09
ABSTRACT
The pond biodiversity index “IBEM”: a new tool for the rapid assessment of biodiversity in ponds from Switzerland.Part 2. Method description and examples of application
Ponds are now widely recognized to contribute signi�cantly to regional freshwater biodiversity. Therefore, tools to easilyand rapidly assess biological quality speci�cally for these aquatic habitats have been increasingly requested by conservationplanners and nature managers. In close association with practitioners, we developed such a method for Switzerland; the pondbiodiversity index “IBEM”. The IBEM-Index is based on the assessment of the taxonomic richness of 5 groups: aquatic vege-tation, Gastropoda, Coleoptera, adult Odonata and Amphibia. No abundance data are necessary and genus level identi�cationis required for all groups except Amphibia (species level). The sampling methodology is a strati�ed random strategy andallows the use of richness estimators to transform the observed taxonomic richness (Sobs) into true taxonomic richness (Strue).As the IBEM assessment follows the methodology presented in the Water Framework Directive, it is based on the calculationof the ratio of true taxonomic richness (Strue) to reference-based predicted richness (Sref). Each of the �ve taxonomic groups isassessed separately and the overall biological quality of any given pond (i.e. the IBEM-Index) is the average of the �ve ratios.This score is later converted into one of �ve quality classes for each pond: bad (0 to 0.2), poor (> 0.2 to 0.4), moderate (> 0.4to 0.6), good (> 0.6 to 0.8), and high (> 0.8 to 1).In this paper, the implementation of the IBEM-Index is described in detail. The sampling methodologies are developed (forthe biodiversity and the environmental variables) as well as the assessment methodology. Finally, two examples are presen-ted in detail, for a “good” quality pond and for a “bad” quality pond. The method implementation also includes a website(http://campus.hesge.ch/ibem) which allows the online calculation of the index, and provides support for both sampling andassessment methodologies to users.The IBEM-Index is a rapid assessment method which gives an overall value of pond biodiversity in terms of taxa richnessand can be used, for example, in regional screenings or site monitoring in Switzerland. Moreover, as biodiversity is generallyrecognized as a good indicator of global ecological quality, the IBEM-Index can also be used to investigate ecosystem quality.
Key words: Bioassessment, monitoring, small waterbodies, nature conservation, case study, practitioners, macroinvertebra-tes, aquatic plants, amphibians.
RESUMEN
Indice de biodiversidad de charcas “IBEM”: una herramienta para la evaluacion rapida de la biodiversidad de charcas enSuiza. Parte 2. Descripcion del metodo y ejemplos de aplicacion
Esta ampliamente reconocido que las pequenas masas de agua (charcas) contribuyen de forma signi�cativa a la biodiversi-dad regional de las aguas dulces. Por tanto, las herramientas que de manera rapida y facil evaluen espec��camente la calidadbiologica de estos habitats acuaticos estan siendo requeridas cada vez mas por profesionales de la gestion y conservacion delmedio natural. En estrecha colaboracion con estos profesionales, se ha desarrollado un metodo de este tipo para Suiza; el�ndice de biodiversidad de charcas “IBEM”. El Indice-IBEM se basa en la evaluacion de la riqueza taxonomica de 5 grupos:vegetacion acuatica, gasteropoda, coleopteros, odonatos (adultos) y an�bios. No son necesarios datos de abundancia y se re-quiere un nivel identi�cacion de genero para todos los grupos excepto para los an�bios (nivel de especie). Se usa un muestreo

106 Indermuehle et al.
aleatorio estrati�cado que permite obtener estimadores para transformar la riqueza taxonomica observada (Sobs) en riquezataxonomica real (Strue). La evaluacion IBEM sigue la metodolog�a de la Directiva Marco del Agua, que se basa en el calculode la relacion entre la riqueza taxonomica real (Strue) y la riqueza esperable en un estado de referencia (Sref). Cada uno delos cinco grupos taxonomicos se evalua por separado y la calidad biologica de una charca determinada (Indice-IBEM) es lamedia de los cinco coe�cientes. Este resultado es posteriormente asignado a una de las cinco clases de calidad: malo (0 a0.2), de�ciente (> 0.2 a 0.4), moderado (> 0.4 a 0.6), bueno (> 0.6 to 0.8), y muy bueno (> 0.8 a 1).En este art�culo, se describe detalladamente la aplicacion del �ndice IBEM y se desarrollan las metodolog�as de mues-treo (para la biodiversidad y las variables ambientales) y de valoracion utilizadas. Por ultimo, se presentan con de-talle dos ejemplos, una charca con “buena” calidad y otra con “mala” calidad. Se incluye tambien una pagina web(http://campus.hesge.ch/ibem), que permite el calculo del �ndice a traves de internet y sirve de apoyo a los usuarios enlas metodolog�as de muestreo y de valoracion.El �ndice IBEM es un metodo de evaluacion rapida que da un valor general de la diversidad biologica de una charca enterminos de riqueza de taxones y se puede utilizar, por ejemplo, a nivel regional o en el seguimiento de una localidad, enSuiza. Ademas, como la biodiversidad es un buen indicador de la calidad ecologica global, el �ndice IBEM tambien se puedeusar para evaluar el estado del ecosistema.
Palabras clave: Indicadores biologicos, seguimiento, charcas, conservacion de la naturaleza, casos de estudio, medioam-bientalistas, macroinvertebrados, plantas acuaticas, an�bios.
INTRODUCTION
Pond ecosystems contribute signi�cantly to re-gional freshwater biodiversity (Nicolet et al.2004, Oertli et al. 2004, Williams et al. 2004, An-gelibert et al. 2006). In the last 15 years, this hasconsistently been shown in many parts of Euro-pe. As a result, tools to easily and rapidly assessthe biological quality of these aquatic habitats ha-ve been increasingly requested by conservationplanners and nature managers.
Method have previously been developed (e.g.Biggs et al., 2000; Boix et al., 2005; Chovanecet al., 2005; Oertli et al., 2005; Menetrey et al.,2008; Solimini et al., 2008), but the characteristicsof many of these (e.g. special type of ecosystems,restricted geographical use, high cost) prevent theiruse by practitioners from Switzerland. To addressthis, we developed such a method specifically for,and in association with Swiss practitioners: thepond biodiversity index “IBEM”. Throughout theprocess, a selection of representative end userssuch as nature conservation managers, consultants,governmental organizations and taxonomic expertswere consulted on the theoretical and practicalaspect of the method in order to fulfill theirrequirements. The IBEM-Index is simple, stan-
dardized, cheap, adjustable and consistent withthe relevant legislative framework (Angelibert etal. 2009). The new method, IBEM, is based onthe biodiversity of five taxonomic groups, fourof which are identified at genus (aquatic plants,aquatic Gastropoda, aquatic Coleoptera, adultOdonata), and one at species level (Amphibia).The sampling methodology is a stratified randomstrategy. The assessment follows the methodologyadopted by the European Water FrameworkDirective, and the ratio of the observed richness toa reference-based predicted richness is convertedinto one of five quality classes for each pond.The final index is the mean of the five assessmentscores. To facilitate the method implementation,a website (http://campus.hesge.ch/ibem) enablesthe calculation of the index online, and providessupport on both sampling and assessment metho-dologies to users. Full details of the developmentof IBEM have been presented in an anotherpaper (part 1, see Angelibert et al., 2009). Inthis paper (part 2), we present the implementationof the IBEM-Index, including the sampling (forbiodiversity and environmental variables) andassessment methodologies. Finally, two detailedexamples are presented, one for a “good” qualitypondandone for a “bad”quality pond.

The IBEM-Index: method description and application 107
RANGE OF APPLICATION (TYPE OFPOND –GEOGRAPHICAL AREAS)
The IBEM-Index can be used to assess pondswith a surface area of 50 m2 to 60 000 m2, anda mean depth between 30 cm and 900 cm.
The method is valid (i) in Switzerland andthe close border regions of neighbour countries(i.e. with a 100 km-wide belt), and (ii) for wa-terbodies situated in the colline or montane al-titudinal belt (300-1000 m.a.s.l.). For other geo-graphical regions (with different species pools),the sampling strategy can be adopted as it standsor easily adapted. However, a different refe-rence system based on biological data or ex-pert knowledge would have to be developedin order to predict the reference richness (Sref)used in the IBEM-Index assessment.
METHOD FOR SAMPLINGBIODIVERSITY AND MEASURINGENVIRONMENTAL VARIABLES
The IBEM-Index for sampling biodiversity hasbeen specifically adapted (see Angelibert et al.,2009) from the PLOCH assessment method (Oertliet al., 2005). The IBEM-Index is based on theassessment of the taxonomic richness of fivegroups: aquatic vegetation, Gastropoda, Coleopte-ra, adult Odonata and Amphibia. The choice ofthese indicator groups has been largely discussedby Oertli et al. (2005) and supported by furtherstudies (Auderset Joye et al., 2004; Menetrey etal. 2005, 2008; see also Cordoba-Aguilar, 2008for Odonata). For Odonata, the adult stage wasselected because identification and sampling areeasier and less expensive than for larvae or exuviae.Moreover, even though allochthonous taxa cangenerate background noisewhen recording an adultassemblage, this noise can be coped with becauseits magnitude does not prevent identification of themain trends (Oertli, 2008). Presence of adults isalso a metric indicating the quality of the environ-ment of a pond (shoreline, helophytic vegetation,buffer area) and has therefore to be considered.
No abundance data is required and taxa iden-ti�cation is to genus level for all groups except
Amphibia (species level). Exotic taxa are not ta-ken into consideration to evaluate the biodiver-sity with the IBEM-Index as they are not re-presentative of the autochtonous biodiversity ofa pond. The IBEM-Index measures the “qua-lity” (and not the functioning of the ecosys-tem) and cannot therefore include exotic spe-cies. The sampling methodology allows the useof richness estimators (Jackknife-1, Burnham &Overton, 1979) to transform the observed taxo-nomic richness (Sobs) into true taxonomic rich-ness (Strue). Finally, this true richness is com-pared to the reference richness (Sref) that wouldbe expected for reference conditions.
Aquatic vegetation
Aquatic plants are sampled once in early July,with square plots (0.5 × 0.5 m) equally distribu-ted along transects which are regularly spacedperpendicular to the longest axis of the pond(see examples in Fig. 4). Areas deeper than 3 mare not sampled. The two square plots locatedat both ends of each transect must be placed di-rectly against the shoreline, covering only the wa-ter (and not the shore). In case of �uctuatingwater level, shoreline square plots must be pla-ced at the usual pond limit. The position of aqua-tic or terrestrial plants can help to locate this li-mit. For example, Mentha aquatica or Veronicabeccabunga are usually located at the shorelinebut with their stems reaching out of the water. Ifthe pond has a dense reedbed or sedges that areimpossible to penetrate, the square plots are lo-cated in front of this area, on the open water. Thenumber of sample plots (n) in relation to pondarea is calculated as follows: n = 30 − 29.1 ∗log10(area) + 8.6 ∗ (log10(area))2 (see part 1, An-gelibert et al. 2009). This number allows enoughdata to be gathered for each pond so that observedaquatic plant richness (Sobs) reaches on average70% of true richness (Strue). In each plot, the pre-sence or absence of aquatic plant genera is recor-ded, with the help a grapnel or an aquascope asnecessary. The depth is recorded in each squareplot, and is later used to calculate the mean ponddepth (see environmental variables section). Onlyaquatic plants are recorded and these are de�ned

108 Indermuehle et al.
as one of 254 species listed in the highest humi-dity class (= 5) by Landolt (1977). This inclu-des true hydrophytes (species submerged or with�oating leaves) and many emergent plants. Tothis ‘aquatic’ species pool were added 22 specieslisted by Landolt (1977) under humidity class4: Juncus effusus, Carex canescens, Carex �a-va, Carex lepidocarpa, Carex nigra, Eleocharisacicularis, Eleocharis quinque�ora, Equisetumpalustre, Galium palustre, Agrostis stolonifera,Juncus conglomeratus, Scirpus sylvaticus, Jun-cus �liformis, Juncus in�exus, Lysimachia num-mularia, Lythrum salicaria, Lysimachia vulgaris,Mentha longifolia, Myosotis scorpioides, Ranun-culus repens, Rorippa palustris, Juncus articu-latus. The Characeae are considered as a singletaxon. In the case of “mixed” genera which in-clude both aquatic and non-aquatic species (suchas Carex sp.), the genus is considered only ifthe observed specimen belongs to an aquatic spe-cies. Exotic species are not taken into account forthe IBEM-Index (for example Elodea nuttallii).In both these instances, a specimen may requireidenti�cation to species level to be either inclu-ded or discarded in the results.
A table with aquatic genera and species takeninto account in the IBEM-Index can be down-loaded from the IBEM website (http://campus.hesge.ch/ibem/�ore.asp).
Gastropoda and Coleoptera
Aquatic Gastropoda and aquatic Coleoptera (lar-vae and adults) are sampled once in early July,with a small-framed hand-net (rectangular fra-me 14 × 10 cm, mesh size 0.5 mm). This sam-pling date was chosen as the best compromisebetween acceptable cost of the method and sa-tisfactory results. Indeed, the sampling of aquaticinvertebrates can be coupled with the samplingof aquatic vegetation. Gastropoda and Coleop-tera are present in the pond all along the year(with the exception of a few Coleoptera families).Furthermore, both adults and larvae of Coleop-tera are sampled, increasing the chance to sam-ple the Coleoptera taxa. The number of requiredsamples (n) in relation to pond area is calcula-ted as follows: n = 15.5 − 10.5 ∗ log10(area) +
2.7 ∗ (log10(area))2 (see part 1, Angelibert et al.2009). This number allows enough data to be ga-thered for each pond so that observed richness(Sobs) reaches on average 90% of true Gastro-poda richness (Strue) and 70% of true Coleopte-ra richness (Strue). Sampling is strati�ed acrossthe dominant mesohabitats. Sediments and algae(except Characeae) are not sampled because oftheir low taxonomic richness for the selected ta-xa. Mesohabitats are divided into two main ca-tegories: (i) shoreline aquatic mesohabitats, and(ii) those occurring between the shoreline (ex-cluding the shoreline itself) to a depth of 2 m(deeper zones are not sampled). Only mesoha-bitats covering more than 1% of the total me-sohabitat area are taken into account and onlythe pond area comprising the mesohabitats lis-ted in Table 1 is considered (this list is alsoavailable on the IBEM website, http://campus.hesge.ch/ibem/coleopteres.asp). Two thirds of thesamples are then allocated to the �rst mesohabi-tat category and the remaining samples are allo-cated to the second. The samples are distributedbetween the mesohabitats in proportion to the co-verage of each, with a minimum of one sampleper mesohabitat. One unit sample consists of theintensive sweeping of the net through the habitatfor 30 seconds. If one mesohabitat is composedof scattered patches, the sampling time (30 s) isdivided into shorter periods and distributed bet-ween patches (= one composite sample). If thenumber of mesohabitats is larger than the num-ber of samples, the surveyor groups together themesohabitats situated in the lowest position inTable 1 (for example: group together mesohabi-tats 3.2.1. and 3.1. (Table 1)) and then sampleseach habitat for 15 s (= one composite sample).If there is one sample to distribute and two ha-bitats have the same coverage, the user has tochoose the habitat listed in the highest positionin Table 1 (for example: hydrophytes (1) are pre-ferred to Helophytes (2); submerged plants (1.1.)are preferred to �oating leaves (1.2.); etc).
Finally, Gastropoda and Coleoptera are sor-ted in the �eld and presence/absence of gene-ra in each sample is recorded in the laboratory.Empty shells of Gastropoda are not sorted. Forinexperienced staff, additional sorting in the la-

The IBEM-Index: method description and application 109
Table 1. List of the mesohabitats taken into account for the IBEM-Index sampling method. Two thirds of the samples are allocatedto the habitats occurring at the shoreline (land-water interface) (A); one third of the samples are allocated to the habitats occurringbetween the shoreline and a depth of 2 m (B). Lista de los mesohabitats considerados en el metodo de muestreo del �ndice IBEM. Dosterceras partes de las muestras se obtienen en habitats situados en las orillas (interfaz tierra-agua) (A); un tercio de las muestras seobtiene en habitats entre la orilla y una profundidad de 2 m (B).
Mesohabitats
A. Habitats occurring at the shoreline (land-water interface)
A. 1. Small-sized helophytes (Carex sp., Eleocharis sp., ...)
A. 2. Roots
A. 3. Bare ground
A. 4. Mineral substrate
A. 5. Accumulations of CPOM (Coarse Particulate Organic Matter) (Leaf litter)
A. 6. Large-sized helophytes (Phragmites sp., Phalaris sp., Typha sp., ...)
A. 7. Other
B. Habitats occurring between the shoreline and 2 m depth (excluding the land-water interface and the sediments)
A. 1. Hydrophytes
A. 1. 1.1.1.1. Submerged with strongly dissected leaves (Myriophyllum sp., Utricularia sp., Ceratophyllum sp., Ranunculus sp. ...)
A. 1. 1.1.1.2. Submerged with thread-like leaves (Potamogeton pusillus, P. pectinatus, Zanichellia palustris)
A. 1. 1.1.2.1. Submerged with large entire leaves (Sagittaria sp., Potamogeton crispus, P. lucens, P. perfoliatus)
A. 1. 1.1.2.2. Submerged with small entire leaves (Elodea sp.)
A. 1. 1.1.3. Characeae
A. 1. 1.2.1. Floating large leaves (Water lilies, Trappa natans, Hydrocharis sp., Potamogeton natans, Polygonum amphibium, ...)
A. 1. 1.2.2. Floating small leaves (Lemna sp.)
A. 1. 1.3. Moss
A. 1. 1.4. Other hydrophytes (Menyanthes trifoliate, ...)
A. 2. Helophytes
A. 1. 2.1. Reedbed (Glyceria maxima, Phragmites australis, Phalaris sp., Typha sp.)
A. 1. 2.2. Large-sized Scirpus (Scirpus lacustris, ...)
A. 1. 2.3. Flooded sedge formations
A. 1. 2.4.1. Alisma sp., Equisetum sp., ...
A. 1. 2.4.2. Eleocharis sp., small Scirpus sp., Juncus sp.
A. 1. 2.5. Other helophytes
A. 3. Other habitats
A. 1. 3.1. Leaf litter
A. 1. 3.2.1. Loose mineral substrate (sand, gravel)
A. 1. 3.2.2. Consolidated mineral substrate (rock, stones)
A. 1. 3.3. Other
boratory is recommended. Identi�cation can bemade either in the �eld or in the lab on pre-served material. Exotic species are not taken in-to account for the IBEM-Index; consequently itcan be necessary to identify the species of a gi-ven specimen in order to discard an exotic ta-xon (for example Gyraulus parvus). The list ofGastropoda and Coleoptera genera used for theIBEM-Index is available on the IBEM website(http://campus.hesge.ch/ibem/coleopteres.asp).
Odonata
Adult Odonata are sampled twice; at the end ofspring and in mid-summer (Fig. 1). The samplingdates depend on the altitude of the studied pond.Observations are made in plots (10 m × 30 m)distributed along one third of the shore length,including all the occurring habitats (Fig. 2).
At least 3 plots must be distributed alongthe shoreline (i.e. ponds with a shoreline length

110 Indermuehle et al.
Figure 1. Late-spring (1) and mid-summer (2) sampling pe-riods for adult Odonata in relation to altitude. These periodswere identi�ed by means of phenological data on adult Odona-ta provided by the Swiss Biological Records Centre (number ofobservations per species, pooled in function of altitude and da-te). Periodos de muestreo para los odonatos adultos en relacioncon la altitud: �nal de primavera (1) y mediados de verano (2).Estos periodos se han determinado mediante datos fenologicosde odonatos adultos facilitados por el Swiss Biological RecordsCentre (numero de observaciones por especie, agrupados enfuncion de la altitud y fecha).
< 270 m are sampled along more than a third ofthe shoreline). Each plot is sampled for 10 minu-
tes. Sampling day conditions are: (i) air tempera-ture between 20 ◦ and 30 ◦C (approximately bet-ween 11h30 and 16h00), (ii) sunshine and (iii) nowind. Presence of Odonata genera is recordedin each plot using binoculars. If identi�cationis not possible with binoculars, Odonata can becaptured using a butter�y net. Strictly lotic taxa,such as Calopteryx and Cordulegaster, are not re-corded. The list of Odonata genera used for theIBEM-Index is available on the IBEM website(http://campus.hesge.ch/ibem/odonates.asp).
Amphibia
The �eld protocol follows the method by Schmidt(2004), used for the red list update in Switzer-land. Presence of amphibian species is recordedduring four visits (March, April, May and June).Each visit lasts 1 hour. The �rst visit is madeduring the night, the other three at dusk. Stan-dardised sampling conditions are mild nights,
Figure 2. Example of distribution of Odonata plots around a pond with route used by the surveyor. Ejemplo de distribucion de lasbandas de muestreo de odonatos en torno a una charca, con la ruta utilizada por el observador.

The IBEM-Index: method description and application 111
with no wind or rain. Sampling after a long pe-riod of drought must be avoided. The amphi-bians (adults, subadults, larvae) are surveyed bymeans of (i) search by �ashlight, (ii) identi�ca-tion of calls, and (iii) dip netting. The two spe-cies Rana esculenta and R. lessonae are consi-dered as one single taxon (green frog complex).The taxonomic reference list, used for the IBEM-Index, is available on the IBEM website (http://campus.hesge.ch/ibem/amphibiens.asp).
Amphibians are a �agship group, often witha central importance for managers. As there isa low number of species, this is the only groupwhere an exhaustive inventory (or nearly so) ispossible. Such exhaustive inventory is particu-larly important for detection of rare species (al-so often threatened). This is, for example, thecase in Switzerland where the gathered specieslist is forwarded to the national managers of theSwiss Amphibian breading sites (the KARCH,Swiss Amphibian and Reptile Conservation Pro-gramme), even though this species list is notuseful for the IBEM index.
Environmental variables
Six environmental variables are measured for theIBEM-Index assessment (see next section): pondsurface area (m2), mean depth (cm), shoreline in-dex, pond shade (4 classes), percentage of wood-land in a 50m radius surrounding the pond, and alti-tude (m.a.s.l.).Methods are summarized inTable 2.
METHOD FOR ASSESSING BIOLOGICALQUALITY
The IBEM assessment follows the methodologypresented in the Water Framework Directive, andis based on the calculation of the ratio betweentrue taxonomic richness (Strue) and reference-basedpredicted richness (Sref). This score is translatedinto one of �ve quality classes for each pond: bad(0 to 0.2), poor (>0.2 to 0.4), moderate (>0.4to 0.6), good (>0.6 to 0.8), and high (>0.8 to1). Each of the �ve taxonomic groups is asses-sed separately and the overall biological qua-lity of any given pond (i.e. the IBEM-Index)is calculated by the average of the �ve ratios.
True taxonomic richness (Strue)
To compensate for the bias of a non-exhaustivesampling, observed taxonomic richness (Sobs)is transformed into true taxonomic richness(Strue) by a statistical estimator (Jackknife-1,Burnham & Overton, 1979). Strue is calcula-ted for aquatic vegetation, Gastropoda, Coleop-tera and Odonata either with speci�c softwa-re (for example EstimateS (Colwell, 2005))or by means of our downloadable MicrosoftEXCEL �le (“calcul richesse Strue”), availableat http://campus.hesge.ch/ibem/calcul.asp. Thesampling of amphibian species is considered tobe exhaustive (or nearly so); therefore the obser-ved Amphibian richness equals Strue.
Table 2. Methods to measure the 6 environmental variables used for the assessment of a given pond by the IBEM-Index. Metodosde medida de las 6 variables medioambientales utilizadas para la valoracion de una charca con el �ndice IBEM.
Variables Units Methods
Pond surface area m2 Calculated using GIS, aerial photography or graph paper
Mean depth cm Mean of the depths recorded in each vegetation square plot1 using a ruler or a handhelddepth sounder
Shoreline index D D = L/(2 ∗ √(π ∗ S) with L = shoreline length (m), S = pond area (m2), π = 3.141
Pond shade Class Vertical projection of the shadow of woody vegetation expressed in four classes:
(1) 0%, (2) >0-5%, (3) >5-25%, (4) >25-100%
Woodland (within 50 m) % Forest coverage in a radius of 50 m around the pond
Altitude m
1 If the pond is deeper than 3 m, additional depth measurements must be carried out.

112 Indermuehle et al.
Predicted taxonomic richness (Sref)
The predicted taxonomic richness for referenceconditions (Sref) is calculated for each taxono-mic group using GAM models, based on a sub-set of 12 predicting variables (see Angelibert etal., 2009 for details). Six of these variables (tro-phic state, transparency, conductivity, percenta-ge of �oating-leaved and submerged vegetation,and �sh presence) potentially describe pond de-gradation; they are therefore used to model re-ference conditions for each site. Indeed, thereference condition of a taxonomic group of agiven pond is simulated by setting these 6 in-dicators of degradation to their “non-degraded”value, i.e. allowing the highest possible taxono-mic richness. The other 6 predictors (surface,mean depth, shoreline development, pond sha-ding, percentage of woodland in a 50 m radius,and altitude) are not sensitive to pond degrada-tion and are therefore set to the �eld-measuredvalues. A downloadable tool calculates Srefautomatically (see next section).
Calculating the IBEM-Index
The IBEM-Index is calculated by a user-friendlytool, either directly online on the IBEM website(http://campus.hesge.ch/ibem/calcul de l indice/initialisation.asp) or by means of a downloadableMicrosoft EXCEL �le (“calcul IBEM v1.0”),available from the same website. The followingelements are required to process the index:(i) true genus richness (Strue) of aquatic vege-tation, Gastropoda, Coleoptera and Odonata,(ii) observed species richness of Amphibia,(iii) 6 �eld-measured environmental variables.The user-friendly tool produces the predictedrichness for each taxonomic group (Sref), calcu-lates the ratio Strue/Sref and �nally computes theIBEM-Index (see example in Fig. 6).
APPLIED EXAMPLES
As a demonstration, two ponds were assessed bythe IBEM-Index and the whole process described
Figure 3. Geographical location of the ponds ZH0002 and ZG0023 in Switzerland. Localizacion geogra�ca de las charcas ZH0002y ZG0023 en Suiza.

The IBEM-Index: method description and application 113
Table 3. Values of the six environmental variables measu-red in the two ponds (ZH0002 and ZG0023) and required forthe IBEM assessment. Valores de las seis variables ambienta-les requeridas para el �ndice IBEM, en dos charcas (ZH0002 yZG0023).
Variables Ponds
ZH0002 ZG0023Altitude (m a.s.l.) 435.00 0720.00
Surface area (m2) 640.00 1608.00Mean depth (cm) 107.00 0108.00
Forested surrounding (%) 000.00 0008.00
Shoreline development 001.29 0001.22
Shade (% of the pond shaded) 001.00 0001.00
here. The two ponds, ZH0002 and ZG0023, arelocated in lowland Switzerland (Fig. 3). Theseponds are located in Adlikon (canton of Zurich)and Menzingen (canton of Zoug), respectively.Both waterbodies are relatively small (640 m2 forZH0002 and 1608 m2 for ZG0023). Other physi-cal pond characteristics are presented in Table 3.
Sampling
According to the pond surface area and using themathematical formula presented in the methodsection, aquatic plants were sampled in 16 and25 square plots in ZH0002 and ZG0023, respecti-vely. These square plots were equally distributedalong transects (Fig. 4).
The mathematical formula presented in the me-thod section was used to calculate the numberof samples needed to survey for Gastropodaand Coleoptera: 7 and 10 samples in ZH0002 andZG0023, respectively. The samples were stratifiedacross the dominant mesohabitats (two mesohabi-tats in ZH0002 and 3 in ZG0023) (Fig. 5). Twothirds of the samples (5 and 7 respectively) weredistributed along the shoreline aquatic habitats. Theother third was distributed between the shoreline(excluding the shoreline itself) to a depth of 2 m.
Adult Odonata were sampled in 3 plots dis-tributed along the shoreline (Fig. 5). As thesetwo ponds have a shoreline length < 270 m (e.g.116 m and 124 m for ZH0002 and ZG0023 res-pectively), they were sampled along more than athird of the shoreline.
Amphibian species were recorded as descri-bed in the methods section.
Figure 4. Distribution of square vegetation sampling plotsalong transects in the two ponds ZH0002 (a) and ZG0023 (b).Distribucion de los cuadrados de muestreo de la vegetacionacuatica a lo largo de transectos en las dos charcas ZH0002(a) y ZG0023 (b).
The six environmental variables required forthe assessment by the IBEM-Index were also re-corded (Table 3).
Calculation of the IBEM-Index
The observed taxonomic richness (Sobs) wastransformed into true taxonomic richness (Strue)
Table 4. Values of the observed taxonomic richness (Sobs) andtrue taxonomic richness (Strue) for the two ponds ZH0002 andZG0023. V: aquatic vegetation, G: Gastropoda, C: Coleoptera,O: Odonata, A: Amphibia. Valores de la riqueza taxonomicaobservada (Sobs) y de la riqueza taxonomica real (Strue) paralas dos charcas ZH0002 y ZG0023. V: vegetacion acuatica, G:gasteropodos, C: coleopteros, O: odonatos, A: an�bios.
Ponds Taxonomic group
V G C O A
ZH0002Sobs 10 7.0 08.0 10 5Strue 11 7.9 12.3 12 5
ZG0023Sobs 03 0.0 03.0 08 2Strue 04 0.0 05.8 08 2

114 Indermuehle et al.
Figure 5. Example of distribution of the sweep-net samples for Gastropoda and Coleoptera and plots for adult Odonata in the twoponds ZH0002 (a) and ZG0023 (b). Ejemplo de distribucion de las puntos de muestreo con redes de mano para gasteropodos ycoleopteros y de las bandas de muestreo para odonatos adultos en las dos charcas ZH0002 (a) y ZG0023 (b).
by the statistical estimator Jackknife-1 (Burn-ham & Overton, 1979) (Table 4). These valuesof true richness varied between 5 (Amphibians)and 12.3 (Coleoptera) for pond ZH0002, andbetween 0 (Gastropoda) and 8 (Odonata) forpond ZG0023. A list of the taxa recorded in bothponds is given in Appendix 1.
To calculate the IBEM-Index, we used the Mi-crosoft EXCEL �le “calcul IBEM v1.0” (Fig. 6).The user entered values in the grey cells (six envi-ronmental variables, �ve observed richness), andthe results were automatically produced (Fig. 6,cells Ratio and Quality class). Note that the �vetaxonomic groups had to be used for a reliable

The IBEM-Index: method description and application 115
assessment with the IBEM-Index. However, theuser can exclude one or more groups (Fig. 6, cells
Group retained yes/no) in order to get a rough es-timate of the biodiversity value of a pond.
a)
b)
Figure 6. Calculation of the IBEM-Index for the two ponds ZH0002 (a) and ZG0023 (b) using the EXCEL �le “calcul IBEM v1.0”(available in French and translated into English for this example) downloadable at http://campus.hesge.ch/ibem. This calculationcan also be done online at: http://campus.hesge.ch/ibem/calcul de l indice/initialisation.asp. Calculo del �ndice IBEM para las doscharcas ZH0002 (a) y ZG0023 (b) usando el archivo de EXCEL “calcul IBEM v1.0” (disponible en frances y traducido a inglespara este ejemplo) se puede descargar en http://campus.hesge.ch/ibem. Este calculo puede realizarse tambien en la siguiente paginade Internet: http://campus.hesge.ch/ibem/calcul de l indice/initialisation.asp.

116 Indermuehle et al.
ZH0002 has a good overall biological quality(Fig. 6a, IBEM-index = 0.79). In this pond, therewas a high diversity of Odonata and Gastropoda,but aquatic vegetation was moderately diverse.
ZG0023 has a poor overall biologicalquality (Fig. 6b, IBEM-Index = 0.28) mainlydue to the poor aquatic vegetation, Gastropodaand Coleoptera diversity.
DISCUSSION
The IBEM-Index is a rapid assessment methodwhich gives an indication of the value of a pondfor biodiversity based on the number of taxa.It enables the identi�cation of taxon-rich pondecosystems, a task required by the 1992 Con-vention on Biodiversity. The IBEM method canbe used in Switzerland for rapid biodiversity as-sessment, for example in regional surveys or forsite monitoring. It is a reliable indicator of si-te quality, adapted for the assessment or moni-toring of ponds belonging to natural sites of na-tional importance (national inventory of marshes,moorlands, river backwaters, amphibian breedingsites). Besides producing the IBEM-Index, thedatasets collected by the IBEMsampling methodcan later be used to study patterns of taxon ri-chness and similarity between sites. Overall, theIBEM-Index is one of the tools available fornature conservation. For strictly species-relatedconservation issues, other tools which are alsopart of the “nature conservation toolbox” shouldbe used, for example exhaustive inventories orred lists. Each tool has its speci�c objective andshould be used appropriately.
As biodiversity is generally recognized as agood indicator of global ecological quality, theIBEM-Index can also be used to investigate thequestion of ecosystem quality, a central objecti-ve of the WFD. For example, the IBEM-Indexwas calculated for 63 Swiss lowland ponds, re-vealing a high proportion of ponds with poor ormoderate biological quality (49%, Fig. 7). Goodquality was assigned to 38% of the ponds, andonly 13%achieved the High quality class, and no-ne of the assessed ponds were ranked in the lo-wer quality class (i.e. Bad). This highlights that
Figure 7. Biological quality of Swiss lowland ponds (n = 63),evaluated by the IBEM-Index. Estado ecologico de las charcassuizas de baja altitud (n = 63) evaluadas mediante el �ndiceIBEM.
about one pond out of two is actually degraded interms of biodiversity, and this is likely to re�ectglobal ecological quality. In the UK, the Country-side Survey 2007 shows that only 8% of pondsare currently in good condition and that the bio-logical quality of lowland ponds decreased bet-ween 1996 and 2007 (Carey et al., 2008). Themain objective of the WFD is to restore the qua-lity of all waterbodies in Europe by 2015. Ho-wever, in all European countries the implemen-tation of the directive covers only waterbodieswith a surface area greater than 50 ha, therefo-re excluding ponds. Despite this, some Europeanregions are also applying WFD-type evaluationand monitoring programmes to ponds (for exam-ple some Spanish states e.g. Catalonia, Aragon).If Switzerland followed the WFD for small wa-terbodies, according to our results half of Swisslowland ponds would have to be restored to goodquality. Although this is not realistic because ofthe limited funding available for nature conserva-tion and water quality management, our assess-ment shows that it is crucial to raise awarenessof the importance of the conservation of ponds inSwitzerland. Currently, ponds are mainly seen asa habitat for �agship species on the Red List. Inthe future, they should also be considered as animportant element of a global landscape whereall freshwater systems should have good ecolo-gical quality. Moreover, the consideration of thewhole pond network is also very important at

The IBEM-Index: method description and application 117
the regional scale. Although the IBEM-Index willnot give a quality value to a regional richness,the taxa list gathered through the IBEM samplingcan be useful to address the question of the pondnetwork richness. For global ecological qualityassessments, the IBEM-Index can be combinedwith metrics recently developed speci�cally forthe assessment of the ecological quality of pondsin Switzerland (see Menetrey et al., 2005, 2008;Sager & Lachavanne, submitted).
The IBEM-Index is valid in Switzerland andthe close border regions of neighbour countries(i.e. with a 100 km-wide belt). In others Euro-pean regions, the sampling strategy and metho-dology can nevertheless be used directly. Con-versely, the assessment of the biological quality(i.e. the calculation of the IBEM-Index) has tobe adapted for each region: a reference condi-tion must be assessed for each pond. The assess-ment of this reference value (i.e. for good eco-logical condition) can be done in four differentways (as speci�ed in the WFD): i) using histo-rical data (from a few years ago to paleoecolo-gical data) on similar ecosystems (same surfacearea, depth, altitude, shoreline) relatively natu-rals (i.e. unimpacted by human activities) at thetime of sampling; ii) using current data on si-milar ecosystems, relatively naturals and locatedin the same region; iii) by consulting taxonomicexperts to de�ne the reference value of richnessor iv) through prediction (i.e. using mathemati-cal model of the relationship between diversityand the driving variables).
ACKNOWLEDGEMENTS
The IBEM-Index was developed with supportfrom: Groupe d’Etude et de Gestion de laGrande-Caricaie (GEG), Fondation des Granget-tes, Musee Cantonal de Zoologie de Lausan-ne, Swiss Amphibian and Reptile ConservationProgramme (KARCH), University of Geneva-Laboratoire d’Ecologie et Biologie Aquatique(LEBA), Laboratoire des technologies de l’In-formation (Haute Ecole de Gestion de Geneve),Consulting of�ces AMaibach Sarl, Aquabug,Aquarius, GREN, and Natura.
The study of the Swiss ponds, which made thedevelopment of the IBEM-index possible, wassupported by many partners: Swiss Federal Of�-ce for the Environment (FOEN), Cantons of Ge-neva, Jura, Vaud and Lucerne, Research commis-sion of the Swiss National Park and HES-SO //University of Applied Sciences Western Switzer-land (RCSO RealTech). Moreover we are gra-teful for the data provided by the Swiss Bio-logical Records Center (CSCF) and the SwissFloristic Database (CRSF).
Many thanks to the following persons for theirvarious contributions: Celine Antoine, Domini-que Auderset Joye, Diana Cambin, Gilles Carron,Emmanuel Castella, Jessica Castella, Michael dela Harpe, Raphaelle Juge, Jean-Bernard Lacha-vanne, Anthony Lehmann, Simon Lezat, Natha-lie Menetrey, Jane O’Rourke, Patrice Prunier,Corinne Pulfer, Nathalie Rimann, Mirko Saam,Lionel Sager, Emilie Sandoz.
REFERENCES
ANGELIBERT, S., N. INDERMUEHLE, D. LU-CHIER, B. OERTLI & J. PERFETTA. 2006. Whe-re hides the aquatic biodiversity in the Canton ofGeneva (Switzerland)? Arch. Sci., 59: 225-234.
ANGELIBERT, S., V. ROSSET, N. INDERMUEH-LE & B. OERTLI. 2010. The Pond BiodiversityIndex “IBEM”: a new tool for the rapid assess-ment of biodiversity in ponds from Switzerland.Part 1. Index development. Limnetica, 29: 93-104.
AUDERSET JOYE, D., B. OERTLI, R. JUGE & J.B. LACHAVANNE. 2004. Evaluation ecologiquedes etangs du Bois de Jussy. Departement del’Interieur, de l’Agriculture et de l’Environnementdu Canton de Geneve (Service des forets, de la pro-tection de la nature et du paysage). University ofGeneva, Geneva. 24 pp + appendix.
BIGGS, J., P. WILLIAMS, M. WHITFIELD, G.FOX, P. NICOLET & S. HOWARD. 2000. A newbiological method for assessing the ecological qua-lity of lentic waterbodies. In: L’eau, de la celluleau paysage. Wicherek S. (ed.): 235-250. Elsevier,Paris, France.
BOIX, D., S. GASCON, J. SALA, M. MARTINOY,J. GIFRE & X. D. QUINTANA. 2005. A new in-dex of water quality assessment in Mediterranean

118 Indermuehle et al.
wetlands based on crustacean and insect assembla-ges: the case of Catalunya (NE Iberian peninsula).Aquatic Conserv: Mar. Freshw. Ecosyst., 15: 635-651.
BURNHAM, K. P. & W. S. OVERTON. 1979. Ro-bust estimation of population size when captu-re probabilities vary among animals. Ecology,60: 927-936.
CAREY, P. D., S. WALLIS, P. M. CHAMBERLAIN,A. COOPER, B. A. EMMETT, L. C. MAS-KELL, T. McCANN, J. MURPHY, L. R. NOR-TON, B. REYNOLDS, W. A. SCOTT, I. C.SMART & J. M. ULLYETT. 2008. CountrysideSurvey: UK Results from 2007. Centre for Ecology& Hydrobiology. Lancaster. 105 pp. (available athttp://www.countrysidesurvey.org.uk).
CHOVANEC, A., J. WARINGER, M. STARIF, W.GRAF, W. RECKENDORFER, A. WARINGER-LOSCHENKOHL, H. WAIDBACHER & H.SCHULTZ. 2005. The Floodplain Index – a newapproach for assessing the ecological status ofriver/�oodplain-systems according to the EU Wa-ter Framework Directive. Arch. Hydrobiol. Suppl.,155: 169-185.
COLWELL, R. K. 2005. EstimateS: Statistical esti-mation of species richness and shared species fromsamples. Version 7.5.User’s Guide and applicationpublished at: http://purl.oclc.org/estimates.
CORDOBA-AGUILAR, A. (ed.). 2008. Dragonflies-Damsel�ies: Model Organisms for Ecological andEvolutionary Research. Oxford: Oxford UniversityPress. Oxford, UK. 304 pp.
LANDOLT, E. 1977. Okologische Zeigerwerte zurSchweizer Flora. Veroffentl. Geobot. Inst. ETH,Stift. Rubel, 64: 1-208.
MENETREY, N., L. SAGER, B. OERTLI & J. B.LACHAVANNE. 2005. Looking for metrics to as-sess the trophic state of ponds. Macroinvertebratesand amphibians. Aquatic Conserv: Mar. Freshw.Ecosyst., 15: 653-664.
MENETREY N., B. OERTLI, M. SARTORI, A.
WAGNER & J. B. LACHAVANNE. 2008. Eutro-phication: are may�ies (Ephemeroptera) good bio-indicators for ponds? Hydrobiologia, 597: 125-135.
NICOLET, P., J. BIGGS, G. FOX, M. J. HOD-SON, C. REYNOLDS, M. WHITFIELD & P. WI-LLIAMS. 2004. The wetland plant and macroin-vertebrate assemblages of temporary ponds in En-gland and Wales. Biol. Conserv., 120: 261-278.
OERTLI, B. 2008. Dragon�ies in the assessment andthe monitoring of aquatic habitats. In:Dragon�ies-Damsel�ies: Model Organisms for Ecologicaland Evolutionary Research. Cordoba-Aguilar A.(ed.): 79-95. Oxford University Press, Oxford, UK.
OERTLI, B., D. AUDERSET JOYE, N. INDER-MUEHLE, R. JUGE & J. B. LACHAVANNE.2004. First European Pond Workshop. Arch. Sci.,57: 69-72.
OERTLI, B., D. AUDERSET JOYE, E. CASTELLA,R. JUGE, A. LEHMANN & J. B. LACHAVAN-NE. 2005. PLOCH: a standardized method forsampling and assessing the biodiversity in ponds.Aquatic Conserv: Mar. Freshw. Ecosyst., 15: 665-679.
SAGER, L. & J. B. LACHAVANNE. 2009. The M-NIP: a Macrophyte based Nutrient Index forPonds. Hydrobiologia, 643: 43-63.
SCHMIDT, B. 2004. Actualisation de la Liste Rougedes amphibiens 2002 – 2005, Directives pour letravail de terrain, Directives revisees pour 2004.KARCH. 8 pp.
SOLIMINI, A., M. BAZZANTI, A. RUGGIERO &G. CARCHINI. 2008. Developing a multimetricindex of ecological integrity based on macroinver-tebrates of mountain ponds in central Italy. Hydro-biologia, 597: 109-123.
WILLIAMS, P., M. WHITFIELD, J. BIGGS, S.BRAY, G. FOX, P. NICOLET & D. SEAR. 2004.Comparative biodiversity of rivers, streams, dit-ches and ponds in an agricultural landscape inSouthern England. Biol. Conserv., 115: 329-341.

The IBEM-Index: method description and application 119
Appendix 1. Taxa recorded in the two test ponds. +: presence. Lista de organismos encontrados en las dos charcas utilizadas deejemplo. +: presencia.
Taxonomic group Genus or species Ponds
ZH0002 ZG0023
Aquatic vegetation Alisma sp. +Carex sp. + +Ceratophyllum sp. +Juncus sp. +Lemna sp. +Lycopus sp. +Lythrum sp. +Mentha sp. +Phragmites sp. + +Potamogeton sp. +Typha sp. +
Gastropoda Ferrissia sp. +Gyraulus sp. +Hippeutis sp. +Physella sp. +Planorbarius sp. +Planorbis sp. +Radix sp. +
Coleoptera Agabus sp. +Dytiscus sp. +Enochrus sp. +Haliplus sp. +Helochares sp. +Hydrophylus sp. +Hydroporus sp. +Hyphydrus sp. +Ilybius sp. +Noterus sp. +Oulimnius sp. +
Odonata Aeshna sp. + +Anax sp. + +Coenagrion sp. + +Cordulia sp. +Enallagma sp. + +Erythromma sp. +Ischnura sp. + +Libellula sp. + +Pyrrhosoma sp. +Sympecma sp. +Sympetrum sp. + +
Amphibia Bufo bufo + +Hyla arborea +Green frog complex (Rana esculenta and R. lessonae) +Rana temporaria + +Triturus alpestris +