the population of southeast asia reading...within nus it works particularly with the faculty of arts...
TRANSCRIPT
Asia Research Institute Working Paper Series No. 196
The Population of Southeast Asia
Gavin W. Jones
JY Pillay Comparative Asia Research Centre Global Asia Institute, National University of Singapore
January 2013
ARI Working Paper No. 196 Asia Research Institute ● Singapore
2
The ARI Working Paper Series is published electronically by the Asia Research Institute of the National University of Singapore. © Copyright is held by the author or authors of each Working Paper. ARI Working Papers cannot be republished, reprinted, or reproduced in any format without the permission of the paper’s author or authors. Note: The views expressed in each paper are those of the author or authors of the paper. They do not necessarily represent or reflect the views of the Asia Research Institute, its Editorial Committee or of the National University of Singapore. Citations of this electronic publication should be made in the following manner: Author, “Title,” ARI Working Paper, No. #, Date, www.nus.ari.edu.sg/pub/wps.htm. For instance, Smith, John, “Ethnic Relations in Singapore,” ARI Working Paper, No. 1, June 2003, www.ari.nus.edu.sg/pub/wps.htm. Asia Research Institute Editorial Committee Michelle Miller - Chair Jeremy Kingsley Jonathan Benney Liang Yongjia Maureen Hickey Peter Marolt Tim Bunnell Valerie Yeo Asia Research Institute National University of Singapore 469A Tower Block #10-01, Bukit Timah Road, Singapore 259770 Tel: (65) 6516 3810 Fax: (65) 6779 1428 Website: www.ari.nus.edu.sg Email: [email protected] The Asia Research Institute (ARI) was established as a university-level institute in July 2001 as one of the strategic initiatives of the National University of Singapore (NUS). The mission of the Institute is to provide a world-class focus and resource for research on the Asian region, located at one of its communications hubs. ARI engages the social sciences broadly defined, and especially interdisciplinary frontiers between and beyond disciplines. Through frequent provision of short-term research appointments it seeks to be a place of encounters between the region and the world. Within NUS it works particularly with the Faculty of Arts and Social Sciences, Business, Law and Design, to support conferences, lectures, and graduate study at the highest level.
ARI Working Paper No. 196 Asia Research Institute ● Singapore
3
THE POPULATION OF SOUTHEAST ASIA
The aim of this paper is to provide a brief but comprehensive overview of population trends in Southeast Asia over the past half century. It also deals with the determinants of these trends, both from the perspective of demographic dynamics and of theoretical understandings of the drivers of demographic change. The paper then assesses projections of population trends up to 2030 and some policy implications.
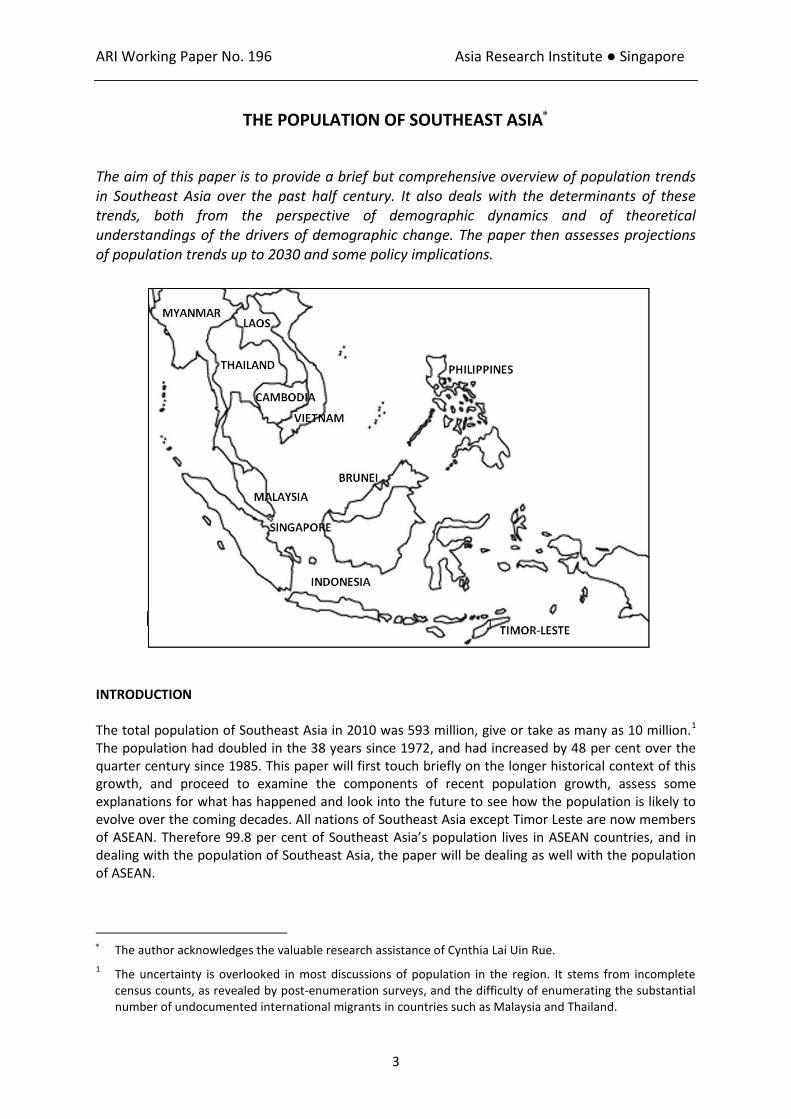
INTRODUCTION The total population of Southeast Asia in 2010 was 593 million, give or take as many as 10 million.1 The population had doubled in the 38 years since 1972, and had increased by 48 per cent over the quarter century since 1985. This paper will first touch briefly on the longer historical context of this growth, and proceed to examine the components of recent population growth, assess some explanations for what has happened and look into the future to see how the population is likely to evolve over the coming decades. All nations of Southeast Asia except Timor Leste are now members of ASEAN. Therefore 99.8 per cent of Southeast Asia’s population lives in ASEAN countries, and in dealing with the population of Southeast Asia, the paper will be dealing as well with the population of ASEAN.
The author acknowledges the valuable research assistance of Cynthia Lai Uin Rue.
1 The uncertainty is overlooked in most discussions of population in the region. It stems from incomplete
census counts, as revealed by post-enumeration surveys, and the difficulty of enumerating the substantial number of undocumented international migrants in countries such as Malaysia and Thailand.
ARI Working Paper No. 196 Asia Research Institute ● Singapore
4
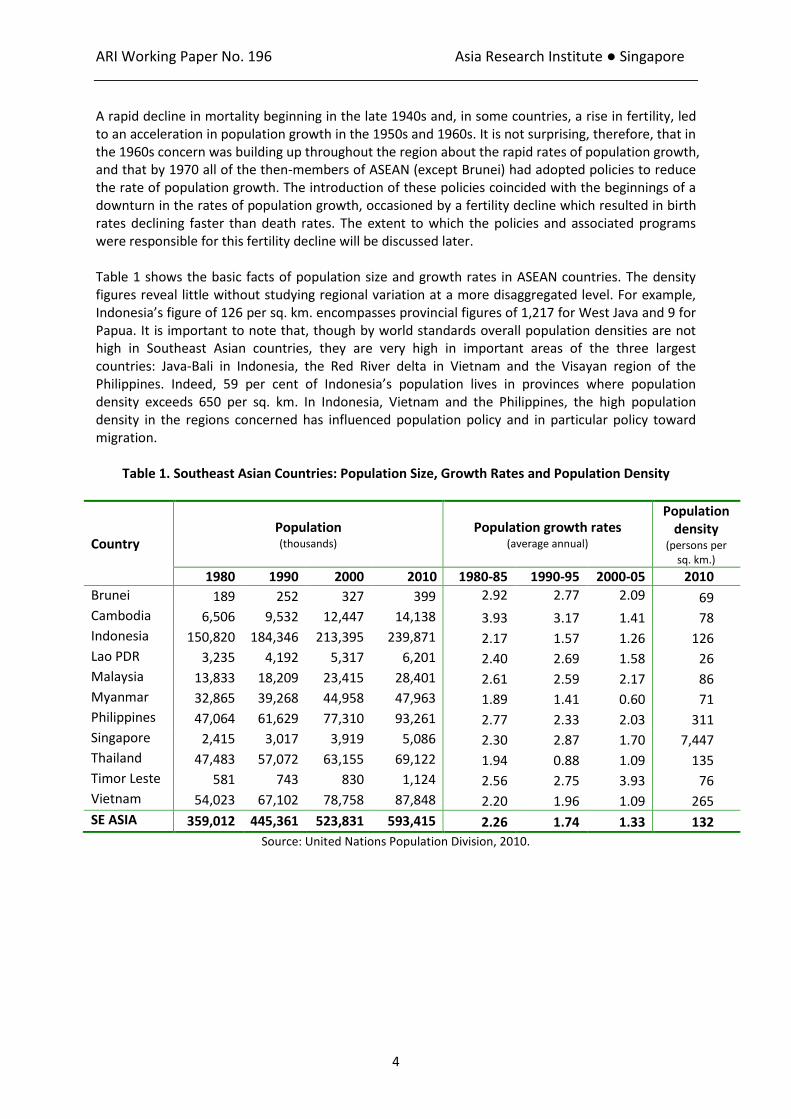
A rapid decline in mortality beginning in the late 1940s and, in some countries, a rise in fertility, led to an acceleration in population growth in the 1950s and 1960s. It is not surprising, therefore, that in the 1960s concern was building up throughout the region about the rapid rates of population growth, and that by 1970 all of the then-members of ASEAN (except Brunei) had adopted policies to reduce the rate of population growth. The introduction of these policies coincided with the beginnings of a downturn in the rates of population growth, occasioned by a fertility decline which resulted in birth rates declining faster than death rates. The extent to which the policies and associated programs were responsible for this fertility decline will be discussed later. Table 1 shows the basic facts of population size and growth rates in ASEAN countries. The density figures reveal little without studying regional variation at a more disaggregated level. For example, Indonesia’s figure of 126 per sq. km. encompasses provincial figures of 1,217 for West Java and 9 for Papua. It is important to note that, though by world standards overall population densities are not high in Southeast Asian countries, they are very high in important areas of the three largest countries: Java-Bali in Indonesia, the Red River delta in Vietnam and the Visayan region of the Philippines. Indeed, 59 per cent of Indonesia’s population lives in provinces where population density exceeds 650 per sq. km. In Indonesia, Vietnam and the Philippines, the high population density in the regions concerned has influenced population policy and in particular policy toward migration.
Table 1. Southeast Asian Countries: Population Size, Growth Rates and Population Density
Country Population (thousands)
Population growth rates (average annual)
Population density
(persons per sq. km.)
1980 1990 2000 2010 1980-85 1990-95 2000-05 2010
Brunei 189 252 327 399 2.92 2.77 2.09 69 Cambodia 6,506 9,532 12,447 14,138 3.93 3.17 1.41 78 Indonesia 150,820 184,346 213,395 239,871 2.17 1.57 1.26 126 Lao PDR 3,235 4,192 5,317 6,201 2.40 2.69 1.58 26 Malaysia 13,833 18,209 23,415 28,401 2.61 2.59 2.17 86 Myanmar 32,865 39,268 44,958 47,963 1.89 1.41 0.60 71 Philippines 47,064 61,629 77,310 93,261 2.77 2.33 2.03 311 Singapore 2,415 3,017 3,919 5,086 2.30 2.87 1.70 7,447 Thailand 47,483 57,072 63,155 69,122 1.94 0.88 1.09 135 Timor Leste 581 743 830 1,124 2.56 2.75 3.93 76 Vietnam 54,023 67,102 78,758 87,848 2.20 1.96 1.09 265
SE ASIA 359,012 445,361 523,831 593,415 2.26 1.74 1.33 132
Source: United Nations Population Division, 2010.

ARI Working Paper No. 196 Asia Research Institute ● Singapore
5
THE POPULATION SITUATION IN HISTORICAL CONTEXT Southeast Asia is one of the most sparsely settled regions of the Asian continent. Two centuries ago, it was a region of forests, swamps and jungles, broken only here and there by significant concentrations of human settlement. The nineteenth and twentieth centuries saw an extraordinary multiplication of the population: from little more than 30 million in 1800 to 80 million in 1900 and 524 million in 2000.2 At the beginning of the twentieth century, much of Central and East Java had population densities comparable to the very populous rural areas of China and India. Other densely settled areas in Southeast Asia, all of them based on wet rice cultivation, included the Red River delta, parts of Luzon and the Visayas, and the Chao Phaya and Irrawaddy deltas. But even the recent decades of rapid population increase have left overall population densities in Southeast Asia well below those of countries such as Japan, Korea, Bangladesh, and India.3
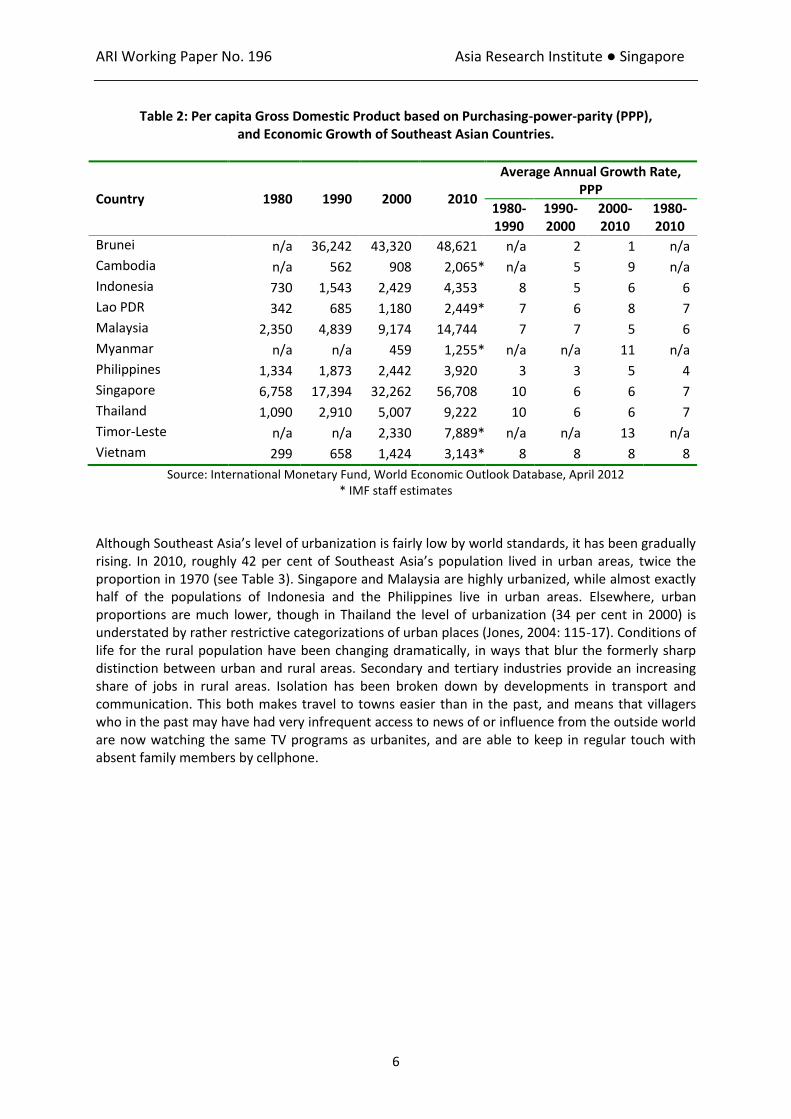
The demographic history of these countries over the last two centuries has been one of frontier expansion into previously empty or sparsely populated regions, some of it officially planned but most of it spontaneous. In the Philippines the main movement was to Mindanao, in Thailand to sparsely settled changwats towards the Burmese, Laos and Cambodian borders, In Vietnam towards the mountain rim in the north and to the central highlands, in Peninsular Malaysia to the state of Pahang and in Indonesia to Sumatra and, more recently, to Kalimantan, Sulawesi and Papua. The Philippine land frontier had ceased to exist by the late 1960s and the Thai frontier by the late 1970s. Though parts of Indonesia, Myanmar and, particularly, Laos have a continuing “frontier” character, the possibility of moving to new land is closed to the vast majority of the agricultural population, both in Indonesia, where the former massive transmigration program has ended, and in the other Southeast Asian countries. Further increases in agricultural production will therefore depend on intensification of cultivation in already settled areas. Although it is not the purpose of this brief paper to discuss economic development in Southeast Asia, some basic trends need to be mentioned in order to provide the context for the discussion of demographic transition. Southeast Asia as a whole has done well economically in recent decades. It comprises some of the most developed countries of Asia, as well as some that are much further behind. The basic economic statistics are presented in Table 2. Singapore and Brunei are two of the world’s wealthiest countries. Next comes Malaysia, followed by Thailand – upper middle income countries on a world scale. The Philippines, which was ahead of Thailand in 1980, has experienced only sluggish economic growth in recent decades, and has fallen far behind Thailand. But it is ahead of Vietnam, and of the three poorest countries in the region, Cambodia, Lao PDR and Myanmar.
2 Some of the best treatments of this historical growth can be found in Zelinsky, 1950; Widjojo, 1970, Peper,
1970; Reid, 1987; Hugo et al, 1987; Owen, 1987; Doeppers and Xenos, 1998; Van Landingham and Hirschman, 2001; Henley, 2005; Hirschman and Bonaparte, 2012.
3 Population density of Southeast Asia is nearly identical to that of China. But if the western and
northwestern provinces of Tibet, Xinjiang, Qinghai and Inner Mongolia are excluded, population density in China rises sharply.
ARI Working Paper No. 196 Asia Research Institute ● Singapore
6
Table 2: Per capita Gross Domestic Product based on Purchasing-power-parity (PPP), and Economic Growth of Southeast Asian Countries.
Country 1980 1990 2000 2010
Average Annual Growth Rate, PPP
1980-1990
1990-2000
2000-2010
1980-2010
Brunei n/a 36,242 43,320 48,621 n/a 2 1 n/a
Cambodia n/a 562 908 2,065* n/a 5 9 n/a
Indonesia 730 1,543 2,429 4,353 8 5 6 6
Lao PDR 342 685 1,180 2,449* 7 6 8 7
Malaysia 2,350 4,839 9,174 14,744 7 7 5 6
Myanmar n/a n/a 459 1,255* n/a n/a 11 n/a
Philippines 1,334 1,873 2,442 3,920 3 3 5 4
Singapore 6,758 17,394 32,262 56,708 10 6 6 7
Thailand 1,090 2,910 5,007 9,222 10 6 6 7
Timor-Leste n/a n/a 2,330 7,889* n/a n/a 13 n/a
Vietnam 299 658 1,424 3,143* 8 8 8 8
Source: International Monetary Fund, World Economic Outlook Database, April 2012 * IMF staff estimates
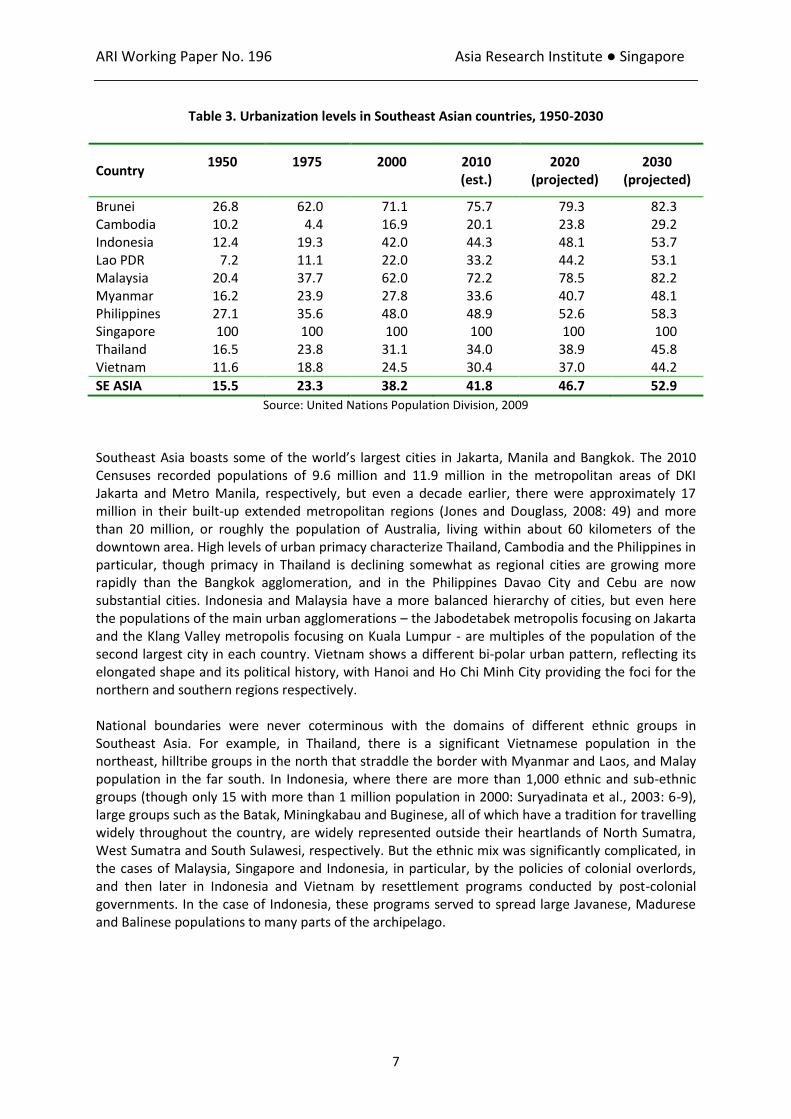
Although Southeast Asia’s level of urbanization is fairly low by world standards, it has been gradually rising. In 2010, roughly 42 per cent of Southeast Asia’s population lived in urban areas, twice the proportion in 1970 (see Table 3). Singapore and Malaysia are highly urbanized, while almost exactly half of the populations of Indonesia and the Philippines live in urban areas. Elsewhere, urban proportions are much lower, though in Thailand the level of urbanization (34 per cent in 2000) is understated by rather restrictive categorizations of urban places (Jones, 2004: 115-17). Conditions of life for the rural population have been changing dramatically, in ways that blur the formerly sharp distinction between urban and rural areas. Secondary and tertiary industries provide an increasing share of jobs in rural areas. Isolation has been broken down by developments in transport and communication. This both makes travel to towns easier than in the past, and means that villagers who in the past may have had very infrequent access to news of or influence from the outside world are now watching the same TV programs as urbanites, and are able to keep in regular touch with absent family members by cellphone.
ARI Working Paper No. 196 Asia Research Institute ● Singapore
7
Table 3. Urbanization levels in Southeast Asian countries, 1950-2030
Country 1950 1975 2000 2010
(est.) 2020
(projected) 2030
(projected)
Brunei 26.8 62.0 71.1 75.7 79.3 82.3 Cambodia 10.2 4.4 16.9 20.1 23.8 29.2 Indonesia 12.4 19.3 42.0 44.3 48.1 53.7 Lao PDR 7.2 11.1 22.0 33.2 44.2 53.1 Malaysia 20.4 37.7 62.0 72.2 78.5 82.2 Myanmar 16.2 23.9 27.8 33.6 40.7 48.1 Philippines 27.1 35.6 48.0 48.9 52.6 58.3 Singapore 100 100 100 100 100 100 Thailand 16.5 23.8 31.1 34.0 38.9 45.8 Vietnam 11.6 18.8 24.5 30.4 37.0 44.2
SE ASIA 15.5 23.3 38.2 41.8 46.7 52.9
Source: United Nations Population Division, 2009
Southeast Asia boasts some of the world’s largest cities in Jakarta, Manila and Bangkok. The 2010 Censuses recorded populations of 9.6 million and 11.9 million in the metropolitan areas of DKI Jakarta and Metro Manila, respectively, but even a decade earlier, there were approximately 17 million in their built-up extended metropolitan regions (Jones and Douglass, 2008: 49) and more than 20 million, or roughly the population of Australia, living within about 60 kilometers of the downtown area. High levels of urban primacy characterize Thailand, Cambodia and the Philippines in particular, though primacy in Thailand is declining somewhat as regional cities are growing more rapidly than the Bangkok agglomeration, and in the Philippines Davao City and Cebu are now substantial cities. Indonesia and Malaysia have a more balanced hierarchy of cities, but even here the populations of the main urban agglomerations – the Jabodetabek metropolis focusing on Jakarta and the Klang Valley metropolis focusing on Kuala Lumpur - are multiples of the population of the second largest city in each country. Vietnam shows a different bi-polar urban pattern, reflecting its elongated shape and its political history, with Hanoi and Ho Chi Minh City providing the foci for the northern and southern regions respectively. National boundaries were never coterminous with the domains of different ethnic groups in Southeast Asia. For example, in Thailand, there is a significant Vietnamese population in the northeast, hilltribe groups in the north that straddle the border with Myanmar and Laos, and Malay population in the far south. In Indonesia, where there are more than 1,000 ethnic and sub-ethnic groups (though only 15 with more than 1 million population in 2000: Suryadinata et al., 2003: 6-9), large groups such as the Batak, Miningkabau and Buginese, all of which have a tradition for travelling widely throughout the country, are widely represented outside their heartlands of North Sumatra, West Sumatra and South Sulawesi, respectively. But the ethnic mix was significantly complicated, in the cases of Malaysia, Singapore and Indonesia, in particular, by the policies of colonial overlords, and then later in Indonesia and Vietnam by resettlement programs conducted by post-colonial governments. In the case of Indonesia, these programs served to spread large Javanese, Madurese and Balinese populations to many parts of the archipelago.
ARI Working Paper No. 196 Asia Research Institute ● Singapore
8
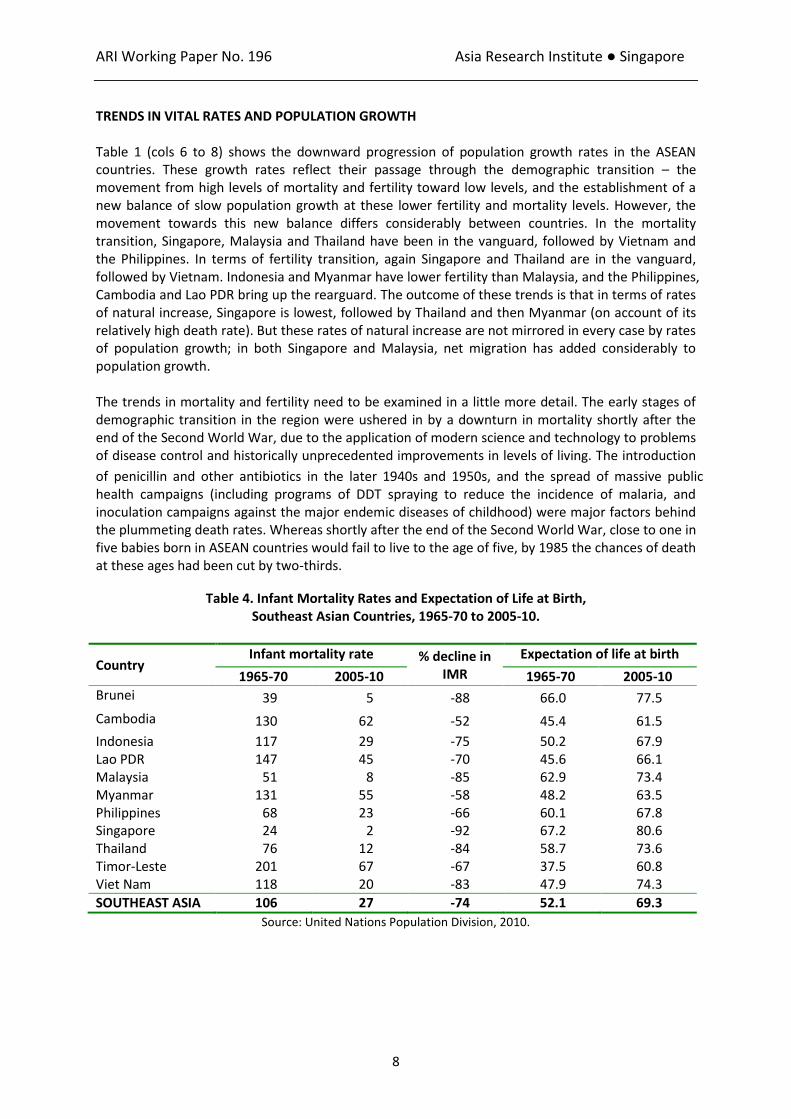
TRENDS IN VITAL RATES AND POPULATION GROWTH Table 1 (cols 6 to 8) shows the downward progression of population growth rates in the ASEAN countries. These growth rates reflect their passage through the demographic transition – the movement from high levels of mortality and fertility toward low levels, and the establishment of a new balance of slow population growth at these lower fertility and mortality levels. However, the movement towards this new balance differs considerably between countries. In the mortality transition, Singapore, Malaysia and Thailand have been in the vanguard, followed by Vietnam and the Philippines. In terms of fertility transition, again Singapore and Thailand are in the vanguard, followed by Vietnam. Indonesia and Myanmar have lower fertility than Malaysia, and the Philippines, Cambodia and Lao PDR bring up the rearguard. The outcome of these trends is that in terms of rates of natural increase, Singapore is lowest, followed by Thailand and then Myanmar (on account of its relatively high death rate). But these rates of natural increase are not mirrored in every case by rates of population growth; in both Singapore and Malaysia, net migration has added considerably to population growth. The trends in mortality and fertility need to be examined in a little more detail. The early stages of demographic transition in the region were ushered in by a downturn in mortality shortly after the end of the Second World War, due to the application of modern science and technology to problems of disease control and historically unprecedented improvements in levels of living. The introduction
of penicillin and other antibiotics in the later 1940s and 1950s, and the spread of massive public health campaigns (including programs of DDT spraying to reduce the incidence of malaria, and inoculation campaigns against the major endemic diseases of childhood) were major factors behind the plummeting death rates. Whereas shortly after the end of the Second World War, close to one in five babies born in ASEAN countries would fail to live to the age of five, by 1985 the chances of death at these ages had been cut by two-thirds.
Table 4. Infant Mortality Rates and Expectation of Life at Birth, Southeast Asian Countries, 1965-70 to 2005-10.
Country Infant mortality rate % decline in
IMR
Expectation of life at birth
1965-70 2005-10 1965-70 2005-10
Brunei 39 5 -88 66.0 77.5
Cambodia 130 62 -52 45.4 61.5
Indonesia 117 29 -75 50.2 67.9 Lao PDR 147 45 -70 45.6 66.1 Malaysia 51 8 -85 62.9 73.4 Myanmar 131 55 -58 48.2 63.5 Philippines 68 23 -66 60.1 67.8 Singapore 24 2 -92 67.2 80.6 Thailand 76 12 -84 58.7 73.6 Timor-Leste 201 67 -67 37.5 60.8 Viet Nam 118 20 -83 47.9 74.3
SOUTHEAST ASIA 106 27 -74 52.1 69.3
Source: United Nations Population Division, 2010.

ARI Working Paper No. 196 Asia Research Institute ● Singapore
9
As shown in Table 4, in the more favoured countries, the progress in lowering mortality has been remarkable. Singapore’s infant mortality rate of 2 per thousand live births is one of the lowest in the world; even Malaysia’s rate of 7 is roughly the same as that of the USA. However, there is scope for further substantial declines in mortality rates in Indonesia, Vietnam, the Philippines and especially Myanmar, Laos and Cambodia. The infant mortality rate remains at around 27 per thousand live births in Indonesia, 20 in Vietnam and 22 in the Philippines. Myanmar, Laos PDR and Cambodia are unfortunately in a different league, as a result of their low levels of development, poorly developed health services and many isolated regions. In these countries, infant mortality rates are estimated to be about 50, 41, and 58, respectively, and maternal mortality rates remain high in many countries. Maternal mortality ratios are difficult to estimate, as evidenced by the wide differences between lower and upper bounds in the estimates in Table 5. They remained shockingly high in many countries of the region in 1990, but have been lowered by 63 per cent in the region as a whole since then (from 410 to 150), well ahead of the worldwide reduction of 47 per cent over this period (UNFPA et al., 2012). Southeast Asia has lower MMRs than South Asia, but has double the ratios of Latin America and quadruple the ratios of East Asia. Much improvement is still needed, particularly in Indonesia, where on the basis of development indicators we might have expected MMRs below those in the Philippines and Vietnam, rather than well above them. Part of Indonesia’s problem no doubt lies in the difficulty of providing quality maternal care services in an archipelagic nation with poor transport and communications in many areas, but this is a problem equally shared by the Philippines.
Table 5. Maternal Mortality Ratios, Southeast Asian Countries, 2010
(maternal deaths per 100,000 live births)
Country MMR Range of uncertainty
Lower estimate Upper estimate
Lao PDR 470 260 840 Cambodia 250 160 390 Indonesia 220 130 350 Myanmar 200 120 330 Philippines 99 66 140 Vietnam 59 29 130 Thailand 48 33 70 Malaysia 29 12 64 Brunei 24 15 40 Singapore 3 2 7 SOUTHEAST ASIA 150 100 220
Source: UNFPA, UNICEF, WHO, World Bank, 2012.
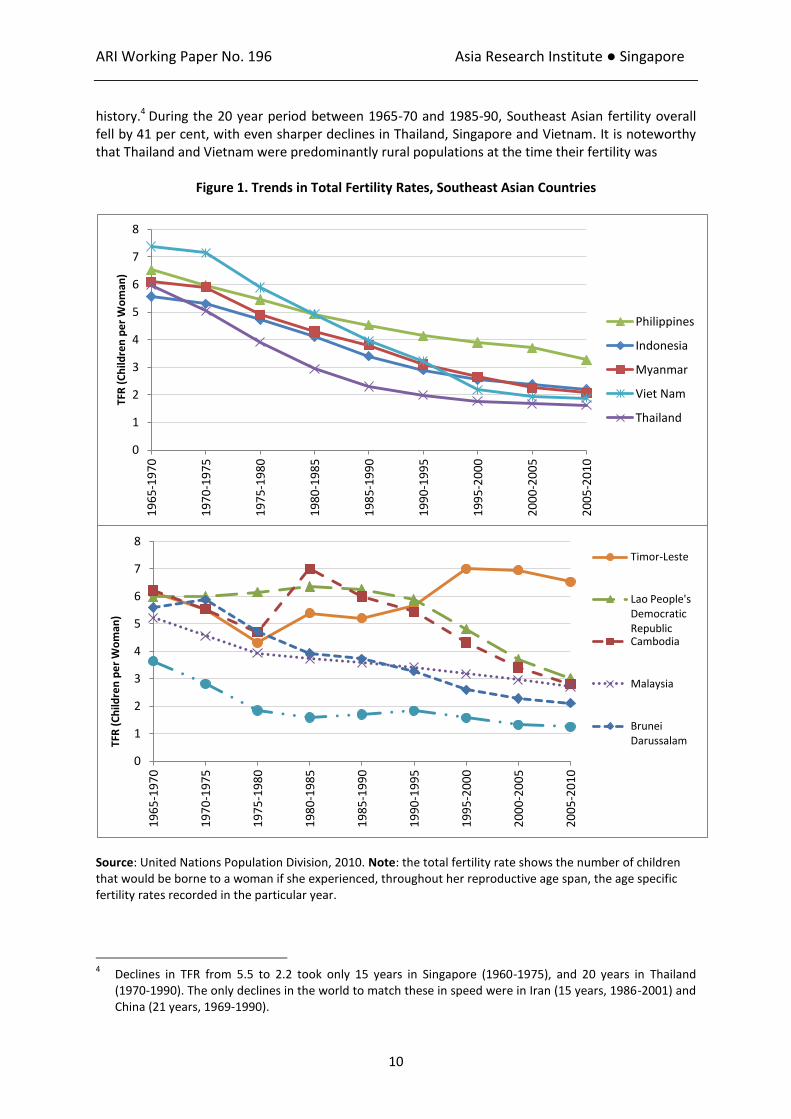
Consistent with demographic transition theory, which posits that a decline in infant mortality is an important precondition for significant declines in fertility, there was a delay between the beginnings of a sharp decline in mortality rates and the beginnings of fertility decline. Fertility first began to decline in Singapore in 1957, followed by Malaysia and Thailand in the mid-1960s, the Philippines and Indonesia in the late 1960s and in the early 1970s by Myanmar and Vietnam (see Fig. 1 and Table 6). The decline accelerated markedly over the 1970s and into the early 1980s, and soon led to declines in rates of population growth. Indeed, the fertility declines in Singapore, among the Chinese and Indians in Malaysia, and in Thailand were among the most rapid ever experienced in world
ARI Working Paper No. 196 Asia Research Institute ● Singapore
10
history.4 During the 20 year period between 1965-70 and 1985-90, Southeast Asian fertility overall fell by 41 per cent, with even sharper declines in Thailand, Singapore and Vietnam. It is noteworthy that Thailand and Vietnam were predominantly rural populations at the time their fertility was
Figure 1. Trends in Total Fertility Rates, Southeast Asian Countries
Source: United Nations Population Division, 2010. Note: the total fertility rate shows the number of children that would be borne to a woman if she experienced, throughout her reproductive age span, the age specific fertility rates recorded in the particular year.
4 Declines in TFR from 5.5 to 2.2 took only 15 years in Singapore (1960-1975), and 20 years in Thailand
(1970-1990). The only declines in the world to match these in speed were in Iran (15 years, 1986-2001) and China (21 years, 1969-1990).
0
1
2
3
4
5
6
7
8
19
65
-19
70
19
70
-19
75
19
75
-19
80
19
80
-19
85
19
85
-19
90
19
90
-19
95
19
95
-20
00
20
00
-20
05
20
05
-20
10
TFR
(C
hild
ren
pe
r W
om
an)
Philippines
Indonesia
Myanmar
Viet Nam
Thailand
0
1
2
3
4
5
6
7
8
19
65
-19
70
19
70
-19
75
19
75
-19
80
19
80
-19
85
19
85
-19
90
19
90
-19
95
19
95
-20
00
20
00
-20
05
20
05
-20
10
TFR
(C
hild
ren
pe
r W
om
an)
Timor-Leste
Lao People's Democratic Republic Cambodia
Malaysia
Brunei Darussalam
ARI Working Paper No. 196 Asia Research Institute ● Singapore
11
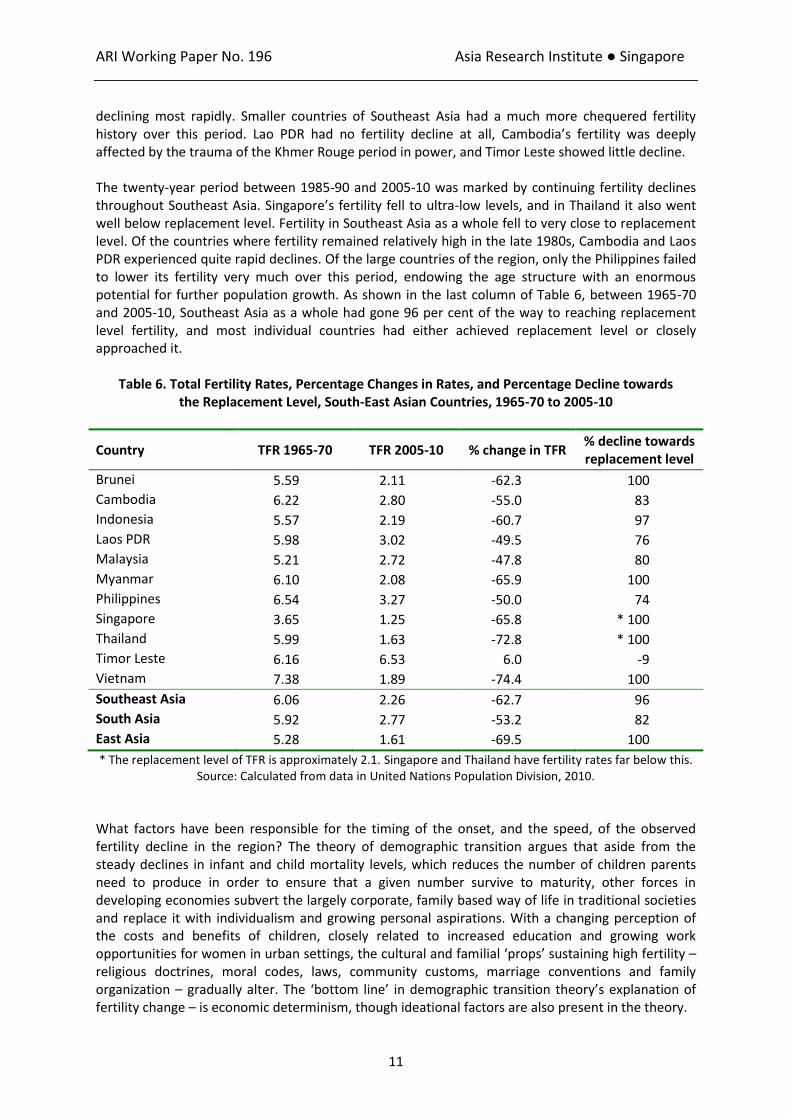
declining most rapidly. Smaller countries of Southeast Asia had a much more chequered fertility history over this period. Lao PDR had no fertility decline at all, Cambodia’s fertility was deeply affected by the trauma of the Khmer Rouge period in power, and Timor Leste showed little decline. The twenty-year period between 1985-90 and 2005-10 was marked by continuing fertility declines throughout Southeast Asia. Singapore’s fertility fell to ultra-low levels, and in Thailand it also went well below replacement level. Fertility in Southeast Asia as a whole fell to very close to replacement level. Of the countries where fertility remained relatively high in the late 1980s, Cambodia and Laos PDR experienced quite rapid declines. Of the large countries of the region, only the Philippines failed to lower its fertility very much over this period, endowing the age structure with an enormous potential for further population growth. As shown in the last column of Table 6, between 1965-70 and 2005-10, Southeast Asia as a whole had gone 96 per cent of the way to reaching replacement level fertility, and most individual countries had either achieved replacement level or closely approached it.
Table 6. Total Fertility Rates, Percentage Changes in Rates, and Percentage Decline towards the Replacement Level, South-East Asian Countries, 1965-70 to 2005-10
Country TFR 1965-70 TFR 2005-10 % change in TFR % decline towards replacement level
Brunei 5.59 2.11 -62.3 100
Cambodia 6.22 2.80 -55.0 83
Indonesia 5.57 2.19 -60.7 97
Laos PDR 5.98 3.02 -49.5 76
Malaysia 5.21 2.72 -47.8 80
Myanmar 6.10 2.08 -65.9 100
Philippines 6.54 3.27 -50.0 74
Singapore 3.65 1.25 -65.8 * 100
Thailand 5.99 1.63 -72.8 * 100
Timor Leste 6.16 6.53 6.0 -9
Vietnam 7.38 1.89 -74.4 100
Southeast Asia 6.06 2.26 -62.7 96
South Asia 5.92 2.77 -53.2 82
East Asia 5.28 1.61 -69.5 100
* The replacement level of TFR is approximately 2.1. Singapore and Thailand have fertility rates far below this. Source: Calculated from data in United Nations Population Division, 2010.
What factors have been responsible for the timing of the onset, and the speed, of the observed fertility decline in the region? The theory of demographic transition argues that aside from the steady declines in infant and child mortality levels, which reduces the number of children parents need to produce in order to ensure that a given number survive to maturity, other forces in developing economies subvert the largely corporate, family based way of life in traditional societies and replace it with individualism and growing personal aspirations. With a changing perception of the costs and benefits of children, closely related to increased education and growing work opportunities for women in urban settings, the cultural and familial ‘props’ sustaining high fertility – religious doctrines, moral codes, laws, community customs, marriage conventions and family organization – gradually alter. The ‘bottom line’ in demographic transition theory’s explanation of fertility change – is economic determinism, though ideational factors are also present in the theory.
ARI Working Paper No. 196 Asia Research Institute ● Singapore
12
Socioeconomic explanations are relevant in a very broad brush way in explaining Southeast Asian fertility transition. On the whole, the better-off countries have the lowest fertility and the less developed countries the highest: compare Singapore and Thailand with Laos PDR and Cambodia. But explanations based on socioeconomic indicators do not adequately explain many aspects of fertility trends in the region: why fertility declined substantially in many areas that were predominantly rural, with low scores on a range of development indicators (e.g. Northern Vietnam in the 1960s and 1970s (Bryant, 2007: 103); Myanmar5; some of the provinces of Indonesia). Nor can they explain why the Philippines, which ranked high amongst the countries of the region in socioeconomic indicators in the 1960s, failed to lead the way in fertility transition, or why the Malays, though benefiting from positive discrimination under the New Economic Policy in Malaysia, had a period of increased fertility and then very sluggish decline in the 1980s and 1990s, while fertility of the other ethnic groups was declining rapidly.6 A broader understanding of fertility trends in the region requires a recognition that institutional factors, including governance, are important in understanding the broad setting of fertility decline (McNicoll, 2006), and that opportunity structures rewarding increased investment in a smaller number of children may emerge among poor populations as well as those that are experiencing rapid economic development. An important – and sometimes overlooked - element in Southeast Asian fertility trends is trends in marriage patterns. In Southeast Asian societies, there is little childbearing outside marriage.7 Therefore the two factors determining fertility are the amount of a woman’s reproductive period she spends within marriage, and the level of marital fertility. The marriage element is a very important determinant of fertility; for example, the fertility decline for Malays in Malaysia over the 1960s was almost entirely due to rising age at marriage (Jones, 1990: 513), and more than one third of the decline in TFR in Myanmar from 4.7 in 1983 to 2.4 in 2001 was attributable to the nuptiality effect (Jones, 2007: 21). There has been a tendency for female age at marriage to rise throughout the region and more recently for a substantial proportion of women in the cities to reach their mid-40s without marrying (around 15 per cent in Bangkok and 14 per cent in Singapore). This helps to account for the below-replacement fertility evident in the major cities of the region. Those women who do marry, many of them not until their late 20s or 30s, are not producing enough children to make up for those who do not marry.
5 The government of Myanmar did not declare any official population policy and formerly restricted access
to contraceptives, though many were smuggled in from neighbouring Thailand and Bangladesh. In the late 1990s, it did begin a birth spacing program, the reach of which was limited both geographically and in availability of particular methods (Ministry of Health and UNFPA, 1999: 35). Myanmar also remained poorer than many of its neighbours; reports in the late 1990s indicated low and falling secondary school enrolment ratios and that 35% of children under the age of three were malnourished (Economist Intelligence Unit, 1998; United Nations Working Group, 1998). Nevertheless, the pace of fertility decline in Myanmar matched that of the much-heralded decline in Indonesia, and fertility rates continued to decline to levels well below those in the Philippines and Malaysia (see Figure 1).
6 Beginning in 1977, total fertility rates for Malays rose, plateaued and then declined only slowly until the
pace of decline picked up somewhat in the mid-1990s. Meanwhile, fertility of the other ethnic groups continued its rapid decline. In contrast to the Chinese, the earlier Malay fertility decline was mainly due to rising age at marriage. The rise after 1977 was partly due to a halt in this upward trend, thus leading to a ‘bunching’ of births among later-marrying women. But another factor is that desired family size among Malays, which has exceeded that of Chinese for some time, rose further after 1977 (Jones, 1990).
7 Some marriages in the region are not officially registered, but are recognized by the community.
Childbearing commonly occurs in such marriages, but is rare in cohabiting relationships not recognized by the community. See Jones and Gubhaju, 2012: 65-66.
ARI Working Paper No. 196 Asia Research Institute ● Singapore
13
The rapid pace of fertility decline that characterized countries such as Thailand and Indonesia can certainly be related to the rapid pace of economic and social development in these countries, including the transport and communications revolutions; and government family planning efforts. The gradual development of all-weather road systems (very rapid in Thailand during the 1960s and 1970s, and in Indonesia since the 1970s), ended the isolation of large numbers of villages; and development of public transport facilities, such as the up-country buses of Thailand and the ‘Bis Malam’ and colts in Indonesia, gave even poor villagers more ready access to large cities. Perhaps even more important was the spread of radio and TV into the villages, and more recently the remarkable spread of the cellphone. The perceptions and aspirations of rural dwellers, even those in isolated areas, were undoubtedly profoundly affected by the urban-dominated images they receive via the media and the greater ease of communication. At the same time, educational opportunities were expanding, thus providing the incentive for rural and urban parents alike to focus on having fewer children and educating them in the hope of achieving upward economic and social mobility. An important factor entirely absent in the European demographic transition was organized family planning programs (mostly beginning around the late 1960s) to foster smaller family size norms and to make contraception readily available. The history of these programs in a number of Southeast Asian countries is documented and analyzed in chapters of Robinson and Ross (eds), 2007. There is debate over where such organized provision of family planning services fitted into the explanatory picture, and the answers clearly differ greatly by country. Pritchett (1994) argued that the impact of these programs has been greatly exaggerated, but Bongaarts (1997), while accepting some of Pritchett’s arguments, nevertheless demonstrated the impact to be substantial. Phillips and Ross (1992) argued that the effect of these programs is stronger when they operate in a context of rapid social and economic development. Sharp declines in fertility in many settings (not only in Southeast Asia) where real income and certain other ‘development indicators’ do not appear to be rising significantly indicate clearly that high levels of modernization on the Western model are not a necessary condition of fertility decline. ‘Modernization’ insofar as it affects fertility must be viewed broadly. The factors identified in demographic transition theory are important – education, industrialization, urbanization and changes in the family. But in some contexts (including perhaps Myanmar) thwarted hopes and economic stagnation can lead to delayed marriage and caution in family building. Considering the Southeast Asian populations with fertility now below replacement level (Singapore, Thailand, Chinese Malaysians, Vietnam, major cities in Indonesia), fertility has been influenced, first, by decreasing proportion married, and secondly by some factors that have influenced marital fertility:
The costs of childbearing are increasing, both the direct financial costs and the opportunity costs of women’s interrupted career development, the latter particularly important for the growing proportion of women reaching higher levels of education
There is increasing pressure, especially in the cities, to engage in “intensive parenting”, arranging tutoring outside of school hours, etc., to ensure that the child is “successful”. Women bear the brunt of fulfilling social expectations about intensive parenting
Related to these two factors, ‘work-life balance’ issues place pressure on parents, particularly mothers, who contemplate combining a career and childrearing in the relatively family-unfriendly workplaces of the region.
ARI Working Paper No. 196 Asia Research Institute ● Singapore
14
MIGRATION – INTERNAL AND INTERNATIONAL Internal and international migration are often dealt with separately in regional population studies. There are two main reasons. First, internal migration, unlike international migration, does not directly affect national population growth rates. Second, it does not raise the same legal issues in relation to citizenship and other matters. A case can be made, however, for considering both kinds of migration together, because the motivation to migrate is on the whole similar. International migration in recent decades has had major effects on population growth in Malaysia and Singapore, in both cases raising rates of population growth far above what would have resulted from natural increase alone. In other countries, it has had less effect, though refugee migration has been important in particular periods in lowering population growth rates in Vietnam, Cambodia, Laos PDR and Myanmar. A tradition of working overseas has resulted in much permanent outmigration from the Philippines and the residence overseas of about 10 per cent of the Philippine workforce at any given time. About 6 million Indonesians are currently working overseas as contract labour migrants and about 3 million Myanmarese are living outside Myanmar, mainly in Thailand (Hugo, 2012, Table 2). In recent decades, organized marriage migration involving women from poorer countries, particularly the Philippines and Vietnam, moving to wealthier Asian countries such as Japan, South Korea, Taiwan and Singapore, has assumed greater prominence (Jones, 2012). Although much smaller in number than labour migration flows, the impact on the population of the source and destination countries is more permanent. The volume of internal migration in the region has been far larger than that of international migration. There has been a shift over time from dominance of the “frontier” migration movements mentioned earlier to largely rural-urban movements and more recently, as the percentage living in urban areas has increased, to a greater share of urban-urban movements. Some of the recent internal migration has led to significant regional population shifts as well, as areas less favoured economically have lost population to more prosperous regions. Thus in Malaysia, Perak’s share of the national population fell from 17.8 per cent in 1980 to 11.0 per cent in 2000, following the collapse of the tin mining sector, and in Indonesia, Central Java’s share of national population fell from 19 per cent in 1961 to 15 per cent in 2000, not only because of its low fertility but also as a result of continuing outmigration to Jakarta and to outer island areas through the transmigration program. Three countries of the region – Indonesia, Malaysia and Vietnam – conducted long-term programs of officially sponsored resettlement of population. In the case of Indonesia, the transmigration program reached its peak in terms of numbers resettled in the 1970s and early 1980s. But controversy built up over whether the program represented merely a “transfer of poverty”, over environmental impacts, land alienation and the impact on local populations in major destination areas such as Papua and parts of Kalimantan (Hardjono, 1989). Since budgetary difficulties in funding the program emerged in the mid-1980s, little new settlement actually occurred after that time, though ethnic violence in some regions between settlers and the local population in the 1990s and 2000s were a continuing negative legacy of the program. In Vietnam, ambitious targets to resettle population in New Economic Zones were adopted in 1976, after reunification. The results were disastrous and the goals had to be greatly scaled down (Desbarats 1987). In Malaysia, resettlement programs which were much more expensive per settler family than those in Indonesia or Vietnam did succeed in creating prosperous conditions in most settlement areas. Far more important in more recent times have been the spontaneous flows of migration arising from people seeking better education and job prospects in other regions. Such flows have long served – though imperfectly – as an equilibrating mechanism between areas of greater and lesser economic potential (as in the case of net outflows from the Visayas to both Luzon and Mindanao). Though
ARI Working Paper No. 196 Asia Research Institute ● Singapore
15
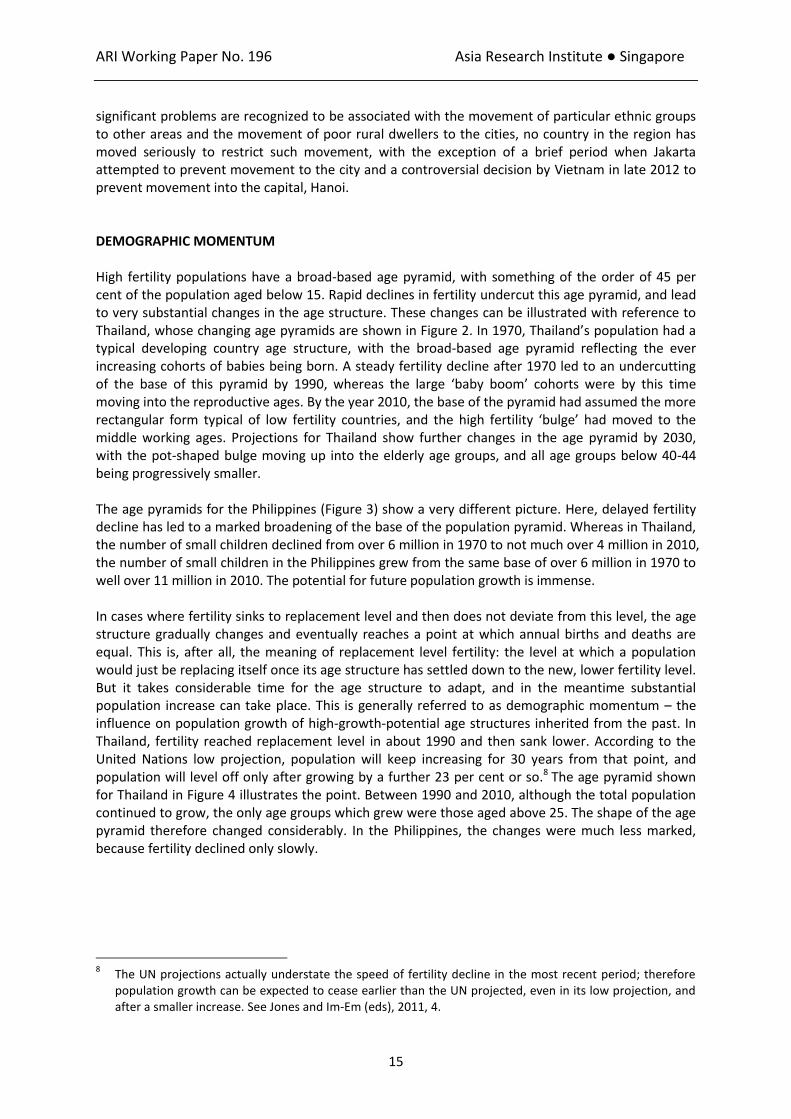
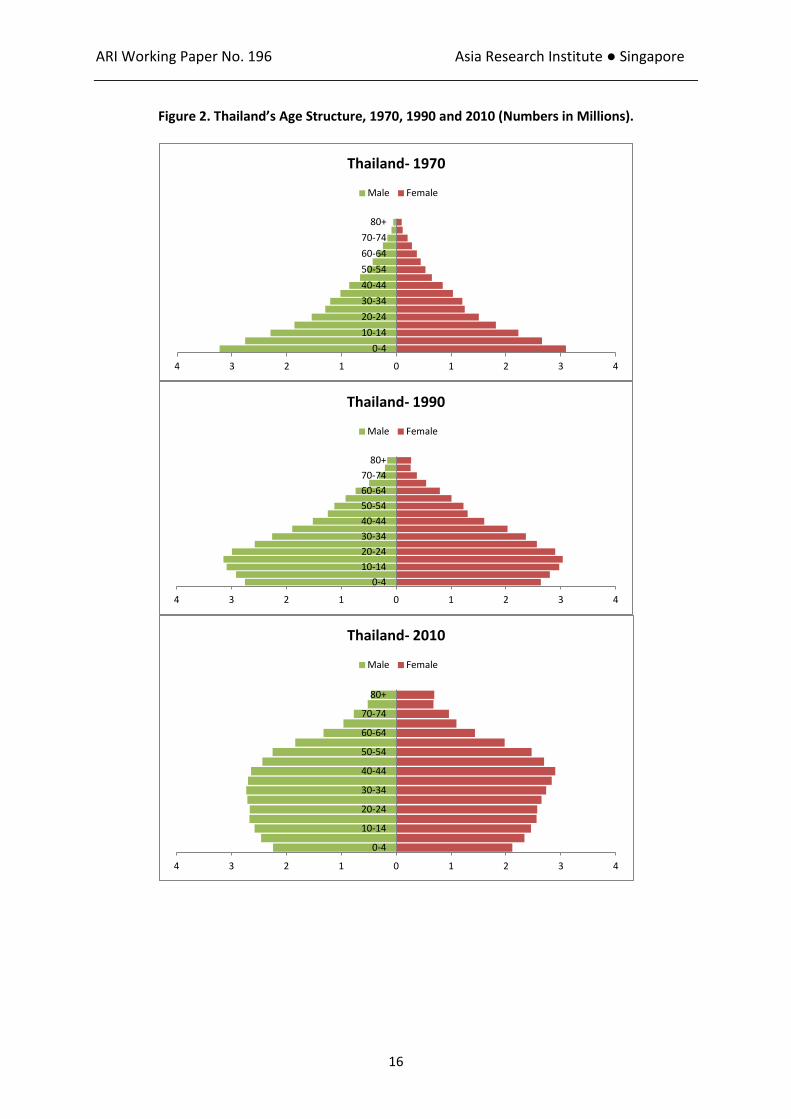
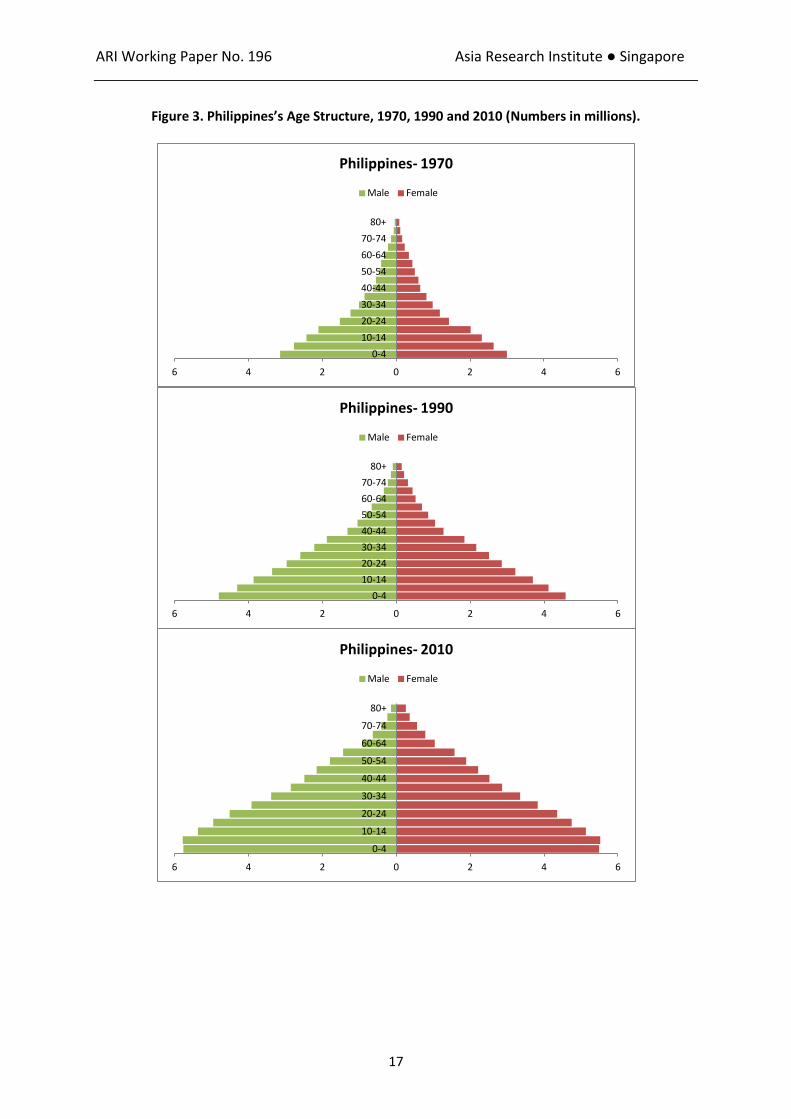
significant problems are recognized to be associated with the movement of particular ethnic groups to other areas and the movement of poor rural dwellers to the cities, no country in the region has moved seriously to restrict such movement, with the exception of a brief period when Jakarta attempted to prevent movement to the city and a controversial decision by Vietnam in late 2012 to prevent movement into the capital, Hanoi. DEMOGRAPHIC MOMENTUM High fertility populations have a broad-based age pyramid, with something of the order of 45 per cent of the population aged below 15. Rapid declines in fertility undercut this age pyramid, and lead to very substantial changes in the age structure. These changes can be illustrated with reference to Thailand, whose changing age pyramids are shown in Figure 2. In 1970, Thailand’s population had a typical developing country age structure, with the broad-based age pyramid reflecting the ever increasing cohorts of babies being born. A steady fertility decline after 1970 led to an undercutting of the base of this pyramid by 1990, whereas the large ‘baby boom’ cohorts were by this time moving into the reproductive ages. By the year 2010, the base of the pyramid had assumed the more rectangular form typical of low fertility countries, and the high fertility ‘bulge’ had moved to the middle working ages. Projections for Thailand show further changes in the age pyramid by 2030, with the pot-shaped bulge moving up into the elderly age groups, and all age groups below 40-44 being progressively smaller. The age pyramids for the Philippines (Figure 3) show a very different picture. Here, delayed fertility decline has led to a marked broadening of the base of the population pyramid. Whereas in Thailand, the number of small children declined from over 6 million in 1970 to not much over 4 million in 2010, the number of small children in the Philippines grew from the same base of over 6 million in 1970 to well over 11 million in 2010. The potential for future population growth is immense. In cases where fertility sinks to replacement level and then does not deviate from this level, the age structure gradually changes and eventually reaches a point at which annual births and deaths are equal. This is, after all, the meaning of replacement level fertility: the level at which a population would just be replacing itself once its age structure has settled down to the new, lower fertility level. But it takes considerable time for the age structure to adapt, and in the meantime substantial population increase can take place. This is generally referred to as demographic momentum – the influence on population growth of high-growth-potential age structures inherited from the past. In Thailand, fertility reached replacement level in about 1990 and then sank lower. According to the United Nations low projection, population will keep increasing for 30 years from that point, and population will level off only after growing by a further 23 per cent or so.8 The age pyramid shown for Thailand in Figure 4 illustrates the point. Between 1990 and 2010, although the total population continued to grow, the only age groups which grew were those aged above 25. The shape of the age pyramid therefore changed considerably. In the Philippines, the changes were much less marked, because fertility declined only slowly.
8 The UN projections actually understate the speed of fertility decline in the most recent period; therefore
population growth can be expected to cease earlier than the UN projected, even in its low projection, and after a smaller increase. See Jones and Im-Em (eds), 2011, 4.
ARI Working Paper No. 196 Asia Research Institute ● Singapore
16
Figure 2. Thailand’s Age Structure, 1970, 1990 and 2010 (Numbers in Millions).
4 3 2 1 0 1 2 3 4
0-4
10-14
20-24
30-34
40-44
50-54
60-64
70-74
80+
Thailand- 1970
Male Female
4 3 2 1 0 1 2 3 4
0-4
10-14
20-24
30-34
40-44
50-54
60-64
70-74
80+
Thailand- 1990
Male Female
4 3 2 1 0 1 2 3 4
0-4
10-14
20-24
30-34
40-44
50-54
60-64
70-74
80+
Thailand- 2010
Male Female
ARI Working Paper No. 196 Asia Research Institute ● Singapore
17
Figure 3. Philippines’s Age Structure, 1970, 1990 and 2010 (Numbers in millions).
6 4 2 0 2 4 6
0-4
10-14
20-24
30-34
40-44
50-54
60-64
70-74
80+
Philippines- 1970
Male Female
6 4 2 0 2 4 6
0-4
10-14
20-24
30-34
40-44
50-54
60-64
70-74
80+
Philippines- 1990
Male Female
6 4 2 0 2 4 6
0-4
10-14
20-24
30-34
40-44
50-54
60-64
70-74
80+
Philippines- 2010
Male Female
ARI Working Paper No. 196 Asia Research Institute ● Singapore
18
Figure 4. Thailand’s Age Structure, 1990 and 2010 (Numbers in millions).
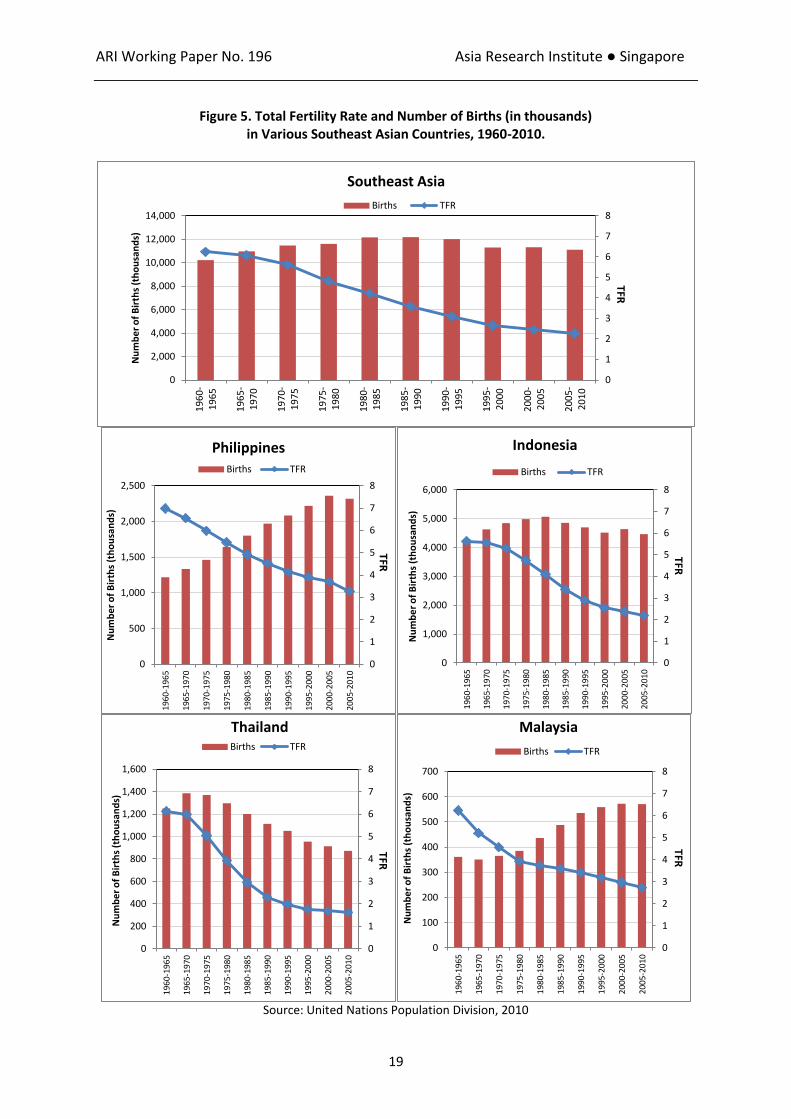
Such changes in age structure are occurring in most Southeast Asian countries. For Southeast Asia as a whole, fertility is projected by the United Nations to reach replacement level in 2015, and fall further thereafter, but the population is projected to increase for a further 40 years, by 22 per cent, before it begins to decline. Over the entire period of fertility decline in Southeast Asia, the share of reproductive-age women in the population has been rising (from 23.4 per cent in 1960 to 23.9 per cent in 1980, 27.3 per cent in 2000 and 27.7 per cent in 2010). This has served to dampen somewhat the effect of the decline of fertility rates on birth rates, and hence on rates of population growth. As the absolute numbers of reproductive-age women have been increasing very rapidly, in many cases the annual number of births were increasing despite quite rapidly declining fertility. The trends in fertility rates and birth numbers in Figure 5 are revealing. In Southeast Asia as a whole, the fertility decline has been sharp enough to cause annual birth numbers to level off by the late 1980s and then began falling. This pattern is shown to a more marked extent in Thailand. In the Philippines, however, though fertility has been declining gradually, the annual number of births has been increasing steadily. Malaysia shows an interesting pattern in which sharp fertility declines appeared to be presaging a decline in births from the late 1970s but stalling of the fertility decline generated sharply increasing annual numbers of births through the 1980s. Births did not level off until the 2000s, with a sharper decline in fertility, but are projected to rise again after 2010 as a result of increased immigration. In Indonesia, the decline in fertility was enough to lower annual births somewhat from the late 1980s, though annual births have not altered greatly since the late 1990s.
4 3 2 1 0 1 2 3 4
0-4
5-9
10-14
15-19
20-24
25-29
30-34
35-39
40-44
45-49
50-54
55-59
60-64
65-69
70-74
75-79
80+
Thailand- 1990 and 2010
1990
Female Male
ARI Working Paper No. 196 Asia Research Institute ● Singapore
19
Figure 5. Total Fertility Rate and Number of Births (in thousands) in Various Southeast Asian Countries, 1960-2010.
Source: United Nations Population Division, 2010
0
1
2
3
4
5
6
7
8
0
2,000
4,000
6,000
8,000
10,000
12,000
14,000
19
60
-1
96
5
19
65
-1
97
0
19
70
-1
97
5
19
75
-1
98
0
19
80
-1
98
5
19
85
-1
99
0
19
90
-1
99
5
19
95
-2
00
0
20
00
-2
00
5
20
05
-2
01
0
Nu
mb
er
of
Bir
ths
(th
ou
san
ds)
Southeast Asia
Births TFR
TFR
0
1
2
3
4
5
6
7
8
0
500
1,000
1,500
2,000
2,500
196
0-1
965
196
5-1
970
197
0-1
975
197
5-1
980
198
0-1
985
198
5-1
990
199
0-1
995
199
5-2
000
200
0-2
005
200
5-2
010
Nu
mb
er
of
Bir
ths
(th
ou
san
ds)
Philippines Births TFR
TFR
0
1
2
3
4
5
6
7
8
0
1,000
2,000
3,000
4,000
5,000
6,000
196
0-1
965
196
5-1
970
197
0-1
975
197
5-1
980
198
0-1
985
198
5-1
990
199
0-1
995
199
5-2
000
200
0-2
005
200
5-2
010
Nu
mb
er
of
Bir
ths
(th
ou
san
ds)
Indonesia
Births TFR
TFR
0
1
2
3
4
5
6
7
8
0
200
400
600
800
1,000
1,200
1,400
1,600
19
60-1
965
19
65-1
970
19
70-1
975
19
75-1
980
19
80-1
985
19
85-1
990
19
90-1
995
19
95-2
000
20
00-2
005
20
05-2
010
Nu
mb
er
of
Bir
ths
(th
ou
san
ds)
Thailand Births TFR
TFR
0
1
2
3
4
5
6
7
8
0
100
200
300
400
500
600
700
19
60-1
965
19
65-1
970
19
70-1
975
19
75-1
980
19
80-1
985
19
85-1
990
19
90-1
995
19
95-2
000
20
00-2
005
20
05-2
010
Nu
mb
er
of
Bir
ths
(th
ou
san
ds)
Malaysia
Births TFR
TFR
ARI Working Paper No. 196 Asia Research Institute ● Singapore
20
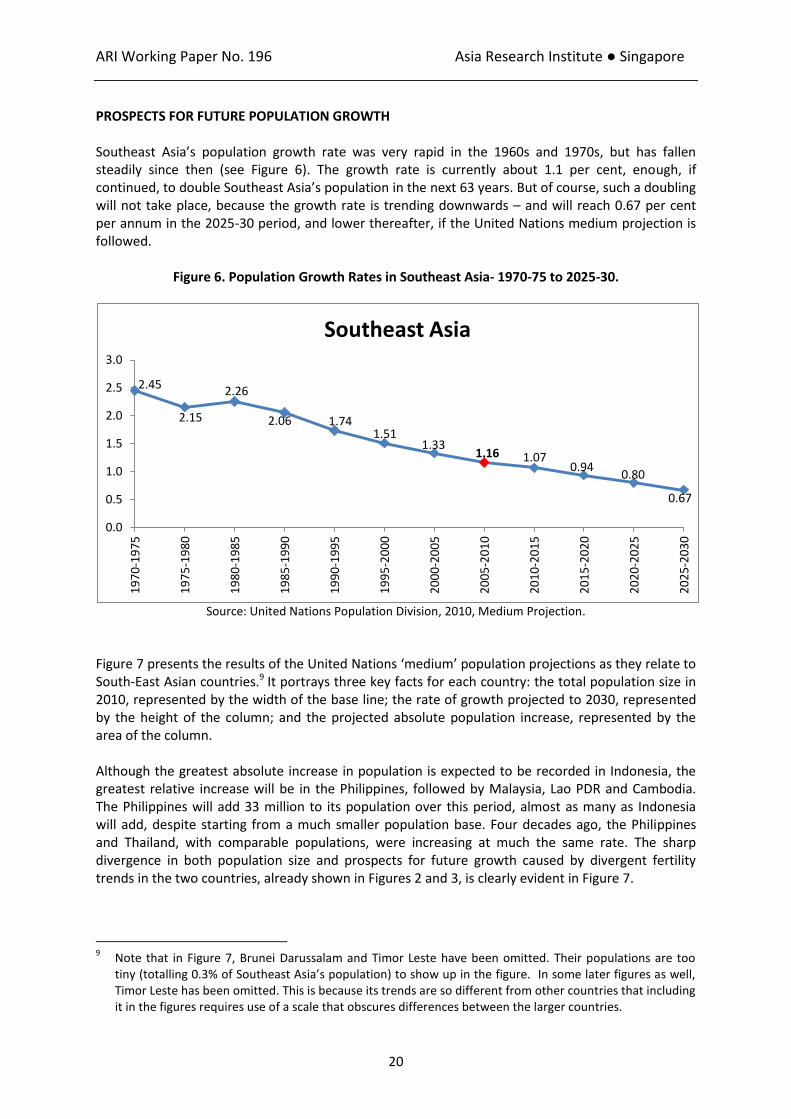
PROSPECTS FOR FUTURE POPULATION GROWTH Southeast Asia’s population growth rate was very rapid in the 1960s and 1970s, but has fallen steadily since then (see Figure 6). The growth rate is currently about 1.1 per cent, enough, if continued, to double Southeast Asia’s population in the next 63 years. But of course, such a doubling will not take place, because the growth rate is trending downwards – and will reach 0.67 per cent per annum in the 2025-30 period, and lower thereafter, if the United Nations medium projection is followed.
Figure 6. Population Growth Rates in Southeast Asia- 1970-75 to 2025-30.
Source: United Nations Population Division, 2010, Medium Projection.
Figure 7 presents the results of the United Nations ‘medium’ population projections as they relate to South-East Asian countries.9 It portrays three key facts for each country: the total population size in 2010, represented by the width of the base line; the rate of growth projected to 2030, represented by the height of the column; and the projected absolute population increase, represented by the area of the column. Although the greatest absolute increase in population is expected to be recorded in Indonesia, the greatest relative increase will be in the Philippines, followed by Malaysia, Lao PDR and Cambodia. The Philippines will add 33 million to its population over this period, almost as many as Indonesia will add, despite starting from a much smaller population base. Four decades ago, the Philippines and Thailand, with comparable populations, were increasing at much the same rate. The sharp divergence in both population size and prospects for future growth caused by divergent fertility trends in the two countries, already shown in Figures 2 and 3, is clearly evident in Figure 7.
9 Note that in Figure 7, Brunei Darussalam and Timor Leste have been omitted. Their populations are too
tiny (totalling 0.3% of Southeast Asia’s population) to show up in the figure. In some later figures as well, Timor Leste has been omitted. This is because its trends are so different from other countries that including it in the figures requires use of a scale that obscures differences between the larger countries.
2.45
2.15
2.26
2.06 1.74 1.51
1.33 1.16 1.07
0.94 0.80
0.67
0.0
0.5
1.0
1.5
2.0
2.5
3.0
19
70
-19
75
19
75
-19
80
19
80
-19
85
19
85
-19
90
19
90
-19
95
19
95
-20
00
20
00
-20
05
20
05
-20
10
20
10
-20
15
20
15
-20
20
20
20
-20
25
20
25
-20
30
Southeast Asia

ARI Working Paper No. 196 Asia Research Institute ● Singapore
21
Figure 7. Southeast Asian Countries: Projected Population Growth, 2010-2030
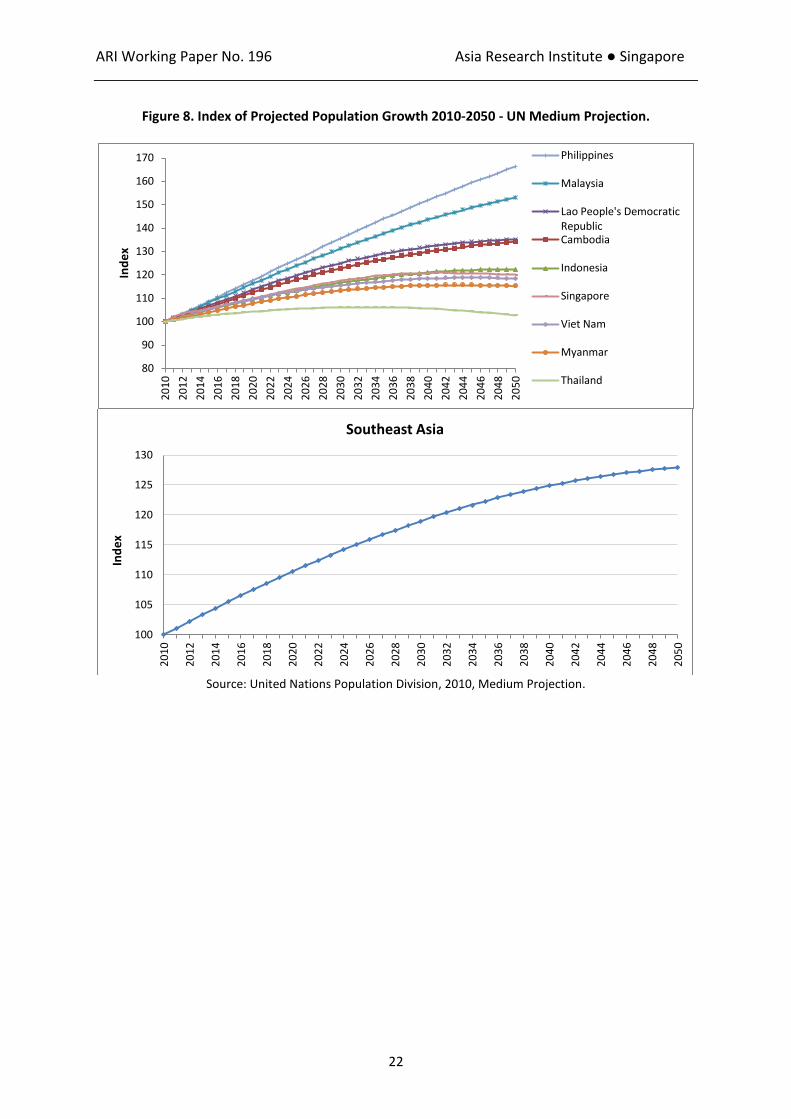
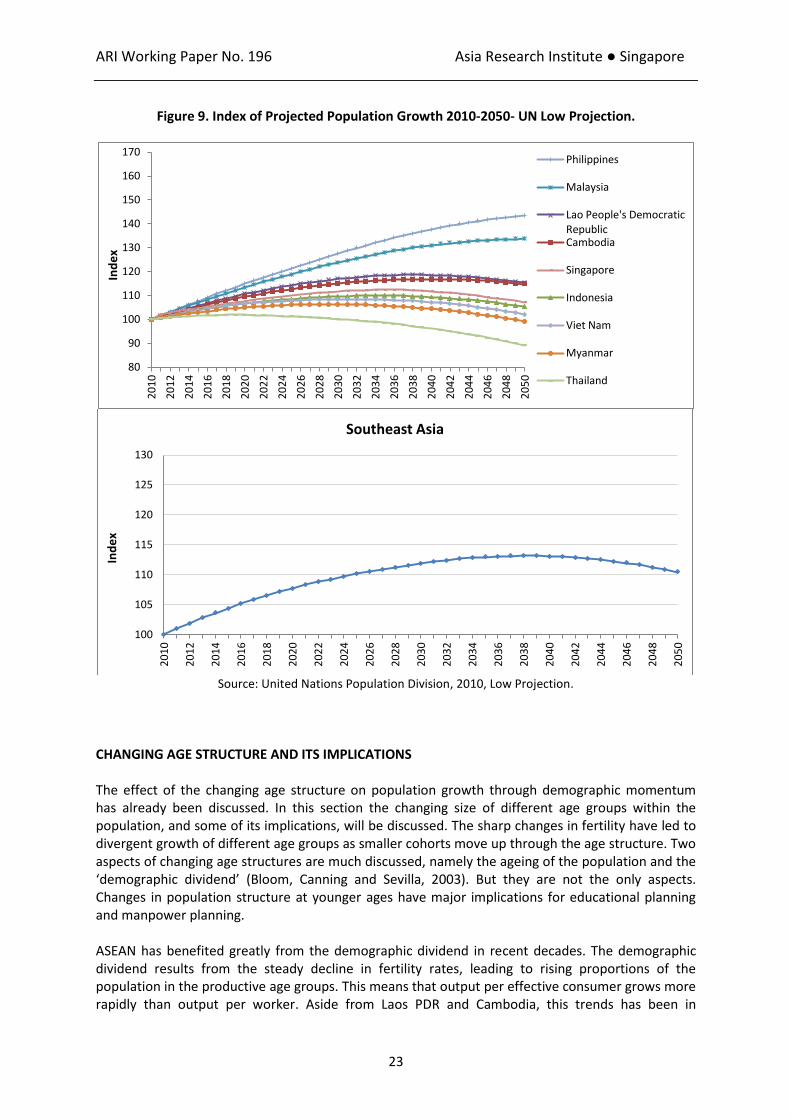
In the context of Asia as a whole, Southeast Asia’s projected population growth (113 million or 19 per cent over the 20-year period 2010-2030) occupies an intermediate position. East Asia’s population, dominated by China, is expected to barely increase (by 3 per cent) over the same period. But South Asia’s population is projected to increase by 26 per cent, considerably more than the projected growth in Southeast Asia. Interestingly, however, four Southeast Asian countries (Laos PDR, Malaysia, the Philippines and Timor Leste) are expected to have faster population growth than India. Population projections are subject to considerable uncertainty, particularly when the projections go beyond a 20-year time span (Scherbov, Lutz and Sanderson, 2011). In the absence of unexpected wars or natural disasters, the greatest uncertainty relates to fertility trends and migration patterns. While the United Nations medium projection is often used as the “most likely” scenario, this is by no means certain. Indeed, even the United Nations low projection may be too high in the case of Thailand (Jones and Im-Em (eds), 2011: 4-7). In order to illustrate this uncertainty, Figures 8 and 9 show the index of population growth projected for the ASEAN countries over the 40-year period beyond 2010. Both the medium and low projections indicate a trend toward cessation of population growth in Southeast Asia towards the middle of the 21st century. The medium projection shows an increase of only 8 per cent between 2030 and 2050, and the low projection a decline of 1 per cent. Indeed, the projections show the beginning of population decline in the region by 2055 in the case of the medium projection and by 2040 in the case of the low projection. For individual countries as well, there are substantial differences between the medium and low projections in the growth of population projected over the 40 years following 2010. For example, in Vietnam, the medium projection shows population growth continuing over the whole period, with a total increase of 20 per cent. The low projection, on the other hand, shows a growth of less than 10 per cent by 2030, after which population begins to decline.
ARI Working Paper No. 196 Asia Research Institute ● Singapore
22
Figure 8. Index of Projected Population Growth 2010-2050 - UN Medium Projection.
Source: United Nations Population Division, 2010, Medium Projection.
80
90
100
110
120
130
140
150
160
170 2
01
0
20
12
20
14
20
16
20
18
20
20
20
22
20
24
20
26
20
28
20
30
20
32
20
34
20
36
20
38
20
40
20
42
20
44
20
46
20
48
20
50
Ind
ex
Philippines
Malaysia
Lao People's Democratic Republic Cambodia
Indonesia
Singapore
Viet Nam
Myanmar
Thailand
100
105
110
115
120
125
130
20
10
20
12
20
14
20
16
20
18
20
20
20
22
20
24
20
26
20
28
20
30
20
32
20
34
20
36
20
38
20
40
20
42
20
44
20
46
20
48
20
50
Ind
ex
Southeast Asia
ARI Working Paper No. 196 Asia Research Institute ● Singapore
23
Figure 9. Index of Projected Population Growth 2010-2050- UN Low Projection.
Source: United Nations Population Division, 2010, Low Projection.
CHANGING AGE STRUCTURE AND ITS IMPLICATIONS The effect of the changing age structure on population growth through demographic momentum has already been discussed. In this section the changing size of different age groups within the population, and some of its implications, will be discussed. The sharp changes in fertility have led to divergent growth of different age groups as smaller cohorts move up through the age structure. Two aspects of changing age structures are much discussed, namely the ageing of the population and the ‘demographic dividend’ (Bloom, Canning and Sevilla, 2003). But they are not the only aspects. Changes in population structure at younger ages have major implications for educational planning and manpower planning. ASEAN has benefited greatly from the demographic dividend in recent decades. The demographic dividend results from the steady decline in fertility rates, leading to rising proportions of the population in the productive age groups. This means that output per effective consumer grows more rapidly than output per worker. Aside from Laos PDR and Cambodia, this trends has been in
80
90
100
110
120
130
140
150
160
170 2
01
0
20
12
20
14
20
16
20
18
20
20
20
22
20
24
20
26
20
28
20
30
20
32
20
34
20
36
20
38
20
40
20
42
20
44
20
46
20
48
20
50
Ind
ex
Philippines
Malaysia
Lao People's Democratic Republic Cambodia
Singapore
Indonesia
Viet Nam
Myanmar
Thailand
100
105
110
115
120
125
130
20
10
20
12
20
14
20
16
20
18
20
20
20
22
20
24
20
26
20
28
20
30
20
32
20
34
20
36
20
38
20
40
20
42
20
44
20
46
20
48
20
50
Ind
ex
Southeast Asia
ARI Working Paper No. 196 Asia Research Institute ● Singapore
24
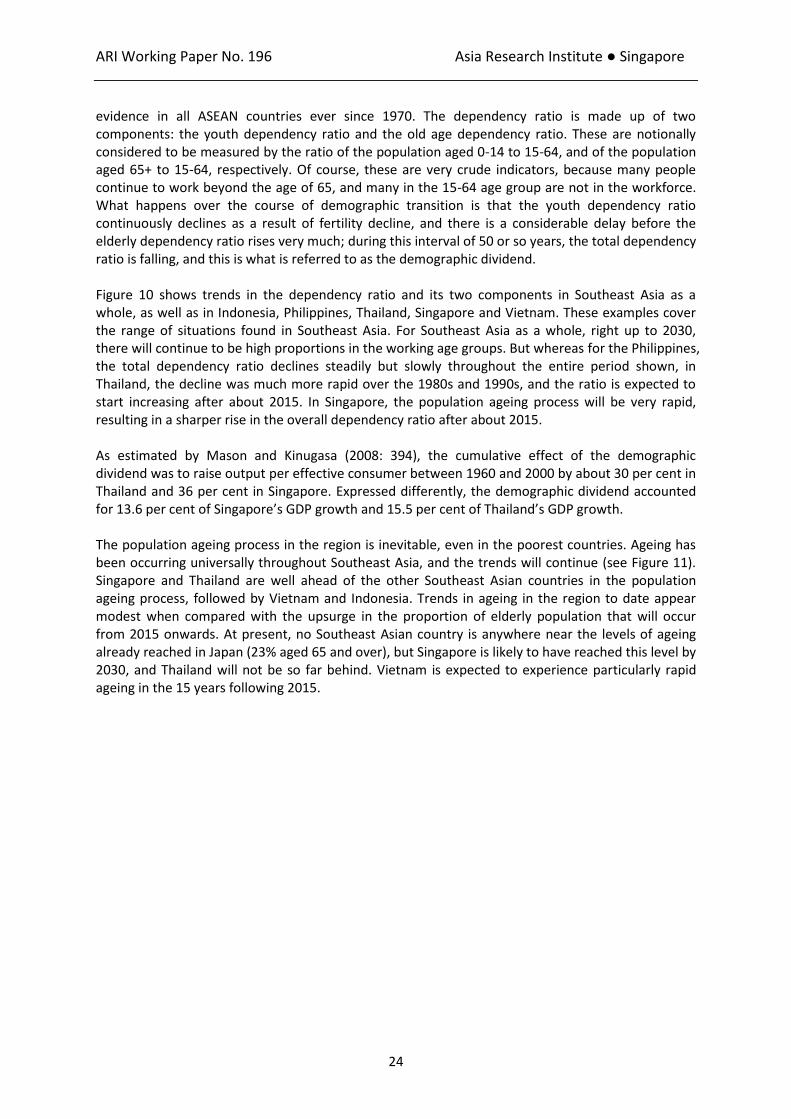
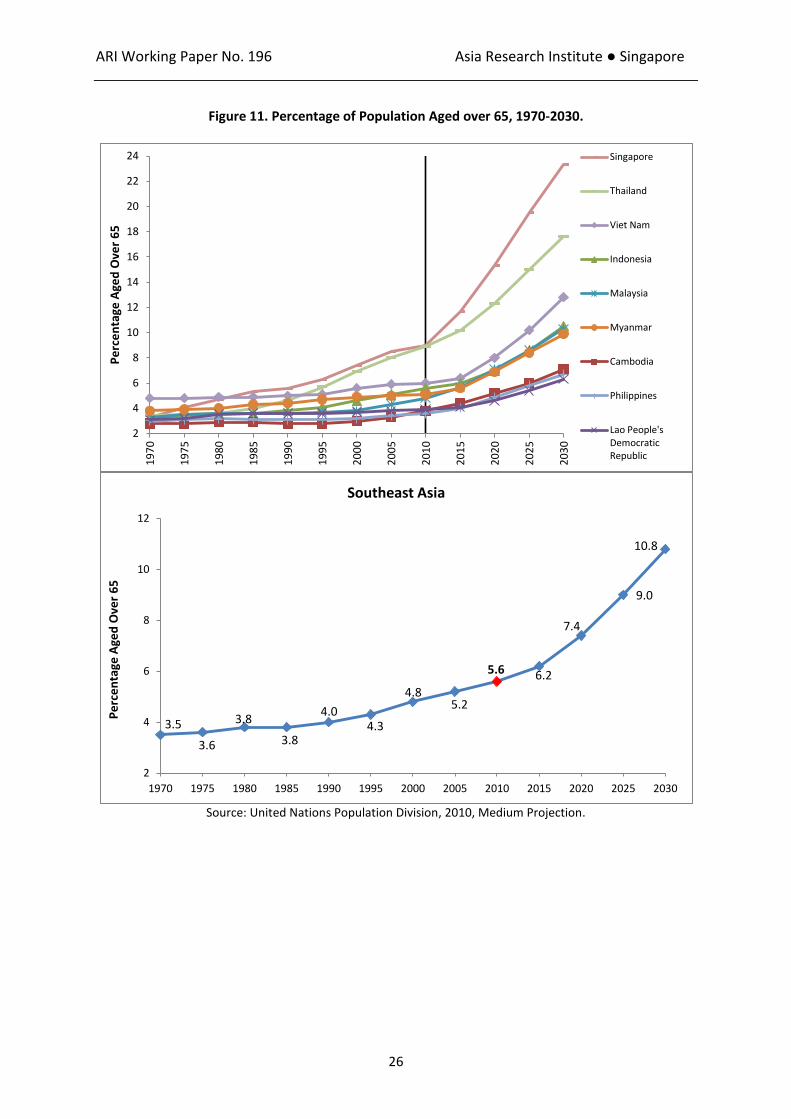
evidence in all ASEAN countries ever since 1970. The dependency ratio is made up of two components: the youth dependency ratio and the old age dependency ratio. These are notionally considered to be measured by the ratio of the population aged 0-14 to 15-64, and of the population aged 65+ to 15-64, respectively. Of course, these are very crude indicators, because many people continue to work beyond the age of 65, and many in the 15-64 age group are not in the workforce. What happens over the course of demographic transition is that the youth dependency ratio continuously declines as a result of fertility decline, and there is a considerable delay before the elderly dependency ratio rises very much; during this interval of 50 or so years, the total dependency ratio is falling, and this is what is referred to as the demographic dividend. Figure 10 shows trends in the dependency ratio and its two components in Southeast Asia as a whole, as well as in Indonesia, Philippines, Thailand, Singapore and Vietnam. These examples cover the range of situations found in Southeast Asia. For Southeast Asia as a whole, right up to 2030, there will continue to be high proportions in the working age groups. But whereas for the Philippines, the total dependency ratio declines steadily but slowly throughout the entire period shown, in Thailand, the decline was much more rapid over the 1980s and 1990s, and the ratio is expected to start increasing after about 2015. In Singapore, the population ageing process will be very rapid, resulting in a sharper rise in the overall dependency ratio after about 2015. As estimated by Mason and Kinugasa (2008: 394), the cumulative effect of the demographic dividend was to raise output per effective consumer between 1960 and 2000 by about 30 per cent in Thailand and 36 per cent in Singapore. Expressed differently, the demographic dividend accounted for 13.6 per cent of Singapore’s GDP growth and 15.5 per cent of Thailand’s GDP growth. The population ageing process in the region is inevitable, even in the poorest countries. Ageing has been occurring universally throughout Southeast Asia, and the trends will continue (see Figure 11). Singapore and Thailand are well ahead of the other Southeast Asian countries in the population ageing process, followed by Vietnam and Indonesia. Trends in ageing in the region to date appear modest when compared with the upsurge in the proportion of elderly population that will occur from 2015 onwards. At present, no Southeast Asian country is anywhere near the levels of ageing already reached in Japan (23% aged 65 and over), but Singapore is likely to have reached this level by 2030, and Thailand will not be so far behind. Vietnam is expected to experience particularly rapid ageing in the 15 years following 2015.

ARI Working Paper No. 196 Asia Research Institute ● Singapore
25
Figure 10. Trends in Dependency Ratios, Southeast Asian Countries, 1970-2040
Source: United Nations Population Division, 2010, Medium Projection.
Child
Old-Age
Total
0
20
40
60
80
100
120
140
160
19
70
19
75
19
80
19
85
19
90
19
95
20
00
20
05
20
10
20
15
20
20
20
25
20
30
De
pe
nd
en
cy R
atio
SOUTHEAST ASIA
Child
Old Age
Total
0
20
40
60
80
100
120
140
160
19
70
19
75
19
80
19
85
19
90
19
95
20
00
20
05
20
10
20
15
20
20
20
25
20
30
De
pe
nd
en
cy R
atio
Indonesia
Child
Old Age
Total
0
20
40
60
80
100
120
140
160
19
70
19
75
19
80
19
85
19
90
19
95
20
00
20
05
20
10
20
15
20
20
20
25
20
30
De
pe
nd
en
cy R
atio
Philippines
Child
Old Age
Total
0
20
40
60
80
100
120
140
160
19
70
19
75
19
80
19
85
19
90
19
95
20
00
20
05
20
10
20
15
20
20
20
25
20
30
De
pe
nd
en
cy R
atio
Singapore
Child
Old Age
Total
0
20
40
60
80
100
120
140
160
19
70
19
75
19
80
19
85
19
90
19
95
20
00
20
05
20
10
20
15
20
20
20
25
20
30
De
pe
nd
en
cy R
atio
Thailand
Child
Old Age
Total
0
20
40
60
80
100
120
140
160
19
70
19
75
19
80
19
85
19
90
19
95
20
00
20
05
20
10
20
15
20
20
20
25
20
30
De
pe
nd
en
cy R
atio
Vietnam
ARI Working Paper No. 196 Asia Research Institute ● Singapore
26
Figure 11. Percentage of Population Aged over 65, 1970-2030.
Source: United Nations Population Division, 2010, Medium Projection.
2
4
6
8
10
12
14
16
18
20
22
24 1
97
0
19
75
19
80
19
85
19
90
19
95
20
00
20
05
20
10
20
15
20
20
20
25
20
30
Pe
rce
nta
ge A
ged
Ove
r 6
5
Singapore
Thailand
Viet Nam
Indonesia
Malaysia
Myanmar
Cambodia
Philippines
Lao People's Democratic Republic
3.5
3.6
3.8
3.8
4.0 4.3
4.8 5.2
5.6 6.2
7.4
9.0
10.8
2
4
6
8
10
12
1970 1975 1980 1985 1990 1995 2000 2005 2010 2015 2020 2025 2030
Pe
rce
nta
ge A
ged
Ove
r 6
5
Southeast Asia
ARI Working Paper No. 196 Asia Research Institute ● Singapore
27
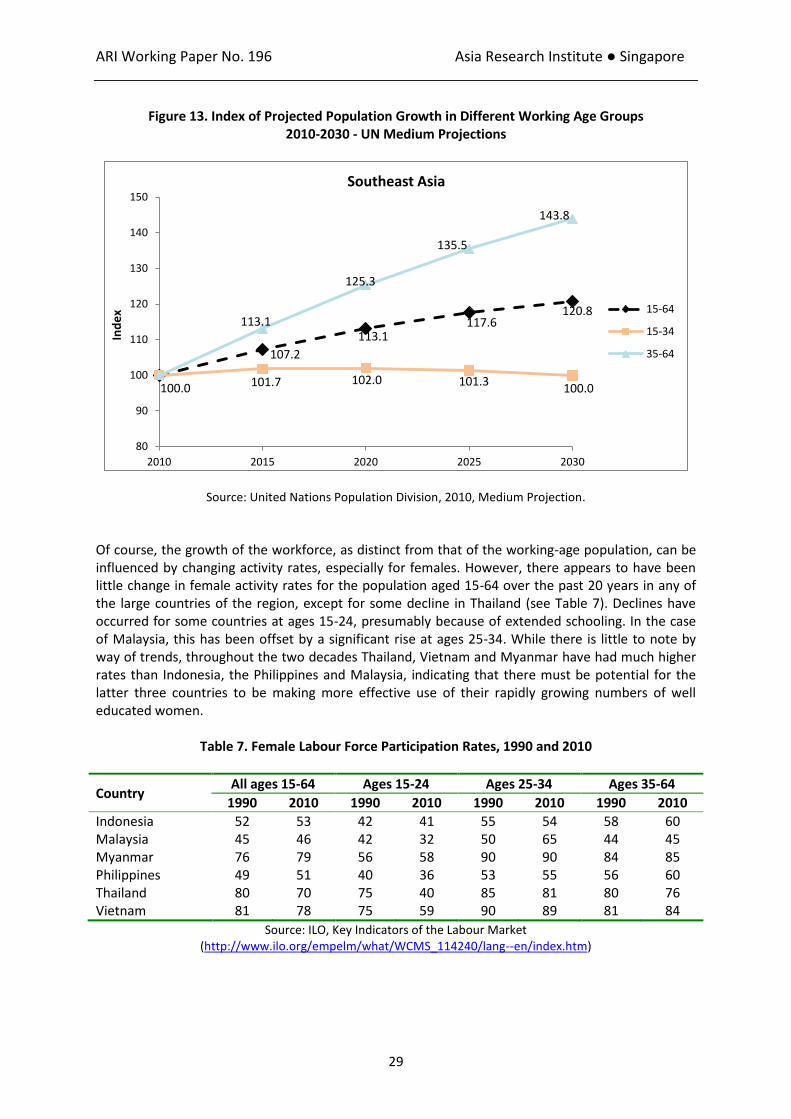
Population trends in the region have been closely related to educational developments, in an interactive process. Declining fertility has facilitated increases in educational enrolment ratios; rising educational levels, in turn, have contributed to the decline in both fertility and mortality levels (Lutz, 2009; Hannum and Buchmann, 2005). The achievement of universal primary school education in Thailand, Malaysia and Indonesia was greatly assisted by the decline in fertility, and the (lagged) deceleration in growth of the school-age population. Indeed, in Thailand, the numbers entering the primary school age groups began to decline around 1980, and during the 1980s they also began to decline in some Indonesian provinces, notably East Java, Bali and North Sulawesi, and in the country as a whole by the late 1980s. By contrast, the numbers entering the primary school age groups in the Philippines and Malaysia continued to rise, and although they have now more or less levelled off in Malaysia, they will rise further over the next two decades in the Philippines. Happily, in the two countries of the region with low school enrolment ratios, Cambodia and Laos PDR, the numbers of primary school-age children have already ceased to increase, thus easing the task of raising enrolment ratios. There was a further lag before the numbers in the secondary school ages levelled off or decreased. This decrease began in Thailand around 1985, and in Indonesia by the early 1990s. Success in achieving universal primary school education (though the ‘universality’ was actually only in terms of all children spending at least some time in primary school, because not all of them were completing primary school) led to an increased emphasis on raising the proportion of children being retained into junior high school and senior high school education. Figure 12 shows that over the past two decades, all the large countries of Southeast Asia have made substantial gains in raising the gross secondary school enrolment ratio to levels around the 80 per cent already achieved somewhat earlier by the Philippines. Such increases should in time assist in raising labour productivity. However, all countries of the region face issues of employability of their educated young people, and of quality issues in their education systems (see Suryadarma and Jones (eds), 2013 for a comprehensive study on Indonesian education issues). Demographic trends ensure that the working-age population in ASEAN countries will continue to grow rapidly for some time. Already, in the countries where the fertility transition has been completed, or nearly so (Singapore, Thailand, Vietnam, Indonesia, Myanmar), the high fertility ‘bulge’ has already pushed into the middle and later working ages, where numbers are growing rapidly, though numbers in the late teenages to early 30s are already roughly constant or declining (see Fig. 13). In the other Southeast Asian countries, too, the key functional group experiencing rapid growth over the 20-year period following 2010 will be the population in the middle to older working ages. Thus throughout the region, the working-age population is ageing, and its growth rate is slowing.

ARI Working Paper No. 196 Asia Research Institute ● Singapore
28
Figure 12. Trends in Secondary School Enrolment Ratio (% gross), Southeast Asian Countries
Source: World databank.
0
20
40
60
80
100
120 1
99
0
19
91
19
92
19
93
19
94
19
95
19
96
19
97
19
98
19
99
20
00
20
01
20
02
20
03
20
04
20
05
20
06
20
07
20
08
20
09
20
10
Pe
rce
nta
ge (
%)
Philippines
Vietnam
Thailand
Indonesia
Myanmar
0
20
40
60
80
100
120
19
90
19
91
19
92
19
93
19
94
19
95
19
96
19
97
19
98
19
99
20
00
20
01
20
02
20
03
20
04
20
05
20
06
20
07
20
08
20
09
20
10
Pe
rce
nta
ge (
%)
Brunei Darussalam Malaysia
Timor-Leste
Lao PDR
ARI Working Paper No. 196 Asia Research Institute ● Singapore
29
Figure 13. Index of Projected Population Growth in Different Working Age Groups 2010-2030 - UN Medium Projections
Source: United Nations Population Division, 2010, Medium Projection.
Of course, the growth of the workforce, as distinct from that of the working-age population, can be influenced by changing activity rates, especially for females. However, there appears to have been little change in female activity rates for the population aged 15-64 over the past 20 years in any of the large countries of the region, except for some decline in Thailand (see Table 7). Declines have occurred for some countries at ages 15-24, presumably because of extended schooling. In the case of Malaysia, this has been offset by a significant rise at ages 25-34. While there is little to note by way of trends, throughout the two decades Thailand, Vietnam and Myanmar have had much higher rates than Indonesia, the Philippines and Malaysia, indicating that there must be potential for the latter three countries to be making more effective use of their rapidly growing numbers of well educated women.
Table 7. Female Labour Force Participation Rates, 1990 and 2010
Country All ages 15-64 Ages 15-24 Ages 25-34 Ages 35-64
1990 2010 1990 2010 1990 2010 1990 2010
Indonesia 52 53 42 41 55 54 58 60 Malaysia 45 46 42 32 50 65 44 45 Myanmar 76 79 56 58 90 90 84 85 Philippines 49 51 40 36 53 55 56 60 Thailand 80 70 75 40 85 81 80 76 Vietnam 81 78 75 59 90 89 81 84
Source: ILO, Key Indicators of the Labour Market (http://www.ilo.org/empelm/what/WCMS_114240/lang--en/index.htm)
107.2
113.1 117.6
120.8
100.0 101.7 102.0 101.3 100.0
113.1
125.3
135.5
143.8
80
90
100
110
120
130
140
150
2010 2015 2020 2025 2030
Ind
ex
Southeast Asia
15-64
15-34
35-64
ARI Working Paper No. 196 Asia Research Institute ● Singapore
30
One implication of the changing age structure of the workforce could be worsening prospects for promotion as the ratio of older to younger workers rises. Paradoxically, though the number of younger workers is not increasing, the number of young, well educated workers is increasing rapidly because of educational expansion. In any promotion system stressing educational attainment or productivity rather than mere time on the job, such well-educated younger workers should be able to hold their own. But such promotion systems are not prevalent in the region, at least in the public sector. POLICY ISSUES During the 1970s and 1980s, fertility reduction remained a key policy aim of three of the largest countries of Southeast Asia – Indonesia, Thailand and Vietnam. Malaysia moved to a pro-natalist stance in 1982 under the leadership of Mahathir Mohammad, a pronatalism that was quietly shelved subsequently, and Philippines policy waxed and waned depending on the willingness of different administrations to take on the Catholic hierarchy over its implacable opposition to modern contraception. The two smaller Indo-Chinese countries – Cambodia and Laos PDR – took a very different stance from that of Vietnam. Although relatively high fertility rates were sources of economic and human resource development problems in both countries, the trauma of the suffering and the major population declines of the Khmer Rouge years in Cambodia, and the small population size and large land resources in Laos PDR delayed the introduction of anti-natalist policies in both countries. The 1990s saw continuing declines in fertility rates and population growth rates, not only in Southeast Asia but across the globe, a disapproval for the setting of targets for population growth and fertility that surfaced at the International Conference on Population and Development in Cairo in 1994, and lessened international attention to issues of dealing with rapid population growth. All of these factors influenced policy in Southeast Asian countries, though planners in both Thailand and Vietnam took time to adjust to the need to modify the long-established goal of fertility reduction as fertility sank below replacement level. As already noted, ASEAN’s fertility rate is now hovering barely above replacement level; its total number of births is expected to decline slightly over the coming decade. This is an ideal situation, and if fertility could be maintained at this level, the implications for development would be very positive. However, it is not likely that it can be maintained at this level. Moreover, the current level is a composite of countries with high, medium and low fertility, and fertility is much less than ideal in some of the countries. From a policy point of view, countries in the region can be grouped as follows:
Fertility too low – Singapore, Thailand
Fertility about right – Malaysia, Indonesia, Myanmar, Viet Nam, Brunei
Fertility too high – Philippines, Cambodia, Lao PDR, Timor Leste Longer-term population planning must take into account the need for fertility to settle in the general vicinity of the replacement level. Fertility much higher or much lower than this level over the longer-run is not sustainable, unless substantial migration balances (either in- or out-) are entertained; these are likely to bring their own problems. Though both the socio-economic and cultural situation is different in ASEAN from that among the economically advanced East Asian countries, Singapore and Thailand are already in danger of entering the low-level fertility trap situation (Lutz et al., 2006; Lutz, 2008) with the problems of redressing over-low fertility and its associated problems for planning. The key need is to devise policies that will support the aspirations of women to combine careers and childbearing. Educational levels of women have risen rapidly, and throughout the region,
ARI Working Paper No. 196 Asia Research Institute ● Singapore
31
educated women are bearing the brunt of family-unfriendly policies and workplaces, requiring them to make difficult decisions about their key aspirations in life. It is noteworthy that European countries with high levels of female labour force participation are among the highest-fertility countries in Europe, because they have developed a socio-economic-familial system that facilitates the raising of children while both partners are working. While Singapore and Thailand are increasingly worried about low fertility, the Philippines has reason to be concerned about its continuing relatively high fertility. Recent relatively rapid fertility declines in both Cambodia and Lao PDR are likely to leave the Philippines as the highest-fertility country in the region, except for the minnow of Timor Leste. The Philippines has high population density, serious land tenure issues, relatively high unemployment rates, high levels of poverty and inequality, and a history of sluggish economic growth. Despite some retrogression in its education system, during the Marcos years and since, it remains a basically well-educated population, providing the human resource base for development if only economic and social policy can be appropriately reformed. Happily, the past few years have seen an encouraging improvement in economic growth rates. In order to set the scene for continued economic growth, a policy to reduce fertility rates, based on widespread provision, on a voluntary basis, of a range of effective family planning methods, would seem to be an essential component of the economic and social policy ‘mix’. Yet it was only at the end of 2012 that the “Responsible Parenthood and Reproductive Health Act of 2012” was enacted after first being filed in Congress 13 years earlier. The role of the Catholic hierarchy in blocking this for so long places the Philippines in a unique position compared with the Catholic countries of Europe and Latin America, where the Church’s influence on government policy and the contraceptive practice of the population appears to have been much more limited. Even so, as Hull (2012: 46-48) and McNicoll (2006: 19) remind us, it would be inappropriate to attribute the delayed fertility decline in the Philippines solely to the influence of the Catholic church.10 Since the Cairo Conference, the reproductive health approach has drawn attention more to the individual needs of people than to demographic targets. For example, important aspects of reproductive health such as reproductive tract infections are not so directly linked to fertility. However, effective reproductive health programs, an important component of which is to meet unmet need for contraception, will certainly impact fertility. Women with unmet need for family planning are defined as sexually active women of reproductive age who desire to avoid or postpone childbearing but are not using any method of contraception. For South and Southeast Asia as a whole, unmet need has fallen from 18 per cent in 1990-95 to 11 per cent in 2000-2005. This is encouraging, but the evidence that rates of induced abortion are quite high in Southeast Asia (and not only as a result of pregnancies to unmarried women) underlines the further gains in welfare that can be made by meeting unmet need for contraception. About 28% of pregnancies in Southeast Asia end in abortion (Singh et al, 2009), and a substantial proportion of these are unsafe abortions. A further controversial issue in almost all ASEAN countries concerns the provision of contraceptive services and advice to the unmarried. With increasingly delayed marriage, large numbers of single women are in need of family planning services, and not only the teenagers who tend to be the focus of controversy over providing access to contraceptives.
10
“The Catholic Church’s stance against birth control practice and programs, often invoked to explain the sluggish Philippines fertility transition, would arguably have been powerless in the face of rapid economic growth” (McNicoll, 2006, fn. 15).
ARI Working Paper No. 196 Asia Research Institute ● Singapore
32
The projected trends in ageing in the region will need continuing attention from planners. The decline in ageing support ratios (population 20-64/population 65+) will be particularly sharp over the coming decade – from 2010 to 2020 – in Singapore, whereas in Thailand, the decade of the 2020s will see the sharpest fall in the ageing support ratios. In the 20 years between 2010 and 2030, the ageing support ratio will halve in Malaysia. At the sub-regional level, migration patterns may be creating pockets – particularly in rural areas – where the proportion of elderly is much higher. Such trends will require major adjustments of policies with regard to income support programs, orientation of health services to give much more weight to gerontology, and labour market policy, including retirement ages. It will also require a re-thinking of the underlying foundation for policies throughout the region, the belief that families can and should play the key role in supporting their elderly members. Family support for the elderly can notionally be divided into three categories: financial assistance, emotional support and physical support. The first two of these do not require co-residence, particularly in the age of the cell-phone. However, for three reasons, there will be less possibility of the family providing intensive care for disabled or frail elderly. These reasons are the lowered proportion of children per elderly person, the increased labour force participation of women (the traditional carers), and the movement of children of the elderly to other localities. These trends have major implications for policy on elder care. Despite the tradition in Asian families of caring for family members in various kinds of need, this traditional reliance on family will be subjected to intense pressures. Governments will almost inevitably be forced to step in. The care needs of the elderly should not be exaggerated. The great majority of the elderly do not need care; for example, in Thailand, more than 80 per cent of those in their 70s and even 65 per cent of those aged over 80, say that they can care for themselves (Knodel and Chayovan 2011: Table 1). The positive contributions made by the elderly in society and family, for example through taking care of grandchildren and through serving as mentors and confidants of their grandchildren as they enter adolescence, need to be recognized and supported (Knodel and Chayovan, 2011: 16-20; Ananta and Ariffin (eds), 2009; Tengku-Aizan and Nurizan, 2008). Moreover, ageing does not pose the same urgency that it does in East Asian countries. There is still time to develop effective social security systems, community programs and adaptations at the household level. Given the rising proportion of the elderly, there is a need to develop appropriate income maintenance systems (Park (ed), 2011; Asher, 2012). The key problem is that until average income in a country reaches a certain level, and until most workers are in formal sector employment, it is difficult to put in place comprehensive income support schemes. The coverage of pension schemes in the region is skewed towards urban areas and the formal sector, especially the government sector, or in other words, the better-off sections of the population, and except in Singapore and Malaysia, the schemes are mainly pay-as-you-go schemes. Thus a major section of the labour force is not covered at all (coverage is less that 30 per cent in the Philippines and Thailand; less than 20 per cent in Indonesia and Vietnam (Park and Estrada, 2011: Figure 1.11), and those covered cannot always be sure that the pension system will be able to honour its future promises. Singapore and Malaysia are the only countries in the region approaching universal coverage. Singapore has long had in place the Central Provident Fund (CPF) to which the employer and employee both contribute, and which has branched out from its earlier focus on retirement savings to a range of purposes. Contribution rates are currently 33 per cent of wages – 20 per cent from the employee and 13 per cent from the employer. The retirement replacement income of 27-30 per cent of the last pre-retirement income is well below the level recommended by the OECD. Malaysia has a somewhat similar scheme. With a rising share of the elderly in the population, all countries are looking to improve their income support schemes, but progress to date has been modest.
ARI Working Paper No. 196 Asia Research Institute ● Singapore
33
One brighter aspect of ageing in the region in the context of rising individual incomes is the possible benefit to be derived from the “second demographic dividend”. As noted by Mason and Kinugasa (2008), there are many ways in which changes in mortality and life expectancy could influence savings rates. They conclude (p. 398) that
The widespread presumption that population ageing is bad for economic growth is unwarranted. .... (For) countries that encourage capital accumulation as a means of meeting retirement needs, aging can serve as a fundamental force for creating a wealthier and more prosperous society.
In the interest of deriving maximum benefit from the demographic dividend, the ASEAN countries need to be devoting more resources to the education and health sectors. In competition with the giants of Asia – China and India – ASEAN has to raise the quality of its human capital, and attention is needed at all levels of the education system. In the health sector, too, levels of infant and maternal mortality are still high in some ASEAN member states. There are two issues here: first, whether a sufficient share of budgetary resources are being devoted to education and health, and second, whether ways can be found to make more effective use of these resources. There are many problematic aspects of international migration in the region, and an urgent need for a regional agreement dealing with such issues. With regard to labour migration, there are underlying push and pull factors that policy must take into account. The wealthier Southeast Asian countries will inevitably be a magnet, as will wealthier countries outside the region – Japan, South Korea and Taiwan, not to mention the Gulf States, Europe and the USA. The middle-income countries of the region - Malaysia and Thailand – are both experiencing in and out movements, but the net effect of migration patterns in both countries is to lower their average level of human capital.11 Malaysia has introduced policies to attract back skilled emigrants, but the variety of reasons for their emigration in the first place, in many cases related as much to dissatisfaction with ethnic policies in Malaysia as to purely economic considerations, suggests that such policies may face an uphill task. Malaysia and Thailand face important issues regarding the provision of education for the children of undocumented migrants. All Southeast Asian countries need policies to prevent abuse of domestic workers, many of whom are international migrants. Greater labour mobility in the region, guided by appropriate laws and regulations, could be of benefit to all countries (Chia 2008). Remittances are very important for the economies of the major migrant-sending counties, especially the Philippines but also Indonesia, Myanmar, Cambodia and Laos. Policies to facilitate the utilization of remittances for productive purposes need to be prioritized. With regard to the continuing urbanization of Southeast Asia, and the appropriate stance to adopt toward the growth of mega-urban regions, urban planners in the region will need to ponder a World Bank study (World Bank 2009) which makes the case for a positive view of urban agglomeration, arguing that spatial concentration of economic activity rises with development, and that governments should not resist it by seeking to target investment and policy attention to the lagging areas of their countries. Instead they should adopt a neutral stance on the location of development activities, but make judicious investments in transport and communications which will enable disadvantaged areas to become connected to the centres of growth. “The challenge for government is to allow – even encourage – “unbalanced” economic growth, and yet to ensure inclusive
11
For example, while comprehensive data are not available, the average educational level of emigrants from Malaysia is very high (see Hugo, 2011), while most of those moving in permanently – for example, from Indonesia and the Philippines to Sabah - have much lower educational levels.

ARI Working Paper No. 196 Asia Research Institute ● Singapore
34
development” (p. 20) through a “well-calibrated blend of institutions, infrastructure and interventions” (p. 6). Montgomery (2009), in a review of the World Bank study, makes the point that the World Bank report may be overly optimistic about some of the benefits of spatial concentration. He argues that in poor countries, inadequate urban management and governance may prevent firms from reaping scale economies of metropolitan location when the public sector cannot provide them with adequate and reliable supplies of electricity and water, and when the urban transport system is ill-managed, congested and chaotic. His point is well taken, but more in relation to the poorest countries than to most of the Southeast Asian countries, which are experiencing rapid and sustained economic growth. Intermediate cities are now tending to grow more rapidly than the largest cities (though this is not always the case when compared with appropriate urban agglomeration populations for these large cities); but planning for intermediate cities certainly receives less attention. In both Indonesia and the Philippines, regional autonomy means that the planning mechanism for intermediate cities needs to integrate national-level planning, dealing with the overall planning design for the nation’s urban areas, with local-level planning that takes into account particular circumstances and the resources available at the local level. As for the mega-urban regions (Jakarta and Manila in particular), there is an urgent need for planning mechanisms that enable the interests of a range of administrations (national, provincial, district and sub-district) to be balanced in planning for these highly populous regions that cut across different administrative jurisdictions. CONCLUSION The changing population of Southeast Asia is a topic that should fascinate, because of the diversity of situations, as well as challenge, because population dynamics are intimately involved in the issues of development planning for the sake of improving the well-being of the populations concerned. The diversity is well illustrated by the fertility rate. The overall ASEAN fertility rate happens to be ideal. And indeed about half of the ASEAN countries share this ideal fertility level, and therefore do not need specifically anti-natalist or pro-natalist measures at this time. But some do – most notably the Philippines (anti-natalist) and Singapore (pro-natalist). When we broaden the discussion from fertility policy to reproductive health policy, none of the ASEAN countries can be fully satisfied with their situation, because none of them can claim that their populations have access to a varied mix of contraceptive services, adequate counselling (especially for adolescents and the unmarried), and adequate reproductive health services. And while the region has made great gains in lowering mortality rates, both infant and maternal mortality remain a serious concern in some countries. The concern about rapid population growth of a few decades ago has been replaced by a sanguine attitude to population trends, based on the evidence that fertility has fallen everywhere in the region and is likely to fall further. Nevertheless, we cannot be certain how low fertility is likely to go in countries such as Vietnam and Malaysia, and in the largest country of the region – Indonesia – fertility has fallen only marginally over the past decade and remains above replacement level. Nevertheless, the odds are on further fertility declines, and a decade from now, other countries may be joining Singapore and Thailand in searching for policies to raise fertility rates. In a world of low population growth in Southeast Asia, greater attention is likely to be given to migration, both internal and international. Internal migration will continue to redistribute population from rural to urban areas, and from regions of lesser to greater economic opportunity. International migration, likewise, will be directed towards the more favoured countries of the region, be it in the form of temporary labour migration (skilled or unskilled), undocumented movements, or marriage

ARI Working Paper No. 196 Asia Research Institute ● Singapore
35
migration. Ethnic heterogeneity of countries or sub-national areas is likely to be increased by such migratory movements. Finally, the conventional wisdom in many quarters is that the emerging giants of the 21st century are China and India. Southeast Asia lacks a ‘giant’, and even if ASEAN succeeds in giving these countries some demographic ballast in the geo-political sphere, it will still remain subsidiary to the main game. In terms of the demographic bonus, though, Southeast Asia is in a strong position relative to both China (which faces a declining labour force and rapid ageing) and India (where continuing labour force growth cannot be fully utilized for development because of deficiencies in its education system and hence failure to build its human capital base). If Southeast Asia can capitalize on its advantages, it can well play an important role in the “Asian century”.
ARI Working Paper No. 196 Asia Research Institute ● Singapore
36
BIBLIOGRAPHY Ananta, Aris and Evi Nurvidya Ariffin, 2009, Older Persons in Southeast Asia: An Emerging Asset,
Singapore: Institute of Southeast Asian Studies. Asher, M. K., 2012, “Social pensions for the elderly in Asia: fiscal costs and financing methods”, in
S.W. Handayani and B. Babajanian (eds), Social Protection for older Persons: Social Pensions in Asia, Manila: Asian Development Bank.
Bloom, David E., David Canning and Jaypee Sevilla, 2003, The Demographic Dividend: a New
Perspective on the Economic Consequences of Change, Santa Monica: The RAND Corporation. Bongaarts, John, 1997, “The role of family planning programmes in contemporary fertility
transitions”, in Gavin W. Jones et al. (eds), The Continuing Demographic Transition, Oxford: Clarendon Press.
Bryant, John, 2007, “Theories of fertility decline and the evidence from development indicators”,
Population and Development Review, 33(1): 101-127. Chia Siow Yue, 2008, “Demographic change and international labour mobility in Southeast Asia:
issues, policies and implications for cooperation”, in Graeme Hugo and Soogil Young (eds), Labour Mobility in the Asia-Pacific Region: Dynamics, Issues and a New APEC Agenda, Singapore: Institute of Southeast Asian Studies.
Desbarats, Jacqueline, 1987, “Population redistribution in the Socialist Republic of Vietnam”,
Population and Development Review, 13(1): 43-76. Doeppers, Daniel F. and Peter Xenos (eds), 1998, Population and History: The Demographic Origins
of the Modern Philippines, Monograph No. 16, Center for Southeast Asian Studies, University of Wisconsin.
Economist Intelligence Unit, 1998, Myanmar Country Profile, London. Hannum, Emily and Claudia Buchmann, 2005, “Global educational expansion and socio-economic
development: An assessment of findings from the social sciences”, World Development, 33(3): 333-354.
Hardjono, J., 1989, “The Indonesian transmigration program in historical perspective”, International
Migration, 26: 427-439. Henley, David, 2005, “Population and the means of subsistence: explaining the historical
demography of island Southeast Asia, with particular reference to Sulawesi”, Journal of Southeast Asian Studies, 36: 337-372.
Hirschman, Charles and Sabrina Bonaparte, 2012, “Population and society in Southeast Asia: a
historical perspective” in Lindy Williams and Michael Philip Guest (eds), Demographic Change in Southeast Asia: Recent Histories and Future Directions, Ithaca: Cornell Southeast Asia Program Publications.
ARI Working Paper No. 196 Asia Research Institute ● Singapore
37
Hirschman, Charles and Yih-Jin Young, “Social context and fertility decline in Southeast Asia: 1968-70 to 1988-90, in C.Y. Cyrus Chu and Ronald Lee (eds), Population and Economic Change in East Asia, supplement to Population and Development Review, Vol. 26, 2000.
Hugo, Graeme, 2012, “Changing patterns of population mobility in Southeast Asia”, in Lindy Williams
and Michael Philip Guest (eds), Demographic Change in Southeast Asia: Recent Histories and Future Directions, Ithaca: Cornell Southeast Asia Program Publications.
Hugo, Graeme, Terence Hull, Valerie Hill and Gavin Jones, 1987, The Demographic Dimension in
Indonesian Development, Kuala Lumpur: Oxford University Press. Hull, Terence H and Velerie J. Hull, 1997, “Politics, culture and fertility trensitions in Indonesia” in
Gavin Jones, Robert Douglas, John C. Caldwell, and Rennie D’Souza (eds), The Continuing Demographic Transition, Oxford: Clarendon Press.
Hull, Terence H., 2012, “Fertility in Southeast Asia” in Lindy Williams and Michael Philip Guest (eds),
Demographic Change in Southeast Asia: Recent Histories and Future Directions, Ithaca: Cornell Southeast Asia Program Publications.
Jones, Gavin W., 1990, “Fertility transitions among Malay populations of Southeast Asia: puzzles of
interpretation”, Population and Development Review, 16(3): 507-537. Jones, Gavin W., 2004, “Urbanization trends in Asia: the conceptual and definitional challenges”, in
Tony Champion and Graeme Hugo (eds), New Forms of Urbanization, Hampshire: Ashgate Publishing: 113-132.
Jones, Gavin W., 2007, “Fertility decline in Asia: the role of marriage change”, Asia-Pacific Population
Journal, 22(2): 13-32. Jones, Gavin W., 2012, “International marriage in Asia: What do we know, and what do we need to
know?” in Doo-Sub Kim (ed), Cross-Border Marriage : Global Trends and Diversity, Seoul: KIHASA.
Jones, Gavin W. and Mike Douglass, 2008, Mega Urban Regions in Pacific Asia: Urban Dynamics in a
Global Era, Singapore: NUS Press. Jones, Gavin W. and Wassana Im-Em (eds), 2011, Impact of Demographic Change in Thailand,
Bangkok, NESDB and UNFPA. Knodel, John and Chanpen Saengtienchai, 2007, “Rural parents with urban children: social and
economic implications of migration on the rural elderly in Thailand”, Population, Space and Place, 13(3): 193-210.
Knodel, John and Napaporn Chayovan, 2011, “Intergenerational family care for and by older people
in Thailand”, paper presented in Conference on Shifting Boundaries of Care Provision in Asia: Policy and Practice Changes, Asia Research Institute, National University of Singapore, 14-15 March.
Knodel, John, Apichat Chamratrithirong and Nibhon Debavalya, 1987, Thailand’s Reproductive
Revolution: Rapid Fertility Decline in a third World Setting, Madison, Wisconsin: University of Wisconsin Press.
ARI Working Paper No. 196 Asia Research Institute ● Singapore
38
Lutz, Wolfgang, 2008, “Has Korea’s fertility reached the bottom? The hypothesis of a “low fertility trap” in parts of Europe and East Asia”, Asian Population Studies, 4(1): 1-4.
Lutz, Wolfgang, 2009. “Sola schola et sanitate: human capital as the root cause and priority for
international development?” Phil. Trans. R. Soc B, 364: 3031-3047. Lutz, Wolfgang, V. Skirbekk and M.R. Testa, 2006, “The low fertility trap hypothesis: forces that may
lead to further postponement and fewer births in Europe”, in D. Philipov, A.C. Liefbroer and F.C. Billari (eds), Vienna Yearbook of Population Research, Vienna.
Mason, Andrew and Tomoko Kinugasa, 2008, “East Asian economic development: two demographic
dividends”, Journal of Asian Economics, 19: 389-399. McGee, T.G., 1967, The Southeast Asian City: A Social Geography of the Primate Cities of Southeast
Asia, Bell: London. McNicoll, Geoffrey, 2006, “Policy lessons of the East Asian demographic transition”, Population and
Development Review, 32(1): 1-25. Ministry of Health, Union of Myanmar, and UNFPA, 1999, A Reproductive Health Needs Assessment
in Myanmar, Yangon. Montgomery, Mark R., review of World Bank, World Development Report 2009, in Population and
Development Review, 35(1): 197-199. Nitisastro, Widjojo, 1970, Population Trends in Indonesia, Ithaca: Cornell University Press. Owen, Norman, 1987, “The paradox of nineteenth-century population growth in Southeast Asia:
evidence from Java and the Philippines”, Journal of Southeast Asian Studies, 18: 45-57. Park, Donghyung (ed), 2011, Pension System and Old Age Income Support in East and Southeast Asia,
Oxon: Routledge. Peper, Bram, 1970, “Population Growth in Java in the Nineteenth Century”, Population Studies, 24:
71-84. Phillips, James F. and John A. Ross, 1992, Family Planning Programmes and Fertility, Oxford: Oxford
University Press. Pritchett, L. H., 1994, “Desired fertility and the impact of population policies”, Population and
Development Review, 20(1): 1-55. Reid, Anthony, 1987,”Low population growth and its causes in pre-colonial Southeast Asia, in
Norman G. Owen (ed), Death and Disease in Southeast Asia: Explorations in Social, Medical, and Demographic History, Singapore: Oxford University Press.
Robinson, Warren C. And John A. Ross (eds), 2007, The Global Family Planning Revolution: Three
Decades of Population Policies and Programs, Washington, D.C.: The World Bank.
ARI Working Paper No. 196 Asia Research Institute ● Singapore
39
Scherbov, S., W. Lutz and W.C. Sanderson, “The uncertain timing of reaching 8 billion, peak world population and other demographic milestones”, Population and Development Review, 37(3): 571-578.
Suryadarma, Daniel and Gavin Jones (eds), 2013, The State of Education in Indonesia, Singapore:
Institute of Southeast Asian Studies. Suryadinata, Leo, Evi Nurvidya Arifin and Aris Ananta, 2003, Indonesia’s Population: Ethnicity and
Religion in a Changing Political Landscape, Singapore: Institute of Southeast Asian Studies. Tengku-Aizan, H. and Y. Nurizan, 2008, “National policy for the elderly in Malaysia: achievements
and challenges”, in H.G. Lee (ed), Ageing in Southeast and East Asia: Family, Social Protection and Policy Challenges, Singapore: Institute of Southeast Asian Studies.
United Nations Population Division, 2010, World Population Prospects: the 2010 Revision, New York:
United Nations. United Nations Population Division, 2009, World Urbanization Prospects: The 2009 Revision, New
York: United Nations. United Nations Working Group, 1998, Human Development in Myanmar, Yangon: United Nations. UNFPA, UNICEF, WHO, World Bank, 2012, Trends in Maternal Mortality 1990 to 2010, New York:
United Nations. Van Landingham, Mark and Charles Hirschman, 2001, “Population pressure and fertility in pre-
transition Thailand”, Population Studies, 55: 233-248. Williams, Lindy and Michael Philip Guest (eds), 2012, Demographic Change in Southeast Asia: Recent
Histories and Future Directions, Ithaca: Cornell Southeast Asia Studies Program. World Bank, 2009, World Development Report 2009: Reshaping Economic Geography, Washington,
D.C.: World Bank. Zelinsky, Wilbur, 1950, “The Indochinese Peninsula: a demographic anomaly”, Far Eastern Quarterly,
9: 115-145.