the population ta»of hong ko - cicred · the population of hong kong » • • fan shuh ching...
TRANSCRIPT

World Population Year
P
ta»THE POPULATION
OFHONG KO

THE POPULATION OF HONG KONG
» • •
Fan Shuh Ching
Department of StatisticsUniversity of Hong Kong
The Committee for International Coordination
of National Research in Demography


PREFACE
The Committee for International Coordination ofNational Research in Demography (C.I.C.R.E.D.) initiatedtwo years ago a programme to have for the World PopulationYear 1974 a series of monographs giving for each country,following a common plan, information on past, present andfuture trends of population. This monograph on the Popu-lation of Hong Kong has been prepared at the invitation ofC.I.C.R.E.D. I wish to take this opportunity to express mysincere gratitude to C.I.C.R.E.D. for its financial assistanceand to Mr. Jean Bourgeois-Pichat, Chairman ofC.I.C.R.E.D.,for his guidance and encouragement in connection with thepreparation of this monograph.
FAN Shuh ChingDepartment of StatisticsUniversity of Hong Kong
December 21,1974.

TABLE OF CONTENTS
Chapter
1
2
3
4
5
6
Population Growth
Components of Growth
Population Composition
Population Distribution
The Labour Force
Population Projections
Page
1
3
12
22
29
37


CHAPTER 1
POPULATION GROWTH
Hong Kong, which comprises the Island of Hong Kong, Kowloon, the NewTerritories and over 200 neighboring islands, lies on the southeast coast of theChinese province of Kwangtung. The Island of Hong Kong, with an area of 29square miles, was ceded to the United Kingdom under the Treaty of Nanking in1842. Kowloon and the Stonecutters Island, with an area of about four squaremiles, were ceded to the United Kingdom under the Convention of Peking in1860. The New Territories, 370 square miles in area, were leased to Britain for99 years in 1898.
The first population figure of Hong Kong Island was reported in theGovernment Gazette of May 15, 1841 to be 7,450 persons. The list ofdistribution included, among other small villages, 2,000 inhabitants at Chek-chu,1,200 at Soo ke-wan, 2,000 in the boats, 800 in the bazaar, and 300 labourersfrom Kowlung/1) No other details regarding the population were given.Population increased rapidly as foreign merchants and Chinese labourers movedin. A Registration Ordinance was introduced by the Government in 1844 toregister all the inhabitants and to check the influx of undesirable elements. ByJune 1845, the population was estimated to be 23,817.^
The Tai Ping War which broke out in the southern part of China in theearly 1850's pushed large number of refugees into Hong Kong. The growth ofpopulation continued and the total was 86,941 by 1859.
The 1861 total population, which included inhabitants in Kowloon, roseto 119,320, of whom 116,335 were Chinese. In the following decade, a mfldcommercial recession set in and halted the steady population increase. Thepopulation increased only by 2,665 to 121,985 by 1972.
From 1881 onwards, a serial of decennial population censuses were takenin Hong Kong/3) The population further increased from 160,402 in 1881 to221,441 in 1891 and further to 283,905 in 1901. In addition, the NewTerritories were estimated to have over 100,000 inhabitants.
In the first three decades of the twentieth century, Hong Kong'spopulation continued to grow rapidly. The total population rose from 456,739in 1911 to 840,473 in 1931, showing an increase of 84 per cent in these twentyyears.
(1) The present names for Chek-chu, Soo-ke-wan, and Kowlung are Stanley, Shaukiwan,and Kowloon, respectively.
(2) Including 595 Europeans, 362 Indians, and 300 visitors.(3) Between 1881 and the Second World War, population censuses were carried out in
1881, 1891, 1897, 1901, 1906,1911, 1921 and 1931 in Hong Kong.

The unsettled and difficult conditions caused by the Japanese invasion ofChina in the late 1930's sent large number of refugees into Hong Kong. It wasestimated in 1941 that the total population was at l,640,000/4^ nearly doubledthe 1931 total figure.
Hong Kong was occupied by Japan between December 1941 and August1945 during the Second World War. Under the Japanese occupation, large-scaledeportations of inhabitants were carried out to solve the food shortage problem.At the end of the war the population was estimated to be only 600,000. Peoplesoon returned home after the war and the population estimate exceeded thepre-war peak to reach 1,800,000 at the end of 1947. Large inflow of peoplestreamed into Hong Kong as the civil war in China broke out in the late 1940's.In 1949, the population of Hong Kong was assessed to be around 1,860,000.Estimates for subsequent three or four years fluctuated between 2,000,000 and2,250,000. The population further expanded to exceed the two and one-halfmillion mark in 1956 and the three million mark in 1960.
The first post-war population census carried out in March 1961 returned afigure of 3,129,648 for Hong Kong's total population. The by-census undertakenin 1966 gave an estimated total of 3,716,400. The second post-war populationcensus completed in March 1971 recorded a total of 3,936,630 inhabitants. Atmid-1974, the population size was estimated to be very close to 4.25 million.
Table 1.1
Year
1872 (December 1)1881 (April 3)1891 (May 20)1901 (January 20)1911 (May 20)1921 (April 24)1931 (March?)1961 (March 7)1971 (March 9)
Population Growth of Hong(1872-1971)
Total Population
121,985160,402221,441368,987456,739625,166840,473
3,129,6483,936,630
Kong
Annual Growth Rate (%)
3.1%3.3%2.5%2.2%3.1%3.0%4.5%2.3%
Notes: (1) Figures prior to' 1901 excluded New Territories.(2) The date shown within brackets was the census date of that year.(3) The annual growth rate between 1891 and 1901 was computed from the
population totals, excluding residents of New Territories, of the two years.
Source: The Census Reports of various years.
(4) This figure was reported by an unofficial census carried out by Air Raid Wardens in10411941.

CHAPTER 2
COMPONENTS OF GROWTH
The growth of a population is influenced by two factors: natural increaseand migration. Migration was the major factor contributing to the growth ofHong Kong's population in the nineteenth century and in the first part of thetwentieth century. Chinese inhabitants were allowed free entry into Hong Konguntil April 1949 when immigrant controls had to be introduced due to the largeinflow of immigrants into Hong Kong caused by the change of Government inChina. Natural increase gained increasing importance in Hong Kong's populationgrowth in the post-war period. In the 1950's natural increase accounted forabout sixty per cent of the population increase. In recent years, its contributiontowards the growth of population rose to nearly eighty per cent.
Table 2.1 Components of Population Growth(1948 - 1973)
„ . , Estimated Population . . . . . Estimated MigiationalPeriod * Natural Increase , 6
Increase Increase1948 - 19531954 19581959 - 19631964 - 19681969 - 1973
528,000614,500545,200370,600371,000
272,344377,455452,934380,955290,560
255,656237,04592,266-10,355•> 80,440
Note: In estimating the population increase, end-year population figures were firstcomputed by averaging the mid-year estimates of two consecutive years. Theestimated migrational increase was the difference between the estimated populationincrease and the natural increase.
Source: Hong Kong Statistics 1947-1967, and Hong Kong Monthly Digest of Statistics,various issues.
FertilityThe number of live births was below 50,000 a year in the first few
post-war years. The number of babies born each year in the late 1950's doubledthe number a decade ago. The annual number of live births fluctuated between102,000 and 116,000 in the first half of the 1960's. The number has declined toaround 80,000 a year in recent years. The crude birth rate rose from 27 perthousand in 1950 to a peak of 37.4 per thousand in 1958 and then started to

decline to below 30 per thousand in 1965 and further to below 20 per thousandin 1971.
Table 2.2 Number of Live Births and Crude Birth Rate(1948 - 1973)
Year
1948 - 19531954 - 19581959 - 19631964 - 1968
19691970197119721973
Annual Live Births
47,475 - 75,54483,317 - 106,624
104,579-115,26382,992 - 108,519
79,32977,46576,81879,05380,147
Crude Biith Rate pet 1,000 persons
26.4 - 33.735.2 - 37.432.9 - 37.021.7 - 30.7
21.420.019.719.719.8
Source: Hong Kong Statistics 1947-1967, and Hong Kong Monthly Digest of Statistics,various issues.
It was reported that to a very large extent the rapid decline in HongKong's crude birth rate from 35.5 per thousand in 1961 to 28.8 per thousand in1965 could be attributed to "the relative decline in the number of young womenof childbearing years" and 'a decline in the proportion of women marriedespecially at the fertile ages 20-24"/^ However, the further decline between1966 and 1968 was believed to be largely due to genuine declines in maritalfertility and not due to changes in age or sex distribution.
Between 1961 and 1966, the number of women aged between 15 and 19rose from 80,000 to 181,000. Their percentage in the total population nearlydoubled from 2.5 to 4.9 per cent. The number of women 20-24 years of ageremained quite stable at over 90,000. Women in age groups 25-29 and 30-34recorded a reduction of 6 to 20 per cent between 1961 and 1966. The numberof women in older age groups rose by 10 to 15 per cent. The large increase in thenumber of women aged 15 to 19 compensated the reduction in the number ofwomen aged 25 to 34 in the period. Though the proportion of women aged 15to 49 in the population remained at 22 per cent in 1961 and 1966, one couldexpect the birth rates to have fallen as there were fewer women in the primechild-bearing years even if the age-specific fertility rates remained constant/2 ̂
Considerably smaller proportion of women in age groups 15-19 and 20-24were married in 1966 and 1971 than in 1961. Slightly higher percentages ofmarried women in older age groups above 30 were recorded in 1971 whencompared with the 1961 proportions. It was noted that the tendency for asmaller proportion of the women 15-24 to be married might continue anddecrease further for a few more years as "marriage squeeze"(3) might set in.
(1) R. Freedman and A.L. Adlakha, "Recent Fertility Decline in Hong Kong: the Role ofthe Changing Age Structure", Population Studies, Volume 22, No. 2, July 1968, p.182.
(2) Age and sex distribution of the population will be discussed in detail in Chapter 3.(3) R. Freedman, D.N. Namboothiri, A. Adlakha and K.C. Chan, "Hong Kong: The
Continuing Fertility Decline, 1967", Studies in Family Planning, No. 44, 1969, p. 11.

Table 2.3
Age-Group
15 - 1 920-2425-2930-3435-3940-4445-49
15-49
Proportions of Currently MarriedWomen in Childbearing Age
(Percentage)
1961
6.451.083.491.490.084.575.5
72.0
1966
4.642.785.292.493.189.793.8
66.5
1971
2.932.379.493.495.192.989.1
59.6
Source: The 1961 Census Report, 1966 By-Census Report, and 1971 Census Report ofHong Kong.
Between 1961 and 1965, the decreases in fertility rates were only noticedfor women in their later part of fertile ages. Women of below 30 years of age hadin fact higher rate in 1965 than those in 1961. Between 1965 and 1968, fertilityrates fell for all age groups between 15 and 49, but sharp declines were foundin the younger childbearing ages 20-35. The marked declines in fertility in theyounger ages are "likely to have long-term effects and to be cumulative in theirimpact."(4)
Table 2.4
Age-Group
15-1920-2425 -2930-3435-3940-4445-49
15-1920-2425-2930-3435-3940-4445-49
Estimated Age-Specific Fertility Rate;
1961
4723831323113957
9
7344673752531546712
Source: R. Freedman, "Hong1970, pp. 9-10.
1965
41252318211122393
(per820568375229132444
Kong Fertility
1966
(per 1000 women)29
21329120311142
3
s
1967
2917826820112340
6
1000 married women)632499342219119464
Decline 1961-1968"
68543331321713156
7
', Population
1968
27158234170102
362
714402273183108392
Index, 36,
(4) R. Freedman et al., op. cit., p. 9.

A number of Hong Kong parents are still having large families. Accordingto the 1961 Census data, among the 738,000 ever-married women 14 per centhad no child still living, 56 per cent had one to three living children, 20 per centhad four to five living children, and slightly less than 10 per cent had more thanfive living children. In 1971,71,000 of the 880,000 ever-married women aged 15years and over had no children. Forty-four per cent of married women at ages15-19 and over one-quarter of married women at ages 20-24 had not given birth.Of the 329,000 ever-married women aged 50 and over, only eight per cent hadnever given birth. Half of the married women had one to three children, andnearly one-quarter gave birth to four or five children. Of the 149,000 marriedwomen who had more than five children, forty-four per cent were in the agegroup 40-49 and thirty-six per cent aged 50 years and over. More than 10,000married women gave birth to nine children and a similar number of women hadten children or more/5 ̂
Table 2.5 Distribution of Ever-MarriedWomen by Number of Children Born
Number of Children*
0123456789
10 and over
Total
1961
99.0161.5144.2114.990.460.736.117.98.33.22.4
738.6
1971
71.2149.8159.4137.3121.092.265.139.622.510.810.7
879.6
* The number of children refers to the number of living children in the 1961 Census andrefers to the number of children born in the 1971 Census.
Source: The 1961 Census Report and the 1971 Census Report of Hong Kong.
MortalityThe number of the deaths fluctuated mostly between 18,000 and 21,000
in the 1950's and the 1960's. In 1972 and 1973, the number of deaths increasedslightly to over 21,000. This is probably because a larger proportion of thepopulation entered the older age of over 60. The crude death rate has beendeclined from 10 per 1,000 persons to around 5 per 1,000 persons in recentyears. The infant mortality rate fell drastically from 100 per 1,000 live births inthe post-war period to below 20 per 1,000 live births in the 1970's. This declinein infant mortality was to a large extent attributable to the reduction of certainpreventable diseases including pneumonia, gastro-enteritis, and tuberculosis.
(5) No direct comparison can be applied to the figures mentioned in this paragraph for1961 and for 1971. This is because in the 1961 Census information was collected onthe number of children still living, while in the 1971 Census information wascollected on the number of children born.

Table 2.6 Number of Deaths, Crude Death Rateand Infant Mortality Rate
(1948 - 1973)
_, » , TN .i. Crude Death Rate Infant Mortality RateYear Annual Deaths , . . . , . „ . . . .
per 1,000 persons per 1,000 births
1948 - 19531954 - 19581959 - 19631964 - 1968
19691970197119721973
13,434 - 20,58019,080 - 20,55418,738 - 20,32417,621 - 19,644
18,73020,76320,25321,14521,360
8 - 1 07 - 86 - 7
5.0 - 5.45.05.15.05.25.1
74 - 10054-7233-48
22.8 - 25.821.819.618.417.516.8
Source: Hong Kong Statistics 1947-1967, and Hong Kong Monthly Digest of Statistics,various issues..
The decline of mortality in the 1960's appeared in all age groups and inboth sexes. The mortality rate fell more rapidly in the age groups below tenyears old. In 1971 the age-specific mortality rates were less than one per 1,000males in the four quinquennial groups between 5-9 and 20-24 and less than oneper 1,000 females in the six quiquennial groups between 1-4 and 25-29. Theage-specific mortality rates were lower for females than for males in all agegroups, and the differences between the two sexes were wider in age groups over25. For the two groups between 55 and 64 years the female mortality rates wereless than half of the rates for males.
Table 2.7
Age-Group
01 - 45 - 9
10-1415-1920-2425-2930-3435-3940-4445-4950-5455-5960-64
65 and over
Age-Specific Death Rates(per 1,000 persons)
1961
Males
40.64.41.00.70.81.31.62.23.04.87.4
14.119.838.272.8
Females
34.54.40.80.50.70.81.31.62.23.14.27.09.1
15.541.6
Males
21.01.00.40.40.60.91.51.92.64.16.1
10.417.829.163.6
1971
Females
15.50.80.30.30.40.60.71.01.52.23.35.57.9
11.841.0
Source: Abridged from Table 92 of Country Monograph Series No. 1 — Population ofHong Kong, published by ESCAP, U.N., 1974.

The major causes of death changed considerably in the post-war period. In1951 infective and parasitic causes, respiratory system and digestic systemdiseases were the important causes of death. These causes of death togetheraccounted for two-thirds of all the deaths in 1951. Deaths from the above causesdecreased continuously in the past two decades and in 1971 less than one-thirdof the deaths were caused by these diseases. On the other hand, neoplasms,nervous and circulatory system diseases took more human Uves away from HongKong in recent years. Deaths from neoplasms, nervous and circulatory systemdiseases rose from 12 per cent of all deaths in 1951 to 47 per cent in 1971.
Table 2.8 Distribution of Deaths by Cause
Cause of Death
-Infective and parasiticNeoplasmsNervous and circulatory systemRespiratory systemDigestive systemCongenital anomalies and perinatal mortalityIll-defined causesAccidents, poisonings and violenceOthers
Total number of deaths
1951 1961
(in percentages)23.64.27.9
27.415.08.56.73.82.9
20,580
15.312.319.014.87.7
11.110.45.93.5
18,738
1971
7.221.026.116.65.14.58.87.13.6
20,253
Source: Annual Report of the Director of Medical and Health Services, 1964-65, and HongKong Monthly Digest of Statistics, July 1974.
Migration
Of the 3.13 million persons who lived in Hong Kong in March 1961,1.49million or 48 per cent were born in Hong Kong, and 1.64 million or 52 per centwere migrants. About half of the migrants moved to Hong Kong beforeSeptember 1949, 28 per cent between September 1949 and Mareh 1955 and 22per cent between March 1955 and March 1961.
Ninety-seven per cent of the children aged 0-4 and 88 per cent of thechildren aged 5-9 in 1961 were locally born. The proportion of locally borngroup reduced to 68 per cent and 44 per cent respectively for age groups 10-14and 15-19. For the age groups between 20 and 40, from 65 to 84 per cent of thepopulation were migrants. For age groups over 40 years, the proportion ofmigrants fluctuated between 85 and 89 per cent. Two-thirds of the migrantsmoved to Hong Kong before September 1949 were in the age groups between 25and 49 in 1961, and more than half of the migrants after September 1949 wereof the age between 15 and 39. This could be interpreted to mean that moremigrants were aged between 15 and 35 at the time of migrating to Hong Kong.

Table 2.9 The Age Distribution of the Immigrant Population(At March 1961)
Age Groups
0 - 45 - 9
10-1415-1920-2425-2930-3435-3940-4445-4950-5455-5960-6465-69
70 and over
Total
Before Sept. 1949
00
13,40726,81436,09283,289
119,273121,861114,88598,42472,87049,45634,24621,07324,090
815,780
Immigrant Population
After Sept. 1949
15,69452,29898,91964,85896,460
107,64995,31774,92858,24746,48735,18026,95822.01015,39516,822
827,222
Total
15,69452,298
112,32691,672
132,552190,938214,590196,789173,132144,911108,05076,41456,25636,46840,912
1,643,002
Source: The 1961 Census Report of Hong Kong, Volume 2, Appendix XXIV.
During the ten-year period between 1961 and 1971, it was noted thatabout 2,000 to 6,000 Chinese people were granted entry permits each year. Thenet gain in the number of natives of Kwangtung Province admitted to Hong Kongreduced from over 10,000 in the early 196O's to only a few hundred in recentyears/6^ The net gain in the number of resident aliens when compared with thatof the preceding year varied between 350 and 3,400 with a net loss of over4,000 for the year of 1968. According to these figures, a net balance of over100,000 legal migrants were added to the Hong Kong population for the period1961-1971.
(6) The Kwangtung Province natives, who were admitted to Hong Kong under theimmigration quota system, should hold exit and re-entry permits issued by China.
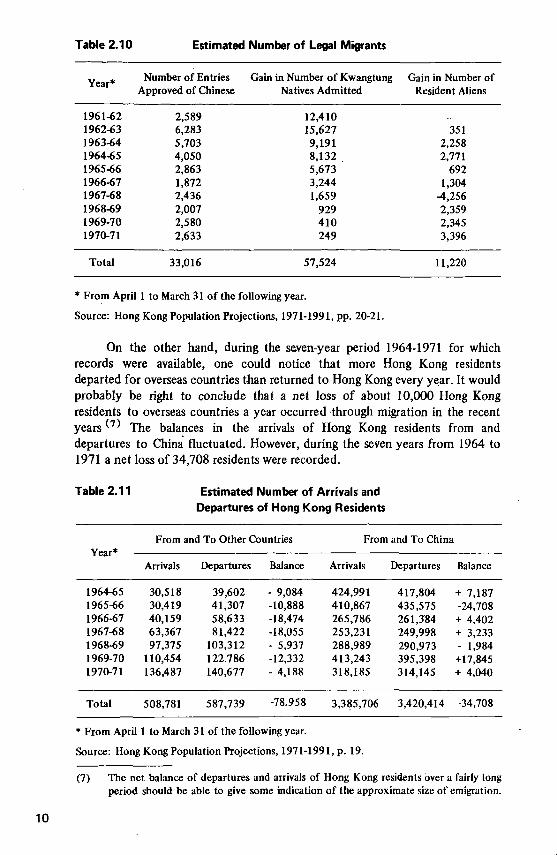
Table 2.10 Estimated Number of Legal Migrants
Vpor*
1961-621962-631963-641964-651965-661966-671967-681968-691969-701970-71
Total
Number of EntriesApproved of Chinese
2,5896,2835,7034,0502,8631,8722,4362,0072,5802,633
33,016
Gain in Number of KwangtungNatives Admitted
12,41015,6279,1918,1325,6733,2441,659
929410249
57,524
Gain in Number ofResident Aliens
_
3512,2582,771
6921,304
4,2562,3592,3453,396
11,220
* From April 1 to March 31 of the following year.
Source: Hong Kong Population Projections, 1971-1991, pp. 20-21.
On the other hand, during the seven-year period 1964-1971 for whichrecords were available, one could notice that more Hong Kong residentsdeparted for overseas countries than returned to Hong Kong every year. It wouldprobably be right to conclude that a net loss of about 10,000 Hong Kongresidents to overseas countries a year occurred through migration in the recentyears ^ The balances in the arrivals of Hong Kong residents from anddepartures to China fluctuated. However, during the seven years from 1964 to1971 a net loss of 34,708 residents were recorded.
Table 2.11
Year*
1964-651965-661966-671967-681968-691969-701970-71
Total
* From April
EstimatedDepartures
Number of,Arrivals andof Hong Kong Residents
From and To Other Countries
Arrivals
30,51830,41940,15963,36797,375
110,454136,487
508,781
1 to March
Departures
39,60241,30758,63381,422
103,312122.786140,677
587,739
Balance
- 9,084-10,888-18,474-18,055- 5,937-12,332- 4,188
-78.958
31 of the following year.
From
Arrivals
424,991410,867265,786253,231288,989413,243318,185
3,385,706
Source: Hong Kong Population Projections, 1971-1991, p. 19.
and To China
Departures
417,804435,575261,384249,998290,973395,398314,145
3,420,414
Balance
+ 7,187-24,708+ 4,402+ 3,233- 1,984+17,845+ 4,040
-34,708
(7) The net balance of departures and arrivals of Hong Kong residents over a fairly longperiod should be able to give some indication of the approximate size of emigration.
10

Numbers on illegal immigrants entering Hong Kong each year weredifficult to estimate. Figures of illegal immigrants, based on the number of theirregistering for identity cards later on, were estimated to vary between 7,000 and14,300 persons with an average number of about 10,400 persons a year for theperiod 1963-1970.(8)
Table 2.12 Estimated Number of Illegal Immigrants
Year Number of Illegal Immigrants
1961 25,6621962 69,5811963 13,4551964 9,7121965 6,9491966 9,5701967 11,3961968 14,2891969 8,0411970 9,669
Total 178,324
Source: Hong Kong Population Projections, 1971-1991, p. 23.
(8) Estimates for the number of illegal immigrants were much higher for 1961 and 1962.They were estimated to be about 25,700 and 69,000 persons respectively.
11

CHAPTER 3
POPULATION COMPOSITION
Age and Sex
The pQpulation of Hong Kong in the early years was mainly migratory,characterized by an uneven sex distribution and a small proportion of youngstersin the population. Over seventy per cent of Hong Kong's civil population in thelast few decades of the nineteenth century were males, resulting in a highlyuneven sex ratio of around 2,500 males to 1,000 females. Of the entire civilpopulation, only 17-20 per cent were children below 15 years of age. The sexratio between boys and girls under 15 was fairly close, about 1,070 boys to1,000 girls.
Table 3.1 Sex Distribution(in thousands, 1881 - 1901)
Sex 1881 1891 1901
The entire civil population:MaleFemaleSex ratio
The Chinese population:MaleFemaleSex ratio
152.9108.144.8
2,412.9
148.9105.943.0
2,462.8
217.9154.163.8
2,415.4
210.9149.661.3
2,440.5
283.9206.277.7
2,653.8
274.5200.374.2
2,699.5
Note: Sex ratio is expressed in number of males per 1,000 females.
Source: The 1881, 1891, and 1901 Census Reports of Hong Kong.
12

Table 3.2 Age Distribution(in thousands, 1891 -1901)
Age
The entire civil population:Under 15Over 15
The Chinese population:Under 15Over 15
1891
217.944.4
173.5
210.942.8
168.1
1901
283.949.4
234.5
274.547.2
227.3
Note: No comparative age data was available in the 1881 Census Report.
Source: The 1891 and 1901 Census Reports of Hong Kong.
The sex distribution of the population improved considerably in the firstthree decades of the twentieth century, reducing from 1,844 males to 1,000females in 1911 to 1,348 males to 1,000 females in 1931.
Table 3.3 Sex Distribution(in thousands, 1911-1931)
Sex 1911 1921 1931
The entire civil population: 456.7 625.2 ' 840.5Male 296.1 382.9 482.6Female 160.6 242.3 357.9Sex ratio 1,844.1 1,508.1 1,348.4
The Chinese population:MaleFemaleSex ratio
437.7282.3155.4
1,816.6
607.2374.4232.8
1,608.2
821.4471.4350.0
1,346.9
Source: The 1911, 1921, and 1931 Census Reports of Hong Kong.
During this period, over twenty-five per cent of the Chinese population,which constituted more than 97 per cent of the total civil population of thattime, were children under 15 years. Over sixty per cent of the population wereof the age between 15 and 50 years, and only ten per cent were 50 years old andover. In 1911, the number of males was more than doubled the number offemales in each five-year age group between 15 and 40. The discrepancies tendedto become much smaller in 1931. More women than men over 65 years of agewere noticed in 1911 and in 1931.
13

Table 3.4 Age and Sex Distribution of the Chinese Population(in thousands, 1911 - 1931)
Age Group
0 - 56 - 1 0
11-1516-2021-2526-3031-3536-4041 -4546-5051-5556-6061-6566-70Over 70
Total
1911
Males
13.316.817.931.340.637.035.426.423.413.511.65.94.92.22.1
282.3
Females
12.617.216.512.915.415.715.511.810.56.76.84.14.22.53.0
155.4
1921
Males
27.223.430.250.249.845.338.036.124.219.312.3
8.34.53.81.8
374.4
Females
26.524.725.723.222.623.620.119.612.811.37.16.33.82.62.9
232.8
1931
Males
43.532.440.764.763.352.242.936.928.924.016.511.16.53.52.4
469.5
Females
43.731.734.335.637.436.429.326.620.417.812.310.16.24.04.1
349.9
Note: The totals of males and females in the above table do not agree with the totals ofprevious tables as the age of a number of residents was reported as unknown.
Source: The 1911,1921, and 1931 Census Reports of Hong Kong.
The recent population of Hong Kong was a more settled one with a quiteeven sex distribution. The 1971 population of Hong Kong consisted of slightlyover two million men and approximately 1.94 million women. The sex ratio,which was 1,058 men to 1,000 women in 1961, was further improved to 1,033men to 1,000 women in 1971.
Forty-six per cent of the population were below the age of twenty in 1961and in 1971. Of the 1.44 million youngsters of below 20 years old in 1961, halfa million were children under 5,776,000 were between 5 and 14 years, and only165,000 were between 15 and 19 years. In 1971, the number of children under5 was reduced to 376,000, but the number of children between 5 and 14 and thenumber of youngsters between 15 and 19 were increased to over one million and428,000, respectively. The fact that more than one-quarter of the 1971population were between the age 5-14 well reflected Hong Kong's baby boom inthe late 1950's and the early 1960's. On the other hand, the low figure of lessthan 200,000 persons in the age group 25-29 in 1971 could partly be explainedby the low birth rate during the Second World War period. The fact that thenumber of children below the age of 5 in 1971 was only three-quarters of thenumber of children in the same age group in 1961 pointed out clearly the rapiddecline in the number of babies born in Hong Kong in the late 1960's. Less thantwelve per cent of the population in 1961 were 50 years old and over, but thecorresponding proportion of old people increased to sixteen per cent in 1971.
14

More males than females appeared in each of the first ten quinquennial agegroups during the period. For example, there were in 1971 more than 224,000men aged between 25 and 34, compared with 182,000 women in the same agerange. Women seem to live longer than men in Hong Kong. More women thanmen were recorded in quinquennial age groups after the age of 50 in 1961 andafter the age of 55 in 1971. The ratio was more than two women to a man in theage group 70-74 in 1971. For those who were older than 75, the ratio betweenwomen and men was three to one.
Table 3.5 Age and Sex Distribution of the Population(in thousands, 1961 and 1971)
Age Group
0 - 45 - 9
10-1415-1920-2425-2930-3435-3940-4445 - 4950-5455-5960-6465-69
70 and over
Total
1961
Males
257.7220.4185.990.2
111.3137.2140.9132.4107.386.560.137.223.613.212.9
1,607.8
Females
243.0204.9165.174.991.5
116.8122.2111.695.780.763.849.840.027.834.0
1,521.8
1971
Males
193.2259.3267.7219.6173.2107.1117.1129.5133.6113.0101.074.952.328.430.7
2,000.6
Females
183.0248.8255.9208.2163.286.695.5
115.6121.9105.494.375.763.445.373.2
1,936.0
Source: The 1961 Census Report and the 1971 Census Report of Hong Kong.
Marital Status
In 1931, nearly half of the Chinese population were recorded as married,46 per cent were single and the remaining five per cent were widowed. Of thosemarried, 230,000 were males and 167,000 were females. This big difference inthe number of married males and females revealed that a considerable number ofmarried men probably did not bring their wives with them while coming to workin Hong Kong. Over 800 married males and 1,200 married females were under16 years of age/1 * Almost three-quarters of the females aged between 15 and 19years and one-quarter of the males aged between 20 and 24 years were married.
( I ) More child marriages were found among Hakka women in the New Territories.
15

Ninety per cent of the 38,000 widowed were females and only ten per cent weremales. Only two men and one woman indicated their marital status as divorced.
Table 3.6 Marital Status of the Chinese Population(in thousands, 1931)
Marital Status Males Females Total
SingleMarriedWidowedUnknown
235.5230.1
3.91.9
148.4167.334.3
0.1
383.8397.4
38.22.0
Total 471.4 350.0 821.4
Source: The 1931 Census Report of Hong Kong.
Child marriage no longer continued to be a common phenomenon. In1961, only 14 persons under 15 years of age, three boys and eleven girls, werereported as already married.*2^ Twenty-seven per cent of the 1961 populationaged 15 and over were never married, and the corresponding proportionincreased to 36 per cent in 1971. The number of married persons rose from 1.20million in 1961 to 1.48 million in 1971. However, there were more widowed anddivorced persons in 1961 than in 1971.
Table 3.7 Conjugal Status(in thousands, 1961 and 1971)
Conjugal Status
Never marriedMarriedWidowedDivorced
Total
Males
333.6587.7
16.75.8
934.8
1961
Females
170.2614.0118.7
5.9
908.8
Total
503.81,201.7
135.411.7
1,852.6
Males
545.7710.1
20.24.5
1,280.5
1971
Females
368.6770.5105.4
3.7
1,248.2
Total
914.31,480.6
125.68.3
7 578 7
Note: This table is confined to those of 15 years old and over.
Source: The 1961 Census Report and the 1971 Census Report of Hong Kong.
Only half a per cent of the males in the age group 15-19 were married in1971, compared with three per cent of the females in the same age group. Theproportion of married naturally increases as age advances. For males, the
(2) In accordance with the recommendations of the United Nations, information onmarital status was collected only from persons aged 15 and above in 1971. Thosewho had not attained the age of 15 were automatically recorded as never married.
16

proportion of married increased to 8 per cent in the 20-24 age group and to 36per cent in the 25-29 age group. The corresponding proportions for females were32 per cent and 80 per cent, respectively. Of those aged 50 and over, only 3.7per cent of the males and 6.4 per cent of the females were still not married. Itwas noticed that young men and women were in recent years planning theirmarriage two or three years later when compared with the age of marriage oftheir parents. As women live longer than men, it was noticed that there wereover one hundred thousand widowed women in Hong Kong, five times thenumber of widowed men in 1971. Nearly two-thirds of the widowed womenwere over 60 years of age. Of the 8,200 person divorced or separated, about4,500 were males and 3,700 were females. Eighty per cent of them were in theage range of 30 to 59 years.
Household
Over ninety-seven per cent of the Hong Kong population lived in domestichouseholds in 1961 and 1971. (3) In 1971, about 72,000 persons were housed incollective households/4^ such as hotels, hospitals, boarding-houses, prisons,orphanages and old people's homes. It was still quite common to find largedomestic households in Hong Kong. Between three to four per cent of the HongKong population maintained one-person households. Households of size 2, 3, 4,or 5 persons numbered over 100,000 each and housed one and a half millionpersons. Another 2.2 million persons of the population were living in relativelylarge households of 6 persons or more.
Table 3.8 Size of Domestic Households(in thousands, 1961 and 1971)
(persons)
123456789
10 and over
Total
Source: The 1961 Census
1961
Number ofHouseholds
104.1101.097.392.582.571.253.734.921.228.8
687.2
Number ofPersons
104.1201.9292.1370.0412.7427.2375.8278.9190.4399.1
3,052.2
1971
Number of Number ofHouseholds
126.2110.5104.0109.3107.599.779.254.732.333.6
857.0
Report and the 1971 Census Report of Hong Kong.
Persons
126.2221.0312.0437.4537.4598.5554.2437.3290.4350.3
3,864.7
(3) A domestic household was defined as related family members or unrelated personswho lived together under the same roof and shared their food.
(4) A collective household included unrelated persons who occupied the same livingaccommodation, shared some form of communal catering, and might or might notpay for their food and lodging.
17

In each household, one person was assigned to be the head of thehousehold. More male heads, about seven men to two women, were reported, Inthe 857,000 domestic households in 1971, over half a million persons wererecorded as spouses, nearly two million persons were recorded as children, andanother 434,000 persons were recorded as relatives of the heads of thehouseholds. Over 25,000 domestic servants and about 130,000 other personswere also reported living in these domestic households.
Ethnicity, Place of Birth, and Usual LanguageInformation on the population's racial distribution was collected in the
censuses carried out in the early part of this century. Over 97 per cent of the thencivil population were Chinese. In the postwar censuses, a question on the placeof origin was asked instead/5^ Over half of the recent population had Canton,Macau and adjacent places as their place of origin. Another one-third of thepopulation were originated from Sze Yap, Chiu Chau and other parts ofKwangtung. Between four and five per cent of the population were of HongKong origin in 1971. Less than two per cent were from other countries,including 29,000 Britons 22,300 Asians, 5,300 from other European countriesand 4,700 from the United States and Canada.
Table 3.9 Place of Origin(in thousands, 1961 and 1971)
Place of Origin
Hong KongCanton, Macau and adjacent placesSze YapChiu ChauElsewhere in KwangtungElsewhere in ChinaOther countriesUnknown
Total
1961
260.51,521.7
573.9257.3244.2222.349.7-
3,129.6
1971
185.72,072.1
684.8391.4250.2284.8
64.92.7
3,936.6
Source: The 1961 Census Report and the 1971 Census Report of Hong Kong.
The proportion of population born in Hong Kong increased considerablyduring the post-war period. In the early part of this century, less than one-thirdof the population were native born. The proportion of Hong Kong bornincreased to 48 per cent in 1961 and 56 per cent in 1971. On the other hand,the proportion of population born in Kwangtung Province dropped from over 60per cent in the pre-war period to around 40 per cent in recent years. Sixty percent of the Hong Kong born population were below 15 years of age, another
(5) The place of origin was defined for the Chinese population as that part of China fromwhich the family came and for the non-Chinese population as the nationality orcountry of origin claimed.
78

thirty per cent between 15 and 34 years, and only ten per cent aged 35 andabove. Of those not born in Hong Kong, only four per cent were youngstersbelow 15 years of age, nearly thirty per cent between 15 and 35 years and overtwo-thirds were aged 35 and above.
Table 3.10
Place of Birth
Hong KongKwangtung ProvinceElsewhere in ChinaOther countriesUnknown
Total
Place of Birth(in thousands, 1911 -1971)
1911
143.9280.0
3.98.1
20.8
456.7
1921
167.2431.9
6.68.7
10.8
625.2
1931
276.4531.1
15.618.48.3
849.8
1961
1,492.91,425.6
153.657.5
3,129.6
1971
2,218.91,475.6
162.279.9
3,936.6
Note: The 1931 total here included people in defence forces and mercantile marine.
Source: The Census Reports of Hong Kong, various years.
Nearly eighty per cent of the 1961 population aged 5 and above spokeCantonese at home, and slightly over 15 per cent used Hakka, Hoklo or Sze Yap.According to the 1971 Census data, 88 per cent of the entire population spokeCantonese with members of their families, and only 8 per cent usually spokeHakka, Hoklo or Sze Yap. Other Chinese languages, including Mandarin, werespoken by about 90,000 persons in Hong Kong. Though twenty per cent of thepopulation could speak some English, it was the usual language of only one percent of the population. Five thousand persons of the 1971 population weredumb.
Table 3.11 Usual Language(in thousands, 1961 and 1971)
Usual Language 1961 1971
CantoneseHakka, Hoklo or Sze YapOther Chinese languagesEnglishOther languagesDumb
2,076.2407.5
95.531.816.31.6
3,469.2315.6
89.541.116.15.1
Total 2,628.9 3,936.6
Note: The 1961 total included only those aged 5 and above.
Source: The 1961 Census Report and the 1971 Census Report of Hong Kong.
19

EducationBetween 580,000 and 590,000 children were too young to go to school in
1961 and 197l/6^ Over forty per cent of the recent population had or werereceiving primary school education. In 1961, 466,000 and 44,000 persons had orwere receiving secondary school and university education, respectively. Thecorresponding figures for 1971 increased to 860,000 and 65,000. The number ofpersons who had no schooling recorded a reduction from 614,000 to 542,000between 1961 and 1971.
Table 3.12 Educational Attainment(in thousands, 1961 and 1971)
Educational Level
Too young to go to schoolKindeigartenPrivate tutorPrimarySecondaryPost secondaryUniversityNo schooling
Total
1961
591.2*
108.71,304.9
441.924.444.0
614.5
3,129.6
1971
376.2202.5134.4
1,755.9814.346.065.6
541.7
3,936.6
* "Kindergarten" was not listed in the 1961 Census.
Source: The 1961 Census Report and the 1971 Census Report of Hong Kong.
Of the population aged 15 and over in 1961, about one-third had noformal schooling, forty per cent received primary school education and just overone-quarter had secondary school education or higher. The proportion ofattaining secondary school or higher level increased to 33 per cent in 1971. Ofthose without any formal schooling, over seventy per cent were females. Ofthose with university training, about one-quarter were females.
Table 3.13 Educational(in
F-iiiiciitinTiiil T,CVG1LAllivttLlUlull l^vVvl
Private TutorPrimarySecondaryPost secondary.UniversityNo schooling
Attainment of All Aged 15 and Overthousand:¡,1961 and 1971)
1961
Males
70.6454.1280.3
15.834.188.9
Females
38.1277.9136.1
8.510.0
438.2
1971
Males
86.8547.4442.3
27.649.3
127.1
Females
47.2433.1285.5
18.516.3
447.6
Total 943.8 908.8 1,208.5 1,248.2
Source: The 1961 Census Report and the 1971 Census Report of Hong Kong.
(6) "Kindergarten" was not separately listed in the 1961 Census. However, a total ofover 200,000 children were recorded as kindergarten students in 1971.
20

About 1,228,000 students, including 650,000 males and 578,000 females,were attending schools in 1971. Of this students population, 194,000 werekindergarten kids, 744,000 at primary schools, 281,000 at secondary andpost-secondary schools, and eight thousand university students. Kindergartenkids were mostly aged between 4 and 7. Primary school students were mainlybetween 6 and 15 years of age, and secondary school students between 13 and20. More post-secondary and university students were found in age groups 17-23and 19-24, respectively. The ratio between male and female primary studentswas fairly close. The difference became somewhat wider among secondary andpost-secondary school students. Among the eight thousand university students,two-thirds were male students and one-third female students.
Table,3.14 Age and Sex Distribution of the Student Population
(in thousands, 1971)
Age Group
4 and below5 - 9
10-1415- 1920-24
25 and over
Total
Males
35.2241.1247.7108.1
16.01.7
649.8
Females
30.5227.9221.3
82.710.94.5
577.8
Total
65.7469.0369.0190.826.96.2
1,227.6
Note: The student population includes kindergarten kids.
Source: The 1971 Census Report of Hong Kong.
21

CHAPTER 4
POPULATION DISTRIBUTION
In the early years of the-century, about half of the population were livingon Hong Kong Island. Kowloon had the greatest expansion among various areas,with the number of inhabitants rising from 56,000 in 1911 to 240,000 in 1931.Yâumati, Mongkok, Shamshuipo, and Kowloon City expanded greatly. The areaof New Kowloon^^ began to absorb more inhabitants during this period. Theincrease in the New Territories was 17,000 persons or 21 per cent between 1911and 1931. The population afloat, though increased from 62,000 in 1911 to71,000 in 1921, recorded a decrease of 1,000 persons between 1921 and 1931.
Table 4.1 Population, by Area(in thousands, 1911 -1931)
Area 1911 1921 1931
Hong Kong IslandKowloonNew KowloonNew TerritoriesMarine
244.356.213.281.261.8
347.4113.9
9.583.271.2
409.2240.4
22.698,270.1
Total 456.7 625.2 840.5
Source: The 1911, 1921 and 1931 Census Reports of Hong Kong.
No major differences in the age distribution of the 1931 Chinesepopulation by broad areas could be detected. About 40 per cent of the landpopulation were below 20 years of age, while for the marine population thecorresponding proportion was 45 per cent. In Hong Kong Island, Kowloon andNew Kowloon, 46 per cent of the residents were in their early adult life of 21 -44years old and 15 per cent were 45 and over. In the New Territories, only 36 percent of the population were between 21 and 44 years of age and over 20 per centwere in their mature or old age.
(1) The area "New Kowloon" consisted of districts of Cheung Sha Wan, Shek Kip Mci,Kowloon Tong, Kai Kak, Ngau Tau Kok and Lei Yue Mun, formerly included in theNew Territories.
22

Table 4.2 Age Distribution of the Chinese Population, by Area(in thousands, 1931)
. r. Hong Kong Island, New . . . _, . ,Age Group v . . „ „ . _ .. . Marine Total
Kowloon and New Kowloon Territories
Infancy (under 1)Childhood (2-13)Adolescence (14-20)Early Adult Life (2M4)Mature Age (45-64)Old Age (65 and over)
20.7123.8109.2302.685.912.5
3.125.213.735.516.53.8
2.317.411.227.9
8.71.4
26.1166.4134.1366.0111.117.7
Total 654.7 97.8 68.9 821.4
Source: The 1931 Census Report .of Hong Kong.
In Hong Kong Island, Kowloon and New Kowloon, the numbers of singlemales and of married males were almost equal in 1931. For residents in the NewTerritories and the afloat population, single males outnumbered married malesby 15 to 20 per cent. Around 47 per cent of the female population were marriedin all areas. The New Territories had the highest proportion, 16 per cent of thefemale population there, of widowed females. A large proportion of the femalesin the New Territories were married by age 21. In Hong Kong Island, Kowloonand New Kowloon married females became majority at the age of 24 or 25. Formales, the difference in the age of marriage was only slight among differentareas.
23

Table 4.3 Marital Staters of the Chinese Population, by Area
(in thousands, 1931)
Hong Kong IslandKowloon and New. Kowloon
MalesFemales
New TerritoriesMalesFemales
MarineMalesFemales
Total: MalesFemales
Single
187.9116.8
25.917.7
21.713.8
235.5148.3
Marital Status
Married
189.5131.3
21.823.0
18.813.0
230.1167.3
Widowed
2.125.1
1.47.9
0.41.3
3.934.3
Unknown*
1.90.1
——
—-
1.90.1
* Street sleepers, who were not questioned on their marital status, were classified asunknown.
Note: Only two men and one woman in Hong Kong and Kowloon were listed as divorced.
Source: The 1931 Census Report of Hong Kong.
Significant changes in the area distribution of the Hong Kong Populationtook place during the post-war years. In 1961, over one million persons or 32per cent of the entire population lived on Hong Kong Island. Kowloon had725,000 persons or 23 per cent. The rapidest expansion occurred in NewKowloon. The number of inhabitants living in New Kowloon jumped frommerely 23,000 in 1931 to more than 850,000 in 1961. About 410,000 personsor 13 per cent of the population resided in the New Territories. Another137,000 persons lived afloat in small boats.
In 1971, both Hong Kong Island and Kowloon had a reduction of around10,000 residents when compared to their 1961 figures/2^ On the other hand,the number of people living in New Kowloon further soared to close to one anda half million, showing an increase of seventy per cent over the 1961 figure. Thepopulation in the New Territories also increased by 60 per cent in the 1960's.This redistribution of population from overcrowded areas of Hong Kong Islandand Kowloon to public housing estates in New Kowloon was mainly the result ofurban development plans and re-housing schemes carried out by the Govern-ment. The marine population reduced drastically to only 80,000 persons. Thepopulation density for Hong Kong as a whole averaged about 10,000 persons per
(2) Central and Sheung Wan districts on Hong Kong Island had only about half of thenumber of their 1961 residents. Aberdeen district on the Island, however, expandedconsiderably as public housing estates in Aberdeen attracted large number of tenants.
24

square mile in 1971, ranging from slightly over below 2,000 persons per squaremile in the New Territories to well over 200,000 persons per square mile inKowloon.
Table 4.4 Population, by Area(in thousands, 1961 and 1971)
Area 1961 1971
Hong Kong IslandKowloonNew KowloonNew TerritoriesMarine
1,004.9725.2852.8409.9136.8
996.2716.3
1,478.5665.779.9
Total 3,129.6 3,936.6
Source: The 1961 Census Report and the 1971 Census Report of Hong Kong.
The sex ratio in terms of males per 1,000 females was higher on HongKong Isand than in the other land areas in the early part of the century. Forexample, in 1911, the sex ratio was 2,250 males per 1,000 females for HongKong Island, 1972 for Kowloon, 1410 for New Kowloon and 1,021 for the NewTerritories. However, the sex distribution improved greatly during the post-waryears and became fairly close in recent years. The sex ratio fluctuated between1,015 and 1,060 males per 1,000 females for all land areas in 1971. The sex ratioin the marine population also reduced from 1,492 in 1931 to 1,150 in 1971.
Table 4.5
Year and Sex
1911MalesFemales
1921MalesFemales
1931MalesFemales
1961MalesFemales
1971MalesFemales
Sex Distribution, by Area(in thousands, 1911 -1971)
Hong Kong Island
169.275.1
221.1126.3
246.2163.0
515.8489.1
501.8494.4
Kowloon
37.318.9
69.544.4
133.3107.1
371.5353.7
368.4347.9
New Kowloon
7.75.5
5.14.4
11.611.0
432.2420.6
748.6729.9
New Territories
41.040.2
41.941.3
49.548.7
215.6194.3
339.0326.7
Marine
40.920.9
45.325.9
42.028.1
72.764.1
42.737.2
Source: The 1911, 1921, 1931, 1961 and 1971 Census Reports of Hong Kong.
25

During the decade 1961-1971 a reduction of over 30 per cent in thenumber of children below 10 years old and a reduction of between 18-27 percent in the number of persons between 30-39 years of age were recorded in HongKong Island and Kowloon. For New Kowloon and the New Territories, thenumber of persons in each 10-year age group increased significantly. Some agegroups as 0 9, 50-59, 60-69 and 70 and over were more than doubled in size inthese two areas. The reduction in the size of the marine population was noticedthroughout all lQ-year age groups. In 1971, between 30 and 36 per cent of theresidents in Hong Kong Island, Kowloon and New Kowloon were below 15 yearsof age about 25 per cent between 15 and 30, another 25 per cent between 30and 50, and the remaining 15 to 18 per cent were older persons over 50 years ofage. The New Territories and the marine population had relatively more childrenbelow the age of 15, while only 20 per cent of the population in the NewTerritories were between 15 and 30, and only 10 per cent of the marine popu-lation were older people over 50.
Table 4.6 Age Distribution, by Area(in thousands 1961 and 1971)
Year andAge Group
19610 - 9
1 0 - 1920-2930-3940-4950-5960-6970 and over
19710 - 9
1 0 - 1920-2930-3940-4950-5960-6970 and over
Hong Kong Island
273.8174.7142.3158.1128.275.935.816.1
188.1236.9150.2115.6123.299.354.528.4
Kowloon
193.7119.8122.6116.985.850.324.911.2
135.8150.1118.997.987.767.538.120.3
New Kowloon
275.5132.5118.4141.697.550.325.811.2
350.8380.5181.7164.7179.3122.263.535.8
New Territories
137.260.854.963.945.826.714.06.6
185.0163.069.071.776.252.030.718.1
Marine
45.928.318.517.613.07.74.01.8
24.720.910.27.87.64.92.51.3
Source: The 1961 Census Report and the 1971 Census Report of Hong Kong.
26

Of persons aged 15 years and over, the proportion of males and femaleswho were never married tended to rise in all areas in the past decade, and theproportion of never married was consistently higher in the urban areas than inthe rural areas. In 1971, between 42.5 and 44.5 per cent of the males andaround 30 per cent of the females of 15 years old and over were never married inHong Kong Island, Kowloon and New Kowloon as compared to 37.8 per cent ofthe males and 25.4 per cent of the females in the New Territories. The numberof widowed persons and divorced persons showed a declining trend during the1960's in all areas except that more widowed persons were recorded for NewKowloon in 1971 than in 1961.
Table 4.7 Conjugal Status, by Area(in thousands, 1961 and 1971)
Year andConjugal Status
1961Never marriedMarriedWidowedDivorced
1971Never marriedMarriedWidowedDivorced
Hong Kong Island
178.1383.446.5
3.6
260.5387.4
35.82.3
Kowloon
134.9281.8
31.83.2
187.5290.425.5
2.2
New Kowloon
121.1328.4
33.83.4
329.0534.945.0
2.4
New Territories
52.4156.7
19.71.3
121.0240.9
18.61.2
Marine
17.351.4
3.60.2
16.327.00.7-
Note: This table is confined to those of 15 years old and over.
Source: The 1961 Census Report and the 1971 Census Report of Hong Kong.
27

More small households were found in Kowloon. Over half of the domestichouseholds in Kowloon were of 1-3 persons. The corresponding proportion was41.5 per cent for Hong Kong Island and 34-35 per cent for New Kowloon andthe New Territories. In certain old districts of Hong Kong Island and Kowloon itwas a common practice to let bed spaces to single persons in old tenementfloors, thus creating a large number of one-person households. About one-thirdto 40 per cent of the households in all areas were of 4-6 persons. One-quarter ofhouseholds in New Kowloon and the New Territories had seven or more persons.Over two-thirds of the marine households had at least six persons in eachhousehold. The average size of household was 3.8 persons for Kowloon, 4.4persons for Hong Kong Island, around 4.8 persons for New Kowloon and theNew Territories, and over 7 persons for the marine population.
Table 4.8 S j z e o f D o m e s t i c Households, by Area
(in thousands, 1971)
Size ofHouseholds(persons)
123456789
10 and over
Total
Hong Kong Island
33.429.829.130.528.624.919.312.97.17.3
222.9
Kowloon
39.431.425.323.220.116.611.77.64.54.7
184.9
New Kowloon
35.433.633.837.840.140.132.923.013.512.8
303.0
New Territories
17.115.215.217.217.817.214.110.06.06.0
135.8
Marine
0.50.50.50.70.91.01.21.21.12.7
10.3
Source: The 1971 Census Report of Hong Kong.
28

CHAPTER 5
THE LABOUR FORCE
In 1931, 470,000 persons or 55 per cent of the total population of850,000 persons^ were reported to be gainfully occupied. The employed groupincluded almost 372,000 males and 99,000 females, amounting to 75 per cent ofthe male population and 28 per cent of the female population respectively.
Of the employed group, 20 per cent was engaged, in commerce andfinance, 15 per cent each in transport and communications, and variousmanufacturing industries, and 13-14 per cent each in personal or domesticservice, and fishing and agriculture. The largest group of male workers wasengaged in commerce and finance, absorbing nearly one-quarter of occupiedmales. One-fifth of the male workers were working for various manufacturingindustries and another one-sixth for transport and communications. Other majorindustrial groups, such as personal service, public administration and defence,building and decorating, agriculture, and fishing, each employed between15,000 to 34,000 male employees. Of the employed females, over 30 per centwere in industries providing personal or domestic service and entertainments, andone-quarter were in agriculture. About 60 to 65 per cent of the male and thefemale employees were aged between 20-40.
Table 5.1 Industrial Classification of Gainfully Occupied Population(in thousands, 1931)
Industry
FishingAgricultureMining and quarryingManufacture of chemicals and metalsManufacture of textilesManufacture of clothingFood, drinks and tobaccoOther manufacturing groupsBuilding and decoratingUtilitiesTransport and communicationCommerce and financePublic administration and defenceProfessionsEntertainmentsPersonal serviceOther industries
Total
Source: Summarized from Table 3.9 of the
Males
15.517.23.7
24.94.6
13.59.1
22.217.9
1.860.292.023.17.62.8
34.121.7
371.9
1931 Census
Females
7.224.50.20.95.63.02.12.43.0—
11.15.00.42.43.7
27.10.2
98.8
Report of Hong Kong.
Total
22.741.7
3.925.810.216.511.224.620.9
1.871.397.023.510.06.5
61.221.9
470.7
(1) This total of 850,000 persons included 9,278 members of the Naval and MilitaryEstablishments. 29

Over 5,700 children under 14 years of age were gainfully occupied in1931. Nearly half of them were boys and slightly over half were girls. Two-thirdsof the occupied children were helping out in fishing, on farms or as boatmen. Inaddition, 114,000 children between 5-13 years old were classified as child labourwith no gainful occupation.
Of the 1961 population, 1.21 million persons or 38 per cent wereclassified as economically active/2^ The number of economically active personsincreased to 1.65 million or 42 per cent of the Hong Kong population in 1971.If children below 10 years of age were left out, then the proportion ofeconomically active persons in the population would be around 55 per cent forboth 1961 and 1971. The economically active population consisted of 865,000males and 347,000 females in 1961 and 1,097,000 males and 558,000 females in1971. The sex ratio of economically active population was 2,491 males to 1,000females in 1961 and 1966 males to 1,000 females in 1971. Fifty-four per cent ofthe 1961 male population and 55 per cent of the 1971 male population wereeconomically active, while only 23 per cent of the 1961 female population and29 per cent of the 1971 female population were economically active.
Table 5.2 Economic Activity Status of Hong Kong Population(in thousands, 1961 and 1971)
Classification
Economically activeMalesFemales
Economically inactiveMalesFemales
Total
1961
1,212.0864.8347.2
1,921.1745.8
1,175.3
3,133.1
1971
1,654.91,096.9
558.0
2,281.7903.7
1,378.0
3,936.6
Source: The 1961 Census Report and the 1971 Census Report of Hong Kong.
Of the male population the participation in economic activity was veryhigh between ages 20-60. For example, over 95 per cent of the males between 25and 55 years of age and around 90 per cent of the males in age groups 20-24 and55-59 were economically active in 1961 and 1971. Among the older group,nearly 80 per cent of those between 60 and 65 years of age and 40 per cent ofthose over 65 years continued to remain economically active. The patterns of
(2) The labour force approach was adopted for classifying persons into economicallyactive or economically inactive. Persons who were engaged in productive work formore than 40 hours during the twenty days before the 1961 Census date or formore than 15 hours during the seven days before the 1971 Census date, includingthose who were not working but looking for work during the reference period, wereincluded in the economically active population. The minimum age-limit for aneconimically active person was 6 years in the 1961 Census and 10 years in the 1971Census.
30

age-specific activity rates for females were quite different. In 1961,48 per centof the females in the 15-19 age group and just over half in the 20-24 age groupwere economically active. The female participation in economic activity washigher in these age groups in 1971, 56 per cent for females aged 15-19 andnearly 70 per cent for females aged 20-24. The participation of females ineconomic activity dropped to around 45 per cent for women aged between 25and 29 years and further to 35-40 per cent for women between 30 and 60 yearsof age. In 1961, approximately one-third of the economically active populationwere never married.
Table 5.3 Age and Sex Distribution ofEconomically Active Population(in thousands, 1961 and 1971)
Age Group
10-1415-1920-2425-3435-4445 - 5455-64
65 and over
Total
Males
11.949.099.3
271.9226.7142.051.912.1
864.8
1961
Females
•12.535.946.881.078.760.925.36.1
347.2
Total
24.484.9
146.1352.9305.4202.977.218.2
1,212.0
Males
12.5110.8156.3220.5259.5206.7107.123.5
1,096.9
1971
Females
23.4117.4113.472.191.977.747.214.9
558.0
Total
35.9228.2269.7292.6351.4384.4154.338.4
1,654.9
Source: The 1961 Census Report and the 1971 Census Report of Hong Kong.
The proportion of workers with no formal schooling or only with someprivate tutoring reduced from 27 per cent of the economically active populationin 1961 to 22 per cent in 1972. About 46 per cent of the group had primaryeducation, and around 25 per cent had secondary education. Only 4-5 per centhad post secondary or university education.
About 21,000 persons of the economically active population wereunemployed in 1961. The unemployment figure rose to over 70,000 persons in1971. Of the working population, about 10 per cent were classified asself-employed and between 80 and 87 per cent were employees. The numbers ofemployers and unpaid family workers were significantly lower in 1971 whencompared with the 1961 figures.
31

Table 5.4 Employment Status of Working Population(in thousands, 1961 and 1971)
Employment Status 1961 1971
Self-employedEmployerEmployeeUnpaid family worker
123.957.4
957.052.8
130.740.7
1,375.935.5
Total 1,191.1 1,582.8
Source: The 1961 Census Report and the 1971 Census Report of Hong Kong.
Craftsmen, labourers and production workers together formed the largestoccupational group in Hong Kong's economically active population.^ Thenumber of workers in this group increased from 520,000 in 1961 to 747,500 in1971, amounting to 43-45 per cent of the entire economically active population.Three-quarters of them were permanent in-workers. Clerical and sales workers,and service and recreation workers together totalled 415,000 persons in 1961and 508,000 persons in 1971. Eighty per cent of these workers were permanentin-workers, and ten per cent were self-employed. Of the group of administrativeand managerial workers, one-third were self-employed, another one-third wereemployers and only one-quarter were permanent in-workers. The number offarmers and fishermen reduced from 87,600 in 1961 to 52,700 in 1971, showinga reduction of 40 per cent in the number of farmers and fishermen in this10-year period. Two-fifths of the farmers and fishermen in 1971 were classifiedas self-employed.
Table 5.5 Distribution of EconomicallyActive Population by Occupation
(in thousands, 1961 and 1971)
Occupation 1961 1971
Professional and technical workersAdministrative and managerial workersClerical and sales workersFarmers and fishermenMiners and quarrymenTransport and communication workersCraftsmen, labourers and production workersService and recreation workersArmed forces and unclassifiedUnemployed*
Total 1,212.0 1,654.9
* For 1971, only those with no previous working experience were included here. Thosewith working experience were classified accordingly by their previous occupations
Source: The 1961 Census Report and the 1971 Census Report of iîong Kong.
(3) The occupation classification used in the 1961 and the 1971 Censuses was adoptedfrom the International Standard Classification of Occupations laid down by theInternational Labour Office.
56.136.6
234.687.6
4.758.0
520.1180.213.220.9
80.775.6
263.852.7
5.396.9
747.5243.864.524.0
32

The distribution of Hong Kong's economically active population byindustry reveals the important contribution of manufacturing industry towardsHong Kong's economy. The manufacturing industry alone absorbed 476,000workers in 1961 and 686,000 workers in 1971, about 40 per cent of HongKong's working population. Services and commerce took one-third of theeconomically active force, and construction, engineering, transport andcommunication industries together employed another 17 per cent in 1961 and1971. Over 110,000 workers were working in agriculture, fishing, mining andquarrying industries. About half of the manufacturing workers were in textileindustry and one-quarter were engaged in the production of chemical, metal andplastic products. The remaining quarter spread over other manufacturingactivities such as food, beverage, and tobacco industries, manufacture of woodproducts, furniture, paper products, leather products, rubber products, and wigs,printing and publishing industries.
Table 5.6 Distribution of EconomicallyActive Population by Industry(in thousands, 1961 and 1971)
Industry
Agriculture, forestry and fishingMining, quarrying and unclassifiedManufacturingConstruction and engineeringUtilitiesCommerceTransport and communicationServices
Total
1961
87.625.5
475.5100.2
19.0131.386.7
265.3
1,191.1
1971
64.751.4
685.8171.8
8.9211.6119.4317.3
1,630.9
Notes: (1) The 1961 headings for "construction and engineering" and "transport andcommunication" were "constructions" and "communications" respectively.
(2) The 1961 total excluded unemployed and job-seekers, and the 1971 totalexcluded those seeking work for the first time.
Source: The 1961 Census Report and the 1971 Census Report of Hong Kong.
Over 90 per cent of the workers in utilities, transport and communicationindustries were males. The proportion of female workers varied from one-thirdto two-fifths in the farming, fishing and servicing industries. Of themanufacturing workers, 292,000 or 43 per cent were females. Three-fifths of thefemale manufacturing workers were with textile products and one-fifth withchemical metal and plastic products.
33

Table 5.7 Distribution of Working Population by Sex
(in thousands, 1971)
Industry
Agriculture, forestry and fishingMining and quarryingManufacturingConstruction and engineeringUtilitiesCommerceTransport and communicationServicesUnclassified
Total
Males
40.93.4
385.6138.0
8.1157.3106.0198.0
12.7
1,050.0
Females
22.11.1
292.030.80.7
51.38.7
114.112.0
532.8
Source: The 19.71 Census Report of Hong Kong.
One-fifth of the 1961 economically active population had no previousschooling. The corresponding proportion reduced to one-sixth in 1971. Forty-sixper cent of the economically active population had primary education. Thosewith secondary or higher education increased from 27 per cent in 1961 to 32 percent in 1971. Over half of the fishermen and farmers in 1971 had no schoolingbefore, while the corresponding figures for workers in manufacturing, transportand communication, construction, services and commerce were between 10 and16 per cent. Nearly half of the labour force in utilities, commerce, and serviceshad secondary or higher education. For transport and communication,construction and engineering and manufacturing industries, about 25-35 per centof the workers received secondary or higher education. Over 90 per cent of theprofessional and technical workers and over half of the administrative,managerial, clerical and sales workers had secondary or higher education!
Table 5.8 Distribution of Economically ActivePopulation by Educational Attainment
(in thousands, 1961 and 1971)
Educational Level 1961 1971
No schoolingPrivate tutorPrimarySecondaryPost secondaryUniversity
Total 1,212.0 1,654.9
Source: The 1961 Census Report and the 1971 Census Report of Hong Kong.
34
243.677.5
559.7279.3
16.835.1
269.089.6
759.8455.9
39.241.4

There were 63,000 part-time workers in the 1971 working population,including 47,600 home-makers 10,800 students and 4,500 retired persons andunpaid members of religious bodies. Six-sevenths of the part-time workers werefemales. Sixty per cent of the part-time workers were assisting variousmanufacturing industries, and nearly twenty per cent were employed bycommercial firms or providing domestic and other services. Other part-timeworkers were engaged in farming or construction activities.
About 16,000 persons with previous working experience were unemployedin 1961. The ratio between unemployed males and females was almost four toone. The number of unemployed including those looking for job for the firsttime increased to 72,000 in 1971. Two-thirds of those unemployed in 1971 hadprevious jobs and one-third were looking for work for the first time.Approximately two-thirds of the unemployed were males and nearly 40 per centof the unemployed males were over 45 years of age. To the contrary, more thanhalf of the unemployed females were between ages of 15 to 24 years. Most ofthe unemployed young females had no previous working experience. More un-employed persons, about two-thirds of the unemployed population,, were locatedin Hong Kong Island and New Kowloon. About 27,000 unemployed were residedin Kowloon and the New Territories. The number of unemployed was relativelyfew in the marine population.
Table 5.9 Age and Sex Distribution
of Unemployed Persons
(in thousands, 1961 and 1971)
Age Group
15-2425-3435-4445-5455-64
Total
Males
1.73.13.02.91.6
12.3
1961
Females
0.90.80.60.80.4
3.5
Total
2.63.93.63.72.0
15.8
Males
14.36.17.59.79.3
46.9
1971
Females
13.62.12.23.14.2
25.2
Total
27.98.29.7
12.813.5
72.1
Note: The 1961 total does not include job-seekers for the first time.
Source: The 1961 Census Report and the 1971 Census Report of Hong Kong.
35

The size of economically inactive population increased from 1.92 millionin 1961 to 2.28 million in 1971. Nearly two-thirds of the 1961 economicallyinactive population were below 15 years of age. In 1971, 60 per cent of theeconomically inactive population were under 15 years of age, 20 per centbetween 15-39 years, 14 per cent between 40-64 years and 6 per cent were 65years of age and over. More than half of the 1971 economically inactivepopulation were full-time students. Of the full-time students, one million wereunder the age of 15 and 216,000 were over 15 years of age. Home-makersaccounted for one-quarter of the economically inactive population. Of the580,000 home-makers, 99 per cent were females. Another one-sixth of theeconomically inactive population were children below 14 years of age and notattending school. The remaining five per cent included retired persons, personsliving on income from investments and overseas remittances, and inmates ofpenal, mental and charitable institutions. Three-quarters of the 24,000 personsliving on income from investments and overseas remittances were females.
Table 5.10 Distribution of EconomicallyInactive Population by Activity Status
(in thousands, 1971)
Activity Status
Home-makerRetired personStudentChildren under 14 years, not at schoolIncome from subletting premises, investments
and overseas remittancesInmate of institution
Total
Males
11.948.6
644.4184.6
6.57.7
903.7
Females
568.130.7
572.5186.2
17.82.7
1,378.0
Total
580.079.3
1,216.9370.8
24.310.4
2,281.7
Source: The 1971 Census Report of Hong Kong.
36

CHAPTER 6
POPULATION PROJECTIONS
Three series of population projections were prepared by the Hong KongGovernment in the past decade. The first projection for 1961-1971 was made in1963 on the basis of the demographic data gathered during the 1961 PopulationCensus and the vital and migration statistics existed at that time. The secondprojected population figures for 1966-1981 were based on the results obtainedfrom the 1966 By-Census, and the recent set of projections for 1971-1991 wasprepared in 1973 from the results of the 1971 Census and recent vital andmigration statistics. The component method was followed in making thesepopulation projections. Based on the existing vital and migration statistics,various assumptions on the course of mortality, fertility and migration weremade to derive separate estimates of both sexes in each age group of thepopulation.
The Projections for 1961-1971The 1961 Census was carried out on February 11, 1961 for the marine
population and on March 7, 1961 for the land population. The first step inpreparing the projections was to estimate the population of Hong Kong on July1, 1961 to be used as the base population for the projections. In arriving at thisestimate, the Marine Census figures were in the first place adjusted to the dateof the Land Census and added to the Land Census figures, then the totals foreach individual years were further adjusted to reach the estimated populationtotal for July 1, 1961 "by adding all the registered births, deducting all theregistered deaths and adding the estimated numbers of immigrants" and finallythe age distribution thus obtained was modified by graduation "to avoiddistorting the dip in the age distribution represented by the Pacific Wargeneration."1-^
The crude death rate of Hong Kong fell from about 10 per thousand in thelate 1940's to below 6 per thousand in 1961, and the infant mortality ratedeclined from around 100 per thousand to below 40 per thousand. This rapiddecline was largely due to "the massive extension of medical facilities for thepoor and the improvement of standards of living and environmentalsanitation".^ The quinquennial age-specific death rates for males and forfemales computed for the years 1956 to 1961 showed a decline of between 15%
(1) Population Projections for Hong Kong, 1961-1971, p. 2.(2) Population Projections for Hong Kong, 1961-1971, p. 4.
37

and 50% for all groupsfor older people duringindices, obtained fromfor each of the sixpopulation in each agethe equation P V 0 2 7 9 =the year with 1956 as 1.
up to 50 years of age. The death rates tended to increasethis period. An exponential trend fitted to the mortalitycomputing the weighted average age-specific death rateyears 1956-1961 with weights showing the ratio ofgroup to the total population, could be represented by: 132.9, where P is the mortality index and V represents
Table 6.1 Adjusted Age and Sex Distributionof Population on July 1,1961
Age Group Males Females
0 - 45 - 9
10-1415-1920-2425-2930-3435-3940-4445-4950-5455-5960-6465-6970-7475-7980-84
85 and over
267,100226,400183,20096,700
111,400141,100141,100125,900107,00087,40060,80038,30023,50013,4007,5003,6001,400
500
252,000210,300163,10080,50090,900
119,200122,800113,40096,40081,50064,80051,00039,60028,30018,40010,1004,1001,600
Total 1,636,300 1,548,000
Source: Population Projections for Hong Kong, 1961-1971, p. 3.
The age-specific birth rates showed increases in the three quinquennialgroups below 30 years of age, but recorded decreases in the other threequinquennial groups for ages 30 and up during the period 1956-1961. Except forthe age group 20-24, of which the birth rates rose from 271 per 1000 in 1956 to352 per 1000 in 1961, the changes in age-specific birth rates of other groupswere not great/3) The general fertility rate was computed to be 174.46 for 1961with fluctuations between 170 and 180 during this period/4^ Factors whichmight have an effect on the fertility rate included improved medical services andhousing conditions, the tendency towards later marriage, and the introduction offamily planning program during this period.
(3) During this period, for example, the birth rate for the age group 25-29 rose from 287per 1000 to 297 per 1000 and the rate for ages 30-34 reduced from 192 per 1000 to180 per 1000.
(4) The age-specific birth rates of the 6 quinquennial groups were weighted by a ratio of1:6.5:7.2:4.5:2.4:0.5, derived from data supplied by the Department of Obstetricsand Gynaecology, University of Hong Kong to obtain the general fertility rate.
38

In the late 195O's over one million persons left Hong Kong each year and aslightly larger number of people entered. The estimated average annual increasein the population due to migration was around 61,100 persons between April1955 and March 1960. The annual increases fluctuated between 20,000 and80,000. The information on those not born in Hong Kong collected in the 1961Census showed that among the 316,000 persons with less than six yearsresidence in Hong Kong 25 per cent were in the age group 10-19, 28 per centbetween 20-29 and another 28 per cent between 30-49.
Three sets of estimates with different assumptions on mortality, fertilityand migration trends were prepared in the first projections. In the high andmedium projections the age-specific mortality rates were assumed to continueuntil 1971 the decreasing trend along the exponential curve p v 0 ' 2 7 9 = 132.9.This would mean that the 1966 age-specific death rates were assumed to be15.5% below the 1961 level and the 1971 age-specific death rates 24% below the1961 level. In the low projection, the 1961 mortality rates were assumed toremain unchanged till 1971. Table 6.2 shows the 1961 age-specific death ratesand the projected age-specific death rates for 1964 and 1969.
Table 6.2
Age Group
0 - 45 - 9
10 - 1415-1920-2425 - 2930-3435-3940 - 4445-4950-5455-5960-6465-6970 7475-7980-84
85 and over
Projected Age-Specific Death Rates(1964 and 1969)
Age-SpecificDeath Rates
1961
Males
12.000.960.660.751.291.552.203.044.847.41
14.1419.8438.1747.6877.33
101.39165.00216.00
Females
10.700.820.460.670.811.271.592.173.094.216.999.14
15.5120.2137.9961.6895.61
196.87
Projected Age-Specific Death
1964
Males
10.900.880.600.691.171.412.002.764.406.73
12.8518.0234.6743.3170.2392.08
149.85196.17
Females
9.720.750.420.610.741.151.441.972.813.826.358.30
14.0918.3634.5056.0286.83
178.80
Rates
1969
Males
9.590.770.530.601.031.241.762.433.875.92
11.3015.8630.5038.1061.7981.01
131.84172.58
Females
8.550.660.370.540.651.011.271.732.473.365.597.30
12.3916.1530.3549.2976.39
157.30
Note: The 1961 rates were mid-year rates, and the projected figures were rates for thebeginning of 1964 and 1969 respectively.
Source: Population Projections for Hong Kong, 1961-1971, p. 14.
39

The high projection assumed a slight increase of one per cent per annum inthe fertility rate up to 1971. The medium projection assumed the fertility ratewould remain unchanged at the 1961 level, and the low projection assumed adecrease of one per cent per annum in the fertility rate. Table 6.3 summarizedthe projected age-specific birth rates of the high, medium and low projections.
Table 6.3
Age Group
152025303540
- 19- 2 4- 2 9- 3 4- 3 9- 4 4
Projected
Age-Specific Birth1961
61.1351.8297.2180.3104.125.5
Age-Specific Birtf(1961 -1971)
i Rates
Projected Age-Specific Birth
R a t e S 1961-1966
High
62.7360.8304.8184.9106.826.2
Low
59.6343.2289.9175.9101.624.9
Rates
1966-1971
High
65.9379.2320.4194.4112.227.5
Low
56.7326.4275.7167.396.623.7
Source: Population Projections for Hong Kong, 1961-1971, p. 15.
Regarding the effects of migration, a net gain of 122,000 persons wasassumed for 1962. The high projection assumed a net annual gain of 80,000persons by migration for the period mid-1962 to mid-1971, and the medium andthe low projections assumed a net gain of 50,000 persons and 20,000 personsevery year respectively. Furthermore, the age and sex distribution of the netincrease by migration in the 1960's was assumed in the projections to follow thesimilar pattern estimated from information on recent arrivals gathered in the1961 Census/5 >
(5) It was reported that majority of those emigrated from Hong Kong were among agegroups of 15 to 29. This fact was accounted for in the estimated distribution shown inTable 6.4.
40

Table 6.4 The Estimated Age and Sex Distributionof the Net Increase by Migration
(Percentages)
Age Group Males Females
0 - 4 1.86 1.565 - 9 4.86 3.60
1 0 - 14 6.90 5.2215 - 19 8.06 5.6720 - 24 8.48 5.7325 - 29 6.73 5.573 0 - 3 4 3.65 4.9035 - 39 2.66 4.0140 - 44 1.97 3.2745 - 49 1.46 2.8550 - 54 1.06 2.5555 - 59 0.75 2.2760 - 64 0.50 1.7765 - 69 0.32 0.9570 - 74 0.17 0.47
75 and over 0.07 0.11
Total 49.50 50.50
Source: Population Projections for Hong Kong, 1961-1971, p. 13.
Based on the various assumptions at these three different levels, thepopulation of Hong Kong was projected to be between a low of 3.82 millionpersons and a high of 4.13 million persons for 1966 and between 4.39 millionand 5.22 million for 1971.
Table 6.5 The First Population Projection of Hong Kong(1966 and 1971)
Level of Projection Mid-1966 Mid-1971
High 4,131,900 5,217,700Medium 3,982,100 4,812,700Low 3,824,900 4,388,700
Source: Population Projections for Hong Kong, 1961-1971, p. 15.
The Projections for 1966-1981A mid-term By-Census was taken by sample in 1966.(6) The By-Census
date was June 18, 1966 for the boat population or August 2,1966 for the landpopulation. The By-Census population total computed from the sample was3,716,400, with a 95 per cent accuracy range from 3,609,200 to 3,823,600. The
(6) The By-Census included a 5 per cent random sample of enumerator blocks at the firststage and a 20 per cent random sample of households at the second stage for the landpopulation, and a 2.5 per cent sample of boats, stratified by size, for the boatpopulation.
41

computed total of 3,716,400 persons for the 1966 population was more than100,000 persons below the low projection figure of 3,824,900 persons preparedin 1963. This was partly due to the rapidly falling birth rate and the continueddeclining mortality rate between 1961 and 1966.
The vital and migration statistics available for this period showed that thecrude death rate continued to decline from 6 per thousand in 1961 to slightlyover 5 per thousand in 1966. The exponential function fitted to the mortalityindices derived form the age-specific death rates for 1956-1965 was of the formpyO-222 _ ¡26.5, implying a 13 per cent decrease in the mortality level between1961 and 1966. The crude birth rate reduced from over 35 per thousand tobelow 26 per thousand during this period. The age-specific birth rates obtainedin 1966 from a sample survey of birth records were 23, 228, 260,194,127 and60 for the six quinquennial age groups 15-19, 20-24, . . . , 40-44, respectively.The first three rates were smaller and the last three were larger than thecorresponding age-specific birth rates obtained in 1961. The median number ofchildren for ever married women in age groups over 30 was found from the 1966By-Census results to be increasing. The balance of migration for 1961-1967 wasestimated to vary between a net loss of 14,500 persons a year to a net gain of18,500 persons a year except the year 1962 during which immigration exceededemigration by about 135,000 persons. From the information collected in theBy-Census,(7) it was estimated that nearly 55 per cent of the new arrivals weremales and 45 per cent females. About 28 per cent of the balance of migrationwere below 15 years of age, 63 per cent between 15 and 54, and the other 9 percent were older persons of 55 years old and over.
Table 6.6 Age and Sex Distribution of Migrant Balance
(Percentages)
Age Group Males Females
0 - 4 6.41 5.395 - 9 4.67 3.89
10-14 5.12 2.8315-19 4.00 4.4520-24 6.26 5.1625-29 7.51 5.3130 - 34 5.28 3.7735 - 39 5.51 2.3240-44 2.91 2.5945-49 2.13 1.7550-54 1.61 1.9855 - 59 0.91 1.9860 - 64 0.74 1.65
65 and over 1.56 2.31
Total 54.62 45.38
Source: Hong Kong Population Projections, 1966-1981, p. 4.
(7) Answers to questions of where the respondent was at the 1961 Census and at thebeginning of 1966 provided useful information on the age and sex patterns of thenew arrivals in the past five years.
42

Another population projection for 1966-1981 was prepared based on he1966 By-Census results and the changing vital statistics. Firstly, the 1966By-Census population figures were adjusted, after graduation, to July 1,1966.
Table 6.7 Adjusted Age and Sex Distributionof Population on July 1,1966
Age Group Males Females
0 - 45 - 9
10-1415-1920-2425-2930-3435-3940-4445-4950-5455-5960-6465-6970-7475-79
80 and over
274,100275,100233,600204,100106,900114,200129,200132,100118,60098,300
' 83,40053,10035,40018,20011,3003,9002,600
259,100253,200214,800181,20094,10097,100
115,800127,900115,00093,70082,50063,50055,10038,70026,60012,9007,000
Total 1,894,100 1,838,300
Source: Hong Kong Population Projections 1966-1981, p. 1.
The projections for 1966-1981 were also prepared at three levels, withthe medium projection further divided into three groups. Table 6.8 summarizesthe assumptions on mortality, fertility and migration trends for these projections.
Table 6.8 Mortality, Fertility and Migration TrendsAssumed in the 1966-1981 Projections
ProjectionLevel Mortality Fertility Migration
High To decline along theexponential curveP V " " = 126.5
Medium 1 To decline along theexponential curvePV°" a = 126.5
Medium 2 To remain at the 1966level
Medium 3 To remain at the 1966level
Low To remain at the 1966level
Age-specific birth ratesto remain at the 1966level.10% decrease every 5years for age group15-29 and 2% increasefor age group 30-44.10% decrease every 5years for age group15-29 and no changefor age group 30-44.10% decrease every 5years for age group15-29 and 2% decreasefor age group 30-44.10% decrease every 5years for all age groups.
A net gain of 20,000persons a year
A net gain of 10,000persons a year
A net gain of 5,000persons a year
A net gain of 2,000persons a year
No gain
Source: Summarized from Hong Kong Population Projections 1966-1981. 43

The projected population figures thus obtained varied from 4,106,600persons by low projection to 4,286,900 persons by high projection for 1971,and from 4,934,300 persons by low projection to 5,705,500 persons by highprojection for 1981. This revised high projection figure of 4,286,900 personsfor 1971 was still 100,000 persons less than the previous low projection figurefor 1971 based on the 1961 Census data.
Table 6.9 The Second Population Projection of Hong Kong(1971 and 1981)
Level of Projection
HighMedium 1Medium 2Medium 3Low
Mid-1971
4,286,9004,208,0004,159,7004,135,6004,106,600
Mid-1981
5,705,5005,329,7005,145,1005,060,9004,934,300
Source: Hong Kong Population Projections, 1966-1981.
The Projections for 1971-1991
The 1971 Census, which took place on February 23, 1971 for personsliving afloat in small boats and on March 9, 1971 for land population, returnedthe total number of the Hong Kong population at 3,936,630 persons. Thispopulation total was 350,000 persons below the high projection for 1971 or170,000 persons below the low projection for 1971 based on the 1966By-Census results.
Hong Kong's crude death rate continued to drop slightly from 5.3 perthousand in 1966 to 5.0 per thousand in 1971. From the age-specific deathrates, it could be seen that the death rates for age groups 1-4 and 5-9 reduced by60 to 80 per cent during 1961-1971. The reduction in the female death rates for.quinquennial age groups between 10 and 44 years of age was mostly between 30and 45 per cent, while the reduction in the male death rates for correspondinggroups in this age range was generally not so great in the last decade. For agegroups beyond 45 years, the decline in the death rates was less than 25 per centfor this ten year period. Infant mortality rate fell from 36.3 per thousand livebirths in 1961 to 18.4 in 1971.
The crude birth rate fell from 25.3 per thousand in 1966 to below 20 perthousand in 1971. The age-specific birth rates for the quinquennial groups15-19, 20-24 , . . . , 45-49 were found to be 17.0,145.6, 243.8,162.5, 83.6,28.4and 3.6, respectively. Compared with the 1966 age-specific birth rates, it couldbe noted that greater reduction in the birth rates was recorded in the less fertileage groups of less than 25 years or over 35 years of age. The reduction in thebirth rates of younger age groups of 15-19 and 20-24 might partly be attributed
44

to the fact that young women tended to get married a few years later in recentyears than a decade or so ago.
It was estimated for the ten-year period from mid-1961 to mid-1971 thetotal number of permanent immigrants entered Hong Kong legally was about140,000 and the total number of permanent emigrants from Hong Kong wasprobably a few thousand higher. The total net negative balance of migration forthe period was believed not to exceed 3,400. The number of illegal immigrants,based on the figures of their registering for identity cards, was estimated toaverage about 10,400 persons a year during the period 1963-1970/8-*
In making the projections, the 1971 Census data were firstly adjusted forerror, graduated and brought forward to mid-1971.
Table 6.10 Adjusted Age and Sex Distribution
of Population on July 1,1971
Age Group Males Females
0 - 45 - 9
10-1415-1920-2425-2930-3435-3940-4445-4950-5455-5960-6465-6970-7475-7980- 84
85 and over
209,300262,700271,800227,300177,400116,500115,200133,100134f900116,200101,30076,70054,70028,40018,4007,6003,9001,800
196,700252,000259,600215,100164,40095,40094,400
118,300123,800108,40094,60078,90064,30047,20036,10021,50011,4006,000
Total 2,057,200 1,988,100
Source: Hong Kong Population Projections, 1971-1991, p. 30.
(8) The number of illegal immigrants was estimated to be about 25,700 and 69,600persons for 1961 and 1962, respectively.
45

The future mortality rates were assumed to remain unchanged at the 1971level for the low projection, and to continue to fall at a slower tempo withdifferential rates of decline among different age groups for high and mediumprojections. In estimating the declining age-specific death rates for the futureyears, annual mortality indices between 1961-1971 for each of the broad agegroups 0, 1-4, 5-24, 25-39, 40-54 and 55 and over were computed and fitted toan exponential equation/9^ Then the ratios of the mortality index for futureyears to the 1971 mortality index of the same age group were computed fromthe mortality trend equation of that group, and finally the estimated futureage-specific death rates for males and for females were derived by applying the1971 age-specific death rates to the ratios.
Table 6.11
Age Group
01 - 45 - 9
1 0 - 141 5 - 1920-2425-2930 - 3435-3940-4445-4950-5455 -5960-64
65 and over
Projected Age-Specific Death(1981 and 1991)
1981
Male
18.70.90.40.40.60.91.41.82.44.05.9
10.117.628.762.7
Female
13.80.70.30.30.40.60.70.91.42.23.25.37.8
11.640.4
Rates
Male
16.40.70.40.40 60.81.31.72.33.85.69.6
17.228.061.3
1991
Female
12.10.50.30.30.40.60.70.91.32.13.05.07.6
11.439.5
Source: Hong Kong Population Projections, 1971-1991, pp. 26-27.
(9) The trend equations for the broad age groups 0, 1-4, 5-24, 25-39, 40-54, and 55 andover were found, in that order, to be:Y=1 .731623X-°"""Y = 2.696902X-0-6""5
Y=1.563985X-°'2"2"Y = 1.325554X-°'174»"Y = 1.243038X-°1331!"Y=1.106575X-°-°s9407
46
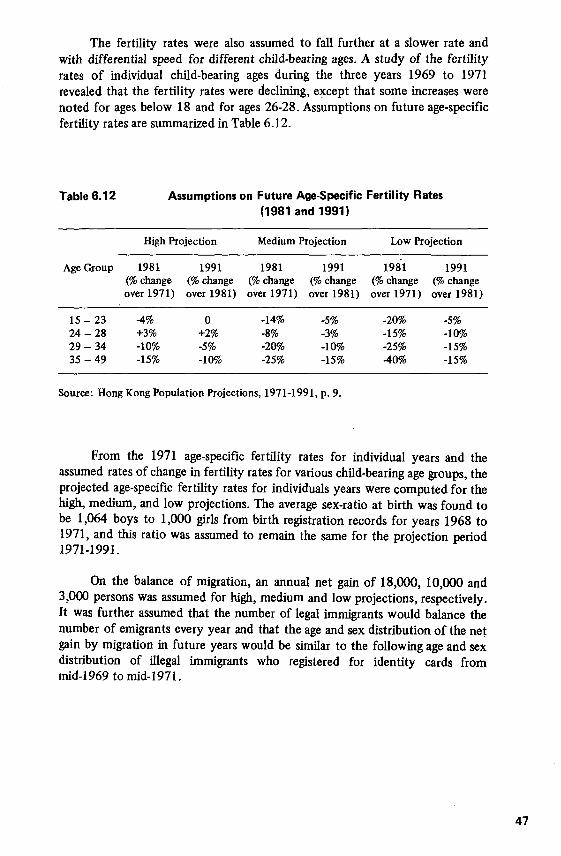
The fertility rates were also assumed to fall further at a slower rate andwith differential speed for different child-bearing ages. A study of the fertilityrates of individual child-bearing ages during the three years 1969 to 1971revealed that the fertility rates were declining, except that some increases werenoted for ages below 18 and for ages 26-28. Assumptions on future age-specificfertility rates are summarized in Table 6.12.
Table 6.12 Assumptions on Future Age-Specific Fertility Rates(1981 and 1991)
High Projection Medium Projection Low Projection
Age Group 1981 1991 1981 1991 1981 1991(% change (% change (% change (% change (% change (% changeover 1971) over 1981) over 1971) over 1981) over 1971) over 1981)
15-2324-2829-3435-49
-4%+3%-10%-15%
0+2%-5%-10%
-14%-8%-20%-25%
-5%-3%-10%-15%
-20%-15%-25%-40%
-5%-10%-15%-15%
Source: Hong Kong Population Projections, 1971-1991, p. 9.
From the 1971 age-specific fertility rates for individual years and theassumed rates of change in fertility rates for various child-bearing age groups, theprojected age-specific fertility rates for individuals years were computed for thehigh, medium, and low projections. The average sex-ratio at birth was found tobe 1,064 boys to 1,000 girls from birth registration records for years 1968 to1971, and this ratio was assumed to remain the same for the projection period1971-1991.
On the balance of migration, an annual net gain of 18,000, 10,000 and3,000 persons was assumed for high, medium and low projections, respectively.It was further assumed that the number of legal immigrants would balance thenumber of emigrants every year and that the age and sex distribution of the netgain by migration in future years would be similar to the following age and sexdistribution of illegal immigrants who registered for identity cards frommid-1969 to mid-1971.
47

Table 6.13 Assumed Age and Sex Distribution of Net Migration(Percentages)
Age Group Males Females
(Sex ratio: 2,791 males to 1,000 females)Under 15 9.3 22.215 - 24 53.8 35.625 - 39 23.2 18.040-54 8.8 13.9
55 and over 4.9 10.3
Total 100.0 100.0
Source: Hong Kong Population Projections, 1971-1991, p. 28.
Based on these assumptions, the low projection gave an eight per centincrease of the population between 1971-1976, and estimated the 1981population at slightly below 4,750,000 persons. The medium projection figureswere about 50,000 persons more than the low projection for 1976 and 120,000persons more for 1981. The high projection averaged an increase of two andone-half per cent per year for L971-1981 and put the estimated population totalbeyond five million for 1981.
Table 6.14 The Third Population Projection of Hong Kong(1971-1991)
Year
1971197219731974197619811991
High Projection
4,045,3004,122,8004,203,7004,288,3004,471,1005,010,9006,336,600
Medium Projection
4,045,3004,114,4004,185,8004,260,1004,417,8004,865,5005,895,500
Low Projection
4,045,3004,106,9004,170,0004,234,9004,370,6004,741,2005,526,200
Source: Hong Kong Population Projections, 1971-1991.
48

The mid-1974 population was estimated to be 4,248,700, which wasbetween the low projection figure 4,234,900 and the medium projection figure4,260,100. If the growth of Hong Kong population continues to go along withthe projections, it would be reasonable to have a population of around4,800,000 persons for Hong Kong in 1981. Table 6.15 shows the age and sexdistribution of the Hong Kong population in 1981 as projected by the low andmedium projections.
Table 6.15
Age Group
0 - 45 - 9
10-1415-1920-2425-2930-3435-3940-4445-4950-5455-5960-6465-6970-7475-7980-84
85 and over
Total
The Age and Sex Distribution of theProjected 1981 Population of
(in thousands, low and medium
Medium Projection
Males
272.2221.9210.3269.3290.1244.3182.3117.8114.9129.7127.9105.5
85.257.835.615.07.33.1
2,490.2
Females
257.1209.7197.9254¡8263.3218.0165.495.794.0
116.7120.6103.587.970.453.034.221.012.1
2,375.3
Total
529.3431.6408.2524.1553.4462.3347.7213.5208.9246.4248.5209.0173.1128.288.649.228.315.2
4,865.5
Hong Kongprojections)
Low Projection
Males Females
252.3215.4208.4264.4279.1231.5174.6114.2112.4127.7126.0103.984.056.734.914 67.23.0
2,410.3 2
238.6203.9196.3252.3260.1214.9163.594.793.1
115.8119.6102.587.269.652.433.820.811.8
,330.9
Total
490.9419.3404.7516.7539.2446.4338.1208.9205.5243.5245.6206.4171.2126.387.348.428.014.8
4,741.2
Source: Hong Kong Population Projections, 1971-1991.
49

REFERENCES
"Hong Kong 1841 Census", Hong Kong: Government Gazette, 15 May 1841,p. 289.
Registrar General's Office, Census Returns of various years between 1853 and1876, reported in Hong Kong Government Gazette, various years.
Registrar General's Office, "Hong Kong: Census of 1881", Government Gazette,11 June 1881, pp. 436-445.
Registrar General's Office, "Hong Kong: Census Report 1891", Sessional Papers,No. 30-91, pp. 373-395.
Registrar General's Office, "Hong Kong: Report on the Census of the Colonyfor 1901", Sessional Papers, No. 39/1901, pp. 715 (1-25).
Registrar General's Office, "Hong Kong: Report on the Census of the Colonyfor 1911", Sessional Papers, No. 17/1911, pp. 103 (1-62).
Registrar General's Office, "Hong Kong: Report on the Census of the Colonyfor 1921", Sessional Papers, No. 15/1921, pp. 151-232.
Registrar General's Office, "Hong Kong: Report on the Census of the Colonyof Hong Kong, 1931", Sessional Papers, No. 5/1931, pp. 87-197.
Census Commissioner, "Hong Kong: Report on the 1961 Census (3 volumes)",Government Printer, Hong Kong, 1962.
Commissioner for Census and Statistics, "Hong Kong: Report on the 1966 By-Census (2 volumes)", Government Printer, Hong Kong, 1967.
Census and Statistics Department, "Hong Kong Population and Housing Census1971 Main Report", Government Printer, Hong Kong, 1972
Census and Statistics Department, "Hong Kong Statistics, 1947-1967", Govern-ment Printer, Hong Kong, 1969.
Census and Statistics Department, "Hong Kong Monthly Digest of Statistics",Government Printer, Hong Kong, various issues.
Economic and Social Commission for. Asia and the Pacific, United Nations,"Country Monograph Series No. 1 - Population of Hong Kong", ESCAP,Bangkok, 1974.
50
