the port attractiveness index: application on african...
TRANSCRIPT
_____________________ Région et Développement n° 41-2015 __________________
THE PORT ATTRACTIVENESS INDEX: APPLICATION ON AFRICAN PORTS
Simone CASCHILI*, Francesca MEDDA
**
Abstract - The overall operational reputation of a port is based on objective factors, including infrastructure endowments and efficiency in the logistics chain as well as on perceived subjective factors such as reliability, and level of corruption. In this work we analyze the concept of port attractiveness, starting with the hypothesis that subjective port determinants (i.e., user perception) and objective/endogenous and exogenous factors can be quantified together. We thus determine the Port Attractiveness Index and test it using 41 container ports of 23 African countries for the period 2006-2010. We apply a bottom-up ap-proach to investigate the structural relationships among the three sets of deter-minants (endogenous, exogenous and subjective) that impact on port attractive-ness. Our methodological approach employs structural equation modeling. Results indicate that subjective factors are indeed influential variables for port attractiveness. Moreover, when examining port attractiveness and investment strategies, we demonstrate that in many cases in African ports governments should implement soft infrastructure as a first step rather than investing in hard infrastructures.
Key-words - SHIPPING, MARITIME TRADE, PORT REPUTATION, AFRICA, STRUCTURAL EQUATION MODELING
JEL Classification - C49, F14, R40
This work was awarded the Hanjin Prize for the Best Paper Award at IAME Conference 2013, Marseille.
* UCL QASER Lab & CASA, University College London ; [email protected]
** UCL QASER Lab, University College London ; [email protected]
48 Simone Caschili, Francesca Medda
1. INTRODUCTION
Maritime ports, and investments to target their expansion, are often deemed by governments not only as an important enhancement of their national assets but also as a means of establishing a gateway to the global shipping network. International trade at present comprises 80% of goods transported via seagoing routes; in the last two decades, ports have grown rapidly to become increasingly specialized, highly capital intensive, and able to carry out a wide range of value-added activities. The recent financial crisis and the consequent restricted availa-bility to credit highlights a major long-term challenge for port investment, which is how to attract the private sector in the financing of port developments in order to maintain and increase market share while achieving profit margins. Foreign direct investment (FDI) in ports is generally very successful; and effec-tive strategies, particularly in developing countries, where international terminal operators (ITOs) in Africa and South Asia are responsible for over 75% of pri-vately-handled containers and cargo (Drewry, 2010), are proof positive of this success. But as observed by UNCTAD (2011), although an attractive option, FDIs are not always simple to implement.
One of the main difficulties of FDIs is that the flow of private investment, as by ITOs, is often decided on the basis of available information and data. This information not only describes the features of the ports, such as possible market size, emergence of inland trade, and transshipment capability, but may also refer to the economic and policy environment of the host country and may in-clude policy stability, regulatory transparency, support for the investment, and so forth. However, it is important to stress that, in developing countries espe-cially, this information is often unreliable and disputable due to ineffective data collection practices, corruption aimed to inflate or deflate the significance of the data, and underinvestment by administrative agencies. Nonetheless, a combina-tion of perceived and actual robust information undeniably provides investors with a financial picture of the level of attractiveness of a port when considering potential investment. From this perspective, port attractiveness is pivotal to the financial decisions of investors and should not be underestimated in scholar and practitioner analyses.
Although port attractiveness is not a new topic, the literature on the subject is still rather limited (Ng, 2006). Most authors have studied port attractiveness through survey methodologies which apply shippers’ perspectives based on their selection of ports during cargo route planning (Tongzon, 2009). Scholars have analyzed a wide range of determinants for port attractiveness, and these tend to vary according to survey sample (i.e., shipping lines, freight forwarders or independent shippers), and study area (i.e., North America, Europe, South-east Asia). Port attractiveness determinants can generally be grouped into three categories: endogenous, exogenous and subjective. Endogenous factors regard the port directly: port infrastructure endowment (Murphy et al., 1994; Slack, 1985; Tiwari et al., 2003; Tongzon, 2002; Ha, 2003), monetary costs (Murphy et al., 1994; Ha, 2003; Foster, 1978; Tongzon, 2002; Tiwari et al., 2003; Foster, 1978; Lirn et al., 2003), logistic efficiency (Murphy et al., 1994; Slack, 1985;
Région et Développement 49
Tiwari et al., 2003; Tongzon, 2002 and 2009; Ha, 2003), and port accessibility (Huybrechts et al., 2002).
On the other hand, exogenous factors include a number of external determi-nants that influence port throughput indirectly: national and local economic competitiveness (Przybyłowski, 2008; OECD, 2008), geographic location (Ti-wari et al., 2003; Tongzon, 2002; Lirn et al., 2003; Ha, 2003), and shipping line characteristics (Noteboom, 2009; Slack, 1985; Tiwari et al., 2003). The third category, subjective factors, leverage port attractiveness and above all refers to the reputation of a port among sector operators (Lirn et al., 2003; Ng, 2006; Tongzon, 2002; Daya et al., 2006; Bird and Bland, 1988).
Whereas, subjective factors consider assistance, flexibility, and communica-tion with customers (Murphy et al., 1994; Ha, 2003; Tongzon, 2002; Slack, 1985), shippers’ experience (Slack, 1985; Noteboom, 2009), and tradition, per-sonal contacts, and level of cooperation among shippers (Tongzon, 2009). Ac-cording to some authors (inter alia Foster, 1978 and Lirn et al., 2003), endoge-nous factors are the most significant determinants of port attractiveness. Alt-hough a number of authors recognize that exogenous and subjective determi-nants are also influential, to the best of our knowledge, no study has yet at-tempted to propose an analytical model to consider endogenous, exogenous and subjective determinants altogether in the evaluation of port attractiveness.
Against this background we contribute to existing literature by setting out a quantitative approach to assess port attractiveness. Our aim is to construct a synoptic index which can be used by various stakeholders (i.e. government bod-ies, investors and researchers) to evaluate and compare qualitative and quantita-tive characteristics of ports in a region (i.e., attractiveness of ports). We con-struct the Port Attractiveness Index and apply it to the case of African ports. Our methodology exploits a bottom-up statistical approach (structural equation modeling, SEM) which allows one to investigate and combine causal relation-ships among exogenous, endogenous and subjective determinants and to meas-ure their significance. The advantage in the use of SEM methodology resides in modeling exogenous, endogenous and subjective determinants as latent varia-bles. With this approach we achieve two goals: 1) we relate observed variables to the selected polytomous factors (latent structural determinants) and we eval-uate their impacts, and 2) we scrutinize the effect of each latent structural de-terminant on port attractiveness. By means of the research framework illustrated thus far, we structure the analysis in a framework of step-by-step research ques-tions as follows:
1: What is the attractiveness of ports and how we can measure it?
2: How do we construct the Port Attractiveness Index by combining endoge-nous, exogenous and subjective variables?
3: Is it possible to construct a synoptic index that estimates the relative im-portance of the attractiveness of a port, given its endogenous, exogenous and subjective variables? In particular, we also want to test the following assump-tion that soft infrastructure consisting of three components – port reputation,
50 Simone Caschili, Francesca Medda
economic development of port hinterlands, and quality of port facilities – is a major determinant of port attractiveness.
4: Is the Port Attractiveness Index suitable to benchmark ports’ characteris-tics and performances?
In our discussion of the Port Attractiveness Index, we have decided to test the index on Africa ports, but this choice is not a fortuitous one. As data on the Africa maritime industry and its trade growth is scant, the data which is availa-ble is often biased towards an oversimplified perception of the entire continent which tends to perpetuate false and partial opinions of African countries (Adichie, 2009). Scholars have quantitatively assessed ‘perception’ through the use of such indicators as country corruption
3 and logistics performance index.
4
The aforementioned indices have been constructed on the basis of surveys with experts, companies and individuals. In particular, Refas and Cantens (2011) have studied the perception of cargo dwell time in the port of Douala and Cam-eroon. Daya et al. (2006) have shown that corruption and the perception of cor-ruption are impediments to trade, because they increase both the risk and the cost of conducting business in African countries. An Ernst & Young survey (2011) has investigated the perception of investments in Africa, and findings yield generally positive perceptions over the medium to long-term.
In this work we will address the subjective variable ‘perception’ by examin-ing 41 container ports in 23 different countries and show through the use of observed macro-economic, socio-economic and infrastructure variables how very different economic and financial opportunities coexist on the African con-tinent. This objective is partially the inspiration for this new Index, since for the case of African ports a positive perception and reputation is critical to the long-term growth of the continent. In fact, the Minister of Trade, Industry, Private Sector Development of Ghana has observed that “the issue of negative percep-tion of Africa by the European and other business communities has played a major role in impeding efforts at attracting much needed level of Foreign Direct Investment.”
5
The structure of the analysis is as follows. In the next section we discuss the methodology applied to study port attractiveness and subsequently construct the Port Attractiveness Index. In Section 3 we present the data set used for the case study of 41 container ports in Africa. In Section 4 we show the results of our case study, and round out the paper in Section 5 by restating our conclusions and discussing future research.
2. METHODOLOGY
Our literature review on port attractiveness in the previous section highlights the limited attention given to the notion of port attractiveness in maritime stud-ies. As stated in our first research question, it is necessary to provide an unam-
3 http://www.transparency.org/cpi2011/results
4 http://data.worldbank.org/data-catalog/logistics-performance-index
5 Source: www.ghananewsagency.org
Région et Développement 51
biguous definition of port attractiveness as the cornerstone of the Port Attrac-tiveness Index. We define port attractiveness as the combination of the produc-tive capacity of a port and its level of international competitiveness which pro-vides direct and indirect economic benefits. A port generates freight traffic through its interconnectedness with inland trade routes and with other regional and international ports. Thus, in order to be attractive and competitive, ports often need to be integrated vertically, i.e., secure maritime routes and landside operations; and integrated horizontally, i.e., highly specialized with a wide geo-graphical market share. The implication here is that a port must be equipped with effective facilities, it must provide reliable services at the lowest price, and it needs to have an efficient productivity level. These characteristics altogether comprise the reputation of a port as an intricate network of operators, investors and maritime brokers.
As discussed in the Introduction, three main categories of key variables are influential in port attractiveness. These variables, i.e., endogenous, exogenous and subjective variables, and in particular the subjective variables, are often collected via surveys (Sequeira, 2012). However, survey methodologies are expensive to carry out and are also time consuming, therefore as an alternative method in this study we consider the copious data collected from third-party organizations (i.e., World Bank, Containerisation International, UNCTAD, in-ternet flows, crowd sourcing data etc.) in order to increase the scale and volume of the examined data as well as variety of the data. After having collected a significant volume of multivariate data, our next step in the analysis is to select a methodology that best supports our objectives: to construct a synoptic index that defines and assesses port attractiveness by means of port variables that are not directly observable (latent variables). Structural Equation Modeling (SEM) is a robust statistical methodology perfectly suited to our calculation of the causal relationships between the variables influencing port attractiveness (Ullman and Bentler, 2012).
SEM is a method similar to multiple regression analyses of factors in the case of multivariate data. However, when compared to multiple linear regres-sion, SEM has many advantages which, as observed by Kline (2011), include greater flexibility in assumption definitions (particularly in cases of multi-collinearity), the capacity to structure confirmatory factor analysis, the use of latent variables (i.e., predictors not directly observable), the ability to model error terms and test coefficients across multiple and between-subjects groups, and to handle time series with auto correlated errors, non-normal and incom-plete data. In general, Structural Equation Modeling has been applied with one of the following approaches (Ullman and Bentler, 2012):
1. Strictly confirmatory approach: a model is tested using SEM goodness-of-fit tests to determine if variance and covariance in the data are consistent with a model specified by the analyst.
2. Alternative modeling approach: two or more causal models are tested to determine which has the best fit.
52 Simone Caschili, Francesca Medda
3. Model development approach: SEM application usually combines con-firmatory and exploratory purposes. When a model is tested using SEM proce-dures, if it is found to be unsatisfactory, an alternative model is tested based on changes suggested by SEM modification indexes.
In our study we apply the model development approach (3); in this case the statistical properties and applications of SEM are well developed and the ap-proach has been implemented across several research fields, including educa-tion (Timothy and Myint, 2009), psychology (MacCallum and Austin, 2000; Agho et al., 1992), sociology (Bielby and Hauser, 1977), econometrics (Dell’Anno and Schneider, 2009; Amemiya 1985), and logistics (Stank et al., 2001; Dunn et al., 1994). SEM has been applied in maritime industry studies in order to analyze liner service capacity (Venus Lun et al., 2011), vertical integra-tion between shipping lines and ports (Bichou and Bell, 2007), linkages be-tween inter-organizational culture, trust, knowledge sharing, collaboration, and performance in the maritime supply chain (Nir et al., 2012), influence of rela-tionship orientation in third-party logistics (Panayide and So, 2005), and the propensity for shippers to use Internet services in liner shipping (Lu et al., 2007). Guo et al. (2009) used path analysis and structural equation modeling to examine influential factors for the dry bulk shipping market. Beyond specific applications in the maritime industry but pertinent to our interest in this work, SEM has also been applied to the analysis of user perception, in for example, the ease to use technology (Fishbein and Ajzen, 1975; Davis, 1989; Ajzen, 1991) and the perception of security protection and satisfaction of e-commerce users (Glover and Benbasat, 2010). Given this backdrop, in the next sections we will discuss the two additional questions (Q2 and Q3) initially posed: how to build the Port Attractiveness Index and how to estimate the different parameters of the three categories of variables: endogenous, exogenous and subjective.
2.1. Port Attractiveness Index
In order to construct the Port Attractiveness Index, we assume that the high-er the value of endogenous, exogenous and subjective variables (hereafter called key constructs) the higher the Port Attractiveness Index (Figure 1).
To validate the structural models of port attractiveness, we need to test the structural causal relationships between the three key constructs: endogenous variables (F), exogenous variables (D) and subjective variables (R). The three key constructs are latent variables that determine the attractiveness of a port (A). The exogenous latent variables D are meant to represent the socio-economic level of port hinterlands and the quality of their governance. D can be dependent on several variables such as economic development (Mazumdar, 1996), quality of telecommunication infrastructure (Oyelaran-Oyeyinka and Lal, 2005), and integrity level (i.e., level of corruption, accountability in gov-ernance, etc.) (Montinola and Jackman, 2002).
Key construct F refers to the infrastructural and operational level of the port (endogenous variables). F is usually dependent on variables such as port facili-ties (Slack, 1985; Tongzon, 2002), logistic efficiency (Murphy et al., 19994;
Région et Développement 53
Ha, 2003; Foster, 1978; Tongzon, 2009) and port productivity (the higher the port throughput, the higher the infrastructure level of a port). The most innova-tive part of our study through the use of SEM is to quantitatively evaluate port reputation represented by the subjective key construct R. In this case, we as-sume that R is dependent on variables such as port quality (from shippers’ point of view), centrality in the international shipping network (the higher the inter-connectivity of a port in the global shipping network, the higher its reputation in the industry), level of reliability, security level (i.e., piracy attacks in Africa, (the higher the level of piracy risk closer to a port, the lower its reputation will be).
Figure 1. Structural equation model of causal relationships between factors in port attractiveness
Source: Authors elaboration.
We linearly combine the causal relationships obtained from the SEM to
build the Port Attractiveness Index Φ. The index Φij for port i in the j
th year can
be written in mathematical terms as follows:
Φ𝑖𝑗
= 𝛼𝐴𝑅 ∗ 𝑅𝑖𝑗
+ 𝛼𝐴𝐹 ∗ 𝐹𝑖𝑗
+ 𝛼𝐴𝐷 ∗ 𝐷𝑖𝑗 (1)
where:
𝑅𝑖𝑗
= ∑ 𝛼𝑟𝑘 ∗ 𝑟𝑖,𝑘𝑗
𝑛𝑘=1 (2)
𝐹𝑖𝑗
= ∑ 𝛼𝑓𝑘∗ 𝑓𝑖,𝑘
𝑗 𝑛
𝑘=1 (3)
𝐷𝑖𝑗
= ∑ 𝛼𝑑𝑘∗ 𝑑𝑖,𝑘
𝑗 𝑛
𝑘=1 (4)
54 Simone Caschili, Francesca Medda
αAR , αAF , αAD , αrk , αfk and αdk are the path loadings obtained from the
SEM and represent the relative importance of each key construct and measured
variable; ri,kj
, fi,kj
and di,kj
are the kth observed variables for port i in the j
th year.
In Annex 1 we present a brief overview of SEM for readers not familiar with this methodology.
3. CASE STUDY: ATTRACTIVENESS OF AFRICAN PORTS
After the 2008 financial crisis, the container industry, although growing steadily until that time, recorded global losses of around USD 1.5 billion in 2009 (Beddow, 2010). The economic turbulence generated by the 2008 down-turn had forced carriers to reorganise liner services. For instance, inter-carrier cooperation (i.e., vessel sharing) has become an unavoidable option for most container liners in order to share investment risk and reduce financial losses (Notteboom et al., 2010; Caschili et al., 2014). It has been argued that such stark economic events could shock the global system and force leading manu-facturing suppliers to search for new trading partners (Sturgeon and Kawakami, 2010). While western countries and specifically countries within the Euro mon-etary zone are still coping with weak economies, Africa is experiencing its big-gest economic boom in 30 years. During the period 1980-2000, the rest of the world grew at an average rate of 5% per annum faster than Africa. However, since the early 2000s the growth rate in Africa has accelerated, and countries such as Ethiopia, Mozambique, Tanzania, Ghana, Zambia, and Nigeria are ex-pected to grow at a rate of between 7 and 8% by 2015 (IMF, 2011). In this period, new trends are emerging in the trading market; the US and EU are still the leading commercial partners in Africa, but in recent years countries in East Asia and South America have rapidly been gaining new market share in Africa (Afribiz.info., 2011). At present, most of the inbound container traffic in Afri-can ports comes from Asia; approximately 60% of Western African containers come directly from China, the leading commercial partner for countries such as the Republic of Congo (40%) and Nigeria (50%). Trade between China and Africa has increased from USD10 billion in 2000 – to USD127 billion in 2010 – while all trade between Asia and Africa has climbed to USD304 billion in 2010. The total trade of Asia-Africa is forecast to soar to over USD1.5 trillion by 2020 (Jagtiani and Krishnan, 2011).
However, structural problems still hinder the growth of most African mari-time trade. A lack of modern ports and underdeveloped inland transportation and logistics limits their efficiency and thus their capacity to grow (Mbekeani, 2010). Some ports experience high levels of inland congestion; for example, in Apapa (Nigeria), truck drivers must wait four to five days merely to gain access to the port. In some countries problems are worsened by customs requirements. In the Democratic Republic of Congo exports need 18 days on average to clear the customs controls, and in Mozambique the waiting period is approximately 10 days.
6 Despite the long waiting times, between 2006 and 2010 a noticeable
6 Source: Catalog Sources World Development Indicators (World Bank data set).
Région et Développement 55
increase in container traffic was recorded at some African ports, such as Toa-masina (Madagascar) with a 34% rise, Port Said (Egypt) 26%, Maputo (Mozambique) 24%, and Durban (South Africa) 8%.
7
According to Zafar (2007), several factors have stimulated the growth of container traffic in Africa, and by so doing have cultivated a positive cyclical effect: steady economic growth, lower political instability and criminality, and increased foreign investment. The distribution of Foreign Direct Investment (FDI) is, however, still uneven on the African continent: Morocco, Angola, Equatorial Guinea, Nigeria, and Sudan absorb about 50% of the total inflows to Africa (Dupasquier and Osakwe, 2005). We observe however, that since 2008 there have been a number of major investments dedicated to the construction and upgrade of ports in Guinea (Conakry’s port: EU500 million); Togo (Lome port: new container terminal for 7000+ TEU containerships – EU60 million); Cameroon (deep water port in Kribi: USD489 million); Kenya (construction of a second container terminal in Mombasa port: USD180 million – and a new port in Lamu costing USD3.5 billion); Tanzania (construction of two container terminals in the port of Dar Es Salam: USD460 million); South Africa (expan-sion of the port of Durban for USD4.3 billion and construction of a new port in Ngqura amounting to USD1.3 billion); Cote D’Ivoire (investments in terminal capacity, road and rail upgrades on hinterland linkages of the Abidjan port: USD90 million); Morocco (Tangier-Med I, concluded in 2007 and its expansion Tangier-Med II started in 2009: EU200 million). Nonetheless, investment in African ports remains comparatively low and more financial private interven-tion is needed to improve port infrastructure and logistics and links with hinter-lands (Mafusire et al., 2010).
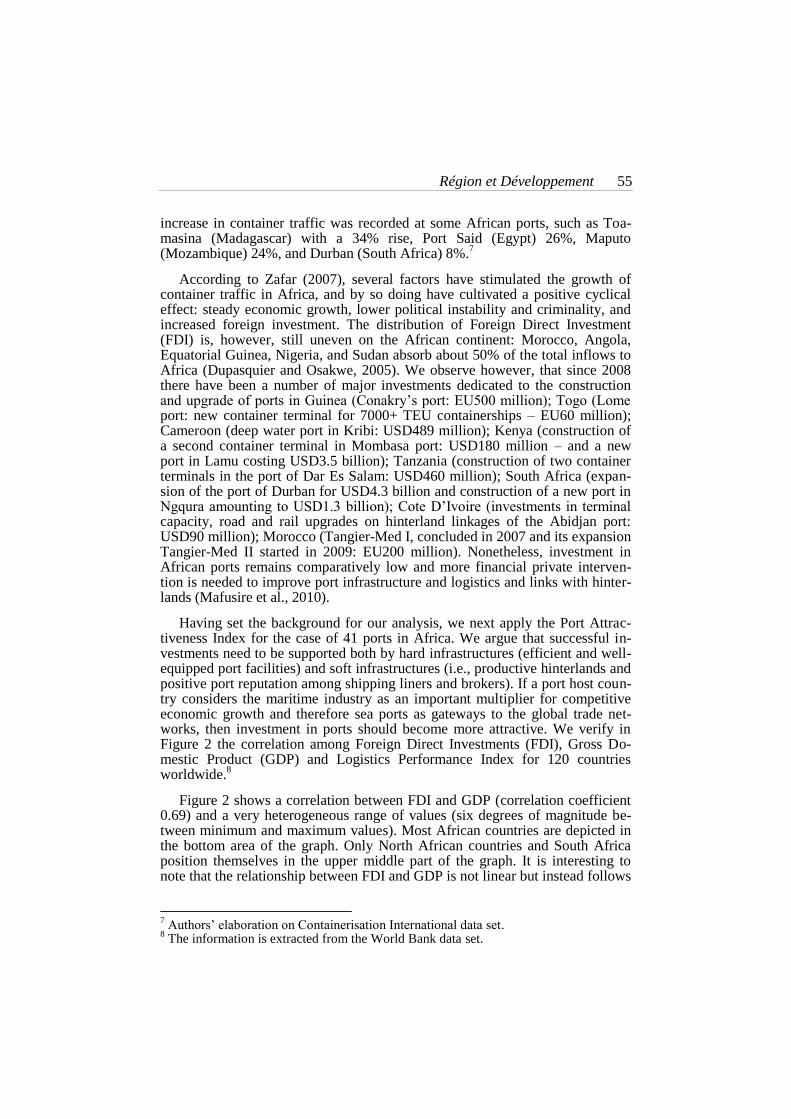
Having set the background for our analysis, we next apply the Port Attrac-tiveness Index for the case of 41 ports in Africa. We argue that successful in-vestments need to be supported both by hard infrastructures (efficient and well-equipped port facilities) and soft infrastructures (i.e., productive hinterlands and positive port reputation among shipping liners and brokers). If a port host coun-try considers the maritime industry as an important multiplier for competitive economic growth and therefore sea ports as gateways to the global trade net-works, then investment in ports should become more attractive. We verify in Figure 2 the correlation among Foreign Direct Investments (FDI), Gross Do-mestic Product (GDP) and Logistics Performance Index for 120 countries worldwide.
8
Figure 2 shows a correlation between FDI and GDP (correlation coefficient 0.69) and a very heterogeneous range of values (six degrees of magnitude be-tween minimum and maximum values). Most African countries are depicted in the bottom area of the graph. Only North African countries and South Africa position themselves in the upper middle part of the graph. It is interesting to note that the relationship between FDI and GDP is not linear but instead follows
7 Authors’ elaboration on Containerisation International data set.
8 The information is extracted from the World Bank data set.
56 Simone Caschili, Francesca Medda
a power law,9 which means that richer countries are able to attract higher for-
eign investments. We also observe that the Logistic Performance Index grows as GDP and FDI increase. Thus, as already discussed in the literature (Mohey-ud-din, 2007; Hong, 1997; Bhandari et al., 2007; Moshirian, 2008), our prelim-inary investigation confirms that FDI may act as a multiplier in the economic growth of a country.
Figure 2. Log-log scatter plot of FDI versus GDP for 120 countries in 2007
Legend: Country circle size is proportional to the Logistic performance index and col-ours identify country membership in continents. Source: Authors elaboration on World Bank data set. 3.1. Data set
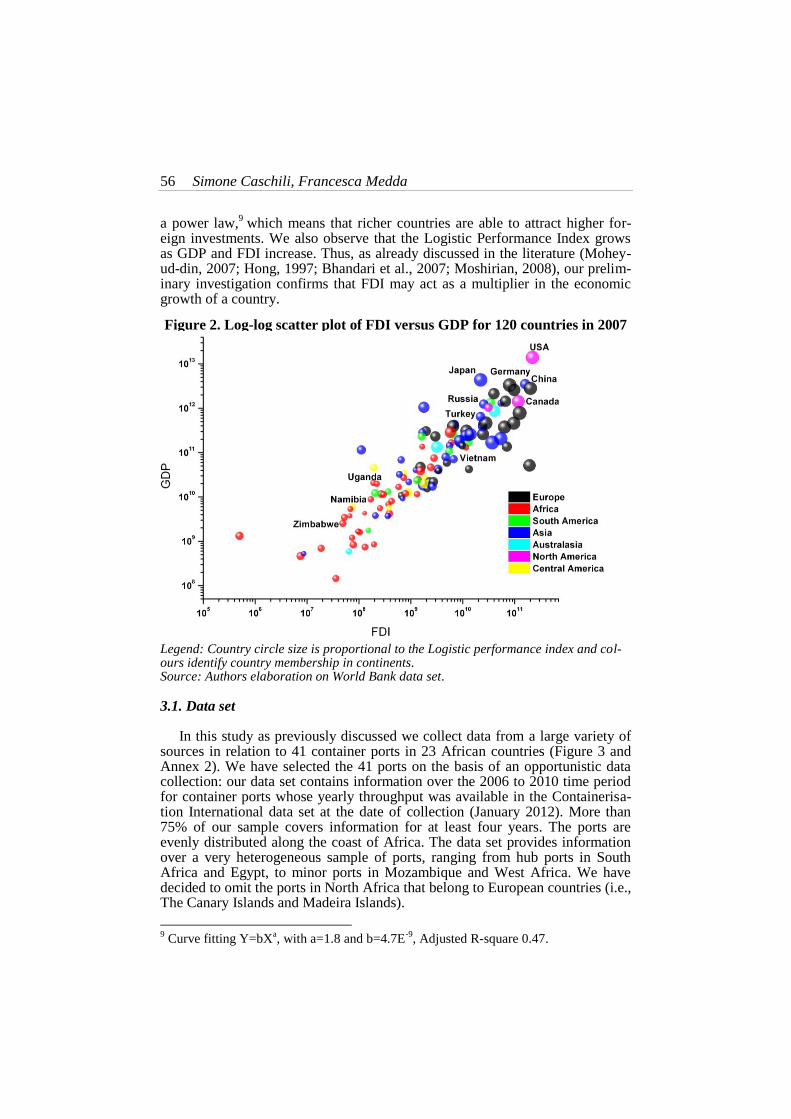
In this study as previously discussed we collect data from a large variety of sources in relation to 41 container ports in 23 African countries (Figure 3 and Annex 2). We have selected the 41 ports on the basis of an opportunistic data collection: our data set contains information over the 2006 to 2010 time period for container ports whose yearly throughput was available in the Containerisa-tion International data set at the date of collection (January 2012). More than 75% of our sample covers information for at least four years. The ports are evenly distributed along the coast of Africa. The data set provides information over a very heterogeneous sample of ports, ranging from hub ports in South Africa and Egypt, to minor ports in Mozambique and West Africa. We have decided to omit the ports in North Africa that belong to European countries (i.e., The Canary Islands and Madeira Islands).
9 Curve fitting Y=bX
a, with a=1.8 and b=4.7E
-9, Adjusted R-square 0.47.
Région et Développement 57
Figure 3. Visualization of the 41 African ports considered
Legend: Size and color of ports are visualized according to the average throughput recorded over the 2006 to 2010 time period. Source: Authors elaboration on Contenarisation International data set.
The average value of port throughput is 455,872 TEUs per year, with a
standard deviation of 675,649, indicating a wide range of throughputs in our sample; the maximum value is 3.6 million TEUs for Port Said (Egypt) in 2010. We have recorded the minimum volume of TEU (3,332) in Richard Bay (South
58 Simone Caschili, Francesca Medda
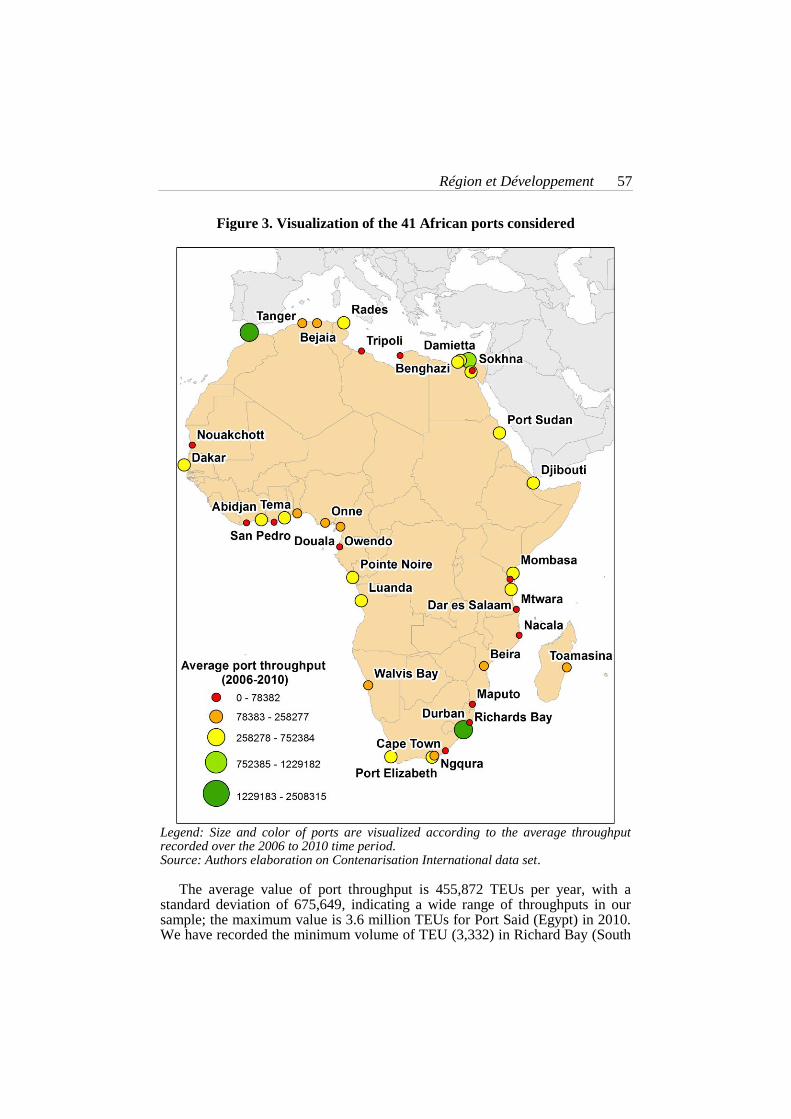
Africa) in 2006. A few ports in geographically-strategic locations (i.e., Egypt because of the Suez Canal, Morocco because of the Strait of Gibraltar, and South Africa because of the Cape Town route) dominate the market, while the remaining ports are growing steadily but with low annual throughputs. In Figure 4 we visualise port throughput trends by region for ports where information is available for at least three years in the observed time period 2006 to 2010.
Figure 4. Port throughput trends between 2006 and 2010
Source: Authors elaboration on Contenarisation International data set.
With the exception of a few unstable trends in the ports of Abidjan and Da-kar, the other ports have positive or stable trends. Northern Africa is dominated by Port Said, which is located on the Suez Canal and works mainly as a tran-shipment point. Ports in Eastern Africa have all increased their throughput be-tween 2006 and 2010. The Southern Africa region handles the highest volumes of TEU, although ports in Southern Africa have experienced a slight decrease of container throughput since 2008. Finally, Eastern Africa had the highest boom in containerisation: the ports of Dar es Salaam, Djibouti and Mombasa clearly increased container volumes during the reference period.
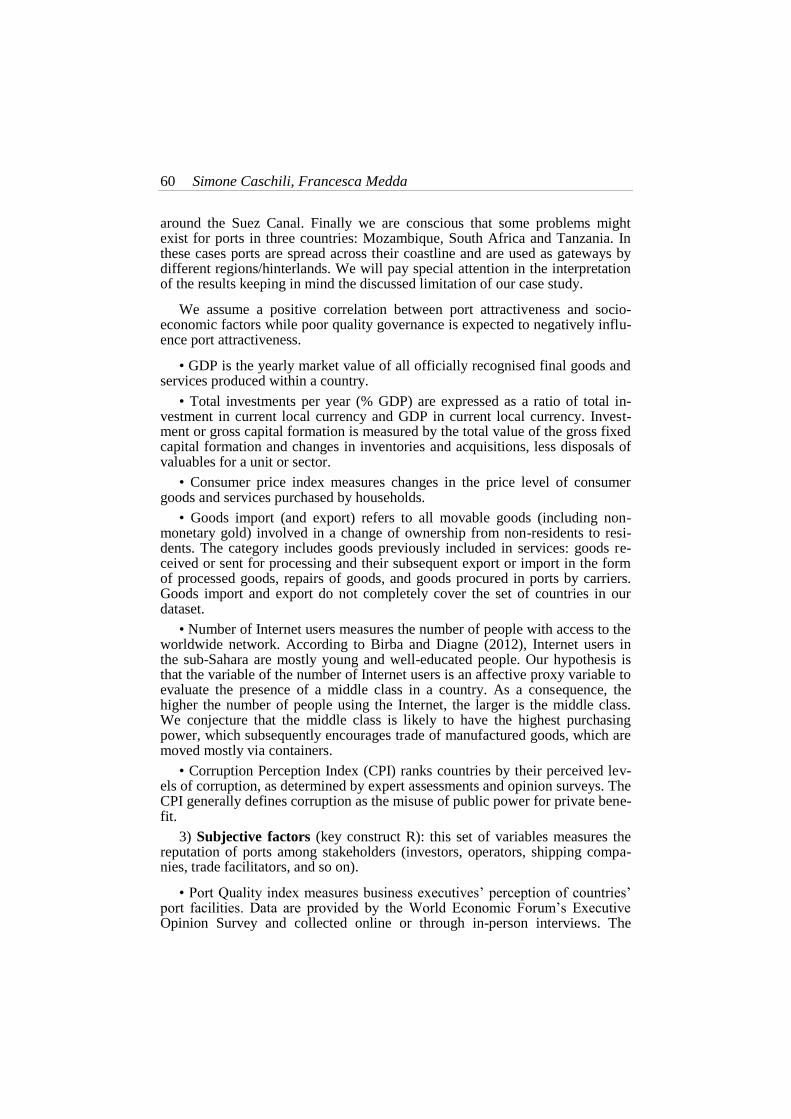
In the remainder of this section we provide a description of the observed var-iables used in the SEM. Table 2 summarizes and provides references for each variable. It is worth mentioning that some of the variables described below were not used in the final configuration of the Port Attractiveness Index. The exclu-sion of some variables has been due to goodness-of-fit reasons of the SEM.
Région et Développement 59
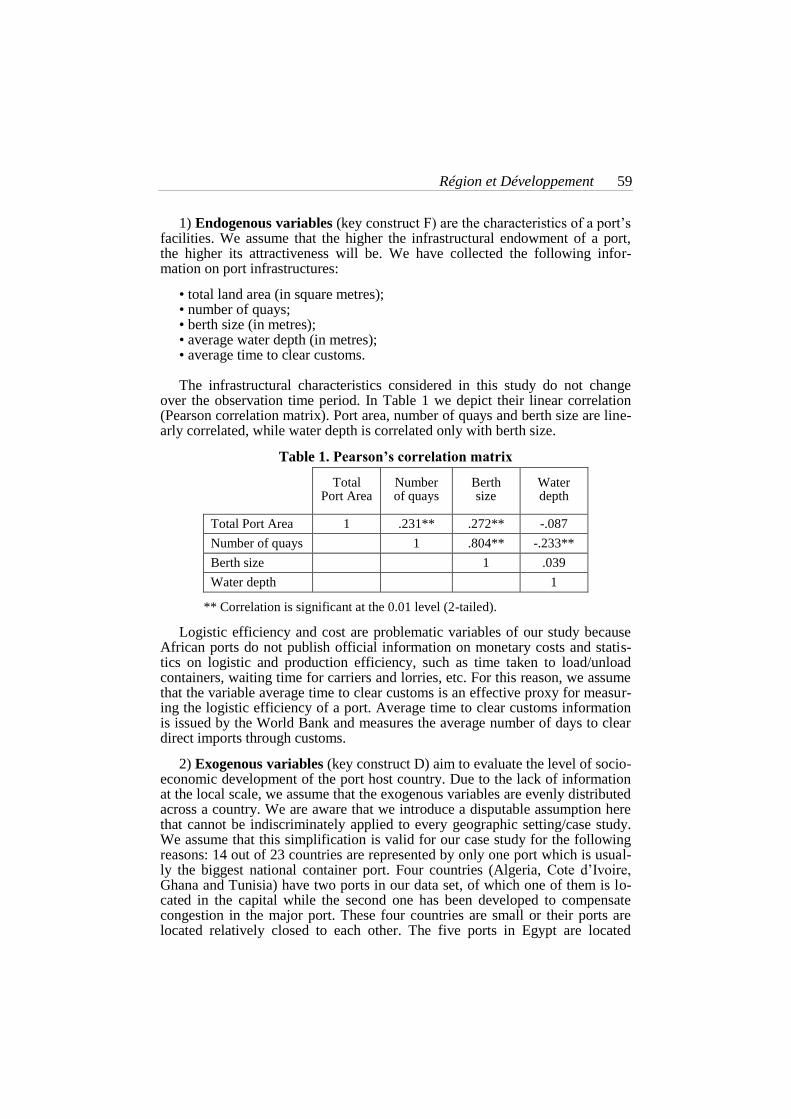
1) Endogenous variables (key construct F) are the characteristics of a port’s facilities. We assume that the higher the infrastructural endowment of a port, the higher its attractiveness will be. We have collected the following infor-mation on port infrastructures:
• total land area (in square metres); • number of quays; • berth size (in metres); • average water depth (in metres); • average time to clear customs. The infrastructural characteristics considered in this study do not change
over the observation time period. In Table 1 we depict their linear correlation (Pearson correlation matrix). Port area, number of quays and berth size are line-arly correlated, while water depth is correlated only with berth size.
Table 1. Pearson’s correlation matrix
Total
Port Area Number of quays
Berth size
Water depth
Total Port Area 1 .231** .272** -.087
Number of quays 1 .804** -.233**
Berth size 1 .039
Water depth 1
** Correlation is significant at the 0.01 level (2-tailed).
Logistic efficiency and cost are problematic variables of our study because African ports do not publish official information on monetary costs and statis-tics on logistic and production efficiency, such as time taken to load/unload containers, waiting time for carriers and lorries, etc. For this reason, we assume that the variable average time to clear customs is an effective proxy for measur-ing the logistic efficiency of a port. Average time to clear customs information is issued by the World Bank and measures the average number of days to clear direct imports through customs.
2) Exogenous variables (key construct D) aim to evaluate the level of socio-economic development of the port host country. Due to the lack of information at the local scale, we assume that the exogenous variables are evenly distributed across a country. We are aware that we introduce a disputable assumption here that cannot be indiscriminately applied to every geographic setting/case study. We assume that this simplification is valid for our case study for the following reasons: 14 out of 23 countries are represented by only one port which is usual-ly the biggest national container port. Four countries (Algeria, Cote d’Ivoire, Ghana and Tunisia) have two ports in our data set, of which one of them is lo-cated in the capital while the second one has been developed to compensate congestion in the major port. These four countries are small or their ports are located relatively closed to each other. The five ports in Egypt are located
60 Simone Caschili, Francesca Medda
around the Suez Canal. Finally we are conscious that some problems might exist for ports in three countries: Mozambique, South Africa and Tanzania. In these cases ports are spread across their coastline and are used as gateways by different regions/hinterlands. We will pay special attention in the interpretation of the results keeping in mind the discussed limitation of our case study.
We assume a positive correlation between port attractiveness and socio-economic factors while poor quality governance is expected to negatively influ-ence port attractiveness.
• GDP is the yearly market value of all officially recognised final goods and services produced within a country.
• Total investments per year (% GDP) are expressed as a ratio of total in-vestment in current local currency and GDP in current local currency. Invest-ment or gross capital formation is measured by the total value of the gross fixed capital formation and changes in inventories and acquisitions, less disposals of valuables for a unit or sector.
• Consumer price index measures changes in the price level of consumer goods and services purchased by households.
• Goods import (and export) refers to all movable goods (including non-monetary gold) involved in a change of ownership from non-residents to resi-dents. The category includes goods previously included in services: goods re-ceived or sent for processing and their subsequent export or import in the form of processed goods, repairs of goods, and goods procured in ports by carriers. Goods import and export do not completely cover the set of countries in our dataset.
• Number of Internet users measures the number of people with access to the worldwide network. According to Birba and Diagne (2012), Internet users in the sub-Sahara are mostly young and well-educated people. Our hypothesis is that the variable of the number of Internet users is an affective proxy variable to evaluate the presence of a middle class in a country. As a consequence, the higher the number of people using the Internet, the larger is the middle class. We conjecture that the middle class is likely to have the highest purchasing power, which subsequently encourages trade of manufactured goods, which are moved mostly via containers.
• Corruption Perception Index (CPI) ranks countries by their perceived lev-els of corruption, as determined by expert assessments and opinion surveys. The CPI generally defines corruption as the misuse of public power for private bene-fit.
3) Subjective factors (key construct R): this set of variables measures the reputation of ports among stakeholders (investors, operators, shipping compa-nies, trade facilitators, and so on).
• Port Quality index measures business executives’ perception of countries’ port facilities. Data are provided by the World Economic Forum’s Executive Opinion Survey and collected online or through in-person interviews. The
Région et Développement 61
World Bank provides scores in the range from 1 (port infrastructure considered extremely underdeveloped) to 7 (port infrastructure considered efficient by in-ternational standards). To ease the interpretation of the results we invert this classification by assigning the highest value to the port with the highest effi-ciency.
• Liner Shipping Connectivity Index (LSCI) indicates how well countries are connected to the global shipping network based on the status of their maritime transport sector. The Index is computed based on five components of the mari-time transport sector: number of ships, container-carrying capacity, maximum vessel size, number of services, and number of companies that deploy container ships in a country’s ports.
• Piracy attack. The past decade has witnessed an unprecedented increase of piracy, especially between the Red Sea and Indian Ocean, near the Somali coast, in the Strait of Malacca, and in the Gulf of Guinea. We consider the im-pact of piracy on the reputation of each port by calculating the number of piracy attacks that occurred in a buffer zone of 500 miles from each port every year (Annex 5).
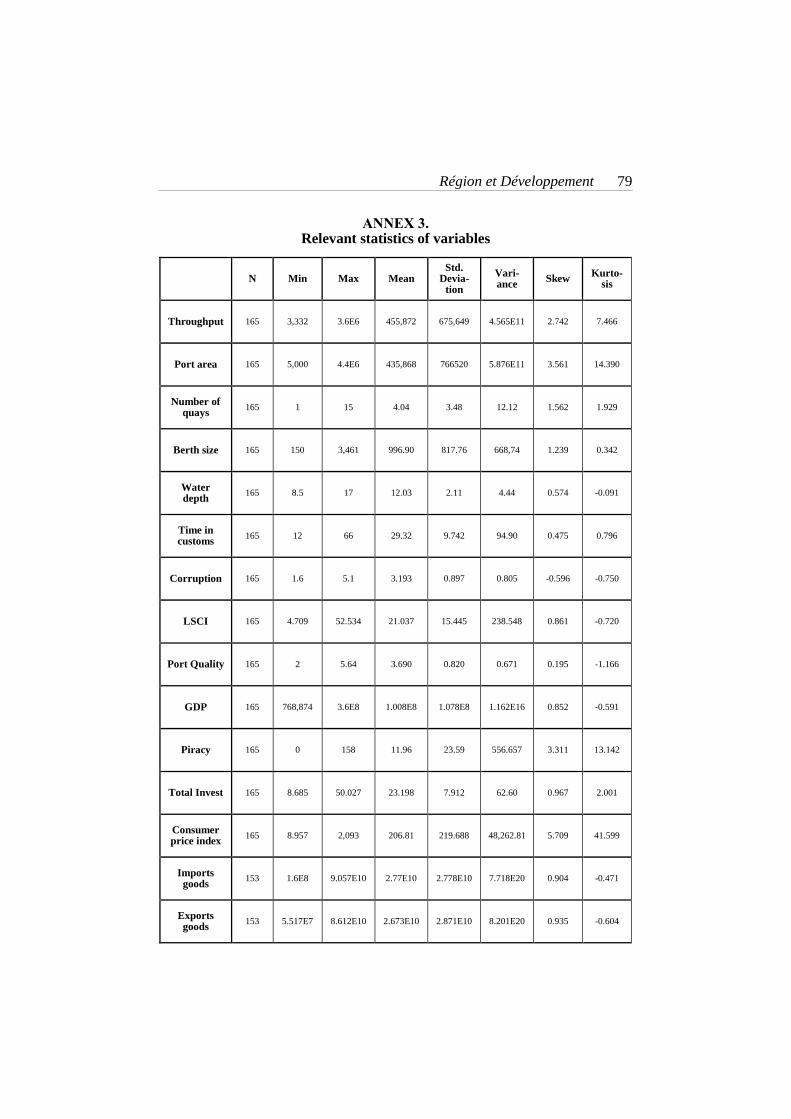
The values of the considered variables are scattered over a large spectrum with standard deviation greater than mean values. A number of variables are not normal distributed, as shown by values of skewness and kurtosis (Annex 3).
Table 2. List of variables
Variable Source
Throughput [TEU] (2006-2010)
CI1
Total area [m2] CI
Number of quays CI
Berth [m] CI
Depth [m] CI
Port quality index (2007-2010)
World Bank
Corruption perception index (2006-2010)
Transparency International
GDP (2006-2010) World Bank
1 Containerisation International.
Variable Source
Average time to clear imports customs
World Bank and various sources
Liner Shipping Con-nectivity Index (LSCI)
UNCTAD
Goods imports World Bank
Goods exports World Bank
Internet users World Bank
Consumer price index World Bank
Number of piracy attacks per year in a buffer zone of 500 miles from each port
Own elaboration on U.S. National Geo-spatial-Intelligence Agency data set
3.2. Limitation of the data set and normalisation
There are some limitations in our collected data set. The first limitation re-lates to the heterogeneity of variables, which have been collected with different units and scales of measurement. In fact, they measure very different features, ranging from port throughput (in TEU) and berth length (in metres) to piracy attacks (total number) and GDP (in US dollars). For this reason we have applied a logarithmic transformation in order to normalise our data set and lessen the
62 Simone Caschili, Francesca Medda
impact of highly skewed distributions. A second limitation regards the number of entry points in our data set. SEM is largely affected by the size of data sam-ples. Jackson (2003) suggests that an ideal sample size compared to the number of parameters to be estimated should be 20:1 or at least 10:1. Our variables have 165 data entries (restricted to 153 in two cases: ‘Goods Import’ and ‘Goods Export’). Moreover, the set of information collected for the 41 ports does not cover every port over the five years of observation (2006-2010), thus resulting in the 165 data entries of our sample.
4. PORT ATTRACTIVENESS IN AFRICA
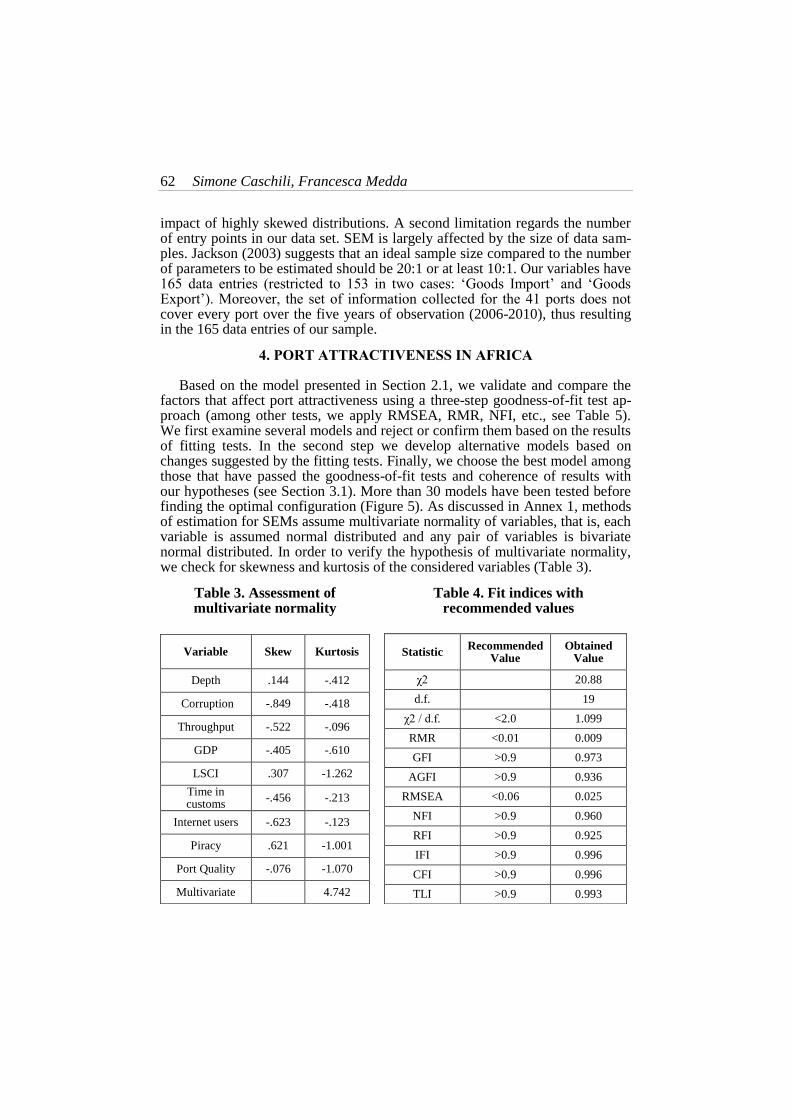
Based on the model presented in Section 2.1, we validate and compare the factors that affect port attractiveness using a three-step goodness-of-fit test ap-proach (among other tests, we apply RMSEA, RMR, NFI, etc., see Table 5). We first examine several models and reject or confirm them based on the results of fitting tests. In the second step we develop alternative models based on changes suggested by the fitting tests. Finally, we choose the best model among those that have passed the goodness-of-fit tests and coherence of results with our hypotheses (see Section 3.1). More than 30 models have been tested before finding the optimal configuration (Figure 5). As discussed in Annex 1, methods of estimation for SEMs assume multivariate normality of variables, that is, each variable is assumed normal distributed and any pair of variables is bivariate normal distributed. In order to verify the hypothesis of multivariate normality, we check for skewness and kurtosis of the considered variables (Table 3).
Table 3. Assessment of multivariate normality
Variable Skew Kurtosis
Depth .144 -.412
Corruption -.849 -.418
Throughput -.522 -.096
GDP -.405 -.610
LSCI .307 -1.262
Time in customs
-.456 -.213
Internet users -.623 -.123
Piracy .621 -1.001
Port Quality -.076 -1.070
Multivariate 4.742
Table 4. Fit indices with recommended values
Statistic Recommended
Value Obtained
Value
χ2 20.88
d.f. 19
χ2 / d.f. <2.0 1.099
RMR <0.01 0.009
GFI >0.9 0.973
AGFI >0.9 0.936
RMSEA <0.06 0.025
NFI >0.9 0.960
RFI >0.9 0.925
IFI >0.9 0.996
CFI >0.9 0.996
TLI >0.9 0.993
Région et Développement 63
Figure 5. Casual SEM diagram with assessment of un-standardised path loading
Source: Authors elaboration.
Except for the variable LSCI, for all other variables skewness and kurtosis fall in the range between -1.00 and +1.00. These variables are therefore normal distributed. We also test Mardia’s index of relative multivariate kurtosis (Mar-dia, 1970), which must vary between -1.96 and +1.96 to support multivariate normality of data distribution. The variables reported in Table 4 have not passed the Mardia’s index test (4.74), so the hypothesis of multivariate normality is rejected for our data set. Because the multivariate normality prerequisite is not satisfied, we use the Asymptotically Distribution-Free estimator (ADF), which assumes a no-normal distribution of variables, to estimate the path loadings of our structural model. The goodness-of-fit indices (Table 4) demonstrate that the
64 Simone Caschili, Francesca Medda
chosen structural model is consistent with the data. All fitting indices have sur-passed their recommended values. In terms of hypothesised links between the measured and latent variables and their statistical significance, all links showed significance paths at p-value < 0.001 (Annex 4). In other words, territorial de-velopment level (exogenous key construct), port assets (endogenous key con-struct), and port reputation (subjective key construct) all influence the attrac-tiveness of a port.
Figure 5 provides the path loading diagram along with estimated un-standardised coefficients for the estimation of port attractiveness. Errors co-variances were established through exploratory approach. The SEM analysis has suggested the introduction of a number of correlated errors which were accepted if the model’s fit improved and the correlated error was supported by observed circumstances. For example in Figure 5 we establish a correlated error between Corruption and Time in Customs because we expect that bureaucratic countries, where time in customs are longer due to the number of documents required and inefficient systems, have higher levels of corruption (Martini, 2013).
Annex 4 reports on the path parameters and error co-variances. All parame-ter signs are consistent with the expected values.
We can now evaluate for our case study of the Africa ports the relative im-portance of each key factor and measured variable. The territorial development surrounding an African port is the major factor for determining port attractive-ness (path coefficient 1.00). Port assets are as important as port reputation (path coefficients of 0.78 and 0.71, respectively). In the case of the key determinant, port reputation, the capacity of a port to be integrated in the international ship-ping network (LSCI) is four times more important than port quality. Thus, in order to increase port attractiveness, port operators need to develop a wide net-work of commercial relationships with other ports. Providing effective services (port quality coefficient = 0.25), ports can also benefit from the positive word-of-mouth effect: ports become more attractive when they function as hubs (i.e., carriers can exploit cooperative schemes in those ports), and they benefit from tacitly being promoted in the industry through a multiplier networking mecha-nism (Huck and Tyran, 2003). On the other hand, piracy is clearly a negative factor for the reputation of African ports (path coefficient = -0.70). Ship owners try to avoid areas and ports that are risky with regard to piracy attacks (high density of incidents); they also consider rerouting in order to avoid hijacks and high insurance premiums (Parmar, 2012). We mentioned in the Introduction that scholars have considered port infrastructure assets as a main determinant of port attractiveness. An interesting finding emerges from our study: port assets count as much as port efficiency (in our case the path loading is negative be-cause the longer a good is held in customs the worse is its efficiency). This is not surprising; ports with good infrastructure assets (storage area, berths, cranes, etc.) but inefficient operations are less productive and thus able to han-dle less container traffic. Finally, territorial development is mainly assessed through GDP and number of Internet users. The level of corruption, although significant, does not have a major impact on territorial development (path coef-
Région et Développement 65
ficient -0.07). This finding is in accordance with a recent research, which points out that ‘corruption may have little average effect on the growth rate of GDP per capita,’ although it limits the capacity of a country to grow (Aidt, 2009).
4.1. Results of Port Attractiveness Index in Africa
The Port Attractiveness Index (Φ) expressed by equation 1 has been rooted to the causality relationships among the determinants of Africa port attractive-ness that we have scrutinised through SEM. Figure 6 depicts the average value of the Port Attractiveness Index for the time period 2006-2010, and each blue circle is proportional to the value of the Index. We observe that the main ports in Africa are clearly situated in North and South areas of the continent. Such an obvious dichotomy is primarily due to the strategic positions of these ports along the main transatlantic shipping corridors. But their geographically advan-tageous positions have been augmented by the implementation of strategic in-vestments for advanced logistics infrastructures and fixed capital investments, as can be witnessed for the ports of Sudan, Dakar and Onne. Ports in central Africa (both west and east coast) suffer low levels of attractiveness, and if we compare this result with level of piracy activity, we observe that the less attrac-tive ports are also situated near areas of higher piracy activity (Annex 5).
The ranking and relative change in the Port Attractiveness Index between 2006 and 2010 is reported in Figure 7 for 25 ports that cover the observation period 2006-2010 (we have reported the complete ranking for all ports included in our study in Annex 6). Although the main ports in Egypt and South Africa occupy the first five positions in the ranking, we can nevertheless observe that a few North African ports show negative performances. Algier has moved from the 8
th position in 2006 to 13
th in 2009 (11
th in 2010); Rades from 15
th in 2006 to
20th in 2009. This trend is certainly related to the opening of the new port of
Tangier in Morocco, which launched its operations in July 2007 and has been able to take relevant container market share from the other ports. The new port of Tangier in Morocco is already positioned in the middle-upper part of the ranking.
Other ports have lost their positions in the ranking, including East London (South Africa), Dakar (Senegal) and Abidjan (Ivory Coast). As discussed in section 3.1, South Africa is a special case in our study because we assume that the national GDP can be used as indicator of the hinterland economic develop-ment of South African ports. In the case of South Africa the National Institute for Statistics (Statistics South Africa, 2011) provides us with the GDP of each province. Because of lack of detailed information on the hinterland and catch-ment areas of each South Africa port, we have assumed that the hinterland of each port corresponds to the province where the port is located. Corruption and level of Internet access are assumed to be unvarying across South Africa. Figure 8 reports the values of Port Attractiveness Index (in 2010) which have been calculated by using the same path loadings obtained from the SEM analysis in Figure 5.
66 Simone Caschili, Francesca Medda
Figure 6. Geo-referred visualization of port attractiveness index
Source: Authors elaboration.
Comparing the results in Figures 7 and 8, the latter analysis provides more reliable results. For example the port of East London appears less attractive with the new calculations. According to Eastern Cape Province,
10 the East Lon-
don port infrastructure has been receiving less and less foreign investment, and many of the containers destined for East London are often diverted to Port Eliz-abeth, Durban and Cape Town which are the major gateways of South Africa.
10
Source retrieved from: www.dedea.gov.za
Région et Développement 67
Figure 7. Ranking of Port Attractiveness Index
Source: Authors elaboration.
In West Africa, Dakar is the most congested port due to its strategic geo-
graphic position. The African Development Bank recently loaned EU47.5 mil-lion for the upgrade of Dakar’s container terminal. In the case of Abidjan, its loss in port attractiveness is generated by internal civil conflict. After the No-vember 2010 presidential election, the UN stationed 9,000 peacekeeping per-sonnel on the Ivory Coast. This political instability is worsened by neighbouring conflicts in Sierra Leone and Liberia. When we examined the performance of other regions, an interesting case is the port of Nacala, which has jumped from 32
nd position in 2006 and 2007 to 10
th and 8
th in 2009 and 2010, respectively.
Nacala’s rise in the Port Attractiveness Index is due to significant investment of
68 Simone Caschili, Francesca Medda
the Mozambique government towards developing efficient national multimodal transport networks. The strategic position of ports in Mozambique indicates that transport costs are 60% cheaper than average Sub-Saharan countries, and logis-tics efficiency is 70% faster than average Sub-Saharan countries. These ports are rapidly emerging as major gateways for the corridors connected to land-locked countries, such as Zimbabwe, Zambia and Malawi, and therefore in-creasing in influence within the global trade market (Domeniguez-Torres and Briceño-Garmendia, 2011).
Figure 8. Port Attractiveness Index in South Africa considering the economic characteristics of ports’ hinterland
Source: Authors elaboration.
4.2. Comparison of Port Attractiveness Index with antagonistic approaches and indicators
One of the innovative characteristics of the Port Attractiveness Index is that it allows for the introduction of quantitative variables related to the ports and their hinterlands and also subjective variables (i.e., accountability, corruption, etc.). By combining these two types of information and data we are able to overcome the problems of partial overviews of the ports, as in the cases of strictly quantitative methods and also avoid expensive and time consuming field survey analyses. For instance, using a survey methodology, Sequeira and Djankov (2010) have studied the impacts of corruption in the competing ports of Durban and Maputo. Although both ports have similar infrastructural facili-
Région et Développement 69
ties and are equidistant from the booming South African provinces of Gauteng, Kwazulu-Natal and Mpumalanga, the port of Durban has a much higher yearly throughput than Maputo. Sequeira and Djankov (2010) note from the survey analysis that some firms prefer to travel, on average, an additional 322 kms in order to avoid ‘coercitive’ and ‘collusive’ corruptions in the port of Maputo. Conversely, Sequeira and Djankov (2010) reckon that the port of Durban, with its large hinterland catchment area, therefore has greater attractiveness than Maputo. When we compare the results of Sequeira and Djankov with our Port Attractiveness Index, we observe that our results are in line with theirs, but in our case we did not have to collect data in the field. Between 2006 and 2009, Durban ranks between first and third position in the general ranking, while Ma-puto between 27th and 29th position (Figure 7 and table E1).
Figure 9. Comparison between Port Attractiveness Index (on the left) and Liner Shipping Connectivity Index (on the right)
Source: Authors elaboration.
This is an important outcome for analysts and operators, particularly in de-veloping countries, where the collection of survey data is an often troublesome operation. If we now compare the Port Attractiveness Index with the commonly and widely used Liner Shipping Connectivity Index (LSCI) developed by UNCTAD, we again notice a very similar behaviour between LSCI and Port Attractiveness Index for the ports of Durban and Maputo (Figure 9, we assume our comparison based on the concept that the more a port is connected with the international trade network, the higher is its attractiveness). However, we ob-serve some discrepancies between the Port Attractiveness Index and LSCI. In particular, for West African countries the LSCI values are homogenous, where-as the Port Attractiveness Index is able to better differentiate among the differ-ent characteristics of the ports of this area. Dakar, Tema, Onne and Luanda are
70 Simone Caschili, Francesca Medda
the most ‘attractive’ ports of the area (2006-2010). In North Africa we have similar results; the LSCI index is quite homogeneous in this area. However, the Port Attractiveness Index allows us to verify that the ports in Egypt and Moroc-co dominate the area, while ports in Algeria, Tunisia and Libya show a much lower attractiveness performance. The Port Attractiveness Index is therefore able to discriminate more clearly among the various characteristics of each port in order to provide a more comprehensive overview of the port characteristics.
In Figure 10 we summarize port characteristics and Port Attractiveness In-dex for the ports of Dar Es Salaam, Durban and Mombasa. We use these three cases to compare the benchmark of Port Attractiveness Index versus LSCI. Durban has highest values in both indices due to better infrastructure and eco-nomic conditions. Dar Es Salaam and Mombasa are very similar in terms of infrastructural endowment, national economic conditions and characteristics ascribable to port reputation. This characteristics are concisely represented in the Port Attractiveness Index and the figures are confirmed in the LSCI.
Figure 10. Summary of port characteristics for three ports in South-Eastern Africa
Source: Authors elaboration.
4.3. Port Attractiveness Index and Foreign Direct Investments
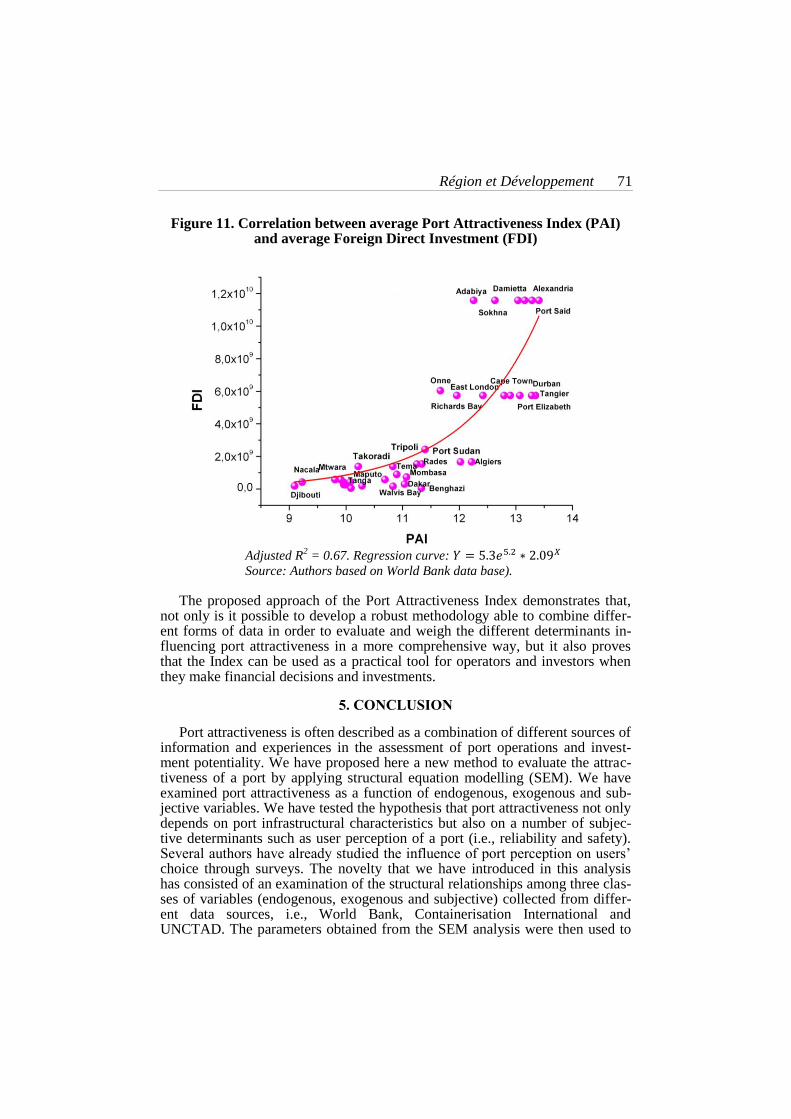
Finally, we want to conclude by examining the possible correlation between the Port Attractiveness Index and financial investment in ports. To conduct this analysis, we consider the World Bank Foreign Direct Investment (FDI) data and the evaluated Port Attractiveness Indices. In Figure 11 we plot our results.
There is an exponential positive correlation between the two variables (Pear-son’s correlation coefficient = 0.81) which indicates that higher values of the Port Attractiveness Index stimulate foreign direct investment. In other words, investors will prefer to invest in ports where the financial risks are leveraged by good “hard and soft” infrastructure, as indicated by the high values of the Port Attractiveness Index.
Région et Développement 71
Figure 11. Correlation between average Port Attractiveness Index (PAI) and average Foreign Direct Investment (FDI)
Adjusted R
2 = 0.67. Regression curve: 𝑌 = 5.3𝑒5.2 ∗ 2.09𝑋
Source: Authors based on World Bank data base).
The proposed approach of the Port Attractiveness Index demonstrates that,
not only is it possible to develop a robust methodology able to combine differ-ent forms of data in order to evaluate and weigh the different determinants in-fluencing port attractiveness in a more comprehensive way, but it also proves that the Index can be used as a practical tool for operators and investors when they make financial decisions and investments.
5. CONCLUSION
Port attractiveness is often described as a combination of different sources of information and experiences in the assessment of port operations and invest-ment potentiality. We have proposed here a new method to evaluate the attrac-tiveness of a port by applying structural equation modelling (SEM). We have examined port attractiveness as a function of endogenous, exogenous and sub-jective variables. We have tested the hypothesis that port attractiveness not only depends on port infrastructural characteristics but also on a number of subjec-tive determinants such as user perception of a port (i.e., reliability and safety). Several authors have already studied the influence of port perception on users’ choice through surveys. The novelty that we have introduced in this analysis has consisted of an examination of the structural relationships among three clas-ses of variables (endogenous, exogenous and subjective) collected from differ-ent data sources, i.e., World Bank, Containerisation International and UNCTAD. The parameters obtained from the SEM analysis were then used to
72 Simone Caschili, Francesca Medda
generate the Port Attractiveness Index. We have applied this methodological approach to a set of 41 container ports in 23 African countries for the period 2006-2010. Results have shown that endogenous, exogenous and subjective variables can be used to estimate a population of covariance matrix that is high-ly similar to the sample covariance matrix. In other words, we have demonstrat-ed that the three classes of determinants (modelled as latent variables) are suita-ble in the measurement of port attractiveness and can be used to build a quanti-tative indicator. Among the three latent variables, exogenous variables (which represent the level of development of ports’ hinterlands) are the most influen-tial; this means that in order to be economically successful a port has to strengthen the freight traffic and business from its catchment area (hinterland). As a consequence, the ports with close ties to their hinterlands will not merely develop and operate as transhipment ports. In the evaluation of the index, en-dogenous and subjective variables have shown a similar importance, which indicates that if we consider the combined cumulative relevance of exogenous and subjective variables, they count more than the infrastructural endowment of a port (i.e., endogenous key construct in our model). This finding leads us to the following policy recommendations for stakeholders, policy makers and plan-ners: to increase the attractiveness of a port, governments should first address the implementation of soft infrastructures rather than hard ones. The Port At-tractiveness Index calculated for the 41 container ports of our study, shows that ports in Egypt and South Africa always occupy the first five positions. A few North African ports have shown negative performance within the time frame of this research. When we have examined the performance of other regions, how-ever, we have spotted some interesting cases. Nacala port jumped from 32nd position in 2006 and 2007 to 10th and 8th in 2009 and 2010, respectively. This finding can be explained by the strategic positioning of Nacala port within the recently improved multimodal infrastructure corridors which connect land-locked neighbours such as Zimbabwe, Zambia and Malawi. We have also ar-gued the significance of the Port Attractiveness Index in relation to investment decisions and strategies, for instance, Foreign Direct Investments correlates positively with port attractiveness.
Beneficial future research would be to evaluate the Port Attractiveness Index and extend the analysis worldwide to a larger set of ports which considers in-dustrialised, developing and lagging countries. Furthermore, due to the similari-ties between the maritime and aviation industries, we also plan to extend the application of the Port Attractiveness Index to study airport attractiveness.
REFERENCES
Adichie C., 2009, "The Danger of a Single Story", TED talk July 2009. Date of access 05 Sept 2013, web link:
www.ted.com/talks/chimamanda_adichie_the_danger_of_a_single_story.html
Afribiz.Info, 2011, "Republic of Congo: trade and Economic Partnership", Date of access 28 Feb 2013, www.afribiz.info/content/republic-of-congo-trade-and-economic-partnerships-2011
Région et Développement 73
Agho A., Price J., Mueller C., 1992, "Discriminant validity of measures of job satis-faction, positive affectivity and negative affectivity", Journal of Occupational and Organizational Psychology 65 (3), 185-196.
Aidt T. S., 2009, "Corruption, institutions, and economic development", Oxford Review of Economic Policy 25 (2), 271-291.
Ajzen I., 1991, "The theory of planned behavior", Organizational Behavior and Human Decision Processes 50, 179-211.
Amemiya T., 1985, "Advanced Econometrics", Cambridge: Harvard University Press.
Beddow M., 2010, "The only way is up", Containerisation International 43 (3), 61-65.
Bhandari R., Dhakal D.P., Pradhan G., Upadhyaya K., 2007, "Foreign Aid, FDI and Economic Growth in East European Countries", Economics Bulletin 6(13), 1-9.
Bichou K., Bell M.G.H., 2007, "Internationalisation and Consolidation of the Con-tainer Port Industry: Assessment of Channel Structure and Relationships", Mari-time Economics & Logistics 9, 35-51.
Bielby W. T., Hauser R. M., 1977, "Structural equation models", Annual Review of Sociology 3, 137-161.
Birba O., Diagne A., 2012, "Determinants of adoption of Internet in Africa: Case of 17 sub-Saharan countries", Structural Change and Economic Dynamics 23(4), 463-472.
Bird J., Bland G., 1988, "Freight forwarders speak: the perception of route competi-tion via seaports in the European communities research project", Maritime Poli-cy and Management 15 (1), 35-55.
Caschili S., Medda F., Parola F., Ferrari C., 2014, "Cooperation in container ship-ping: A network of agreements”, Journal of Networks and Spatial Economics. DOI: 10.1007/s11067-014-9230-1
Davis F., 1989, "Perceived usefulness, perceived ease of use, and user acceptance of information technology", MIS Quarterly 13, 319-340.
Daya Y., Ranoto T.R., Letsoalo M.A., 2006, "Intra-Africa Agricultural Trade: A South African Perspective", Department of Agriculture, Pretoria, South Africa. Date of access 28 Feb 2013, www.nda.agric.za/docs/researchP/IntraAfrica.pdf
Dell’Anno R., Schneider F., 2009, "A complex approach to estimate the shadow economy: the structural equation modelling", In Faggiani M. and Lux T. (eds). Coping with the Complexity of Economics. Heidelberg: Springer-Verlag, 110-130.
Drewry, 2010, "Annual Review of Global Container Terminal Operators", London: Drewry.
Dunn S. C., Seaker R. F., Waller M. A., 1994, "Latent variables in business logis-tics research: Scale development and validation", Journal Business Logistics 15 (2), 145-172.
Dupasquier C., Osakwe P., 2005, "Foreign direct investment in Africa: perfor-mance, challenges and responsibilities", Works In Progress No. 21. Economic Commission for Africa: African Trade Policy Center.
74 Simone Caschili, Francesca Medda
Ernst & Young, 2011, "It’s time for Africa: Africa attractiveness survey", Date of access 28 February 2014. www.ey.com/Publication/vwLUAssets/2011_-_Africa_Attractiveness_Survey/$FILE/Attractiveness_africa_low_resolution_final_WEB.pdf
Fishbein M., Ajzen I., 1975, "Belief, attitude, intention, and behavior: An introduc-tion to theory and research", Reading: Addison-Wesley.
Foster T., 1978, "What’s important in a port", Distribution Worldwide 78, 33-36.
Glover S., Benbasat I., 2010, "A comprehensive model of perceived risk of e-commerce transactions", International Journal of Electronic Commerce 15(2), 47-78.
Guo Z., Wang W., Song X., Jiang Q., 2009, "Path Analysis of International Dry Bulk Carriers Based on Structural Equation Modeling", Journal of the Eastern Asia Society for Transportation Studies 8, 2214-2224.
Ha M.S., 2003, 2A comparison of service quality at major container ports: implica-tions for Korean ports", Journal of Transport Geography 11, 131-137.
Hong K., 1997, "Foreign Capital and Economic Growth in Korea: 1970-1990", Journal of Economic Development 22 (1), 79-89.
Huck S., Tyran J.R., 2003, "Reciprocity as a social multiplier: the case of experi-ence goods", ELSE Working Papers 65. London, UK: ESRC Centre for Eco-nomic Learning and Social Evolution.
Huybrechts M., Meersman H., Van de Voorde E., Van Hooydonk E., Verbeke A., Winkelmans W., 2002, "Port Competitiveness: An Economic and Legal Analysis of the Factors Determining the Competitiveness of Sea-ports", Antwerp: De Boeck.
IMF, 2011, "Regional Economic Outlook: Sub-Saharan Africa", Washington D.C., U.S.A: The International Monetary Fund Press.
Jackson, D. L., 2003, "Revisiting sample size and the number of parameter esti-mates: Some support for the N:q hypothesis", Structural Equation Modeling 10, 128-141.
Jagtiani, S., Krishnan, U., 2011, "Maersk Lured by $1.5 Trillion in 2020 Asia-Africa Trade: Freight Markets", Bloomberg.com. Date of access 28 February 2013. www.bloomberg.com/news/2011-09-13/maersk-lured-by-1-5-trillion-asia-africa-trade-freight-markets.html
Kline R. B., 2011, "Principle and Practice of structural Equation Modeling (Third Edition)", New York: The Guilford Press.
Lirn T. C., Thanapoulou H., Beresford A., Anthony K.C., 2003, "Transhipment port selection and decision-making behaviour: analysing the Taiwanese case", Inter-national Journal of Logistics Research and Application, 6 (4), 229-244.
Lu C., Lai K., Cheng, T. C. E., 2007, "Application of structural equation modelling to evaluate the intention of shippers to use Internet services in liner shipping", European Journal of Operational Research 180 (2), 845-867.
MacCallum R. C., Austin J.T., 2000, "Applications of structural equation modelling in psychological research", Annual Review of Psycology 51, 201-226.
Région et Développement 75
Mafusire A., Anyanwu J., Brixiova Z., Mubila M., 2010, "Infrastructure Deficit and Opportunities in Africa", African Development Bank Economic Brief 1, 1-15.
Mardia K. V., 1970, "Measures of multivariate skewness and kurtosis with applica-tions", Biometrika 36, 519-530.
Martini M., 2013, "Reducing bureaucracy and corruption affecting small and medi-um enterprises", Transparency International, Expert Answer 380. Web link: www.u4.no/publications/reducing-bureaucracy-and-corruption-affecting-small-and-medium-enterprises
Mazumdar J., 1996, "Do Static Gains from Trade Lead to Medium-Run Growth?", Journal of Political Economy 104(6), 1328-1337.
Mbekeani K. K., 2010, "Infrastructure, Trade Expansion and Regional Integration: Global Experience and Lessons for Africa", Journal of African Economies 19 (1), 88-113.
Mohey-Ud-Din G., 2007, "Impact of FCI on Economic Growth in Pakistan", Jour-nal of Independent Studies and Research 5 (1), 24-29.
Montinola G.R., Jackman R., 2002, "Sources of Corruption: A Cross-Country Study", British Journal of Political Science 32, 142-170.
Moshirian F., 2008, "Globalisation, Growth and Institutions", Journal of Banking and Finance 32 (4), 472-479.
Murphy P., Daley J., 1994, "A comparative analysis of port selection factors", Transportation Journal 34 (1), 15-21.
Ng K. Y. A., 2006, "Assessing the Attractiveness of Ports in the North European Container Transhipment Market: An Agenda for Future Research in Port Com-petition", Maritime Economics and Logistics 8(3), 234-250.
Nir A., Ding J., Chou C., 2012, "Inter-organizational culture, trust, knowledge shar-ing, collaboration and performance in supply chain of maritime industries: Ex-amining the linkages", African Journal of Business Management 6(19), 5927-5938.
Notteboom T., Rodrigue J.-P., Monie G., 2010, "The organizational and geograph-ical ramifications of the 2008-09 financial crisis on the maritime shipping and port industries", In Hall P. (eds). Integrating seaports and trade corri-dors.Surrey: Ashgate, 13-46.
Notteboom T.E., Vernimmen B., 2009, "The effect of high fuel costs on liner ser-vice configuration in container shipping", Journal of Transport Geography 17, 325-337.
OECD, 2008, "Port Competition and Hinterland Connections", Discussion Paper No. 2008-19. Paris: OECD/ITF.
Oyelaran-Oyeyinka B., Kaushalesh L., 2005, "Internet Diffusion in sub-Saharan Africa: A Cross-Country Analysis", Telecommunications Policy 29(7), 507-527.
Panayides P.M., So M., 2005, "The impact of integrated logistics relationships on third-party logistics service quality and performance", Maritime Economics and Logistics 7 (1), 36-55.
Parmar S. S., 2012, "Somali Piracy: A Form of Economic Terrorism", Strategic Analysis 36(2), 290-303.
76 Simone Caschili, Francesca Medda
Przybyłowski, A. 2008, "Attractiveness goes far beyond", Baltic Transport Journal 5, 20-21.
Refas S., Cantens T., 2011, "Why Does Cargo Spend Weeks in African Ports? The Case of Douala, Cameroon?", World Bank Policy Research Working Paper No. 5565. Washington DC: World Bank.
Sequeira S., 2012, "Advances in Measuring Corruption in the Field", London: Working Paper of London School of Economics.
Sequeira S., Djankov S., 2010, "An Empirical Study of Corruption in Ports", Lon-don: Working Paper of London School of Economics.
Slack B., 1985, "Containerisation and inter-port competition", Maritime Policy and Management 12 (4), 293–304.
Stank T. P., Keller S. B., Daugherty P. J., 2001, "Supply chain collaboration and logistics service performance", Journal of Business logistics 22 (1), 29-47.
Statistics South Africa, 2011, "Gross domestic product, Third quarter 2011", Stats SA P0441. Available online: http://www.statssa.gov.za/publications/P0441/P04413rdQuarter2011.pdf
Sturgeon S. J., Kawakami M., 2010, "Global Value Chains in the Electronics Indus-try: Was the Crisis a Window of Opportunity for Developing Countries?, In Cat-taneo O., Gereffi G., Staritz C. (eds). Global Value Chain in a Postcrisis World: a Development Perspective. Washington DC: The World Bank.
Timothy T., Myint S.K., 2009, "Structural equation modelling in educational re-search: concepts and applications", Rotterdam: Sense Publishers.
Tiwari P., Itoh H., Dio M., 2003, "Shippers’ port and carrier selection behaviour in China: a discrete choice analysis", Maritime Economics and Logistics 5, 23-39.
Tongzon J., 2002, "Port choice determinants in a competitive environment", Pro-ceedings of Annual IAME Meeting and Conference. Panama, November 2002: 1-22.
Tongzon J., 2009, "Port choice and freight forwarders", Transportation Research Part E: Logistics and Transportation Review 45(1), 186-195.
Ullman J. B., Bentler P. M., 2012, "Structural equation modelling", Handbook in Psycology (Second Edition). John Wiley & Sons.
UNCTAD, 2011, "Best practices in investment for development: Case studies in FDI", New York and Geneva: United Nations Conference on trade and devel-opment.
Venus Lun Y. H., Lai K., Wong C. W. Y., Cheng T. C. E., 2011, "Demand chain management in the container shipping service industry", International Journal of Production Economics 141(2), 485-492.
Zafar A., 2007, "The Growing Relationship Between China and Sub-Saharan Afri-ca: Macroeconomic, Trade, Investment, an Aid Links", World Bank Researcher Observer 22(1), 103-130.
Région et Développement 77
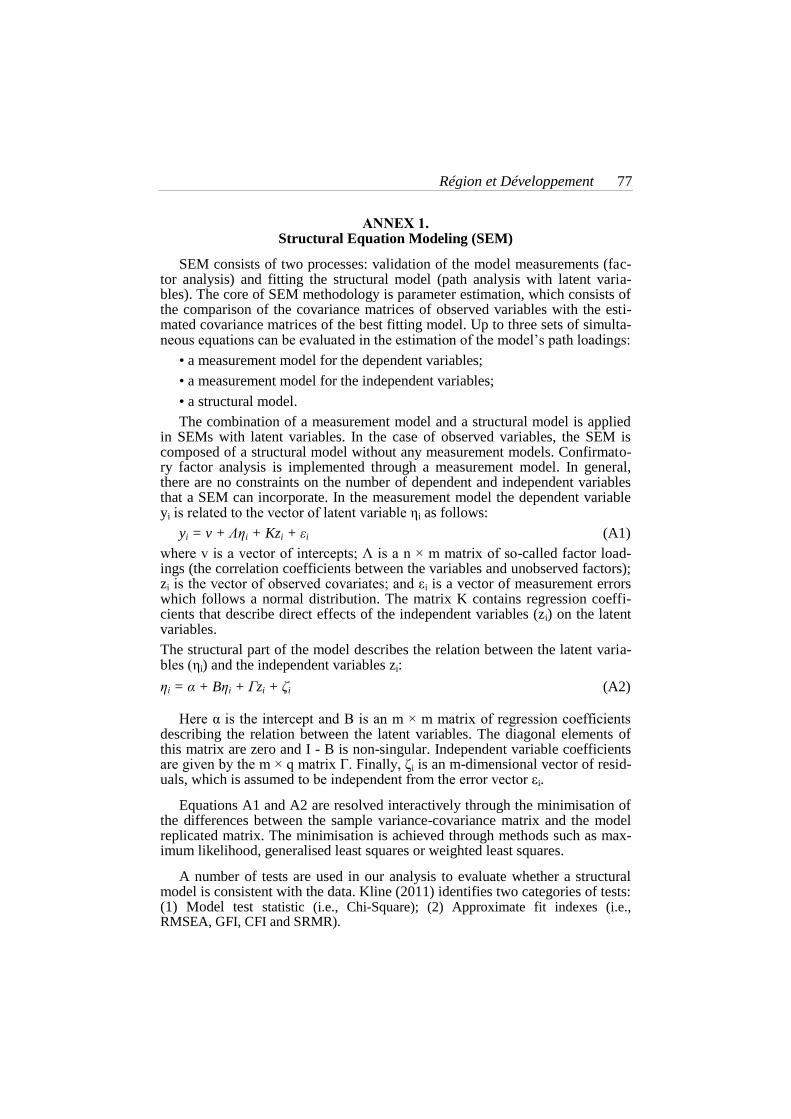
ANNEX 1. Structural Equation Modeling (SEM)
SEM consists of two processes: validation of the model measurements (fac-tor analysis) and fitting the structural model (path analysis with latent varia-bles). The core of SEM methodology is parameter estimation, which consists of the comparison of the covariance matrices of observed variables with the esti-mated covariance matrices of the best fitting model. Up to three sets of simulta-neous equations can be evaluated in the estimation of the model’s path loadings:
• a measurement model for the dependent variables;
• a measurement model for the independent variables;
• a structural model.
The combination of a measurement model and a structural model is applied in SEMs with latent variables. In the case of observed variables, the SEM is composed of a structural model without any measurement models. Confirmato-ry factor analysis is implemented through a measurement model. In general, there are no constraints on the number of dependent and independent variables that a SEM can incorporate. In the measurement model the dependent variable yi is related to the vector of latent variable ηi as follows:
yi = v + Ληi + Kzi + εi (A1)
where v is a vector of intercepts; Λ is a n × m matrix of so-called factor load-ings (the correlation coefficients between the variables and unobserved factors); zi is the vector of observed covariates; and εi is a vector of measurement errors which follows a normal distribution. The matrix K contains regression coeffi-cients that describe direct effects of the independent variables (zi) on the latent variables.
The structural part of the model describes the relation between the latent varia-bles (ηi) and the independent variables zi:
ηi = α + Bηi + Γzi + ζi (A2)
Here α is the intercept and B is an m × m matrix of regression coefficients describing the relation between the latent variables. The diagonal elements of this matrix are zero and I - B is non-singular. Independent variable coefficients are given by the m × q matrix Γ. Finally, ζi is an m-dimensional vector of resid-uals, which is assumed to be independent from the error vector εi.
Equations A1 and A2 are resolved interactively through the minimisation of the differences between the sample variance-covariance matrix and the model replicated matrix. The minimisation is achieved through methods such as max-imum likelihood, generalised least squares or weighted least squares.
A number of tests are used in our analysis to evaluate whether a structural model is consistent with the data. Kline (2011) identifies two categories of tests: (1) Model test statistic (i.e., Chi-Square); (2) Approximate fit indexes (i.e., RMSEA, GFI, CFI and SRMR).

78 Simone Caschili, Francesca Medda
It is beyond the scope of this paper to discuss each of the tests in the two catego-ries. Readers who are unfamiliar with SEM fitting tests can find appropriate refer-ences in Kline (2011) and in articles published in specialised scientific media, par-ticularly Structural Equation Modelling: A Multidisciplinary Journal.
Finally, one can find several software and statistical packages already developed for implementing SEM (i.e., EQS, LISREL, MPlus. etc.). In this study we use SPSS Amos version 20.
ANNEX 2. List of the 41 ports used in the study
Country Port
Algeria Algiers, Bejaia
Angola Luanda
Benin Cotonou
Cameroon Douala
Congo Pointe Noire
Cote d'Ivoire Abidjan, San Pedro
Djibouti Djibouti
Egypt Adabiyah, Alexandria, Damietta, El Dekheila, Port Said, Sokhna
Gabon Owendo
Ghana Takoradi, Tema
Kenya Mombasa
Libya Benghazi
Madagascar Toamasina
Mauritania Nouakchott
Morocco Tangier
Mozambique Beira, Maputo, Nacala
Namibia Walvis Bay
Nigeria Onne
Senegal Dakar
South Africa Cape Town, Durban, East London, Ngqura, Port Elizabeth, Richards Bay
Sudan Port Sudan
Tanzania Dar es Salaam, Mtwara, Tanga
Tunisia Rades, Tripoli
Région et Développement 79
ANNEX 3. Relevant statistics of variables
N Min Max Mean Std.
Devia-tion
Vari-ance
Skew Kurto-
sis
Throughput 165 3,332 3.6E6 455,872 675,649 4.565E11 2.742 7.466
Port area 165 5,000 4.4E6 435,868 766520 5.876E11 3.561 14.390
Number of quays
165 1 15 4.04 3.48 12.12 1.562 1.929
Berth size 165 150 3,461 996.90 817.76 668,74 1.239 0.342
Water depth
165 8.5 17 12.03 2.11 4.44 0.574 -0.091
Time in customs
165 12 66 29.32 9.742 94.90 0.475 0.796
Corruption 165 1.6 5.1 3.193 0.897 0.805 -0.596 -0.750
LSCI 165 4.709 52.534 21.037 15.445 238.548 0.861 -0.720
Port Quality 165 2 5.64 3.690 0.820 0.671 0.195 -1.166
GDP 165 768,874 3.6E8 1.008E8 1.078E8 1.162E16 0.852 -0.591
Piracy 165 0 158 11.96 23.59 556.657 3.311 13.142
Total Invest 165 8.685 50.027 23.198 7.912 62.60 0.967 2.001
Consumer price index
165 8.957 2,093 206.81 219.688 48,262.81 5.709 41.599
Imports goods
153 1.6E8 9.057E10 2.77E10 2.778E10 7.718E20 0.904 -0.471
Exports goods
153 5.517E7 8.612E10 2.673E10 2.871E10 8.201E20 0.935 -0.604
80 Simone Caschili, Francesca Medda
ANNEX 4. Model estimates
Estimate S.E. C.R. P
Port assets <--- Port attractiveness .777 .107 7.287 ***
Territorial Development <--- Port attractiveness 1.000
Port reputation <--- Port attractiveness .705 .049 14.269 ***
GDP <--- Territorial Development 1.000
LSCI <--- Port reputation 1.000
Piracy <--- Port reputation -.696 .155 -4.478 ***
Port Quality <--- Port reputation .247 .020 12.572 ***
Internet users <--- Territorial Development .586 .048 12.139 ***
Time in customs <--- Port assets -.116 .034 -3.372 ***
Throughput <--- Port assets 1.000
Corruption inverted <--- Territorial Development -.069 .010 -6.570 ***
Port Area <--- Port assets .113 .020 5.811 ***
ErrQ <--> ErrC -.002 .000 -5.608 ***
ErrP <--> ErrG -.143 .017 -8.215 ***
ErrI <--> ErrG .075 .010 7.492 ***
ErrP <--> ErrC .009 .002 5.448 ***
ErrCu <--> ErrG .013 .004 3.430 ***
ErrG <--> ErrC -.008 .001 -6.227 ***
ErrCu <--> ErrC -.001 .000 -3.476 ***
ErrI <--> ErrCu -.020 .003 -7.254 ***
ANNEX 5. Density map of piracy attacks
Legend: Lighter to darker areas correspond to denser zone of attacks. Source: Authors elaboration on U.S. National Geospatial-Intelligence Agency data set.

Région et Développement 81
ANNEX 6.
Port Attractiveness index ranking
2006 2007 2008 2009 2010
Durban Durban (=) Port Said (+) Port Said (=) Port Said (=)
Port Said Port Said (=) Durban (=-) Damietta (=+) Durban (=+)
Cape Town Cape Town (=) Damietta (+) Durban (=-) Damietta (=-)
Port Elizabeth Port Elizabeth (=) El Dekheila (+) Alexandria (=+) Alexandria (=)
El Dekheila Damietta Alexandria (+) El Dekheila (=-) El Dekheila (=)
East London El Dekheila (=-) Cape Town (-) Tangier Tangier (=)
Sokhna Alexandria Port Elizabeth (-) Cape Town (=) Cape Town (=)
Algiers Sokhna (=-) Sokhna (=) Port Elizabeth (=) Port Elizabeth (=)
Bejaia East London (-) East London (=) Sokhna (=) Nacala (+)
Richards Bay Algiers (-) Adabiya (=+) Adabiya (=+) Ngqura (+)
Adabiya Adabiya (=) Algiers (=-) Nacala (++) Sokhna (-)
Onne Bejaia (-) Bejaia (=) Ngqura Algiers(+)
Port Sudan Richards Bay (-) Richards Bay (=) East London (-) Adabiya (++)
Benghazi Port Sudan(=-) Tripoli (+) Algiers (-) East London (=-)
Rades Rades (=) Benghazi (+) Richards Bay (=-) Bejaia(=+)
Mombasa Tripoli Dakar (+) Bejaia (-) Richards Bay (=-)
Luanda Benghazi (-) Port Sudan (-) Benghazi (-) Onne (+)
Dakar Mombasa (-) Rades (-) Port Sudan (=-) Port Sudan (=)
Dar es Salaam Dakar (=-) Mombasa (=-) Onne (--) Rades (=+)
Abidjan Abidjan (=) Walvis Bay (+) Rades (-) Mombasa (=+)
Tema Dar es Salaam (-) Abidjan (=-) Mombasa (-) Tema (=+)
Walvis Bay Tema (=-) Tema (=) Dakar (--) Walvis Bay (=+)
Douala Walvis Bay (=-) Dar es Salaam (-) Walvis Bay (-) Dakar (=-)
Takoradi Takoradi (=) Toamasina (+) Tema (-) Abidjan (=+)
San Pedro Douala (-) San Pedro (=+) Abidjan (-) Dar es Salaam (=+)
Pointe Noire San Pedro (=-) Douala (=-) Dar es Salaam (-) San Pedro (=)
Owendo Maputo (+) Maputo (=) San Pedro (-) Toamasina (=)
Cotonou Tanga (+) Beira (+) Maputo (=-) Tanga (=)
Maputo Mtwara (+) Cotonou (=-) Douala (-) Mtwara (=)
Tanga Beira Tanga (-) Toamasina (--) Nouakchott (=)
Toamasina Toamasina (=) Owendo (-) Tanga (=-) Djibouti (=)
Mtwara Nacala Nacala (=) Owendo (=-)
Nouakchott Nouakchott (=) Mtwara (-) Mtwara (=)
Djibouti Djibouti (=) Nouakchott (=) Nouakchott (=)
Djibouti (=) Djibouti (=)
Legend. Trends: extremely positive ++, positive +,stable =, negative -, extremely nega-tive --
82 Simone Caschili, Francesca Medda
L’INDICE D'ATTRACTIVITÉ PORTUAIRE : UNE APPLICATION AUX PORTS AFRICAINS
Résumé - La réputation d'un port est fondée sur des facteurs objectifs, tels que son niveau d’infrastructures et l'efficience de la chaîne logistique, ainsi que sur des facteurs subjectifs comme la fiabilité et le niveau de corruption perçus par les utilisateurs. Dans ce travail, nous avons analysé la notion d'attractivité por-tuaire en partant de l’hypothèse que les déterminants subjectifs et les facteurs objectifs – endogènes (longueur et nombre de quais...) et exogènes (PIB...) – peuvent être quantifiés ensemble. Nous avons déterminé l'indice d’attractivité portuaire à partir d’un échantillon de 41 ports à conteneur de 23 pays afri-cains, pour la période 2006-2010. Pour cela nous avons appliqué une approche ascendante (bottom-up) pour étudier les relations structurelles entre les trois ensembles de déterminants (endogènes, exogènes et subjectifs) qui ont un im-pact sur l’attractivité portuaire. Les résultats obtenus du modèle indiquent que les facteurs subjectifs ont une influence importante sur l’attractivité portuaire. Il apparaît alors que dans de nombreux ports africains, les gouvernements de-vraient d’abord développer des infrastructures « soft » plutôt que d'investir dans des infrastructures « hard ».
Mots-clés - TRANSPORT, COMMERCE MARITIME, RÉPUTATION POR-TUAIRE, AFRIQUE, MODÉLISATION PAR ÉQUATION STRUCTURELLE