the potential economic benefits of protecting and
TRANSCRIPT
The Potential Economic Benefits
of Protecting and Presenting Cape York
Guy Chester and Sally Driml In Association with
Cape York Sustainable Futures
Submission Number: 212 Attachment F

24 June 2012 2 Version 3.0
The Potential Economic Benefits of Protecting and Presenting Cape York
EcoSustainAbility Pty Ltd Cairns Office
Phone +61 (0)7 40558132 Fax +61 (0)7 40558142
PO Box 230 Yorkeys Knob QLD 4878 Australia
ACN 098560126: Version Notes
Version 3.0: This version is the final report for Cape York Sustainable Futures to present to the Department of Environment and Heritage Protection.
© EcoSustainAbility 2012 This document remains the property of EcoSustainAbility until all invoices relating to our consulting services for this project are fully paid. Copyright and ownership of the intellectual property contained in the report remains with EcoSustainAbility unless otherwise agreed. Unauthorised use, distribution, copying or dissemination of this document in any form whatsoever is prohibited.
Regardless of copyright ownership, the moral right of Guy Chester (EcoSustainAbility) and Sally Driml (University of Queensland) to be acknowledged as the authors of this work is asserted.
The content of this report should be read in the context of the scope of consulting services, the purpose of the document and the information supplied by the client. The report does not constitute legal, planning, financial or engineering advice.
24 June 2012 3 Version 3.0
The Potential Economic Benefits of Protecting and Presenting Cape York
Summary .................................................................................................................................. 5 Introduction .............................................................................................................................. 9
Study of Economic Benefits ..................................................................................................................... 9 Project Brief ............................................................................................................................................ 9 Cape York Region ................................................................................................................................. 10 Rigour ................................................................................................................................................... 10
The Economic Impact of World Heritage Areas ........................................................................ 14 Comparison .......................................................................................................................................... 14 Increased Economic Activity .................................................................................................................. 16
The Cape York Economy ......................................................................................................... 17 Definition of Cape York Peninsula Area ................................................................................................. 18 Population ............................................................................................................................................ 18 Employment .......................................................................................................................................... 19 Economic Profile ................................................................................................................................... 20 Industries of Significance for This Study ............................................................................................... 21 Agricultural Production ......................................................................................................................... 22 Mining .................................................................................................................................................. 23 Tourism ................................................................................................................................................ 23
Current Land Tenure and Use ................................................................................................. 28 Cape York Land Tenures ....................................................................................................................... 28 Current Conservation Land Tenures ...................................................................................................... 30
Current Conservation Management ......................................................................................... 31 Current Conservation Management Expenditure ................................................................................... 32 Benchmarking Against World Heritage .................................................................................................. 38
Current Tourism ...................................................................................................................... 40 Cape York Tourism ............................................................................................................................... 40 Accommodation .................................................................................................................................... 47 Recent Tourism Planning ...................................................................................................................... 50
Grazing ................................................................................................................................... 51 Overall Land Use ................................................................................................................................... 52 Economic Impact ................................................................................................................................... 54
Potential Economic Opportunities ........................................................................................... 55 Potential Economic Opportunities ......................................................................................................... 55 Cattle .................................................................................................................................................... 56 Fisheries and Aquaculture ..................................................................................................................... 57 Agriculture ............................................................................................................................................ 57 Forestry/Timber .................................................................................................................................... 58 Mining and Quarrying ........................................................................................................................... 58 Tourism ................................................................................................................................................ 59 Light Industry, Retail and Services ......................................................................................................... 61 Accommodation .................................................................................................................................... 61 Business Centres and Infrastructure ...................................................................................................... 62 Ecosystem Services and Conservation Management .............................................................................. 63 Cultural Landscape Management .......................................................................................................... 65 Tropical Environment Management Training ......................................................................................... 65 Research ............................................................................................................................................... 66 Maximising Economic Opportunities ..................................................................................................... 66 Indigenous Employment ....................................................................................................................... 71 Consequential Economic Development .................................................................................................. 73
Potential Impacts .................................................................................................................... 74 Changes in Land Use............................................................................................................................. 75
24 June 2012 4 Version 3.0
The Potential Economic Benefits of Protecting and Presenting Cape York
Tenure .................................................................................................................................................. 76 Approvals ............................................................................................................................................. 76 Land Management ................................................................................................................................ 77 Access .................................................................................................................................................. 77 Community Services .............................................................................................................................. 78 Grazing ................................................................................................................................................. 78 Fisheries, Aquaculture and Agriculture ................................................................................................. 79 Forestry/Timber .................................................................................................................................... 80 Mining .................................................................................................................................................. 80 Quarrying ............................................................................................................................................. 80 Tourism ................................................................................................................................................ 81 Light Industry, Retail, Business Centres, Services and Accommodation ................................................. 82 Indigenous ............................................................................................................................................ 82 Mitigating Potential Adverse Impacts .................................................................................................... 83 The Impacts of No Action ...................................................................................................................... 84
Management Considerations .................................................................................................. 86 Optimal Management Practices ............................................................................................................. 86 Local Determination .............................................................................................................................. 87 Management Regimes ........................................................................................................................... 88
Potential Future Scenarios ...................................................................................................... 90 Assumed World Heritage Area ............................................................................................................... 90 Management Assumptions .................................................................................................................... 91 Tourism Trends and Forecasts .............................................................................................................. 92 Summary of Assumptions for Scenarios ................................................................................................ 95 Potential Future Scenarios ..................................................................................................................... 96 Likelihood Considerations for Scenarios ............................................................................................... 96
Economic Modelling ............................................................................................................... 99 Methods ................................................................................................................................................ 99 Economic Impact Assessment ............................................................................................................. 100 Cost Benefit Type Presentation ........................................................................................................... 108
Modelled Potential Economic Benefits ................................................................................... 113 Summary Results of Economic Modelling ............................................................................................ 113 Sensitivity Analysis .............................................................................................................................. 115 Cost Benefit ........................................................................................................................................ 116
Conclusions ......................................................................................................................... 118 References ........................................................................................................................... 119 Appendix One – Scenario Results .......................................................................................... 121
No Action Scenario .............................................................................................................................. 122 Modest Conservation, Modest Tourism ............................................................................................... 125 Modest Conservation, High Tourism ................................................................................................... 128 High Conservation, Modest Tourism ................................................................................................... 131 High Conservation, High Tourism ....................................................................................................... 134

24 June 2012 5 Version 3.0
The Potential Economic Benefits of Protecting and Presenting Cape York
Summary
Background This document presents the results of a study of the economic benefits of “Protecting and Presenting” Cape York Peninsula, most likely by world heritage listing. The study was undertaken by EcoSustainAbility (Guy Chester) in association with the University of Queensland (Sally Driml) in collaboration with Cape York Sustainable Futures as a project for the Queensland Department of Environment and Heritage Protection (was Department of Environment and Resource Management).
Other World Heritage Areas Based on other Australian world heritage sites, it is very difficult to draw any conclusions on the economic impact of world heritage listing given the lack of data, the possibility of many other economic influences on visitor behaviour, and not well understood influences of publicity and marketing.
Cape York Economy The Cape York population (2010) is 16,800, 57 percent of which is of Aboriginal or Torres Strait Islander origin. Growth is 2.2 percent annually. There are 8,250 persons employed (2010), unemployment is 16 percent. Primary industries support 8.4 percent of jobs, manufacturing, construction, energy and waste and transport supported 19.1 per cent of jobs; and the trade and services sectors provided the remaining 72.5 per cent of employment.
The Gross Value Added for the Far North Queensland Region (minus Cairns) is $3,754m.
Land Use In summary, 14.3 percent of Cape York is National Park, 23.3 percent is Aboriginal Shire Lease, DOGIT or Land Trust, 52.9 percent is lands lease (33.89 percent is actively pastoral properties, see section below) and 0.7 percent is freehold. Nature reserves comprise a further 3.55 percent. Of critical importance to the economic development situation for Cape York is the very low proportion of freehold land and as such many development opportunities are constrained by the allowable purposes/uses of lease, trust and reserved land.
There are other tenures and statutory land designations which have conservation effect; these include wild rivers designations and the various planning schemes in effect by local governments. There is of course also many tens of thousands of square kilometres of lands which are indigenous and/or pastoral which may have significant conservation values and which comprise relatively intact natural landscapes.
The current conservation land tenures on Cape York include national parks, CYPAL national parks, coordinated conservation areas, nature refuges, a private wildlife reserve and an Indigenous Protected Area; these comprise 20 percent of Cape York.
Tourism Tourism is 9.7 percent of the output of the Tropical North Queensland region (including Cairns), (compared with 3% for all of Australia).
Tourism data is problematic as the reporting areas do not allow easy understanding of the area of interest. Tourism in the Cape York Peninsula Area has one focus in the lower Cape based around Cooktown as the destination. This includes commercial tours from Cairns as well as self drive tourism. The other major tourism focus is longer trips to the tip of Cape York on commercial tours and by self drive tourists.
The most recent published information on tourism in the area is for the Cook Shire in 2007. This data indicates that there were 87,000 visitors and 276,000 visitor nights when domestic and international tourism is added together.
There is considerable uncertainty around estimates of tourist numbers, visitor nights and expenditure due to small sample sizes for the Cape York Peninsula Area in the major tourism surveys, the National Visitor Survey and International Visitor Survey. An approximate figure can be obtained by excluding the accommodation property data of more than 15 rooms as a surrogate for Cooktown from overall Cape York figures. This results in 71,000 visitors and 619,000 visitor nights. This is considered a bit high. CYSF report that about 20,000 visitors travel to the tip of Cape York.
Estimated expenditure per day used for rest of Cook Shire and Rest of Cape York is $70, based on the Outback Central West results for campers and caravaners as an average of non commercial and commercial accommodation.
The estimated current total expenditure by visitors to CYP (excluding Cooktown) is $29 million, and this contributes $9 million in direct value added or $15 million in direct plus indirect value added. This expenditure supports 156 direct jobs and a total of 197 jobs direct plus indirect jobs in the FNQ region.
The vast majority of “accommodation” on Cape York is camping for the self drive or safari tour market. Camping accommodation includes an approximate capacity of 4500 people, including all bush camping sites, or 3500 people at sites with at least basic facilities.
Commercial accommodation ranges from the Bamaga Resort and resort style motels at Weipa to the remote lodges such as Lotusbird Lodge and Iron Range Cabins. The work for this project has identified 947 bed capacity. The Weipa accommodation is mostly local business travel, as is some accommodation along the Peninsula Development Road and in communities.
For the purposes of this study it is assumed that there are 700 beds in 24 properties available for leisure travel tourism. This provides an annual capacity of 147,000 bed nights for a seven month season. The campsites with at least basic facilities provides for 735,000 “bed” (sic tent!) nights.
If it is assumed that there are 50,000 visitors to Cape York Peninsula (excluding Cooktown and surrounds) with an average length of stay of seven nights this represents a current demand of 350,000 bed nights.
At present there is overcrowding of key sites during peak periods such as school holidays.
24 June 2012 6 Version 3.0
The Potential Economic Benefits of Protecting and Presenting Cape York
Agriculture In terms of primary industries, fishing aquaculture and forestry are minor. Agricultural production for the Cape York Peninsula Area is reported for 2005-6 as $42.4 million, $28.1 m being livestock slaughtering, the rest is crops. This includes all of Cook Shire and includes the relatively intensive cropping and grazing near Cooktown and Lakeland.
The grazing industry is the major primary industry, there are 44 properties comprising 49,000 km2 and assuming a stocking density of 50 hectares per head, there is an estimated herd of 97,600 with an annual value of sales of about $8 million (2011 dollars) or about $1.60 per hectare.
Conservation Management In summary, it is concluded that there are existing conservation and natural resource management programs on Cape York, which for the 2010/11 year, amount to at least $17.5m and 189 jobs ($13.9m recurrent and $3.5m capital expenditure). Approximately $6.9m of this funding is to land and sea country ranger programs and indigenous land management.
Conservation management and staff for the current Cape York programs have been compared with similar world heritage sites.
The direct management expenditure ($) per area of world heritage site (km2). This shows a wide range of $200,000/km2 for the very small Naracorte to $113/km2 for the extensive Shark Bay. The mean for similar WH sites is $2737/km2, Cape York is $278/km2.
The management staff per area of world heritage site (km2). This shows a wide range of 4.7 employees/km2 for the very small Naracorte to 0.001 employees/km2 for the extensive Shark Bay. The mean for similar WH sites is 0.01 employees/km2. Cape York is 0.00374 employees/km (or about 40% of the mean, but three times Shark Bay).
In order to take into account the need for greater area to require increased management and the need have greater management of high visitation two indices which factor in both area and visitors have been derived.
The direct management expenditure ($) per area of world heritage site (km2) per visitor. The mean for similar WH sites is $0.019/visitor/km2, Cape York is $0.009/visitor/km2.
The management staff per area of world heritage site (km2) per visitor. The mean for similar WH sites is 0.000000101 staff/km2/visitor, Cape York is 0.000000124.
Opportunities, Impacts and Management The key opportunity resulting from protecting and presenting Cape York could include increased conservation/natural resource management by government agencies and by indigenous and other landowners. The key enabling factors include government expenditure on conservation management and the development of long term programs including training and empowerment of local people allowing career paths and long term livelihoods to be based on conservation management.
Tourism is a potential economic benefit which will require substantial investment in marketing and tourism infrastructure to realise growth and economic benefits.
Grazing has an ongoing role in the economy and it is assumed that the current area of land for grazing will remain. World heritage listing could affect mining, quarrying timber and agriculture activities.
The major enabling factors to facilitate an economic benefit from world heritage listing (or other protection and presentation) include:
Government expenditure on long term conservation and natural resource management of public, indigenous and pastoral lands.
Government expenditure on tourism marketing, access and facilities.
Creating/allowing tenures and planning approvals to facilitate tourism and other micro/small businesses to realise the businesses to support economic growth.
Ensuring access is maintained and upgraded throughout Cape York to key community and tourism sites (noting that this may require use of quarries and borrow pits and some new roads or re-alignment of roads and river crossings etc. within the world heritage area).
The potential impacts on world heritage listing include the potential loss of minor industries and potential land uses such as intensive agriculture. There is the potential for world heritage listing to constrain community growth, tourism through the addition of onerous approval process, restriction of access and limitations on uses. Mitigation strategies are proposed which minimise economic and social impacts whilst maximising the potential for protection of world heritage values.
The study has not considered mining and any potential impacts on mining as it is assumed that current mines will be excluded from the world heritage area. There remains the possibility for an impact on the economic potential of Cape York if potential mines are included within the world heritage area and subsequent development is restricted or prohibited.
In terms of management, the following aspects may aid maximising the economic opportunities and minimise social impacts resulting from world heritage listing.
Governance: Ensuring local community, business and landholder involvement.
24 June 2012 7 Version 3.0
The Potential Economic Benefits of Protecting and Presenting Cape York
Autonomy: Whether a separate agency or part of an existing entity, giving local land managers and any overarching agency local autonomy.
Integration: Ensuring the management/regulatory regime will integrate or replace existing bureaucracy/development permits rather than be additional.
Resources: Ensuring the level of resources for natural resource/conservation management and presentation of the world heritage area are adequate.
Longevity: Ensuring government commitment to long term funding for recurrent management and capital expenditure on enabling projects and infrastructure.
Local/regional: The level of local autonomy within the overall world heritage region, such as a local indigenous land owner group or pastoralist having local autonomy for the management of their section of the world heritage area.
Capacity: An initial major focus (then ongoing support for) the level of local institutional/enterprise/entrepreneur capacity for facilitation of economic development and benefits.
Assumed World Heritage Area For the modelling of potential future scenarios, the assumption is of a broad acre AICS/world heritage nomination. Approximately 30% of the Cape would be included. The assumed world heritage area includes 51,100 km2, 30,000 km2 of which will be national park and 10,000km2 nature refuges on trust or leased lands.
To avoid any doubt, this is merely an assumed world heritage area, prepared by EcoSustainAbility, it is included in this study as the basis for modelling of the scenarios, not to guide the AICS or world heritage process.
Future Scenarios The intention of developing scenarios section is to provide an analysis of a range of future scenarios based on levels of natural resource management, tourism and infrastructure.
Five scenarios have been modelled: No world heritage, tourism organic growth, no more
natural resource management. (No Action) Modest natural resource management, modest tourism
growth. Modest natural resource management, high tourism
growth. Intensive natural resource management, modest tourism
growth. Intensive natural resource management, high tourism
growth.
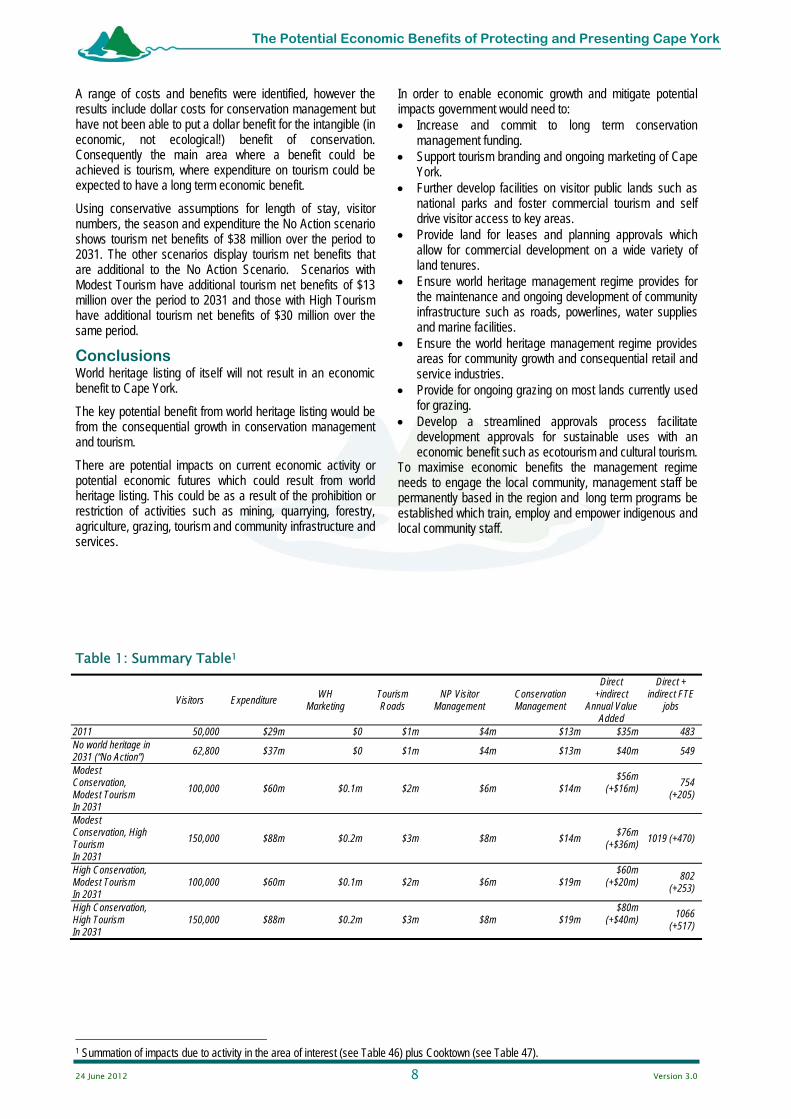
Economic Modelling of Benefits The modelling of the potential economic benefits of protecting and presenting Cape York takes the form of comparing the modelled outcomes of a No Action scenario with the modelling of various future scenarios. The modelling period was 2011 to 2031. The modelling is based on assumptions and is not a prediction. The industries/activities modelled include tourism (visitation, construction and tourism roads), national park visitor management, conservation management and grazing. Table 1 summarises the results.
A range of conservative assumptions for key aspects of the modelled economy, scenarios and multipliers have been used. Included in the model is an assumed total level of tourism which would be achieved, investment in tourism infrastructure capacity by both government (national park visitor facilities and roads) and private enterprise (e.g. lodges and commercial camping etc.). A trigger of 65% occupancy was used for determining growth (and investment required in accommodation).
Cooktown is outside the area modelled but the visitation impacts were included.
Increases in No Action to 2031 compared with the Current in 2011 are mainly due to growth in tourism expenditure, growing at the expected ‘business as usual’ growth rate.
Increases in Value Added and Employment for the four change scenarios at 2031 (including generated by activity in the area of interest and extra tourism to Cooktown) are shown in the Table 1 below. As expected, these increase with the increased injection of funds from tourists visiting the region of interest, from private tourism construction expenditure and from government for management in this region. Direct and total impacts are estimated for the broader Far North Queensland region.
Should world heritage listing not proceed, with tourism visitation growing at average Australian projected growth rates there would be 62,800 visitors spending $37m annually by 2031. With government annual expenditure at similar levels to today ($18m on tourism roads, national park visitor management and conservation management) there would be a value added benefit of $40m and 549 jobs (66 more jobs than today).
On a regional basis, employment ranges from an additional 205 jobs (above No Action) under the Modest Conservation, Modest Tourism scenario to an additional 517 jobs under the High Conservation, High Tourism scenario.
When indirect and extra tourism in Cooktown is considered the total direct and indirect (value added) economic benefit to the FNQ region is $56m ($16m more than No Action) under the Modest Conservation, Modest Tourism scenario and an additional $40m annually ($80m in total) under the High Conservation, High Tourism scenario.
Government would need to invest in aggressive marketing, additional tourism infrastructure and more intensive natural resource management and conservation; and tourism infrastructure and numbers, length of stay and expenditure would need to meet assumptions, for the increased annual value added benefit of $40m and 517 jobs of the High Conservation, High Tourism scenario result to be achieved.
Cost Benefit Analysis is an additional economic tool to inform decision makers of the costs and benefits of a proposal. It extends consideration to non-market social and environmental goods and services, even if it is not possible to place dollar values on all of these.
This study is not a full Cost Benefit Analysis (CBA), but rather is the first stage towards a CBA. In CBA, all present and future costs and benefits are discounted to a ‘present value’ and compared in a Net Present Value (NPV) sum across all the years.
24 June 2012 8 Version 3.0
The Potential Economic Benefits of Protecting and Presenting Cape York
A range of costs and benefits were identified, however the results include dollar costs for conservation management but have not been able to put a dollar benefit for the intangible (in economic, not ecological!) benefit of conservation. Consequently the main area where a benefit could be achieved is tourism, where expenditure on tourism could be expected to have a long term economic benefit.
Using conservative assumptions for length of stay, visitor numbers, the season and expenditure the No Action scenario shows tourism net benefits of $38 million over the period to 2031. The other scenarios display tourism net benefits that are additional to the No Action Scenario. Scenarios with Modest Tourism have additional tourism net benefits of $13 million over the period to 2031 and those with High Tourism have additional tourism net benefits of $30 million over the same period.
Conclusions World heritage listing of itself will not result in an economic benefit to Cape York.
The key potential benefit from world heritage listing would be from the consequential growth in conservation management and tourism.
There are potential impacts on current economic activity or potential economic futures which could result from world heritage listing. This could be as a result of the prohibition or restriction of activities such as mining, quarrying, forestry, agriculture, grazing, tourism and community infrastructure and services.
In order to enable economic growth and mitigate potential impacts government would need to: Increase and commit to long term conservation
management funding. Support tourism branding and ongoing marketing of Cape
York. Further develop facilities on visitor public lands such as
national parks and foster commercial tourism and self drive visitor access to key areas.
Provide land for leases and planning approvals which allow for commercial development on a wide variety of land tenures.
Ensure world heritage management regime provides for the maintenance and ongoing development of community infrastructure such as roads, powerlines, water supplies and marine facilities.
Ensure the world heritage management regime provides areas for community growth and consequential retail and service industries.
Provide for ongoing grazing on most lands currently used for grazing.
Develop a streamlined approvals process facilitate development approvals for sustainable uses with an economic benefit such as ecotourism and cultural tourism.
To maximise economic benefits the management regime needs to engage the local community, management staff be permanently based in the region and long term programs be established which train, employ and empower indigenous and local community staff.
Table 1: Summary Table1
Visitors Expenditure WH
Marketing Tourism Roads
NP Visitor Management
Conservation Management
Direct +indirect
Annual Value Added
Direct + indirect FTE
jobs
2011 50,000 $29m $0 $1m $4m $13m $35m 483 No world heritage in 2031 (“No Action”) 62,800 $37m $0 $1m $4m $13m $40m 549
Modest Conservation, Modest Tourism In 2031
100,000 $60m $0.1m $2m $6m $14m $56m
(+$16m)
754 (+205)
Modest Conservation, High Tourism In 2031
150,000 $88m $0.2m $3m $8m $14m $76m
(+$36m) 1019 (+470)
High Conservation, Modest Tourism In 2031
100,000 $60m $0.1m $2m $6m $19m $60m
(+$20m)
802 (+253)
High Conservation, High Tourism In 2031
150,000 $88m $0.2m $3m $8m $19m $80m
(+$40m)
1066 (+517)
1 Summation of impacts due to activity in the area of interest (see Table 46) plus Cooktown (see Table 47).
24 June 2012 9 Version 3.0
The Potential Economic Benefits of Protecting and Presenting Cape York
Introduction
Study of Economic Benefits This document reports on a study of the economic benefits of “Protecting and Presenting” Cape York Peninsula. The study addresses the potential world heritage listing, and more generally addresses the economic benefits of the overall protection of Cape York’s natural and cultural heritage and it presentation.
Authors The study was undertaken by EcoSustainAbility (Guy Chester) in association with the University of Queensland (Sally Driml) in collaboration with Cape York Sustainable Futures (CYSF) as a project for the Queensland Department of Environment and Heritage Protection (DEHP, which was the Department of Environment and Resource Management (DERM). Guy Chester managed the study and was the prime author of the scenarios, opportunities (qualitative), impacts and management chapters. Sally Driml compiled much of the economic baseline for the Cape and undertook the economic modelling. Guy Chester was the overall editor. Conclusions, opinions and assumptions within this report are those of the authors.
The study has been guided by Lyn Wallace (DEHP) and Trish Butler (CYSF).
Departmental References This report refers to government departments as they were up to February 2012. The Department of Environment and Resource Management is referred to for all its activities prior to February 2012. With the Department being disaggregated, the new Department of Environment and Heritage Protection has the carriage of the project.
Project Brief Purpose The prime purpose of the study is to undertake an economic benefit analysis in relation to a potential world heritage nomination for suitable areas of Cape York Peninsula.
There is a need to not just focus on the world heritage listing, but more specifically on the benefits of the protection, conservation and presentation of the cultural and natural heritage national and/or international significance of Cape York.
Further, the Study may be an input to the community engagement program for the declaration of Areas of International Conservation Significance (AICS) and the preparation of a world heritage nomination for parts of Cape York Peninsula.
Fundamentally this study attempts to provide some understanding to meet the aspirations and concerns of Traditional Owners, pastoralists, community residents and small business owners as to the potential economic impacts and opportunities for benefit that may arise from world heritage listing and associated government inputs from management and promotion of the Cape.
Considerations The previous Queensland Government committed to the identification and declaration of AICS under the Cape York Peninsula Heritage Act which may contribute to a national and world heritage nomination for appropriate areas with Traditional Owner consent and community support.

24 June 2012 10 Version 3.0
The Potential Economic Benefits of Protecting and Presenting Cape York
The three separate processes of AICS, national and world heritage listing were aligned and are being pursued concurrently. The process is being undertaken in collaboration with the Cape York Peninsula Scientific and Cultural Advisory Committee (CYPSCAC), the Cape York Peninsula Regional Advisory Committee (CYPRAC) and the Australian Government based on a draft discussion paper by Peter Valentine and Dermot Smyth (2008).
The following key assumptions have guided the development of this pathway:
Large areas of the Cape York Peninsula Region (CYPR) would meet one or more of both the cultural and natural criteria and the cultural landscape requirements.
A commitment to appropriate and sustainable management of the nominated cultural and natural heritage and cultural landscape(s) is a prerequisite to a successful nomination.
The demonstrated support of the communities in the region, especially the Indigenous people of the region, is a prerequisite to a successful nomination.
Terms of Reference for the Report Opportunities Snapshot: Consider the economic opportunities presented by WH Listing in other similar sites.
Cape York Opportunities: Consider how WH listing could enhance sustainable economic development on Cape York Peninsula.
Adverse Impacts: Consider any potential adverse economic impacts of world heritage listing on Cape York Peninsula.
No Action Alternative: Consider the potential economic implications of not proceeding or succeeding with a world heritage listing for Cape York Peninsula.
Indigenous Effects: In relation to all of the above, identify how the Indigenous people, communities and businesses of the Cape will be impacted.
Management: Make recommendations in relation to the optimal management practices and approaches of a future world heritage site on Cape York Peninsula, including appropriate levels of Indigenous involvement in management, so as to deliver the best sustainable economic opportunities and minimise economic disadvantage, recognising that:
The economic implications of world heritage listing may be influenced by the WH management and regulatory regime adopted to manage the values of a site; and
Details of the management regime of any future WH area on CYP are not yet known.
Cape York Region This report variously describes the Cape York Peninsula Area (the various local government areas less Bamaga and sometimes Cooktown), Cape York Peninsula, the Cape York Region (the area the subject of the Heritage Act) and other spatial terms. This is owing to the various data sets using different areas and the overall lack of any agreed definition of the southern boundary of “Cape York”.
Rigour It is important to note that there is a paucity of relevant economic data for Cape York. As such the process undertaken can be categorised as a rigorous methodology using available data and indentified/defensible assumptions. Given this approach, assumptions are identified and where possible the basis for them cited. Where practical sensitivity to minor changes to key assumptions has been considered before finalising our modelling.
24 June 2012 11 Version 3.0
The Potential Economic Benefits of Protecting and Presenting Cape York
World Heritage The Convention Concerning the Protection of the World Cultural and Natural Heritage (the Convention) was adopted by the UNESCO General Conference in 1972. The Convention came into force in 1975 and is now ratified by 186 States Parties.
The Convention aims to promote cooperation among nations to protect heritage from around the world that is of such outstanding universal value that its conservation is important for current and future generations. It is intended that, properties on the World Heritage List will be conserved for all time. States Parties to the Convention commit themselves to ensure the identification, protection, conservation, and presentation of World Heritage properties. States recognize that the identification and safeguarding of heritage located in their territory is primarily their responsibility. They agree to do all they can, using their own resources and, at times with international assistance, to protect their World Heritage properties.
In addition to the Convention, the “Operational Guidelines for the Implementation of the World Heritage Convention” is the main framework for World Heritage management.
Obligations Each Country has obligations to identify, list and manage World Heritage. States parties agree, amongst other things, to as far as possible:
adopt a general policy which aims to give the cultural and natural heritage a function in the life of the community and to integrate the protection of that heritage into comprehensive planning programs;
undertake appropriate legal, scientific, technical, administrative and financial measures necessary for the identification, protection, conservation, presentation and rehabilitation of this heritage; and
refrain from any deliberate measures which might damage, directly or indirectly, the cultural and natural heritage of other Parties to the Convention, and to help other Parties in the identification and protection of their properties.
World Heritage Committee The Convention is administered by a World Heritage Committee , which consists of 21 members elected from those States that are Parties to the Convention. Elections are held every two years. The Committee's main tasks are to:
decide on the inscription of new properties on the World Heritage List discuss all matters relating to the implementation of the Convention consider requests for international assistance ensure States meet their obligations under the Convention to protect World Heritage properties administer the World Heritage Fund.
The Committee is supported by a small secretariat, the World Heritage Centre, which is a part of the United Nations Educational, Scientific and Cultural Organisation (UNESCO) based in Paris, France.
World Heritage List The World Heritage List includes 890 properties forming part of the cultural and natural heritage which the World Heritage Committee considers as having outstanding universal value. These include 689 cultural, 176 natural and 25 mixed properties in 148 States Parties.
24 June 2012 12 Version 3.0
The Potential Economic Benefits of Protecting and Presenting Cape York
“In Danger” There is a List of World Heritage in Danger to inform the international community of conditions which threaten the values for which a property was inscribed as World Heritage, and to encourage corrective action. Armed conflict and war, earthquakes and other natural disasters, pollution, poaching, uncontrolled urbanization and unchecked tourist development pose major problems to World Heritage sites. Dangers can be ‘ascertained’, referring to specific and proven imminent threats, or ‘potential’, when a property is faced with threats which could have negative effects on its World Heritage values.
The World Heritage Committee can inscribe on the List of World Heritage in Danger properties whose protection requires ‘major operations (…) and for which assistance has been requested’. Inscribing a site on the List of World Heritage in Danger allows the World Heritage Committee to allocate immediate assistance from the World Heritage Fund to the endangered property. Inscription on the List of World Heritage in Danger is not perceived in the same way by all parties concerned. Some countries apply for the inscription of a site to focus international attention on its problems and to obtain expert assistance in solving them. Others however, wish to avoid an inscription, which they perceive as a dishonour. The listing of a site as World Heritage in Danger is not meant to be a sanction, but as a system established to respond to specific conservation needs in an efficient manner.
Values To be included on the World Heritage List, sites must be of outstanding universal value and meet at least one out of ten selection criteria. In summary, the criteria are:
World Heritage Values (Cultural) i. Masterpiece of human creative genius ii. Interchange of human values iii. Exceptional testimony to cultural tradition/civilisation iv. Outstanding example of building/landscape v. Traditional human settlement/land use/sea use vi. Tangibly associated with events and living traditions
World Heritage Values (Natural) vii. Superlative natural phenomena, exceptional natural beauty viii. Earth’s history, record of life, geological processes ix. Significant ecological and biological processes, ecosystems/communities x. Natural habitats for in-situ conservation
Integrity and Authenticity In addition to the values, there are conditions of integrity and authenticity which must be met, in summary these are:
Authenticity (cultural criteria) Reliability of information, cultural context etc.
Integrity (all properties) Wholeness and intactness All elements, adequate size for representation
There are specific integrity conditions for each natural criteria. WH Protection and Management The Convention and Operational Guidelines have specific obligations on Countries for their World Heritage sites. Specifically, there are pre-requisites for legislative and regulatory protection, boundaries for effective protection, buffer zones, management systems and sustainable use which must be met before World Heritage listing can be achieved.
24 June 2012 13 Version 3.0
The Potential Economic Benefits of Protecting and Presenting Cape York
Cape York World Heritage Nomination and Management The above is a summary, the full convention and operational guidelines have many and various detailed provisions relating to the potential listing process, the vales, their integrity and ongoing management requirements.
The fundamental issue for Cape York is that the values need to be determined in a manner which allows for an assessment of their significance, their conditions of integrity, the level of representativeness by any world heritage area. The management regime and community support need to be finalised before nomination (not subsequently).
24 June 2012 14 Version 3.0
The Potential Economic Benefits of Protecting and Presenting Cape York
The Economic Impact of World Heritage Areas
Comparison This section provides a context and basis for comparison with other world heritage areas (WHAs).
This discussion is presented in two parts. The first addresses the economic activity associated with world heritage areas in Australia, and as such presents a basis for understanding the economic significance of expenditure by visitors and expenditure by governments on management of these areas.
The second part addresses whether it is possible to ascribe any increase in economic activity to the listing of these areas on the register as opposed to the economic activity being a result of ‘business as usual’ for the protected area.
15 Australian World Heritage Areas A major study of the economic activity associated with Australia’s World Heritage Areas was prepared by Gillespie Economics and BDA Group (2008). This study included 15 of Australia’s 17 WHA and excluded the Great Barrier Reef and Heard and McDonald Islands.
The study focussed on the economic regions in which the WHAs are located and also estimated state level and national level economic activity associated with the WHAs.
Direct economic activity was measured as the money spent by governments on management of the WHAs and the money spent by visitors to the WHAs2. In the case of visitor expenditure the estimate is based on all expenditure in a region by people who visited the WHA. This is a broad definition of expenditure, whereas a more narrow definition would include only the expenditure directly due to the opportunity to visit the WHA—that is it would not have occurred in the region if the opportunity to visit the WHA was not available (Driml et al. 2011).
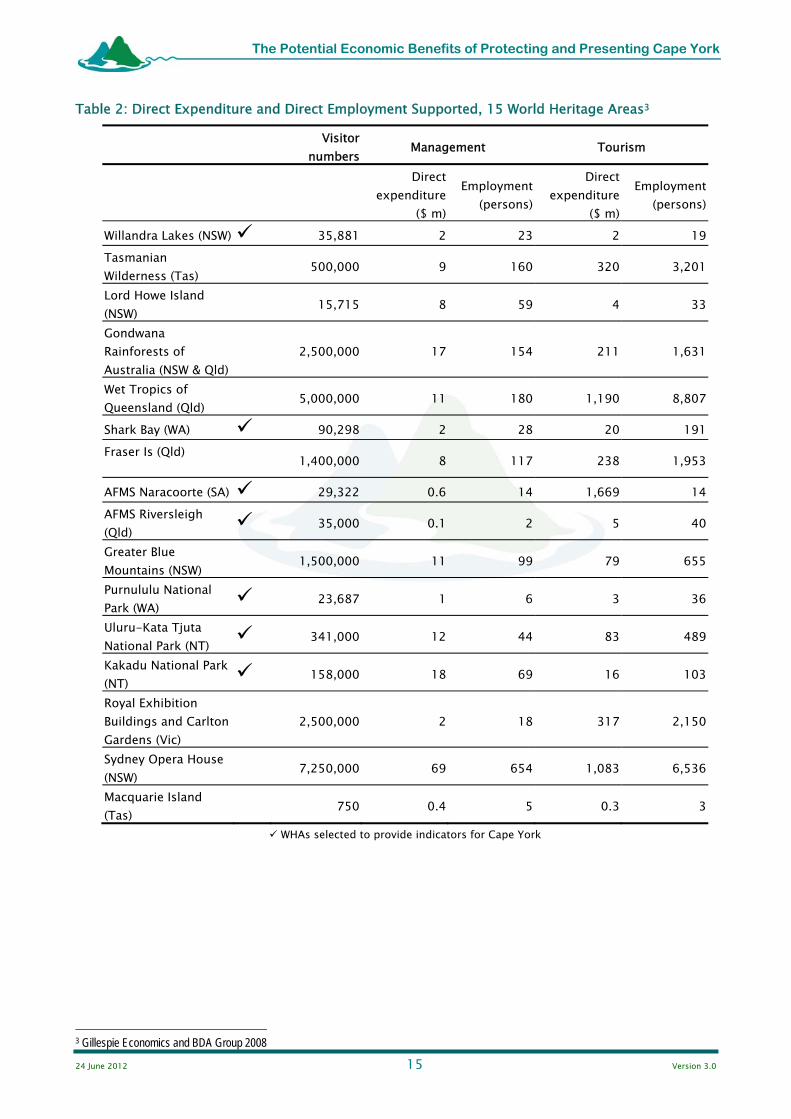
The authors used the economic modelling technique of Input-Output analysis to estimate the impact of this direct expenditure in the region (and state and nation) in terms of generating ‘value added’, income to households and employment. Furthermore the Input-Output models allowed the estimation of flow-on effects in the economy due to the impact of the direct expenditure and so generated indirect output, value added, income and employment estimates. The Gillespie Economics and BDA report contains very detailed results for each of the 15 WHAs. For the purposes of this study, the direct expenditure and direct employment supported (estimated from the Input-Output models) are shown in Table 2.
Of the natural environment WHAs, the Wet Tropics of Queensland has the highest visitor numbers (5 million) and greatest economic activity due to visitors at over $1 billion per year supporting around 8,800 jobs. This is supported by government expenditure of $11 million on management creating 180 jobs. Whilst the Cape York Peninsula Area is close to the Wet Tropics, it currently has tourism characteristics more similar to one of the smaller, more remote, WHAs like Shark Bay with its 90,000 visitors, $20 million visitor expenditure supporting 191 jobs. For Shark Bay, government management funding was $2 million supporting 28 jobs. However, government national park visitor management and conservation management funding of Cape York is more similar to the Wet Tropics with current funding of around $17 million supporting 148 FTE direct plus indirect jobs.
2 It should be noted that there is no necessary relationship between visitor numbers and expenditure and the amount spent by governments on management. Management budgets are determined by decisions by the management agencies, which take into account a number of factors.
24 June 2012 15 Version 3.0
The Potential Economic Benefits of Protecting and Presenting Cape York
Table 2: Direct Expenditure and Direct Employment Supported, 15 World Heritage Areas3
Visitor numbers Management Tourism
Direct
expenditure($ m)
Employment (persons)
Direct expenditure
($ m)
Employment (persons)
Willandra Lakes (NSW) 35,881 2 23 2 19Tasmanian Wilderness (Tas) 500,000 9 160 320 3,201
Lord Howe Island (NSW) 15,715 8 59 4 33
Gondwana Rainforests of Australia (NSW & Qld)
2,500,000 17 154 211 1,631
Wet Tropics of Queensland (Qld) 5,000,000 11 180 1,190 8,807
Shark Bay (WA) 90,298 2 28 20 191Fraser Is (Qld) 1,400,000 8 117 238 1,953
AFMS Naracoorte (SA) 29,322 0.6 14 1,669 14AFMS Riversleigh (Qld) 35,000 0.1 2 5 40
Greater Blue Mountains (NSW) 1,500,000 11 99 79 655
Purnululu National Park (WA) 23,687 1 6 3 36
Uluru-Kata Tjuta National Park (NT) 341,000 12 44 83 489
Kakadu National Park (NT) 158,000 18 69 16 103
Royal Exhibition Buildings and Carlton Gardens (Vic)
2,500,000 2 18 317 2,150
Sydney Opera House (NSW) 7,250,000 69 654 1,083 6,536
Macquarie Island (Tas) 750 0.4 5 0.3 3
WHAs selected to provide indicators for Cape York
3 Gillespie Economics and BDA Group 2008

24 June 2012 16 Version 3.0
The Potential Economic Benefits of Protecting and Presenting Cape York
Great Barrier Reef World Heritage Area A study by Access Economics (2009) estimated the economic contribution of the Great Barrier Reef (GBR) Marine Park to the GBR Catchment Area, Queensland and Australia. This study also used Input-Output modelling to estimate employment supported and indirect effects. The GBR Marine Park is a multiple use area and along with tourism, commercial and recreational fishing are allowed under managed conditions. The methodology of the study however included all tourism in the regions adjacent to the GBR, termed the ‘GBR Catchment Area’, regardless of whether tourists had visited the Reef or not. This has led to a very high end estimate of the potential economic activity supported due to the GBR. Using these high visitor estimates, tourism contributed 94% of the direct economic activity modelled. The major results are quoted from the report below, however these should be recognised as very generous estimates of economic activity supported by the GBR.
‘The total direct and indirect contribution of the GBRMP to the GBRCA is estimated to be just under $3.6 billion in 2006-07. The figure is larger for Queensland at just around $4.0 billion. Australia-wide, the contribution is just over $5.4 billion. These figures correspond with estimated employment contributions, direct and indirect, of 39,700 full time equivalents (FTE) of the GBRMP to the GBRCA. The employment figures for Queensland and Australia are 43,700 and 53,800 respectively ‘(Access Economics 2009, page ii).
Increased Economic Activity World Heritage Icon Value report (Buckley 2002) This report examined six Australian World Heritage Areas (Fraser Island, Kakadu National Park, Uluru Kata-Tjuta National Park, Tasmanian Wilderness, Shark Bay, Western Australia, and Central Eastern Rainforest Reserves) paired with ‘control’ sites for each WHA in order to see if World Heritage listing led to an increase in economic activity through tourism at the WHA sites.
Buckley found growth in overall visitor numbers at all the WHAs over time, with an increase in the proportion of overseas visitors at Fraser Island, Kakadu, Uluru Kata-Tjuta (from one of two data sources), Shark Bay and Central Eastern Rainforest Reserves. There was inadequate data to form a conclusion for the Tasmanian Wilderness WHA. Certainly the data presented in the report show that the WHAs support increasing visitor numbers and increasing proportions of overseas visitors.
However, when trying to determine if the act of listing WHAs was the source of visitor growth, different patterns became apparent. Buckley notes that in most cases data on WHAs and control sites are limited and therefore he was not able to make statistically based conclusions. He also notes that in some cases (Fraser Island, Kakadu) it appears that the controversy over potential listing led to the start of increased visitation to the WHAs, prior to the dates of listing. For some of the WHAs (Tasmanian Wilderness, Shark Bay), Buckley notes that there is insufficient data to indicate whether visitor numbers increased with listing. He concluded that for Uluru Kata-Tjuta, visitor growth took off with the completion of facilities at the park, four years before listing. There was no change in the rate of growth of visitor numbers at the Central Eastern Rainforest Reserves parks at the time of listing.
Buckley’s overall findings were: 1. Total visitor numbers at World Heritage Areas are commonly up to an order of magnitude higher than at comparable control sites, both pre-and post-listing. 2. For most Australian World Heritage Areas, data are inadequate to determine whether there is a significant World Heritage icon value. 3. For the few Australian World Heritage Areas with adequate data to test, World Heritage listing does seem to have a positive effect on measures of tourism expenditure, particularly by increasing the proportion of international visitors quite significantly.

24 June 2012 17 Version 3.0
The Potential Economic Benefits of Protecting and Presenting Cape York
15 World Heritage Areas The authors of the report on the 15 world heritage areas were specifically asked to investigate whether ‘designation of a site as WH status alters visitation and management expenditure and hence regional, state and national economic impacts’ (Gillespie Economics and BDA Group 2008, page 8). They approached this by seeking historical data on management expenditure and visitor numbers for the WHAs. However, as the authors note in their report, there is limited historical data held by WHA managers. They were only able to look at historical data spanning the inscription date for a few WHAs.
In respect of visitor numbers, for Shark Bay, Naracoorte and Purnululu, there was no growth in visitor numbers following inscription. For Uluru Kata-Tjuta, it was observed that listing occurred during a period of rapid growth with no discernable change after listing. For Kakadu however, some change was observed after two of the three stages of listing. It was noted that ‘visitation levels do seem to have rapidly increased a couple of years after the first stage of WH listing’ (Gillespie Economics and BDA Group 2008, page 10). The second stage of listing occurred in a period of rapid growth, with no change in that growth following listing. It was observed that the third stage of listing was followed by a period of growth, after which visitation has gradually declined to a new level.
The authors were able to obtain even fewer cases of historical management expenditure data. Management expenditure for Shark Bay increased only six to seven years after inscription. For Purnululu there was a one off increase the year after inscription. The Greater Blue Mountains had a rapid increase in management budget for the four years after inscription in 1999-2000 and then an even larger increase from the fifth year to a peak in 2005-06.
While the report shows considerable economic value associated with visitor use of the WHAs studied, the authors concluded that it was very difficult to draw any conclusions on the economic impact of the act of world heritage listing given the lack of data, the possibility of many other economic influences on visitor behaviour, and not well understood influences of publicity and marketing.
Wet Tropics WHA The Wet Tropics World Heritage Area (WTWHA) was listed in 1988 amid controversy over the economic future of the area. All logging of rainforest in the WTWHA was banned with future timber production confined to plantations outside the protected area. It was argued that tourism would provide the economic engine of the region in the future.
Writing in 2000, Driml made the observation that:
‘Reliable statistics are not available on the number of tours or visitors to the rainforests prior to listing, but the evidence from observation is of an increase in both since the time of listing. This may be attributed partly to underlying trends and partly to the listing and its publicity’. (Driml 2000, page 205)
Research undertaken several years after the listing showed that tourism in the entire North Queensland region had increased significantly in the 1980s and 1990s. Visitor numbers in 1997 were 44% higher than in 1991-92 (Driml 2000).
Based on a survey of visitors in 1994, the expenditure by tourists to the WTWHA who also stayed several nights in the adjacent region was estimated at $443 million per annum. This was over ten times the annual gross value of logging at the time of its cessation ($26 million in 1986 dollars, equivalent to $34 million at 1994 dollars) (Driml 2000).
Expenditure on conservation management did rise following listing with a $10 million package provided by the Commonwealth government as part of the compensation package to the region following listing. This amount was spent over the period of 1990-91 to 1994-95 (Driml 2000).
24 June 2012 18 Version 3.0
The Potential Economic Benefits of Protecting and Presenting Cape York
The Cape York Economy
Definition of Cape York Peninsula Area For the purposes of this chapter, the ‘Cape York Peninsula Area’ is defined to include the Local Government Areas (LGAs) of4:
Aurukun Cook Hope Vale Kowanyama Lockhart River Mapoon Napranum Northern Peninsula Area Pormpuraaw Weipa Wujal Wujal
The LGA of Torres has been excluded as it includes both the tip of Cape York (including Bamaga) and Thursday Island and so the regions as defined here is a lower bound estimate of the economy of the mainland area of Cape York. Within the State of Queensland, the Cape York Peninsula Area lies within the economic region of Far North Queensland, defined by the Statistical Division of the same name. It also lies within the Tropical North Queensland tourism region5. It is important to note that the Region includes the city of Cairns, the town of Port Douglas and the Atherton Tablelands. The majority of the population of the region lives outside the Cape York Peninsula part of the region and for most industries, the majority of economic activity occurs outside the Cape York Peninsula part of the region.
There are some challenges in describing an economic baseline for the Cape York Peninsula Area as many economic data series are not available below the regional level. In addition, some economic data of particular interest, such as regional industry contribution to Gross Regional Product, are not very current.
The approach used here for describing the economic baseline for Cape York includes reporting data for the actual Cape York Peninsula Area where possible. Regional level data is reported in some cases, for the purposes of placing the Cape York Peninsula Area economy into some context.
Population The estimated resident population of Cape York as at 30 June 2010 was 16,837 persons or 0.4 per cent of the Queensland population. At the time of the 2006 Census there were 7,751 persons who stated that they were of Aboriginal or Torres Strait Islander origin, or 56.9 per cent of the population (compared with 3.3 per cent for Queensland) (Australian Bureau of Statistics 2010a).
The distribution of population between the Local Government Areas is shown on Table 3 below. Population growth between 2009 and 2010 was around the same rate for Queensland as a whole, at 2.2 per cent.
4 The selection of LGAs to include is consistent with the report New Horizons and Opportunities (Cape York Sustainable Futures 2010) 5 The Far North Statistical Division differs from the Tropical North Region in that the former does include the LGA of Cardwell but does not include the LGAs of Burke Carpentaria and Mornington.

24 June 2012 19 Version 3.0
The Potential Economic Benefits of Protecting and Presenting Cape York
Table 3: Estimated Population LGAs and Cape York Peninsula Area6
Estimated population at 30 June Average annual growth rate
Local Government Area 2005 2009 2010(p)2005 to 2009(a)
%
2009 to 2010(p)
%Aurukun 1,133 1,209 1,216 1.4 0.6Bamaga 871 909 960 na 5.6Cooktown 1,411 1,509 1,549 na 2.6Cook Shire ex Cooktown 2,306 2,390 2,427 na 1.5Hope Vale 845 832 847 0.0 1.8Kowyanama 1,078 1,156 1,198 2.1 3.6Lockhart River 604 619 641 1.2 3.6Mapoon 245 266 267 1.7 0.4Napranum 878 930 951 1.6 2.3Northern Peninsula Area 2,135 2,282 2,389 2.3 4.7Pormpuraaw 646 676 698 1.6 3.3Weipa 2,807 3,320 3,340 3.5 0.6Wujal Wujal 356 352 354 -0.1 20.6Cape York 15,315 16,450 16,837 1.9* 2.3Queensland 3,994,858 4,424,767 4,513,850 2.5 2.0
(a) average annual growth rate, (p) preliminary *excludes Bamaga
Employment The labour force in the Cape York Peninsula Area was 8,248 persons at the December quarter 2010. There were over 2,000 persons in the labour force in the Cook Shire and Weipa Town LGAs. The number of unemployed persons aged 15 years and over at the December quarter 2010 was 1,342 persons. This was an unemployment rate of 16.3 per cent (compared with 5.5 per cent for Queensland). Napranum Shire, Mapoon Shire and Weipa Town LGAs recorded the lowest unemployment rate at 9.9 per cent while Wujal Wujal Shire recorded the highest unemployment rate of 23.2 per cent (Australian Bureau of Statistics 2007).
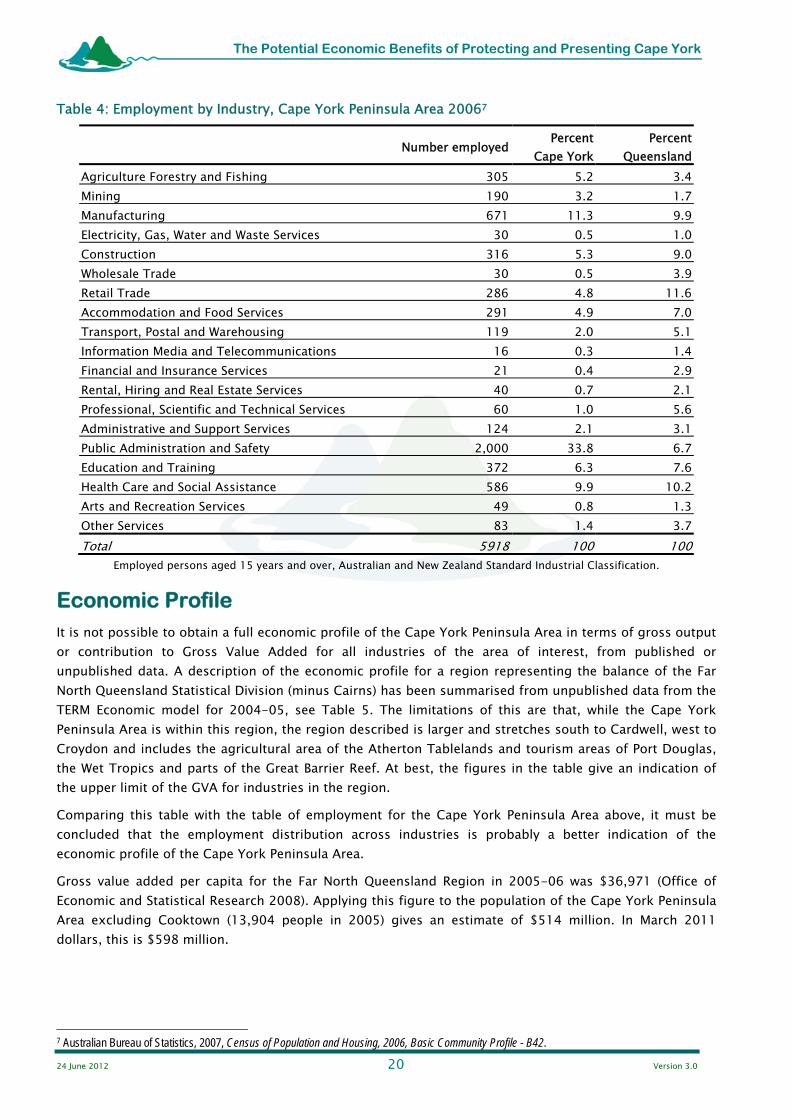
Employment by industry is shown in Table 4. The largest proportion of employment (33.8 per cent) is in the Public Administration and Safety Services industry classification. It is worth noting that the primary industries of agriculture, fisheries and forestry and mining supported 8.4 per cent of employment; manufacturing, construction, energy and waste and transport supported 19.1 per cent of jobs; and the trade and services sectors provided the remaining 72.5 per cent of employment. It should be noted that ‘tourism’ is not classified as a separate sector in the ANZSIC classification but that the employment supported due to expenditure by tourists falls within several of the industries.
6 Australian Bureau of Statistics, 2010a, Regional Population Growth, Australia, 2009-10, cat. no. 3218.0 and unpublished data, sourced from Office of Economic and Statistical Research, 2011, Queensland Regional Profiles, Queensland Treasury, Brisbane, viewed July 2011, http://statistics.oesr.qld.gov.au/qld-regional-profiles?
24 June 2012 20 Version 3.0
The Potential Economic Benefits of Protecting and Presenting Cape York
Table 4: Employment by Industry, Cape York Peninsula Area 20067
Number employed Percent Cape York
Percent Queensland
Agriculture Forestry and Fishing 305 5.2 3.4Mining 190 3.2 1.7Manufacturing 671 11.3 9.9Electricity, Gas, Water and Waste Services 30 0.5 1.0Construction 316 5.3 9.0Wholesale Trade 30 0.5 3.9Retail Trade 286 4.8 11.6Accommodation and Food Services 291 4.9 7.0Transport, Postal and Warehousing 119 2.0 5.1Information Media and Telecommunications 16 0.3 1.4Financial and Insurance Services 21 0.4 2.9Rental, Hiring and Real Estate Services 40 0.7 2.1Professional, Scientific and Technical Services 60 1.0 5.6Administrative and Support Services 124 2.1 3.1Public Administration and Safety 2,000 33.8 6.7Education and Training 372 6.3 7.6Health Care and Social Assistance 586 9.9 10.2Arts and Recreation Services 49 0.8 1.3Other Services 83 1.4 3.7Total 5918 100 100
Employed persons aged 15 years and over, Australian and New Zealand Standard Industrial Classification.
Economic Profile It is not possible to obtain a full economic profile of the Cape York Peninsula Area in terms of gross output or contribution to Gross Value Added for all industries of the area of interest, from published or unpublished data. A description of the economic profile for a region representing the balance of the Far North Queensland Statistical Division (minus Cairns) has been summarised from unpublished data from the TERM Economic model for 2004-05, see Table 5. The limitations of this are that, while the Cape York Peninsula Area is within this region, the region described is larger and stretches south to Cardwell, west to Croydon and includes the agricultural area of the Atherton Tablelands and tourism areas of Port Douglas, the Wet Tropics and parts of the Great Barrier Reef. At best, the figures in the table give an indication of the upper limit of the GVA for industries in the region.
Comparing this table with the table of employment for the Cape York Peninsula Area above, it must be concluded that the employment distribution across industries is probably a better indication of the economic profile of the Cape York Peninsula Area.
Gross value added per capita for the Far North Queensland Region in 2005-06 was $36,971 (Office of Economic and Statistical Research 2008). Applying this figure to the population of the Cape York Peninsula Area excluding Cooktown (13,904 people in 2005) gives an estimate of $514 million. In March 2011 dollars, this is $598 million.
7 Australian Bureau of Statistics, 2007, Census of Population and Housing, 2006, Basic Community Profile - B42.

24 June 2012 21 Version 3.0
The Potential Economic Benefits of Protecting and Presenting Cape York
Table 5: Balance of Far North Queensland Region (Minus Cairns) 2004-05, Gross Value Added8
Industry sector Gross Value Added($m) % of total GVA
Agriculture $499.9m 13.2Mining $310.4m 8.2Manufacturing $390.3m 10.3Energy and water $77.6m 2.0Construction $258.6m 6.8Wholesale $116.0m 3.0Retail $277.6m 7.2Restaurants and accommodating 118.5m 3.1Transport and postal 221.0m 5.8Banking, real estate and business services 634.8m 16.9Government administration and defence 358.1m 9.5Education 178.4m 4.7Health and community services 233.2m 6.2Arts, sport and entertainment 79.9m 2.1TOTAL $3,754m 100
Tropical North Queensland Tourism Tourism is not classified as a separate industry in the standard national accounting approaches to classifying industries. Thus spending by tourists is included in a number of sectors including accommodation, transport, retail etc. Recently, however, Tourism Satellite Accounts have been prepared which define tourism as a separate sector based on spending by tourists. This has allowed tourism to be compared with other industries. Tourism is an important industry in Tropical North Queensland (TNQ). Tourism Research Australia has calculated the economic importance of tourism in Australia’s tourism regions by comparing the output of tourism with output of the whole regional economies for these regions (Tourism Research Australia 2011(a)). In TNQ, tourism accounted for 9.7% of the region’s output and the region was ranked in the top ten regions on that indicator. This compares with a benchmark of 3% for Australian tourism regions overall.
Industries of Significance for This Study The New Horizons and Opportunities Report (Cape York Sustainable Futures, 2010) has identified agriculture (particularly livestock and farming) and mining as primary industries on which the economic base of the region already depends. Further information is provided on these industries below. There are a number of other primary industry activities identified in New Horizons and Opportunities where opportunities exist but the current economic contribution is relatively low, so these are not reported on further in this study. These include fishing, aquaculture and forestry.
Tourism has been selected as an industry for more detailed reporting below, as it is an industry that may expand under world heritage listing and will be included in the Scenarios to be undertaken for the study.
Similarly, conservation management is an activity that may expand under world heritage listing and will be included in the Scenarios to be undertaken for the study.
8 Summarised from unpublished TERM data.

24 June 2012 22 Version 3.0
The Potential Economic Benefits of Protecting and Presenting Cape York
Agricultural Production The available data on agricultural production in the Cape York Peninsula Area are limited to those made available on a LGA scale, the latest being for 2005-06, see Table 6. The gross value of agricultural production in the Cape York Peninsula Area in 2005-06 was $42.4 million, made up of $14.3 million from crops and $28.1 million from livestock slaughtering. At the time, there was no contribution from livestock products or exports (Australian Bureau of Statistics 2008).
Table 6: Value of Agricultural Production (a) (b) by LGA, Cape York Peninsula Area 2005-069
Local Government Area Crops
$m
Livestock slaughtering
$m
Total
$mAurukun 0 0 0Cook 14.2 27.4 41.7Hope Vale 0 0 0Kowanyama 0 0.7 0.7Lockhart River 0 0 0Mapoon 0 0 0Napranum 0 0 0Northern Peninsula Area 0 0 0Pormpuraaw 0 0 0Weipa 0 0 0Wujal Wujal 0 0 0Cape York 14.3 28.1 42.4Region as % of Queensland 0.3 0.7
(a) Gross value of agricultural commodities produced, (b) based on Agricultural Survey estimates
Cropping is mainly concentrated in the Lakeland Downs area in the Cook Shire and around Cooktown. Crops include bananas, sorghum, corn, legumes and tropical fruits (CYSF 2010).
The pastoral industry is the most significant agriculture in terms of production value and land area involved. Most information on the pastoral industry in Cape York is somewhat dated with most research effort appearing to be around the mid 1990’s, however, characteristics of the industry remain similar to that period. In 1995, it was estimated that the industry generated 90 cents per hectare on average (Cotter 1995, cited in Savanna Explorer.10) Stocking rates were as low as one head per 60 hectares. Profits margins were reported to be slim and operating costs relatively high (Savanna Explorer). Infrastructure was reported to be minimal (CYPLUS 1995, cited in Savanna Explorer).
CYSF (2010) notes that the cattle industry is the largest land user in the area with 30% to 40% of the bioregion under grazing, on 50 properties. The Cape York area currently has ‘mainly breeding properties turning off store cattle for southern markets, live cattle export and coastal fatteners’ (Department of Employment, Economic Development and Innovation, 2010, page 8). All saleyards and processing facilities lie outside the Cape York Peninsula Area. Some live export occurred from Weipa in 2009 (CYSF 2010).
9 Australian Bureau of Statistics, 2008,, Agricultural Commodities, Australia, 2005-06, cat. no. 7125.0 10 Savanna Explorer, Tropical Savannas Cooperative Research Centre, viewed 24-6-2011, http://www.savanna.org.au/qld/cy/cygrazing.html
24 June 2012 23 Version 3.0
The Potential Economic Benefits of Protecting and Presenting Cape York
A recent report on the economics of fire management in Cape York (Gobius et al. 2008) includes more recent information on returns for a sample of properties. Based on a sample of 8 properties, the average income (total value of sales) of the properties is $167,000 in 2008 ($181,600 in 2011 dollars). If this income is extrapolated to 44 properties covering 4.9 million ha, the total income is $7,376,000 per annum ($7,990,000 in 2011 dollars). However, it should be noted that the sample of only 8 properties shows considerable variation of income per property. On a per ha grazed basis, the average income for the sample is $3.26per hectare ($3.53 in 2011 dollars) used for grazing, however not all of the total area of the properties is used for grazing and there is also considerable variation in the per ha income across the sample. On a per hectare basis for 4.9 million ha, this is $1.60 income per ha in 2011 dollars.
Mining Mining in the Cape York Peninsula Area is currently focussed on three projects. Bauxite is mined at Weipa by Rio Tinto Alcan. There were 826 people employed by Rio Tinto Alcan at Weipa in 2009 and the contributions paid to employees in wages, salaries and benefits were $107 million (Rio Tinto Alcan 2010). In 2009, the company shipped 16.8 million dry product tonnes of ore from Weipa (Rio Tinto Alcan 2010). While the price received by Rio Tinto Alcan is not published, an estimate of the gross value of production can be made using average bauxite prices for the period.
Cape Flattery Silica Mines operates as the largest global exporter of silica sand. The mine employs over 100 people (Queensland Resources Council 2011). The Skardon River Kaolin mine has recently been acquired by Gulf Mines11.
The New Horizons and Opportunities report (Cape York Sustainable Futures, 2010) also notes a number of opportunities:
Waratah Coal Inc was granted two exploration permits in the Laura basin in 2007 (page 10). Active prospects are held for gold, kaolin, cassiterite and tungsten in the region (page 10). In 2006 the Queensland Government awarded preferred developer status to the Aluminium
Corporation of China (CHALCO), who are considering the development of a world class integrated mine and beneficiation plant at the Aurukun deposit (page 32).
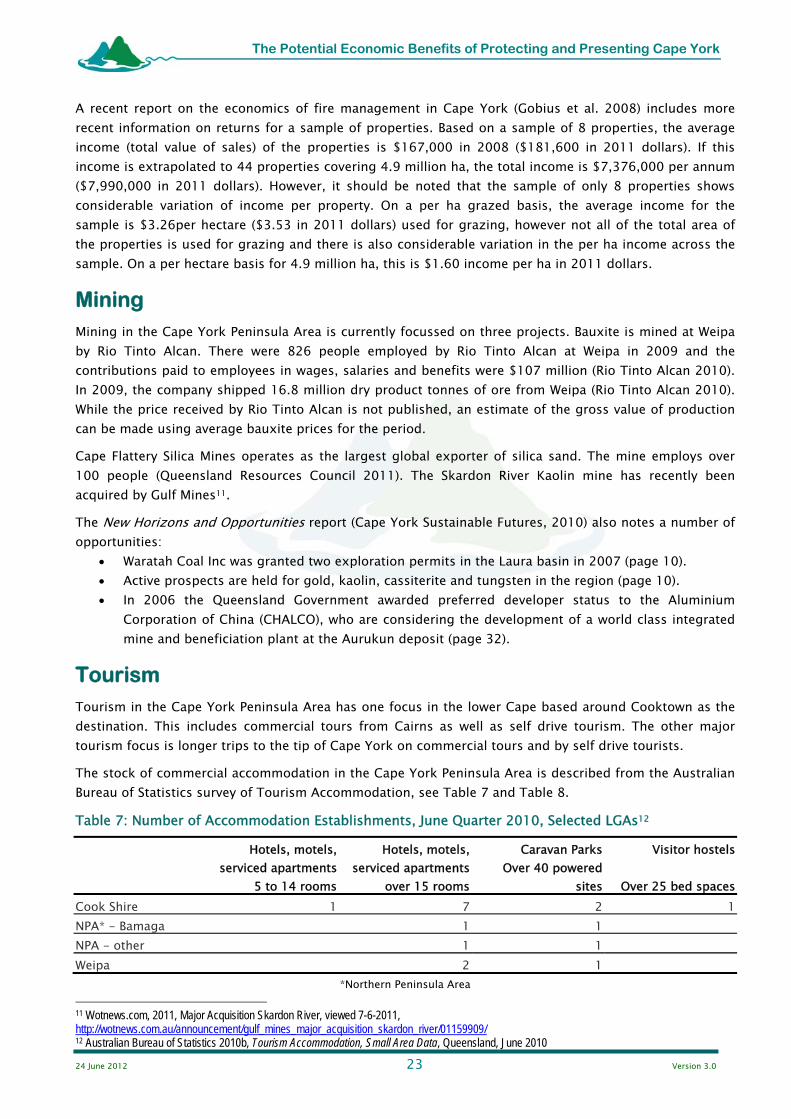
Tourism Tourism in the Cape York Peninsula Area has one focus in the lower Cape based around Cooktown as the destination. This includes commercial tours from Cairns as well as self drive tourism. The other major tourism focus is longer trips to the tip of Cape York on commercial tours and by self drive tourists.
The stock of commercial accommodation in the Cape York Peninsula Area is described from the Australian Bureau of Statistics survey of Tourism Accommodation, see Table 7 and Table 8.
Table 7: Number of Accommodation Establishments, June Quarter 2010, Selected LGAs12
Hotels, motels,
serviced apartments 5 to 14 rooms
Hotels, motels, serviced apartments
over 15 rooms
Caravan Parks Over 40 powered
sites
Visitor hostels
Over 25 bed spacesCook Shire 1 7 2 1NPA* - Bamaga 1 1 NPA - other 1 1 Weipa 2 1
*Northern Peninsula Area 11 Wotnews.com, 2011, Major Acquisition Skardon River, viewed 7-6-2011, http://wotnews.com.au/announcement/gulf_mines_major_acquisition_skardon_river/01159909/ 12 Australian Bureau of Statistics 2010b, Tourism Accommodation, Small Area Data, Queensland, June 2010

24 June 2012 24 Version 3.0
The Potential Economic Benefits of Protecting and Presenting Cape York
Table 8: Cook Shire, Hotels, Motels, Serviced Apartments with Over 15 Rooms, Quarters 2009-201013
Establish-ments
Rooms Employ-
ment
Occ.rate
%Guests Average
nights stayVisitor nights
Takings
Sept 2009 7 188 147 75.5 12,505 1.9 23,759 $4,044,706Dec 2009 7 192 138 50.3 7,103 2.0 14,206 $3,328,271
March 2010 7 191 142 34.6 4,437 2.2 9,761 $2,222,980
June 2010 7 192 153 55% 8,018 2.0 16,020 $2,930,396Annual
Total 32,055 63,474 $12,526,299
Estimate of Baseline Tourism Visitor Numbers There is considerable uncertainty around estimates of tourist numbers, visitor nights and expenditure due to small sample sizes for the Cape York Peninsula Area in the major tourism surveys, the National Visitor Survey and International Visitor Survey. The aim of this section is to derive an estimate of tourism to Cape York excluding Cooktown.
The most recent published information on tourism in the area is for the Cook Shire (including Cooktown) in 2007, see Table 9. This data indicates that there were 87,000 visitors and 276,000 visitor nights when domestic and international tourism is added together.
Table 9: Tourism to Cook Shire 2007, Based on Three to Four Year Average14
International Domestic overnight Total*Visitors (‘000) 9, 000 78,000 87,000Visitor nights (‘000) 47,000 229,000 276,000Spend ($ millions) $2m $26m $28mAverage stay (nights) 5.0 2.9Average spend per trip ($) 162 335Average spend per night ($) 32 115
*Calculated from TRA published data
For the purposes of this study, small area data was viewed on Tourism Research Australia’s online database for the LGAs that make up the Cape York Peninsula Area. This data should be treated with caution due to small sample sizes15. The estimates for the visitors to Cook Shire are very similar to the 2007 published estimates. Data on visitors to the rest of the Cape York viewed support an estimate of around 20,000 visitors per annum.
The average stay for all international and domestic visitors viewed on the TRA data base is similar to averages for the Tropical North Queensland Region (international, 9 nights; domestic, 6 nights) (Tourism Research Australia 2010). Efforts have been made to disaggregate Cook Shire tourism into that which occurs in Cooktown and in other parts of the Shire. One basis for this is to assume that all the tourism in commercial accommodation in enterprises larger than 15 rooms does in fact occur in Cooktown16. On that basis, at least 32,000 visitors, 63,000 visitor nights and takings of $12,500,000 can be attributed to Cooktown (see Table of Tourism Accommodation, above). It is assumed however, that a larger proportion of visitors to Cook Shire are in fact visitors to Cooktown only.
13 Australian Bureau of Statistics 2010b, Tourism Accommodation, Small Area Data, Queensland, June 2010 14 Tourism Research Australia 2008, Tourism Profiles for Local Government Areas in Regional Australia, Queensland: COOK SHIRE 15 Tourism Research Australia 2011b. These data are not available for commercial use; however estimates based on published data have been checked based on viewing these data. 16 This can be supported based on a search of accommodation listings and local knowledge.
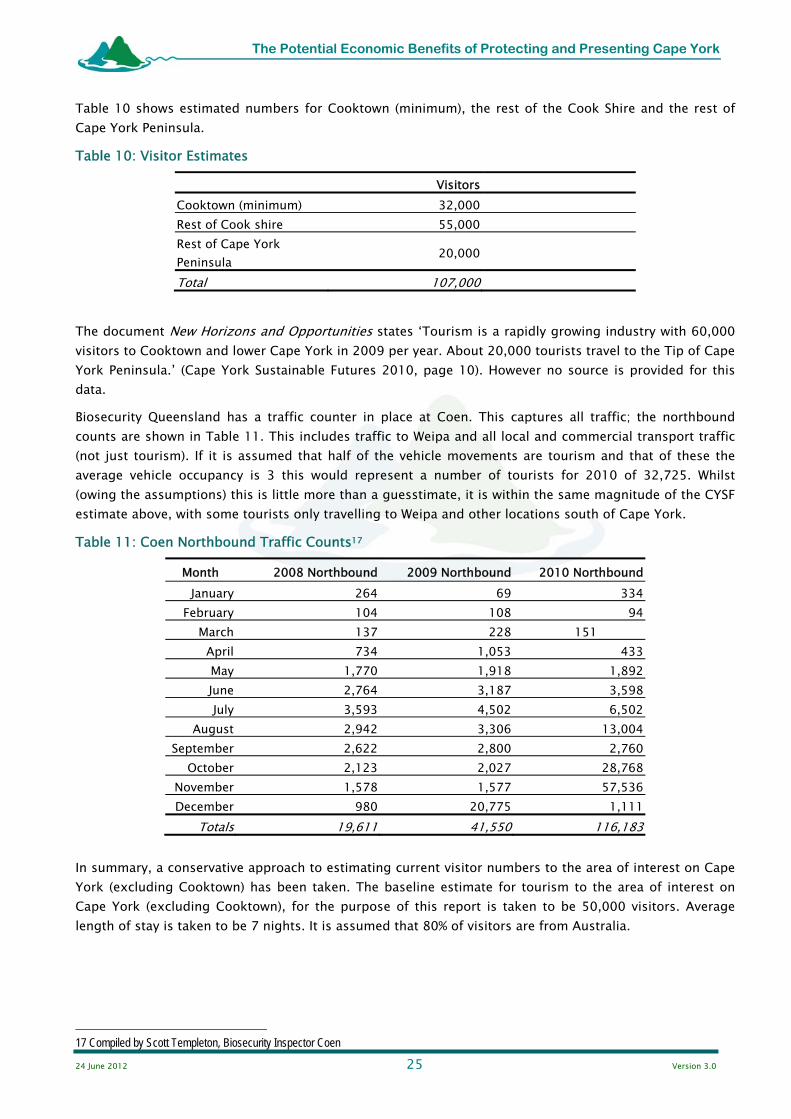
24 June 2012 25 Version 3.0
The Potential Economic Benefits of Protecting and Presenting Cape York
Table 10 shows estimated numbers for Cooktown (minimum), the rest of the Cook Shire and the rest of Cape York Peninsula.
Table 10: Visitor Estimates
Visitors
Cooktown (minimum) 32,000
Rest of Cook shire 55,000
Rest of Cape York Peninsula 20,000
Total 107,000
The document New Horizons and Opportunities states ‘Tourism is a rapidly growing industry with 60,000 visitors to Cooktown and lower Cape York in 2009 per year. About 20,000 tourists travel to the Tip of Cape York Peninsula.’ (Cape York Sustainable Futures 2010, page 10). However no source is provided for this data.
Biosecurity Queensland has a traffic counter in place at Coen. This captures all traffic; the northbound counts are shown in Table 11. This includes traffic to Weipa and all local and commercial transport traffic (not just tourism). If it is assumed that half of the vehicle movements are tourism and that of these the average vehicle occupancy is 3 this would represent a number of tourists for 2010 of 32,725. Whilst (owing the assumptions) this is little more than a guesstimate, it is within the same magnitude of the CYSF estimate above, with some tourists only travelling to Weipa and other locations south of Cape York.
Table 11: Coen Northbound Traffic Counts17 Month 2008 Northbound 2009 Northbound 2010 Northbound
January 264 69 334
February 104 108 94
March 137 228 151
April 734 1,053 433 May 1,770 1,918 1,892 June 2,764 3,187 3,598 July 3,593 4,502 6,502
August 2,942 3,306 13,004 September 2,622 2,800 2,760
October 2,123 2,027 28,768 November 1,578 1,577 57,536 December 980 20,775 1,111
Totals 19,611 41,550 116,183 In summary, a conservative approach to estimating current visitor numbers to the area of interest on Cape York (excluding Cooktown) has been taken. The baseline estimate for tourism to the area of interest on Cape York (excluding Cooktown), for the purpose of this report is taken to be 50,000 visitors. Average length of stay is taken to be 7 nights. It is assumed that 80% of visitors are from Australia.
17 Compiled by Scott Templeton, Biosecurity Inspector Coen
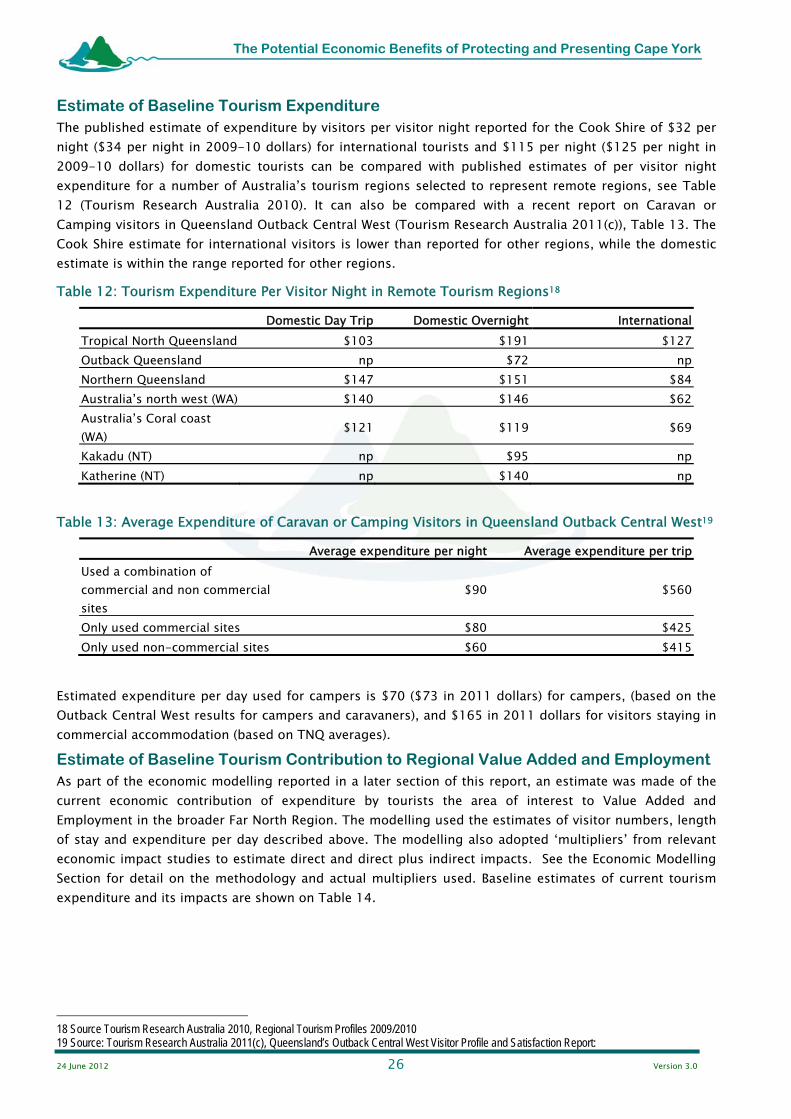
24 June 2012 26 Version 3.0
The Potential Economic Benefits of Protecting and Presenting Cape York
Estimate of Baseline Tourism Expenditure The published estimate of expenditure by visitors per visitor night reported for the Cook Shire of $32 per night ($34 per night in 2009-10 dollars) for international tourists and $115 per night ($125 per night in 2009-10 dollars) for domestic tourists can be compared with published estimates of per visitor night expenditure for a number of Australia’s tourism regions selected to represent remote regions, see Table 12 (Tourism Research Australia 2010). It can also be compared with a recent report on Caravan or Camping visitors in Queensland Outback Central West (Tourism Research Australia 2011(c)), Table 13. The Cook Shire estimate for international visitors is lower than reported for other regions, while the domestic estimate is within the range reported for other regions.
Table 12: Tourism Expenditure Per Visitor Night in Remote Tourism Regions18
Domestic Day Trip Domestic Overnight InternationalTropical North Queensland $103 $191 $127Outback Queensland np $72 npNorthern Queensland $147 $151 $84Australia’s north west (WA) $140 $146 $62Australia’s Coral coast (WA) $121 $119 $69
Kakadu (NT) np $95 npKatherine (NT) np $140 np
Table 13: Average Expenditure of Caravan or Camping Visitors in Queensland Outback Central West19
Average expenditure per night Average expenditure per tripUsed a combination of commercial and non commercial sites
$90 $560
Only used commercial sites $80 $425Only used non-commercial sites $60 $415
Estimated expenditure per day used for campers is $70 ($73 in 2011 dollars) for campers, (based on the Outback Central West results for campers and caravaners), and $165 in 2011 dollars for visitors staying in commercial accommodation (based on TNQ averages).
Estimate of Baseline Tourism Contribution to Regional Value Added and Employment As part of the economic modelling reported in a later section of this report, an estimate was made of the current economic contribution of expenditure by tourists the area of interest to Value Added and Employment in the broader Far North Region. The modelling used the estimates of visitor numbers, length of stay and expenditure per day described above. The modelling also adopted ‘multipliers’ from relevant economic impact studies to estimate direct and direct plus indirect impacts. See the Economic Modelling Section for detail on the methodology and actual multipliers used. Baseline estimates of current tourism expenditure and its impacts are shown on Table 14.
18 Source Tourism Research Australia 2010, Regional Tourism Profiles 2009/2010 19 Source: Tourism Research Australia 2011(c), Queensland’s Outback Central West Visitor Profile and Satisfaction Report:

24 June 2012 27 Version 3.0
The Potential Economic Benefits of Protecting and Presenting Cape York
Table 14: Estimates of Current Tourism Contribution to Regional Value Added and Employment20
Current 2011
Tourism expenditure $29 million
Direct Value Added $9 million
Direct plus Indirect Value Added $15 million
Direct Employment 156 jobs
Direct plus Indirect Employment 197 jobs
20 Source: this report, see Appendix One
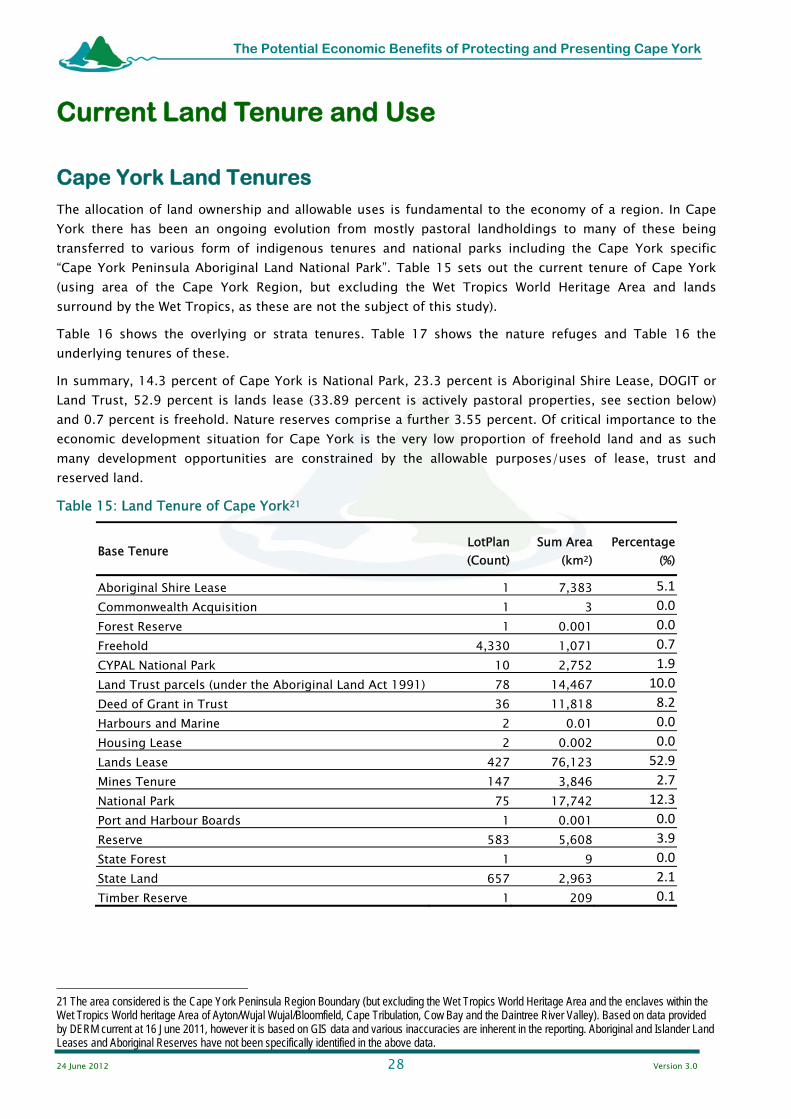
24 June 2012 28 Version 3.0
The Potential Economic Benefits of Protecting and Presenting Cape York
Current Land Tenure and Use
Cape York Land Tenures The allocation of land ownership and allowable uses is fundamental to the economy of a region. In Cape York there has been an ongoing evolution from mostly pastoral landholdings to many of these being transferred to various form of indigenous tenures and national parks including the Cape York specific “Cape York Peninsula Aboriginal Land National Park”. Table 15 sets out the current tenure of Cape York (using area of the Cape York Region, but excluding the Wet Tropics World Heritage Area and lands surround by the Wet Tropics, as these are not the subject of this study).
Table 16 shows the overlying or strata tenures. Table 17 shows the nature refuges and Table 16 the underlying tenures of these.
In summary, 14.3 percent of Cape York is National Park, 23.3 percent is Aboriginal Shire Lease, DOGIT or Land Trust, 52.9 percent is lands lease (33.89 percent is actively pastoral properties, see section below) and 0.7 percent is freehold. Nature reserves comprise a further 3.55 percent. Of critical importance to the economic development situation for Cape York is the very low proportion of freehold land and as such many development opportunities are constrained by the allowable purposes/uses of lease, trust and reserved land.
Table 15: Land Tenure of Cape York21
Base Tenure LotPlan (Count)
Sum Area (km2)
Percentage(%)
Aboriginal Shire Lease 1 7,383 5.1
Commonwealth Acquisition 1 3 0.0
Forest Reserve 1 0.001 0.0
Freehold 4,330 1,071 0.7
CYPAL National Park 10 2,752 1.9
Land Trust parcels (under the Aboriginal Land Act 1991) 78 14,467 10.0
Deed of Grant in Trust 36 11,818 8.2
Harbours and Marine 2 0.01 0.0
Housing Lease 2 0.002 0.0
Lands Lease 427 76,123 52.9
Mines Tenure 147 3,846 2.7
National Park 75 17,742 12.3
Port and Harbour Boards 1 0.001 0.0
Reserve 583 5,608 3.9
State Forest 1 9 0.0
State Land 657 2,963 2.1
Timber Reserve 1 209 0.1
21 The area considered is the Cape York Peninsula Region Boundary (but excluding the Wet Tropics World Heritage Area and the enclaves within the Wet Tropics World heritage Area of Ayton/Wujal Wujal/Bloomfield, Cape Tribulation, Cow Bay and the Daintree River Valley). Based on data provided by DERM current at 16 June 2011, however it is based on GIS data and various inaccuracies are inherent in the reporting. Aboriginal and Islander Land Leases and Aboriginal Reserves have not been specifically identified in the above data.
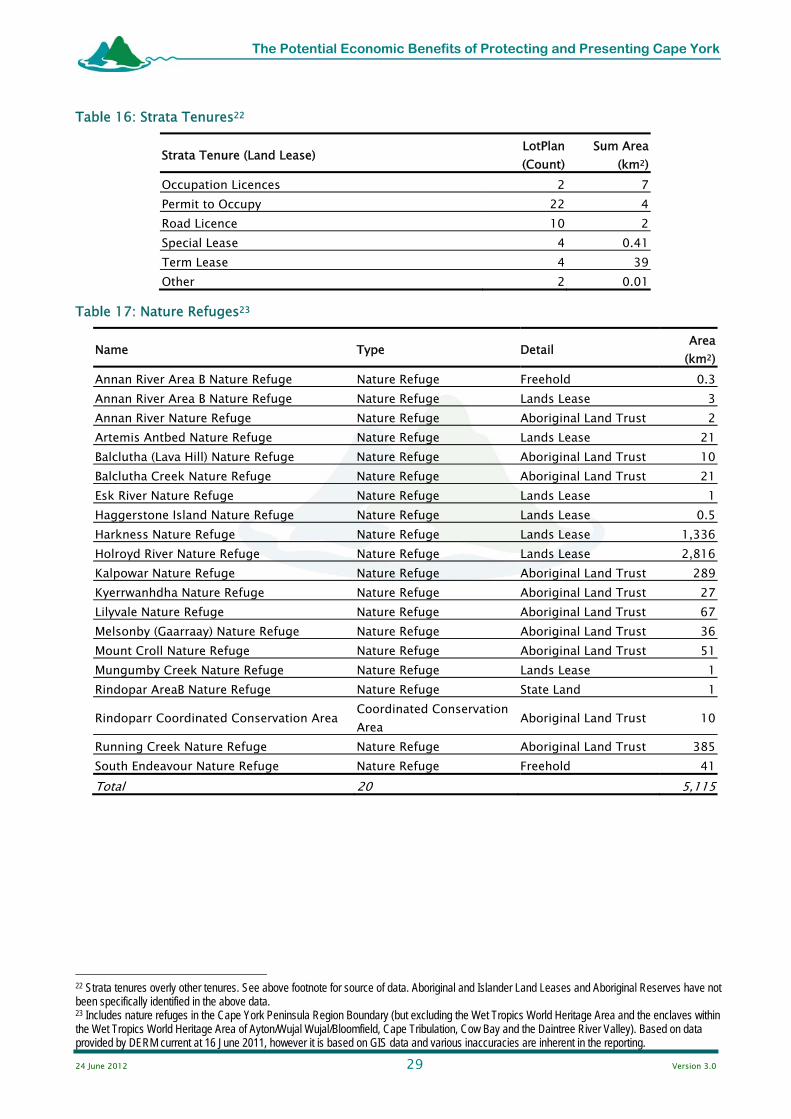
24 June 2012 29 Version 3.0
The Potential Economic Benefits of Protecting and Presenting Cape York
Table 16: Strata Tenures22
Strata Tenure (Land Lease) LotPlan (Count)
Sum Area (km2)
Occupation Licences 2 7 Permit to Occupy 22 4 Road Licence 10 2 Special Lease 4 0.41 Term Lease 4 39 Other 2 0.01
Table 17: Nature Refuges23
Name Type Detail Area (km2)
Annan River Area B Nature Refuge Nature Refuge Freehold 0.3Annan River Area B Nature Refuge Nature Refuge Lands Lease 3Annan River Nature Refuge Nature Refuge Aboriginal Land Trust 2Artemis Antbed Nature Refuge Nature Refuge Lands Lease 21Balclutha (Lava Hill) Nature Refuge Nature Refuge Aboriginal Land Trust 10Balclutha Creek Nature Refuge Nature Refuge Aboriginal Land Trust 21Esk River Nature Refuge Nature Refuge Lands Lease 1Haggerstone Island Nature Refuge Nature Refuge Lands Lease 0.5Harkness Nature Refuge Nature Refuge Lands Lease 1,336Holroyd River Nature Refuge Nature Refuge Lands Lease 2,816Kalpowar Nature Refuge Nature Refuge Aboriginal Land Trust 289Kyerrwanhdha Nature Refuge Nature Refuge Aboriginal Land Trust 27Lilyvale Nature Refuge Nature Refuge Aboriginal Land Trust 67Melsonby (Gaarraay) Nature Refuge Nature Refuge Aboriginal Land Trust 36Mount Croll Nature Refuge Nature Refuge Aboriginal Land Trust 51Mungumby Creek Nature Refuge Nature Refuge Lands Lease 1Rindopar AreaB Nature Refuge Nature Refuge State Land 1
Rindoparr Coordinated Conservation Area Coordinated Conservation Area Aboriginal Land Trust 10
Running Creek Nature Refuge Nature Refuge Aboriginal Land Trust 385South Endeavour Nature Refuge Nature Refuge Freehold 41Total 20 5,115
22 Strata tenures overly other tenures. See above footnote for source of data. Aboriginal and Islander Land Leases and Aboriginal Reserves have not been specifically identified in the above data. 23 Includes nature refuges in the Cape York Peninsula Region Boundary (but excluding the Wet Tropics World Heritage Area and the enclaves within the Wet Tropics World Heritage Area of Ayton/Wujal Wujal/Bloomfield, Cape Tribulation, Cow Bay and the Daintree River Valley). Based on data provided by DERM current at 16 June 2011, however it is based on GIS data and various inaccuracies are inherent in the reporting.
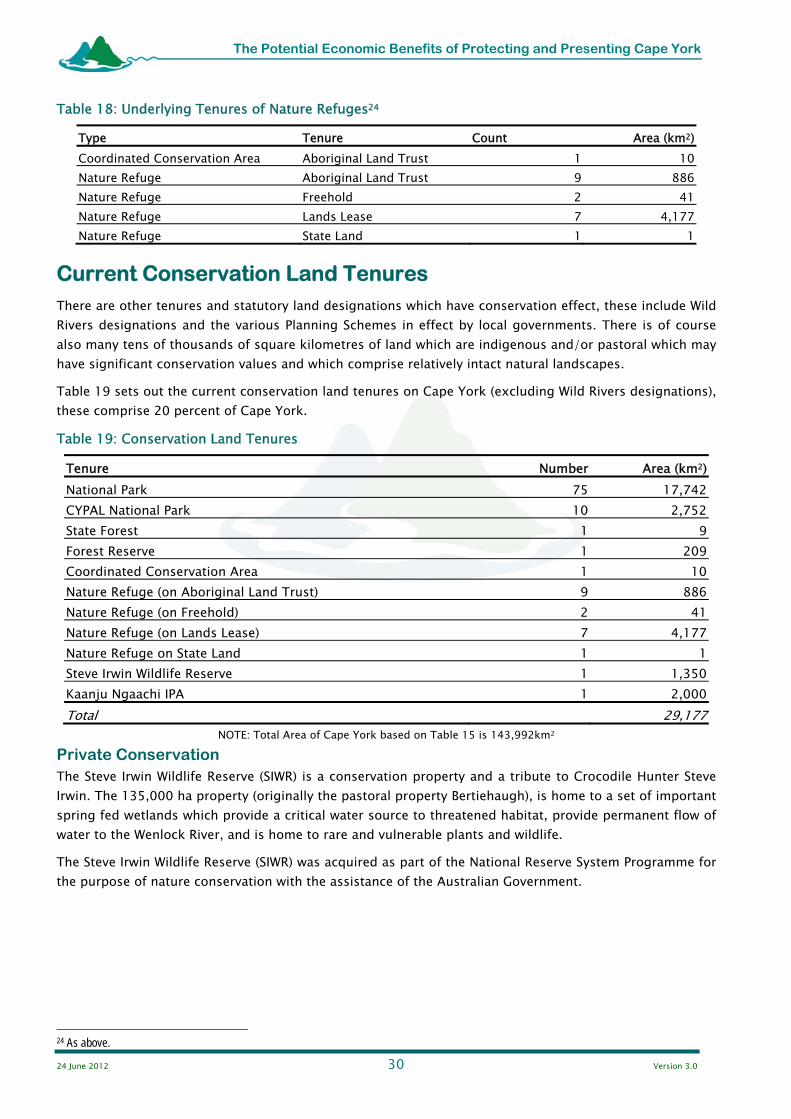
24 June 2012 30 Version 3.0
The Potential Economic Benefits of Protecting and Presenting Cape York
Table 18: Underlying Tenures of Nature Refuges24
Type Tenure Count Area (km2)Coordinated Conservation Area Aboriginal Land Trust 1 10Nature Refuge Aboriginal Land Trust 9 886Nature Refuge Freehold 2 41Nature Refuge Lands Lease 7 4,177Nature Refuge State Land 1 1
Current Conservation Land Tenures There are other tenures and statutory land designations which have conservation effect, these include Wild Rivers designations and the various Planning Schemes in effect by local governments. There is of course also many tens of thousands of square kilometres of land which are indigenous and/or pastoral which may have significant conservation values and which comprise relatively intact natural landscapes.
Table 19 sets out the current conservation land tenures on Cape York (excluding Wild Rivers designations), these comprise 20 percent of Cape York.
Table 19: Conservation Land Tenures
Tenure Number Area (km2)National Park 75 17,742CYPAL National Park 10 2,752State Forest 1 9Forest Reserve 1 209Coordinated Conservation Area 1 10Nature Refuge (on Aboriginal Land Trust) 9 886Nature Refuge (on Freehold) 2 41Nature Refuge (on Lands Lease) 7 4,177Nature Refuge on State Land 1 1Steve Irwin Wildlife Reserve 1 1,350Kaanju Ngaachi IPA 1 2,000Total 29,177
NOTE: Total Area of Cape York based on Table 15 is 143,992km2
Private Conservation The Steve Irwin Wildlife Reserve (SIWR) is a conservation property and a tribute to Crocodile Hunter Steve Irwin. The 135,000 ha property (originally the pastoral property Bertiehaugh), is home to a set of important spring fed wetlands which provide a critical water source to threatened habitat, provide permanent flow of water to the Wenlock River, and is home to rare and vulnerable plants and wildlife.
The Steve Irwin Wildlife Reserve (SIWR) was acquired as part of the National Reserve System Programme for the purpose of nature conservation with the assistance of the Australian Government.
24 As above.
24 June 2012 31 Version 3.0
The Potential Economic Benefits of Protecting and Presenting Cape York
Kaanju Ngaachi Wenlock and Pascoe Rivers Indigenous Protected Area The Kaanju Ngaachi Wenlock and Pascoe Rivers Indigenous Protected Area (IPA) is Australia's 25th Indigenous Protected Area. It stretches across nearly 2,000 square kilometres of wet tropical forest and sand ridge country between Lockhart River, Coen and Weipa on Cape York. Like all of Australia's Indigenous Protected Areas, it protects some of the nation's rare and fragile environments for the benefit of all Australians.
The Indigenous Protected Area is managed by the Chuulangun Aboriginal Corporation and is a place of significant social, cultural, spiritual, historical and economic value for its traditional owners.
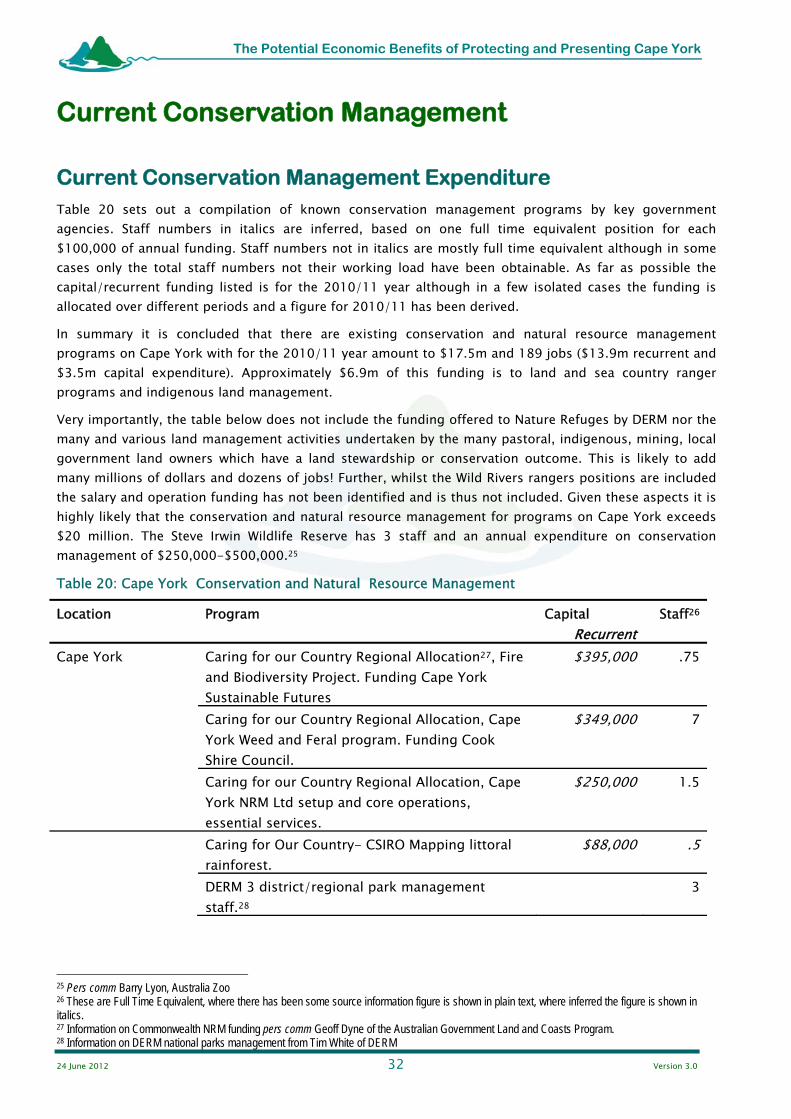
24 June 2012 32 Version 3.0
The Potential Economic Benefits of Protecting and Presenting Cape York
Current Conservation Management
Current Conservation Management Expenditure Table 20 sets out a compilation of known conservation management programs by key government agencies. Staff numbers in italics are inferred, based on one full time equivalent position for each $100,000 of annual funding. Staff numbers not in italics are mostly full time equivalent although in some cases only the total staff numbers not their working load have been obtainable. As far as possible the capital/recurrent funding listed is for the 2010/11 year although in a few isolated cases the funding is allocated over different periods and a figure for 2010/11 has been derived.
In summary it is concluded that there are existing conservation and natural resource management programs on Cape York with for the 2010/11 year amount to $17.5m and 189 jobs ($13.9m recurrent and $3.5m capital expenditure). Approximately $6.9m of this funding is to land and sea country ranger programs and indigenous land management.
Very importantly, the table below does not include the funding offered to Nature Refuges by DERM nor the many and various land management activities undertaken by the many pastoral, indigenous, mining, local government land owners which have a land stewardship or conservation outcome. This is likely to add many millions of dollars and dozens of jobs! Further, whilst the Wild Rivers rangers positions are included the salary and operation funding has not been identified and is thus not included. Given these aspects it is highly likely that the conservation and natural resource management for programs on Cape York exceeds $20 million. The Steve Irwin Wildlife Reserve has 3 staff and an annual expenditure on conservation management of $250,000-$500,000.25
Table 20: Cape York Conservation and Natural Resource Management
Location Program Capital Recurrent
Staff26
Cape York Caring for our Country Regional Allocation27, Fire and Biodiversity Project. Funding Cape York Sustainable Futures
$395,000 .75
Caring for our Country Regional Allocation, Cape York Weed and Feral program. Funding Cook Shire Council.
$349,000 7
Caring for our Country Regional Allocation, Cape York NRM Ltd setup and core operations, essential services.
$250,000 1.5
Caring for Our Country- CSIRO Mapping littoral rainforest.
$88,000 .5
DERM 3 district/regional park management staff.28
3
25 Pers comm Barry Lyon, Australia Zoo 26 These are Full Time Equivalent, where there has been some source information figure is shown in plain text, where inferred the figure is shown in italics. 27 Information on Commonwealth NRM funding pers comm Geoff Dyne of the Australian Government Land and Coasts Program. 28 Information on DERM national parks management from Tim White of DERM
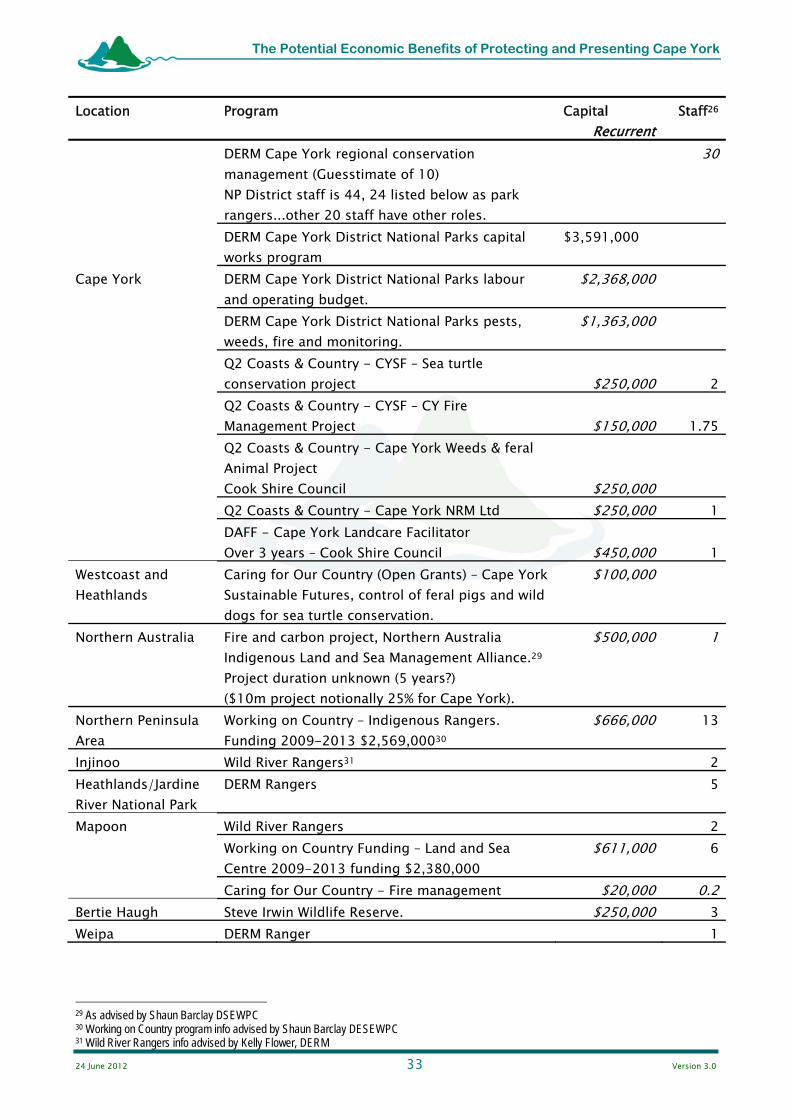
24 June 2012 33 Version 3.0
The Potential Economic Benefits of Protecting and Presenting Cape York
Location Program Capital Recurrent
Staff26
DERM Cape York regional conservation management (Guesstimate of 10) NP District staff is 44, 24 listed below as park rangers...other 20 staff have other roles.
30
DERM Cape York District National Parks capital works program
$3,591,000
Cape York DERM Cape York District National Parks labour and operating budget.
$2,368,000
DERM Cape York District National Parks pests, weeds, fire and monitoring.
$1,363,000
Q2 Coasts & Country - CYSF – Sea turtle conservation project $250,000 2
Q2 Coasts & Country - CYSF – CY Fire Management Project $150,000 1.75
Q2 Coasts & Country - Cape York Weeds & feral Animal Project Cook Shire Council $250,000
Q2 Coasts & Country - Cape York NRM Ltd $250,000 1 DAFF - Cape York Landcare Facilitator
Over 3 years – Cook Shire Council $450,000 1Westcoast and Heathlands
Caring for Our Country (Open Grants) – Cape York Sustainable Futures, control of feral pigs and wild dogs for sea turtle conservation.
$100,000
Northern Australia Fire and carbon project, Northern Australia Indigenous Land and Sea Management Alliance.29 Project duration unknown (5 years?) ($10m project notionally 25% for Cape York).
$500,000 1
Northern Peninsula Area
Working on Country – Indigenous Rangers. Funding 2009-2013 $2,569,00030
$666,000 13
Injinoo Wild River Rangers31 2Heathlands/Jardine River National Park
DERM Rangers 5
Mapoon Wild River Rangers 2 Working on Country Funding – Land and Sea
Centre 2009-2013 funding $2,380,000 $611,000 6
Caring for Our Country - Fire management $20,000 0.2Bertie Haugh Steve Irwin Wildlife Reserve. $250,000 3Weipa DERM Ranger 1
29 As advised by Shaun Barclay DSEWPC 30 Working on Country program info advised by Shaun Barclay DESEWPC 31 Wild River Rangers info advised by Kelly Flower, DERM
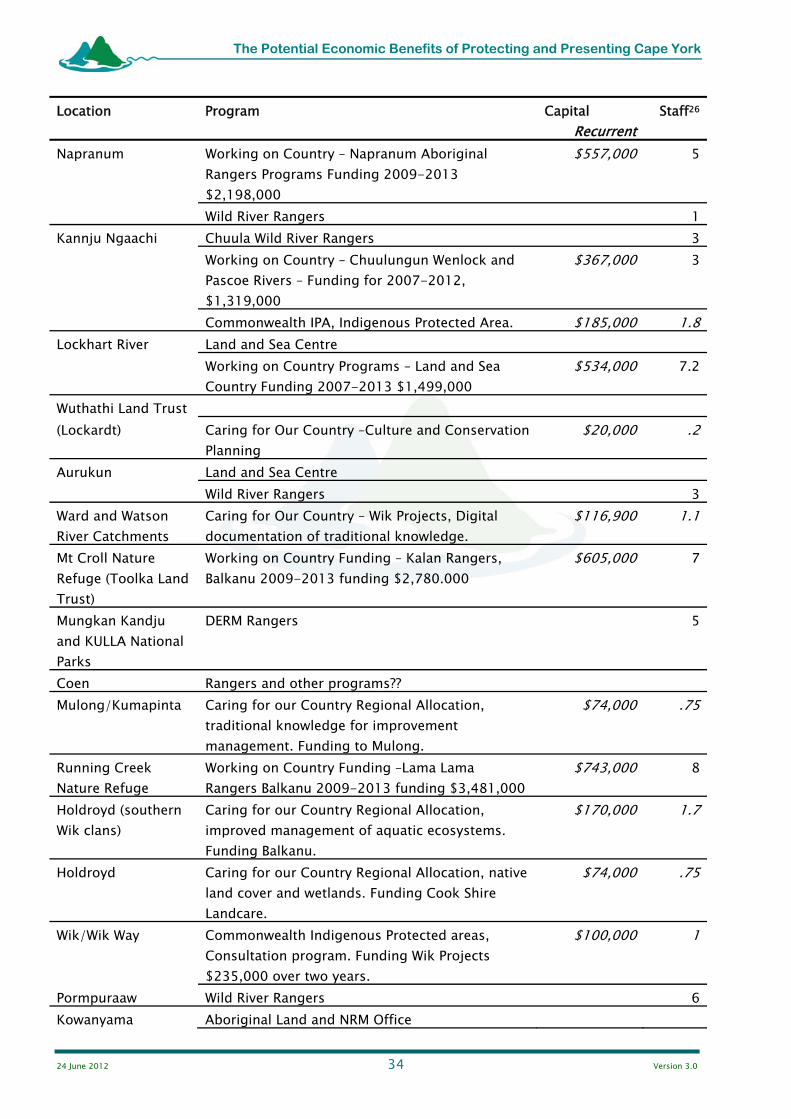
24 June 2012 34 Version 3.0
The Potential Economic Benefits of Protecting and Presenting Cape York
Location Program Capital Recurrent
Staff26
Napranum Working on Country – Napranum Aboriginal Rangers Programs Funding 2009-2013 $2,198,000
$557,000 5
Wild River Rangers 1Kannju Ngaachi Chuula Wild River Rangers 3 Working on Country – Chuulungun Wenlock and
Pascoe Rivers – Funding for 2007-2012, $1,319,000
$367,000 3
Commonwealth IPA, Indigenous Protected Area. $185,000 1.8Lockhart River Land and Sea Centre Working on Country Programs – Land and Sea
Country Funding 2007-2013 $1,499,000 $534,000 7.2
Wuthathi Land Trust (Lockardt) Caring for Our Country –Culture and Conservation
Planning $20,000 .2
Aurukun Land and Sea Centre Wild River Rangers 3Ward and Watson River Catchments
Caring for Our Country – Wik Projects, Digital documentation of traditional knowledge.
$116,900 1.1
Mt Croll Nature Refuge (Toolka Land Trust)
Working on Country Funding – Kalan Rangers, Balkanu 2009-2013 funding $2,780.000
$605,000 7
Mungkan Kandju and KULLA National Parks
DERM Rangers 5
Coen Rangers and other programs?? Mulong/Kumapinta Caring for our Country Regional Allocation,
traditional knowledge for improvement management. Funding to Mulong.
$74,000 .75
Running Creek Nature Refuge
Working on Country Funding –Lama Lama Rangers Balkanu 2009-2013 funding $3,481,000
$743,000 8
Holdroyd (southern Wik clans)
Caring for our Country Regional Allocation, improved management of aquatic ecosystems. Funding Balkanu.
$170,000 1.7
Holdroyd Caring for our Country Regional Allocation, native land cover and wetlands. Funding Cook Shire Landcare.
$74,000 .75
Wik/Wik Way Commonwealth Indigenous Protected areas, Consultation program. Funding Wik Projects $235,000 over two years.
$100,000 1
Pormpuraaw Wild River Rangers 6Kowanyama Aboriginal Land and NRM Office

24 June 2012 35 Version 3.0
The Potential Economic Benefits of Protecting and Presenting Cape York
Location Program Capital Recurrent
Staff26
Wild River Rangers 1 Working on Country – Funding for 2007-2013
$2,688,000 $583,000 5
Lakefield National Park
DERM Rangers 8
Hopevale Wild River Rangers 4Laura Agnarra Rangers
12
Mitchell River Watershed Group
Mitchell River Traditional Custodian Advisory Group
South Cape York Catchments Group
Caring for Our Country – Open Grants, wildlife corridor rehabilitation and Salvinia eradication.
$218,000 2
Balnggarrawa Caring for Our Country - Fencing and Fire management to protect rock art.
$20,000 .2
Cooktown DERM Rangers 2Rossville Caring for Our Country - Feral Pig $20,000 .2Archer Point – Spring Creek
Yuku-Baja-Muliku Working on Country Programs – Land and Sea Country Funding 2007-2013 $2,060,000
$578,000 8
Caring for Our Country –Coastal Area Protection, fencing to exclude cattle from riparian area.
$20,000 .2
Nyungkal Working on Country Programs – Nyungkal Ranger Service, Balkanu funding 2009-2013 $3,365,000
$875,000 9
Total $13,919,90032 189
The Nature Refuge Program in the Cape York Peninsula Heritage Act Area (CYPHA) In addition to the above programs, DERM provides financial resources through Nature Refuge programs.
NatureAssist is a State funded financial assistance scheme developed to encourage Queensland landholders to participate in the Nature Refuge Program. NatureAssist - Round 1 commenced in 2006, subsequently followed by Round 2 in 2007 and Round 3 in 2009. Each round of NatureAssist differs according to the amount of funds available for distribution, eligible areas within the State, and policy objectives. Eligible landholders are invited to tender for funds to conduct conservation works which assist in managing and/or enhancing the protection of significant conservation values on their property. Successful tenders are those which represent the largest conservation gain for the financial investment.
Note: Tables 21 and 22 below provide an overview of Nature Refuges negotiated to date in the CYPHA area by staff in the Nature Refuges Program of DERM (excludes Nature Refuges negotiated as part of State tenure dealings); and associated NatureAssist investments.
Table 21: Cape York Nature Refuges33 32 Not including the DERM national park capital or the private enterprise expenditure on the Steve Irwin Wildlife Reserve.
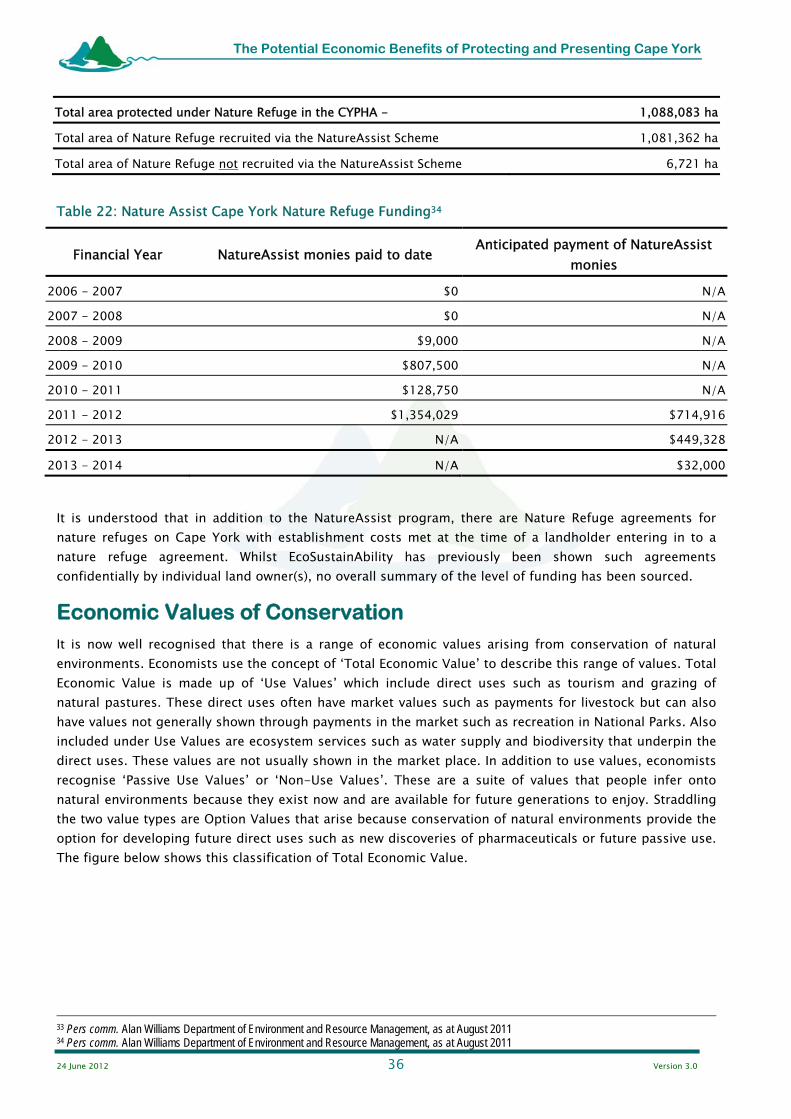
24 June 2012 36 Version 3.0
The Potential Economic Benefits of Protecting and Presenting Cape York
Total area protected under Nature Refuge in the CYPHA - 1,088,083 ha
Total area of Nature Refuge recruited via the NatureAssist Scheme 1,081,362 ha
Total area of Nature Refuge not recruited via the NatureAssist Scheme 6,721 ha
Table 22: Nature Assist Cape York Nature Refuge Funding34
Financial Year NatureAssist monies paid to date Anticipated payment of NatureAssist
monies
2006 - 2007 $0 N/A
2007 - 2008 $0 N/A
2008 - 2009 $9,000 N/A
2009 - 2010 $807,500 N/A
2010 - 2011 $128,750 N/A
2011 - 2012 $1,354,029 $714,916
2012 - 2013 N/A $449,328
2013 - 2014 N/A $32,000
It is understood that in addition to the NatureAssist program, there are Nature Refuge agreements for nature refuges on Cape York with establishment costs met at the time of a landholder entering in to a nature refuge agreement. Whilst EcoSustainAbility has previously been shown such agreements confidentially by individual land owner(s), no overall summary of the level of funding has been sourced.
Economic Values of Conservation It is now well recognised that there is a range of economic values arising from conservation of natural environments. Economists use the concept of ‘Total Economic Value’ to describe this range of values. Total Economic Value is made up of ‘Use Values’ which include direct uses such as tourism and grazing of natural pastures. These direct uses often have market values such as payments for livestock but can also have values not generally shown through payments in the market such as recreation in National Parks. Also included under Use Values are ecosystem services such as water supply and biodiversity that underpin the direct uses. These values are not usually shown in the market place. In addition to use values, economists recognise ‘Passive Use Values’ or ‘Non-Use Values’. These are a suite of values that people infer onto natural environments because they exist now and are available for future generations to enjoy. Straddling the two value types are Option Values that arise because conservation of natural environments provide the option for developing future direct uses such as new discoveries of pharmaceuticals or future passive use. The figure below shows this classification of Total Economic Value.
33 Pers comm. Alan Williams Department of Environment and Resource Management, as at August 2011 34 Pers comm. Alan Williams Department of Environment and Resource Management, as at August 2011
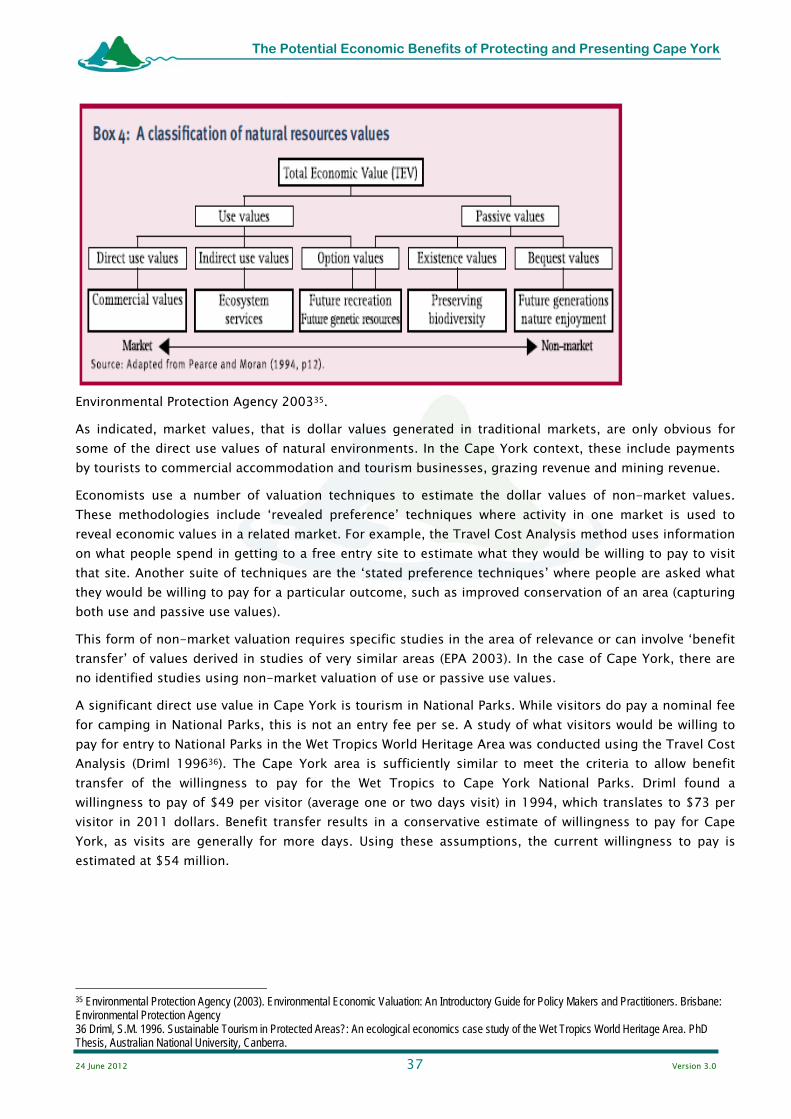
24 June 2012 37 Version 3.0
The Potential Economic Benefits of Protecting and Presenting Cape York
Environmental Protection Agency 200335.
As indicated, market values, that is dollar values generated in traditional markets, are only obvious for some of the direct use values of natural environments. In the Cape York context, these include payments by tourists to commercial accommodation and tourism businesses, grazing revenue and mining revenue.
Economists use a number of valuation techniques to estimate the dollar values of non-market values. These methodologies include ‘revealed preference’ techniques where activity in one market is used to reveal economic values in a related market. For example, the Travel Cost Analysis method uses information on what people spend in getting to a free entry site to estimate what they would be willing to pay to visit that site. Another suite of techniques are the ‘stated preference techniques’ where people are asked what they would be willing to pay for a particular outcome, such as improved conservation of an area (capturing both use and passive use values).
This form of non-market valuation requires specific studies in the area of relevance or can involve ‘benefit transfer’ of values derived in studies of very similar areas (EPA 2003). In the case of Cape York, there are no identified studies using non-market valuation of use or passive use values.
A significant direct use value in Cape York is tourism in National Parks. While visitors do pay a nominal fee for camping in National Parks, this is not an entry fee per se. A study of what visitors would be willing to pay for entry to National Parks in the Wet Tropics World Heritage Area was conducted using the Travel Cost Analysis (Driml 199636). The Cape York area is sufficiently similar to meet the criteria to allow benefit transfer of the willingness to pay for the Wet Tropics to Cape York National Parks. Driml found a willingness to pay of $49 per visitor (average one or two days visit) in 1994, which translates to $73 per visitor in 2011 dollars. Benefit transfer results in a conservative estimate of willingness to pay for Cape York, as visits are generally for more days. Using these assumptions, the current willingness to pay is estimated at $54 million.
35 Environmental Protection Agency (2003). Environmental Economic Valuation: An Introductory Guide for Policy Makers and Practitioners. Brisbane: Environmental Protection Agency 36 Driml, S.M. 1996. Sustainable Tourism in Protected Areas?: An ecological economics case study of the Wet Tropics World Heritage Area. PhD Thesis, Australian National University, Canberra.
24 June 2012 38 Version 3.0
The Potential Economic Benefits of Protecting and Presenting Cape York
Many people value the conservation of the environment of Cape York. This finds expression through the dedication of resources by governments on behalf of their citizens to the conservation effort. Applying non-market valuation techniques would estimate willingness to pay by relevant populations for conservation (and continuing passive use values, option values and direct use values compatible with conservation). Non-market valuation could play a role in fine tuning government decisions on investment in different levels of conservation.
This study does not include any estimates of the non-market values of conservation for several reasons. Firstly, no relevant studies have been carried out in the Cape York area. Secondly, in order to estimate the non-market value of conservation in such a study, it is first necessary to describe either the increased conservation outcome of extra conservation effort or the loss that would occur with less effort. This is beyond the scope of this study. Without such information, it is not acceptable to use benefit transfer of values from other studies. Thirdly, no directly relevant studies of similar environments or areas were identified where benefit transfer could be used.
Benchmarking Against World Heritage The following Table is based on Gillespie Economics and BDA Group (2008), see Table 23. It sets out the area (derived from DSEWPC website information) along with the management expenditure, staff and visitors. Comparisons of management effort for protected areas and world heritage have proven problematic and there is no agreed indice to provide a benchmark. Having said that, taking the reasonably comparable Australian world heritage sites, four indices enable very approximate comparison:
The direct management expenditure ($) per area of world heritage site (km2). This shows a wide range of $200,000/km2 for the very small Naracorte to $113/km2 for the extensive Shark Bay. Excluding the AFMS sites the mean is $2737/km2.
The management staff per area of world heritage site (km2). This shows a wide range of 4.7 employees/km2 for the very small Naracorte to 0.001employees/km2 for the extensive Shark Bay. Excluding the AFMS sites the mean is 0.01 employees/km2.
In order to take into account the need for greater area to require increased management and the need have greater management of high visitation two indices which factor in both area and visitors have been derived.
The direct management expenditure ($) per area of world heritage site (km2) per visitor. This shows a wide range of $6.82/km2/visitor for the very small Naracorte to $0.001/km2/visitor for the extensive and less visited Shark Bay. Excluding the AFMS sites the mean is $0.019/km2/visitor.
The management staff per area of world heritage site (km2) per visitor. This shows a wide range of with a relatively high indice for Naracorte and the lowest for Shark Bay. Excluding the AFMS sites the mean is 0.000000101 staff/km2/visitor.
Table 24 represents a relative and very approximate benchmarking of the current conservation management of Cape York against the above indices. For this an area of 50,000km2 has been approximated for the lands subject to the various conservation programs. The indices are quite sensitive to this figure and some effort has been taken to approximate the area... however it remains little more than an informed guesstimate.
When the current expenditure on Cape York is compared to the above benchmarks from similar Australian world heritage sites (see Table 23 and Table 24), the conservation management expenditure per area per visitor is slightly below ($0.019/km2/visitor for similar world heritage sites with Cape York $0.014/km2/visitor). Cape York has slightly higher staff indice with 0.000000187 staff/km2/visitor versus the mean for similar world heritage sites of 0.000000101 staff/km2/visitor.
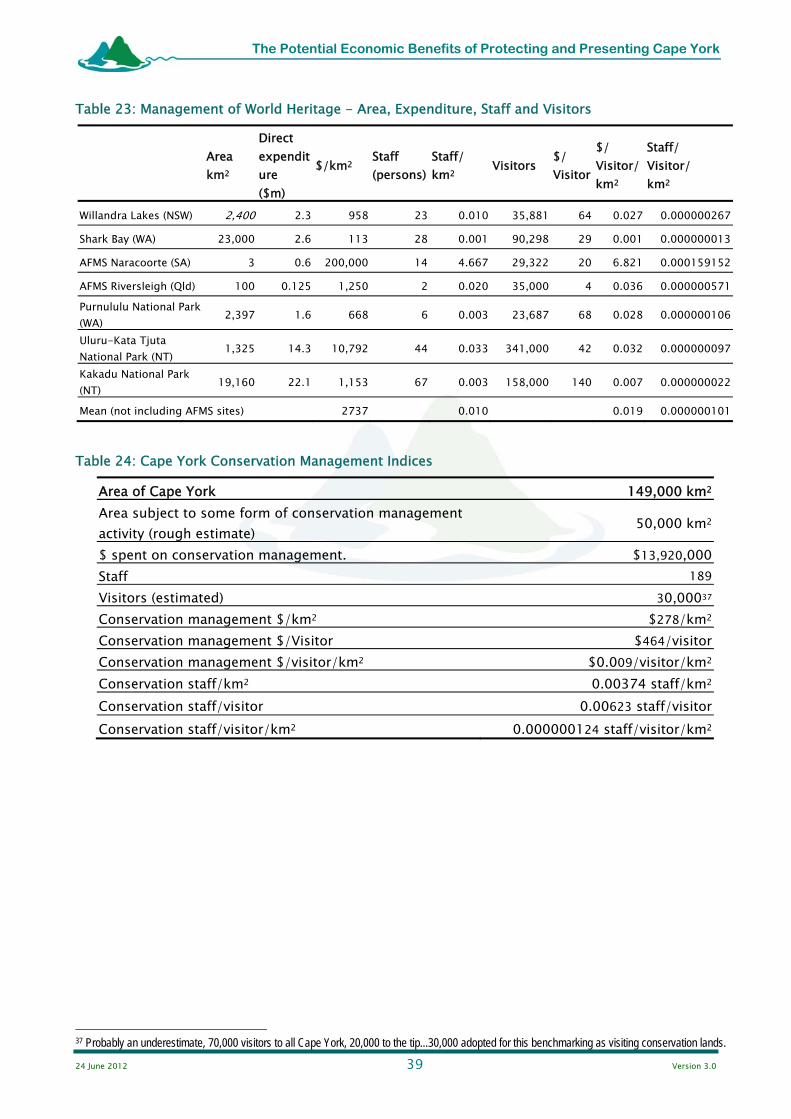
24 June 2012 39 Version 3.0
The Potential Economic Benefits of Protecting and Presenting Cape York
Table 23: Management of World Heritage - Area, Expenditure, Staff and Visitors
Area km2
Direct expenditure ($m)
$/km2 Staff (persons)
Staff/ km2 Visitors $/
Visitor
$/ Visitor/ km2
Staff/ Visitor/ km2
Willandra Lakes (NSW) 2,400 2.3 958 23 0.010 35,881 64 0.027 0.000000267
Shark Bay (WA) 23,000 2.6 113 28 0.001 90,298 29 0.001 0.000000013
AFMS Naracoorte (SA) 3 0.6 200,000 14 4.667 29,322 20 6.821 0.000159152
AFMS Riversleigh (Qld) 100 0.125 1,250 2 0.020 35,000 4 0.036 0.000000571Purnululu National Park (WA) 2,397 1.6 668 6 0.003 23,687 68 0.028 0.000000106
Uluru-Kata Tjuta National Park (NT) 1,325 14.3 10,792 44 0.033 341,000 42 0.032 0.000000097
Kakadu National Park (NT) 19,160 22.1 1,153 67 0.003 158,000 140 0.007 0.000000022
Mean (not including AFMS sites) 2737 0.010 0.019 0.000000101
Table 24: Cape York Conservation Management Indices
Area of Cape York 149,000 km2
Area subject to some form of conservation management activity (rough estimate) 50,000 km2
$ spent on conservation management. $13,920,000Staff 189Visitors (estimated) 30,00037
Conservation management $/km2 $278/km2
Conservation management $/Visitor $464/visitorConservation management $/visitor/km2 $0.009/visitor/km2
Conservation staff/km2 0.00374 staff/km2
Conservation staff/visitor 0.00623 staff/visitorConservation staff/visitor/km2 0.000000124 staff/visitor/km2
37 Probably an underestimate, 70,000 visitors to all Cape York, 20,000 to the tip...30,000 adopted for this benchmarking as visiting conservation lands.

24 June 2012 40 Version 3.0
The Potential Economic Benefits of Protecting and Presenting Cape York
Current Tourism
Cape York Tourism Tourism Positioning and Development There are examples worldwide where world heritage listing has been an important aspect of the branding and tourism positioning of a natural and cultural area. Fundamentally, from a potential tourist’s perspective if an international body has recognised the global significance of a place, it may be worth seeing! However, there often needs to be major efforts on the branding and then significant investment in the actual delivery of the tourism product (access, infrastructure, human resources etc.) for any realisation of a benefit to the local community and economy.
Cape York has a challenge with tourism, its value is the large scale landscapes and the highly scenic places/attractions (be they waterholes, beaches, headlands, rock art, mountains or rivers) are widely separated. The challenges for this have constrained growth of tourism, ventures even where there are close attractions and access such a Pajinka Lodge had difficulties.
Cape York Tourism Development Action Plan The Cape York Peninsula & Torres Strait Tourism Development Action Plan – 2008–2011 (Tourism Queensland 2008) states:
“Tourism development throughout Cape York and the Torres Strait will undoubtedly be a positive move towards meeting the increasingly diverse demands of both domestic and international visitors, but it is not exclusively for the benefit of visitors or the tourism industry alone. It is also about providing commercial and non-commercial opportunities that will promote community and personal development and self-fulfilment. This region represents a unique opportunity for tourism in Queensland, offering a range of nature-based and cultural tourism experiences while at the same time providing the opportunity for local communities to improve their self sufficiency through active involvement in the tourism industry. While tourism development in Cape York and the Torres Strait needs to reflect market demands and commercial realities, unlike a traditional industry driven approach, communities will play a pivotal role in shaping the nature and direction of tourism product development in the region.”
The Action Plan describes the target markets and product:
“Visitation to Cape York is dominated by mature Australians, German-speaking Europeans, British, North Americans and New Zealanders travelling as part of a group or in hire vehicles. Through improved infrastructure and destinational promotion the opportunity to open new markets and increase current smaller markets such as fly-in fishing, cruising and specific themed touring will increase. Improvements to road access will open the Cape to a wider touring market and present communities off the main track the opportunity to cater to the more adventurous 4WD traveller.”
“The main activities visitors are seeking while in Cape York are:
4WD Camping Exploring Fishing Swimming Relaxing Sightseeing
Niche Markets are small yet significant and include: Fly in/fly out fishing
24 June 2012 41 Version 3.0
The Potential Economic Benefits of Protecting and Presenting Cape York
Fly in/fly out sightseers Self drive international camping Backpackers Bird watching – Iron Range and Lockerbie Scrub Hunting – pigs. Rifle and bow-hunters
Potential market segments include: Bird watching Diving Cruise shipping Super Yacht cruising Family members “War memories” tours”
It is noted that the above does not overtly mention cultural tourism with the visitor being guided through a natural/cultural landscape by traditional owners, tourism products for the Cape which have been successful in Kakadu and elsewhere in the Top End of the Northern Territory.
The Action Plan includes proposals for further development of visitor facilities in national parks, the identification of tourism opportunities and “tourism champions” in local communities, a tourism reference group and developing a Cape York brand.
It is concluded that there are many challenges for tourism development on Cape York. The world heritage listing could provide some focus to the better establishment of a Cape York tourism brand, however much more effort in development of tourism products in terms of infrastructure (both on public land such as national park facilities and private such as camp sites, lodges etc.) and access (roads, coastal and marine facilities etc.) will be required to realise any greater tourism potential.
Cape York Camping and National Park Tourism Framework Recently (2009) various Queensland government agencies collaborated to develop the Cape York Camping and National Park Tourism Framework (Queensland Government, 2009). In essence this Framework was developed to address two key issues identified in the above mentioned Tourism Development Action Plan, unregulated bush camping in Cape York and strategic tourism planning in national parks. The Framework’s introduction sets out the context:
“Nature-based tourism has been identified as a growth sector of the Cape York region. Tourism is generally based on the Cape’s natural assets, specifically its unspoilt wilderness, remoteness and open spaces as well as the lack of commercialization of the region and challenging terrain. Visitor research has identified that the adventurous journey to Cape York is as much a motivating factor to travel there as the destination itself.38 Visitors to the region are generally people who enjoy the outdoors, are adventurous and are seeking a challenge.
The foundation for nature-based tourism to play a role in the future of the region is based on the flow of tourists along the Peninsula Development road that provides access to the Cape and its unique natural assets. High profile attractions include the National Parks of the region such as the Jardine River National Park, Iron Range National Park and Lakefield National Park. The popularity of Cape York's national parks has been recognised by the Environmental Protection Agency who has invested a total of $2.3 million in visitor infrastructure at selected sites over the past 5 years.
38 Tourism Queensland 2002, Cape York Tourism Market Assessment and Potential,, quoted in Queensland Government 2009.

24 June 2012 42 Version 3.0
The Potential Economic Benefits of Protecting and Presenting Cape York
To date, unregulated camping has led to the environmental degradation of many sites in the region. As a consequence this has negatively impacted on the visitor experience. The Cape York Camping and National Park Tourism Framework works toward identifying appropriate camping areas and associated visitor infrastructure needs for Cape York in line with market demand in order to build a sustainable, world-class experience. The document will identify commercial opportunities available for Traditional Owners, operators and local communities to build, manage and maintain campgrounds and tourism infrastructure to capitalise on visitation to their region. Furthermore, it identifies potential protected area visitor experiences, infrastructure and access requirements.”
The Framework recognised a series of key issues and challenges:
“A lack of security of tenure for commercial tourism operators is hampering future investment in current and potential camping and national park opportunities.
Commercial Tourism operators are uncertain about the ramifications of the land acquisition process for their business, particularly during the tenure resolution process.
Tenure resolution and native title negotiations are ongoing across the Cape resulting in a constantly changing framework for negotiation of tourism opportunities.
A lack of coordination across government agencies, land trusts and the commercial tourism sector in the planning and development of tourism opportunities has led to an ad-hoc approach to appropriate infrastructure development in the past.
Camping development to date has been done in isolation from research indicating visitor trends, changing visitor needs and expectations.
There has to date been a lack of dedicated funding for the development of camping facilities outside protected areas.
Cape York covers a significantly large landmass with many remote areas inaccessible during the wet season. This makes the maintenance of visitor infrastructures, rubbish removal & cleaning of toilets, difficult and expensive.
A framework is in place to guide agencies when negotiating Indigenous Land Use Agreements. This framework does not specifically consider commercial feasibility and tourism investment issues.
Development on Cape York is required to comply with urban planning and building regulations. These regulations have not been designed with the environmental and economic landscape of Cape York in mind and in many cases, this is prohibiting further tourism development.
Cape York is not actively marketed as a tourism destination, resulting in low consumer conversion. Negative publicity has impacted on the image of the destination, particularly in regards to alcohol related issues.
There is a lack of 3-4 star quality accommodation on Cape York. Barriers to commercial investment in the region have led to the use of temporary, low quality accommodation facilities that are not reflective of visitor expectations.
There is a lack of directional signage across Cape York that limits visitors in their movements away from the Peninsula Development Road and Overland Telegraph Line to other camping and national park sites.”
The Framework sets out six key visitor hubs (or developed tourism nodes). It recognises that ultimately, the aspirations of Traditional Owners and market forces will determine the experiences offered in each node:

24 June 2012 43 Version 3.0
The Potential Economic Benefits of Protecting and Presenting Cape York
“Northern Tourism Node: This region incorporates three key experiences on Cape York including Pajinka (the “Tip of Australia”) and the NPA, the Overland Telegraph Line and the natural wonders of the Jardine River. This is a rugged, adventure destination that is rich in cultural history.
Iron Range/Lockhart River Tourism Node: This tourism node is characterised by its stunning natural attributes, namely its beaches and rainforest, and the quaint seaside community of Portland Roads. It has tangible links to its military past and is a popular tourism destination.
Central Tourism Node: This area presents both a wilderness experience and a chance to connect with some of Cape York’s local communities. Mungkan Kanju National Park offers remote camping, fishing and birdwatching opportunities while the town of Coen and the local roadhouses provides contact with locals and opportunities to replenish supplies.
Lakefield/Cooktown Tourism Node: This region is a popular fishing and camping destination characterised by billabongs, rivers, open spaces and a spectacular coastline with prolific marine life. This node is a tourism destination in its own right and is becoming increasingly popular.
Weipa Tourism Node: This tourism node incorporates Napranum and Mapoon. It is a strong fishing and camping destination on the West coast of Cape York.
Pormpuraaw and Kowanyama Tourism Node: This node provides visitors with the opportunity for wilderness camping along its pristine coastline. It is primarily a fishing destination for self-contained visitors.”
The Framework includes recommendations for redevelopment of the Pajinka site to support day-use and preparing the abandoned resort site for future commercial investment, best practice, environmentally sustainable accommodation be constructed at Chili Beach, camping infrastructure be developed along the Overland Telegraph Line and Redevelopment of the camping ground and day-use site at Somerset. Table 25 sets out priority sites for development. The Framework identified two potential management models, using volunteer campsite managers and indigenous campsite managers.
Table 25: Sites for Priority Development of Camping
Recommended Sites for Priority Action
Recommended Sites for Action in the Medium Term
Recommended Sites for Long-term Action
Somerset Pajinka Overland Telegraph Track Eliot Falls Cockatoo Creek Chili Beach North Chili Beach Garraway Falls River Bend Vrilya Point Old Laura Homestead
Mutee Head Captain Billy Landing Rainforest Campsite Cooks Hut Gordon Creek Mungkan Kanju Kalpowar Hann Crossing Marina Plains Shelburne Bay Paradise Creek Evan’s Landing Billy Lagoon Mapoon Bowchat
Injinoo Umagico Heathlands Jardine River Bathurst Heads Six Mile Waterhole Twelve Mile Waterhole Ussher Point
A range of nature-based tourism accommodation and camping options are outlined in the framework, which are outlined in Table 26:
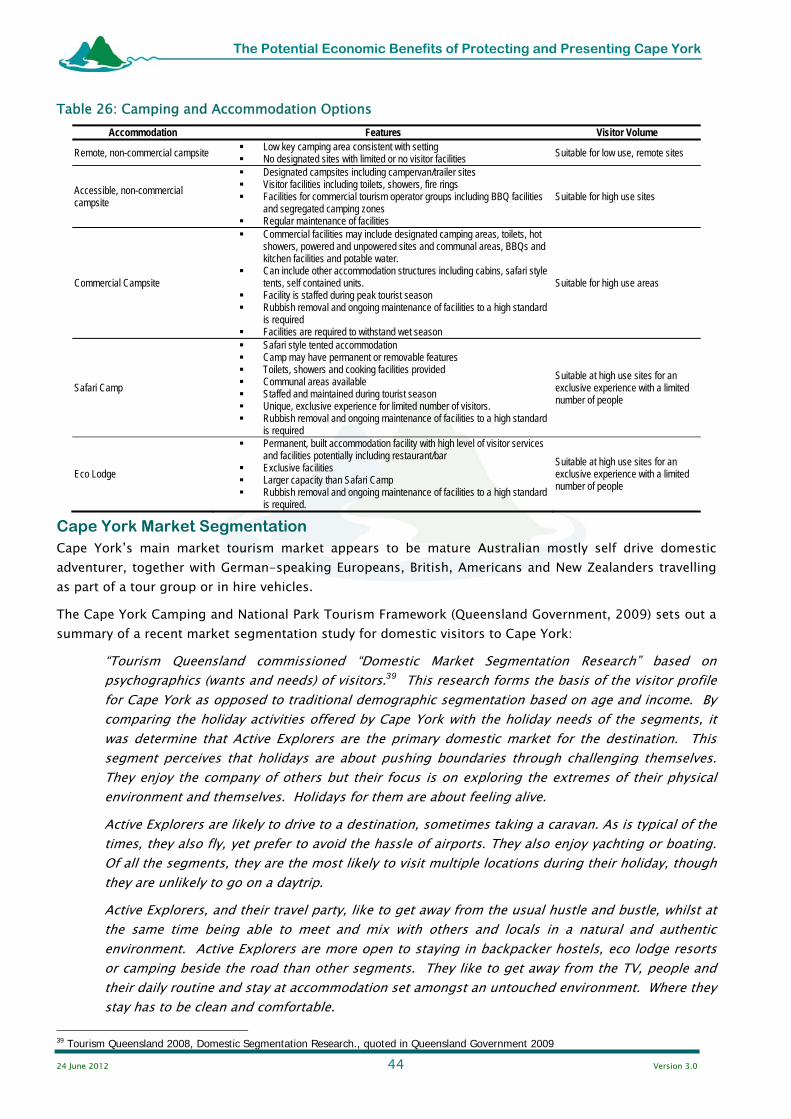
24 June 2012 44 Version 3.0
The Potential Economic Benefits of Protecting and Presenting Cape York
Table 26: Camping and Accommodation Options Accommodation Features Visitor Volume
Remote, non-commercial campsite Low key camping area consistent with setting No designated sites with limited or no visitor facilities Suitable for low use, remote sites
Accessible, non-commercial campsite
Designated campsites including campervan/trailer sites Visitor facilities including toilets, showers, fire rings Facilities for commercial tourism operator groups including BBQ facilities
and segregated camping zones Regular maintenance of facilities
Suitable for high use sites
Commercial Campsite
Commercial facilities may include designated camping areas, toilets, hot showers, powered and unpowered sites and communal areas, BBQs and kitchen facilities and potable water.
Can include other accommodation structures including cabins, safari style tents, self contained units.
Facility is staffed during peak tourist season Rubbish removal and ongoing maintenance of facilities to a high standard
is required Facilities are required to withstand wet season
Suitable for high use areas
Safari Camp
Safari style tented accommodation Camp may have permanent or removable features Toilets, showers and cooking facilities provided Communal areas available Staffed and maintained during tourist season Unique, exclusive experience for limited number of visitors. Rubbish removal and ongoing maintenance of facilities to a high standard
is required
Suitable at high use sites for an exclusive experience with a limited number of people
Eco Lodge
Permanent, built accommodation facility with high level of visitor services and facilities potentially including restaurant/bar
Exclusive facilities Larger capacity than Safari Camp Rubbish removal and ongoing maintenance of facilities to a high standard
is required.
Suitable at high use sites for an exclusive experience with a limited number of people
Cape York Market Segmentation Cape York’s main market tourism market appears to be mature Australian mostly self drive domestic adventurer, together with German-speaking Europeans, British, Americans and New Zealanders travelling as part of a tour group or in hire vehicles.
The Cape York Camping and National Park Tourism Framework (Queensland Government, 2009) sets out a summary of a recent market segmentation study for domestic visitors to Cape York:
“Tourism Queensland commissioned “Domestic Market Segmentation Research” based on psychographics (wants and needs) of visitors.39 This research forms the basis of the visitor profile for Cape York as opposed to traditional demographic segmentation based on age and income. By comparing the holiday activities offered by Cape York with the holiday needs of the segments, it was determine that Active Explorers are the primary domestic market for the destination. This segment perceives that holidays are about pushing boundaries through challenging themselves. They enjoy the company of others but their focus is on exploring the extremes of their physical environment and themselves. Holidays for them are about feeling alive.
Active Explorers are likely to drive to a destination, sometimes taking a caravan. As is typical of the times, they also fly, yet prefer to avoid the hassle of airports. They also enjoy yachting or boating. Of all the segments, they are the most likely to visit multiple locations during their holiday, though they are unlikely to go on a daytrip.
Active Explorers, and their travel party, like to get away from the usual hustle and bustle, whilst at the same time being able to meet and mix with others and locals in a natural and authentic environment. Active Explorers are more open to staying in backpacker hostels, eco lodge resorts or camping beside the road than other segments. They like to get away from the TV, people and their daily routine and stay at accommodation set amongst an untouched environment. Where they stay has to be clean and comfortable.
39 Tourism Queensland 2008, Domestic Segmentation Research., quoted in Queensland Government 2009
24 June 2012 45 Version 3.0
The Potential Economic Benefits of Protecting and Presenting Cape York
Active Explorers consider themselves to be very sporty, they love physical activity and they’ll take risks while doing it. When on holiday they want to be active rather than be sitting around. They’ll go away for weekend breaks when they can. They are more open than most other segments to a full eco-tourism experience. They are more likely than others to feel that the short time they have available for holidays limit the distance they can travel.
Connectors have been identified as a secondary market for Cape York. Connectors see holidays as a chance to connect with the people they care most about. They will often subordinate their own preferences in terms of activities to ensure everyone has a good time. It’s about what is real and what’s really important. Connectors are considered to be friendly, supportive, loyal and appreciative. For them holidays are about socialising, relaxing, spending time with family and friends, and ensuring everyone is enjoying themselves. They express a preference for a self contained house, apartment or holiday unit while on holiday. For them, having access to a well equipped kitchen is important to preparing meals.”
Demographic research was conducted on the existing and potential markets for Cape York in 200240. This research indicated that most visitors to Cape York reside in Queensland, with a significant proportion represented by the regional local market that is Cairns, Townville and Mackay. New South Wales and Victoria are the largest interstate source markets.
“The research indicated that visitors were motivated to travel to Cape York for an adventure, and for the sense of achievement of making it all the way to the top. Other motivating factors include the scenery, the unspoilt environment, the excellent fishing and bird watching opportunities, and simply ‘getting away from it all’. Generally, the length of stay varied between one to two weeks and two to three weeks with just under 20% staying more than four weeks.
These reports highlight that the profile of Cape York Visitors is mainly self-drive, couples and families (two adults and children) between 45 and 64 years of age. Young couples between the ages of 26 to 35 are the region’s secondary market.
The main length of stay varies between one to two weeks and two to three weeks with just under 20% staying more than four weeks.
The top five stated motives for travelling to Cape York are: never been before, adventure, fishing, go to the Tip, and four-wheel driving. Visitors’ main activities while in Cape York are:
Four-wheel driving Camping Exploring Fishing Swimming Relaxing Sightseeing
Niche Markets are small yet significant and include:
Fly in/ fly out fishing Fly in/ fly out sightseers Self drive international camping Backpackers Bird watching – Iron Range and Lockerbie Scrub. Hunting – pigs. (Rifle and bow-hunters)
40 “Tourism Queensland 2002, Cape York Tourism: Market Assessment and Potential, quoted in Queensland Government 2009

24 June 2012 46 Version 3.0
The Potential Economic Benefits of Protecting and Presenting Cape York
A Tourism Queensland survey undertaken in 2003 “Exploring non-visitors’ perceptions of Cape York” gave some insight into perceptions and expectations of the Cape York visitor experience. That report indicated that potential visitors appear to rely on hearsay and guesswork when asked to describe their expectations of the facilities and infrastructure at Cape York.
Some think, and indeed hope, that there will be next to nothing in the way of built accommodation and amenities, as they want to experience a truly natural holiday. People generally expect to camp during their Cape York holiday, although some, particularly females and those with children, would hope to spend at least some of their time in a cabin or motel. They are unlikely to book accommodation in advance as they do not want to feel ‘locked in’ to arrive at a certain place on a certain day.
Potential visitors expect to find the odd fuel stop and general store on their way to the top of Cape York, but they would attempt to take as much as possible with them to avoid paying higher prices in remote areas.
Visitors generally expect to participate in activities like fishing, bird watching, and exploring either by foot or car. While they do not generally have a great desire for organised activities in Cape York, there is some appeal for organised activities such as fishing charters and guided tours.
Potential visitors generally anticipate driving all the way to the top of the Cape, even those living in Melbourne. There is little awareness of options such as flying part or all of the way there, but there is evidence that this may be an appealing option for some.
Safety is an obvious concern for those considering travelling to Cape York, including concerns about crocodiles, flooding and isolation. One of the main ways people plan to deal with these safety concerns is to travel in a group with at least two vehicles.”
The Framework cites the Great Tropical Marketing Plan report prepared for TTNQ in 2005. Key marketing issues for the international market are that there is relatively low market awareness of the appeal of Cape York as a destination. Marketing activities need to be tailored towards building destination awareness in conjunction with development and distribution of niche touring options such as culture, adventure and fishing.
The Framework identifies potential or emerging international visitor market segments which, after further investigation, may offer additional prospects for development:
“Bird Watching – older / high disposable income / singles and small groups from US, Europe and Japan
Recreational / Sport Fishing – singles and small groups from Europe and US Diving – singles and small groups from US, Japan and Europe (There has been very little in the
way of promotion, and accordingly there is little recognition in all markets as yet, of existing and potential opportunities for dive experiences north of Port Douglas)
Cruise Shipping – older / high disposable income / singles and couples from Australia, US, Europe (scheduled cruises along the east coast of the Cape have been increasing in frequencies in recent times)
Super Yacht cruising Family member “war memories” tours – repeat US Market”
Tropical North Queensland Tourism Opportunity Plan The Queensland Government, Tourism Queensland and Tourism Tropical North Queensland published the 2010 – 2020 Tourism Opportunity Plan (Queensland Government 2010) for the region and identified a “Cape York Wilderness Experience” as one of eighteen catalyst projects. The opportunity is seen as:
“Opportunity:

24 June 2012 47 Version 3.0
The Potential Economic Benefits of Protecting and Presenting Cape York
Develop a uniquely Cape York sustainable tourism experience that celebrates the region’s environmental, cultural and landscape values through the implementation of the following key initiatives:
Re-development of Pajinka Resort and the wider ‘Tip’ experience
Implementation of the Cape York Camping and National Park Tourism Framework with the aim of establishing a network of camping and accommodation opportunities and associated attractions and tours across the Cape.
Implementation of other key actions in the Cape York Peninsula and Torres Strait Tourism Development Action Plan dealing with infrastructure, product and industry development, coordination and marketing.
Establish the ‘Dreaming Trail’ concept across Cape York where environmental and cultural values are presented and experienced at tourism nodes and along tourism trails (walking, road and sea) and where there are opportunities for authentic engagement with Indigenous people.
Background: The Cape York region between Cooktown and Bamaga offers a remote wilderness tourism experience through a richly diverse natural and cultural landscape. It is one of the unique and iconic Australian adventure journeys.
Current visitation to Cape York is dominated by mature aged Australians with international tourists representing less than 10% of the market. Over 80% of domestic visitors to the Cape use their own vehicle with the remaining domestic and international visitors using hire vehicles and commercial tour operators with only a very small proportion using air and sea.
The current attraction of Cape York revolves around its isolation, open spaces, unspoilt environment, spectacular scenery, fishing and the sense of adventure at escaping from the everyday hustle and bustle. Into the future Cape York has the potential to build on these attributes and attract a broader domestic and international visitor market looking for a true adventure wilderness experience and authentic engagement with Indigenous Australians.
Cape York represents a unique opportunity for TNQ and Queensland to present itself to the world as having one of the last great wilderness adventure and cultural experiences - and tourism represents a valuable economic, social and environmental opportunity for the Cape York community. The Cape York Peninsula and Torres Strait Tourism Development Action Plan provides the blueprint for realizing the great potential of tourism on Cape York as a partnership between all levels of government, industry and the Cape York Community.”
Accommodation Table 27 has been compiled to provide a snapshot of the accommodation on the Cape. Fundamentally the vast majority of “accommodation” on Cape York is camping for the self drive or safari tour market.
Camping accommodation includes an approximate capacity of 4500 people, including all bush camping sites, or 3500 people at sites with at least basic facilities. There are 11 developed camping areas/ caravan parks. Commercial accommodation ranges from the Bamaga Resort and resort style motels at Weipa to the remote lodges such as Lotusbird Lodge and Iron Range Cabins. The work for this project has identified 947 bed capacity. The Weipa accommodation is mostly local business travel, as is some accommodation along the Peninsula development Road and in Communities.
For the purposes of this study it is assumed that there are 700 beds in 24 properties available for leisure travel tourism. This provides an annual capacity of 147,000 bed nights for a seven month season. The campsites with at least basic facilities provides for 735,000 “bed” (sic tent!) nights.
If it is assumed that there are 50,000 visitors to Cape York Peninsula (excluding Cooktown and surrounds) with an average length of stay of seven nights this represents a current demand of 350,000 bed nights.
NOTE At present there is overcrowding of key sites during peak periods such as school holidays.
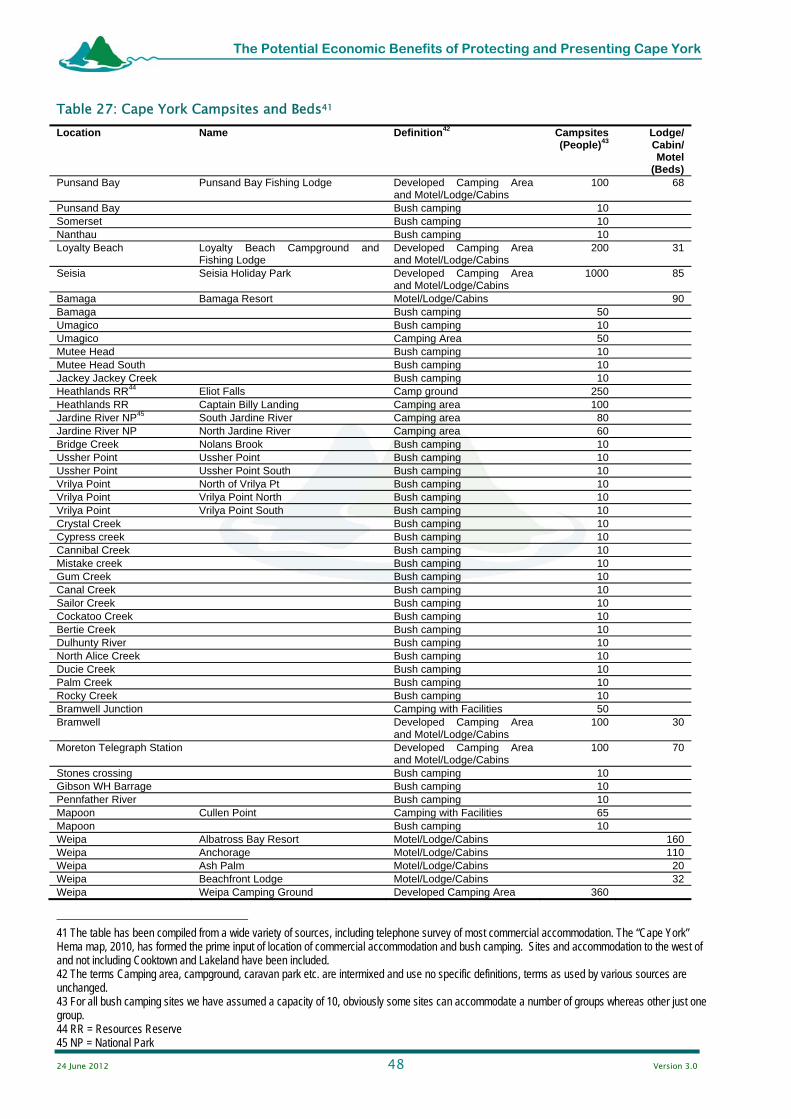
24 June 2012 48 Version 3.0
The Potential Economic Benefits of Protecting and Presenting Cape York
Table 27: Cape York Campsites and Beds41 Location Name Definition42 Campsites
(People)43 Lodge/ Cabin/ Motel
(Beds) Punsand Bay Punsand Bay Fishing Lodge Developed Camping Area
and Motel/Lodge/Cabins 100 68
Punsand Bay Bush camping 10 Somerset Bush camping 10 Nanthau Bush camping 10 Loyalty Beach Loyalty Beach Campground and
Fishing Lodge Developed Camping Area and Motel/Lodge/Cabins
200 31
Seisia Seisia Holiday Park Developed Camping Area and Motel/Lodge/Cabins
1000 85
Bamaga Bamaga Resort Motel/Lodge/Cabins 90 Bamaga Bush camping 50 Umagico Bush camping 10 Umagico Camping Area 50 Mutee Head Bush camping 10 Mutee Head South Bush camping 10 Jackey Jackey Creek Bush camping 10 Heathlands RR44 Eliot Falls Camp ground 250 Heathlands RR Captain Billy Landing Camping area 100 Jardine River NP45 South Jardine River Camping area 80 Jardine River NP North Jardine River Camping area 60 Bridge Creek Nolans Brook Bush camping 10 Ussher Point Ussher Point Bush camping 10 Ussher Point Ussher Point South Bush camping 10 Vrilya Point North of Vrilya Pt Bush camping 10 Vrilya Point Vrilya Point North Bush camping 10 Vrilya Point Vrilya Point South Bush camping 10 Crystal Creek Bush camping 10 Cypress creek Bush camping 10 Cannibal Creek Bush camping 10 Mistake creek Bush camping 10 Gum Creek Bush camping 10 Canal Creek Bush camping 10 Sailor Creek Bush camping 10 Cockatoo Creek Bush camping 10 Bertie Creek Bush camping 10 Dulhunty River Bush camping 10 North Alice Creek Bush camping 10 Ducie Creek Bush camping 10 Palm Creek Bush camping 10 Rocky Creek Bush camping 10 Bramwell Junction Camping with Facilities 50 Bramwell Developed Camping Area
and Motel/Lodge/Cabins 100 30
Moreton Telegraph Station Developed Camping Area and Motel/Lodge/Cabins
100 70
Stones crossing Bush camping 10 Gibson WH Barrage Bush camping 10 Pennfather River Bush camping 10 Mapoon Cullen Point Camping with Facilities 65 Mapoon Bush camping 10 Weipa Albatross Bay Resort Motel/Lodge/Cabins 160 Weipa Anchorage Motel/Lodge/Cabins 110 Weipa Ash Palm Motel/Lodge/Cabins 20 Weipa Beachfront Lodge Motel/Lodge/Cabins 32 Weipa Weipa Camping Ground Developed Camping Area 360
41 The table has been compiled from a wide variety of sources, including telephone survey of most commercial accommodation. The “Cape York” Hema map, 2010, has formed the prime input of location of commercial accommodation and bush camping. Sites and accommodation to the west of and not including Cooktown and Lakeland have been included. 42 The terms Camping area, campground, caravan park etc. are intermixed and use no specific definitions, terms as used by various sources are unchanged. 43 For all bush camping sites we have assumed a capacity of 10, obviously some sites can accommodate a number of groups whereas other just one group. 44 RR = Resources Reserve 45 NP = National Park

24 June 2012 49 Version 3.0
The Potential Economic Benefits of Protecting and Presenting Cape York
Location Name Definition42 Campsites (People)43
Lodge/ Cabin/ Motel
(Beds) Weipa Western Cape Centre Motel/Lodge/Cabins 34 False Pera Head Bush camping 10 Amban Bush camping 10 Aurukun Motel/Lodge/Cabins 16 Merluna Developed Camping Area
and Motel/Lodge/Cabins 100 20
Iron Range National Park Chili Beach camping area Camping area 60 Iron Range National Park Cooks Hut camping area Camping area 15 Iron Range National Park Gordon Creek camping area Camping area 10 Iron Range National Park Rainforest camping area Camping area 8 Portland Roads Portland House Motel/Lodge/Cabins 8 Portland Roads Portland Roads Beach Shack Motel/Lodge/Cabins 4 Iron Range Iron Range cabins Motel/Lodge/Cabins 32 Archer River Roadhouse Motel/Lodge/Cabins 100 12 Mungkan Kandju NP Mango Lagoon Camp site 10 Mungkan Kandju NP First Coen River campsite Camp site 10 Mungkan Kandju NP Chong Swamp Camp site 10 Mungkan Kandju NP Second Coen River Camp site 10 Mungkan Kandju NP Pandanus Lagoon Camp site 10 Mungkan Kandju NP Vardons Lagoon Camp site 10 Mungkan Kandju NP Night Paddock Lagoon Camp site 10 Mungkan Kandju NP Langi Lagoon Camp site 10 Mungkan Kandju NP Old Archer Crossing Camp site 10 Mungkan Kandju NP Bobs Lagoon Camp site 10 Mungkan Kandju NP Twin Lagoons 1 Camp site 10 Mungkan Kandju NP Twin Lagoons 2 Camp site 10 Mungkan Kandju NP Ten Mile Junction Camp site 10 Mungkan Kandju NP Governors’ Waterhole Camp site 10 Mungkan Kandju NP Horsetailer Waterhole Camp site 10 Coen Exchange Hotel Motel/Lodge/Cabins 36 Coen Homestead Guesthouse Motel/Lodge/Cabins 20 Port Stewart Bush camping 10 Musgrave Roadhouse Developed Camping Area
and Motel/Lodge/Cabins 140 28
Saltwater Creek Lotusbird lodge Motel/Lodge/Cabins 10 8 Lakefield National Park Twelve Mile Waterhole Camping area 10 Lakefield National Park Old Faithful Waterhole Camping area 10 Lakefield National Park Mick Fienn Waterhole Camping area 10 Lakefield National Park Dingo Waterhole Camping area 10 Lakefield National Park Kalpowar Crossing Campground Camp ground 40 Lakefield National Park Seven Mile Waterhole Camping area 10 Lakefield National Park Hann Crossing camping area Camp ground 20 Lakefield National Park 6 Mile Camping area 10 Lakefield National Park Annie River Camping area 10 Lakefield National Park 5 Mile Camping area 10 Lakefield National Park Saltwater Camping area 10 Lakefield National Park Sweetwater Camping area 10 Lakefield National Park Bizant River / Browns Creek Camping area 10 Lakefield National Park Catfish Waterhole Camping area 10 Lakefield National Park Hanuschs Camping area 20 Lakefield National Park Midway Camping area 10 Lakefield National Park Melaleuca Camping area 40 Lakefield National Park Elbow Camping area 10 Lakefield National Park Horseshoe Lagoon Camping area 10 Lakefield National Park Kennedy Bend Camping area 40 Lakefield National Park Lake Emma Camping area 10 Lakefield National Park Old Laura / Dowling Yards Camping area 10 Lakefield National Park Orange Plains Camping area 40 Lakefield National Park Top Whiphandle Camping area 10 Lakefield National Park Bottom Whiphandle Camping area 10 Lakefield National Park Basin Hole Camping area 10 Lakefield National Park Welcome Camping area 10 Lakefield National Park Leichardt Camping area 10 Bathurst Head Combe Point Bush camping 10 Bathurst Head Bathurst Bay Bush camping 10 Cape Melville National Park
Cape Melville - Bathurst Bay camping area
Camping area 10
Cape Melville National Melville Beach Camping area 100

24 June 2012 50 Version 3.0
The Potential Economic Benefits of Protecting and Presenting Cape York
Location Name Definition42 Campsites (People)43
Lodge/ Cabin/ Motel
(Beds) Park Cape Melville National Park
Ninian Bay Camping area 30
Mungkan River Bush camping 10 Pormpuraaw Camping with Facilities 50 Kowanyama Bush camping 10 Mitchell River Bush camping 10 Old Koolatah Waterhole Bush camping 10 Jowalbinna Safari Camp Motel/Lodge/Cabins 10 Palmer River Goldfield Bush camping 10 Laura Quinkan Hotel Motel/Lodge/Cabins 120 6 Laura Camping with Facilities 50 Hopevale Elim Beach Bush camping 10 Deighton Deighton River Bush Camp Bush camping 10 Endeavour River Endeavour Falls Tourist Park Developed Camping Area
and Motel/Lodge/Cabins 240 17
TOTAL 4508 947
NOTE Approximately 3305 of the above camping site capacity is at managed sites where there are basic facilities.
Recent Tourism Planning Cape York Tourism Forums Between November 2010 and April 2011 Cape York Sustainable Futures undertook a series of forums throughout the cape to identify tourism futures, opportunities and issues for Cape York.
The five (5) key priorities emerging from all forums were:
“1. The need to create a tourism and business organisation to represent Cape York Peninsula interests in order to create a unity of purpose; for all tourism and business interests to ‘speak with one voice’ to represent the region. Attendees suggested a December 2011 time frame for establishment of the body.
2. The need to create a distinctive “Cape York and Torres Strait” brand and to unify support for an easily recognisable image.
3. Take actions to expand marketing efforts and increase information and promotion to the travelling public – open Visitor Information Centres and share information across the region.
4. Strategically plan for infrastructure improvements:
a. encourage investment in accommodation to meet demand and
b. progressively improve roads, particularly the Peninsula Development Road
5. Resolution of land tenure issues both by the State Government and local Councils, and in the case of Weipa by Rio Tinto; attendees noted that lack of capacity to use DOGIT land is hindering expansion and development.”

24 June 2012 51 Version 3.0
The Potential Economic Benefits of Protecting and Presenting Cape York
Cook Shire Tourism Strategy As at November 2011, Cook Shire Council had engaged consultants to develop a Tourism Strategy for the shire. The Terms of Reference and potential scope of this have not been evaluated. The key topics the consultants have been looking at during consultations include46:
Product development;
Camping policy and grey nomads;
Marketing;
Cruise shipping industry;
Mountain biking;
Tourism related infrastructure; and
Signage and related policy.
46 Pers comm. James Dunbar, AEC Group
24 June 2012 52 Version 3.0
The Potential Economic Benefits of Protecting and Presenting Cape York
Grazing
Overall Land Use Given the overall historical importance of the grazing industry to the Cape, this section provides analysis of the aerial extent and economic contribution.
The Savanna Explorer website 47 (developed by key researchers and Savanna organisations) states:
Despite the fact that it occupies over 7.5 million hectares, the Cape York cattle industry remains only marginally productive. This is largely a result of low soil fertility, poor nutrient value of pasture species, isolation and very limited infrastructure.
A 1992 Queensland Department of Primary Industries report on the region estimated the total herd size of the region at only 130,000 head with annual sales (turn off) of about 18,000 which in turn generated around $6.5 million. In 1995 it was estimated that the average income generated in the region was around 90 cents per hectare (Cotter 1995). This compares, for example, to $1.90 per hectare generated in the Kimberley region.
Stocking rates are as low as one head per 60 hectares and as a consequence property sizes are very large. While turn off is low, operating costs for such vast properties are relatively high making profit margins slim. Infrastructure such as fencing and watering points also tends to be limited.
Table 28 sets out the current known pastoral properties on Cape York. This is 33.89 percent of the land area of Cape York (as per Table 15as developed by DERM for this study).
In addition to the above, it is understood that the following properties are now National Park but may have cattle on them and be subject to various de-stocking programs Battlecamp, Crosby Creek, Kallinga, Mary Valley, Melsonby, Mount Jack and Strathmay (comprising 412,517 ha). Bertiehaugh Station (137,070ha) is now managed as Steve Irwin Wildlife Reserve, it is understood to have 67,000ha still under cattle (not included in the production figures below). The following ex Cattle Stations are not held by indigenous owners and are understood to have virtually no cattle on them (and are not being managed for cattle production): Baas Yard, Glen Garland, Kalpowar, Normanby and Strathgordon, comprising 339,438 ha. Further, the properties Harvest Home and Wattle Hills are understood to not have any productive cattle on them (102,016 ha).
On the basis that there are 44 properties covering 4.9 million hectares and assuming a stocking density of 50 hectares per head, there is an estimated herd of 97,600. This would appear to reflect a reasonable figure when compared to the 1992 figure above of 130,000 given the various properties that are now not in production owing to transfer to indigenous ownership and/or national park acquisitions.
47 Savanna Explorer, Tropical Savannas cooperative Research Centre, http://www.savanna.org.au/qld/cy/cygrazing.html
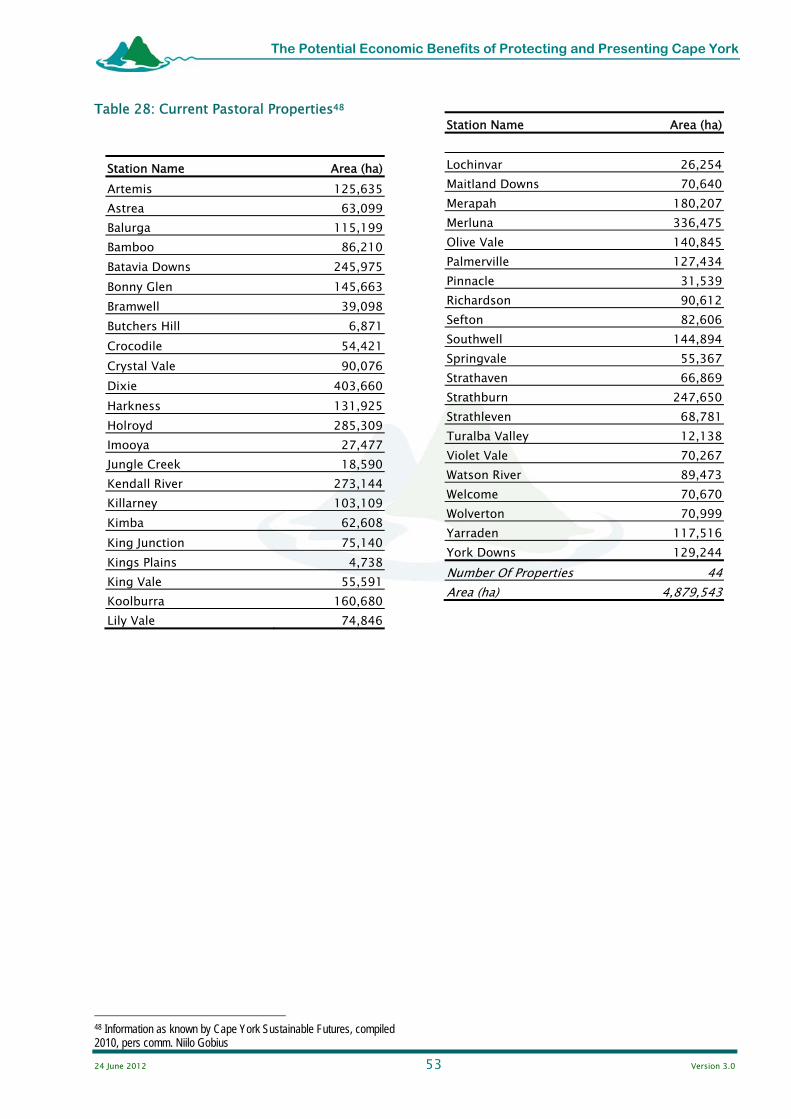
24 June 2012 53 Version 3.0
The Potential Economic Benefits of Protecting and Presenting Cape York
Table 28: Current Pastoral Properties48
Station Name Area (ha)Artemis 125,635Astrea 63,099Balurga 115,199Bamboo 86,210Batavia Downs 245,975Bonny Glen 145,663Bramwell 39,098Butchers Hill 6,871Crocodile 54,421Crystal Vale 90,076Dixie 403,660Harkness 131,925Holroyd 285,309Imooya 27,477Jungle Creek 18,590Kendall River 273,144Killarney 103,109Kimba 62,608King Junction 75,140Kings Plains 4,738King Vale 55,591Koolburra 160,680Lily Vale 74,846
48 Information as known by Cape York Sustainable Futures, compiled 2010, pers comm. Niilo Gobius
Station Name Area (ha) Lochinvar 26,254Maitland Downs 70,640Merapah 180,207Merluna 336,475Olive Vale 140,845Palmerville 127,434Pinnacle 31,539Richardson 90,612Sefton 82,606Southwell 144,894Springvale 55,367Strathaven 66,869Strathburn 247,650Strathleven 68,781Turalba Valley 12,138Violet Vale 70,267Watson River 89,473Welcome 70,670Wolverton 70,999Yarraden 117,516York Downs 129,244Number Of Properties 44Area (ha) 4,879,543

24 June 2012 54 Version 3.0
The Potential Economic Benefits of Protecting and Presenting Cape York
Sustainability Considerations The following is from the landmanager website.
“Cape York has management issues which are quite different to those experienced by graziers elsewhere in Northern Australia. Because many of the properties are only marginally productive, many graziers in Cape York must engage in off-farm employment such as fencing, mustering or supplying tourist facilities. It also means that there is very little capital available for property development. Overall the very low stocking rates mean severe land degradation and changes in pasture composition experienced elsewhere have not occurred on a large scale in the Cape. However, preferential grazing has certainly caused localised degradation. As the majority of properties have very limited internal fencing and watering points, the distribution of cattle is very difficult to control.”
The land manager website identifies fire management, feral animals, weeds as issues affecting both production and ecological sustainability of the land use. It describes the challenges for more intensive production owing to the low capital available and the low productivity of the savanna pastures.
Economic Impact There is relatively little information available on the economic value of grazing in the region of interest in Cape York. The CYPLUS studies in the mid 1990s paint a picture of low productivity and low returns for properties in the area. Walker (1995) reports the following for a property on Cape York; gross margin (income minus variable costs) of $69,223 and when fixed costs are taken into account, net income of $14,000 for the year. In another report for CYPLUS, Cotter (1995) quotes information provided by the Meat and Livestock Branch of the Commonwealth Department of Primary Industries and Energy. They give a figure of $6.5 million in gross income annually from Cape York properties covering 7.382 million hectares. This gives an average income of 90 cents per hectare.
A recent report on the economics of fire management in Cape York (Gobius et al. 2008) includes more recent information on returns for a sample of properties. Based on a sample of 8 properties, the average income (total value of sales) of the properties is $167,000 in 2008 ($181,600 in 2011 dollars). If this income is extrapolated to 44 properties covering 4.9 million ha, the total income is $7,376,000 per annum ($7,990,000 in 2011 dollars). However, it should be noted that the sample of only 8 properties shows considerable variation of income per property. On a per ha grazed basis, the average income for the sample is $3.26per hectare ($3.53 in 2011 dollars) used for grazing, however not the total area of the properties is used for grazing and there is also considerable variation in the per ha income across the sample. On a per hectare basis for 4.9 million ha, this is $1.60 income per ha in 2011 dollars.
The report also records gross margins (income minus variable costs). The average gross margin per property is $51,649 in 2008 ($56,000 in 2011 dollars). Extrapolated to 44 properties, this gives a total gross margin of $2,273,000 ($2,462,000 in 2011 dollars). The variable costs used to calculate gross margins only take account of non family labour costs and do not include any opportunity cost for family labour. Thus the producer surplus estimated using a gross margin approach will be a generous estimate.
The reports drawn on for this study all discuss prospects for increased productivity from grazing due to practices such as feed supplements, pasture improvement and improved fire management. However all these require additional investment. Due to the low returns to properties, this is a challenge.
24 June 2012 55 Version 3.0
The Potential Economic Benefits of Protecting and Presenting Cape York
Potential Economic Opportunities
Potential Economic Opportunities This section identifies potential economic opportunities for Cape York associated with protecting and presenting the natural and cultural values of the Cape. The enabling factors and potential constraints are identified for each potential opportunity. A conclusion of the likelihood of realising (unquantified) opportunities is made (within the context of the enabling factors and constraints).
Identified Opportunities not Predicted Benefits NOTE: There has been no attempt to predict quantifiable benefits, rather this chapter identifies potential opportunities. The development of scenarios and the modelling in a following chapter provides a level of quantification of potential economic benefits (but not a prediction).
Protecting and Presenting During the initial consultation stages of this project the suggestion was made to move the focus from determining economic benefits and impacts from world heritage listing to that for overall protecting and presenting the natural and cultural values of Cape York.
As such this chapter is based on the overall outcome of protecting and presenting areas of Cape York. For this analysis it is assumed that there will be an overall increase in declared national parks, in a variety of tenures with statutory conservation regimes (e.g. aboriginal freehold with nature refuge status) and an overall increase in pro-active natural resource management on other lands which have natural landscapes (e.g. indigenous protected areas and fire/feral animal and weed control on pastoral leases. It is assumed that existing natural resource management agencies, organisations and structures (including the new Natural Resource Management Board) will remain in place. Further it is assumed that conservation management funding will be at least maintained.
World Heritage There is the potential that the Australian public awareness and international branding of Cape York as a significant natural and cultural landscape will be significantly enhanced by world heritage listing. Further it is assumed that there will need to be an overall coordinated management approach (to meet the obligations of world heritage listing) established if a world heritage areas listing is achieved.
Given this, where there is a potential difference between overall protection and presentation of Cape York versus world heritage listing, this is outlined as an enabling factor below.
Land Tenures This chapter has identified opportunities without considering land tenure issues. It is vital to understand that to achieve any economic activities there will been a need to allow alienation of lands for specific purposes to public, community and private owners with tenures that allow security (i.e. may be dealt with and can be offered as security).
Opportunities There are a suite of potential economic opportunities which may arise from protecting and presenting Cape York. These have been identified from the examples of other World Heritage sites and based on the current opportunities in Cape York. The Investment Prospectus (CYSF 2010) and the Cape York Peninsula and Torres Strait Tourism Development Action Plan (Tourism Queensland 2008) have been prime sources.
24 June 2012 56 Version 3.0
The Potential Economic Benefits of Protecting and Presenting Cape York
The opportunities for Cape York identified by CYSF include:
Cattle
Fisheries and aquaculture
Agriculture
Timber
Mining
Tourism
Light industry, retail and services
Accommodation
Business Centres and infrastructure
Ecosystem Services
Tropical Environmental Management and Training
In terms of tourism there are a variety of existing plans and documents which indentify potential opportunities on Cape York. Few of these opportunities are dependent upon world heritage listing per se, however many involve the presentation of the natural and cultural values of the Cape. The opportunities can best be summarised as:
Expansion of the self drive “Cape York/Overland Telegraph Line” who traverse the Cape to the tip.
Continuation of the “Cape York/Overland Telegraph Line” safari tour.
Expansion of the shorter stay, self drive visitor often activity focussed to a single destination (e.g. Lakefield fishing trips etc.).
Expansion of Torres Strait/Northern Peninsula Area short stay visitor (fly/boat in).
Expansion of eco and or fishing lodge style 3 day to week stay visitor (either self drive or fly in.
Potential development of cultural tourism (as specific single destination experience and as sites and attractions for the above style of visitors (self drive, safari tour and fly in).
Cattle The CYSF investment prospectus summarises the opportunity as:
“CATTLE Historically the cattle industry has been the key player in the economic development of Cape York and is still the major land user in the region. Peninsula primary producers continue to play a role in land management, feral pest control, quarantine and fire management. Meat and Livestock Australia (MLA) predictions for 2011 suggest that beef profitability will recover and live cattle demand will expand, fuelling herd expansion in the north. There are investment opportunities associated with improved land and stock management processes and the live cattle export industry.”
There has been significant community concern over a perceived impact on the sustainability of the cattle industry on Cape York should world heritage listing proceed. These concerns have been exacerbated by the ongoing acquisition of cattle properties for nature conservation and the phasing out of cattle grazing and non-renewal of leases in the nearby Wet Tropics World Heritage Area.

24 June 2012 57 Version 3.0
The Potential Economic Benefits of Protecting and Presenting Cape York
There is further discussion of the potential economic impacts in the following chapter.
There are a large number of factors affecting the sustainability of the cattle industry on Cape York. One major aspect is to maintain critical mass, should the number of pastoral properties or area available for grazing be reduced to a further significant extent the support systems and services will be fragmented and could affect the viability of the industry.
However this section is addressing the opportunities and the major opportunity is for integrated grazing production and conservation management to be achieved on a broad acre landscape basis. When this can be combined with payments to pastoralists for their conservation land management, this could be a positive outcome in terms of providing additional income to pastoralists.
The opportunity for grazing is to maintain a critical mass of grazing properties and to allow the maximisation of grazing production in combination with cattle exclusion of critical conservation areas (e.g. wetlands, vine thickets, special riparian zones etc.) and an overall conservation management regime over the whole property with additional income to the landholder for conservation management capital and recurrent expenditure which is over and above their normal land stewardship obligations.
The key enabling factors are:
Maintain a critical mass of grazing properties to ensure overall industry viability.
For properties within or adjacent to the world heritage area, allow existing and sustainable development of water extraction for potable and pastoral uses, road infrastructure (including borrow pits for maintenance and upgrading of bridges, minor re-alignment of roads etc.).
Provide conservation land management financial assistance and technical advisory support.
Fisheries and Aquaculture The CYSF investment prospectus summarises the opportunity as:
“With the growing demand for seafood and diminishing resources, aquaculture is likely to become an emerging priority for Queensland's coastal areas. There are opportunities for production at various locations on Cape York Peninsula, subject to economic feasibility and environmental sustainability studies.”
The world heritage listing of Cape York would not appear to provide any additional opportunity for the realisation of further fisheries and aquaculture opportunities.
Agriculture The CYSF investment prospectus summarises the opportunity as:
“The main cultivation areas on Cape York are near Lakeland Downs and Cooktown. Bananas, sorghum, corn, melons, legumes, and range of tropical fruits are produced at Lakeland Downs and Cooktown’s Endeavour Valley. Investment opportunities could exist in extending the production of tropical plants and fruits, industrial bamboo production and bio-medical research into medicinal properties of tropical plants.”
The key agriculture opportunities recognised for Cape York appear to be outside the potential world heritage area. It is unlikely that there will be any additional opportunities on agriculture arising from world heritage listing.

24 June 2012 58 Version 3.0
The Potential Economic Benefits of Protecting and Presenting Cape York
If a broad acre nomination encompasses communities over large areas of Cape York there may be an opportunity to allow smaller, low impact market garden and fruit orchards etc. to reduce these communities need to forever rely on fresh fruit and vegetables transported into communities from outside the Cape (with the inherent embodied energy and carbon emissions of the “food miles”). The enabling factor would be to allow small scale market gardens and orchards using species unlikely to become invasive, where native vegetation is not cleared and sustainable/minimal impacts practices are used.
Forestry/Timber The CYSF investment prospectus summarises the opportunity as:
“TIMBER Although there are small scale saw milling businesses at Napranum and Cooktown, a sustainable timber industry is yet to be established on Cape York Peninsula. This may come from timber resources felled prior to the conduct of mining operations or from sustainable reforestation projects established on pre-cleared land. This is already being trialled by the ICT project at Lakeland Downs, and such projects may have substantial benefits on mine-site rehabilitation projects.”
The conservation regime inherent with world heritage listing is likely to prohibit large scale timber extraction from within the world heritage area. There is no major timber industry within areas understood to be likely to be included within the world heritage listing, however there is modest use of timber resources for bush camps, fences and other structures on grazing and aboriginal lands within the potential world heritage area.
The opportunity exists to continue to allow modest in-situ use of timber resources on lands within the world heritage area such that “bush materials” structures may be constructed and maintained for otherwise approved uses.
The critical enabling factor is to allow modest levels of in-situ use of timber resources by land holders and traditional owners.
Mining and Quarrying The CYSF investment prospectus summarises the opportunity as:
“MINING Cape York has three significant established mines: Rio Tinto Alcan’s Weipa Bauxite mine (mining world class bauxite mineral accumulations), Cape Flattery Silica Mine (the world’s largest exporter of silica sands) and the Skardon River kaolin mine, where Minerals Corporation recently began commercial mining operations. Waratah Coal Inc was granted two exploration permits in the Laura basin in 2007, and active prospects are held for gold, kaolin, cassiterite and tungsten in the region. Mining will continue to provide the impetus for expansion of small business, trade and light industrial activities.”
The conservation regime inherent with world heritage listing is likely to prohibit large scale mining from within the world heritage area. There are no major proposed mines within areas understood to be likely to be included within the world heritage listing, however there is ongoing mining.
The opportunity exists to allow development of mining prospects on lands within the world heritage area if these are otherwise or previously approved uses.

24 June 2012 59 Version 3.0
The Potential Economic Benefits of Protecting and Presenting Cape York
The critical enabling factor would be to allow existing mines and recognised prospects to be developed. Or at the time of world heritage listing to ensure the world heritage listing does not include viable/potential mining prospects. It is recognised that this is a challenge firstly to identify which prospects are viable and secondly to ensure potential environmental impacts do not adversely affect the integrity of world heritage values.
Quarrying has a critical role in supporting the economy of Cape York. The vast road network is maintained and upgraded using locally sourced quarry materials. The experience of local governments with the Wet Tropics World Heritage Area has been that quarries and borrow pits within the world heritage area have been progressively shut down and new sites have not been approved. This has created major additional expenditure for local governments and road managers.
The opportunity exists to recognise the vitally important role local (gravel) borrow pits and hard rock quarries have in maintaining and developing roads and other infrastructure and allow existing and new sustainably managed (minimal environmental impact) quarries and borrow pits which support local roads and infrastructure.
The critical enabling factor is to allow quarries and borrow pits, both existing and new, within the world heritage area where they support local roads and infrastructure. Guidelines for design, siting and management could ensure ecologically sustainable use with no or minimal impacts on world heritage values.
Tourism The CYSF investment prospectus summarises the opportunity as:
“TOURISM Cape York Peninsula contains a wealth of spectacular natural environments and attractions that are experiencing increasing levels of attention from within Australia and abroad. Tourism is a rapidly growing industry with 60,000 visitors to Cooktown and lower Cape York in 2009 per year. About 20,000 tourists travel to the Tip of Cape York Peninsula. The current level of infrastructure is not sufficient to cover demands, creating opportunities for investment in bush and safari camps, accommodation and amenities. Local tourism industry providers struggle to meet peak demand, with business, systems development and customer services training identified areas of need. Although locally owned and operated tourism companies operated by small family businesses are located at various centres on the Cape, all of the larger tourism companies work from outside of Cape York Peninsula, offering tours into and through the region. The main operators offer 4WD and small bus tours. Future investment will rest on a number of development options, including developing and improving tourism experiences, provision of support services, creation of specialised tours, provision of infrastructure and accommodation and expanding the tourism season ‘shoulder’ by embracing “Green Tourism” in the wet season.”
Without doubt tourism is the major private enterprise industry which can benefit from World Heritage listing. The opportunities include:
Expansion of the self drive “Cape York/Overland Telegraph Line” who traverse the Cape to the tip.
Continuation of the “Cape York/Overland Telegraph Line” safari tour (camping and accommodated.
24 June 2012 60 Version 3.0
The Potential Economic Benefits of Protecting and Presenting Cape York
Expansion of the shorter stay, self drive visitor often activity focussed to a single destination (e.g. Lakefield fishing trips etc.)
Expansion of Torres Strait/Northern Peninsula Area short stay visitor (fly/boat in).
Expansion of eco and or fishing lodge style 3 day to week stay visitor (either self drive or fly in.
Potential development of cultural tourism (as specific single destination experience and as sites and attractions for the above style of visitors (self drive, safari tour and fly in).
The potential economic opportunities include (but are not limited to):
Overall brand/destination awareness promoting existing tourism.
Additional tourism using existing infrastructure.
Tourism growth based on new public infrastructure (camping grounds, roads, attractions etc.).
Tourism growth based on new private infrastructure (motels, resorts, campsites) and tour businesses (e.g. boat tour etc.).
New niche market tourism opportunities (e.g. cultural tourism, bird watching.
Given that tourism is a major potential opportunity from world heritage it is recognised that current tourism capacity is a major constraint and the opportunities in Cape York Peninsula need facilities and infrastructure to be realised. This will include understanding potential nodes and markets for different tourism products. These may have infrastructure needs and these will be identified. In many some cases there will be infrastructure needs in National Parks and other public lands likely to be within the world heritage area.
There are many critical enabling factors which need to be implemented to achieve any substantial growth. These include:
branding and marketing of the Cape as a brand and promotion of the various activities, destinations and experiences;
the facilitation of land tenures and access rights which provide business security and offer commercial lending security;
a planning and approvals system to enable tourism business establishment and growth which offer adequate protection of world heritage value and business viability;
the facilitation of commercial tours, concessions and potentially commercial accommodation on protected areas; and
substantial government investment in facilities (e.g. national park camping), roads and other infrastructure such as boat ramps, orientation signage and nature and cultural interpretation facilities.
The overall marketing/branding of the tourism product of Cape York would be needed as a fundamental enabling factor and would need to involve:
The aggressive branding of Cape York (as a destination in its own right, not just as part of Tropical North Queensland).
The marketing of specific experiences and activities (e.g. self drive cape trips, self drive activity trips, safaris, eco lodges, fishing lodges, cultural heritage sites, cultural immersion opportunities etc.

24 June 2012 61 Version 3.0
The Potential Economic Benefits of Protecting and Presenting Cape York
The fostering of a sales and distribution system for Cape York tourism, recognising the remote and relatively fragmented and inexperienced industry may need easy access to an effective sales, distribution and booking system for potential tourists prior to their arrival and self drive tourists whilst on the Cape.
To avoid any doubt, whilst the management of the world heritage area will need to pro-actively manage the impacts of tourism to ensure the integrity of world heritage values are not affected, to achieve an economic benefit from tourism there will need to be a facilitatory approach to enabling activities, to providing access and infrastructure and encouraging not merely regulating tourism enterprises and tourists.
A growth of tourism is unlikely without substantial marketing and facilitation. A substantial growth will require significant government investment in incentives to private enterprise and infrastructure. Further, it may require capital grants for tourism enterprises on land held by traditional owners where tenures do not provide for commercial (“mortgage able”) security.
Light Industry, Retail and Services The CYSF investment prospectus summarises the opportunity as:
“Mining operations on Cape York Peninsula are expected to continue until 2064 and will be the main source of growth for the light industrial and retail sectors. In addition the increasing development of the tourism industry base following essential improvements to the Peninsula Development Road will provide key local opportunity development and create new employment for the region.”
The world heritage listing of Cape York would not appear to provide any additional opportunity for the realisation of light industry, retail and services. The following chapter identifies key mitigation strategies to minimise any adverse impacts.
If a broad acre nomination encompasses communities over large areas of Cape York there may be an opportunity to specifically provide for light industry, retail and/or services which support the local community. The critical enabling factor would be to ensure the land use and planning approvals minimise potential adverse impacts on world heritage values, without being to onerous in either approval process or approval conditions to affect viability of the enterprise.
Accommodation The CYSF investment prospectus summarises the opportunity as:
“ACCOMMODATION During peak season month (sic months) there is an accommodation shortage across Cape York. Limited flights into most centres necessitate that business visitors stay overnight and as a result, accommodation facilities are often fully booked. A significant opportunity exists for the development of accommodation facilities in Coen, Lakeland Downs and at each Indigenous Community. This need will escalate as road conditions improve and tourism numbers increase.”
The world heritage listing of Cape York could potentially provide substantial additional opportunity for the provision of accommodation (for short stay leisure and business travellers, for weekly/monthly and longer stay business and government travellers and to allow for increased residential populations. The following chapter identifies key mitigation strategies to minimise any adverse impacts.

24 June 2012 62 Version 3.0
The Potential Economic Benefits of Protecting and Presenting Cape York
The key enabling factor would be to ensure that accommodation can be provided and developed both for leisure and business short stay tourism and for longer stay business, government and community use.
NOTE: It is unlikely that this can be achieved by the exclusion of current communities and settlements from world heritage listing. To realise the opportunity, even if the major towns and settlements are excluded from the world heritage nomination, there will still be a need to allow accommodation development within the world heritage area. The can be achieved with provisions which enable land use and planning approvals which minimise potential adverse impacts on world heritage values, without being too onerous in either approval process nor approval conditions.
Business Centres and Infrastructure The CYSF investment prospectus summarises the opportunity as:
Cooktown and Weipa are the two significant population centres on Cape York Peninsula. Cooktown, just over 300kms from Cairns via a standard sealed highway, is the region’s most accessible town. It is also the most northerly centre on Australia’s east coast. Hope Vale, an indigenous community of 1,200 people, located approximately 30kms west of Cooktown also relies on the Cooktown business district for much of its needs. Weipa is the region’s largest, fastest growing town. The Rio Tinto bauxite mine, Weipa’s major employer, has been the catalyst for the township’s growth over the past 50 years. The remaining communities are typically smaller service centres that provide essentials to local population and travellers. Bamaga, the exception to the rule, is a small well serviced township at the tip of Cape York Peninsula, a centre around which a number of other indigenous communities cluster. Lakeland Downs, Laura, Hann River, Musgrave, Coen, Archer River, Moreton and Bramwell Junction are important traffic stop-points on the Peninsula Development Road where fuel, food, rest areas, and (for the majority of these places) overnight facilities are available. Major infrastructure investment opportunities include airport improvements, accommodation, port improvements and a wind farm at Archer Point.
The world heritage listing of Cape York would not appear to provide any additional opportunity for the realisation of business centres and infrastructure. The following chapter identifies key mitigation strategies to minimise any adverse impacts.
If a broad acre nomination encompasses communities over large areas of Cape York there may be an opportunity to specifically provide for business centre growth to support the local community. The critical enabling factor would be to ensure the land use and planning approvals minimise potential adverse impacts on world heritage values, without being to onerous in either approval process or approval conditions to affect viability of the enterprise.
In terms of infrastructure, there will be a need for ongoing maintenance of infrastructure and construction of new infrastructure to support communities and facilitate economic growth. This may include:
Tourism and conservation management infrastructure within the world heritage and provided by government (e.g. ranger stations, access roads, rubbish facilities, toilets, interpretive centres and camping grounds).
Tourism sites and facilities within the world heritage area (such as resorts etc.).
24 June 2012 63 Version 3.0
The Potential Economic Benefits of Protecting and Presenting Cape York
Community infrastructure such as water supplies, pipelines, communications towers, powerlines etc.
The key enabling factor will be to ensure that such tourism, conservation and community support infrastructure can be developed within the world heritage area.
Ecosystem Services and Conservation Management The CYSF investment prospectus summarises the opportunity as:
“The future sustainable management of Cape York Peninsula land and ecosystems demands a coherent and coordinated strategy with wide community engagement, which would have the benefits of biodiversity conservation, sequestration of carbon and local employment, particularly on indigenous communities and National Park areas handed to traditional owners.
It would be far more cost effective, and retain the land management processes so necessary for protection of ecosystems, for government to come to a business arrangement with property holders to make payment for Environmental and Ecosystem Services and property management plans and to gazette the land as nature refuges. It would be a negotiated contract between suppliers of ecosystem services (landholders) and a buyer (government). The contract requires the landholder to go beyond the normal duty of care required under the pastoral lease in providing services of future benefit for the wider community.
Where traditional lands are gazetted as National Parks and returned to traditional owners under an agreed management process, a similar ecosystem management approach should be adopted, providing an essential service for both government and community and creating employment.
Develop a structure for payment to enable owners and lessees of grazing properties, traditional owners and Aboriginal Shire Councils to provide environmental services such as water quality improvements, nature conservation and restoration, landscape management and carbon sequestration. A future scenario would be ‘multi-function’ landscapes with environmental and ecosystem conservation allied with controlled/managed commercial activities such as grazing. Hence ecosystem services would provide sustainable market and income opportunities for land managers and indigenous communities.”
There is substantial potential for the management of a Cape York World Heritage Area to provide a significant economic base for the Cape York community in ecosystem services (conservation land management). It is noted that this is not a wealth creating private enterprise but requires public monies, that said, if governments are committed to adequate management of a large scale world heritage area over much of Cape York, this could enable a substantial economic base for the community.
The opportunity includes:
Natural resource and cultural landscape/site conservation management efforts on public land (including employment of rangers etc.).
Natural resource and cultural landscape/site conservation management efforts on private/indigenous lands (including employment of indigenous rangers and pastoralists as land managers).
The opportunity includes local indigenous community members to become trained to manage their own traditional or other lands and other community members (such as pastoralists) to manage their lands or contribute to the management of public lands.
24 June 2012 64 Version 3.0
The Potential Economic Benefits of Protecting and Presenting Cape York
NOTE: Whilst the chapter above identifies substantial current employment and expenditure on ecosystem services/ conservation management it is noted that much of this is project based funding and this inherently implies a volatility of employment and a lack for defined career path and local community stability.
The key enabling factor for this would be for governments to commit to long term funding of conservation management utilising local community staff and creating local expertise, career paths and long term capital and recurrent funding commitments to conservation management programs. The establishment of an agency(ies) with corporate memory and a growing knowledge base for management is desirable.
Carbon Farming The Carbon Farming Initiative is part of the Australian Government’s Clean Energy Future Plan and underpinning legislation came into effect in September 2011 (Australian Government 201249).
It allows for the generation of carbon credits from approved activities that reduce emissions or store carbon on the land. The carbon credits from Kyoto-compliant activities will be able to be sold in international markets. Other activities will be recognised as generating non-Kyoto Australian Carbon Credit Units and these may be used as voluntary offsets or purchased by the Australian government.
Development of the CFI is in its early days in terms of determining what activities will be eligible for earning credits, methodologies and details of how individual land management or farming operations could earn credits. Activities will need to meet additionality criteria (are not already required to meet law (regulatory additionality) or are not activities that are common practice and already widely adopted).
The following four types of projects could be eligible under the CFI:
Agricultural emissions avoidance projects
Projects that avoid emissions of:
methane from the digestive tract of livestock
methane or nitrous oxide from the decomposition of livestock urine or dung
methane from rice fields or rice plants
methane or nitrous oxide from the burning of savannas or grasslands
methane or nitrous oxide from the burning of crop stubble in fields, crop residues in fields or sugar cane before harvest
methane or nitrous oxide from soil.
Landfill legacy emissions avoidance projects
Projects that avoid emissions of greenhouse gases from the operation of a landfill facility, to the extent to which the emissions are attributable to waste accepted by the facility before 1 July 2012.
Introduced animal emissions avoidance projects
Projects that avoid emissions of methane from the digestive tract of an introduced animal or emissions of methane or nitrous oxide from the decomposition of introduced animal urine or dung.
49http://www.climatechange.gov.au/government/initiatives/carbon-farming-initiative.aspx, viewed 21 May 2012.
24 June 2012 65 Version 3.0
The Potential Economic Benefits of Protecting and Presenting Cape York
Sequestration offsets projects
Projects that remove carbon dioxide from the atmosphere by sequestering carbon in living biomass, dead organic matter or soil; or remove carbon dioxide from the atmosphere by sequestering carbon in, and avoid emissions of greenhouses gases from, living biomass, dead organic matter or soil 50’.
The potential for land management and farming activities on Cape York to earn carbon credits under the Carbon Farming Initiative is uncertain at this stage of the development of the details and methodologies of the scheme. It is therefore beyond the scope of this study to predict any potential economic values of carbon farming. It is recommended that future research is conducted on the potential for eligible carbon farming activities Cape York.
Cultural Landscape Management Given the likelihood that the world heritage nomination will include cultural landscape and specific extant cultural values and cultural fabric/material there will be a need for specific cultural heritage management. This management can be largely integrated with the conservation land management above, however there is also the opportunity for there to be additional employment in specific cultural conservation roles.
Tropical Environment Management Training The CYSF investment prospectus summarises the opportunity as:
“With the resources and knowledge of a ‘first-world’ nation behind them, Cape York Peninsula communities are strategically situated to become examples of world best practice in tropical environment management and to pass on their knowledge of sustainable land management to the wider national and international community. Their experience and local ‘know how’ can provide the basis for development of a training network in tropical environment and cultural management and also provide opportunities for cross-cultural training programs for corporations and governments. A long term opportunity would involve development of training venues and programs demonstrating world best practice in tropical land management based at Bamaga TAFE and other community centres such as Kowanyama, Western Cape College, Lockhart River. Training would be designed to attract Australian and international participants. Local people, and particularly community elders, would need to play a key role in course development and delivery. Similarly, cross-cultural training could be offered for corporations, schools and government agencies. Such an enterprise would have a far-reaching impact on the future economy of the region as it would encompass a wide range of activities including land and resource management, scientific and environmental studies and site interpretation, people management and tourism, structured tourism delivery and marketing, customer services, catering and hospitality, specialised accommodation development and management. It would require a long term partnership of communities, conservation interests, government and private/commercial interests which could be expected to have long term positive economic and social outcomes for Cape York Peninsula communities.”
50 http://www.climatechange.gov.au/government/initiatives/carbon-farming-initiative/activities-eligible-excluded.aspx, viewed 21 May 2012

24 June 2012 66 Version 3.0
The Potential Economic Benefits of Protecting and Presenting Cape York
As noted above, there is substantial potential for the management of a Cape York World Heritage Area to provide a significant economic base for the Cape York community in ecosystem services (conservation land management). This opportunity could extend to offering training.
The key enabling factor for this is that governments commit to long term funding of conservation management utilising local community staff and creating local expertise, career paths and long term capital and recurrent funding commitments to conservation management programs. Further the opportunity could be realised with the establishment of “on Cape” training for conservation management expertise.
Initially this can be used to train local Cape York residents in conservation management to maximise local community participation in the management of the world heritage area. Once the core management team is established and local participation in this is substantial then the training programs and facilities can have a role in ongoing training of local community youth for involvement of conservation management on cape York and also become training enterprises for training Cape York youth to work “off Cape” in conservation management and training “non Cape” participants to work in conservation elsewhere (particularly tropical savannah Australia).
Research In addition to the conservation management and training opportunities above it is noted that there are likely to be ongoing research opportunities for understanding the natural and cultural values of Cape York, their integrity, threatening processes and conservation needs. Such research could become an economic benefit to the Cape York community particularly if there are field study stations established which have local community managers and research assistants etc. (noting that often the prime research leaders are likely to come from an “off Cape” university or other research institutions).
The key enabling factor for this is for governments to commit to long term funding of conservation management including “on Cape” management oriented research involving the local research facilities. The opportunity can only be realised as an economic benefit to Cape York with the establishment of “on Cape” research facilities which involve employment of locally based staff (in addition to “off Cape” research experts who may visit a research facility for short periods).
Maximising Economic Opportunities The table below sets out a summary of potential economic opportunities and their enabling factors. The section below this further discusses some aspects related to maximising economic benefits from world heritage listing.
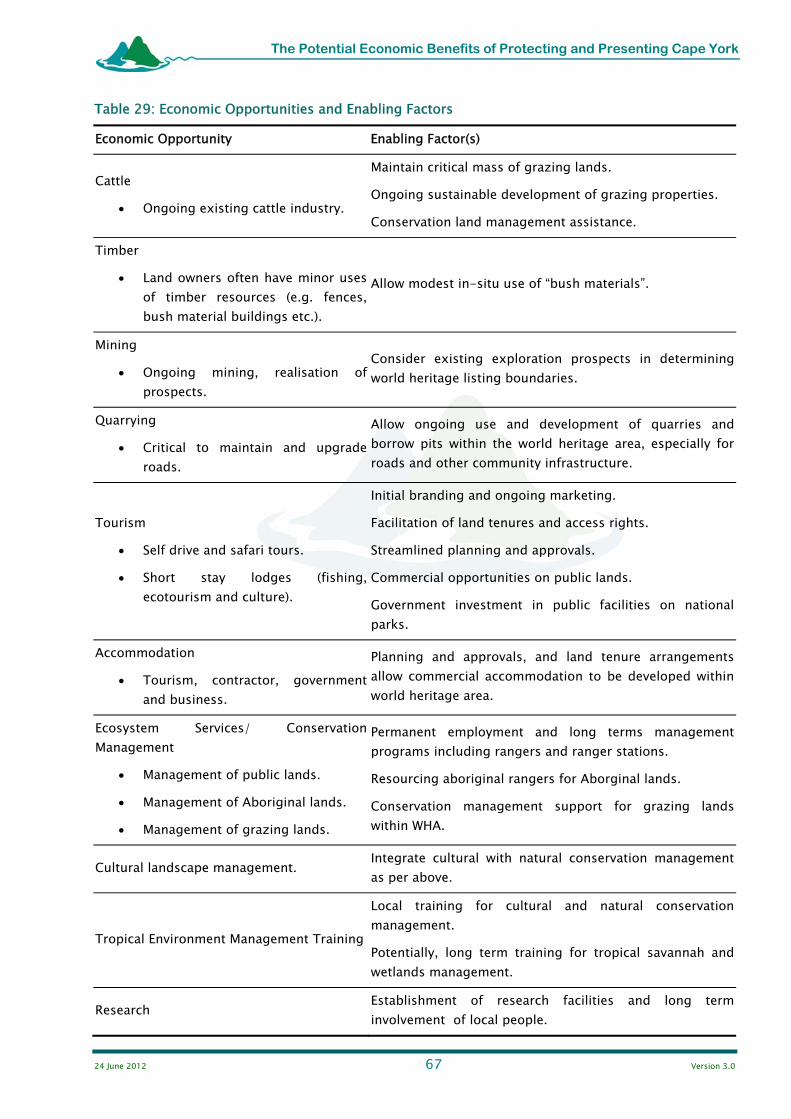
24 June 2012 67 Version 3.0
The Potential Economic Benefits of Protecting and Presenting Cape York
Table 29: Economic Opportunities and Enabling Factors
Economic Opportunity Enabling Factor(s)
Cattle
Ongoing existing cattle industry.
Maintain critical mass of grazing lands.
Ongoing sustainable development of grazing properties.
Conservation land management assistance.
Timber
Land owners often have minor uses of timber resources (e.g. fences, bush material buildings etc.).
Allow modest in-situ use of “bush materials”.
Mining
Ongoing mining, realisation of prospects.
Consider existing exploration prospects in determining world heritage listing boundaries.
Quarrying
Critical to maintain and upgrade roads.
Allow ongoing use and development of quarries and borrow pits within the world heritage area, especially for roads and other community infrastructure.
Tourism
Self drive and safari tours.
Short stay lodges (fishing, ecotourism and culture).
Initial branding and ongoing marketing.
Facilitation of land tenures and access rights.
Streamlined planning and approvals.
Commercial opportunities on public lands.
Government investment in public facilities on national parks.
Accommodation
Tourism, contractor, government and business.
Planning and approvals, and land tenure arrangements allow commercial accommodation to be developed within world heritage area.
Ecosystem Services/ Conservation Management
Management of public lands.
Management of Aboriginal lands.
Management of grazing lands.
Permanent employment and long terms management programs including rangers and ranger stations.
Resourcing aboriginal rangers for Aborginal lands.
Conservation management support for grazing lands within WHA.
Cultural landscape management. Integrate cultural with natural conservation management as per above.
Tropical Environment Management Training
Local training for cultural and natural conservation management.
Potentially, long term training for tropical savannah and wetlands management.
Research Establishment of research facilities and long term involvement of local people.

24 June 2012 68 Version 3.0
The Potential Economic Benefits of Protecting and Presenting Cape York
Economy Fundamentally there is a challenge for world heritage listing of Cape York to result in an economic benefit to the region and allow communities to gain their livelihoods from the area either unrelated to conservation/world heritage or as a consequence.
Cape York has a tyranny of distance, whilst the large scale natural landscapes are the very foundation of its natural values, including the wilderness aspects, this creates a remoteness for any economic activity.
Further, whilst conservation is a major goal for Cape York, so is regional development. The present population is not sustained by internal economic activity with a major proportion of the population reliant on welfare, unemployed or underemployed and with many small businesses barely viable.
Mining remains the largest, concentrated activity, mostly on the western Cape and is not considered in any detail here. The decision on boundaries and the management of any world heritage listing of Cape York will need to resolve where potential new mines can occur. The recent Wild Rivers declaration of the Wenlock has shown the Government’s inclination to ensure conservation of natural values, without necessarily, prohibiting mining in the area, certainly ensuring conservation is the priority.
According to the Cape York Peninsula Land Use Strategy (1997) about 84% of Cape York is used for extensive agriculture and traditional indigenous use, whereas only 3% is used for intensive agriculture and mining with a further 2% towns and services areas. The remainder is nature conservation which has grown with the declaration of new parks since the 1997 CYPLUS report. The CYPLUS report had an economic vision (for 2010!) with a “reconciled and harmonious community where the residents have achieved a vibrant broad, sustainable economy that supports the needs and aspirations of residents lifestyles”. The vision outlines a range of aspects to achieve this including tenure security, conservation of nature and culture with multiple land use, retention and re-investment of local economic benefits, development of a skilled workforce, provision of transport and service infrastructure and cooperative/partnership approaches.
It is concluded that CYPLUS’s Economic Vision for Cape York (to be achieved by 2010) could still apply today. Whilst there has been much achievement toward the vision, with major initiatives such as the upgrading of roads and tenure resolution, there is still a long way to go.
World heritage listing is not an economic outcome in itself, however there is an opportunity that the process for consideration of world heritage listing and the proposed management regime (including land use controls, infrastructure, access and services) can understand the consequential impacts and attempt to maximise the opportunities for economic development.
Tourism Positioning and Development There are examples worldwide where world heritage listing has been an important aspect of the branding and tourism positioning of natural and cultural sites. Fundamentally, from a potential tourist’s perspective if an international body has recognised the global significance of a place, it may be worth seeing! However, there often needs to be major efforts on the branding and then significant investment in the actual delivery of the tourism product (access, infrastructure, human resources etc.) for any realisation of a benefit to the local community and economy.
Cape York has a challenge with tourism, its value is the large scale landscapes and consequently the highly scenic places/attractions (be they waterholes, beaches, headlands, rock art, mountains or rivers) are widely separated. The challenges for this have constrained growth of tourism, ventures even where there are close attractions and access such a Pajinka Lodge had difficulties.
24 June 2012 69 Version 3.0
The Potential Economic Benefits of Protecting and Presenting Cape York
It is concluded that there are many challenges for tourism development on Cape York. The world heritage listing could provide some focus to the better establishment of a Cape York tourism brand, however much more effort in development of tourism products in terms of infrastructure (both on public land such as national park facilities and private such as camp sites, lodges etc.) and access (roads, coastal and marine facilities etc.) will be required to realise any greater tourism potential.
Compensatory Infrastructure Development In many cases of world heritage listing some form of compensation has been offered to impacted communities. In the Wet Tropics example there was a structural adjustment package for the local businesses and communities affected by the cessation of rainforest logging. In the Cape York example there is not necessarily a dominant land use or economic driver which will cease with listing. Having said that governments (State and Commonwealth) may be encouraged to provide increased expenditure on infrastructure development with the focus of the Cape at the time of and immediately following world heritage listing.
The ongoing development of the main roads, national park and coastal recreation facilities are examples of such infrastructure development. Apart from the major roads and infrastructure, small scale infrastructure such as a track to an attraction in a national park, a boat ramp, a community water supply can have significant local benefits.
There may be opportunities for significant benefits to arise should there be a package of large and small scale community and tourism infrastructure developed as part of world heritage listing and its initial management.
Lease Surety and Flexibility The Cape York Peninsula Heritage Act 2007 has the provisions which allow the longer term pastoral leases (75 years) in exchange for conservation and agreements with traditional owners (in the Area of International Conservation Significance, AICS). This may present a significant opportunity for leaseholders, particularly if there are long term commitments by government to support the financial costs of conservation measures (such as fencing off a rainforest pocket or wetland etc.). However there may be increased land management obligations to achieve the conservation outcomes and if there is no surety of financial assistance for natural resource and conservation management the obligations on leaseholders may outweigh the benefit of the longer leases.
In other places, such as the Gulf Savannah (e.g. the Savannah Guides), the Northern Territory and Willandra, pastoral lessees have diversified their use to include tourism, from hosting visitors at homesteads to providing access to bush camping, running boat cruises on a billabong to even the creation of a private nature refuge and ecolodge (e.g. Arkaroola in South Australia). Undertaking such activities as part of a pastoral lease is often not allowed. The Department of Environment and Resource Management have a policy which allows for very modest tourism on pastoral leases. There may be an opportunity for the new leases to allow for some minor tourism uses of pastoral leases in a manner which provides a mechanism for pastoralists to diversify their business and gain some benefit from tourism.
There may also be a desire by some pastoralists to have other farming activities on their land (such as fruit crops, fish ponds etc.) which may otherwise be restricted by their lease conditions. There may be an opportunity in resolving the new leases to include some flexibility for these other minor (in terms of area of activity as a proportion of the lease area) activities.
24 June 2012 70 Version 3.0
The Potential Economic Benefits of Protecting and Presenting Cape York
It is clear from the provisions in the Cape York Peninsula Heritage Act 2007 regarding leases within the AICS being able to have the 75 year terms that it is envisaged that the world heritage Area may/will include pastoral leases. There is an opportunity to ensure that leaseholders have support to meet conservation and natural resource management obligations under the new leases and provide some flexibility to allow entry into tourism or other agricultural activities.
Tenures There are a variety of specific land tenures on Cape York which are not dealable freehold. In other words, a land owner may find it difficult to establish a business on land where the security of the land title can be offered for a mortgage. It is important to recognise that lenders, be they investors, banks and even Indigenous Business Australia require security against loans. This single aspect is potentially the most significant for local entrepreneurs to be able to establish micro/small businesses such as safari/cultural camps, lodges etc.
It is vital that a set of potential lease arrangements which can be established over Aboriginal Freehold, DOGIT and other tenures across the Cape, as well as the excision of small, specific purpose lands from pastoral leases be developed and made widely known as a mechanism to implement opportunities. Further, the provision of leases/concessions on public owned land needs to be made more available to realise significant tourism growth.
Appropriate tenure arrangements are the key enabling factor for facilitating tourism growth and realising an economic benefit.
Land Management Assistance While discussed above as part of the lease agreements, long term commitments by government to support the financial costs of conservation measures (such as fencing off a rainforest pocket or wetland etc.) and natural resource management (fire, weeds, ferals etc.) is a significant opportunity.
One important aspect is to maximize the opportunity by developing long term programs for such land management assistance. There is presently a program of land and sea country rangers on various aboriginal lands and also the Wild Rivers rangers. For both indigenous and pastoral lands, long term programs which allow the employment and training of permanent staff and resourcing of their equipment and supplies for natural resource and conservation management is far preferable to programs which provide grant funding on a short term project basis. Such short term project funding does not create a long term capacity and economic activity on the Cape.
The Savannah Guides program has shown how the pastoral community can adopt tourism and provide a unique interpretive program, in a similar way, there could be an opportunity for some form of “Ranger” program where pastoral leases or nominated staff are appointed to a role for conservation management or interpretation/presentation of the areas of nearby areas of the world heritage area (both those that include the Pastoral lease and other nearby public lands within the world heritage area.
Near Rockhampton, pastoralists who ran cattle on various properties successfully transitioned to become “range managers” of Shoalwater Bay Training Area when their lands were acquired by the Commonwealth for military training. The training area is a large scale, natural landscape with conservation of natural values a major focus of its management. The range managers have a diversity of natural resource management and conservation responsibilities.
24 June 2012 71 Version 3.0
The Potential Economic Benefits of Protecting and Presenting Cape York
The world heritage listing of Cape York could be an opportunity for State and Commonwealth governments to establish an integrated and long term program of natural resource and conservation management assistance to indigenous and pastoral land holders. Such a program if well resourced and long term could from the backbone of world heritage management, be a major economic input to the Cape and result in substantial capacity building, employment, career paths and empowerment for local residents.
Access The current road infrastructure development plans include:
Continue to extend bitumen seal and upgrade floodways on Peninsula Developmental Road to complete sealing of the road to Laura. Works include: sealing 4km of road and construction of a bridge at Carols Crossing over the Laura River, sealing 1km of road and bridge construction at Ruths Creek and commencing construction of a low-level causeway at the Laura River to improve safety and access.
Commence construction of an unsealed section of Northern Peninsula Road between Captain Billys turn-off to Sailors Hill.
Commence road and drainage improvements on Lockhart River Access Road between Pascoe River and Browns Creek.
Commence road and drainage improvements on section of Pormpuraaw Access Road. Commence construction of a new bridge and approaches at the Bloomfield River crossing at
Wujal Wujal.
It is important to recognise that access is a key component for the Cape, in terms of vehicle type (road condition) and seasonality. Cape York Sustainable Futures is currently campaigning to have the road sealed by 2020. However government has not committed to this. The key aspect is to reduce seasonal closures and allow access year round.
Indigenous Employment Potential Indigenous employment This section examines the potential for greater Indigenous employment as a result of increased tourism and conservation management expenditure. As outlined below, the proportion of new jobs that would go to Indigenous people is (unfortunately) likely to be very low. No separate analysis of indigenous employment is included in the economic impact assessment.
A recent report by Stoeckl et al. (2011) examined and modelled Indigenous and Non-Indigenous household income and employment in the Daly River and the Mitchell River catchment regions in northern Australia. The Mitchell River catchment overlaps with the Cape York area of interest for this study. Therefore findings from the Stoeckl et al. report are relevant to understanding possible impacts on Indigenous employment of increased economic activity in Cape York.
The overall findings of Stoeckl et al were that: 'There is an asymmetric divide between Indigenous and Non-Indigenous economic systems in Northern Australia. Given the lack of employment and business opportunities, workplace skills, and the other infrastructure prerequisites for development, local Indigenous people are very unlikely to benefit from the stimulus of any of the north's existing industries. This situation is likely to persist unless, or until, there is structural change' (Stoeckl et al 2011, p. 9).
To model the effects on household income and employment with an expansion in economic activity, Stoeckl et al used Input-Output Analysis using a model that they built for the study. It has 10 industry sectors and also separates results for Indigenous and Non-Indigenous households.
24 June 2012 72 Version 3.0
The Potential Economic Benefits of Protecting and Presenting Cape York
The modelling showed the impact on household income with a $1 increase in final demand. In general, it was observed that the sectors to benefit most from a $1 increase in final demand are the retail; finance and Non-Indigenous household sectors. It was observed that 'very little money ever flows from Non-Indigenous householders or businesses to Indigenous households (Stoeckl et al. 2011, p. 69). Significantly, it was also found that when payments directly to Indigenous households increase, Non-Indigenous households capture more of the flow-on multiplier effects than Indigenous households.
Employment multipliers generated by Stoeckl et al. show that only a small proportion of new jobs were likely to go to Indigenous workers. Under the assumption of the analysis that the structure of the economy would remain constant, and the current level of Indigenous involvement in the labour market employment would prevail, new employment was projected per additional 1 million dollars expansion of the following sectors51:
Transport: 22 new jobs, of which 1 would go to Indigenous employees. Trade: 16 new jobs, of which 1 would go to Indigenous employees. Mining: 12 new jobs, of which 1 would go to Indigenous employees. Government: 24 new jobs, of which 7 would go to Indigenous employees. Finance: 13 new jobs, of which 1 would go to Indigenous employees. Electricity: 12 new jobs, of which 1 would go to Indigenous employees. Culture: 31 new jobs, of which 2 would go to Indigenous employees. Construction: 22 new jobs, of which 1 would go to Indigenous employees Agriculture: 21 new jobs, of which 2 would go to Indigenous employees. Accommodation: 31 new jobs, of which 2 would go to Indigenous employees
The result of modelling employment for the Daly River catchment showed similarly low projections of potential Indigenous employment, although they were marginally higher than in the Mitchell River catchment due to a currently higher Indigenous involvement in the labour market.
It can be concluded that unless there are significant changes made in the structure of regional economies and deliberate measures taken to increase the likelihood of new jobs being filled by Indigenous people, any expansion in economic activity will mostly benefit Non-Indigenous people.
Conservation Management There has been a concerted effort to train and engage indigenous people of Cape York in land and sea conservation, caring for country type programs. It is expected that any world heritage listing would involve a cooperative management program with traditional custodians and indigenous “rangers”. Given this it may be hoped (“assumed”) that a significant proportion of the modelled expenditure on conservation management may result in some growth in indigenous employment beyond the conclusions of Stoek et al above.
Health and Wellbeing Benefits of Indigenous Involvement with Land and Sea Management While expenditure by government on conservation management is shown as a cost in the cost benefit type presentation, there may be positive benefits from employing Indigenous people if there are health and wellbeing benefits associated with this employment. Health benefits can be given a dollar value by measuring treatment and other costs avoided.
However it is beyond the scope of this study to place a dollar value on potential benefits. Wellbeing benefits are less tangible in economic terms and are also outside the scope of this study. Therefore, the economic benefits of Indigenous employment are included in descriptive terms in the cost benefit type presentation. This section provides justification of this inclusion.
51 The numbers of jobs are interpreted from a graph in Stoeckl et al. and represent a close approximation.

24 June 2012 73 Version 3.0
The Potential Economic Benefits of Protecting and Presenting Cape York
A number of studies have established benefits to Indigenous people who participate in Indigenous cultural and natural resource management (ICNRM). This includes Traditional Owners and people who return to country or live on country and participate in land and sea management, including those who may be employed as rangers in targeted programs. This is relevant to the economic study as there are likely to be benefits not usually measured in dollar terms of increasing the involvement of Indigenous people in conservation management.
Garnett and Sithole (2007, p. 1) found that 'People taking part in customary and contemporary land and sea management practices, particularly those living in traditional homelands, were much healthier, including lower rates of diabetes and lower risks of cardiovascular disease. The landscape where ICNRM is practised was also in better condition according to several measures of landscape health'.
As part of the study conducted on Healthy Country, Healthy People, there was an examination of the health status of people from Maningrida and this was correlated with their self reported involvement in ICNRM. Increasing participation in ICNRM had an inverse relationship with body mass index, and risk factors associated with diabetes and cardiovascular disease. While there is a call for more study involving larger groups over time, it was concluded that: 'Nevertheless the evidence is sufficient to support the proof of concept that investment in ICNRM appears to be an important strategy for the prevention of chronic diseases and their complications. Even from a narrow economic perspective would result in substantial direct savings from health care costs saved and reduced individual and social impacts' (Garnett and Sithole (2007, p. 28).
A review of studies on Indigenous health and wellbeing by Ganesharajah (2009) examines some of the formal Indigenous natural resource management programs, in particular the Indigenous Protected Areas (IPA) scheme. She reports that: 'The potential benefits of the IPA scheme are significant on a range of levels - social, cultural, environmental, and economic. An evaluation of the IPA scheme found that 95% of communities involved in IPA reported economic benefits and 74% reported that IPA assisted in the reduction of substance abuse and contributed to functional families. Factors such as substance abuse and a functional family have obvious links to health and wellbeing. By positively influencing these factors, the IPA scheme has the capacity to positively influence health' (Ganesharajah 2009, p. 25).
However, it is not a simple matter that employment of Indigenous people in conservation management is all positive.
Stresses and issues arise due to the low level of pay, uncertainty of engagement and lack of opportunity to progress as outlined in the report by Sithole et al. 2007.
Consequential Economic Development Long Term Commitment Ensures Stable Communities The achievement of an economic benefit from world heritage listing will be to maximise the consequential economic benefits. This will mean community growth as a result of the increased employment and economic development. However this can only be realised is the consequential benefits such as local retail and services sector growth owing to increased employment/economic activity is facilitated and not prohibited.

24 June 2012 74 Version 3.0
The Potential Economic Benefits of Protecting and Presenting Cape York
Ten rangers and five tour guides creating fifteen jobs needs to be able to facilitate families living in a community and the establishment of services such as a shop, mechanics etc. In small communities these are often micro-businesses with little capital and little capacity for long and uncertain approval processes. It is vital that the world heritage area and associated communities allow for this activity and note that tenure arrangements need to provide for such micro business enterprise to thrive. There is a further need for government health and education services to extend to and accommodate (sometimes remote) community growth so these vital aspects do not become a constraint on communities achieving a critical mass with economic vitality.
24 June 2012 75 Version 3.0
The Potential Economic Benefits of Protecting and Presenting Cape York
Potential Impacts
This chapter discusses the potential economic impacts which could arise from world heritage listing and identifies potential mitigation strategies.
Changes in Land Use There are apparent concerns by some stakeholders regarding a general move to national park/nature reserve status, lease conditions and conservation controls (such as wild rivers) and other aspects which it is perceived affect economic land uses. Lease conditions may restrict additional land uses. The listing of a world heritage area may result in restricted access or closed access to areas, approvals and zoning may affect ability for new land uses and buffer zones may increase the effect on non-conservation land uses beyond the actual world heritage area.
These aspects may impact upon Cape York’s current economy and/or economic potential, however whilst the proposed boundary is unknown and management arrangements undefined this is hard to evaluate.
The most significant perception of land use change would be the loss of grazing rights. There is a pro-active program of developing nature refuge agreements with pastoral leaseholders. On the face if it this provides some conservation effect and ensures that the pastoral activity can be maintained whilst achieving real conservation outcomes and commitments from the pastoralist to sustainable land management practices. There remains a tension between the long term commitments required by pastoralists versus the one-off project funding for sustainability initiatives provided when the nature refuge agreement is initially established.
There are other land use changes which are more subtle. What is a esplanade or reserve, available for economic activity such as beach hire, tourism etc. may be restricted as the land use restrictions give effect to a greater conservation regime.
The protection and presentation of an area as world heritage may have a consequential adverse impact on allowable land uses such as forestry, mining, agriculture, water storage and abstraction and this could result a loss of potential economic growth.
In terms of current activity, it is possible that existing uses could have a transitional arrangement to mitigate the immediate impacts.
In terms of future uses, the only economic mitigation is for government compensation to businesses and communities where existing land uses which have financial and economic contribution are prohibited or constrained. On a more regional or macro sense, the economic growth and benefits via government expenditure on conservation and resulting from tourism growth as a consequence of world heritage listing could possibly mitigate by replacing economic activity, however this does not mitigate specific impacts on employees, businesses and community where activities are phased out.
In terms of land use changes associated with world heritage listing the key mitigation strategy will be to ensure any restriction on allowable activities and land uses takes into account economic impacts of actual and potential activities and where there is an impact provide compensation.

24 June 2012 76 Version 3.0
The Potential Economic Benefits of Protecting and Presenting Cape York
Tenure The CYTRIG process has involved acquisition of land and which has been converted to national park or aboriginal freehold. In general there has been a move in land tenures toward greater conservation protection and more formalising the use rights. The process is slowly clarifying the likely long term make up of tenures on the Cape, although each acquisition under CYTRIG results in specific negotiations between the traditional owners and Government with no pre-determined outcome.
As discussed above, most leases are for a specific purpose and may require renegotiation to amend conditions for any change of use.
This report does not address the complex nature of Aboriginal/native title lands other than to recognise that the process on Cape York involves a variety of entities including Prescribed Body Corporate (and/or Registered Native Title Body Corporate) who hold native title, Aboriginal Land Trusts (holding Aboriginal Freehold and Aboriginal corporations (holding pastoral leases etc.). It is noted that more than one of these organisations may exist (often with common membership) for a parcel of land (e.g. where there has been a successful native title determination on Aboriginal freehold land).
Fundamentally there is often a concern by stakeholders that world heritage listing is a tenure in itself, and can change current tenures. World heritage listing, in the case of Cape York is unlikely to be a land tenure. However there are likely to be tenure implications as government decisions on changes to tenure in the future would need to take into account the world heritage status.
The land tenure situation in Cape York is evolving, with the protected area estate growing and aboriginal freehold lands being established. Whilst world heritage is not a tenure in itself, however there may be consequential impacts on future tenure dealings within and adjacent to the world heritage area.
In terms of land tenure arrangements associated with world heritage listing the key mitigation strategy will be to ensure any restriction on tenure types and allowable activities and land uses and future land dealings takes into account potential economic impacts.
A critical mitigation strategy would be to ensure land tenures allow alienation of lands to specific owners for economic activities in a manner which allows the land to be offered and security for raising capital funding.
Approvals The approvals regime likely for a Cape York world heritage area will depend upon the proposed boundary and the tenure types within it. It is likely that there will need to be a conservation planning/approvals/zoning regime for all lands other than national parks within the world heritage area (this is most likely necessary to meet the protection and management requirements of the Operational Guidelines).
Given this it is most likely that some form of additional approvals will be required for land uses changes and development activities within and possibly adjacent to the world heritage area. It is possible that this will involve some form of statutory management plan which establishes an additional approval process. It is most likely that would be given effect under Queensland legislation.
The Commonwealth Environment Protection Biodiversity Conservation Act would also be applied. The Commonwealth could form an agreement with Queensland to accredit State development approval processes for minor and routine development approvals, however for major activities the Commonwealth would be likely to require the EPBC assessment process to be run by DSEWPAC.

24 June 2012 77 Version 3.0
The Potential Economic Benefits of Protecting and Presenting Cape York
There may be some development proposals which require approval under existing State planning approvals, some additional state level “World Heritage” approval and also, in some cases Commonwealth EPBC approval.
Under current development approvals small businesses and community groups find it hard to obtain development approvals under the Sustainable Planning Act owing to the remoteness and difficulty to cost effectively obtain required specialist advice. Environmental, planning and engineering consultants become prohibitive for small projects given the additional costs with the remote locations. It is likely that this will be exacerbated with world heritage listing likely to result in additional approvals and/or a higher level of documentation and assessment of potential impacts.
Current development approval processes are already an impediment for small business and communities on Cape York, world heritage could exacerbate this. A key mitigation strategy would be to have streamlined approval processes and some form of advisory service or subsidy for professional advice.
Land Management As discussed above, there is an opportunity for Cape York that the focus on the protection and management of world heritage values will result in greater resources for land management. There will undoubtedly be an increased emphasis on natural habitat protection, with requirements relating to fences, access, water/riparian/wetlands/coast, vegetation retention/rehabilitation, fire, weeds, feral animals and erosion and sediment control.
It is highly likely that for lands within the world heritage area there will be a substantial emphasis on natural habitat protection (including fences, access, water/riparian/wetlands/coast, vegetation retention/rehabilitation, fire, weeds, feral animals, and erosion and sediment control). There are likely to be requirements on lands adjoining the world heritage area as well.
The key mitigation strategy would be to ensure that any requirements for land management imposed on land owners (as a result of world heritage listing and that is beyond the land owners present obligations for land management) are adequately resourced by government such that there is no financial burden on land owners.
Access For a remote and huge area such as Cape York access is a major issue. CYPLUS Stage 2 outlined a suite of major strategies for roads and transport. This includes a range of road upgrading requirements and the recognition of the key role shipping and airport facilities play in regional development and the creation of a sustainable economy.
The ongoing maintenance of roads and other access needs to be considered, borrow pits etc. for gravel re-sheeting of existing roads and new roads need to be considered. Given the broad acre listing likely for Cape York it will be unworkable to have a policy of obtaining such gravel resources from “outside” the world heritage area. There are precedents both in Australia and world-wide where this sort of minor quarrying is permitted for maintenance of essential infrastructure. Similarly water is needed for road maintenance and a pragmatic approach to allowing minor and/or irregular water extraction for such purposes will be needed.
24 June 2012 78 Version 3.0
The Potential Economic Benefits of Protecting and Presenting Cape York
There is an ongoing need for major roadwork and upgrading including improved routes new bridges, flood immunity works etc. There are likely to be many reasons for new roads and access to be desirable and/or necessary and as such the management of the world heritage area needs to have a framework which does not constrain access to the existing network but does have provision for consideration of major upgrading of existing and construction of new roads, this may be a realignment of a major road to gain a safer geometry, a new access road to a boat ramp/ campsite/ attraction /farming area/aboriginal outstation etc.
Access is not restricted to roads, marine and boating facilities on Cape York are presently limited, however there may be a desire for new small port facilities and/or recreational boating facilities such as boat ramps, landing pontoons, berths, boat harbours, wharves, marinas and even in some instances dredged channels for safe navigation across river mouths etc. Whilst a Port of the scale of Weipa’s is unlikely to be proposed anywhere else, smaller scale facilities are likely to be required to realise Cape York’s economic potential (at least to provide good livelihoods for the present population).
Activities such as forest clearing for roads, riparian disturbance for bridges, dredging and removal of marine plants for marine facilities and hard rock quarries for the sealing of roads and airstrips are likely to be needed within the world heritage area, obviously the environmental impacts need to be understood, assessed and mitigation strategies implemented but it will be important for the world heritage area not to have a blanket prohibition on these types of activities associated with access.
A fundamental mitigation strategy to avoid any economic impediments from world heritage listing would be to ensure the management regime allows and does not overly constrain the ongoing maintenance, upgrading and further development of access roads, airports and marine facilities.
Community Services The size and dispersed nature of settlement in Cape York makes for a major challenge to provide services. The CYPLUS Stage 2 vision outlines the need for access to a high level of quality human services. The services that may be required include new water extraction and water pipelines, water supply/storage dams and reservoirs, powerlines, telecommunications cables and towers and community facilities (health, education, recreation, municipal functions, public open space etc.).
Given the size and remoteness of Cape York and the dispersed nature of communities and settlement patterns, services are a critical issue to providing for community livelihoods. In order to mitigate potential impacts on community services, world heritage management would need to provide for the ongoing maintenance, upgrading and further development of services to support thriving communities.
Grazing A major proportion of Cape York is used for grazing cattle. There are many programs in place to encourage good natural resource management and sustainability of the land use. These are not discussed in any detail here.
Given the Cape York Heritage Act envisages that the AICS will include pastoral leases, it is likely that at least some areas of some cattle stations are likely to be included in the world heritage area. This then create a series of issues which will need to be addressed. Fundamentally, if the whole of a pastoral lease is not included in the world heritage/AICS area how the 75 year lease provisions will operate needs to be determined.
24 June 2012 79 Version 3.0
The Potential Economic Benefits of Protecting and Presenting Cape York
Given the example of the Wet Tropics where over time the policies changed and as it was found impractical to exclude cattle from areas of conservation value (e.g. rainforest) a policy to stop grazing and not renew leases was enacted, there may need to be longer term certainty of the outcomes for grazing on Cape York.
The viability of the cattle industry has not been assessed as part of this study. Once all the public land acquisitions are completed will there remain a viable industry is a critical consideration in determining the overall impact on the industry. Particular issues include road maintenance, where four properties justified road maintenance if only one is left at the end of the road, will the roads be maintained for this lone property? How much this is an issue has not been determined, but it has been raised by stakeholders.
Consideration of this includes the support services, from the local roadhouse to specific services such as agricultural suppliers which as the numbers of pastoral properties decline become unviable or are located further away.
The viability of an individual property after the conservation and land management needs to protect world heritage values of the world heritage area in or adjoining a pastoral lease could be affected. be determined. There could be situations where a property is no longer viable? Restrictions on water extraction, pasture crops, access and fire regimes may be issues which affect viability of an individual property. How much this is an issue has not been determined, but it has been raised by stakeholders.
There will undoubtedly be an increased emphasis on natural habitat protection, with requirements relating to fences, access, water/riparian/wetlands/coast, vegetation retention/rehabilitation, fire, weeds, feral animals and erosion and sediment control. In order to mitigate any financial burden on graziers, this would require additional resources in the form of grants etc. to ensure the obligations (which are beyond the “normal” land stewardship obligations) do not affect the viability of the pastoral use.
There remain a range of uncertainties with potential listing of Cape York and the viability of the cattle industry on Cape York. At the Cape scale, the viability of the pastoral industry needs to be considered, at the property scale the implications of and support for any increased land management obligations to protect world heritage values would need to be addressed.
There are further considerations regarding the future potential of properties, new uses as technologies and pastoral techniques evolve and improve. Within the context of lease conditions, nature refuge agreements and the land uses allowed under the world heritage management regime there may be a case for long term flexibility to allow for this innovation.
The major mitigation strategy is to allow continued grazing on most lands currently grazed. This does not preclude conservation management of world heritage values, particularly where these are wetlands, riparian areas, vine thickets and other habitats on pastoral properties which are not grazed by cattle. Where stocking densities, fires regime or fencing off of areas from grazing affects the viability of a cattle property, acquisition of the property or some form of payment for conservation management and/or compensation for loss of grazing income could mitigate impacts. On a regional level, consideration may need to be given to the industry viability if the overall area available for the industry is significantly reduced.

24 June 2012 80 Version 3.0
The Potential Economic Benefits of Protecting and Presenting Cape York
Fisheries, Aquaculture and Agriculture The world heritage listing of Cape York would not appear to be a potential impact on current fisheries aquaculture and agriculture activities. However the potential impacts on future opportunities would require understanding of the boundaries and management regime.
Mitigation would require allowing fisheries, aquaculture and agriculture activities to continue and/or be developed. Even if minimal impact and undertaken in an ecologically sustainable manner they may have unacceptable impacts on the integrity of world heritage values. In many other world heritage areas these types of activities are prohibited or restricted.
Forestry/Timber The conservation regime inherent with world heritage listing is likely to prohibit large scale timber extraction from within the world heritage area. There is no major forestry industry within areas understood to be likely to be included within the world heritage listing, however there is modest use of timber resources for bush camps, fences and other structures on grazing and aboriginal lands within the potential world heritage area.
The key mitigation strategy would be to allow modest in-situ use of timber resources on lands within the world heritage area such that “bush materials” structures may be constructed and maintained for otherwise approved uses.
Mining The conservation regime inherent with world heritage listing is likely to prohibit large scale mining from within the world heritage area. There remains the possibility for an impact on the economic potential of Cape York if potential mines are included within the world heritage area and subsequent development is restricted or prohibited.
The key mitigation strategy would be to allow existing mines and recognised prospects to be developed. Or at the time of world heritage listing to ensure the world heritage listing does not include viable/potential mining prospects. It is recognised that this is a challenge firstly to identify which prospects are viable and secondly to ensure potential environmental impacts do not adversely affect the integrity of world heritage values.
Quarrying Quarrying has a critical role in supporting the economy of Cape York. The vast road network is maintained and upgraded using locally sourced quarry materials. The experience of local governments with the Wet Tropics World Heritage Area has been that quarries and borrow pits within the world heritage area have been progressively shut down and new sites have not been approved. This has created major additional expenditure for local governments and road managers.
The key mitigation strategy would be to recognise the vitally important role local borrow pits and hard rock quarries have in maintaining and developing roads and other infrastructure and thus to allow existing and new sustainably managed (minimal environmental impact) quarries and borrow pits which support local roads and infrastructure.
24 June 2012 81 Version 3.0
The Potential Economic Benefits of Protecting and Presenting Cape York
Tourism As discussed in the Opportunities section above, tourism has the potential to grow in Cape York and for some areas provide a significant contribution to the local economy and provide for local livelihoods. There are however many aspects and issues which may need resolution.
There are examples world wide of ecotourism and sustainable tourism in world heritage areas. Models for appropriate tourism include Australia’s EcoCertification and the Global Sustainable Tourism Criteria. In the discussion below, it is assumed that tourism development on Cape York occurs in a manner which is sustainable and presents world heritage values (as required by the Operational Guidelines). Further, it is noted that many world heritage areas have very intensive and high levels of visitation (which does require impact reducing infrastructure and management), and as such it is assumed that tourism could grow in many areas of Cape York without adverse effects on world heritage values.
Fundamentally tourism needs access. Given a lot of the existing and potential tourism is by self drive vehicles this means public roads and tracks. Access to coasts, rivers etc. for vessels is also fundamental. Whilst at present air access is not a major aspect of the tourism on Cape York, should cost effective scheduled commercial flights be developed to key destinations, there may be more opportunities for “fly-in” tourism.
Access is not just roads, airstrips and boating facilities it also involves access to the attractions and the ability to use areas for activities.
Once there is access, facilities are required, from camping grounds and walking tracks, visitor centres and boat ramps, motels and ecolodges, stores and service stations, cafes and roadhouses etc. all make up the suite of facilities to support tourism and create products.
These facilities and access are required at the scale for the tourism product, i.e. for the traditional self drive to the tip of Cape York, these facilities are required as set of access/attractions/facilities which suite the itineraries of the self drive tourist, then in areas (e.g. Lakefield) where the tourist experience in more concentrated in one area the opportunities needs to be integrated to provide a worthy experience/tourism product. Thus tourism precinct planning is required; it is not just a rock art shelter and interpretive sign or camp ground that makes tourism, but an understanding of the range of access/attractions/facilities that make the product. The development of a fly in ecolodge tourism product, requires the airstrip, the airline, the ecolodge, but also access to a range of attractions and activities for the product to be viable.
For tourism to thrive on Cape York and provide a significant economic contribution, private enterprise is required to develop the accommodation, tours and services to support tourism. Whilst the national parks provide important access and facilities at natural and cultural attractions, the whole tourism product will also require the opportunity for commercial activities. These may include tours on public lands, concessionaire style/lease businesses on public lands and tourism investment on private lands. Approvals and land tenure options to facilitate this will be required.
One issue in this regard is the various tenures of aboriginal land and leases can preclude banks from lending if they do not have mortgage-able security (a bank cannot become mortgagor in possession and recover a debt if land is part of a large lease or is unalienable aboriginal freehold etc). Resolution of this will require tenures (including specific purpose leases that allow for commercial lending and surety of capital investment) and/or the development of alternative means for businesses to raise capital for tourism ventures.
There are many tourism opportunities on pastoral leases, which may allow lessees to gain additional revenue (beyond the core business of grazing cattle). This may require approvals and changes to lease conditions.

24 June 2012 82 Version 3.0
The Potential Economic Benefits of Protecting and Presenting Cape York
Tourism remains the main mechanism to realise any economic benefit from world heritage listing and is the most prospective means for communities to gain economic independence and sustain livelihoods from any Cape York world heritage area. Tourism can form a major mechanism to present the world heritage values and if developed using best practice sustainability/ecotourism much growth in tourism could be accommodated without loss of world heritage values.
To mitigate potential impacts on tourism, the management regime for world heritage will need to include proactive development of tourism opportunities and involve overall strategic level and precinct based tourism planning, not just reactive regulation. Further access; services; infrastructure; facilities; appropriate tenures/land access for commercial ventures; and efficient and timely approvals processes would be required.
Light Industry, Retail, Business Centres, Services and Accommodation The impacts upon light industry, retail, business centres, services and accommodation greatly depends upon the extent of the world heritage listing area. If community areas, towns and settlements are included the impacts could be substantial unless growth of developed land and uses is permitted.
Should community areas, towns and settlements be included within the world heritage area the key mitigation strategy would be to have provisions which allow for the sustainable development of light industry, retail and services within appropriate areas to cater for community and economic growth.
Outside of community areas, towns and settlements there are also light industry, retail, services and accommodation such as road houses/service stations, cafes and shops. The potential world heritage area is likely to include sites of existing and potential lights industry, retail, services and accommodation businesses. The key mitigation strategy would be to have mechanisms within the management regime to allow existing such businesses to continue and potentially expand and for the approval of new businesses in new sites where the impacts on world heritage values are ecologically and culturally sustainable.
Indigenous As discussed above the development of this report has not involved any detailed consultation with indigenous groups. It is understood that Balkanu have issues with the “road map”.
It is noted that there are substantial challenges to obtain traditional owner consent to world heritage listing and that this process could take a longer period as traditional owners move from focus on the areas of consideration for listing to the management, constraints and obligations for their uses and the management and decision making framework for management of the world heritage area. Despite these challenges there are many models in Australia and overseas of world heritage areas owned and jointly managed with traditional owners.
This study has not considered the process of consultation with Aboriginal land owners and the overall indigenous community on Cape York. However an overall consideration of the potential economic impacts of world heritage listing and mechanisms to mitigate these impacts are outlined below.
Fundamentally, world heritage listing may imply a conservation regime over traditional lands where there are constraints on Aboriginal landowners with decisions made by other agencies and/or governments on appropriate land uses. This could affect both traditional land uses and activities.

24 June 2012 83 Version 3.0
The Potential Economic Benefits of Protecting and Presenting Cape York
Hunting, fishing, use of traditional materials could potentially be restricted in specific areas, or all of the world heritage area. This could affect Cape York’s indigenous peoples ability to live a subsistence lifestyle from their land. Whilst there may be few indigenous people who wish to do this full time the use of their lands for such activities for short periods allows a sense of belonging to the land and cultural renewal.
The development of outstations and camps in otherwise undeveloped areas may be restricted. The use of roads to access traditional lands may be restricted.
The undertaking of economic development activities such as farming, forestry, fishing, hunting gathering bush foods, medicines and seeds for propagation, tourism and extractive uses (mining/quarrying etc.) are all economic activities which may be undertaken by aboriginal land owners on their lands or by others with some form or resource rent to benefit aboriginal owners. These activities may be constrained by the conservation regime implied by world heritage listing.
The potential impacts will depend upon the extent of the world heritage area and the allowable uses. To some extent the allowance of traditional use and occupation of the land allows the subsistence/cultural renewal activities could mitigate to allow economic benefit. However the constraints upon other lands uses farming, forestry, fishing, hunting gathering bush foods, medicines and seeds for propagation, tourism and extractive uses (mining/quarrying etc.) will need to consider the conservation of world heritage values versus the potential economic benefits to the indigenous population and land owners of cape York.
Mitigating Potential Adverse Impacts The table below summarises the mitigating factors which could minimise potential impacts. Of particular relevance for mitigation is to include transitional provisions or “gandfathering” (recognising prior uses for a sunset period) and other mechanisms to mitigate potential adverse impacts where they affect existing economic activity.
Economic Impact Mitigation
Changes in land use Transitional provisions for existing land uses.
Consider impacts of prohibition and if necessary provide compensation.
Tenure Consider tenures and provide for alienation to realise economic opportunities.
Approvals
Duplication and arduous/uncertain approvals processes can affect realisation of opportunities.
Provide a streamlined approval processes and some form of advisory service or subsidy for professional advice
Access
Many economic activity rely on existing and upgraded access via roads, seaports and airports.
Allows and does not overly constrain the ongoing maintenance, upgrading and further development of access roads, airports and marine facilities.

24 June 2012 84 Version 3.0
The Potential Economic Benefits of Protecting and Presenting Cape York
Economic Impact Mitigation
Community Services
New and existing water extraction and pipelines, dams and reservoirs, powerlines, telecommunications cables and towers and community facilities.)
Provide for the ongoing maintenance, upgrading and further development of services.
Grazing
Ongoing existing cattle industry.
Maintain critical mass of grazing lands.
Ongoing sustainable development of grazing properties.
Conservation land management assistance.
Timber
Land owners often have minor uses of timber resources (e.g. fences, bush material buildings etc.).
Allow modest in-situ use of “bush materials”.
Quarrying
Critical to maintain and upgrade roads.
Allow ongoing use and development of quarries and borrow pits within the world heritage area, especially for roads and other community infrastructure.
Tourism
Self drive and safari tours.
Short stay lodges (fishing, ecotourism and culture).
Initial branding and ongoing marketing.
Facilitation of land tenures and access rights.
Streamlined planning and approvals.
Commercial opportunities on public lands.
Government investment in public facilities on national parks.
Accommodation
Tourism, contractor, government and business.
Planning and approvals, and land tenure arrangements allow commercial accommodation to be developed within world heritage area.
Light Industry, Retail, Business Centres, Services and Accommodation
Allow existing light industry, retail, services and accommodation to continue and provide for the approval of new businesses in new sites where the impacts on world heritage values are ecologically and culturally sustainable.
Indigenous Uses
Traditional/cultural renewal and economic development initiatives.
Allowance of traditional use and occupation for subsistence/cultural renewal activities and new activities/development where the impacts on world heritage values are ecologically sustainable
24 June 2012 85 Version 3.0
The Potential Economic Benefits of Protecting and Presenting Cape York
The Impacts of No Action There are no major economic impacts of not word heritage listing Cape York by itself. In other words, the present economy could be expected to continue, with modest growth subject to internal and external economic factors.
Further, most of the economic benefits identified could be achieved without world heritage listing. If government continued to acquire lands and create an overall conservation estate and spend money on conservation management, the economic benefits of such expenditure could be realised without world heritage listing.
It is noted that in some cases world heritage listing has facilitated increased Commonwealth government spending in areas and greater coordination of management by Federal/State/local governments. It is noted that should world heritage listing not occur the overarching international recognition, obligations and oversight would not be present. Even if similar conservation expenditure was made initially, without world heritage listing long term commitments to expenditure and management resources may be more likely to be eroded as governments face other priorities.
Similarly the economic benefits of tourism growth may be able to be achieved without world heritage listing if resources are applied to branding and marketing, product development occurs, tourism is facilitated (tenure, approvals, concessions etc.) and there is adequate private investment in accommodation and tourism enterprises. However there is a stronger rationale to expect that the tourism economic benefits may be more readily/reliably realised owing to the branding factor of world heritage listing. Even with world heritage listing a major branding and marketing campaign would be required, however world heritage listing does aid branding.
It is therefore concluded that without world heritage listing there may be the potential to realise economic benefits if similar funding and management arrangements are put into place for conservation and tourism. However, world heritage listing is seen as a catalyst for which would increase the likelihood of the benefits of protecting and presenting Cape York.
24 June 2012 86 Version 3.0
The Potential Economic Benefits of Protecting and Presenting Cape York
Management Considerations
This chapter sets out a discussion of optimal management practices and approaches to:
Identify optimal management practices and approaches of a future world heritage site on Cape York Peninsula.
Consider of Indigenous involvement in management.
Identify mechanisms to deliver the best sustainable economic opportunities.
Identify mechanisms to minimise economic disadvantage.
Optimal Management Practices The consideration of optimal management practices and approaches of a future world heritage site on Cape York Peninsula to maximise economic opportunities needs to consider:
Governance (local community, business and landholder involvement).
Autonomy (whether a separate agency or part of an existing entity).
Integration (whether the management/regulatory regime will integrate or replace existing bureaucracy/development permits rather than be additional.).
Resources (the level of resources for natural resource/conservation management and presentation of the world heritage Area).
Longevity (the government commitment to long term funding for recurrent management and capital expenditure on enabling projects and infrastructure).
Local/regional: (the level of local autonomy within the overall world heritage region, such as a local indigenous land owner group or pastoralist having local autonomy for the management of their section of the world heritage area).
Capacity: (the level of institutional capacity for facilitation of economic development and benefits).
Governance Arrangements The governance arrangements for a world heritage area need to include representation and participation by all stakeholders. One overall body may be desirable, however this would need to be established with stakeholder engagement and avoid duplication/additional processes. Much depends upon the geographical location of the proposed world heritage area, if it is a broad acre nomination, there may be substantial overlap with the recently established NRM Board. Further, there may be a need to involve and coordinate the three levels of government. It is vital that the Commonwealth is fully engaged and supports whatever governance arrangements are established.
Legislation There is already a range of overlapping state legislation covering many aspects of conservation. As soon as the area is nominated for world heritage the conservation aspects become matters of national environmental significance and as such the Commonwealth’s EPBC Act and the referral/approval processes become enacted. The desirable outcome for Cape York world heritage needs to be an integration of legislative regulation and approval processes, to streamline processes and provide certainty, rather than creating any additional layers/processes.

24 June 2012 87 Version 3.0
The Potential Economic Benefits of Protecting and Presenting Cape York
Strategic Planning There is a need for an overall strategic plan for any world heritage area... this is fundamental to the World Heritage Operational Guidelines and is required as any Cape York World Heritage Area is likely to have a wide variety of tenures, landscapes, ecosystems and cultural values.
Statutory Planning It will be vital to understand the potential statutory planning regime and how this may impact adversely or beneficially on the Cape’s economy. Consideration during development of the statutory planning will need to consider how a statutory plan may integrate and incorporate other plans and regulatory regimes such as Nature Conservation, Sustainable Planning, Coastal, Heritage and other state legislation and the Commonwealth’s EPBC Act,
Development approvals are a key aspect of facilitating or being a major impediment to economic development and it would be desirable to establish mechanisms where one Cape York World Heritage Statutory Plan may be able to integrate all the above legislation, rather than adding an additional layer/process.
Joint Management There are great examples of joint management with indigenous landholders in other world heritage areas and also on the Cape...there is an opportunity for the Cape to develop an overall joint management outcome, not just between government agencies and indigenous landholders but with all community and landholder stakeholders.
Given the potential joint management context for a Cape York World Heritage Area, there is an opportunity to make this a key aspect to ensure potential economic benefits to local communities from management. Critical to this will be the involvement of other tenure holders (such as those with grazing leases), neighbours and communities from across the Cape (whether inside or near the world heritage area) so that they can also be involved in a joint management model to achieve the best possible economic outcomes.
Local Determination Numerous stakeholders have raised the aspirations of local communities for local determination. Cape York has a very dispersed population over a large area with a disproportionately high number of groups, from land trusts, corporations and other entities, community groups and the local government including Cook Shire, Weipa Town Authority and Aboriginal Shire Councils.
It is desirable for management arrangements for a Cape York world heritage area will need to include a mechanism to effectively involve the wide range and dispersed nature of stakeholder groups and local community interests of Cape York.
NRM Process – relevance to WH? The Natural Resources Management Board for Cape York has recently been established. How this organisation will be involved in and engaged in management of a Cape York World Heritage Area has not been determined. Indeed the relevance of an NRM board may be reduced if a world heritage management agency is established and controls the majority of resources/funding for conservation/natural resource management.
The role of the proposed NRM Board in relation to world heritage management needs to be clarified.

24 June 2012 88 Version 3.0
The Potential Economic Benefits of Protecting and Presenting Cape York
Management Regimes Corporate Governance, Planning and Statutory Protection From consultation with DERM and DSEWP&C officers it is apparent that no particular management regime or model has been determined as yet for the proposed Cape York world heritage area. Given the likely inclusion of national parks, aboriginal freehold, pastoral leases and other tenures, it is likely some form of multiple tenure statutory/management regime will be required to meet the protection and management requirements of the Operational Guidelines.
The range of management regimes could include a Wet Tropics style management authority, with specific enabling legislation and a statutory management plan, some extension to the Cape York Heritage Act and creation of world heritage provisions for Cape York in the Sustainable Planning Act or other Queensland legislation to give effect to protection and specific land use/development approval processes in the world heritage area to a less statutory regime with a series of negotiated agreements for the non-national park lands of any Aboriginal freehold and pastoral lease areas (e.g. nature refuge agreements etc.).
It is expected that the management regime will need to include Aboriginal traditional owners, local community and tourism industry leaders and others.
The management regime will need to address the multiple tenure types (including national parks, aboriginal land and leasehold land) and given the multiple tenures some form of overarching statutory protection, land use and development approvals process is expected.
It is desirable that the management regime will include an overall strategic level management plan which if it includes zoning and development approvals processes integrates and streamlines other requirements rather than duplicates.
Management Resources From consultation with DERM and DSEWP&C officers it is apparent that Governments have not specifically committed to any special long or short term funding model for the management of a Cape York world heritage area. As discussed above, it is likely that there will be the need for management planning, some form of statutory/management body, a consultative body and consultation process, development assessment processes and of course actual conservation management on the ground. The Operational Guidelines also require presentation of world heritage values and it is expected that management resources would need to be applied to developing further visitor access and facilities and interpretation programs to present world heritage values.
It is concluded that a long term funding model with contributions from both Commonwealth and State governments will be required to adequately resource the management of a Cape York world heritage area. To date there have been no commitments to such funding. Given the potential joint management context for a Cape York World Heritage Area, capacity building and need for coordination/collaboration by many stakeholder and landholder agencies will need to be addressed.
The involvement of other tenure holders (such as those with grazing leases), neighbours and communities from across the Cape (whether inside or near the world heritage area) in a joint management model to achieve the best possible economic outcomes may be desirable.
Financial Resources It is highly likely that a Cape York world heritage nomination will be across millions of hectares and as such is likely to require specific and long term financial commitments by state and commonwealth governments in order to meet international obligations for world heritage management.

24 June 2012 89 Version 3.0
The Potential Economic Benefits of Protecting and Presenting Cape York
The modelling of management (see chapters below) has made assumptions for the long term funding for management by the three levels of government. These funding requirements will be critical to realising adequate management of the world heritage area and achieving economic benefits.
Funding for adequate land management by the various landholders (from aboriginal landholders, pastoralists and government conservation agencies), infrastructure development (particularly that which facilitates positive economic outcomes) and facilitates economic and social benefits will be required.
Capacity of Organisations The Planning for People discussion paper provides some worthwhile insights into the need to support and enhance the capacity of organisations. The tyranny of distance and the small, dispersed population of the Cape needs to be recognised.
It will be desirable for management arrangements to provide local capacity building for the long term management of the world heritage area.
24 June 2012 90 Version 3.0
The Potential Economic Benefits of Protecting and Presenting Cape York
Potential Future Scenarios
Assumed World Heritage Area Fundamentally the identification of the area for world heritage nomination requires both the spatial determination of the natural and cultural values as well as the establishment of a protection and management regime which will meet the Operation Guidelines requirements for Protection and Management.
1. It is assumed that all lands that are National Park or National Park (Cape York Peninsula Aboriginal land) will be included in any world heritage nomination. The basis of this assumption is that they have been acquired by Government owing to their conservation values.
2. It is assumed that large areas of lands subject to “pending land dealings” as advised by DERM and other future land acquisitions will be included as they are being acquired by Government owing to their conservation values and at least 50% of these areas will become National Park (Cape York Aboriginal Land) and some of the areas returned for homelands as Aboriginal freehold will be made nature refuges.
3. It is assumed that other areas of Cape York that have some form of conservation tenure may be included (this can range from Aboriginal Land with some form of conservation management agreement or nature refuge designation, private conservation lands such as the Steve Irwin Wildlife Reserve and other government lands e.g. esplanades etc.).
4. Given the above, it is assumed that at the minimum a “serial” nomination based on the lands listed above is potentially viable based on natural values, however there could be issues associated with integrity given there are substantial areas of natural habitat with conservation values not included. The “protection and management” requirements for world heritage listing could be a challenge to meet for such a serial nomination particularly the “boundaries for effective protection” aspects.
5. The spatial extent of other cultural values, specific sites etc. may allow for such a serial nomination to include some nominated cultural values (if specific sites of materiel and non materiel culture are known), there may also be areas specifically included on cultural landscape grounds.
NOTE: in the above discussion, it is assumed that the Commonwealth and Queensland governments will not wish to rely on the EPBC Act’s protection of Matters of National Environmental Significance for the “protection” of any non-conservation tenure lands proposed for world heritage listing. It has been assumed that some form of overall State level protection and management regime will be implemented.
For the purposes of this project and to consider the economic benefits and impacts of World heritage listing of Cape York it is assumed that:
At the minimum area, a “serial” nomination of the current and proposed National Parks, National Park (Cape York Aboriginal Land) and nature refuges on Aboriginal Land is likely.
A broad scale nomination of a wider area of Cape York is possible and would have the natural, cultural and cultural heritage values worthy of world heritage listing, but will require some form of conservation management regime to meet the protection and management requirements.
Given the above It is assumed that the potential area for world heritage listing may include: National Parks, National Park (Cape York Aboriginal Land);

24 June 2012 91 Version 3.0
The Potential Economic Benefits of Protecting and Presenting Cape York
Areas of nature refuge on Aboriginal freehold land and other agreed areas of Aboriginal land tenure and freehold land.
Other areas managed for conservation such as the Steve Irwin Wildlife Refuge and Kaanju Ngaachi Indigenous Protected Area.
Some areas of pastoral leases.
NOTE: There is a Queensland Government process to identify a potential Area of International Conservation Significance and then an area for potential world heritage nomination. This report does not intend to predict the outcome of the process. Nor, to avoid any doubt does the report have any specific “inside” information on a potential area. Having said that it is important to identify an assumed world heritage area for the purposes of modelling the potential impact of scenarios.
To avoid any doubt, the following table is merely an assumed world heritage area, prepared by EcoSustainAbility, it is included in this paper as an assumption for modelling of the scenarios, not to guide the AICS or world heritage process. The assumption is of a broad acre AICS/world heritage nomination. Approximately 30% of the Cape would be included. The assumed world heritage area includes 51,100 km2, 30,000 km2 of which will be national park (Table 30).
Table 30: Tenures of Assumed World Heritage Area
Tenure Area (km2)
National Park/ CYPAL National Park52 30,000State Forest/Timber Reserve 218Coordinated Conservation Area 10Nature Refuge (on Aboriginal Land Trust) 1,000Land Trust Parcels (Aboriginal Land Act 1991)53 4,000Nature Refuge on Freehold and Lands Lease 10,000Private Wildlife Reserve (e.g. Steve Irwin Wildlife Reserve) 1,350Indigenous Protected Area(s) (e.g. Kaanju Ngaachi IPA) 2,000DOGIT54 2,500Total 51,100
Management Assumptions Overall Framework The following overall framework is assumed:
“Cape York has thriving communities who derive their livelihoods from natural resource management, tourism, grazing and mining. Community development and the economy is supported by ongoing improvements to access and services. There are opportunities for entrepreneurial enterprises for tourism and new agricultural activities. The cultural and natural values of the Cape have been recognised by world heritage listing of national parks, nature refuges and areas of Aboriginal land and pastoral leases voluntarily included within the area. Landholders with lands in the world heritage area derive benefits for their proactive management for conservation values. The management of the world heritage area is undertaken by a single, well resourced management body streamlining integrated Commonwealth and State approvals and management programs and with landholder and local community determination as fundamental planks of its management.”
52 Assumes a further 50% increase on early June 2011 area (did not include Lakefield nor any future acquisitions). 53 Assumes about 30% of current lands. 54 Assumes about 25% of current DOGIT lands.

24 June 2012 92 Version 3.0
The Potential Economic Benefits of Protecting and Presenting Cape York
Principles for Achieving Protection and Presentation Whilst Maximising Socio-Economic Benefits The following principles in order to achieve protection and presentation whilst maximising socio-economic benefits are assumed:
The world heritage nomination is based on natural and cultural values, and cultural landscape criteria.
No land is included in the world heritage area nomination without landholder knowledge and consent.
As part of the development of the nomination for world heritage listing and management arrangements:
The tenure resolution process is substantially completed or the long term extent of protection of conservation values in protected areas is understood.
The management regime including the form of any management body, statutory planning and approvals processes and resources is determined.
There is a commitment to provide for development of tourism products in terms of infrastructure (both on public land such as national park facilities and private such as camp sites, lodges etc.) and access (roads, coastal and marine facilities etc.) which be required to realise any greater economic contribution.
There are commitments to funding and any regulatory conservation regime specifically allows for ongoing maintenance and development of access, infrastructure and services.
Land tenure arrangements address surety, flexibility and allow capital raising options.
Management arrangements include community based land management (employing Cape locals).
Any specific State approval process for the world heritage area, streamlines other approval processes rather than adding another layer and seamlessly integrates any Commonwealth requirements.
Allowable land uses of areas within and adjoining the world heritage area are overtly determined, this takes into account other land use/development constraints such as Wild Rivers.
It would be desirable to have an economic futures plan developed with interested stakeholders and government policy and funding commitments to its implementation are made concurrent with world heritage listing.
Tourism Trends and Forecasts In order to provide a basis for the ‘business as usual’ scenario for this study, it is necessary to adopt a projected future growth (or decline) rate for tourism in the Cape York Peninsula Area. This is approached by examining recent tourism trends and published forecasts for tourism growth.
Recent tourism trends for the Tropical North Queensland Region are examined here, as data are not available specifically for the Cape York Peninsula Area. A summary of trends over the last three years is shown in Table 31.
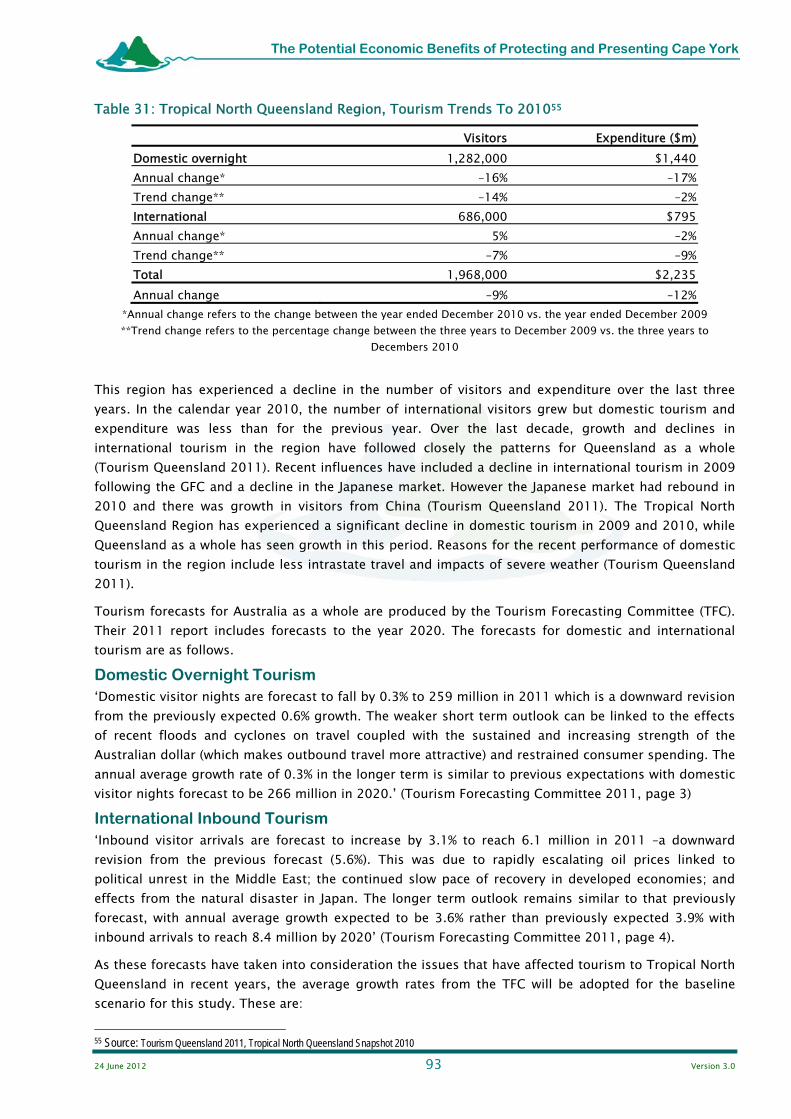
24 June 2012 93 Version 3.0
The Potential Economic Benefits of Protecting and Presenting Cape York
Table 31: Tropical North Queensland Region, Tourism Trends To 201055
Visitors Expenditure ($m)Domestic overnight 1,282,000 $1,440Annual change* –16% –17%Trend change** –14% –2%International 686,000 $795Annual change* 5% –2%Trend change** –7% –9%Total 1,968,000 $2,235Annual change –9% –12%
*Annual change refers to the change between the year ended December 2010 vs. the year ended December 2009 **Trend change refers to the percentage change between the three years to December 2009 vs. the three years to
Decembers 2010
This region has experienced a decline in the number of visitors and expenditure over the last three years. In the calendar year 2010, the number of international visitors grew but domestic tourism and expenditure was less than for the previous year. Over the last decade, growth and declines in international tourism in the region have followed closely the patterns for Queensland as a whole (Tourism Queensland 2011). Recent influences have included a decline in international tourism in 2009 following the GFC and a decline in the Japanese market. However the Japanese market had rebound in 2010 and there was growth in visitors from China (Tourism Queensland 2011). The Tropical North Queensland Region has experienced a significant decline in domestic tourism in 2009 and 2010, while Queensland as a whole has seen growth in this period. Reasons for the recent performance of domestic tourism in the region include less intrastate travel and impacts of severe weather (Tourism Queensland 2011).
Tourism forecasts for Australia as a whole are produced by the Tourism Forecasting Committee (TFC). Their 2011 report includes forecasts to the year 2020. The forecasts for domestic and international tourism are as follows.
Domestic Overnight Tourism ‘Domestic visitor nights are forecast to fall by 0.3% to 259 million in 2011 which is a downward revision from the previously expected 0.6% growth. The weaker short term outlook can be linked to the effects of recent floods and cyclones on travel coupled with the sustained and increasing strength of the Australian dollar (which makes outbound travel more attractive) and restrained consumer spending. The annual average growth rate of 0.3% in the longer term is similar to previous expectations with domestic visitor nights forecast to be 266 million in 2020.’ (Tourism Forecasting Committee 2011, page 3)
International Inbound Tourism ‘Inbound visitor arrivals are forecast to increase by 3.1% to reach 6.1 million in 2011 –a downward revision from the previous forecast (5.6%). This was due to rapidly escalating oil prices linked to political unrest in the Middle East; the continued slow pace of recovery in developed economies; and effects from the natural disaster in Japan. The longer term outlook remains similar to that previously forecast, with annual average growth expected to be 3.6% rather than previously expected 3.9% with inbound arrivals to reach 8.4 million by 2020’ (Tourism Forecasting Committee 2011, page 4).
As these forecasts have taken into consideration the issues that have affected tourism to Tropical North Queensland in recent years, the average growth rates from the TFC will be adopted for the baseline scenario for this study. These are: 55 Source: Tourism Queensland 2011, Tropical North Queensland Snapshot 2010

24 June 2012 94 Version 3.0
The Potential Economic Benefits of Protecting and Presenting Cape York
annual average growth rate of domestic visitor nights of 0.3%; and
annual average growth of inbound visitor arrivals of 3.6%.
The scenarios will be modelled using the more detailed forecasts for five year periods contained in the TFC report.

24 June 2012 95 Version 3.0
The Potential Economic Benefits of Protecting and Presenting Cape York
Summary of Assumptions for Scenarios The assumptions for each Scenario are set out in Table 32.
Table 32: Assumptions for Scenarios
Aspect Assumption
World Heritage Area National Park
DOGIT, Land TrustNature Refuges on Freehold and Land Lease,
51,100 km2
30,000 km2
7,500 km2
10,000 km2
Population of Cape York 16,800Employment 8,250
Gross Value Added (FNQ Region less Cairns)Gross Value Added Cape YorkAgriculture Forestry and Fishing
MiningManufacturing
Construction and Elect/Water/WasteWholesale and retail tradeAccommodation and Food
Professional, Scientific, technicalPublic administration, education and health
$3,754m$598m
5.2 %3.2 %
11%5.8%5.3%4.9%
1%50%
Agriculture (Cape York Peninsula, inc all Cook Shire) Crops
Livestock SlaughteringArea Under Grazing
Head of cattle$/ ha
$42.4m$14.3m$28.1m4.9m ha97,600
$1.60Conservation and NRM Management
Total Expenditure (recurrent)Capital works
JobsArea subject to some form of conservation
VisitorsConservation management $/km2
Conservation management $/VisitorConservation management $/visitor/km2
Conservation staff/km2
Conservation staff/visitorConservation staff/visitor/km2
$13,920,000$3,591,000
18950,000 km2
30,000$278$464
$0.0090.003740.00623
0.000000124Tourism
CYP Visitors (not including Cooktown)Visitor Nights (not including Cooktown)
Average Length of Stay$ Spend per night
Estimated Tourism Expenditure (CYP, not Cooktown)Direct Value Added (CYP not Cooktown)
Estimated Direct EmploymentCYP (not Cooktown) Tourism Beds
50,000
350,0007 nights
$73/$165$29.5m
$9.0m156 jobs700 beds
24 June 2012 96 Version 3.0
The Potential Economic Benefits of Protecting and Presenting Cape York
CYP (not Cooktown) Campsites with FacilitiesCYP (not Cooktown) Bush campsites with Facilities
3500 “beds” 1000 “beds”
Potential Future Scenarios Alternative Futures The intention of this section is to provide an analysis of a range of future scenarios based on levels of natural resource management, tourism and infrastructure.
Five scenarios have been modelled: No world heritage, tourism organic growth, no more natural resource management. Modest natural resource management, modest tourism growth. Modest natural resource management, high tourism growth. Intensive natural resource management, modest tourism growth. Intensive natural resource management, high tourism growth.
The key factors for each scenario are set out in Table 33.
Likelihood Considerations for Scenarios No Action This scenario is modelled as the base case against which the other world heritage scenarios are modelled. The scenario is based on a set of assumptions of “business as usual” should world heritage listing not occur.
Modest Conservation Modest Tourism This scenario is considered most likely if government establishes the world heritage area with a modest management program and modest support for tourism promotion and facilitation. It should be noted that this still requires significant ongoing commitments by governments to achieve the potential economic benefits.
To avoid any doubt it is considered that this scenario is not in any way “automatic” as a result of world heritage listing. If world heritage listing were to occur with no additional management regime or conservation effort and tourism promotion and facilitation, the “no action” scenario is most likely to be the economic outcome.
Modest Conservation High Tourism This scenario requires the government to establish the world heritage area with a modest management program and aggressive support for tourism promotion and facilitation. It should be noted that this requires substantial ongoing commitments by governments to achieve the potential economic benefits.
The modelling of tourism outcomes assumes that an aggressive tourism branding and marketing program, the development of public infrastructure and private enterprise accommodation, experience and tours will result in the modelled level of tourism. This is an assumption, not a prediction!
The likelihood of the tourism growth cannot be guaranteed and could be subject to unpredictable outside influences such as foreign exchange rates, source markets economic conditions and factors affecting tourism such as health and security scares etc.

24 June 2012 97 Version 3.0
The Potential Economic Benefits of Protecting and Presenting Cape York
Intensive Conservation Modest Tourism This scenario is considered most likely if government establishes the world heritage area with a substantial management program and modest support for tourism promotion and facilitation. It should be noted that this requires substantial ongoing commitments by governments to achieve the potential economic benefits.
To avoid any doubt it is considered that this scenario is not in any way “automatic” as a result of world heritage listing. The scenario requires investment in tourism promotion and facilitation.
Intensive Conservation High Tourism This scenario is considered possible if government establishes the world heritage area with a substantial management program and substantial support for tourism promotion and facilitation. It should be noted that this requires substantial ongoing commitments by governments to achieve the potential economic benefits.
The likelihood of the tourism growth cannot be guaranteed and could be subject to unpredictable outside influences such as foreign exchange rates, source markets economic conditions and factors affecting tourism such as health and security scares and weather (cyclones, floods or exceptionally long wet season) etc.
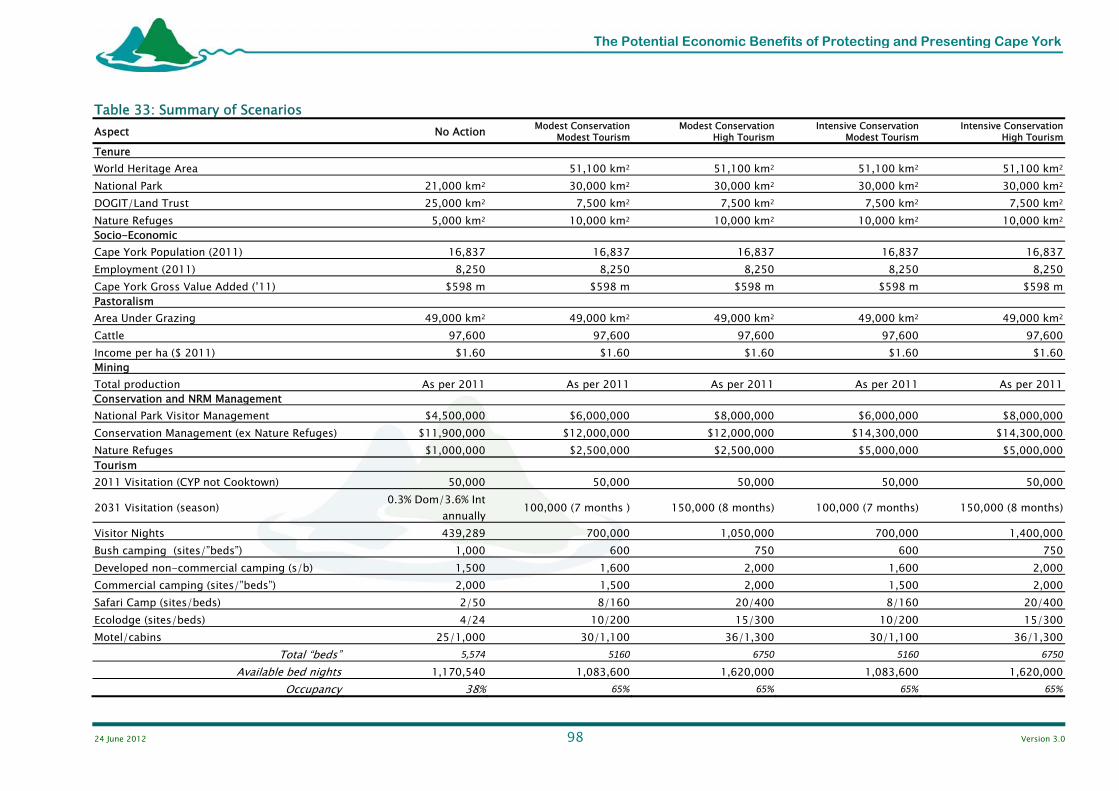
24 June 2012 98 Version 3.0
The Potential Economic Benefits of Protecting and Presenting Cape York
Table 33: Summary of Scenarios Aspect No Action Modest Conservation
Modest Tourism Modest Conservation
High TourismIntensive Conservation
Modest TourismIntensive Conservation
High Tourism Tenure World Heritage Area 51,100 km2 51,100 km2 51,100 km2 51,100 km2 National Park 21,000 km2 30,000 km2 30,000 km2 30,000 km2 30,000 km2 DOGIT/Land Trust 25,000 km2 7,500 km2 7,500 km2 7,500 km2 7,500 km2 Nature Refuges 5,000 km2 10,000 km2 10,000 km2 10,000 km2 10,000 km2 Socio-Economic Cape York Population (2011) 16,837 16,837 16,837 16,837 16,837 Employment (2011) 8,250 8,250 8,250 8,250 8,250 Cape York Gross Value Added (’11) $598 m $598 m $598 m $598 m $598 m Pastoralism Area Under Grazing 49,000 km2 49,000 km2 49,000 km2 49,000 km2 49,000 km2 Cattle 97,600 97,600 97,600 97,600 97,600 Income per ha ($ 2011) $1.60 $1.60 $1.60 $1.60 $1.60 Mining Total production As per 2011 As per 2011 As per 2011 As per 2011 As per 2011 Conservation and NRM Management National Park Visitor Management $4,500,000 $6,000,000 $8,000,000 $6,000,000 $8,000,000 Conservation Management (ex Nature Refuges) $11,900,000 $12,000,000 $12,000,000 $14,300,000 $14,300,000 Nature Refuges $1,000,000 $2,500,000 $2,500,000 $5,000,000 $5,000,000 Tourism 2011 Visitation (CYP not Cooktown) 50,000 50,000 50,000 50,000 50,000
2031 Visitation (season) 0.3% Dom/3.6% Int annually 100,000 (7 months ) 150,000 (8 months) 100,000 (7 months) 150,000 (8 months)
Visitor Nights 439,289 700,000 1,050,000 700,000 1,400,000 Bush camping (sites/”beds”) 1,000 600 750 600 750 Developed non-commercial camping (s/b) 1,500 1,600 2,000 1,600 2,000 Commercial camping (sites/”beds”) 2,000 1,500 2,000 1,500 2,000 Safari Camp (sites/beds) 2/50 8/160 20/400 8/160 20/400 Ecolodge (sites/beds) 4/24 10/200 15/300 10/200 15/300 Motel/cabins 25/1,000 30/1,100 36/1,300 30/1,100 36/1,300
Total “beds” 5,574 5160 6750 5160 6750 Available bed nights 1,170,540 1,083,600 1,620,000 1,083,600 1,620,000
Occupancy 38% 65% 65% 65% 65%

24 June 2012 99 Version 3.0
The Potential Economic Benefits of Protecting and Presenting Cape York
Economic Modelling
Methods The overall aim of the economic modelling is to explore the potential economic changes that may occur with four world heritage area (WHA) scenarios, against a baseline of ‘No Action’ (otherwise known as ‘business as usual’) over the period to 2031 (current year plus 20 years). For the WHA scenarios, it is assumed that world heritage listing will come into effect in 2014.
The Scenarios are outlined in the previous chapter.
The ‘No Action’ scenario builds in expected change such as expected growth in tourism with no specific action to improve tourism demand or supply.
Only industries or activities that may experience direct change due to world heritage listing are included in the ‘No Action’ and WHA scenarios. These are: Tourism, National Park visitor management, National Park visitor consumer surplus, World Heritage Marketing, Tourism Construction, Tourism Roads, Conservation Management and Grazing. It is assumed that all other industries in the Cape York region will not be directly affected, but some may experience flow-on economic impacts as will be shown in the economic impact assessment.
It is important to note that this economic modelling does not predict that the changes in the four WHA scenarios will occur with world heritage listing.
These scenarios are ‘what if’ scenarios and have been generated using a mix of knowledge from the literature, best estimates of the consultants and stakeholders and assumptions (see Likelihood Considerations for Scenarios section). The economic modelling is aimed at illustrating the potential impacts if the scenario comes to pass.
Two approaches for economic modelling are included. The first is an economic impact assessment approach where the aim is to generate estimates of value added and employment supported in Cape York and its economic region in the scenarios modelled. The second approach is to provide a ‘cost benefit type presentation’ to illustrate ‘present values’ associated with the scenarios modelled. Due to time and resource limitations of this study, this not a full Cost Benefit Analysis of the scenarios.
The economic modelling is based on a desk top approach, accessing available information. It did not involve the collection of new data or the construction of region specific Input-Output or other models and therefore has limitations. It will provide information sufficient to give an understanding of the ‘order of magnitude’ of present economic circumstances and potential changes with the WHA scenarios. It will also highlight sensitivities and gaps in knowledge. This will assist in the next steps of consideration of the possibility of world heritage listing.
It is important to specify the geographic and economic regions to which the economic modelling and the results relate. The industries and activities modelled in the ‘No Action’ and WHA scenarios are those actually in the area of interest for possible world heritage listing (hereafter called the ‘region of interest’). This is the roughly 50,000 Km2 described elsewhere in the report.
24 June 2012 100 Version 3.0
The Potential Economic Benefits of Protecting and Presenting Cape York
The economic impact assessment aims to estimate direct and flow-on impacts. The direct and flow-on impacts will be for an economic region of a greater area than the region of interest (generally the rest of Cape York and the Far Northern Region). This study has employed the use of ‘economic multipliers’ from other published studies to estimate these impacts, and the geographical spread of impacts estimated will be determined by the multipliers used. The geographic/economic spread of specific impacts estimated is noted below.
The cost benefit type presentation includes impacts at the regional level and also at the State of Queensland level as it includes expenditure by the Queensland government on activities such as conservation management and road construction. The non-market benefits of conservation management can be international, in recognition of the potential world heritage status of the region. Again, the geographic/economic spread of specific types of costs and benefits is noted below.
All results have been rounded off to millions of dollars.
Economic Impact Assessment Economic impact assessment aims to estimate the impacts of a ‘shock’ such as world heritage listing with associated resource, demand and management changes. The initial step is to build a picture of the economic contribution of activities and industries that may change in a ‘business as usual’ scenario and then to estimate the impacts of the change due to the ‘shock’. This type of assessment relies on economic models of regions that detail the economic interdependencies in a region. This includes Input-Output models and Computable General Equilibrium (CGE) models. This report relies on existing published Input-Output models and multiplier information from these. A limitation of Input-Output models is that they do not recognise limited capacity in an economy (for example limited skilled labour), and therefore can overestimate impacts. In addition, Input-Output analysis is a static analysis that does not allow for changes in production or consumption relationships, substitution or price effects. CGE models do build in capacity constraints and more dynamic relationships. While a CGE model has been used to assess potential impacts of climate change in the Tropical North Queensland Region (Turton et al 2009), resource and time limitations for this study precluded new modelling using CGE. This approach may be useful if more detailed analysis is warranted in the future.
A limitation of this study is that there is not one published study which provides all the information required for the Cape York region. Therefore it has been necessary to select information from a variety of studies. For this reason, the scenario estimates should be treated as indicative of the ‘order of magnitude’ of changes only.
The focus chosen for this study is to estimate Value Added and Employment indicators. Value added represents wages and salaries and profits retained in an economy. Employment refers to full time equivalent jobs supported by the output.
In order to estimate the impact of change, ‘multipliers’ generated from Input-Output analysis are used. Value added multipliers describe the percentage change in an indicator with a change in direct output (or in the case of tourism, consumption). Employment multipliers describe how many full time equivalent jobs are supported, usually per $1 million of output.
Input-Output analysis can estimate impacts in the sector directly affected by a change and also in can estimate ‘flow-on effects’ in the economy as other sectors provide inputs to and absorb outputs from the sector initially affected. The full range of types of indicators and multipliers produced in various Input-Output studies is outlined in Table 34. Where possible both Direct and Direct plus Indirect effects are estimated for Value Added and Employment in this study. The selection of Direct and Direct plus Indirect effects (not including consumption induced effects) is a conservative approach taken in respect of limitations with Input-Output Analysis described above and as recommended by Dwyer et al.(2010).
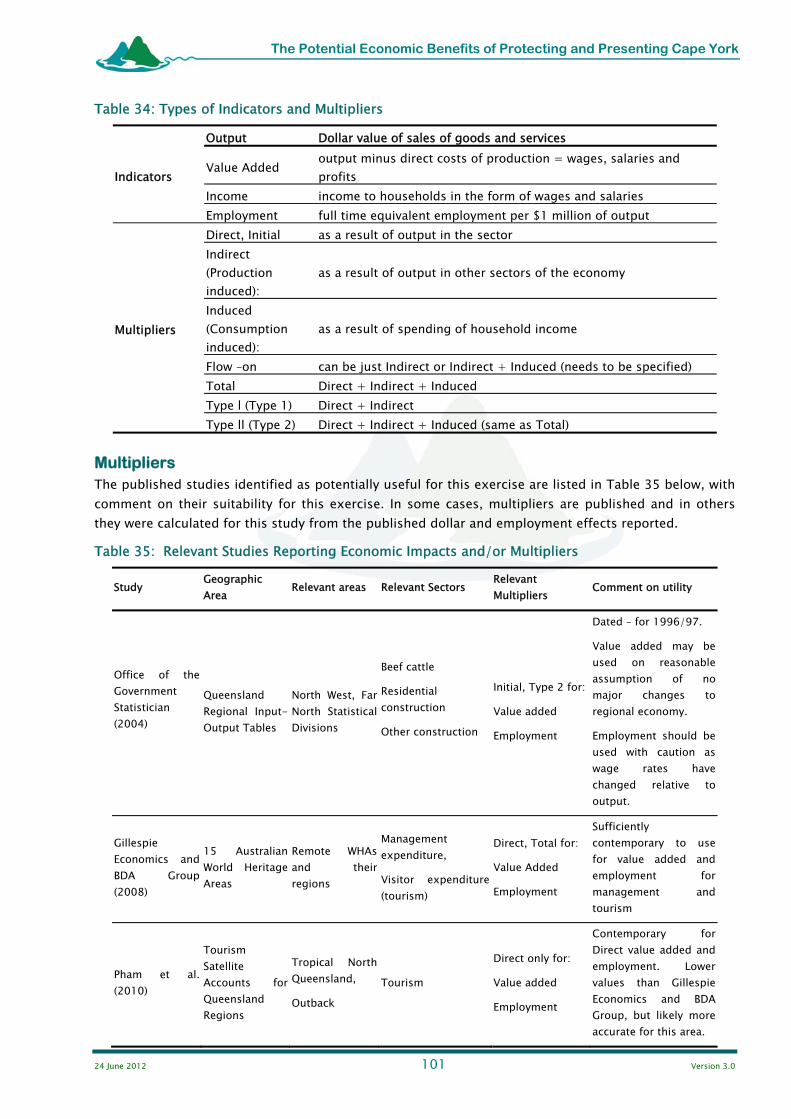
24 June 2012 101 Version 3.0
The Potential Economic Benefits of Protecting and Presenting Cape York
Table 34: Types of Indicators and Multipliers
Indicators
Output Dollar value of sales of goods and services
Value Added output minus direct costs of production = wages, salaries and profits
Income income to households in the form of wages and salaries Employment full time equivalent employment per $1 million of output
Multipliers
Direct, Initial as a result of output in the sector Indirect (Production induced):
as a result of output in other sectors of the economy
Induced (Consumption induced):
as a result of spending of household income
Flow –on can be just Indirect or Indirect + Induced (needs to be specified) Total Direct + Indirect + Induced Type l (Type 1) Direct + Indirect Type ll (Type 2) Direct + Indirect + Induced (same as Total)
Multipliers The published studies identified as potentially useful for this exercise are listed in Table 35 below, with comment on their suitability for this exercise. In some cases, multipliers are published and in others they were calculated for this study from the published dollar and employment effects reported.
Table 35: Relevant Studies Reporting Economic Impacts and/or Multipliers
Study Geographic Area Relevant areas Relevant Sectors Relevant
Multipliers Comment on utility
Office of the Government Statistician (2004)
Queensland Regional Input-Output Tables
North West, Far North Statistical Divisions
Beef cattle
Residential construction
Other construction
Initial, Type 2 for:
Value added
Employment
Dated – for 1996/97.
Value added may be used on reasonable assumption of no major changes to regional economy.
Employment should be used with caution as wage rates have changed relative to output.
Gillespie Economics and BDA Group (2008)
15 Australian World Heritage Areas
Remote WHAs and their regions
Management expenditure,
Visitor expenditure (tourism)
Direct, Total for:
Value Added
Employment
Sufficiently contemporary to use for value added and employment for management and tourism
Pham et al. (2010)
Tourism Satellite Accounts for Queensland Regions
Tropical North Queensland,
Outback Tourism
Direct only for:
Value added
Employment
Contemporary for Direct value added and employment. Lower values than Gillespie Economics and BDA Group, but likely more accurate for this area.

24 June 2012 102 Version 3.0
The Potential Economic Benefits of Protecting and Presenting Cape York
Study Geographic Area Relevant areas Relevant Sectors Relevant
Multipliers Comment on utility
Stoeckl et al. (2011)*
Daly and Mitchell River catchments
Mitchell River Catchment
Accommodation
Agriculture
Transport
Construction
Government
Total Employment,
Indigenous Employment,
Non Indigenous Employment
Employment multipliers higher than other sources.
Estimates impacts for remote region equivalent to Cape York excluding Cooktown.
*Also includes Type l, Type ll for Output, but Output is not reported in this study.
The multipliers actually used in the modelling are reported in Table 36. Not all these are selected for final reporting, as conservative estimates are generally favoured. One exception is Conservation Management where the expected employment modelled for the ‘No Action’ scenario using the higher range multipliers estimated from Gillespie Economics and BDA Group (2008) is very close to actual employment estimated during research conducted for this study. Therefore the higher range multipliers are adopted for value added and employment for Conservation Management.
Unfortunately, the latest Input-Output Tables for Queensland regions are for 1996-97. These are used to provide multipliers for Tourism Construction, Tourism Roads and Grazing, in the absence of more recent information. The value added as a percentage of output may well be similar today as the basic economic structure of the region remains similar. However the employment relationships will have changed due to wage rates approximately doubling since 199756. The employment per $1 million output relationship will have changed so there is less employment per $1 million output today. This does not imply a halving of employment numbers, as wages make up only part of the input costs. However, the employment estimates may be somewhat overstated. Employment multipliers from Stoeckl et al. (2011) were tested but as they are higher, they are not selected for reporting. For this reason, the indigenous and non indigenous employment multipliers are not selected for reporting, but are discussed in the Indigenous Employment section of this report.
Table 36: Multipliers Used in Estimates for this Study
Cape York industry/activity Multipliers used Regional impact implied
Tourism
Gillespie Economics and BDA Group (2008). Visitor sector
Value added (mid) Direct Direct + indirect Employment (mid) Direct Direct + indirect
0.42 0.52 5.8 6.7
Region equivalent to a Statistical Division
Pham et al (2010) Tourism sector
Value added Direct Employment Direct
0.31 5.3
Tropical North Queensland Tourism Region (similar to Far North Region)
Tourism construction
OGS (2004)
Value added Direct Direct + indirect Employment Direct Direct + indirect
0.4 0.6 7.1
OGS (2004) Far North Region
56 Australian Bureau of Statistics, 1977 and 2011, Average Weekly Earnings, Catalogue Number 6302.0

24 June 2012 103 Version 3.0
The Potential Economic Benefits of Protecting and Presenting Cape York
10.2
Stoeckl et al 2011 Employment Total
22
Remote region equivalent to Cape York ex Cooktown
Conservation management
Gillespie Economics and BDA Group 2008. Management sector
Value added (high) Direct Direct + indirect Employment (high) Direct Direct + indirect
0.71 0.76
8.4 9.6
Region equivalent to Statistical Division
Road construction OGS (2004)
Value added Direct Direct + indirect Employment Direct Direct + indirect
0.5 0.6 10 13
OGS (2004) Far North Region
Stoeckl et al (2011) Employment Total
22
Remote region equivalent to Cape York ex Cooktown
Grazing OGS (2004)
Value added Direct Direct + indirect Employment Direct Direct + indirect
0.4 0.7 8.7 13.6
OGS (2004) Far North Region
Stoeckl et al (2011) Employment Total
21
Remote region equivalent to Cape York ex Cooktown
Modelling Approach The economic impact assessment employs an Excel spreadsheet to model the scenarios from 2011 to 2031. The ‘No Action’ scenario uses data and estimates for the year 2011 drawn from the description of the current economic status of industries and activities in the region of interest, as presented earlier in this report. All dollar values are in 2011 dollars.
Data and Assumptions for Tourism It is expenditure by tourists that supports value added and employment in the economy. Therefore expenditure for 2011 was established using data and assumptions outlined earlier in the report. In summary, this is that current visitor numbers are 50,000 per annum, the average length of stay is 7 nights and 80% of visitors are Australians.
For the No Action scenario, tourism is assumed to grow at an average rate projected for Australia by the Tourism Forecasting Committee (2011). This is +0.3% per annum for domestic tourists and +3.6% per annum for international visitors.
The average expenditure per day for visitors who camped is based on Tourism Research Australia’s report on Queensland’s Outback and Central West (Tourism Research Australia 2011c) (an average of $70 per day converted to $73 in 2011 dollars). For visitors staying in safari lodge, eco lodge or motel accommodation, the estimated expenditure per day is based on the average between $127 per day for international visitors and $191 per day for domestic visitors to Tropical North Queensland (Tourism Research Australia 2010). This is around $159 per day in 2010, converted to $165 in 2011 dollars.
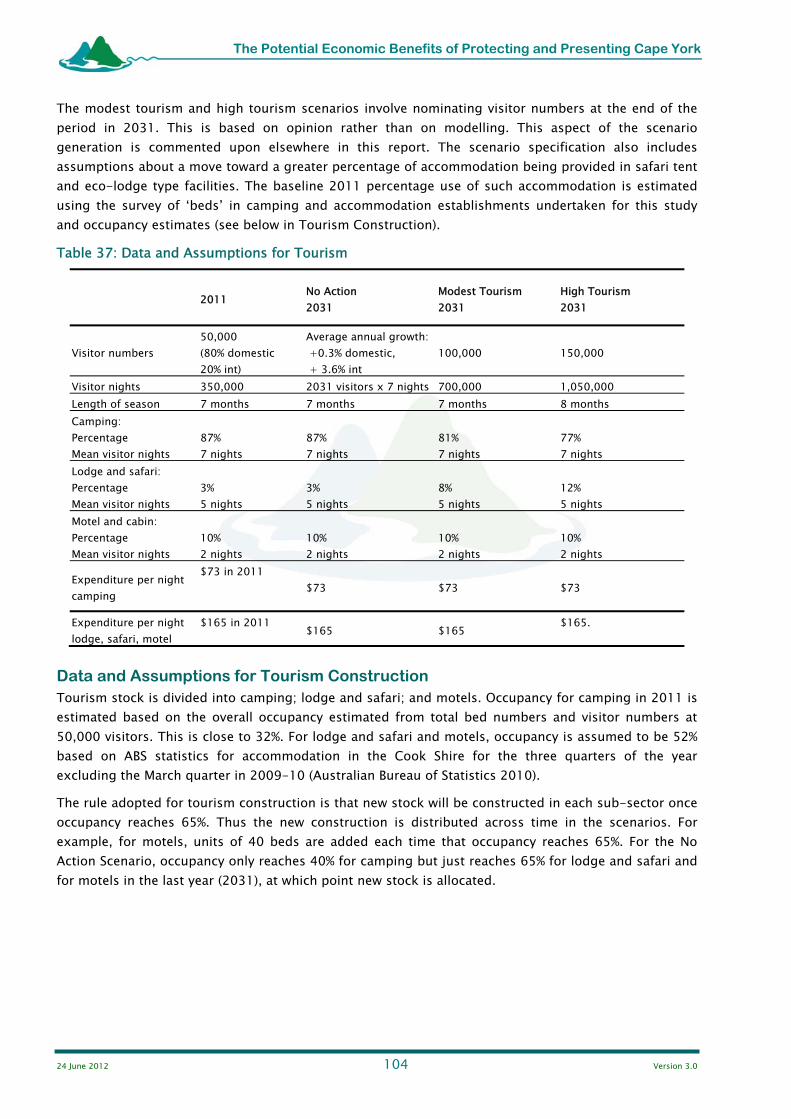
24 June 2012 104 Version 3.0
The Potential Economic Benefits of Protecting and Presenting Cape York
The modest tourism and high tourism scenarios involve nominating visitor numbers at the end of the period in 2031. This is based on opinion rather than on modelling. This aspect of the scenario generation is commented upon elsewhere in this report. The scenario specification also includes assumptions about a move toward a greater percentage of accommodation being provided in safari tent and eco-lodge type facilities. The baseline 2011 percentage use of such accommodation is estimated using the survey of ‘beds’ in camping and accommodation establishments undertaken for this study and occupancy estimates (see below in Tourism Construction).
Table 37: Data and Assumptions for Tourism
2011 No Action
2031 Modest Tourism 2031
High Tourism 2031
Visitor numbers 50,000 (80% domestic 20% int)
Average annual growth: +0.3% domestic, + 3.6% int
100,000 150,000
Visitor nights 350,000 2031 visitors x 7 nights 700,000 1,050,000 Length of season 7 months 7 months 7 months 8 months Camping: Percentage Mean visitor nights
87% 7 nights
87% 7 nights
81% 7 nights
77% 7 nights
Lodge and safari: Percentage Mean visitor nights
3% 5 nights
3% 5 nights
8% 5 nights
12% 5 nights
Motel and cabin: Percentage Mean visitor nights
10% 2 nights
10% 2 nights
10% 2 nights
10% 2 nights
Expenditure per night camping
$73 in 2011
$73 $73 $73
Expenditure per night lodge, safari, motel
$165 in 2011 $165 $165 $165.
Data and Assumptions for Tourism Construction Tourism stock is divided into camping; lodge and safari; and motels. Occupancy for camping in 2011 is estimated based on the overall occupancy estimated from total bed numbers and visitor numbers at 50,000 visitors. This is close to 32%. For lodge and safari and motels, occupancy is assumed to be 52% based on ABS statistics for accommodation in the Cook Shire for the three quarters of the year excluding the March quarter in 2009-10 (Australian Bureau of Statistics 2010).
The rule adopted for tourism construction is that new stock will be constructed in each sub-sector once occupancy reaches 65%. Thus the new construction is distributed across time in the scenarios. For example, for motels, units of 40 beds are added each time that occupancy reaches 65%. For the No Action Scenario, occupancy only reaches 40% for camping but just reaches 65% for lodge and safari and for motels in the last year (2031), at which point new stock is allocated.

24 June 2012 105 Version 3.0
The Potential Economic Benefits of Protecting and Presenting Cape York
Table 38: Data and assumptions for Tourism Construction
2011 No Action
2031
Modest Tourism
2031
High Tourism2031
Camping: occupancy 32% 40%
65%+ 65%+
Lodge and safari: Occupancy 52% 65%
65%+ 65%+
Motel and cabin: Occupancy 52% 65%
65%+ 65%+Bush camping (sites/”beds”) 1,000 1,000 600 750Developed non-commercial camping (s/b) 1,500 1,500 1,600 2,000Commercial camping (sites/”beds”) 2,000 2,000 1,500 2,000Safari Camp (sites/beds) 2/50 2/50 8/160 20/400Ecolodge (sites/beds) 4/24 4/24 10/200 15/300
Motel/cabins (sites/beds)
25/1,000** assumed 300 currently used
for tourism
25/1,000 30/1100 36/1300
Total beds 5574 5574 5160 6750Approx beds needed for 65% occupancy 5128 6731
The following estimates of tourism construction costs were developed by the authors in consultation with tourism industry experts. It is important to note that these are a gross generalisation and each site will have infrastructure and other costs which vary widely. Further, land acquisition, planning, feasibility and approval costs, nor business establishment capital requirements are not included.
Table 39: Estimates of Tourism Construction Costs
Accommodation type Cost per ‘bed’ 2011 dollarsBush camping $1000Developed camping $5000Commercial camping $10,000Safari camp beds $75,000Ecolodge beds $125,000Motel beds $100,000
Data and Assumptions for National Park Visitor Management The tourism attractions of Cape York are primarily nature based and include significant National Park areas. The Department of Environment and Resource Management (DERM) is responsible for managing National Parks and providing management activities aimed at facilitating and managing visitor use and its impacts. It was decided to treat this as a separate activity from conservation management as the level of expenditure by DERM on visitor management is assumed to be related to visitor numbers and will therefore need to grow with visitor numbers in the WHA scenarios. In addition, DERM provides camping sites and charges fees for camping in National Parks. The expenditure injected into the region for National Park management is modelled to estimate value added and employment as it is clearly greater than the revenue from camping fees.
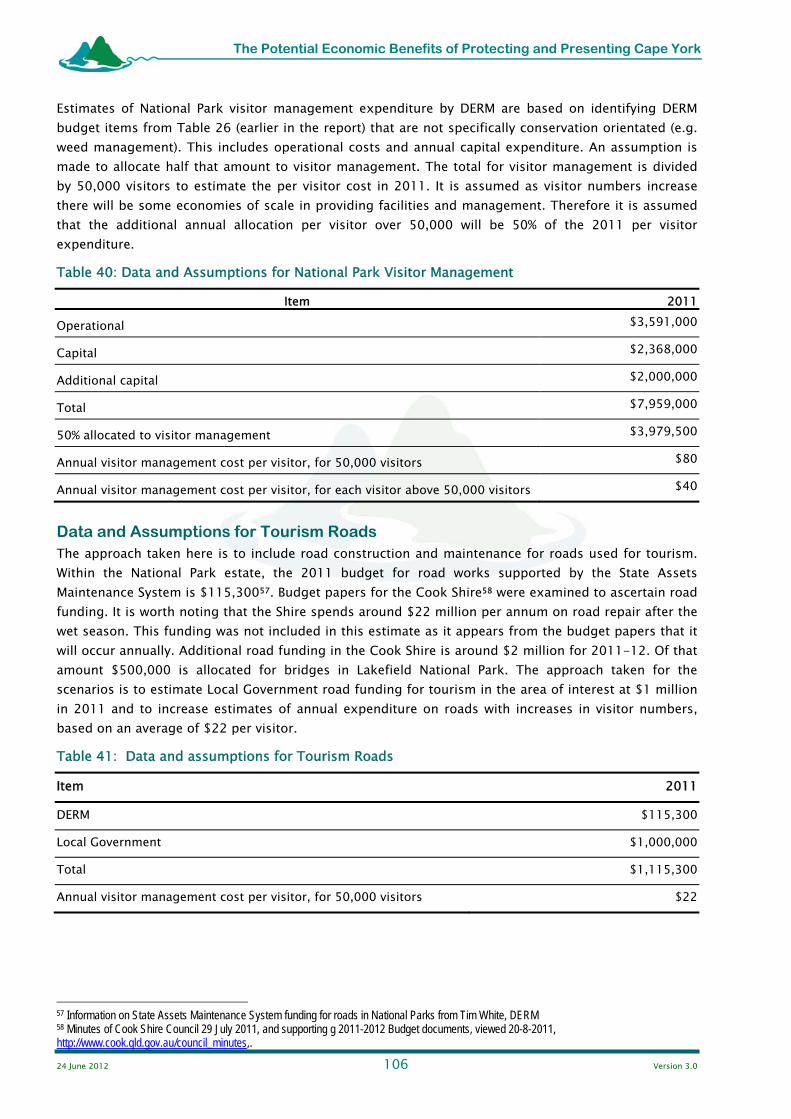
24 June 2012 106 Version 3.0
The Potential Economic Benefits of Protecting and Presenting Cape York
Estimates of National Park visitor management expenditure by DERM are based on identifying DERM budget items from Table 26 (earlier in the report) that are not specifically conservation orientated (e.g. weed management). This includes operational costs and annual capital expenditure. An assumption is made to allocate half that amount to visitor management. The total for visitor management is divided by 50,000 visitors to estimate the per visitor cost in 2011. It is assumed as visitor numbers increase there will be some economies of scale in providing facilities and management. Therefore it is assumed that the additional annual allocation per visitor over 50,000 will be 50% of the 2011 per visitor expenditure.
Table 40: Data and Assumptions for National Park Visitor Management
Item 2011
Operational $3,591,000
Capital $2,368,000
Additional capital $2,000,000
Total $7,959,000
50% allocated to visitor management $3,979,500
Annual visitor management cost per visitor, for 50,000 visitors $80
Annual visitor management cost per visitor, for each visitor above 50,000 visitors $40
Data and Assumptions for Tourism Roads The approach taken here is to include road construction and maintenance for roads used for tourism. Within the National Park estate, the 2011 budget for road works supported by the State Assets Maintenance System is $115,30057. Budget papers for the Cook Shire58 were examined to ascertain road funding. It is worth noting that the Shire spends around $22 million per annum on road repair after the wet season. This funding was not included in this estimate as it appears from the budget papers that it will occur annually. Additional road funding in the Cook Shire is around $2 million for 2011-12. Of that amount $500,000 is allocated for bridges in Lakefield National Park. The approach taken for the scenarios is to estimate Local Government road funding for tourism in the area of interest at $1 million in 2011 and to increase estimates of annual expenditure on roads with increases in visitor numbers, based on an average of $22 per visitor.
Table 41: Data and assumptions for Tourism Roads
Item 2011
DERM $115,300
Local Government $1,000,000
Total $1,115,300
Annual visitor management cost per visitor, for 50,000 visitors $22
57 Information on State Assets Maintenance System funding for roads in National Parks from Tim White, DERM 58 Minutes of Cook Shire Council 29 July 2011, and supporting g 2011-2012 Budget documents, viewed 20-8-2011, http://www.cook.qld.gov.au/council_minutes,.

24 June 2012 107 Version 3.0
The Potential Economic Benefits of Protecting and Presenting Cape York
Data and Assumptions for Conservation Management The conservation management programs identified for this report are shown on Table 26 earlier in the report. As described above, some of the DERM budget is allocated to visitor management. The remainder DERM budget is allocated to conservation management along with the other programs listed in that table.
Further information was obtained on the Nature Refuge program. Two funding programs are administered by DERM. Payments to Traditional Owners for conservation agreements on Cape York averaged $227,000 in the five years to 2011-12. In addition this program has $150,000 per annum to support landholders59. The Nature Assist program funded projects in Cape York at an average of $697,000 for five years from 2008-09. Thus an amount of $1 million is allocated to ‘Nature Refuges’ for 201160.
For the No Action Scenario, the 2011 level of expenditure is assumed to continue unchanged. The modest conservation scenario also continues most expenditure unchanged but includes a boost in Nature Refuge funding to $2,500,000 per annum. The high conservation scenario assumes a 20% increase in all expenditure except Nature Refuges, which increases to $5,000,000 per annum.
Table 42: Data and Assumptions for Conservation Management
Current 2011 No Action
annual
Modest conservation annual*
High conservationannual*
Programs on Table 26 minus DERM
funding allocated to visitor management
$11,940,400
Continue 2011 funding of
$11,940,400
Continue 2011 funding
$11,940,400
2011 funding + 20%
14,328,480
Nature Refuges $1,000,000 $1,000,000 $2,500,000 $5,000,000
Total $12,940,000 $12,940,000 $14,440,400 $19,328,480
*commences 2014
Data and Assumptions for Grazing The No Action Scenario for grazing is estimated based on current levels of grazing and returns to grazing in the region of interest. Returns to grazing are discussed in an earlier section of the report. It is assumed that there are no changes in grazing associated with the other four WHA scenarios.
Table 43: Data and Assumptions for Grazing
Per property2011 dollars
Total for 44 properties on 4.9 million ha.
2011 dollarsAnnual Income $181,600 $7,990,000Annual Gross margin $56,000 $2,462,000
59 Information provided by DERM 60 Information provided by DERM

24 June 2012 108 Version 3.0
The Potential Economic Benefits of Protecting and Presenting Cape York
Tourism to Cooktown In addition to the modelling of impacts due to increased tourism in the area of interest, it is assumed that additional tourism to Cooktown will be generated due to visitors passing through on their way to and from the area of interest. A separate estimate of expenditure by tourists is made and modelled. This is based on 25% of visitors to the area of interest staying in Cooktown for one night at $165 per night. This is estimate is entirely due to expenditure by tourists and does not include tourism construction or any government expenditure.
Cost Benefit Type Presentation Cost Benefit Analysis (CBA) is concerned with all the private and social costs and benefits of a proposal. In CBA, “welfare benefits are generally calculated by measuring the additional consumer surplus and producer surplus of a given option over the ‘do nothing’ or ‘base case’” (Dwyer et al, 2010 page 368). All present and future costs and benefits are discounted to a ‘present value’ and compared in a Net Present Value (NPV) sum across all the years. Ideally all costs and benefits, including social and environmental aspects are measured and compared in dollar terms. Technical requirements include shadow pricing resources at their opportunity cost (Dwyer et al 2010). In addition, the scope of a CBA includes defining the relevant community for whom the CBA is conducted (Campbell and Brown 2003).
This presentation does not strictly comply with all the requirements of a CBA. It can rather be considered the first steps towards a CBA.
A descriptive table is developed to illustrate what would be considered to be the full range of costs and benefits if all were able to be measured in dollar terms, see Table 44.
There has been no attempt to limit the presentation to a defined community, rather it is seen as relevant at this stage to list in Table 44 where all the costs and benefits fall, locally to internationally.
Table 44: Cape York: Descriptive Range of Costs and Benefits for Scenarios
Costs Benefits Net Benefits
Tourism
Goods and services inputs to tourism businesses, including wages and salaries
Any environmental damage from tourism
Expenditure by tourists
Consumers surplus to tourists
Producer surplus to tourism businesses
Consumers surplus to tourists
Where costs/benefits fall
Tourism businesses in Cape York
Any damage costs fall on national and possibly international community
Tourism businesses in Cape York
Consumers surplus captured by tourists
Tourism businesses in Cape York (producer surplus)
Consumers surplus captured by tourists
National Park Visitor Management
Government expenditure on visitor management
Expenditure by NP campers
Consumer surplus to visitors (especially where entry fees are nil or low)
Government expenditure net of camping revenue
Consumer surplus to visitors
Where costs/benefits fall Queensland and Australian taxpayers
NP campers
Consumer surplus to visitors
Taxpayers
Visitors
Tourism construction Construction costs
Any environmental damage
Included in expenditure by tourists
Accounted for in net tourism benefits above

24 June 2012 109 Version 3.0
The Potential Economic Benefits of Protecting and Presenting Cape York
Costs Benefits Net Benefits
from tourism construction
Where costs/benefits fall
Tourism providers in Cape York
Any damage costs fall on national and possibly international community
As above As above
WH branding and marketing Government expenditure on WH branding and marketing
Included in expenditure by tourists
Accounted for in net tourism benefits above
Where costs/benefits fall Queensland and Australian taxpayers As above As above
Tourism Road construction Government expenditure on road construction
Tourism benefits included above
Tourism benefits included above
Where costs/benefits fall Local government and Queensland rate/taxpayers As above As above
Conservation management
Government expenditure on CM
Benefits of conservation
Benefits of indigenous employment
Net Benefits of conservation and Indigenous employment minus costs
Where costs/benefits fall Local Government, Queensland and Australian rate/taxpayers
Australian and international community, future generations
Cape York Indigenous communities
Australian and international community, future generations
Cape York Indigenous communities
Grazing Costs of production including wages and salaries Income from sales of cattle Producers surplus
Where costs/benefits fall Cape York grazing property owners
Cape York grazing property owners
Cape York grazing property owners
The actual ability to value costs and benefits in dollar terms is somewhat limited for this exercise. Due to the limited resources for this study, no attempt is made to estimate dollar values for some of the non-market but important social and environmental values associated with Cape York. Significant amongst these are the values of conservation of the natural environment of Cape York. These will accrue to current and future generations, locally, nationally and internationally. Nor was there any attempt to value the acknowledged social benefits of indigenous employment (see a discussion of this earlier in the report).
For this presentation, dollar values generated in the economic impact analysis are modified where necessary and calculated in present value terms. A principle of the cost benefit approach is to value all costs and benefits in present value terms. That is, future values are discounted each year by an appropriate discount rate and then added up to a single ‘present value’ amount. The appropriate discount rate for social cost benefit analysis is often the long term government bond rate. For Australia, the10 year government bond yield ranged between 4.5% and 5.5% over the period 2009 to 2011 (Reserve Bank of Australia 2011), therefore a rate of 5.0% is used for the presentation.

24 June 2012 110 Version 3.0
The Potential Economic Benefits of Protecting and Presenting Cape York
The presentation of results is in terms of the No Action Scenario and the difference between the four WHA ‘change’ scenarios and No Action.
Obviously, due to the significant items of missing values in dollar terms (and the other limitations described above), it is not possible to derive a single Net Present Value or cost benefit ratio for the various scenarios. However, the results are informative as to the order of magnitude of the items able to be estimated in dollar terms.
Table 45 shows what is able to be presented in dollar terms and what appears in descriptive terms in the cost benefit type presentation.
Data and Assumptions for Tourism Present Values Tourism expenditure is estimated in the economic impact assessment. The costs of tourism are estimated by firstly taking the difference between expenditure and value added (which represents input costs not including wages and salaries). Secondly, wages are estimated using the employment for the sector at the average wage rate for the Far North Statistical Division (balance excluding Cairns) of $34,000 in 2008 (Australian Bureau of Statistics 2010c) converted to $36,830 in 2011 dollars, and added to the cost. Thirdly, the interest costs on capital for new tourism construction are subtracted from cost to avoid double counting these costs (see below). The producer surplus is the difference between expenditure and cost.
No costs or benefits for environmental damage or rehabilitation associated with tourism have been included. It is assumed that the significant funding of visitor management and conservation management will involve proactive sustainable outcomes preventing negative impacts of tourism. However, this is a matter for constant monitoring and management.
Data and Assumptions for National Park Visitor Management Present Values Costs of National Park visitor management are estimates in the economic impact analysis. Revenue from camping fees is estimated on the basis of the number of National Park camping ‘beds’ by 32% occupancy for 7 months, by the standard fee of $5.30 per night61.
Table 45: Present Values (2011 to 2031) and Description of Costs and Benefits for Scenarios
Costs Benefits Net Benefits
Tourism Present value of costs of inputs, wages
(dollars)
Present value of expenditure by tourists (minus NP campers)
(dollars)
Present value of tourism producer surplus (dollars)
Consumer surplus (not estimated)
National Park visitor management
Present value of government expenditure on NP visitor management
(dollars)
Present value of revenue from National Park camping
(dollars)
Present value of net expenditure on NP visitor management
(dollars)
National Park visitors
Present value of consumer surplus to National Park visitors
(dollars)
Present value of consumer surplus to National Park visitors
(dollars)
61 DERM national park camping fees, viewed 26-8-11, http://www.derm.qld.gov.au/parks_and_forests/index.html,

24 June 2012 111 Version 3.0
The Potential Economic Benefits of Protecting and Presenting Cape York
Costs Benefits Net Benefits
WH branding and marketing
Present value of government expenditure on WH branding and marketing
(dollars)
$0 (Included above) Present value of cost of WH branding and marketing
(dollars)
Tourism construction Present value of annual opportunity costs of construction (dollars)
$0 (Included above) Present value of cost of Tourism Construction
(dollars)
Tourisms roads Present value of annual construction costs (dollars) $0 (Included above)
Present value of cost of Tourism Roads
(dollars)
Conservation management
Present value of government (and some private) expenditure on CM
(dollars)
Non market benefits of conservation (not estimated)
Non market benefits of Indigenous employment (not estimated)
No dollar figure able to be included here
Grazing Present value of Input costs
(dollars)
Present value of income from sales
(dollars)
Present value of producer surplus
(dollars)
Data and Assumptions for National Park Visitor Consumer Surplus Present Values People who visit National Parks may experience ‘consumer surplus’, which represents the amount they are willing to pay for the experience above what they have to pay. This is particularly the case where there are no or low visitor entry fees to National Parks. It is usual to include this consumer surplus in a Cost Benefit Analysis. There are a variety of methods available to estimate the non market values of consumer surplus that have been endorsed by the Queensland Government for use in economic analysis (Environmental Protection Agency 2003).
A study conducted in the Wet Tropics World Heritage Area estimated the average consumer surplus to visitors to that area using the travel cost analysis method (Driml 1996). That study found an average consumer surplus of $49 per visitor in 1996 (and that visitors spent on average one or two days visiting the Wet Tropics WHA). For the purposes of this study, it is considered that the Wet Tropics WHA is sufficiently similar to allow use of the ‘benefit transfer’ method (Environmental Protection Agency 2003) to apply the consumer surplus of Wet Tropics visitors to Cape York visitors. A conservative approach is taken by using the consumer surplus for Wet Tropics visitors which applied for one to two days to Cape York visitors who stay longer (for example 7 days). The 1996 value of $49 is converted to 2011 dollars at $73 per visitor.
Data and assumptions for Tourism Construction Present Values Costs of tourism construction are valued at the annual opportunity cost of the capital plus depreciation. The opportunity cost of capital is valued at a market rate of 9.5% based on an average of business investment rates offered by Australia’s major banks62. The depreciation rate is based on the Australian Taxation Office depreciation formula for capital works using a rate of 2.5% per annum over 40 years63.
62 Based on business loan rates of Commonwealth Bank, Westpac and ANZ web sites, viewed 24-4-2012. 63 Australian Taxation Office, viewed 24-4-2012, http://www.ato.gov.au/content/00183243.htm.
24 June 2012 112 Version 3.0
The Potential Economic Benefits of Protecting and Presenting Cape York
Data and Assumptions for Conservation Management Present Values Government and private expenditure on conservation management is treated as a cost. This is estimated in the economic impact analysis. Note the significant non market social and environmental benefits of conservation and indigenous employment associated with conservation management are not estimated in dollar terms.
Data and Assumptions for Tourism Roads Present Values Government expenditure on provision of roads associated with tourism use is estimated for the economic impact analysis. Some of the benefits of roads are captured in tourism surpluses above. However it should be recognised that major road work will also provide broader benefits to the region where roads also provide access for other community and business activity. For this reason, the study is restricted to estimated expenditure on roads associated with tourism use.
Data and Assumptions for Grazing Present Values Information available on grazing includes income from the sale of cattle plus ‘gross margins’ which is income minus variable costs. An estimate of variable costs is made by subtracting the gross margin from income. This gives a conservative estimate of costs as it does not include fixed costs including salary to the property owner. The producer surplus is estimated as income minus costs and because costs are conservative, the producer surplus may be overstated.

24 June 2012 113 Version 3.0
The Potential Economic Benefits of Protecting and Presenting Cape York
Modelled Potential Economic Benefits
Summary Results of Economic Modelling The economic modelling of the potential economic benefits of protecting and presenting Cape York takes the form of comparing a No Action Scenario with four scenarios of potential change with world heritage listing. The change scenarios are possible changes based on assumptions set outside the modelling, that is, they are not predicted by the modelling. The basic approach for assessment is to measure the differences between the No Action Scenario and each change scenario. The modelling period was 2011 to 2031.
This sections provides summary tables, Appendix One includes specific outputs for each Scenario.
Value Added and Employment Economic impact assessment produces estimates of the economic indicators of Value Added and Employment. While a conservative approach is taken in selection of economic multipliers to use for these estimates, it should be noted that impacts estimated using multipliers generated by Input-Output analysis may be overstated if in reality there are constraints in the region in terms of skilled labour, capital or other resources needed to supply increased economic activity.
The economic impact assessment estimates impacts due to changes in the area of interest (excluding Cooktown), i.e. increased tourism to that area, and increased spending on conservation management for that area. Direct and indirect impacts however refer to impacts in the broader economic region of Far North Queensland.
The economic impact assessment shows value added and employment growing year by year for all scenarios. Aggregate results for the year 2031 are shown on Table 46. The industries/activities that are included in the assessment are:
Tourism National Park Visitor Management Tourism Construction Tourism Roads Conservation Management Grazing
All these activities except tourism construction will occur each year and will grow year by year. Tourism construction will occur only when occupancy of tourism accommodation reaches 65% and so will only occur in some years. An annual average of Value Added and Employment for Tourism Construction over the period 2011 to 2031 is included in Table 46.
In addition, potential impacts of tourism in Cooktown due to tourists, who are going to, or returning from, the area of interest are estimated, see Table 47. This is estimate is entirely due to expenditure by tourists and does not include tourism construction or any government expenditure.

24 June 2012 114 Version 3.0
The Potential Economic Benefits of Protecting and Presenting Cape York
Table 46: Value Added and Employment - related to area of interest for WH listing
Current 2011
No Action In 2031
Modest Conservation,
Modest TourismIn 2031
Modest Conservation, High Tourism
In 2031
High Conservation,
Modest Tourism In 2031
High Conservation, High Tourism
In 2031
Direct Value Added FNQ region* $24 m $26 m $36 m
(+$10 m)
(+38%)
$47 m(+$22 m)
(+85%)
$42 m (+$14 m)
(+54%)
$51 m(+$25 m)
(+96%)
Direct + Indirect Value added FNQ region*
$34 m $39 m $54 m(+$15 m)
$73 m(+$33 m)
$58 m
(+$19 m) $77 m)
(+$37 m
Direct FTE jobs FNQ region* 360 408 561
(+152)(+37%)
754(+346)(+85%)
601
(+192) (+47%)
796(+386)(+95%)
Direct +Indirect FTE jobs FNQ region*
469 532 727(+195)
978(+446)
775
(+243) 1025
(+493)
* Addition over No Action shown in brackets
Table 47: Value Added and Employment - related to extra tourism to Cooktown
Current 2011
No Action In 2031
Modest Conservation,
Modest TourismIn 2031
Modest Conservation, High Tourism
In 2031
High Conservation,
Modest Tourism In 2031
High Conservation, High Tourism
In 2031Direct Value Added FNQ region* $0.6 m $0.8 m $1 m
(+$0.5 m)$2 m
(+$1 m)
$1 m
(+$0.5 m) $2 m
(+$1 m)
Direct +Indirect Value added FNQ region*
$1 m $1 m $2 m(+$0.8 m)
$3 m(+$2 m)
$2 m (+$1 m)
$3 m(+$2 m)
Direct FTE jobs FNQ region* 12 15 24
(+9)36
(+21)
24
(+9) 36
(+)21Direct +Indirect FTE jobs FNQ region*
14 17 27(+10)
41(+24)
27
(+10) 41
(+24)
* Addition over No Action shown in brackets
Key Findings - Value Added and Employment Increases in Value Added and Employment shown in Tables 46 and 47 are due to modelled increases in:
Expenditure by tourists in the region Expenditure by government on National Park visitor management (this is modelled to increase
with tourism growth) Expenditure by government on roads for tourisms (this is modelled to increase with tourism
growth) Expenditure by government on conservation management
Value Added and Employment supported by income from sales from grazing is assumed to remain constant.
Increases in No Action to 2031 compared with Current in 2011 are mainly due to growth in tourism expenditure, growing at the expected ‘business as usual’ growth rate.
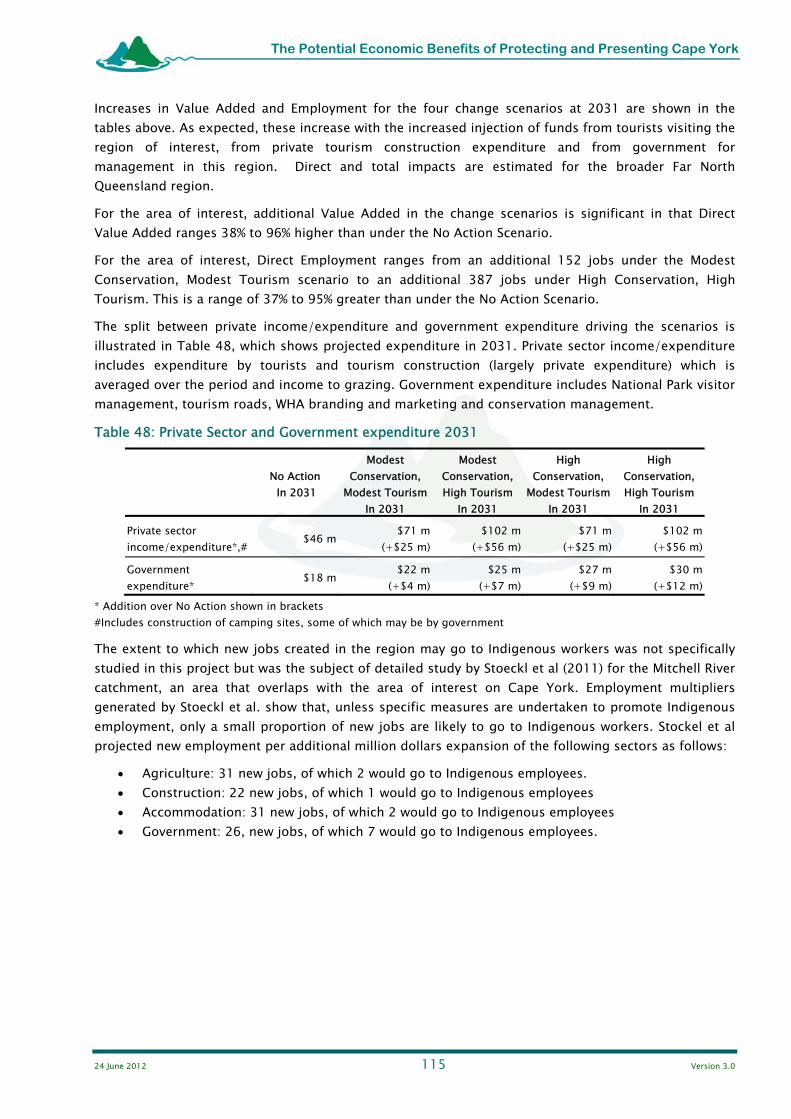
24 June 2012 115 Version 3.0
The Potential Economic Benefits of Protecting and Presenting Cape York
Increases in Value Added and Employment for the four change scenarios at 2031 are shown in the tables above. As expected, these increase with the increased injection of funds from tourists visiting the region of interest, from private tourism construction expenditure and from government for management in this region. Direct and total impacts are estimated for the broader Far North Queensland region.
For the area of interest, additional Value Added in the change scenarios is significant in that Direct Value Added ranges 38% to 96% higher than under the No Action Scenario.
For the area of interest, Direct Employment ranges from an additional 152 jobs under the Modest Conservation, Modest Tourism scenario to an additional 387 jobs under High Conservation, High Tourism. This is a range of 37% to 95% greater than under the No Action Scenario.
The split between private income/expenditure and government expenditure driving the scenarios is illustrated in Table 48, which shows projected expenditure in 2031. Private sector income/expenditure includes expenditure by tourists and tourism construction (largely private expenditure) which is averaged over the period and income to grazing. Government expenditure includes National Park visitor management, tourism roads, WHA branding and marketing and conservation management.
Table 48: Private Sector and Government expenditure 2031
No Action In 2031
Modest Conservation,
Modest TourismIn 2031
Modest Conservation, High Tourism
In 2031
High Conservation,
Modest Tourism In 2031
High Conservation, High Tourism
In 2031
Private sector income/expenditure*,# $46 m $71 m
(+$25 m)$102 m
(+$56 m)$71 m
(+$25 m) $102 m
(+$56 m)
Government expenditure* $18 m $22 m
(+$4 m)$25 m
(+$7 m)$27 m
(+$9 m) $30 m
(+$12 m)* Addition over No Action shown in brackets #Includes construction of camping sites, some of which may be by government
The extent to which new jobs created in the region may go to Indigenous workers was not specifically studied in this project but was the subject of detailed study by Stoeckl et al (2011) for the Mitchell River catchment, an area that overlaps with the area of interest on Cape York. Employment multipliers generated by Stoeckl et al. show that, unless specific measures are undertaken to promote Indigenous employment, only a small proportion of new jobs are likely to go to Indigenous workers. Stockel et al projected new employment per additional million dollars expansion of the following sectors as follows:
Agriculture: 31 new jobs, of which 2 would go to Indigenous employees. Construction: 22 new jobs, of which 1 would go to Indigenous employees Accommodation: 31 new jobs, of which 2 would go to Indigenous employees Government: 26, new jobs, of which 7 would go to Indigenous employees.
24 June 2012 116 Version 3.0
The Potential Economic Benefits of Protecting and Presenting Cape York
Sensitivity Analysis Initial sensitivity analysis was conducted on two variables that could possibly make a significant difference to results of economic impact assessment.
Reduce camping nights from 7 days to 5 days: As the Peninsula Development Road is upgraded and sealed, visitor stay may reduce. However, because National Park visitor management expenditure and roads expenditure is estimated on a per visitor basis (not per visitor night), reducing camping nights reduces tourism expenditure but not costs.
Increase per night expenditure in commercial accommodation from $165 to $200 per night: this does increase tourism expenditure, but not by much as this level of commercial accommodation is a relatively small (but growing) component of accommodation.
Cost Benefit Cost Benefit Analysis is an additional economic tool to inform decision makers of the costs and benefits of a proposal. It extends consideration to non-market social and environmental goods and services, even if it is not possible to place dollar values on all of these. This study is not a full Cost Benefit Analysis (CBA), but rather is the first stage towards a CBA. However, useful insights into the flows of costs and benefits over time can be gained. Costs and benefits are presented as discounted present values over the period modelled.
It is not possible to put dollar values on all relevant costs and benefits. Most importantly conservation benefits and Indigenous employment benefits are not valued.
Key Findings – Cost Benefit Type Presentation The study did put a dollar value on consumer surplus to National Park visitors (based on transferring results from a study of the Wet Tropics World Heritage Area). The presentation shows that there can be net benefits from National Park visitor use, that is, the consumer surplus enjoyed by visitors is greater than the costs to government of providing visitor management.
The analysis presents a net benefit assessment for all tourism related costs and benefits able to be estimated for this study by including the dollar values for: Tourism Expenditure, National Park Visitor Management, National Park Visitor Consumer Surplus, Tourism Construction, WHA Marketing and Tourism Roads. The No Action scenario shows net benefits of $38 million over the period to 2031 (Table 49). The other scenarios also display net benefits that are greater than those of the No Action scenario. These are additional net benefits of $13 million for the whole period to 2031 for scenarios with Modest Tourism and $30 million for the period for scenarios with High Tourism.
The cost benefit presentation is not able to cast light on whether there are growing benefits of conservation management with growth in investment in this area. This is an assessment that needs to be made outside the economic model.
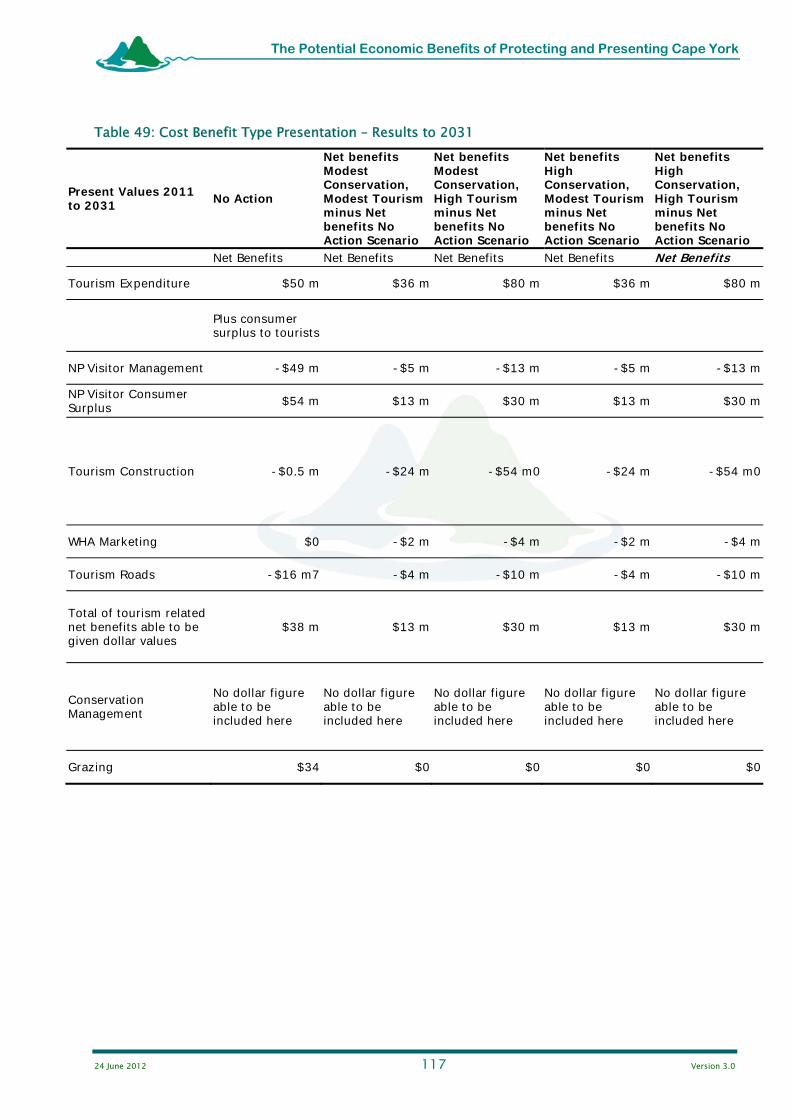
24 June 2012 117 Version 3.0
The Potential Economic Benefits of Protecting and Presenting Cape York
Table 49: Cost Benefit Type Presentation – Results to 2031
Present Values 2011 to 2031 No Action
Net benefits Modest Conservation, Modest Tourism minus Net benefits No Action Scenario
Net benefits Modest Conservation, High Tourism minus Net benefits No Action Scenario
Net benefits High Conservation, Modest Tourism minus Net benefits No Action Scenario
Net benefits High Conservation, High Tourism minus Net benefits No Action Scenario
Net Benefits Net Benefits Net Benefits Net Benefits Net Benefits
Tourism Expenditure $50 m $36 m $80 m $36 m $80 m
Plus consumer surplus to tourists
NP Visitor Management -$49 m -$5 m -$13 m -$5 m -$13 m
NP Visitor Consumer Surplus $54 m $13 m $30 m $13 m $30 m
Tourism Construction -$0.5 m -$24 m -$54 m0 -$24 m -$54 m0
WHA Marketing $0 -$2 m -$4 m -$2 m -$4 m
Tourism Roads -$16 m7 -$4 m -$10 m -$4 m -$10 m
Total of tourism related net benefits able to be given dollar values
$38 m $13 m $30 m $13 m $30 m
Conservation Management
No dollar figure able to be included here
No dollar figure able to be included here
No dollar figure able to be included here
No dollar figure able to be included here
No dollar figure able to be included here
Grazing $34 $0 $0 $0 $0
24 June 2012 118 Version 3.0
The Potential Economic Benefits of Protecting and Presenting Cape York
Conclusions
World heritage listing of itself will not result in an economic benefit to Cape York.
The key potential benefit from world heritage listing would be from the consequential growth in conservation management and tourism.
There are potential impacts on current economic activity or potential economic futures which could result from world heritage listing. This could be as a result of the prohibition or restriction of activities such as mining, quarrying, forestry, agriculture, grazing, tourism and community infrastructure and services.
In order to enable economic growth and mitigate potential impacts government would need to:
Increase and commit to long term conservation management funding.
Support tourism branding and ongoing marketing of Cape York.
Further develop facilities on visitor public lands such as national parks and foster commercial tourism and self drive visitor access to key areas.
Provide land for leases and planning approvals which allow for commercial development on a wide variety of land tenures.
Ensure world heritage management regime provides for the maintenance and ongoing development of community infrastructure such as roads, powerlines, water supplies and marine facilities.
Ensure the world heritage management regime provides areas for community growth and consequential retail and service industries.
Provide for ongoing grazing on most lands currently used for grazing.
Develop a streamlined approvals process and facilitate development approvals for sustainable uses with an economic benefit such as ecotourism and cultural tourism.
To maximise economic benefits the management regime needs to engage the local community, management staff be permanently based in the region and involve establishing long term programs which train, employ and empower indigenous and local community staff.
24 June 2012 119 Version 3.0
The Potential Economic Benefits of Protecting and Presenting Cape York
References
Access Economics, 2009, The Economic Contribution of the Great Barrier Reef Marine Park, 2006-2007, Great Barrier Reef Marine Park Authority Research Publication No. 98, Townsville.
Australian Bureau of Statistics, 2007, Census of Population and Housing, 2006, Basic Community Profile - B42, sourced from Office of Economic and Statistical Research, 2011, Queensland Regional Profiles, Queensland Treasury, Brisbane, viewed July 2011, http://statistics.oesr.qld.gov.au/qld-regional-profiles.
Australian Bureau of Statistics, 2008, Agricultural Commodities, Australia, 2005-06, cat. no. 7125.0, sourced from Office of Economic and Statistical Research, 2011, Queensland Regional Profiles, Queensland Treasury, Brisbane, viewed July 2011, http://statistics.oesr.qld.gov.au/qld-regional-profiles?
Australian Bureau of Statistics, 2010a, Regional Population Growth, Australia, 2009-10, cat. no. 3218.0 and unpublished data., sourced from Office of Economic and Statistical Research, 2011, Queensland Regional Profiles, Queensland Treasury, Brisbane, viewed July 2011, http://statistics.oesr.qld.gov.au/qld-regional-profiles
Australian Bureau of Statistics, 2010b, Tourism Accommodation, Small Area Data, Queensland, June 2010, Australian Bureau of Statistics, Canberra.
Australian Bureau of Statistics 2010c, National Regional Profile: Far North SD Balance Catalogue Number 35010, Australian Bureau of Statistics, Canberra.
Australian Government, 2008, National Landscapes Program, Tourism Australia and Parks Australia, Canberra.
Australian Government, 2009, National Long Term Tourism Strategy, Department of Resources, Energy and Tourism, Canberra.
Buckley, R, 2002, World Heritage Icon Value, Australian Heritage Commission, Canberra.
Cape York Regional Advisory Group (1997). “Cape York Peninsula Land Use Strategy – Our Land Our future: A Strategy for Sustainable Land Use and Economic and Social Development. Commonwealth and Queensland Governments
Cape York Sustainable Futures 2010, New Horizons and Opportunities – Cape York Peninsula, Cape York Sustainable Futures, Cairns.
Campbell H.F. & Brown R. P. C., 2003, Benefit Cost Analysis: Financial and Economic Appraisal Using Spreadsheets, Cambridge University Press, Melbourne
Cotter, G. F. 1995, Management of Pastoral Holdings in Cape York Peninsula, Cape York Peninsula Land Use Strategy, Australian Government, Canberra.
Department of Employment, Economic Development and Innovation, 2010, The Queensland Beef Industry, Current Trends and Projections, Department of Employment, Economic Development and Innovation, Brisbane.
Driml, S.M. 1996. Sustainable Tourism in Protected Areas?: An ecological economics case study of the Wet Tropics World Heritage Area. PhD Thesis, Australian National University, Canberra
Driml, S. M., 2000, ‘Ecotourism – Opportunities and Threats’ in McDonald, G. M. and Lane M. (Eds) Securing the Wet Tropics, The Federation Press, Leichardt NSW.

24 June 2012 120 Version 3.0
The Potential Economic Benefits of Protecting and Presenting Cape York
Driml, S. & McLennan, C., 2010, Handbook on Measuring the Economic Value of Tourism to National Parks, Sustainable Tourism Co-operative Research Centre, Gold Coast.
Driml, S., 2010, The Economic Value of National Parks and Protected Areas in Australia, Sustainable Tourism Cooperative Research Centre, Gold Coast.
Driml, S., Robinson, J., Tkaczynski, A. and Dwyer, L., 2010, Tourism Investment in Australia: A Scoping Study, Sustainable Tourism Co-operative Research Centre, Gold Coast.
Driml S, Brown, R.P.C., Ballantyne, R., Pegg, S. and Scott, N. 2011, A method for estimating the state-wide economic significance of national park tourism: the case of Queensland, Tourism Analysis (in press).
Dwyer, L. Forsyth, P. and Dwyer, W. 2010, Tourism Economics and Policy, Channel View Publications, Bristol
Environmental Protection Agency, 2003, Environmental Economic Valuation: An Introductory Guide for Policy Makers and Practitioners, Environmental Protection Agency, Brisbane.
EcoSustainAbility, 2010 Cape York World Heritage – Discussion Paper, for Cape York Sustainable Futures.
Ganesharajah, C. 2009, Indigenous Health and Wellbeing: The Importance of Country, Native Title Research Unit, Australian Institute of Aboriginal and Torres Strait Islander Studies, Canberra.
Garnett, S.T. and Sithole, B. 2007. Sustainable Northern Landscapes and the Nexus with Indigenous Health: Healthy Country Healthy People. Land and Water Australia, Canberra
Gillespie Economics and BDA Group, 2008, Economic Activity of Australia’s World Heritage Areas, Department of the Environment, Water, Heritage and the Arts, Canberra.
Gobius, N., Drucker, A. and Garnett, S. 2008, Final Report: Remote Sensing and the Economics of Fire Management for Sustainable Pastoralism, Cape York Peninsula Development Association.
Office of the Government Statistician, 2004, Queensland Regional Input Output Tables 1996-97, 34 Industries, Queensland Government, Brisbane.
Pham, T. D., Dwyer, L., Spurr, R. 2010, Regional Economic Contribution of Tourism Destinations in Queensland, Sustainable Tourism Cooperative Research Centre, Gold Coast.
Planning for People 2010 Management Arrangements for Potential World Heritage Listing for Cape York Peninsula – Issues and Options Discussion Paper
Queensland Government, 2010, Tropical North Queensland Tourism Opportunity Plan, Tourism Queensland, Brisbane.
Queensland Resources Council 2011, Cape Flattery Silica Mines, viewed 7-6-2011, http://www.qrc.org.au/01_directory/details.asp?ID=9
Queensland Treasury, 2008, Experimental Estimates of Gross Regional Product, Queensland Treasury, Brisbane.
Reserve Bank of Australia 2011, Reserve Bank Statement on Monetary Policy, August 2011, Reserve Bank of Australia, Sydney.
Rio Tinto Alcan 2010, Weipa 2009 Sustainable Development Review, Rio Tinto Alcan.
Stoeckl, N., Esparon, M, Stanley, O., Farr, M., Delisle, A. and Altai, Z. 2011, Socio-Economic Activity and Water Use in Australia's Tropical Rivers: A Case Study in the Mitchell and Daly River Catchments, Tropical Rivers and Coastal Knowledge, Charles Darwin University, Darwin.

24 June 2012 121 Version 3.0
The Potential Economic Benefits of Protecting and Presenting Cape York
Sithole, B. and Hunter-Xenie, H. with Lorraine Williams, Jonnie Saegenschnitter, Dean Yibarbuk, Matthew Ryan, Otto Campion, Balupalu Yunupingu, Mona Liddy, Elaine Watts, Cherry Daniels, Grace Daniels, Peter Christophersen, Victor Cubillo, Eddie Phillips, Wanyubi Marika, Donna Jackson and Wayne Barbour, 2007 Aboriginal Land and Sea Management in the Top End: a Community Driven Evaluation, CSIRO: Darwin.
Turton, S. Hawden, W. and Wilson, R. 2009, The Impacts of Climate Change on Australian Tourism Destinations, Cooperative Research Centre for Sustainable Tourism, Gold Coast.
Tourism Forecasting Committee, 2011, Forecast 2011, Issue 1, Tourism Research Australia, Canberra.
Tourism Queensland, 2008, Cape York Peninsula and Torres Strait Tourism Development Action Plan 2008-2011
Tourism Queensland, 2011, Tropical North Queensland Snapshot 2010, Tourism Queensland, Brisbane.
Tourism Research Australia 2008, Tourism Profiles for Local Government Areas in Regional Australia, Queensland: COOK SHIRE, Tourism Research Australia, Canberra.
Tourism Research Australia, 2010, Regional Tourism Profiles 2009/2010, Tourism Research Australia, Canberra.
Tourism Research Australia 2011(a), The Economic Importance of Tourism in Australia’s Regions, Tourism Research Australia, Canberra.
Tourism Research Australia 2011(b), Online Student data base, viewed 21 June 2011, Tourism Research Australia, Canberra, http://www.ret.gov.au/tourism/research/tra/data/Pages/data.aspx
Tourism Research Australia 2011(c), Queensland’s Outback Central West Visitor Profile and Satisfaction Report: Summary and Discussion of Results, Tourism Research Australia, Canberra.
Valentine, P.S. 2006, Compiling a Case for World Heritage on Cape York Peninsula, Report for QPWS published by James Cook University.
Walker, R. 1995, Pastoral industry of Cape York, Cape York Peninsula Land Use Strategy, Australian Government, Canberra.

24 June 2012 122 Version 3.0
The Potential Economic Benefits of Protecting and Presenting Cape York
Appendix One – Scenario Results
No Action Scenario Value Added and Employment Results
Current 2011 No Action 2031
Annual values (2011 dollars, not discounted) Visitors 50,000 62,756 Tourism expenditure in region $29 m $37 m Tourism expenditure on NP Camping $0.4 m $0.6 m NP Visitor Management expenditure $4 m $4 m WHA Marketing expenditure $0 $0 Tourism Roads expenditure $1 m $1 m Tourism Construction av. ann. expenditure* $0 $0.6 m Conservation Management expenditure $13 m $13 m Grazing income $8 m $8 m Value added in 2031 Tourism direct $9 m $11 m NP M'ment direct $2 m $2 m Tourism Roads direct $0.5 m $0.7 m Tourism Construction av. ann. direct* $0 $0.2 m Conservation M'ment direct $9 m $9 m Grazing direct $3 m $3 m Direct Value Added $24 m $26 m Tourism direct + indirect $15 m $19 m NP M'ment direct + indirect $3 m $3 m Tourism Roads direct + indirect $0.6 m $0.8 m Tourism Construction av. ann. direct + indirect* $0 $0.3 m Conservation M'ment direct + indirect $9 m $10 m Grazing direct + indirect $6 m $6 m Direct plus indirect Value Added $34 m $39 m Full Time Equivalent jobs in 2031 Tourism direct 156 196 NP M'ment direct 14 16 Tourism Roads direct 11 14 Tourism Construction av. ann. direct* 0 4 Conservation M'ment direct 109 109 Grazing direct 70 70 Direct FTE jobs 2031 360 408 Tourism direct + indirect 197 248 NP M'ment direct + indirect 24 27

24 June 2012 123 Version 3.0
The Potential Economic Benefits of Protecting and Presenting Cape York
Tourism Roads direct + indirect 14 18 Tourism Construction av. ann. direct + indirect* 0 6 Conservation M'ment direct + indirect 124 124 Grazing direct + indirect 109 109 Direct plus indirect FTE jobs 2031 469 532
No Action Scenario: Jobs
0
100
200
300
400
500
600
2011
2013
2015
2017
2019
2021
2023
2025
2027
2029
2031
Jobs Direct Jobs
Total Jobs (direct plusflow‐on)
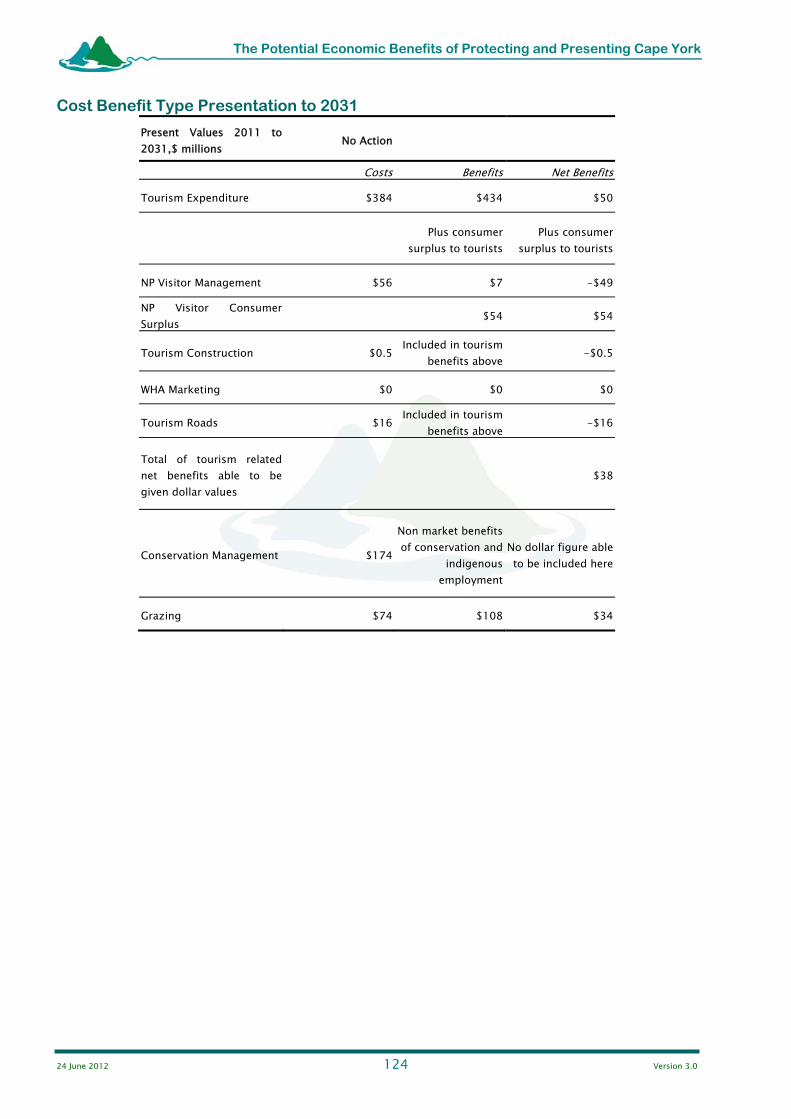
24 June 2012 124 Version 3.0
The Potential Economic Benefits of Protecting and Presenting Cape York
Cost Benefit Type Presentation to 2031
Present Values 2011 to 2031,$ millions No Action
Costs Benefits Net Benefits
Tourism Expenditure $384 $434 $50
Plus consumer surplus to tourists
Plus consumer surplus to tourists
NP Visitor Management $56 $7 -$49
NP Visitor Consumer Surplus $54 $54
Tourism Construction $0.5 Included in tourism benefits above -$0.5
WHA Marketing $0 $0 $0
Tourism Roads $16 Included in tourism benefits above -$16
Total of tourism related net benefits able to be given dollar values
$38
Conservation Management $174
Non market benefits of conservation and
indigenous employment
No dollar figure able to be included here
Grazing $74 $108 $34
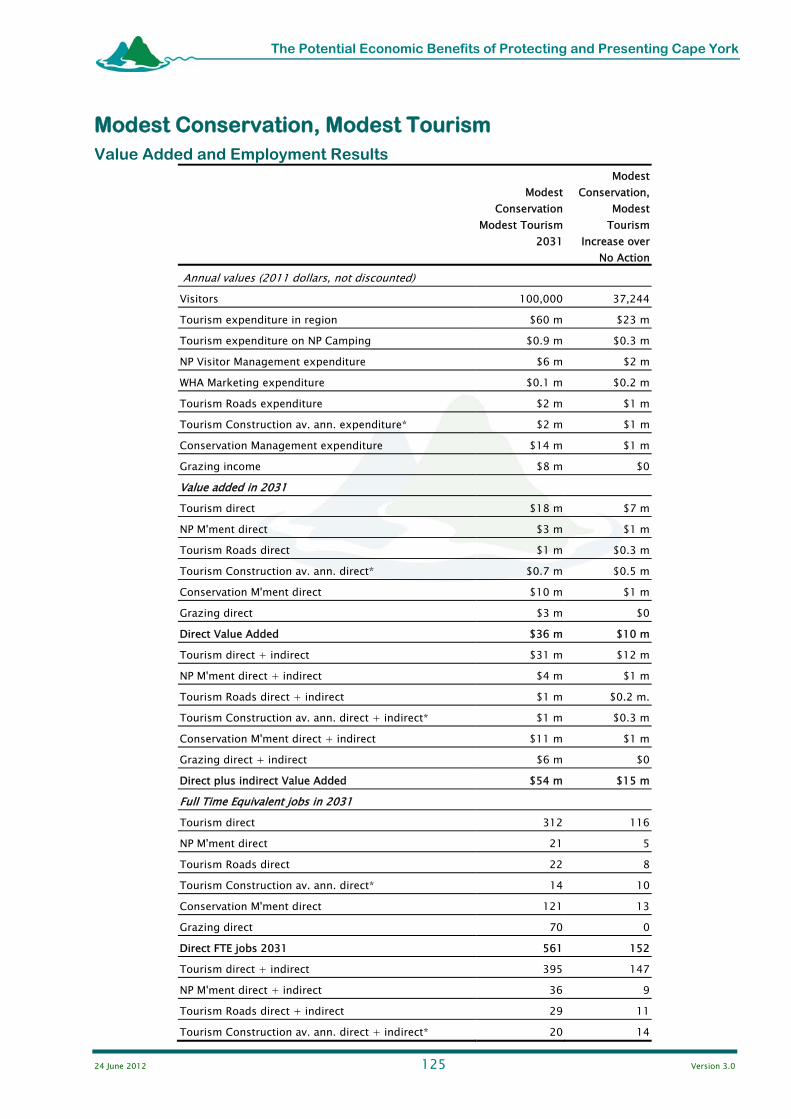
24 June 2012 125 Version 3.0
The Potential Economic Benefits of Protecting and Presenting Cape York
Modest Conservation, Modest Tourism Value Added and Employment Results
Modest Conservation
Modest Tourism 2031
Modest Conservation,
Modest Tourism
Increase over No Action
Annual values (2011 dollars, not discounted) Visitors 100,000 37,244 Tourism expenditure in region $60 m $23 m Tourism expenditure on NP Camping $0.9 m $0.3 m NP Visitor Management expenditure $6 m $2 m WHA Marketing expenditure $0.1 m $0.2 m Tourism Roads expenditure $2 m $1 m Tourism Construction av. ann. expenditure* $2 m $1 m Conservation Management expenditure $14 m $1 m Grazing income $8 m $0 Value added in 2031 Tourism direct $18 m $7 m NP M'ment direct $3 m $1 m Tourism Roads direct $1 m $0.3 m Tourism Construction av. ann. direct* $0.7 m $0.5 m Conservation M'ment direct $10 m $1 m Grazing direct $3 m $0 Direct Value Added $36 m $10 m Tourism direct + indirect $31 m $12 m NP M'ment direct + indirect $4 m $1 m Tourism Roads direct + indirect $1 m $0.2 m. Tourism Construction av. ann. direct + indirect* $1 m $0.3 m Conservation M'ment direct + indirect $11 m $1 m Grazing direct + indirect $6 m $0 Direct plus indirect Value Added $54 m $15 m Full Time Equivalent jobs in 2031 Tourism direct 312 116 NP M'ment direct 21 5 Tourism Roads direct 22 8 Tourism Construction av. ann. direct* 14 10 Conservation M'ment direct 121 13 Grazing direct 70 0 Direct FTE jobs 2031 561 152 Tourism direct + indirect 395 147 NP M'ment direct + indirect 36 9 Tourism Roads direct + indirect 29 11 Tourism Construction av. ann. direct + indirect* 20 14

24 June 2012 126 Version 3.0
The Potential Economic Benefits of Protecting and Presenting Cape York
Conservation M'ment direct + indirect 139 14 Grazing direct + indirect 109 0 Direct plus indirect FTE jobs 2031 727 195
Modest Conservation, Modest Tourism, Jobs increase over No Action
Scenario 2: Jobs increase over No Action
0
50
100
150
200
250
2011
2013
2015
2017
2019
2021
2023
2025
2027
2029
2031
Jobs
Direct Jobs
Total Jobs (directplus flow‐on)

24 June 2012 127 Version 3.0
The Potential Economic Benefits of Protecting and Presenting Cape York
Cost Benefit Type Presentation to 2031
Present Values 2011 to 2031 $ millions
Modest Conservation
Modest Tourism
Net benefits Modest Conservation,
Modest Tourismminus Net benefits No Action Scenario
Costs Benefits Net Benefits Net Benefits
Tourism Expenditure $457 $543 $86 $36
Plus consumer surplus to tourists
Plus consumer surplus to tourists
NP visitor management $63 $9 -$54 -$5
NP visitor consumer surplus $67 $67 $13
Tourism Construction $25 Included in tourism
benefits above -$25 -$24
WHA marketing $2 Included in tourism benefits above -$2, -$2
Tourism Roads $21 Included in tourism benefits above -$21 -$4
Total of tourism related net benefits able to be given dollar values
$51 $13
Conservation Management $187 Non market benefits
of conservationNo dollar figure able to be included here
No dollar figure able to be included here
Grazing $74 $108 $34 $0

24 June 2012 128 Version 3.0
The Potential Economic Benefits of Protecting and Presenting Cape York
Modest Conservation, High Tourism Value Added and Employment Results
Modest Conservation
High Tourism
2031
Modest Conservation, High
Tourism Increase over No Action
Annual values (2011 dollars, not discounted) Visitors 150,000 $87,244 Tourism expenditure in region $88 m $51 m Tourism expenditure on NP Camping $1 m $0.8 m NP Visitor Management expenditure $8 m $3 m WHA Marketing expenditure $0.3 m $0.3 m Tourism Roads expenditure $3 m $2 m Tourism Construction av. ann. expenditure* $5 m $4 m Conservation Management expenditure $14 m $2 m Grazing income $8 m $0 Value added in 2031 Tourism direct $27 m $16 m NP M'ment direct $4 m $2 m Tourism Roads direct $1 m $1 m Tourism Construction av. ann. direct* $2 m $2 m Conservation M'ment direct $10 m $1 m Grazing direct $3 m $0 Direct Value Added $47 m $22 m Tourism direct + indirect $46 m $27 m NP M'ment direct + indirect $5 m $2 m Tourism Roads direct + indirect $2 m $1 m Tourism Construction av. ann. direct + indirect* $3 m $2 m Conservation M'ment direct + indirect $11 m $1 m Grazing direct + indirect $6 m $0 Direct plus indirect Value Added $73 m $33 m Full Time Equivalent jobs in 2031 Tourism direct 469 273 NP M'ment direct 29 12 Tourism Roads direct 33 19 Tourism Construction av. ann. direct* 33 29 Conservation M'ment direct 121 13 Grazing direct 70 0 Direct FTE jobs 2031 754 346 Tourism direct + indirect 592 344 NP M'ment direct + indirect 48 21 Tourism Roads direct + indirect 43 25 Tourism Construction av. ann. direct + indirect* 47 41 Conservation M'ment direct + indirect 139 14
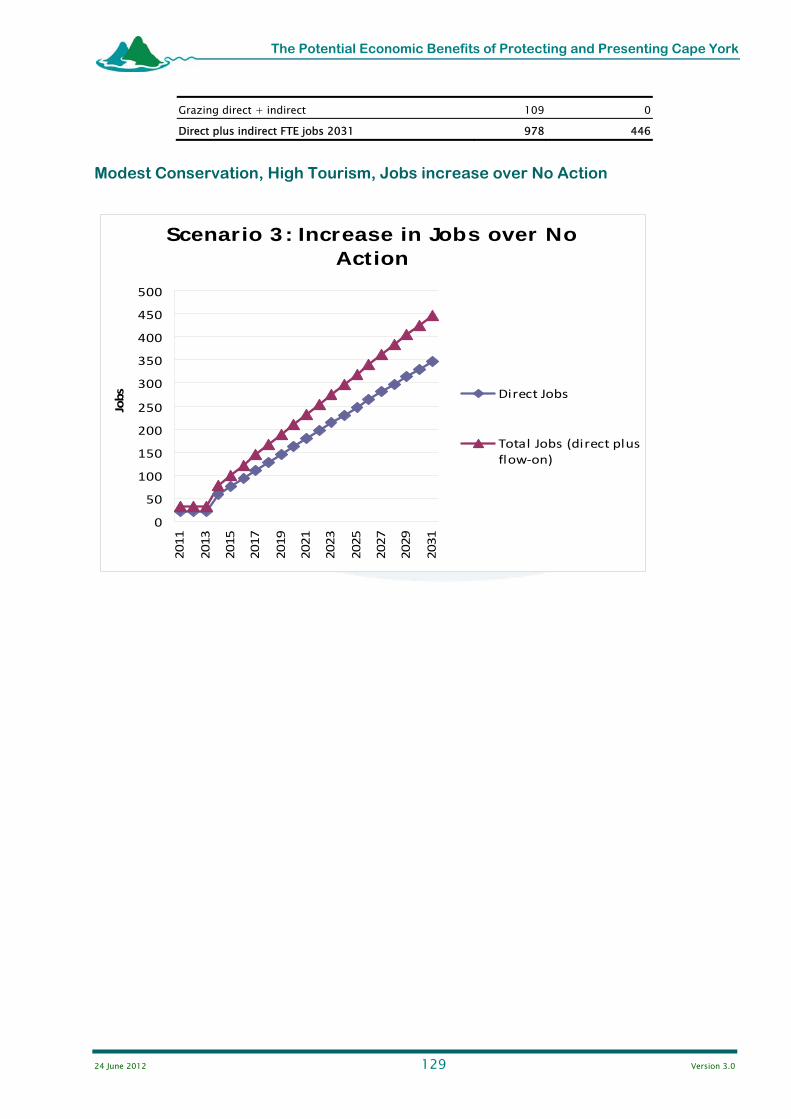
24 June 2012 129 Version 3.0
The Potential Economic Benefits of Protecting and Presenting Cape York
Grazing direct + indirect 109 0 Direct plus indirect FTE jobs 2031 978 446
Modest Conservation, High Tourism, Jobs increase over No Action
Scenario 3: Increase in Jobs over No Action
0
50
100
150
200
250
300
350
400
450
500
2011
2013
2015
2017
2019
2021
2023
2025
2027
2029
2031
Jobs Direct Jobs
Total Jobs (direct plusflow‐on)

24 June 2012 130 Version 3.0
The Potential Economic Benefits of Protecting and Presenting Cape York
Cost Benefit Type Presentation to 2031
Present Values 2011 to 2031
$ millions
Modest Conservation High
Tourism
Net benefits Modest Conservation, High Tourism minus Net benefits No Action
Scenario
Costs Benefits Net Benefits
Tourism Expenditure $555 $685 $130 $80
Plus consumer surplus to tourists
Plus consumer surplus to tourists
NP visitor management $73 $11 -$62 -$13
NP visitor consumer surplus $84 $84 $30
Tourism Construction $55 Included in tourism
benefits above -$55 -$54
WHA marketing $4 Included in tourism benefits above -$4 -$4
Tourism Roads $26 Included in tourism benefits above -$26 -$10
Total of tourism related net benefits able to be given dollar values
$68 $30
Conservation Management $187 Non market benefits
of conservationNo dollar figure able to be included here
No dollar figure able to be included here
Grazing $74 $108 $34 $0
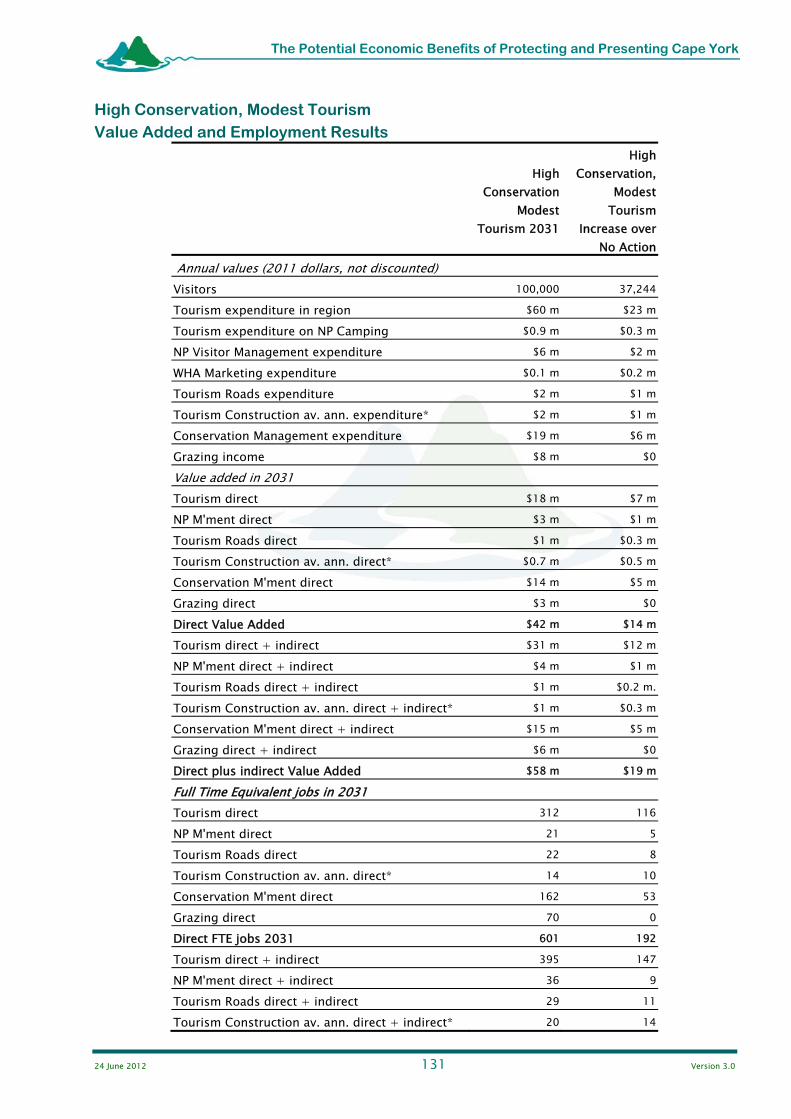
24 June 2012 131 Version 3.0
The Potential Economic Benefits of Protecting and Presenting Cape York
High Conservation, Modest Tourism Value Added and Employment Results
High Conservation
Modest Tourism 2031
High Conservation,
Modest Tourism
Increase over No Action
Annual values (2011 dollars, not discounted) Visitors 100,000 37,244
Tourism expenditure in region $60 m $23 m
Tourism expenditure on NP Camping $0.9 m $0.3 m
NP Visitor Management expenditure $6 m $2 m
WHA Marketing expenditure $0.1 m $0.2 m
Tourism Roads expenditure $2 m $1 m
Tourism Construction av. ann. expenditure* $2 m $1 m
Conservation Management expenditure $19 m $6 m
Grazing income $8 m $0
Value added in 2031 Tourism direct $18 m $7 m
NP M'ment direct $3 m $1 m
Tourism Roads direct $1 m $0.3 m
Tourism Construction av. ann. direct* $0.7 m $0.5 m
Conservation M'ment direct $14 m $5 m
Grazing direct $3 m $0
Direct Value Added $42 m $14 m
Tourism direct + indirect $31 m $12 m
NP M'ment direct + indirect $4 m $1 m
Tourism Roads direct + indirect $1 m $0.2 m.
Tourism Construction av. ann. direct + indirect* $1 m $0.3 m
Conservation M'ment direct + indirect $15 m $5 m
Grazing direct + indirect $6 m $0
Direct plus indirect Value Added $58 m $19 m
Full Time Equivalent jobs in 2031 Tourism direct 312 116
NP M'ment direct 21 5
Tourism Roads direct 22 8
Tourism Construction av. ann. direct* 14 10
Conservation M'ment direct 162 53
Grazing direct 70 0
Direct FTE jobs 2031 601 192
Tourism direct + indirect 395 147
NP M'ment direct + indirect 36 9
Tourism Roads direct + indirect 29 11
Tourism Construction av. ann. direct + indirect* 20 14
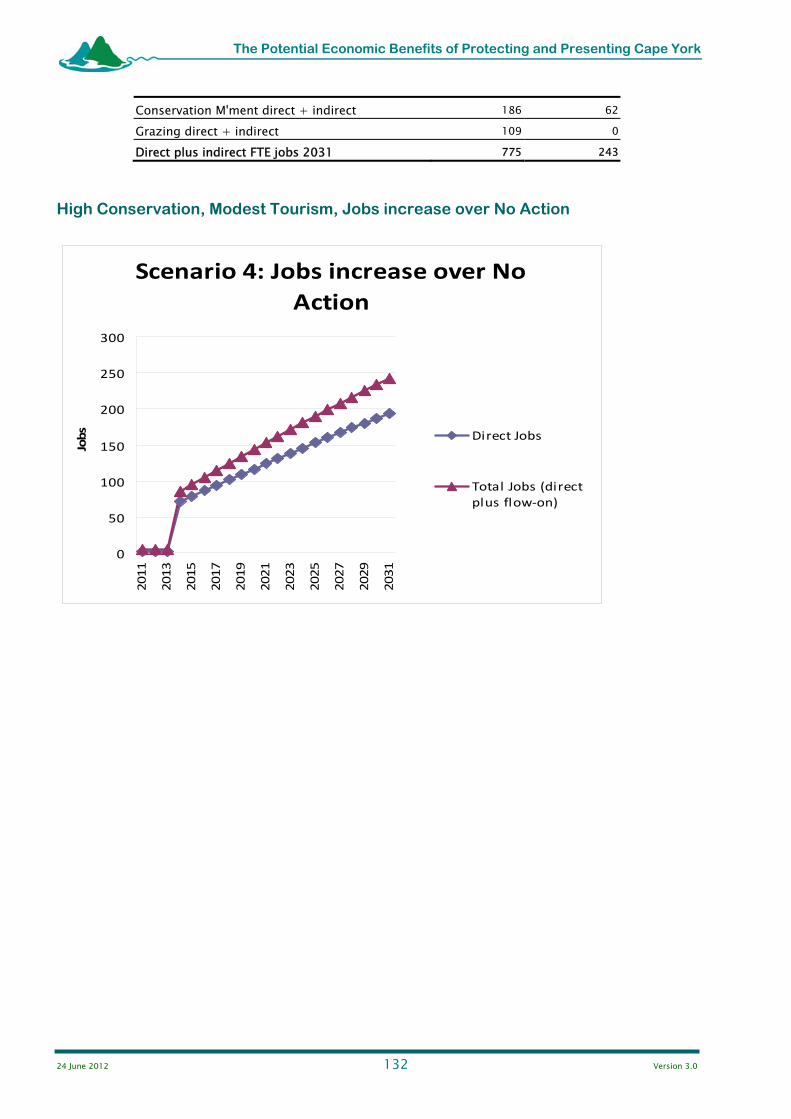
24 June 2012 132 Version 3.0
The Potential Economic Benefits of Protecting and Presenting Cape York
Conservation M'ment direct + indirect 186 62 Grazing direct + indirect 109 0 Direct plus indirect FTE jobs 2031 775 243
High Conservation, Modest Tourism, Jobs increase over No Action
Scenario 4: Jobs increase over No
Action
0
50
100
150
200
250
300
2011
2013
2015
2017
2019
2021
2023
2025
2027
2029
2031
Jobs Direct Jobs
Total Jobs (directplus flow‐on)

24 June 2012 133 Version 3.0
The Potential Economic Benefits of Protecting and Presenting Cape York
Cost Benefit Type Presentation to 2031
Present Values 2011 to 2031 $ millions
High Conservation Modest Tourism
Net benefits HighConservation,
Modest Tourismminus Net benefits No Action Scenario
Costs Benefits Net Benefits Net Benefits
Tourism Expenditure $457 $543 $86 $36
Plus consumer surplus to tourists
Plus consumer surplus to tourists
NP visitor management $63 $9 -$54 -$5
NP visitor consumer surplus $67 $67 $13
Tourism Construction $25 Included in tourism
benefits above -$25 -$24
WHA marketing $2 Included in tourism benefits above -$2, -$2
Tourism Roads $21 Included in tourism benefits above -$21 -$4
Total of tourism related net benefits able to be given dollar values
$51 $13
Conservation Management $239 Non market benefits
of conservationNo dollar figure able to be included here
No dollar figure able to be included here
Grazing $74 $108 $34 $0

24 June 2012 134 Version 3.0
The Potential Economic Benefits of Protecting and Presenting Cape York
High Conservation, High Tourism Value Added and Employment Results
High Conservation High Tourism
2031
High Conservation, High Tourism
Increase over No Action
Annual values (2011 dollars, not discounted)
Visitors 150,000 87,244
Tourism expenditure in region $88 m $51 m
Tourism expenditure on NP Camping $1 m $0.8 m
NP Visitor Management expenditure $8 m $3 m
WHA Marketing expenditure $0.3 m $0.3 m
Tourism Roads expenditure $3 m $2 m
Tourism Construction av. ann. expenditure* $5 m $4 m
Conservation Management expenditure $19 m $6 m
Grazing income $8 m $0
Value added in 2031
Tourism direct $27 m $16 m
NP M'ment direct $4 m $2 m
Tourism Roads direct $1 m $1 m
Tourism Construction av. ann. direct* $2 m $2 m
Conservation M'ment direct $14 m $5 m
Grazing direct $3 m $0
Direct Value Added $51 m $26 m
Tourism direct + indirect $46 m $27 m
NP M'ment direct + indirect $5 m $2 m
Tourism Roads direct + indirect $2 m $1 m
Tourism Construction av. ann. direct + indirect* $3 m $2 m
Conservation M'ment direct + indirect $15 m $5 m
Grazing direct + indirect $6 m $0
Direct plus indirect Value Added $77 m $37 m
Full Time Equivalent jobs in 2031
Tourism direct 469 273
NP M'ment direct 29 12
Tourism Roads direct 33 19
Tourism Construction av. ann. direct* 33 29
Conservation M'ment direct 162 53
Grazing direct 70 0

24 June 2012 135 Version 3.0
The Potential Economic Benefits of Protecting and Presenting Cape York
Direct FTE jobs 2031 796 386
Tourism direct + indirect 592 344
NP M'ment direct + indirect 48 21
Tourism Roads direct + indirect 43 25
Tourism Construction av. ann. direct + indirect* 47 41
Conservation M'ment direct + indirect 186 62
Grazing direct + indirect 109 0
Direct plus indirect FTE jobs 2031 1025 493
High Conservation, High Tourism, Jobs increase over No Action
Scenario 5: Jobs increase over No Action
0
100
200
300
400
500
600
2011
2013
2015
2017
2019
2021
2023
2025
2027
2029
2031
Jobs Direct Jobs
Total Jobs (directplus flow‐on)
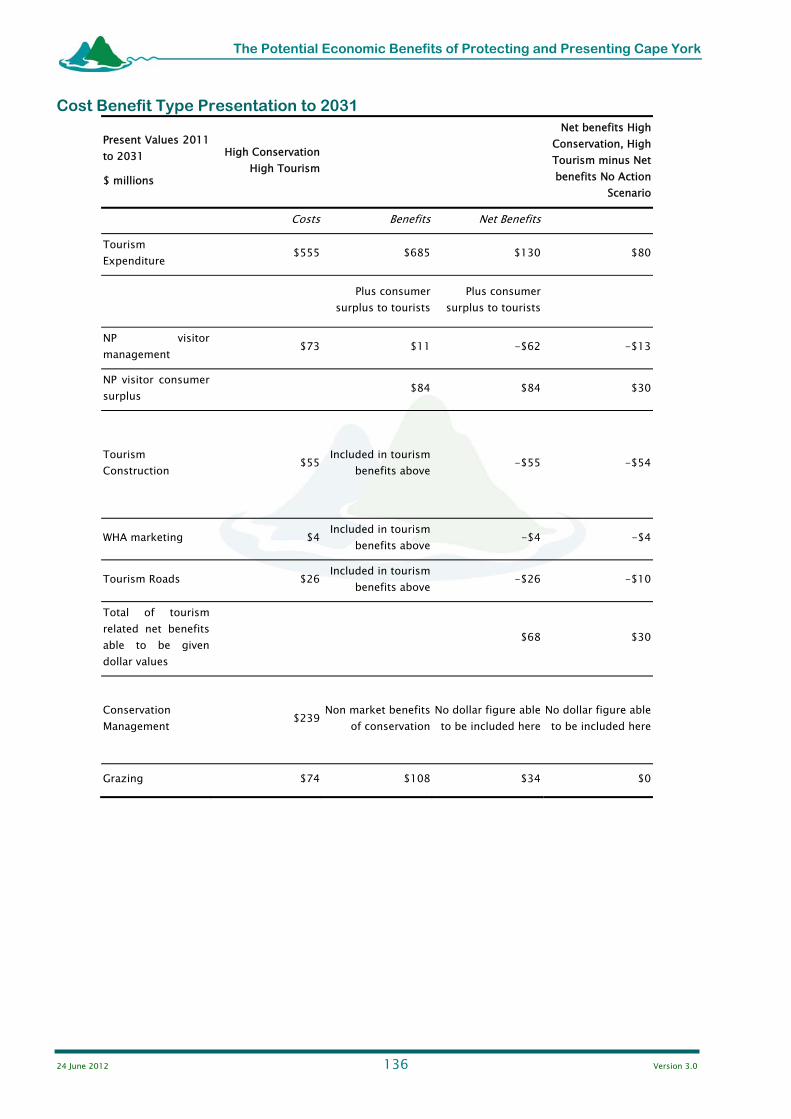
24 June 2012 136 Version 3.0
The Potential Economic Benefits of Protecting and Presenting Cape York
Cost Benefit Type Presentation to 2031
Present Values 2011 to 2031
$ millions
High Conservation High Tourism
Net benefits High Conservation, High Tourism minus Net benefits No Action
Scenario
Costs Benefits Net Benefits
Tourism Expenditure $555 $685 $130 $80
Plus consumer surplus to tourists
Plus consumer surplus to tourists
NP visitor management $73 $11 -$62 -$13
NP visitor consumer surplus $84 $84 $30
Tourism Construction $55 Included in tourism
benefits above -$55 -$54
WHA marketing $4 Included in tourism benefits above -$4 -$4
Tourism Roads $26 Included in tourism benefits above -$26 -$10
Total of tourism related net benefits able to be given dollar values
$68 $30
Conservation Management $239 Non market benefits
of conservationNo dollar figure able to be included here
No dollar figure able to be included here
Grazing $74 $108 $34 $0