the potential of the satellite industry in asiatalksatellite.com/ses - the potential of the...
TRANSCRIPT
The potential of the Satellite Industry in Asia
CommunicAsia 2015
Deepak Mathur, Senior Vice-President, Commercial APAC & the Middle East

SES
Who we are: Worldwide & in Asia
#1 in DTH channels carried and subs reached
>1,000 TV channels 44 million homes
A leading video player and a strong base of quality data customers
#1 in Indian VSAT
150k sites in India alone
Owns and operates one of the world’s largest commercial satellite fleets
• Over 50 satellites covering 99% of the globe
Partner of choice for major global broadcasters, telcos, enterprises, governments and institutions
• Technical reach of 312 million households in 2014
Global reach, regional support
• Over 1,230 employees around the globe
• 23 locations worldwide
worldwide in Asia-Pacific
World-leading satellite operator and dynamic market leader
2

3
The Global Satellite Industry in transition

What does the SATCOM Sector Look Like?
Service Providers & Equipment
$122 Bn / 13% CAGR ‘09-’14
DTH & Video
$13 Bn / 5.5% CAGR ‘09-’14 FSS Satellite Operators
$4.4 Bn / -5% CAGR ‘09-’14 Satellite Mfr. & Launchers
450 Mio DTH households consuming a total one zettabyte of video content yearly
4 Bn viewers get their video directly (DTH) or indirectly (DTC/IPTV feed) through satellite : enabling a $1,900 Bn Global Media and Entertainment Industry
2.2 Mio Satellite Broadband Subs
1.6 Mio Enterprise and SME VSATs
28% of all STBs sold in 2014 where satellite
Sources: Primary - Euroconsult, supplemental – NSR, Dataxis, Infonetics Research & SES Market Intelligence 4

Satellite World in Transition
Non-linear media, OTT
Mobile data and video
Multi-play, mobility, disaster recovery
M2M - Internet of Things
Big data
Next Generation Access, FTTx
LTE, LTE-A, WiFi, TV white space, 5G
MEO S-HTS, GEO HTS
LEO constellations, Small-Sats
High Altitude Platforms
Very significant increase of complexity
New players and segments
Within and external to the satellite industry
Trillion USD ICT arena
New business models (“freemium”, cross-subsidization, big data monetization)
New “converged” regulations
New Usages and Applications New Ecosystems
More Delivery Technologies New Competitors
5

Opening New Opportunities
6
88% of Internet traffic will be video by 2018
$2,200 Bn (6.3% CAGR) Global Media and Entertainment Industry by 2018
10,000 HD/4K satellite ch’s by 2025
5,500 new satellite ch’s by 2023
$5.3 Bn satellite backhaul by 2024
Off-loading and backhauling, feeding towers and edges with linear video and data
120 Mio new DTH households by 2018
36% STB’ revenue from satellite by 2018
30x In-flight broadband traffic by 2025
$4 Bn incremental maritime revenues by 2023
$20.6 Bn OTT revenues by 2019
But serving all will require combining strengths of available technologies
4.2 Bn People still offline by 2018
50 Bn IoT devices by 2018
New Usages and Applications New Ecosystems
More Delivery Technologies New Competitors
Sources: Euroconsult, NSR, Dataxis , Cisco, Infonetics Research, Ovum, McKinsey
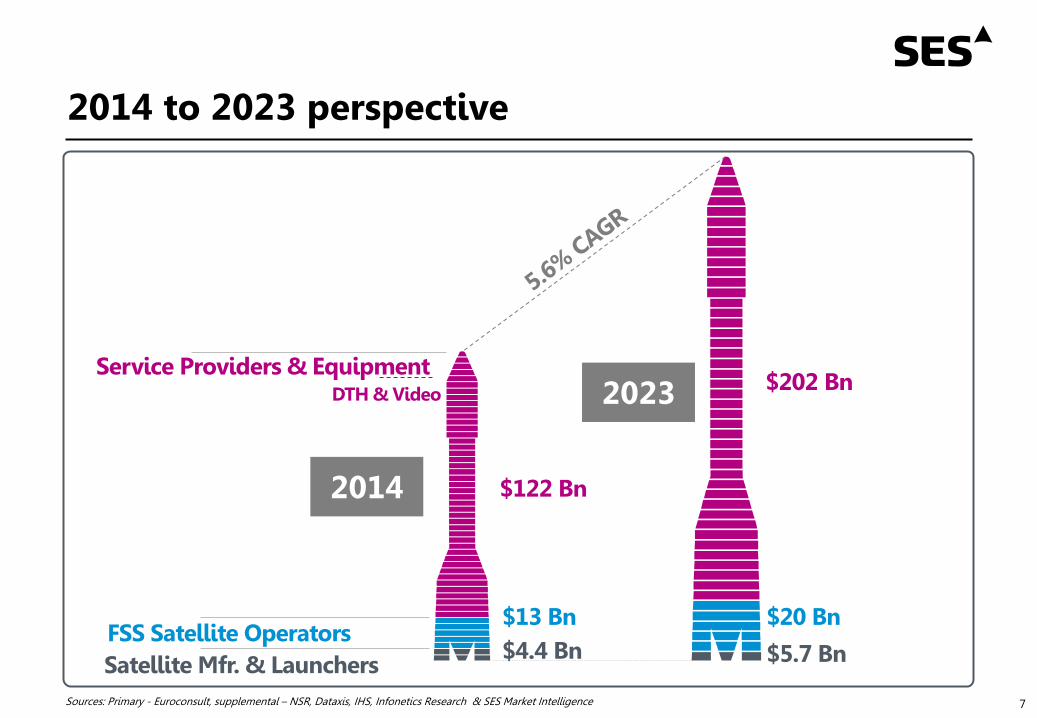
2014 to 2023 perspective
7 Sources: Primary - Euroconsult, supplemental – NSR, Dataxis, IHS, Infonetics Research & SES Market Intelligence
Service Providers & Equipment $202 Bn
$5.7 Bn
$20 Bn $13 Bn
DTH & Video
FSS Satellite Operators Satellite Mfr. & Launchers
$122 Bn 2014
2023
$4.4 Bn

What’s in for Asia?

01 Video Linear TV perspective
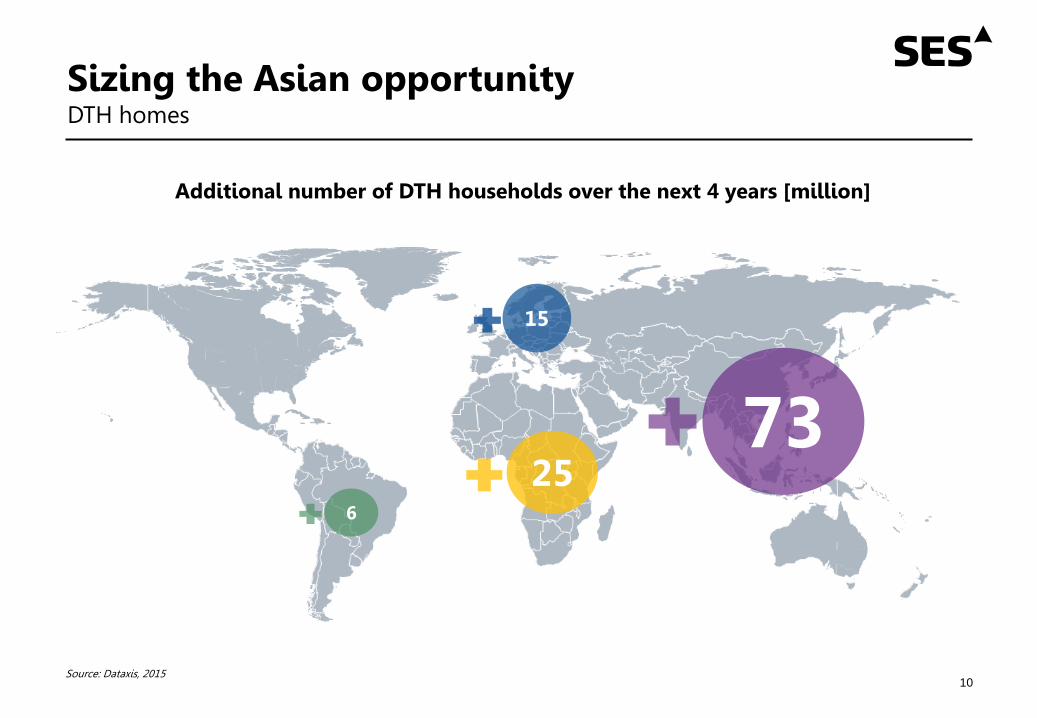
Sizing the Asian opportunity DTH homes
10
6
15
25 73
Additional number of DTH households over the next 4 years [million]
Source: Dataxis, 2015

Sizing the Asian opportunity Satellite TV channels
11
1.1k
1.5k
0.9k
1.6k
Additional number of satellite channels over the next 4 years
0.5k
Source: NSR, 2015
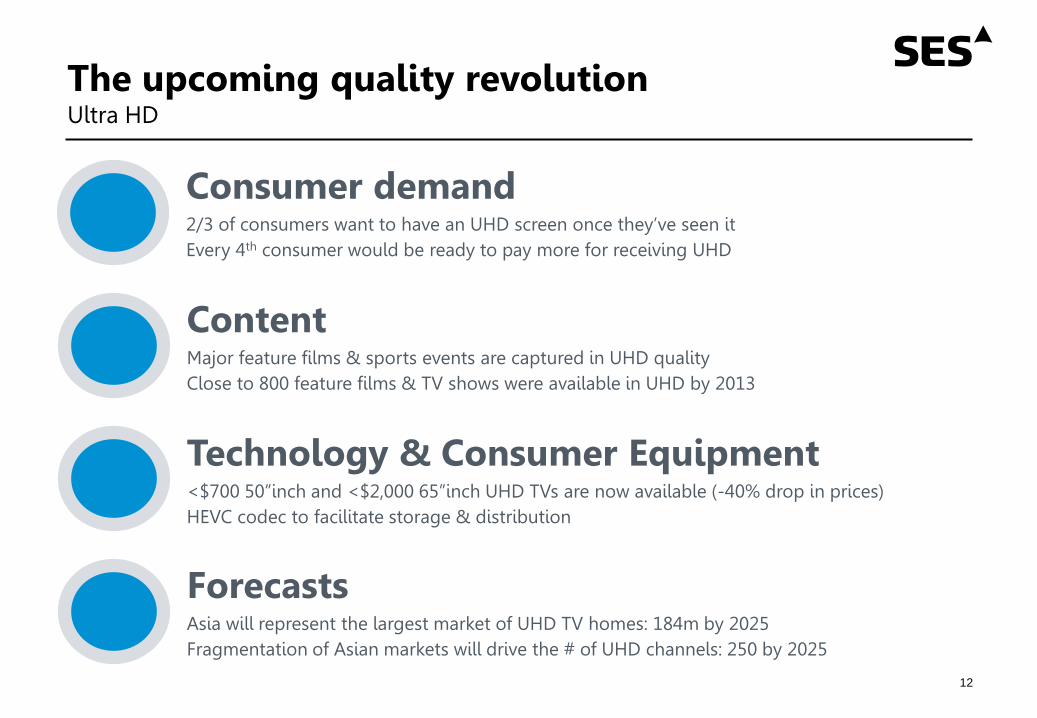
The upcoming quality revolution Ultra HD
12
Consumer demand 2/3 of consumers want to have an UHD screen once they’ve seen it Every 4th consumer would be ready to pay more for receiving UHD
Content Major feature films & sports events are captured in UHD quality Close to 800 feature films & TV shows were available in UHD by 2013
Technology & Consumer Equipment <$700 50”inch and <$2,000 65”inch UHD TVs are now available (-40% drop in prices) HEVC codec to facilitate storage & distribution
Forecasts Asia will represent the largest market of UHD TV homes: 184m by 2025 Fragmentation of Asian markets will drive the # of UHD channels: 250 by 2025

02 Video Non-linear TV perspective
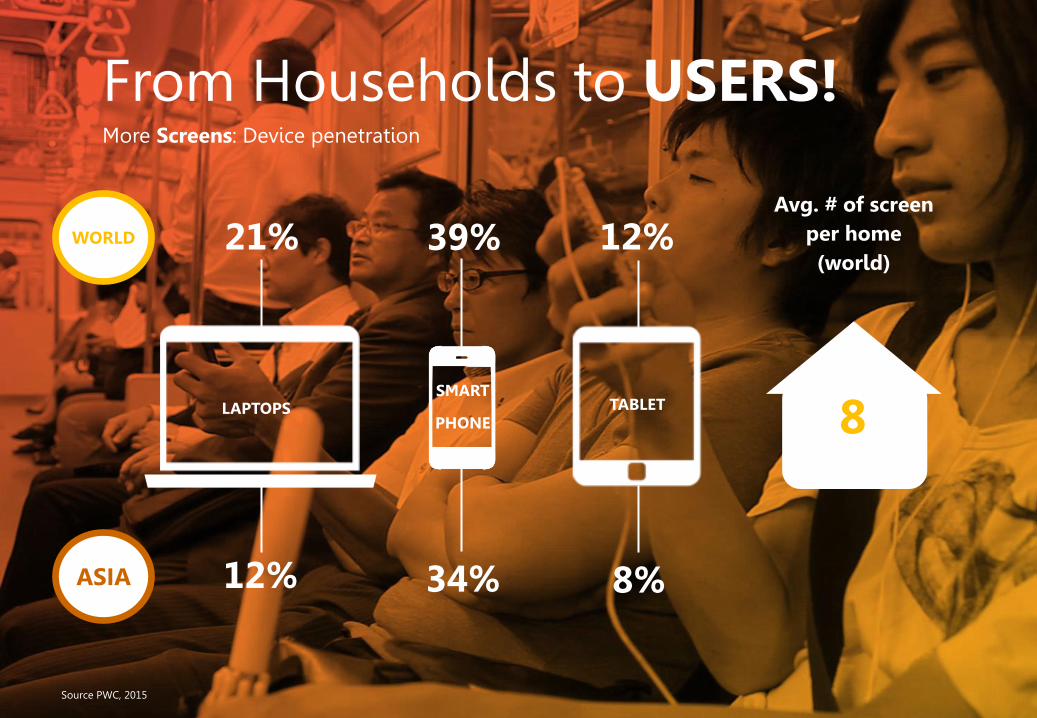
From Households to USERS! More Screens: Device penetration
LAPTOPS SMART
PHONE TABLET 8
ASIA
WORLD 21%
12% 34%
39% 12%
8%
Avg. # of screen per home (world)
Source PWC, 2015

A distribution challenge Technologies
15
Making this new video experience available to all consumers requires distribution networks capable of enabling and supporting all required video-related features
Broadband Technologies Broadcast Technologies
No single technology ticks all the boxes
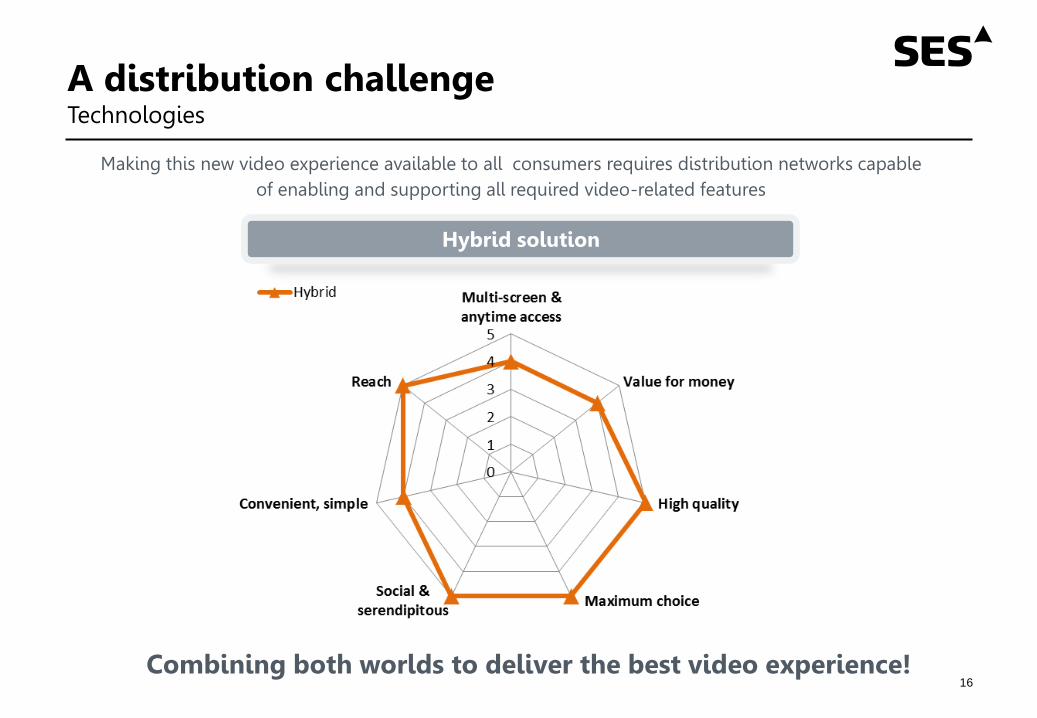
A distribution challenge Technologies
16
Making this new video experience available to all consumers requires distribution networks capable of enabling and supporting all required video-related features
Hybrid solution
Combining both worlds to deliver the best video experience!
A distribution challenge Technologies
17
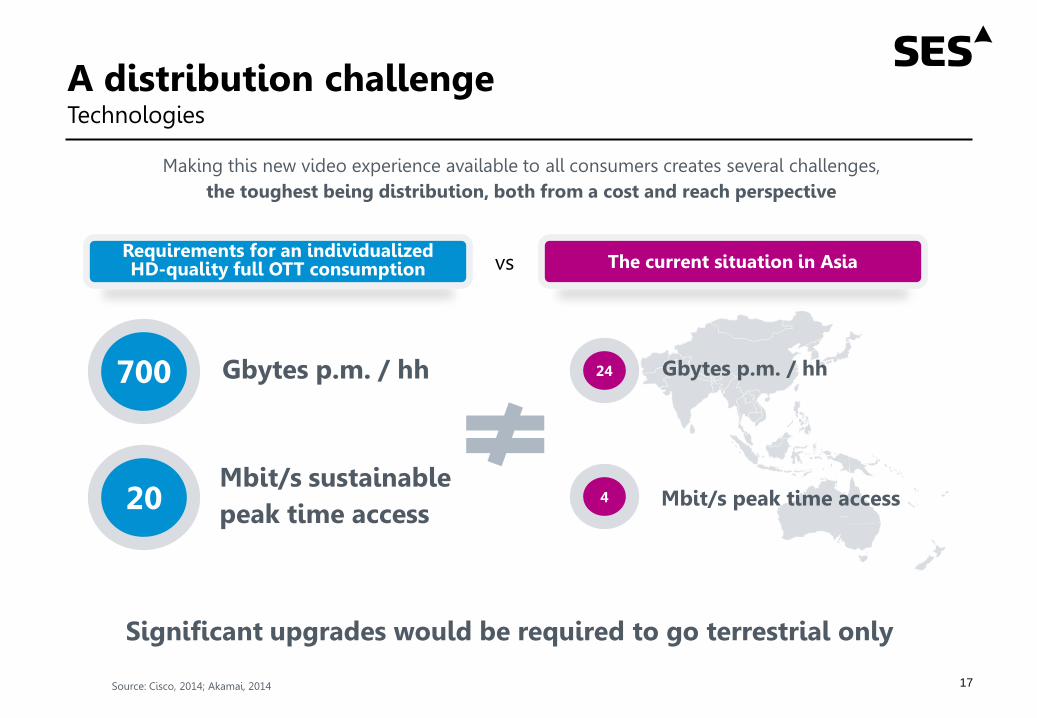
Making this new video experience available to all consumers creates several challenges, the toughest being distribution, both from a cost and reach perspective
Significant upgrades would be required to go terrestrial only
Source: Cisco, 2014; Akamai, 2014
Requirements for an individualized HD-quality full OTT consumption
700 Gbytes p.m. / hh
20 Mbit/s sustainable peak time access
The current situation in Asia
24 Gbytes p.m. / hh
4 Mbit/s peak time access
vs
A distribution challenge Technologies
18
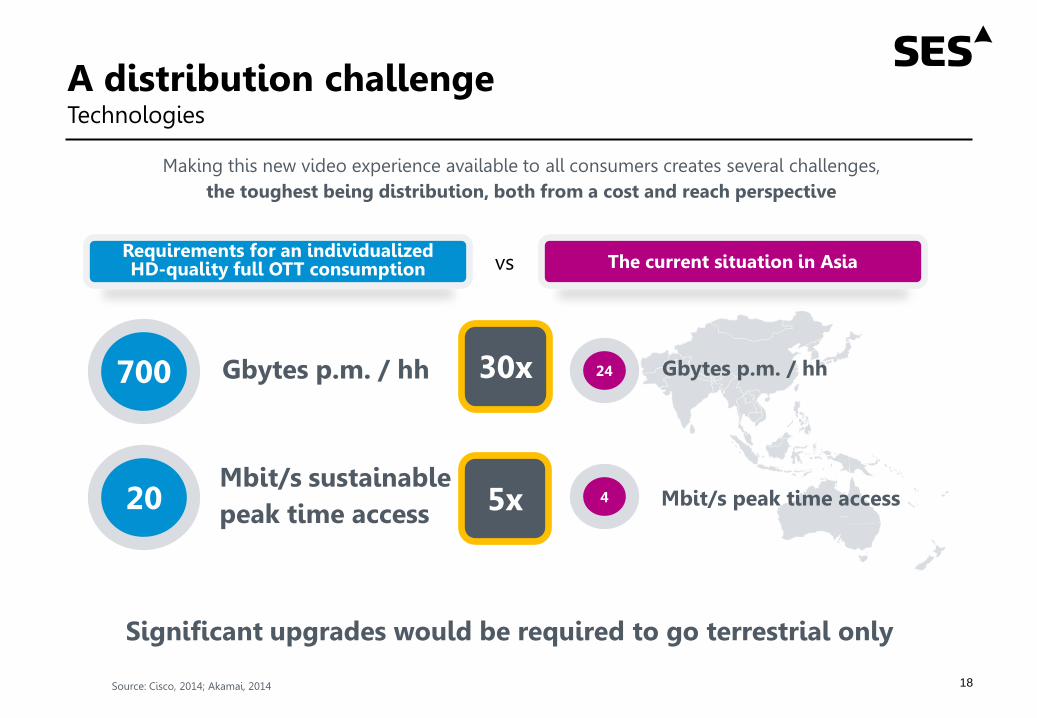
Making this new video experience available to all consumers creates several challenges, the toughest being distribution, both from a cost and reach perspective
Significant upgrades would be required to go terrestrial only
Source: Cisco, 2014; Akamai, 2014
Requirements for an individualized HD-quality full OTT consumption
700 Gbytes p.m. / hh
20 Mbit/s sustainable peak time access
The current situation in Asia
24 Gbytes p.m. / hh
4 Mbit/s peak time access
vs
30x
5x

A distribution challenge Technologies
19
Making this new video experience available to all consumers creates several challenges, the toughest being distribution, both from a cost and reach perspective
Source: Cisco, 2014; Akamai, 2014
Requirements for an individualized HD-quality full OTT consumption
700 Gbytes p.m. / hh
20 Mbit/s sustainable peak time access
The current situation in Asia
24 Gbytes p.m. / hh
4 Mbit/s peak time access
vs
not evening mentioning full OTT consumption in Ultra HD…
100x
12x

A distribution solution Hybrid satellite-terrestrial
20
Reach Exponential growth of NextGen access deployment costs vs unchanged incremental satellite user costs
4Gbit/s broadcast satellite
NGA Roll-out
Household reach
Cum
ulat
ed c
osts
~50c/ Gbyte (p.a.) on satellite for any number
of receivers
1c/Gbyte CDN cost per receiver
# Receivers
Cos
t pe
r G
byte
Distribution Cost Satellite to stream & push most popular content to a “home-CDN” Terrestrial for interactivity, long tail & time-critical access
Joining forces to deliver a sustainable state-of-the-art experience
Satellite Terrestrial OTT
03 Data Enterprise & Mobility

Mobile Backhaul

Sizing the opportunity Cellular Networks
23
Mobile subs over the next 3 years
+300million, reaching a total of 2bn However, today’s wireless broadband penetration
9%
=

Cellular Backhaul via Satellite
Drivers / Opportunities Increasing mobile penetration
Take-up of 3G/4G services
MNOs deploy 2G and 3G to rural areas to maximize coverage and comply with USO mandates
Regulatory opening in certain markets boosting market growth in Asia
Everything to
the Cloud
24

Mobility

Mobility services on the rise Aeronautical: “Frontier Application”
Drivers / Opportunities Massive increase in smartphones & tablets
Increased air-passenger travel
Mobile apps & online video
Advanced Antenna technology
Optimized satellite design
Over 80% of airline passengers carry a smart
device
99%
of those passengers turn it on during the flight
26
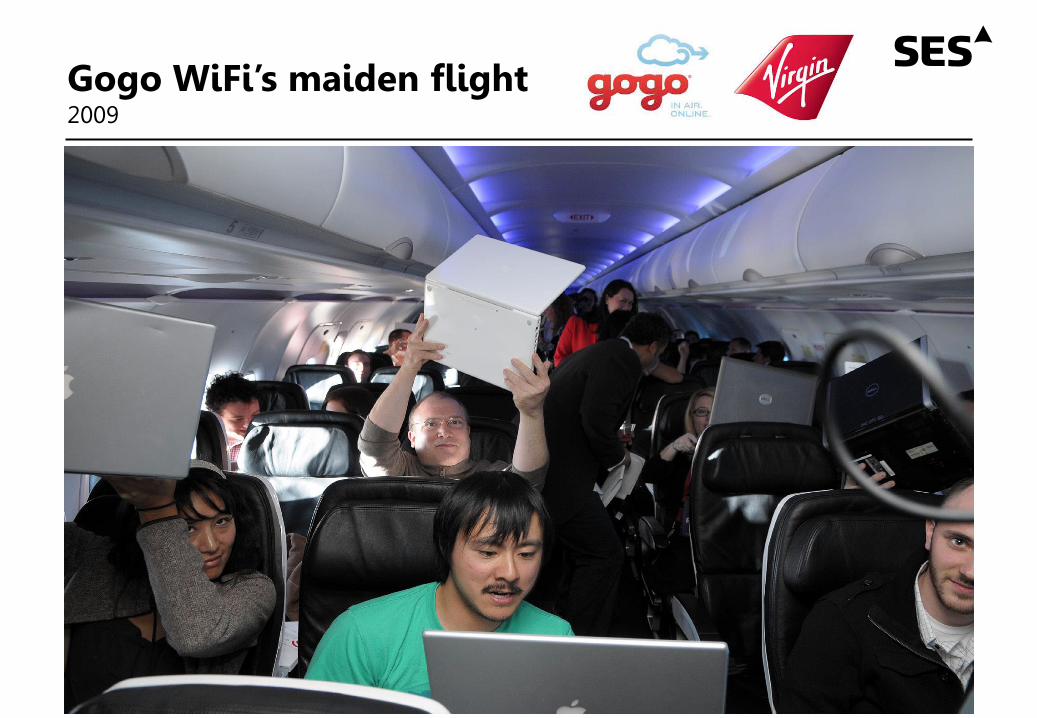
Gogo WiFi’s maiden flight 2009
27
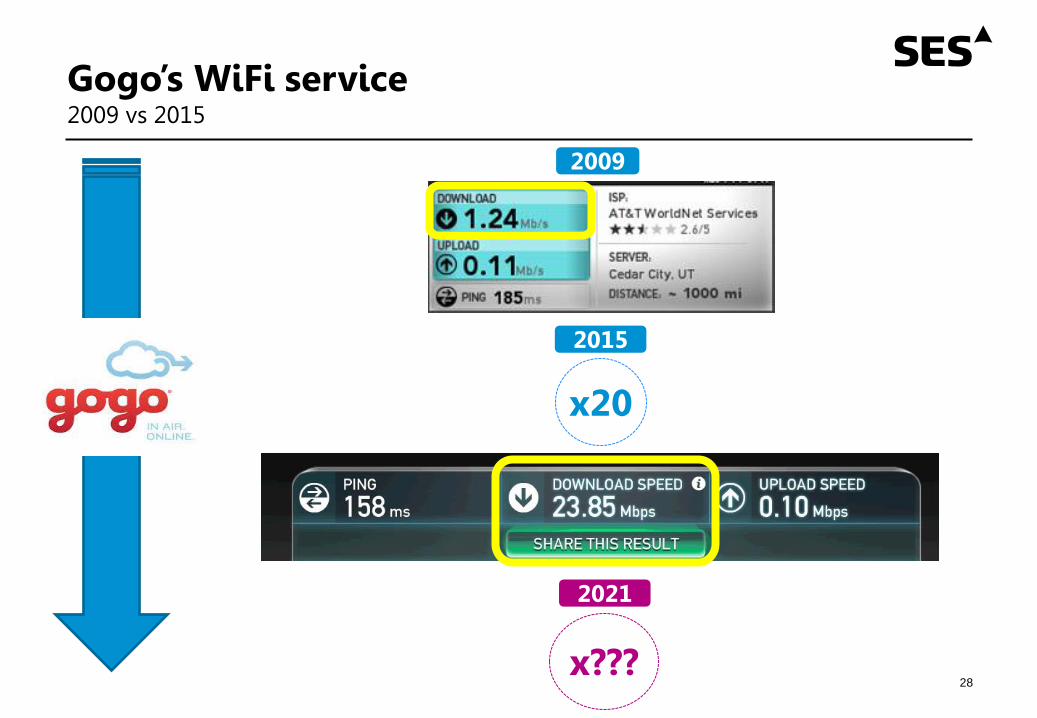
Gogo’s WiFi service 2009 vs 2015
2009
2015
x20
2021
x??? 28
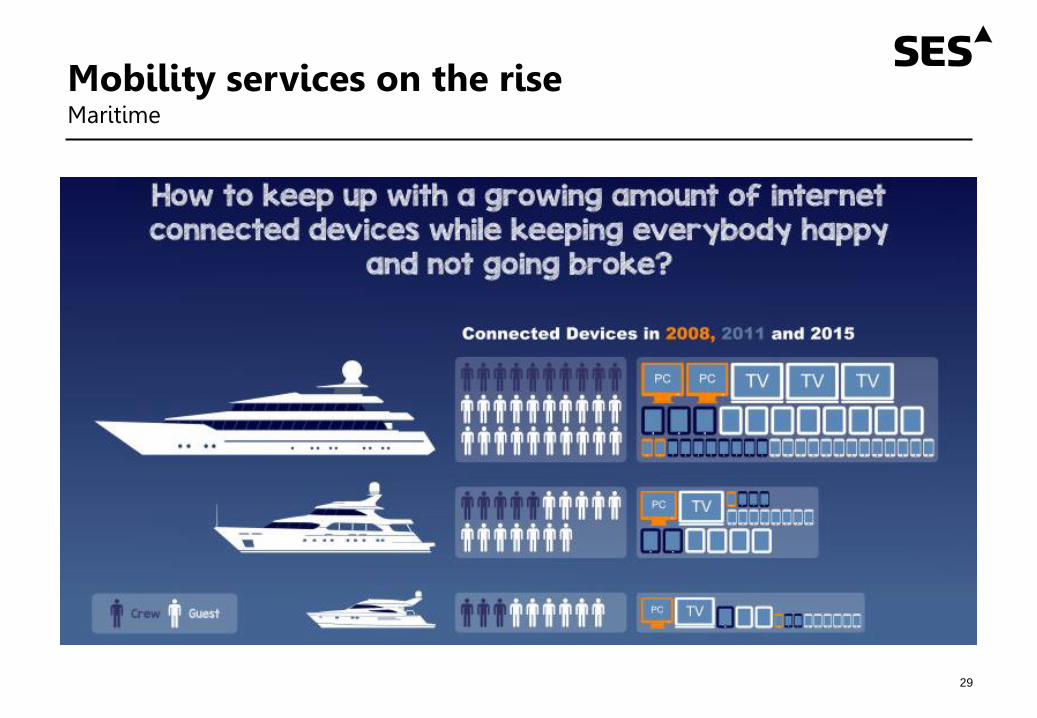
Mobility services on the rise Maritime
29

Mobility services on the rise Maritime: Cruise ships
2010
2015
10 Mbps 40 Mbps up to 1.3Gbps
30
What enables growth?

Drivers & Enablers
32
Demand-Side A LOT More Devices Everything to the Cloud
Supply-Side
Better Ground Technology
Better Satellite Technology Hybrid Networks
Shaped Beams
GEO HTS
MEO HTS
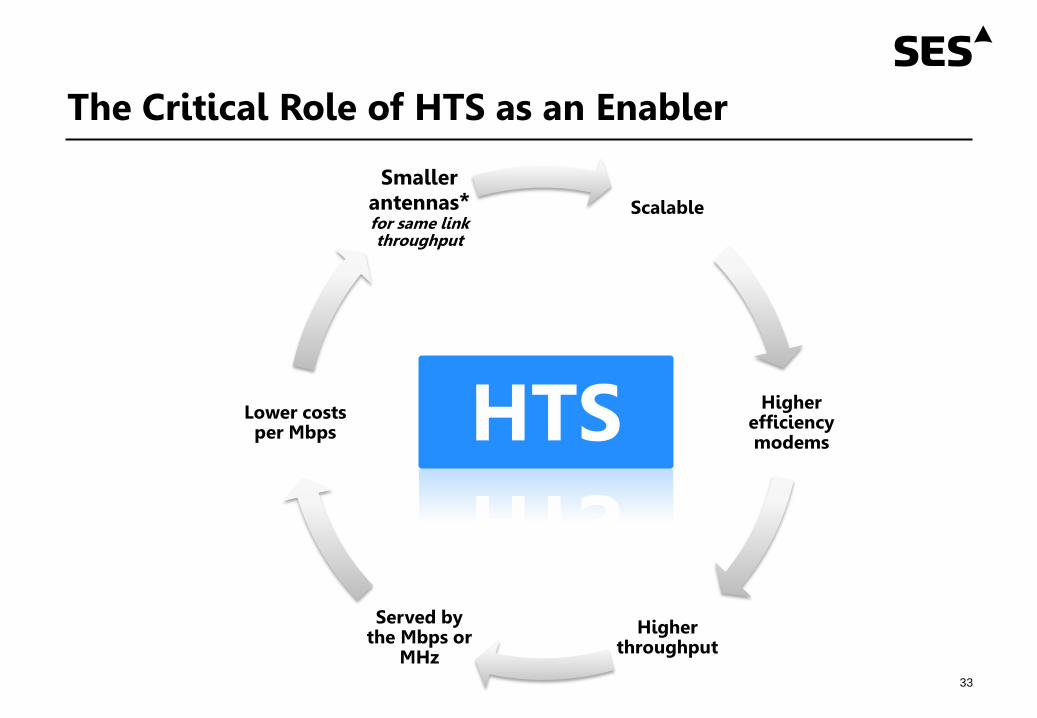
The Critical Role of HTS as an Enabler
33
Scalable
Higher efficiency modems
Higher throughput
Served by the Mbps or
MHz
Lower costs per Mbps
Smaller antennas* for same link throughput
HTS

But most importantly….
Hybrid Networks
UNLOCK NEW BUSINESS MODELS 34

Thank you