the potential role of nuclear power in romanian mix of · pdf file · 2016-07-04the...
TRANSCRIPT

The Potential Role of Nuclear Power in Romanian Mix of Energy Supply
E. Banches
Romanian Nuclear Agency & Radioactive Waste (ANDR)
- IAEA/JRC Technical Meeting on the Role and Sustainability of Nuclear Power in the National Energy Mix, Including the Long Term Operation of Nuclear Power Plants
– Amsterdam, Netherlands 21–23 June 2016

Brief contents • ACTING IN PRESENT = where we are – which are the problems?
– Based on UN Sustainability Concept and IAEA Basic Principle, Romania deploys a Nuclear Power Program part of National Energy Mix
• ACTING FOR THE FUTURE = we have predictions - what are their long term effects ?
– Using IAEA PESS Instruments (MAED & MESSAGE) Romania has completed a Technical Study on the sustainable contribution of Nuclear Power in Energy Mix - predictions for 2011 to 2070; The long term operation of NPP are systematically considered.
– 3 nuclear scenarios and the effects of theirs long term predictions are provided.
• ACTING IN THE FUTURE = the scenarios sustainability assessment vs. the assumptions – which are the gaps – we have recommendations – the decision makers are advised to update the sustainable strategies
– The assumptions of Security of Energy Supply and the Efficiency criteria provide gaps and recommendations for the Optimal Energy Mix which include in the 1st report the concept of the “Smart Electrical and Heat Grid” ; this concept promote tougher nuclear and renewable technologies if the electrical grid and the heat grid will be operate in cooperation
– Using INPRO Methodology ANDR has completed a limited NESA in economics, radioactive waste management and infrastructure areas of the 3 nuclear long term predictions; the results are used to provide recommendations in a specific 2nd report (*)
– The decisions makers can use the 2 reports to update the specific sustainable strategies..

ACTING IN PRESENT (where we are ?) - Based on UN Sustainability & IAEA Basic Principles
• The sustainable development concept (SDC) is based on 3 pillars (goals): – Social development - the humanity need survives in social and environmental system – Economic development - economic wealth of communities for the well-being of their
inhabitants (growth of real national income, gross domestic product, or per capita income) – Environmental protection - the biodiversity of the nature need to be preserved.
• The SDC is linked to the Governmental institutions & and Decision makers acts: – To use and protect Environmental resources for Social development using the Economic
system development (industrial, research/education/health using the financial frame) • In 1987, the Brundtland Report , “Our Common Future” define SDC as:
– “Development that meets the needs of the present without compromising the ability of future generations to meet their own needs”.
• In 1998, the World Energy Assessment on “Energy and Challenge of sustainability” defines:
– the assessor’s options for sustainable energy supply & use, are linked to social, economic, environmental and security of supply
• The United Nations Framework Convention on Climate Change (UNFCCC), adopted in 1997 the “Kyoto Protocol” which:
– Calls Nations for greenhouse gas (GHG) emissions reduction by 2008-2012 – Identify the Nuclear Power as the least carbon intensive emissions, but need to solve
“nuclear issues”

ACTING IN PRESENT (where we are ?) briefing: Energy Planning and Sustainable Development
• The sustainable development concept (SDC) is based on 3 pillars:
– Society – Economy – Environment
• The SDC is linked by Government institutions and Decision makers which acts: • To use and protect Environmental
resources for Social development by Economic system development (industrial, research/education/health care in the financial frame)
(Source: IAEA Tools and Methodologies for Planning and Nuclear Energy System Assessment – INPRO-PESS brochure – IAEA Austria 2009)

ACTING IN PRESENT (where we are ?) The UN Sustainability Concept vs. IAEA Basic Principles
• UN Sustainable Concept is extended in 7 assessment areas:
– Economics – Environment – Waste
(Radioactive) Management
– (Nuclear) Safety – (Nuclear)
Proliferation Resistance
– (Nuclear) Physical Protection
– Infrastructure
• In 2000, IAEA (GC(44)/RES/21) lanced the International Project on Innovative Nuclear Reactors and Fuel Cycles (INPRO) in order to:
– “Help to ensure that nuclear energy is available to contribute in fulfilling, in a sustainable manner, energy needs in 21st century”
• In 2010, IAEA INPRO proposed TECDOC-1575 as 1st INPRO Methodology of Nuclear Energy Systems Assessment (NESA)

ACTING IN PRESENT (where we are ?) INPRO Methodology – 2nd Steps of NESA
• INPRO 7 areas assessment vs.: – Basic Principles, – User Requirements, – Criteria, with
associated indicators and established Acceptance Limits
– The gaps identifie the Innovative Nuclear System (INS) need of improvements
(Source: IAEA Tools and Methodologies for Planning and Nuclear Energy System Assessment – INPRO-PESS brochure – IAEA Austria 2009)

ACTING IN PRESENT (where we are ?) Overview of Romanian Nuclear Power profile
Nuclear Power in Romania (Updated January 2016 – http://www.world-nuclear.org )
•Romania has two nuclear 700 MW PHWR (CANDU 6) reactors generating almost 20 % of its electricity. •Romania's first commercial nuclear power reactor began to operate in 1996. Its second was commissioned in May 2007. •China General Nuclear Power (CGN) has agreed to complete two more 720 MW PHWR (CANDU 6) units. •Romanian government support for nuclear energy is strong; Romania is a party of the Nuclear Non-Proliferation Treaty since 1970. INFRASTRUCTURE (Legal licensed under CNCAN Law 111/1996) •Romanian Fuel Cycle, One Through, based on PHWR – CANDU 6 Facilities for all PHWR Fuel Cycle: Mining (3 uranium ore perimeters), Conversion (Feldioara uranium conversion factory), Fuel fabrication (Pitesti nuclear fuel factory – qualified by AECL Canada), Heavy water production (Drobeta Turnu-Severin heavy water factory), Electricity production (Cernavoda NPP - U1, U2 in operation; U3, U4, delayed project ), Spent fuel storage (“DICA” - MACSTOR – for 50ys at Cenavoda site; HLW Deep Geol. Rep. – by 2055, not yet decided), Radioactive waste repositories (“DNDR” – Baita low-level repository; “DFDSMA”-low & intermediate-level ANDR project dedicated to Saligny site by 2021)

ACTING IN PRESENT, (where we are ?) Romanian Nuclear Fuel Cycle & RW Facilities
Mining Uranium Ore
Extraction
Feldioara Conversion
Factory Conversion
Pitesti Nuclear Fuel Factory
Fuel Fabrication
Drobeta Turnu-Severin Heavy Water Factory
Heavy Water Production
Cernavoda NPP Units 1 and 2
Electricity Production
Spent Fuel Disposal (Deep Geological Repository
- projected after 2055) The solution is not yet
decided
Cernavoda “DICA” – MACSTOR, Dry Storage
Facility
Spent Fuel Storage
Baita “NDDR” – low-level radioactive waste;
Saligny “DFDSMA” – (low & intermediate-level
radioactive waste - projected after 2021)


Pitesti Nuclear Fuel Factory • In operation since 1983;
• In 1994 the factory was authorised
by AECL and Zircatec Precision Inc. Canada as a CANDU 6 type fuel manufacturer;
• In 2004, the factory has increased its manufacturing capacity in order to ensure the needed fuel for the Cernavoda NPP Unit 2, which was put in operation in 2007.
• The factory design capacity is now of 200 tHM/year and it will probably be further increased to cover the needs of two more units (U3 & U4) which are to be built on Cernavoda site.
CANDU 6 fuel assembly produced by Pitesti factory
Nuclear Fuel Cycle Facilities: Fuel Fabrication ACTING IN PRESENT, (where we are ?)

Drobeta Turnu-Severin Heavy Water Factory In operation since 1988;
It is the largest heavy water factory in the world; Is working at 92% of it’s capacity with only 3 modules, with a fourth
one not yet finalized;
A reserve for charging one nuclear reactor is produced in only 4 years;
Nuclear Fuel Cycle Facilities: Heavy Water Factory ACTING IN PRESENT, (where we are ?)

Reactor Type Gross Capacity MW(e)
Construction Start
First Criticality Operating Status
Cernavoda-1 CANDU-6 706.5 1980 16th of April 1996 In operation
Cemavoda-2 CANDU-6 706.5 1980 6th of May 2007 In operation
Cemavoda-3 CANDU-6 720 1980 - Under preservation, construction planned to be restarted
Cemavoda-4 CANDU-6 720 1980 - Under preservation, construction planned to be restarted
Cemavoda-5 CANDU-6 - 1980 - Under preservation, no plans to be restarted
Cernavoda Nuclear Power Plant ACTING IN PRESENT, (where we are ?)

Dry storage facility for spent fuel (DICA)
Nuclear Fuel Cycle Facilities: Spent Fuel Storage
In operation since 2003;
Designed to store CANDU 6 fuel for a period of 50 years;
ACTING IN PRESENT, (where we are ?)

Nuclear Fuel Cycle Facilities: Radioactive Waste Storage Facilities
– Operated by Cernavoda NPP
– Capacity for 2 Units, 40 years of operation, solid (solidified) waste;
– Consist of 3 Structures: • Concrete warehouse • Concrete cylindrical cells • Concrete cubes.
DIDR - The structure no. 1 – warehouse inside view
Cernavoda NPP RW Storage Facility
ACTING IN PRESENT, (where we are ?)

Planned facilities
• Disposal facility: – Radioactive waste from Cernavoda NPP – Site selected, Saligny near Cernavoda – Clay formation – Modular concept – Designed for 4 Units/40 years of operation +decommissioning of 2
Units
• Radioactive Waste Treatment Facility – Cernavoda NPP waste – Super - compaction, drying of resins – Handling devices – Solidified waste - cementation – Manufacturing of modules – Location not yet established
ACTING IN PRESENT, (where we are ?)

Planned facilities
• Tritium Removal Facility – Technological solution for the heavy water moderator of Cernavoda
NPP – Based on the transfer of tritium from the liquid phase (heavy water)
in the gas phase (deuterium), through a catalyzed isotopic exchange process followed by a final concentration of tritium by cryogenic distillation and its safe storage in a metal hydride form
– Design already approved
ACTING IN PRESENT, (where we are ?)

STATE COMMITMENT: Main Actors in Romanian Energy Field
- Romanian Gov.-Ministry of Economy, Trade and Business Environment Relations
- ANRE (Romanian Energy Regulatory Authority) is an independent public entity under the Prime Minister’s coord. ANRE establishes regulations to ensure efficient, transparent and stable functioning of the electricity and heat sectors ANRE:
• Strategic Investors in Energy Sector (Nuclear, Classic and Renewable)
• Main Electricity Producers: Hydroelectrica, Nuclearelectrica, a group of 4 thermo Power companies (coming from the former Termoelectrica)
- Transelectrica SA - Responsible for managing the balance of the Romanian Transport & Distribution network, providing equal and fair access to all parties, balancing the system and providing ancillary services
- OPCOM - The electricity market operator, - Competition Council - monitoring behaviour of market players.
PRESENT ENERGY MIX, (authorities & operators)

• A - Growth rate of “gross domestic product” (GDP) per capita (UM - %) • B - Regional GDP per capita (UM - Lei (RON) per capita) • C - Total “greenhouse gas" (GHG) emissions (UM - Thsd. tonnes) • D - Emissions of greenhouse gases by sector (UM - Thsd. tonnes) • E - Gross Value Added (GVA) (UM - %) • F - Primary energy consumption per inhabitant, (UM – “tonne of oil
equivalent” [toe]/ inhabitant) • G - Primary energy intensity, (UM - toe/1000Euro) • H - Final energy intensity, (UM – toe /1000Euro) • I - Unemployment rate per total and by gender (UM - %) • J - Unemployment rate by level of education (UM - %) • K - Unemployment rate by age group (UM - %) • L - Employment rate - total and by age group indicator (UM - %) • M - Risk-of-poverty rate after social transfers (UM - %)
PRESENT STATUS, (information for prognosis) Status of Romanian economic development until 2012 –Economic & Statistical Indicators and Unit of Measure (UM)

PRESENT STATUS, (which are the trends?)
A. - Growth rate of GDP per capita (UM - %)
3C. - Total GHG emissions (UM - Thsd. tonnes)
Status of Romanian economic development until 2012 –Economic & some Statistical Indicators for the 2070 prognosis
3F- Primary energy consumption per inhabitant, (UM – toe/ inhabitant)
3H- Final energy intensity, (Unit of measure - toe/1000Euro)

ENERGY RESOURCES: Coal, Hydrocarbures, Uranium ores, Renewable (Hydro, Wind, Solar, Biomass) A - Oil : The actual oil reserves stands at around 0.6 billion boe (barrel oil equivalent) at the
beginning of 2009 (EIA, 2009). On maritime delimitation in the Black Sea is estimated to contains about 70 billion cubic meters of gas and 12 million tons of oil (Media, 2009). B – Natural Gas : Natural gas reserves are also limited and are estimated at about 109 billion cubic metres, and considering the decline in domestic production, the continuity of the their exploitation is ensured for about 10 years. C - Coal : Romania has important reserves of coal, although the coal quality is rather poor.
PRESENT STATUS, (which are the trends?)
D – Renewable energy resources : Hydropower generation and wind power generation accounted for almost the entire amount of the total electricity generated by renewable energy sources in Romania. According to CN Transelectrica SA, the breakdown of renewable energies by 1 June 2012 (7,853 MW) was hydropower (6,511 MW), wind power (1,314 MW) and biomass (26 MW) with little solar power.
E – Uranium: National Uranium Company CNU is the only national company engaged in: • exploration and mining of raw uranium ores (Crucea and Botusana mines), • conservation / closing / environmental restoration (Dobrei, Natra & Ciudanovița mines.), • uranium ore processing/ concentrate refining / dioxide production (Feldioara Plant).

ENERGY PRODUCTION & CONSUMPTION – statistics 2002-2011 PRESENT STATUS, (which are the trends?)
The domestic energy production and consumption for the period 2002-2011 are illustrated in the Table 3.16 and Table 3.17.
Romania has a wide but quantitatively reduced range of fossil and mineral energy resources as: oil, natural gas, coal, uranium ore, and a great potential of renewable energy resources.

PRESENT STATUS, (which are the trends?) Gross Electricity Generation – statistics 2000-2011
Gross, Net Electricity Generation [GWh] and Grosspeak of Electricity Demand [GW] for
the period 2000-2011
Hydro PP 20,24 TWh
33%
Nuclear PP 11,62 TWh
19%
Thermal PP 28,81 TWh
47%
Wind PP 0,31 TWh
1%
Electricity generation [TWh] per type of power plants in
2011

PRESENT STATUS, (which are the trends?) Nuclear Power in Electricity Mix Production
National Energy Mix (NEMix) Production [MW] in 2016 for 24 h: (02.05 h16:00 - 03.05 h16.00)
Electricity cannot be stored in the System !

PRESENT STATUS, (which are the trends?) Nuclear Power in Electricity Mix Production (II)
National Energy Mix (NEMix) Production [MW] in 2016 for 24 h: (03.01 h08:00 - 04.01 h08.00)

PRESENT STATUS, (which are the trends?) Centralized Heat Supply System – statistics in 2010
• The centralized heat supply system includes the heat distribution network and the district stations for Hot Water Mix and Distribution (HWMixD). Heat can be stored for several hours !
• This system has old installations that are planned to be replaced with Thermal Classical Cogeneration Systems and Hot Water Boilers (to support the heat consumption on the pick).

ACTING FOR THE FUTURE (the “Smart Electrical and Heat Grid”)
Conceptual Flow-Chart on MAED & MESSAGE Prediction in Romanian Case Study
Technical Studies Predictions for a sustainable contribution of Nuclear Power in Energy Mix – planning the Long Term Vision using IAEA Tools: we have elaborated nuclear scenarios, we predicted their long term effects and we selected the optimal nuclear contribution vs. a set of established principles and bounds – we have solutions - what are their long term effects?
National History of -Economic -Social -Environmental -Institutional & Technological Indicators
3 MAED Prediction for Energy Demand Long Term evolution
slow Demand (D1) evolution of electricity
& district heat medium Demand (D2)
evolution of electricity & district heat
high Demand (D3) evolution of electricity
& district heat
Proven Technologies for electricity and/or heat production (Classic,
Renewable, Nuclear) Proven technologies for energy
storage and redistribution (Hydro/ Thermal Pumping Storage )
- Non Proven Technologies (non-affordable at low costs)
-
MESSAGE Prediction for the Energy Mix Competitors Long Term Contributions
Classic optimistic
3 Nuclear Scenarios Low Nuclear (S1)
Hig Nuclear (S3)
Reference Nuclear (S2)
Contribution for (S3)
Contribution for (S1)
Contribution for (S2)
principles

ACTING FOR THE FUTURE (we have predictions) IAEA MAED & MESSAGE tools used in National Studies
• MAED - to estimate the energy annual Electricity and District Heat long term Demands for three possible 2011-2070 evolutions of the society: – slow-pessimistic (D1), – medium-reference (D2), – rapidly-optimistic (D3).
• MESSAGE - to generate optimal predictions for 3 the nuclear scenarios, linked to 3 equal probable options of the political makers on 2011-2070 period of modelling: – Low Nuclear Scenario (S1), – Reference Nuclear Scenario (S2), – High Nuclear Scenario (S3).

ACTING IN THE FUTURE = (decide to solve the problems estimated in long terms by the MAED and MESSAGE Programs) - Brief MAED optimal predictions vs. Govt. & Industry Decisions
• The “final energy consumption” is in proportional with the product between the “primary” and to the “final” “energy intensity”; How will be possible to reduce more the “final energy consumption” until 2070 by Govt. & Industry Decisions?
• Which will be the real demand increase until 2070 ?
• The evolution of Energy Demand (D) predicted by MAED for 2011-2070 period: – The overall demand
includes the electricity demand (De) and District Heat Demand (Dh): D=De+Dh
– The predicted Demand is some were between the D1=De1+Dh1 and D3=De3+Dh3
– D2=De2+Dh2 is the most probable evolution and is considered as “reference” in the MESSAGE study

ACTING IN THE FUTURE = (decide to solve the problems estimated in long terms by the MAED and MESSAGE Programs) - Seasonal/ weekly/ daily variation in energy demands (2011 statistics)
MESSAGE annual load regions graphs for Electricity (a) and Heat (b) Demands
(a) (b)

ACTING FOR THE FUTURE (General Case Study Matrix) MESSAGE competitor technologies…free Gen III+ limits?
NUCLEAR POWER SECTOR: • S1: only 2 CANDU units (existing ones + life extension) • S2: 4 CANDU units – national energy strategy in force 2013-2020
(existing ones and those in construction + life extension); sensitivity studies of 3 scenarios of investment capital level costs
• S3: 4 CANDU units + NEW NPP free installed capacities (Gen III+ after 2035: PWR/ HWR mix)* + Gen IV(ALFRED project in development – not yet considered as competitor in the preliminary model till 2070)
CLASIC POWER & DISTRICT HEAT SECTOR – optimistic assumption • HYDRO (including pumping-storage), RENEWABLE (Wind Farms &
Solar PV), THERMO (existing/ coal, lignite, gas; new/ lignite, gas, including thermal district-distribution & storage – CO2 capture technologies not yet considered as classic competitors in the preliminary model till 2070/ “GETICA CO2 project” have no relevant results)
NON-PROVEN TECHNOLOGIES in the first year of modelling period: • These are in development status and the industrial use will be very costly • These technologies will be developed and used only when the energy
demand will exceeded the proven technology capacity
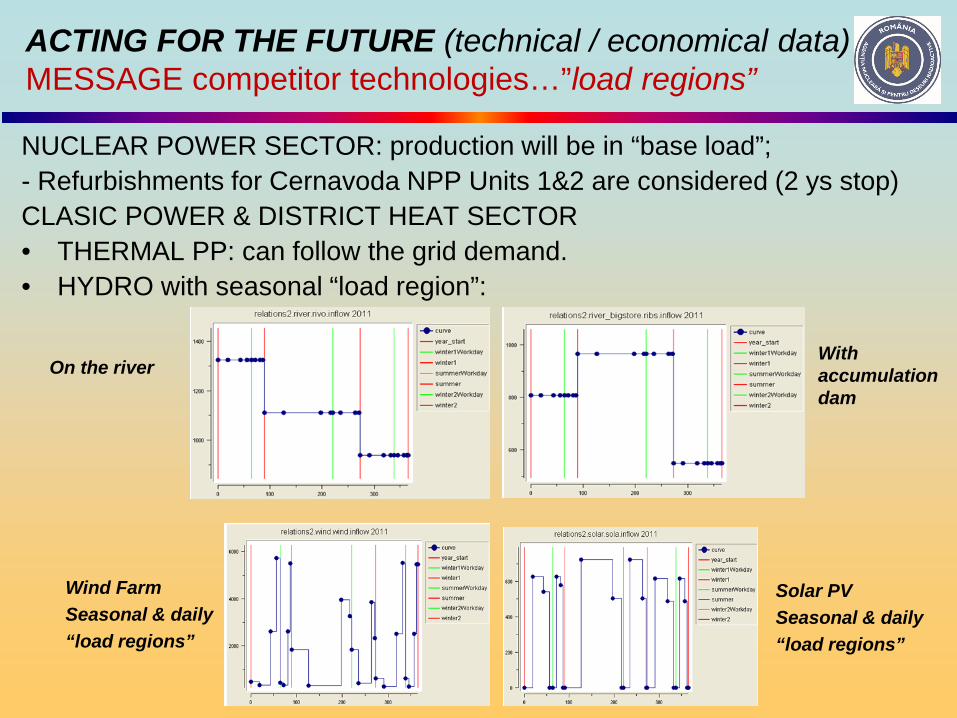
ACTING FOR THE FUTURE (technical / economical data) MESSAGE competitor technologies…”load regions”
NUCLEAR POWER SECTOR: production will be in “base load”; - Refurbishments for Cernavoda NPP Units 1&2 are considered (2 ys stop) CLASIC POWER & DISTRICT HEAT SECTOR • THERMAL PP: can follow the grid demand. • HYDRO with seasonal “load region”:
Wind Farm Seasonal & daily “load regions”
Solar PV Seasonal & daily “load regions”
On the river With accumulation dam

Principles (P) and basic MESSAGE assumptions for selection of scenarios assuring the long term sustainable development of Nuclear Energy System in National Energy Mix
• P1: The sustainability of the National Energy Mix (NEMix) is ensured by its Proven Technologies' components capability to met associated sustainable demand.
• P2: The security of energy supply of the National Energy Mix (NEMix) is ensured by their structural components capability to met associated sustainable demand.
• P3: The „MESSAGE case study” performed for this report is considering the Combined Electricity and District Heat national mix (EDHMix) - composed by 3 main competitor components at minimal costs of energy production : Classical, Renewables and Nuclear ; Non-Proven (dummy) technologies are also considered in competition in order to assure fitting of the considered demand.
• P4: NEMix security of energy supply can be ensured if all its subsystems contribute to the security of energy supply, in compliance with EU requirements on the minimising the CO2 emissions – but is sustainable and secured if the dummy technologies are not selected.

Basic MESSAGE optimal predictions: the period of “security of energy supply” – S1/2045; S2/2065; S3 vs. public acceptance…?
The period in which the “security of energy supply” in the NEMix is ensured for each nuclear scenario considered, for the medium demand (D2) increase of energy and for the discount rate 8% by year, is as follows: • 2011-2065, for the
Reference Nuclear Scenario (S2, Dummy),
• 2011-2045, for the Low Nuclear Scenario (S1, Dummy),
• 2011-2070 and after this period, for the High Nuclear Scenario (NO Dummy S3).
Classical proven technologies will be Less competitiveness ….
…then advanced Nuclear proven technologies

The MESSAGE optimal prediction for “the potential role of Nuclear Power in NEMix”
• The potential role of Nuclear Power in NEMix until 2070, of the 3 Nuclear Scenarios are discussed in rapport with their capability to ensure the security of energy supply for the medium energy demand until 2070.
• The MESSAGE optimal predictions are used to analyse the possible effects of variability of: – the energy demand evolution, – the investments discount rate, – the evolution of total renewable energy sharing in NEMix, – the level of the reference costs of the investments for the new nuclear
technologies allowed by each nuclear scenario to be installed in NEMix,
– the level of CO2 emission penalty decided to be applied on the modelling period in NEMix to the classical technologies activities,
– the option to bound or not the MESSAGE process to use integer class of mixed activities and capacities of the technologies in NEMix for the all period of optimisation

Basic MESSAGE optimal predictions: the opportunity to use nuclear as technologies with “zero emissions of greenhouse gases” in competition with other technologies…vs. NPP’s public acceptance ?
This opportunity differs for each nuclear scenario, depending on the evolution level of the energy demand as follow: • For the Reference Nuclear
Scenario (S2) and the Low Nuclear Scenario (S1) – nuclear technologies ensure to meet the uncovered energy demand by the renewable technologies annual production, and by the maximal annual classical technologies production, allowed after the national CO2 emission annual limit is reached..
• For the High Nuclear Scenario (S3) – the nuclear technologies ensure to met the energy demand uncovered by classical technologies and, similar to the other two scenarios until 2035. After 2035, advances nuclear technologies will further contribute to rapid reduction of CO2 emissions as result of their competitiveness superior to other two technologies.
CANDU 3&4 contribution
CANDU 3&4 contribution & Adv HWR contibution
Adv HWR contribution & Adv PWR contibution
HWR – Heavy Water Reactors PWR – Pressurized Water Reactors

NUCLEAR VISION, for the 3 scenarios until 2070 Romanian Nuclear Fuel Cycle & RW Facilities
Mining Uranium Ore
Extraction (S1,S2,S3)
Feldioara Conversion Factory Conversion (S1,S2,S3)
Pitesti Nuclear Fuel Factory Fuel Fabrication Cernavoda NPP
Units 1 & 2 Electricity
Production (S1)
Spent Fuel Disposal
(Deep Geological Repository -
projected after 2055)
Cernavoda “DICA” – MACSTOR, Dry Storage Facility
Spent Fuel Storage (S1,S2)
Baita “NDDR” – low-level
radioactive waste;
Saligny “DFDSMA” – (low &
intermediate-level radioactive waste -
projected after 2020)
Cernavoda NPP Units 3 & 4 Electricity Production (S2,S3)
Import UO2 (S2,S3)
Advanced HWR Units Electricity production (S3)
Advanced PWR Units Electricity production (S3)
Import HWR fuel (S3)
Utility Dry Storage Facility Spent Fuel Storage (S3)
Import PWR fuel (S3)
Back to the country of origin Spent Fuel Storage (S3)
Drobeta Turnu-Severin Heavy Water Factory
Heavy Water Production (S1,S2,S3)

Basic MESSAGE optimal predictions: Uranium consumption trends, fuel consumption (domestic and imported) and volume of spent fuel accumulated in spent fuel storages (wet and dry) vs. public acceptance*
The results of the optimization carried out with MESSAGE, emphasize the following specific aspects: • The uranium resources currently exploited with moderate costs shall be sufficient for
Cernavoda Units 1 and 2 operations throughout the whole considered life time within the three nuclear scenarios.
• For the operation of Cernavoda units 3 and 4, in the Reference and in the High Nuclear scenario, it is expected that the resources shall be depleted around 2030 – 2040, followed by operation using imported fuel.
• For the operation of advanced PWR and HWR units, in the High Nuclear Scenario, the optimal solution is to use imported fuel. • The volume of the
accumulated spent nuclear fuel by the end of 2070 in the interim dry fuel repository depends on the selected nuclear scenario, as well as on the forecasted energy consumption.

Basic MESSAGE optimal predictions: Re-distribution System Share in NEMix total Production
The General Case Study Model used in MESSAGE, includes two types of energy storage and re-distribution systems in NEMix: • The district heat pipes
lines, in the large cities to including the existing District-Heat grids and their existing capacity (“HeatPump_SI), associated to the CHP total installed capacities NEMix (“HeatFlow_I”)
• Tarnita-Lapustesti Hydro Pumping (“Pump”) Storage (“Turb.”) system, predicted to be installed after 2015 in Romania.This system is selected in NEMix after 2021 • The capacity of District–Heat grids to store and redistribute daily
the energy is 10/1 greater the Hydro-Pumping Storage System

ACTING IN THE FUTURE = (decide to solve the problems estimated in long terms by the MAED and MESSAGE Programs) - Brief MESSAGE optimal prediction vs. Govt. Industry Decisions (I)
MESSAGE provide different optimal predictions for each nuclear scenario (S1, S2 , S3) indexed for each category of demand (D1, D2, D3).
• A – The period in which the “security of energy supply” in the NEMix is ensured for each nuclear scenario considered for D2 is greater for D1 and lower for D3 . We mention that the year beyond which the security of energy supply will be not ensured yet by NEMix, do not increase over 2045 for S1 if D2 decrease to D1 and this prove that, after this year if will cancel all nuclear, the demand will be over the production of the Classic (limited by CO2 emissions) and Renewable (limited by overall national resources for hydro, wind and solar). This aspect prove also the opportunity to use nuclear technologies over 2045 as technologies with “zero emissions of greenhouse gases”.
• B – The competitiveness of nuclear technologies selected within each nuclear scenario, each other and compared to other available technologies, prove the more economic competitiveness of advanced nuclear technologies (HWR & PWR) than the proven classical technologies considered.
• C – The fuel consumption (domestic and imported) and volume of spent fuel accumulated in the intermediate spent fuel storages for each nuclear scenario, prove that the that the HWR technology generate about 6/1 spent fuel in rapport with PWR. In this reason, MESSAGE will select more PWR for the last period of modelling; Taking into account the associated CO2 emissions over-reduction of Romanian engagements in EU, is indicated to limit nuclear technologies installed until this limit.

ACTING IN THE FUTURE = (decide to solve the problems estimated in long terms by the MAED and MESSAGE Programs) - Brief MESSAGE optimal prediction vs. Govt. Industry Decisions (II)
MESSAGE optimal prediction can be used by Govt. & Industry decisions –makers: - Which will be the best way to promote these optimal predictions in the
totally deregulated frame of the National and International Market? - What will be the national and/or international tools that we can develop in the
future, in order to promote inside the society new Technical Studies for Nuclear Energy Sustainability and their “best optimal predictions“?
• D – The variation of the level of investment required to install a nuclear technology within NEMix, depending on selected nuclear scenario, depending on the time elapsed between two similar nuclear investments, and in relation with the investment discount rate, prove the need to plan investments and to carry out early specific investment programmes for installing the nuclear technologies in each nuclear scenario selected; 10 years delay double the initial investment costs and can decrease the attractively of the new investors for a delayed nuclear project.
• E – The capacity of the combined energy system (electricity and heat) to meet the simultaneously variations both in the electricity demand, and in the thermal energy demand prove the huge opportunity in the future to use Hot Water Boilers (District Heat Accumulators) to support the daily variations, that will be more effectiveness than “Tarnita Pumping Storage Project” in rapport of 10/1. In this respect the Hot Water Boilers will be very useful in the future.

FINAL CONCLUSIONS (I)
• Technical studies are recommended to give an expert vision about the possible scenarios about nuclear contribution of nuclear energy in NEMix and their security of supply.
• Some recommendation are general and can apply to promote all the competitor technologies in NEMix .
• NESA with INPRO Methodology* can provide supplementary information about the long term sustainability of the selected scenarios of nuclear energy contribution in NEMix, and also identify the need of improvement to achieve the long term sustainability.
*- NESA in 3 areas (economic, infrastructure, and radioactive waste management) is completed and the first draft of the technical report is in preliminary status of ANDR official approval (the result cannot be shared yet).

FINAL CONCLUSIONS (II)
• Romania can maintains a balanced, competitive and technologically neutral energy mix where nuclear energy will contribute to achieving energy and climate targets set at European and National level.
• Most probably nuclear power will not have alternate options on a medium and long term during this century.
• Romania has a clear option and commitments regarding nuclear power programme.
• The increased contribution estimated for nuclear technologies in energy mix in "high nuclear scenario" will generate long term issues in the Nuclear Fuel Cycle back-end in order to reach the radioactive wastes neutral end state; these issues need to be periodically assessed for sustainability using the basic principles of INPRO Methodology in economics, infrastructure and radioactive waste management areas vs. the advanced status of the art for proven nuclear technologies in order to find theirs long term optimal contribution.

Thank you for your kind attention !