the power of big ideas in mathematics education - cresst - ucla
TRANSCRIPT

The Power of Big Ideas in Mathematics Education:
Development and Pilot Testing of POWERSOURCE Assessments
CSE Report 697
David Niemi, Julia Vallone, and Terry Vendlinski CRESST/UCLA
August 2006
National Center for Research on Evaluation, Standards, and Student Testing (CRESST) Center for the Study of Evaluation (CSE),
Graduate School of Education & Information Studies University of California, Los Angeles
GSE&IS Building, Box 951522 Los Angeles, CA 90095-1522
(310) 206-1532
Copyright © 2006 The Regents of the University of California
The work reported herein was supported under the Educational Research and Development Centers Program, PR/Award Number R305B960002, as administered by the Office of Educational Research and Improvement, U.S. Department of Education.
The findings and opinions expressed in this report do not reflect the positions or policies of the National Institute on Student Achievement, Curriculum, and Assessment, the Office of Educational Research and Improvement, or the U.S. Department of Education.

1
THE POWER OF BIG IDEAS IN MATHEMATICS EDUCATION:
DEVELOPMENT AND PILOT TESTING OF POWERSOURCE ASSESSMENTS
David Niemi, Julia Vallone, and Terry Vendlinski
Center for Research on Evaluation, Standards, and Student Testing
University of California, Los Angeles
Abstract The characteristics of expert knowledge—interconnectedness, understanding, and ability to
transfer—are inextricably linked, a point that is critically important for educators and
constitutes a major theme of this paper. In this paper we explore how an analysis of the
architecture of expert knowledge can inform the development of assessments to help teachers
move students toward greater expertise in mathematics, and we present examples of such
assessments. We also review student responses and preliminary results from pilot tests of
assessments administered in sixth-grade classes in a large urban school district. Our
preliminary analyses suggest that an assessment strategy based on the structure of
mathematical knowledge can reveal deficiencies in student understanding of and ability to
apply fundamental concepts of pre-algebra, and has the potential to help teachers remediate
those deficiencies.
Introduction For educators, researchers and others who are interested in improving learning,
and particularly learning of complex skills and knowledge, a fundamental challenge is understanding how isolated skills and pieces of knowledge learned in a variety of classroom contexts can become inter-connected, meaningful, and generalizable. As cognitive science research has convincingly demonstrated, it is the connections among elements of knowledge, understanding of important concepts and principles, and the ability to apply knowledge flexibly and effectively in a wide variety of situations, that characterize the development of knowledge toward greater expertise (e.g., Ausubel, 1968; Bereiter & Scardamalia, 1986; Chi & Ceci, 1987; Chi, Glaser, & Rees, 1982; Glaser & Chi, 1988; Larkin, McDermott, Simon, & Simon, 1980; Niemi, 1996; NRC, 2002, 2004;

2
Silver, 1981). This is true for all domains that cognitive scientists have studied, including mathematics, science, history, reading, writing, and other school subjects.
The Importance of Big Ideas
Decades of cognitive research and educational experience have shown that when specific responses to specific tasks or questions are learned by rote, that knowledge does not generalize (e.g., Bassok & Holyoak 1989a, b; Bransford, Brown, & Cocking, 1999; Carpenter & Franke, 2001; Chi, Glaser, & Farr, 1988; Ericsson, 2002; Larkin, 1983; Newell, 1990; NRC, 2004). Despite the robustness of this finding, however, mathematics instruction in the U. S. has historically focused on the memorization of specific responses to specific questions, and as a result, the knowledge most students have is extremely context bound and not generalizable. Most K-12 mathematics students do not construct the meaning of core concepts and principles, cannot relate concepts to problem-solving skills and procedures, and view mathematics as a collection of isolated, meaningless procedures to be memorized, not understood (e.g., Carpenter & Lehrer, 1999; Heibert & Carpenter, 1997; Porter, 1989; Schmidt, 2001; Stodolsky, 1988).
In contrast to the piecemeal, context-bound knowledge that beginning learners have, expert knowledge has a relational structure: this is one of the strongest and most powerful conclusions to be drawn from decades of cognitive science research on the nature and development of knowledge—strongest, in the sense that it has been extensively and compellingly validated in a large number of studies, and powerful, in the sense that it has great explanatory force and broad implications for teaching, learning, and educational practice in general. For someone who has advanced knowledge in a domain, every element of that knowledge is connected to other elements in a highly organized structure, with certain statements, expressing important ideas, dominating and organizing other types of knowledge (e.g., Bereiter & Scardamalia, 1986; Chi & Ceci, 1987; Chi, Glaser, & Rees, 1982; Glaser & Chi, 1988; Larkin, McDermott, Simon, & Simon, 1980; Bransford, Brown & Cocking, 1999; Niemi, 1996; Wineburg, 2002). That certain ideas organize other kinds of knowledge, including problem-solving strategies and skills, was first and most dramatically revealed in a series of studies by Glaser and colleagues (Chi & Glaser, 1981; Chi et al., 1982).
In one study, for example, when physics experts and novices were asked to sort problems printed on index cards (Chi et al., 1981), the experts put together problems on the basis of abstract concepts and principles, e.g., Newton’s laws, conservation of
3
energy. Novices, on the other hand, sorted on the basis of physical features of the problem situation, e.g., “there’s an inclined plane in these problems”. The novices either did not understand the theoretical principles or did not know how and when to apply them to problem-solving situations. One effect of representing problems in terms of theoretical concepts is that expert problem solvers can activate and implement problem-solving procedures linked to those concepts, e.g., formulas for solving conservation of energy problems. Novices have to resort to remembering how they solved problems with similar surface features, which can lead to ineffective solution strategies as problems with the same surface features (e.g., inclined planes) may be conceptually very different.
A follow-up study (Chi et al., 1982) using a different method, concept mapping, further confirmed that experts’ problem-solving schemas were organized primarily around the laws of physics and conditions for applying them, while novice schemas were organized around the surface features of the problems. Chi et al. (1982) concluded that weakness in novices’ problem solving could be attributed primarily to deficiencies in their knowledge base and its organization. A range of studies have replicated these findings in many other domains, and in each case researchers have found that experts have highly structured schemas, or knowledge structures, that are organized around central concepts or principles, or “big ideas”. The nature of these concepts differs from domain to domain, but in general they are abstract principles that can be used to organize broad areas of knowledge and make inferences in the domain, as well as determining strategies for solving a wide range of problems.
It has been known for many years that the understanding of big ideas leads to more flexible and generalizable knowledge use, improves problem solving, makes it easier to make sense of and master new facts and procedures, and enables transfer (e.g., Ausubel, 1968; Chi & Ceci, 1987; Gelman & Lee Gattis, 1995; Larkin, McDermott, Simon, & Simon, 1980; Silver, 1981). The importance of understanding the core principles of a subject area and using them to organize knowledge (or for schema) has been found in many different subject areas, from interpreting X-rays, solving navigational problems, or playing chess (Chi, Glaser, & Farr, 1988; Ericsson, 2002; Larkin, McDermott, Simon, & Simon, 1980) to mathematics (Ball & Bass, 2001; Carpenter, Fennema, & Franke, 1996; Carpenter & Franke, 2001; Collis & Romberg, 1991; diSessa & Minstrell; 1998; Lane, 1993; Porter, Kirst, Osthoff, Smithson, & Schneider, 1993).
4
Identifying Big Ideas
Given the importance of big ideas—organizing concepts and principles—in the organization of expert knowledge and in expert problem solving, the obvious question is how to determine what the big ideas are in a domain. Chi and Glaser ingeniously chose tasks that could be classified in terms of big ideas, but they did not offer a comprehensive list of big ideas in physics. One could follow their lead and administer a lot of tasks to a lot of experts (mathematicians in our case). Presumably the experts would identify the big ideas represented by those tasks, assuming that the tasks actually reflected and required knowledge of the big ideas. Without knowing what the big ideas are, however, it would be difficult to insure that the tasks comprehensively covered the big ideas in question. There would be no way to guarantee that one had the right set of tasks, without identifying ahead of time the big ideas to be targeted by those tasks. To address this problem, we developed a procedure for eliciting big ideas directly from experts. We did this because we found that neither state standards nor existing curricula make clear what the big ideas in a domain are, nor how other elements of knowledge relate to the big ideas. Once experts identified the big ideas for their domains, we were able to use the big ideas to develop a structured framework of knowledge for each domain, and the framework was then used to build a content blueprint for assessment development.
For this study we focused on identifying big ideas in algebra, because of the importance of algebra as a gateway to higher education, advanced mathematics coursework, and a wide range of careers. Many states have pushed to require that all high school students be proficient in algebra, and even that first-year algebra be mastered by the end of eighth grade (California Mathematics Frameworks [CMF], 1999; NCTM, 2000). Yet success in algebra has been elusive for too many students, particularly those from underrepresented groups, and one likely explanation for this is that students are not mastering the big ideas that could serve as a foundation for mastering algebra (Carpenter et al., 2003). The work described in this paper is embedded in a larger project that seeks to alleviate this problem in two ways: first, by working with mathematicians and mathematics educators to develop an ontology or conceptual map of algebra knowledge and its prerequisites; second, by using this ontology to develop and test a series of diagnostic assessments that teachers can use in elementary through middle school to help assure that their students are developing the fundamental knowledge and skills they will need to succeed in algebra. The assessments will be one component of an intervention that will include professional
5
development and instructional activities and resources to help students who have not mastered the big ideas. This comprehensive intervention will be experimentally tested in the 2007-08 school year in a large sample of classrooms (see, for example, Baker, 2006). This paper covers the initial steps in this project, analysis of the domains to be assessed and development and pilot testing of several types of assessments.
We have worked closely with experts, including university professors and working scientists and mathematicians in several disciplines to identify the big ideas in their domains. Our methodology has evolved with experience, and the process for elucidating big ideas has been gradually refined. For example, to create a list of big ideas in algebra we initially worked with three university-level mathematicians and two high-school teachers. Rather than consider how topics are typically organized for pedagogical purposes, or how content is conventionally organized in curricula, the experts were asked to consider which ideas were most important in their own thinking and problem solving. The expert panel first identified first the big ideas that organized their thinking and work in the domain, then subordinate or supporting ideas that elaborate and give meaning to the organizing concepts. The list of big ideas and supporting ideas was subsequently reviewed and the language slightly revised by six other mathematicians working in two separate groups. As an example of the kinds of statements comprising the final list, Statement 1 below is an overarching big idea and Statement 2 is a related supporting idea:
1) A number is any entity that obeys the laws of arithmetic; all numbers obey the laws of arithmetic.
2) Equivalence is a fundamental property of rational numbers: equivalent fractions, percents, and decimals all name the same relationship between two values.
(There are 20 big ideas in the final list, which may be obtained from the authors.)
Using Big Ideas to Build Assessments
From the algebra big ideas list created by experts, three conceptual domains, each representing one or more big ideas, were selected for assessment trials with sixth-grade students in the Los Angeles Unified School District. These domains were selected because they are: a) heavily represented in state standards and state and district test blueprints; b) historically difficult for students to master; and c) important prerequisites for learning and mastering algebra. In each domain we specified the conceptual-declarative and procedural knowledge to be assessed, as follows:
6
1) Properties of arithmetic: The conceptual-declarative knowledge associated with this domain involves understanding these big ideas: the multiplicative identity, order of operations, and the distributive law for multiplication. Procedural knowledge associated with these big ideas includes using the ideas to evaluate expressions and solve single-step equations.
2) Principles for solving equations: The conceptual-declarative knowledge or big ideas involved here include knowing what it means to solve an equation and the meaning of the equals sign, as well as the principles that underlie solution procedures. Procedural knowledge includes the ability to solve simple one-step equations (e.g., divide both sides of the equation by a non-zero number).
3) Rational number equivalence: The big idea here is that equivalent representations of a rational number can by generated by applying the multiplicative identity (e.g., multiply a given fraction by a/a). Procedural knowledge includes the procedures for recognizing and finding equivalent representations of fractions, decimals, and percents; finding fractions that are equivalent to a given fraction; and determining when two fractions are equivalent.
Strategy for Developing Assessments
To develop assessments of big ideas (which we call POWERSOURCE assessments) for each the three domains, we drew on assessment models we have validated in an extensive series of studies over many years (e.g., Baker, 1997; Baker, Freeman, & Clayton, 1991; Niemi, 1996; Niemi, Sylvester, & Baker, in press). In general, the POWERSOURCE assessments we have been developing involve students confronting a brief problem, description, or other symbolic representation, determining the underlying concept(s) and principle(s) and then either simply solving the problem, or solving and explaining why their procedures work, or inspecting partial solutions or planned strategies and then explaining (or selecting) which principles they exhibit and whether the solutions adhere to the principles’ requirements or limits. Other constraints on the assessments are that they must be relatively easy to evaluate by teachers and must provide information to guide follow-up instructional decisions to help students deepen their understanding. (Ultimately, we will be designing professional development and instructional supports for teachers and students, but in this paper we are focusing on analysis of the domains and initial development and testing of assessments.)

7
Under the general assessment model described above, we have developed three main types of assessment to date: basic computation tasks, partially-worked problems (with or without explanations), and explanation tasks. Initially we included the computation tasks because we wanted to compare performance on those tasks with performance on more complex measures of understanding; we were not necessarily expecting to include computation tasks in the final version of the assessment-with-instruction intervention that we plan to test in the future (for more on long term project plans, see Baker, 2006). Later development and pilot testing will encompass word problems with and without explanations, and other types of open-ended problems. We report here on tasks developed for two of our three conceptual domains: properties of arithmetic and principles for solving equations.
The basic computation tasks are designed to assess whether or not students can recognize problems as instances of particular ideas and can then solve the tasks successfully. Tasks are simple, well-defined problems representing an application of the relevant big idea, e.g., for the distributive property a typical task is:
6 (3 + 1) = 6 • + 6 • 1
With respect to the second category of tasks, partially-worked problems, some evidence suggests that learning from worked examples (problems including solution steps and often the final solution with some parts missing) is an effective way of gaining cognitive skills in well-structured domains such as math and physics (Renkl, Atkinson, Maier, 2000; Sweller, van Merrienboer, & Paas, 1998; VanLehn, 1996). Indeed, Sweller (1989) found that studying worked examples was more effective than traditional problem solving alone. The use of worked examples does not, however, guarantee positive learning outcomes. Other research has shown the extent to which students are asked to explain how each step plays a role in the effectiveness of the learning method (Renkl, 2002) as does the way in which the tasks are structured. As suggested in the literature, well-designed worked examples, particularly those requiring explanations, may allow us to make inferences about students’ understanding (or lack thereof) rather than merely providing information about the ability to recall and execute procedures.
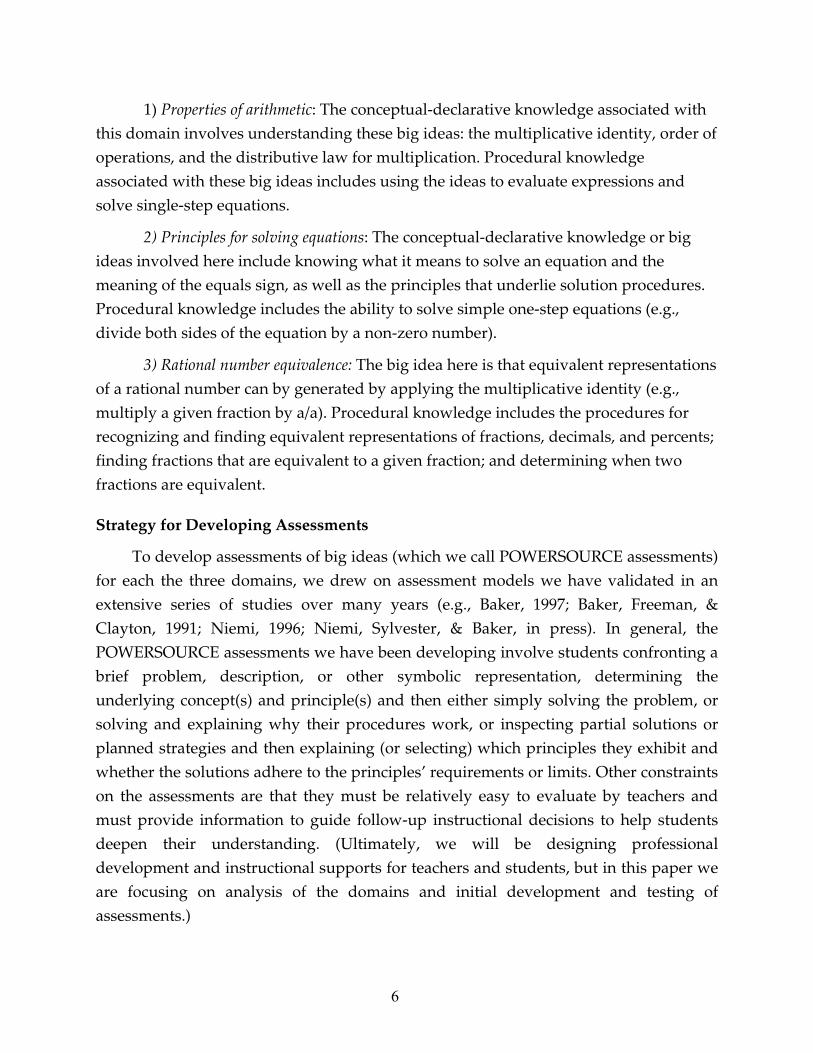
In the worked examples we have developed, the student must read and understand problem-solving steps completed by another person and fill in one to three boxes representing missing numbers or symbols in the problem solution, or fill in a
8
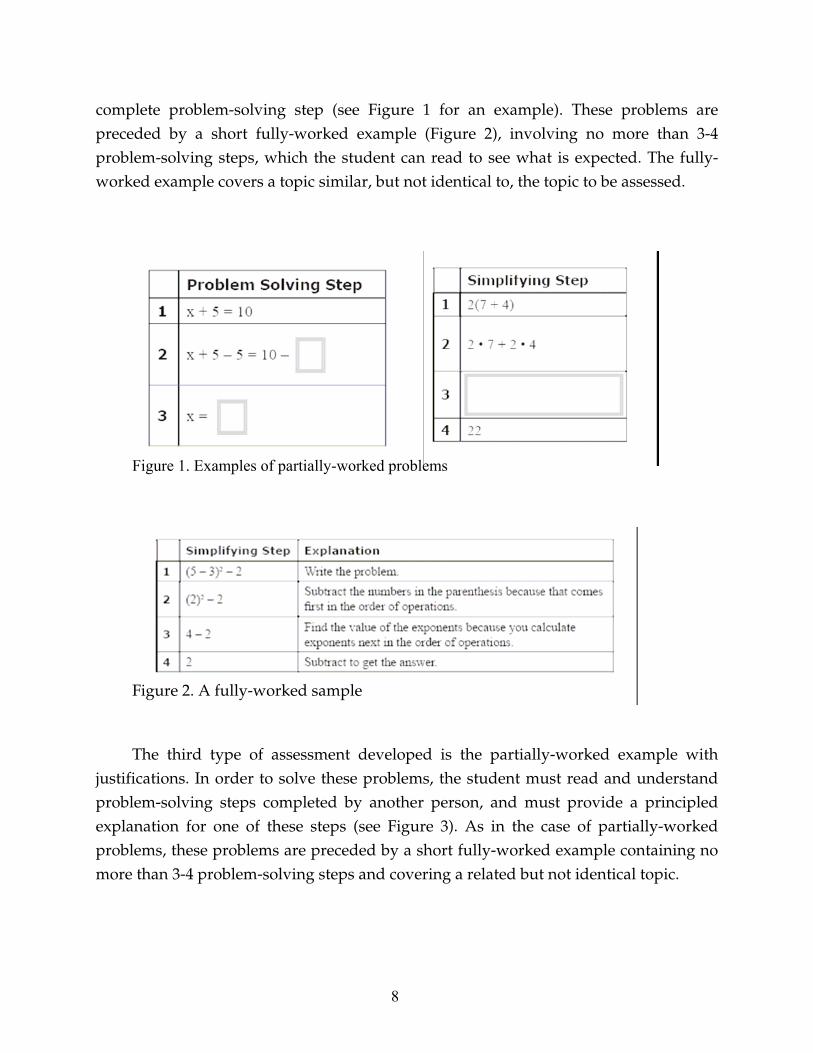
complete problem-solving step (see Figure 1 for an example). These problems are preceded by a short fully-worked example (Figure 2), involving no more than 3-4 problem-solving steps, which the student can read to see what is expected. The fully-worked example covers a topic similar, but not identical to, the topic to be assessed.
Figure 1. Examples of partially-worked problems
Figure 2. A fully-worked sample
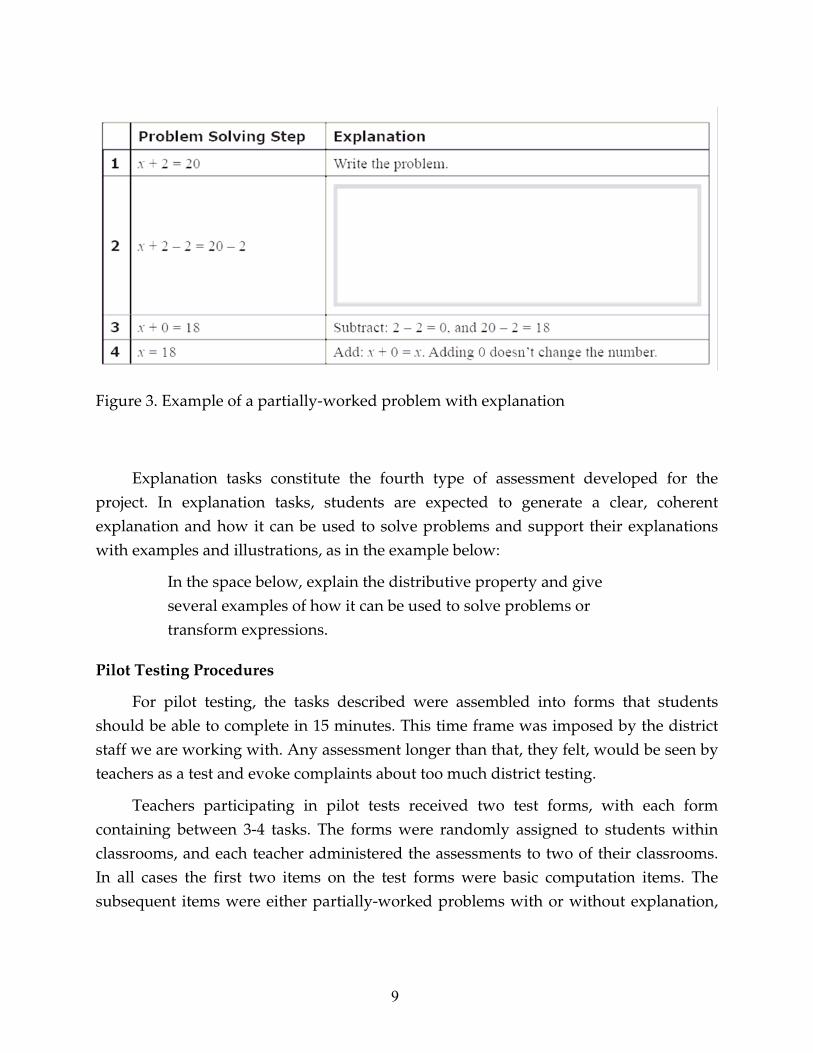
The third type of assessment developed is the partially-worked example with justifications. In order to solve these problems, the student must read and understand problem-solving steps completed by another person, and must provide a principled explanation for one of these steps (see Figure 3). As in the case of partially-worked problems, these problems are preceded by a short fully-worked example containing no more than 3-4 problem-solving steps and covering a related but not identical topic.
9
Figure 3. Example of a partially-worked problem with explanation
Explanation tasks constitute the fourth type of assessment developed for the project. In explanation tasks, students are expected to generate a clear, coherent explanation and how it can be used to solve problems and support their explanations with examples and illustrations, as in the example below:
In the space below, explain the distributive property and give several examples of how it can be used to solve problems or transform expressions.
Pilot Testing Procedures
For pilot testing, the tasks described were assembled into forms that students should be able to complete in 15 minutes. This time frame was imposed by the district staff we are working with. Any assessment longer than that, they felt, would be seen by teachers as a test and evoke complaints about too much district testing.
Teachers participating in pilot tests received two test forms, with each form containing between 3-4 tasks. The forms were randomly assigned to students within classrooms, and each teacher administered the assessments to two of their classrooms. In all cases the first two items on the test forms were basic computation items. The subsequent items were either partially-worked problems with or without explanation,

10
or open-ended explanation tasks. Forms containing explanation tasks did not contain any other tasks besides the basic computational items.
Five sixth-grade teachers were recruited from three middle schools. Teachers were advised to administer the forms to their highest and second highest achieving classes. Two of the teachers administered forms containing problems on principles for solving equations and three gave administered forms that focused on properties of arithmetic. Although each teacher received forms for the same domain, they received two forms containing different assessment items (Form A and Form B). All teachers described their classes as low achieving relative to the rest of the district.
In addition to determining whether students could read and understand the tasks, the pilot tests were designed to compare different types of assessments with respect to the quality of information they provide, their diagnostic utility, and the information value they provide in relation to other tasks. Would some tasks provide us more information about students’ understanding of a particular big idea than others? The data we report here are a first step toward addressing these concerns. All teachers confirmed that the fifteen time frame for the assessments was sufficient, which answered another key pilot test question.
Results
As basic computation tasks and partially-worked examples were very easy to score (dichotomously or on an ordinal scale, respectively), we analyzed these data first, in order to investigate what each allowed us to infer about student understanding. We have also reviewed student responses from explanation tasks, but these data will be reported at a later date.
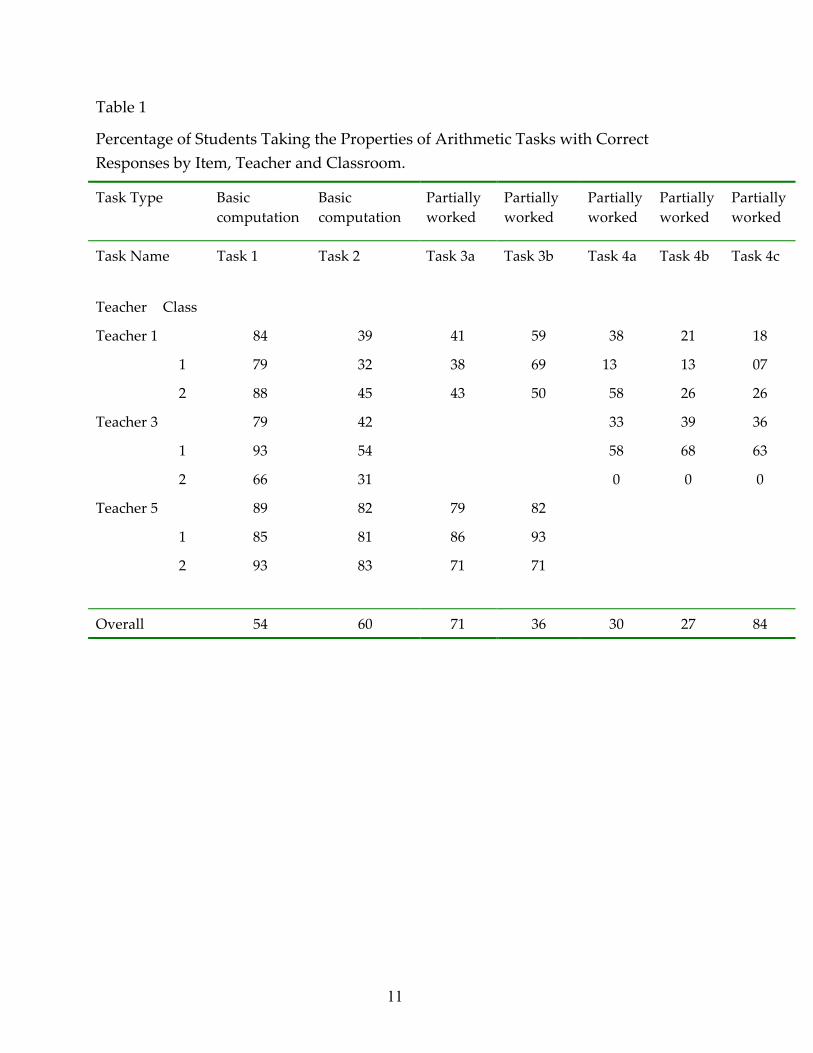
As noted earlier, data were collected from 10 classes at three schools. Four classes received tasks on principles of solving equations and six classes received tasks focused on properties of arithmetic. Table 1 shows the percentage of students with correct responses for each test item for the test forms containing properties of arithmetic items and Table 2 shows results for the solving equations forms.
11
Table 1
Percentage of Students Taking the Properties of Arithmetic Tasks with Correct Responses by Item, Teacher and Classroom.
Task Type Basic computation
Basic computation
Partially worked
Partially worked
Partially worked
Partially worked
Partially worked
Task Name Task 1 Task 2 Task 3a Task 3b Task 4a Task 4b Task 4c
Teacher Class
Teacher 1 84 39 41 59 38 21 18
1 79 32 38 69 13 13 07
2 88 45 43 50 58 26 26
Teacher 3 79 42 33 39 36
1 93 54 58 68 63
2 66 31 0 0 0
Teacher 5 89 82 79 82
1 85 81 86 93
2 93 83 71 71
Overall 54 60 71 36 30 27 84
12
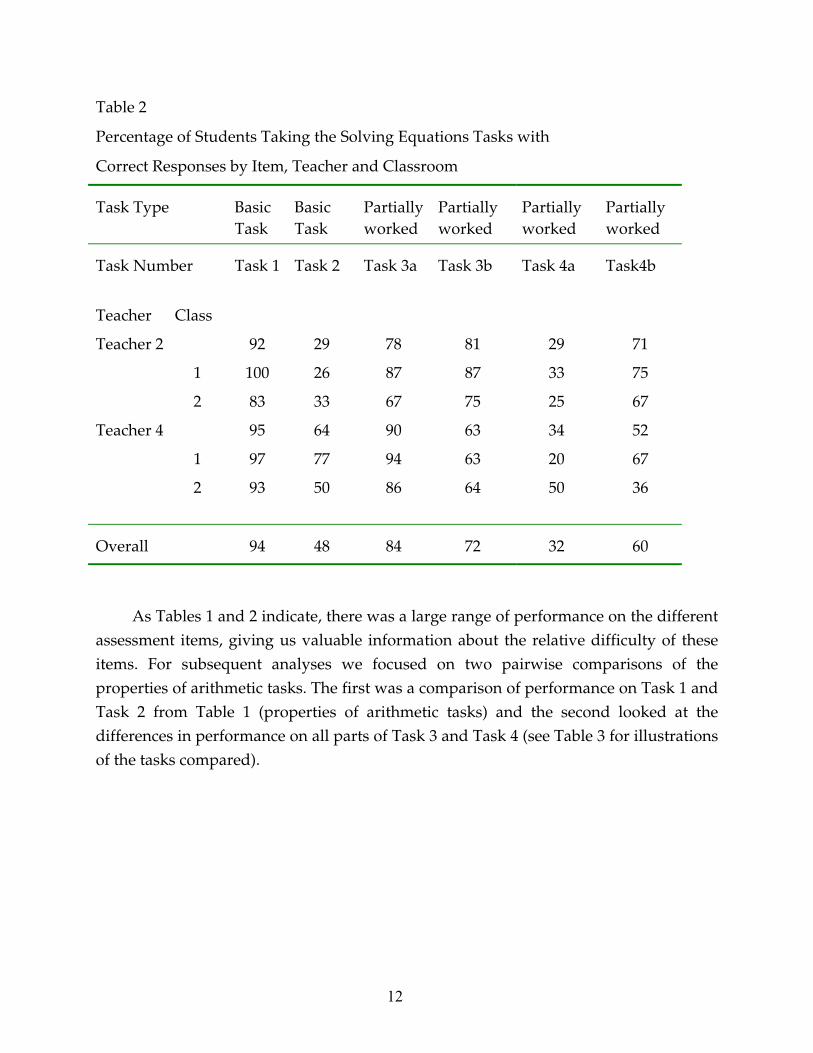
Table 2
Percentage of Students Taking the Solving Equations Tasks with
Correct Responses by Item, Teacher and Classroom
Task Type Basic Task
Basic Task
Partially worked
Partially worked
Partially worked
Partially worked
Task Number Task 1 Task 2 Task 3a Task 3b Task 4a Task4b
Teacher Class
Teacher 2 92 29 78 81 29 71
1 100 26 87 87 33 75
2 83 33 67 75 25 67
Teacher 4 95 64 90 63 34 52
1 97 77 94 63 20 67
2 93 50 86 64 50 36
Overall 94 48 84 72 32 60
As Tables 1 and 2 indicate, there was a large range of performance on the different assessment items, giving us valuable information about the relative difficulty of these items. For subsequent analyses we focused on two pairwise comparisons of the properties of arithmetic tasks. The first was a comparison of performance on Task 1 and Task 2 from Table 1 (properties of arithmetic tasks) and the second looked at the differences in performance on all parts of Task 3 and Task 4 (see Table 3 for illustrations of the tasks compared).

13
Table 3
Tasks Used for Subsequent Analyses
Task number Task
Task 1
6 (3 + 1) = 6 ● + 6 ● 1
Task 2
3 (15 + 5) = ●15 + 3 ● 5
Task 3
Task 4—parts
a, b and c
Frequencies of response for each of the items shown in Table 3 were calculated. We took the top five most frequently given responses and collapsed the rest into the other category. For the most part, responses appearing in the ‘other’ category were

14
given by 1 or 2 students. Table 4 shows that almost 84% of students responded correctly to Task 1 where they were asked to fill in the box representing the second digit in the response. The alternative responses to this and all of the problems analyzed provide valuable insight into students’ misconceptions and errors of thinking. Further analyses were done on these problems and are presented in a later section.
Table 4
Frequency of Responses to Task 1
Response Frequency %
3 * 146 83.9
4 9 5.2
24 5 2.9
1 4 2.3
12 3 1.7
All Other 7 4
Total 174 100
* correct answer
Table 5
Frequency of Responses to Task 2
Response Frequency %
3* 94 54
2 15 8.6
5 11 6.3
23 10 5.7
60 8 4.6
All Other 36 20.8
Total 174 100
* correct answer
15
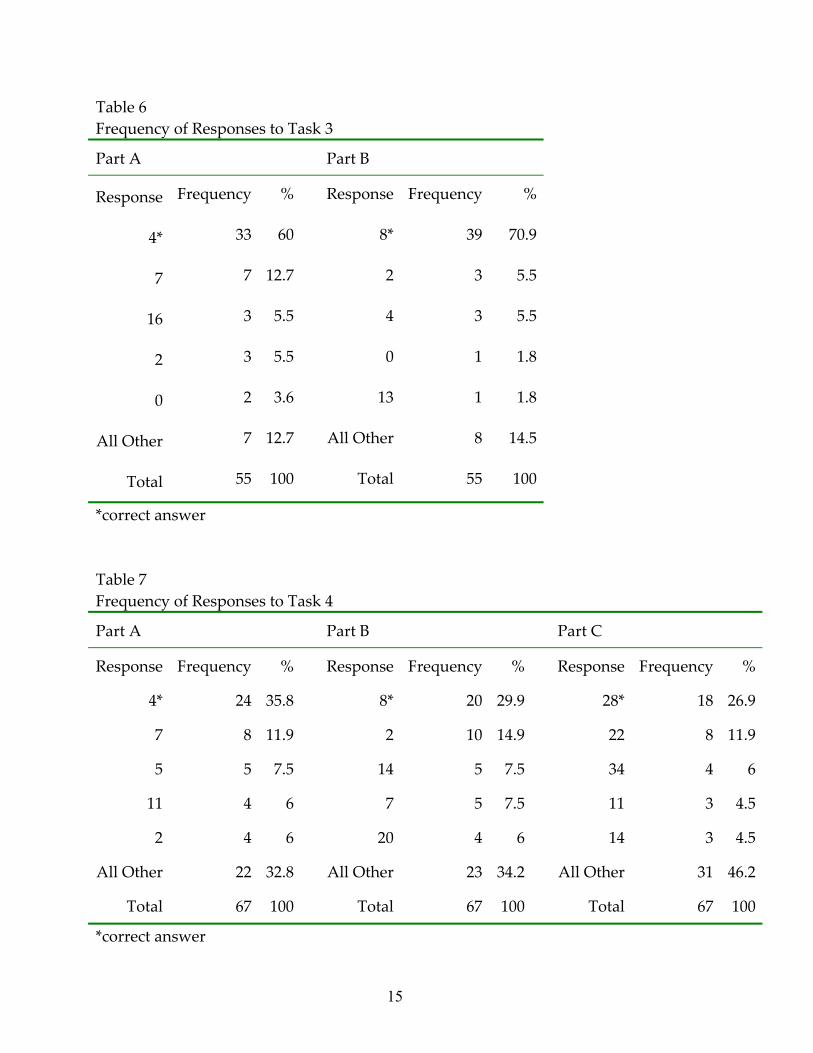
Table 6 Frequency of Responses to Task 3
Part A Part B
Response Frequency % Response Frequency %
4* 33 60 8* 39 70.9
7 7 12.7 2 3 5.5
16 3 5.5 4 3 5.5
2 3 5.5 0 1 1.8
0 2 3.6 13 1 1.8
All Other 7 12.7 All Other 8 14.5
Total 55 100 Total 55 100
*correct answer Table 7 Frequency of Responses to Task 4
Part A Part B Part C
Response Frequency % Response Frequency % Response Frequency %
4* 24 35.8 8* 20 29.9 28* 18 26.9
7 8 11.9 2 10 14.9 22 8 11.9
5 5 7.5 14 5 7.5 34 4 6
11 4 6 7 5 7.5 11 3 4.5
2 4 6 20 4 6 14 3 4.5
All Other 22 32.8 All Other 23 34.2 All Other 31 46.2
Total 67 100 Total 67 100 Total 67 100
*correct answer
16
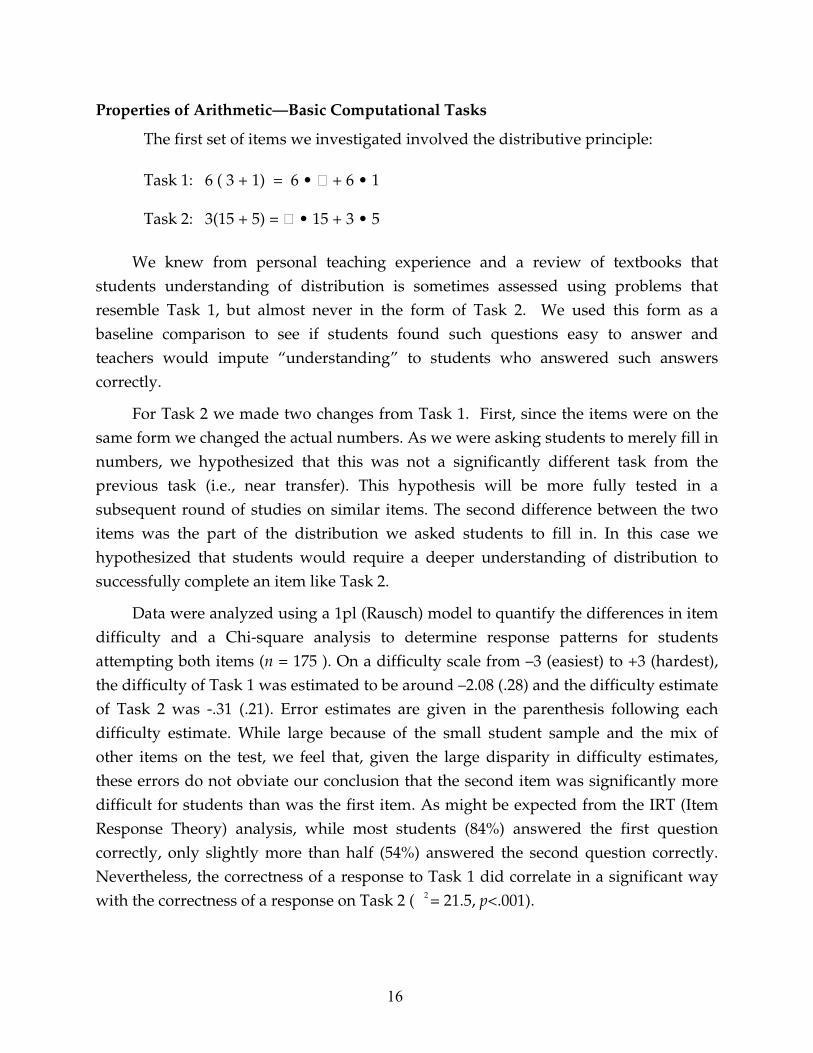
Properties of Arithmetic—Basic Computational Tasks
The first set of items we investigated involved the distributive principle:
Task 1: 6 ( 3 + 1) = 6 • + 6 • 1
Task 2: 3(15 + 5) = • 15 + 3 • 5
We knew from personal teaching experience and a review of textbooks that students understanding of distribution is sometimes assessed using problems that resemble Task 1, but almost never in the form of Task 2. We used this form as a baseline comparison to see if students found such questions easy to answer and teachers would impute “understanding” to students who answered such answers correctly.
For Task 2 we made two changes from Task 1. First, since the items were on the same form we changed the actual numbers. As we were asking students to merely fill in numbers, we hypothesized that this was not a significantly different task from the previous task (i.e., near transfer). This hypothesis will be more fully tested in a subsequent round of studies on similar items. The second difference between the two items was the part of the distribution we asked students to fill in. In this case we hypothesized that students would require a deeper understanding of distribution to successfully complete an item like Task 2.
Data were analyzed using a 1pl (Rausch) model to quantify the differences in item difficulty and a Chi-square analysis to determine response patterns for students attempting both items (n = 175 ). On a difficulty scale from –3 (easiest) to +3 (hardest), the difficulty of Task 1 was estimated to be around –2.08 (.28) and the difficulty estimate of Task 2 was -.31 (.21). Error estimates are given in the parenthesis following each difficulty estimate. While large because of the small student sample and the mix of other items on the test, we feel that, given the large disparity in difficulty estimates, these errors do not obviate our conclusion that the second item was significantly more difficult for students than was the first item. As might be expected from the IRT (Item Response Theory) analysis, while most students (84%) answered the first question correctly, only slightly more than half (54%) answered the second question correctly. Nevertheless, the correctness of a response to Task 1 did correlate in a significant way with the correctness of a response on Task 2 ( 2 = 21.5, p<.001).
17
Given these results, the fact that the cognitive demands of both problems are similar, and that students are apparently less likely to have seen the second type of item, we suspect that the second item might be a better indicator of student understanding than the first. In future piloting we will test the effects of moving the fill-in box to other places in the expanded distribution. This analysis has also prompted us to test problems that ask the distribution question in “reverse” (i.e., as a “factoring” problem”). For example, we have begun piloting items such as: 6 • 3 + 6 • 1 = •( 3 + 1)
This new item not only probes understanding of distribution, but also makes explicit the relationship between distribution, factoring, and the “big idea” that multiplication is repeated addition.
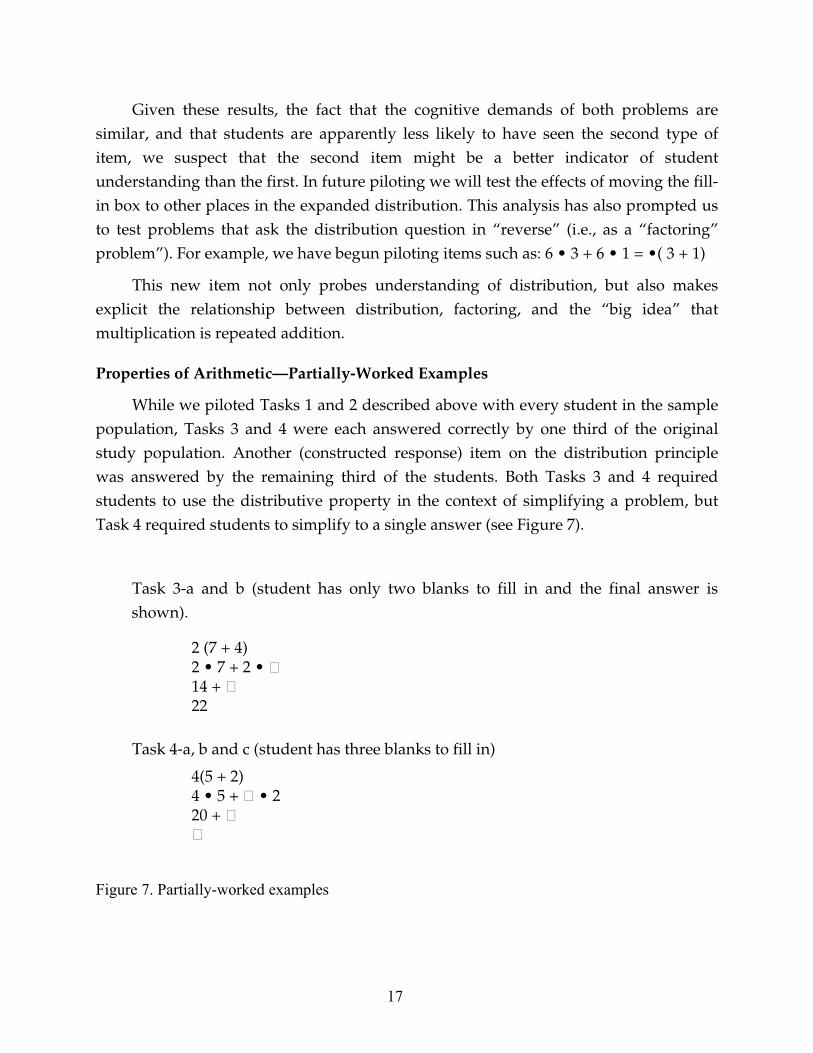
Properties of Arithmetic—Partially-Worked Examples
While we piloted Tasks 1 and 2 described above with every student in the sample population, Tasks 3 and 4 were each answered correctly by one third of the original study population. Another (constructed response) item on the distribution principle was answered by the remaining third of the students. Both Tasks 3 and 4 required students to use the distributive property in the context of simplifying a problem, but Task 4 required students to simplify to a single answer (see Figure 7).
Task 3-a and b (student has only two blanks to fill in and the final answer is shown).
2 (7 + 4) 2 • 7 + 2 • 14 + 22
Task 4-a, b and c (student has three blanks to fill in)
4(5 + 2) 4 • 5 + • 2 20 +
Figure 7. Partially-worked examples

18
We expected Task 3 to be easier for the students for two reasons: First, based on the results from the analysis of Tasks 1 and 2, placing the box after the multiplier seemed to be easier for students. Second, the construction of Task 3 allows students to work both from top to bottom as well as from bottom to top (“backwards”). We were uncertain of our conclusion, however, as we felt that many students could easily simplify the original problem in Task 4 using proper order of operations and multiplication, and then fill in the final answer box directly for themselves.
To perform an IRT analysis on these items, we separated responses for Task 4 into three distinct sub-tasks (the answer to 4 • 5 + • • 2, the answer to 20 + •, and the final answer), labeled a – c respectively (see Table 3). Task 3 was similarly separated into two sub-tasks, labeled a – b respectively (see Table 3).
Not surprisingly, a 1-pl logistic model suggested that, on the same –3 to +3 scale described above, Task 4a was the least difficult (+0.5) of the three sub-tasks in Task 4, followed by 4b (+ 0.85) and 4c (+ 0.98). Error estimates were .39, .42, and .44, respectively. Again, while these estimates were large because of the small student sample and the mix of other items on the test, we feel that, given the relatively large disparity in difficulty estimates, these errors do not obviate our conclusion that the second sub-item was significantly more difficult for students than was the first sub-item, and the third sub-item was the most difficult.
This same trend is borne out in a crosstabs analysis (see Table 8 ). The correlations among the three sub-tasks are significant ( 2 = 59.5, p<.001) indicating that the sub-items are not independent of one another.

19
Table 8
Task 4 Chi-Square Analysis
Incorrect answer 4c Correct answer 4c
Incorrect answer 4a
Incorrect answer to 4b
40 0
Correct answer to 4b
1 2
Correct answer to 4a
Incorrect answer to 4b
7 0
Correct answer to 4b
1 16
χ2 = 59.5, p<.001
This analysis also suggests that students might not actually calculate a final answer to the distribution problem and work “backward”. To test such contextual scaffolding, we administered Task 3 to a second one-third of the population. Difficulty estimates for Tasks 3a and 3b were made using the same 1-pl model used for the previous items. Not surprisingly, we found that, when students knew the final answer, the second answer (3b) was significantly easier (-1.04) for them students to find than a similar answer without such a cue (4b described above). Moreover, finding the first answer (3a) was now more difficult (-0.49) for the students than finding the second answer (3b). This was exactly opposite the results we found for item 4, suggesting that students may have used the supplied answer in item 3 (and not their knowledge of distribution) to arrive at their answer.

20
As indicated in Table 9, although Tasks 3a and 3b are dependent on each other ( 2 = 11.5, p<.001), students incorrectly answering Task 3a are about equally likely to get Task 3b correct as to get it wrong.
Table 9
Task 3 Chi-Square Analysis
Incorrect answer 3b Correct answer 3b
Incorrect answer 3a 12 10
Correct answer 3 a 4 29
χ2 = 11.5, p<.001
More importantly, when we collapse the data in Table 8 to exclude the effect of a correct or incorrect answer to Task 4c, and consider only how students did on Tasks 4a and 4b (see Table 10), we find the correlation between the two sub-tasks are still significant ( 2 = 29.9, p<.001). Moreover, a comparison of Tables 9 and 10 suggests that students are far more likely to get the second sub-task (4b) wrong without the aid of “contextual scaffolding” (70%) than students who took the sub-task (3b) that was followed by contextual scaffolding (29%). As was suggested by IRT analysis, the item with contextual scaffolding was significantly easier for students than was a similar item without this scaffolding.
Table 10
Task 4 Chi-Square Analysis Using Sub-Tasks a and b
Incorrect answer 4b Correct answer 4b
Incorrect answer 4a 40 3
Correct answer 4a 7 17
χ2 = 29.9, p<.001
21
More importantly, the difficulty of the distribution sub-tasks changed significantly when contextual scaffolding was present. As was noted above, when a sub-task was part of a problem in which the final answer was provided, the difficulty of the distribution of Task 4a was significantly easier (-0.49) than a similar sub-task (3a) situated in a problem in which students had to supply the final answer as well (+0.5). As implied by these difficulty parameters, students were far more likely to correctly complete the distribution sub-item when scaffolding was present (60% on 3a) than they were to correctly complete a similar sub-task which was not scaffolded (36% on 4a).
Conclusions Our review of student responses, descriptive data, and IRT results converge on the
fact that different assessments can reveal different information about student understanding, and that overall, students’ responses to even fairly simple items can provide significant and useful information about their understanding. Even given the simplicity of the tasks, results suggest two important conclusions. First, when assessing the distributive principle using worked example or computation items, it is important that we consider which elements of the distribution equation or expression we ask students to supply. Asking for an answer in only one highly-typical format may not allow us to validly infer that students understand a general principle. In fact, we may only be seeing their ability to recall similar instances of such problems. As Carpenter, Fennema and Franke (1999) and many others suggest, when teaching a mathematical concept, it is critically important to expose students to a wide variety of instances and representations of the concept, and assessment strategies should reflect this point. We intend to do this very thing in future pilot studies by changing the elements we request students to supply as well as by flipping the equation (i.e., creating problems that look more like factoring).
The second conclusion is that we must consider the contextual scaffolding we supply in worked example problems. Not surprisingly, we found that the distribution step was much easier for students when we supplied a final answer to the problem than when we did not supply the answer. This suggests that understanding of distribution was not the only trait being measured by both problems, and that we will need to revise some of the items to address this problem.
Finally, in this study we also piloted a number of open-ended items which asked students to explain the distribution principle (e.g., why it “works,” or how does it represent “repeated addition,” etc.). We are currently analyzing these items and their
22
impact on the conclusions reported here. In addition, we are developing other items including word problems based on the results and conclusions outlined above. We have found that well-designed computation and worked example tasks can allow us to make inferences about understanding (or lack thereof) rather than merely informing us whether a student has memorized a procedure. Ultimately, we will be investigating the diagnostic utility and overall validity of these assessments in comparison with other methods for assessing understanding of big ideas, including word problems, graphically represented problems, and open-ended explanations. We will also be testing the impact of embedding all POWERSOURCE assessments in an ongoing manga or comic book style narrative, which will be designed to enhance the motivation and effort put forth by students.

23
References
Ausubel, D. P. (1960). The use of advance organizers in the learning and retention of meaningful verbal material. Journal of Education Psychology, 51, 267-272.
Baker, E. L. (2006). Moving to the next generation system design: Integrating cognition, assessment and learning. Paper presented at the annual meeting of the American Educational Research Association, San Francisco.
Baker, E. L. (1997). Model-based performance assessment. Theory into Practice, 36(4), 247-254.
Baker, E. L., Freeman, M., & Clayton, S. (1991). Cognitive assessment of history for large-scale testing. In M. C. Wittrock & E. L. Baker (Eds.), Testing and cognition (pp. 131-153). Englewood Cliffs, NJ: Prentice-Hall.
Ball, D. L., & Bass, H. (2001). What mathematical knowledge is entailed in teaching children to reason mathematically? In National Research Council, Knowing and learning mathematics for teaching: Proceedings of a workshop (pp. 26-34). Washington, DC: National Academy Press. Available: http://books.nap.edu/catalog/10050.html.
Bassok, M., & Holyoak, K. J. (1989a). Interdomain transfer between isomorphic topics in algebra and physics. Journal of Experimental Psychology: Memory, Learning, and Cognition, 15(1), 153-166.
Bassok, M., & Holyoak, K. J. (1989b). Transfer of domain-specific problem solving procedures. Journal of Experimental Psychology: Learning, Memory, and Cognition, 16, 522-533.
Bereiter, C., & Scardamalia, M. (1986). Educational relevance of the study of expertise. Interchange, 17(2), 10-19.
Bransford, J. D., Brown, A. L., & Cocking, R. R. (1999). How people learn: Brain, mind, experience, and school. Washington, DC: National Academy Press.
Carpenter, T. P., Fennema, E., & Franke, M. L. (1996). Cognitively guided instruction: A knowledge base for reform in primary mathematics instruction. The Elementary School Journal, 97(1), 3-20.
Carpenter, T.P., Fennema, E., & Franke, M.L. (1999). Cognitively guided instruction: A knowledge

24
base for reform in primary mathematics instruction. The Elementary School
Journal 97 (1): 3-20.
Carpenter, T., & Franke, M. (2001). Developing algebraic reasoning in the elementary school. In H. Chick, K. Stacey, J. Vincent, & J. Vincent (Eds.), Proceedings of the 12th ICMI Study Conference (Vol. 1, pp. 155-162). Melbourne, Australia: The University of Melbourne.
Chi, M. T. H., & Ceci, S.J. (1987). Content knowledge: Its role, representation, and restructuring in memory development. Advances in Child Development and Behavior, 20, 91-143.
Chi, M. T. H., deLeeuw, N., Chiu, M., & LaVancher, C. (1994). Eliciting self-explanations improves understanding. Cognitive Science, 18, 439-477.
Chi, M. T. H., Feltovich, P., & Glaser, R. (1981). Categorization and representation of physics problems by experts and novices. Cognitive Science, 5, 121-152.
Chi, M. T. H., Glaser, R., & Rees, E. (1982). Expertise in problem solving. In R. Sternberg (Ed.), Advances in the psychology of human intelligence (Vol. 1, pp. 7-75). Hillsdale, NJ: Lawrence Erlbaum Associates.
Collis, K., & Romberg, T. A. (1991). Assessment of mathematical performance: An analysis of open-ended test items. In M. C. Wittrock & E. L. Baker (Eds.), Testing and cognition (pp. 82-130). Englewood Cliffs, NJ: Prentice Hall.
diSessa, A. & Minstrell, J. (1998). Cultivating conceptual change with benchmark lessons. In J. G. Greeno & S. Goldman (Eds.), Thinking practices in learning and teaching science and mathematics (pp. 155-187). Mahwah, NJ: Erlbaum.
Ericsson, K. A. (2002). Attaining excellence through deliberate practice: Insights from the study of expert performance. In M. Ferrari (Ed.), The pursuit of excellence in education (pp. 21-55). Hillsdale, NJ: Erlbaum.
Ericsson, K. A. (2003). The search for general abilities and basic capacities: Theoretical implications from the modifiability and complexity of mechanisms mediating expert performance. In R. J. Sternberg & E. L. Grigorenko (Eds.), Perspectives on the psychology of abilities, competencies, and expertise (pp. 93-125). Cambridge: Cambridge University Press.
25
Glaser, R., & Chi, M.T.H. (1988). Overview. In M. T. H. Chi, R. Glaser, & M. J. Farr (Eds.), The nature of expertise (pp. xv-xxxvi). Hillsdale, NJ: Lawrence Erlbaum Associates, Publishers.
Hiebert, J., & Carpenter, T. P. (1992). Learning and teaching with understanding. In D. A. Grouws (Ed.), Handbook of research on mathematics teaching and learning (pp. 65-97). New York: Macmillan.
Lane, S. (1993). The conceptual framework for the development of a mathematics performance assessment instrument. Educational Measurement: Issues and Practice, 12(2), 16-23.
Larkin, J. H. (1983). The role of problem representation in physics. In D. Gentner & A. L. Stevens (Eds.), Mental models. Hillsdale, NJ: Erlbaum.
Larkin, J. H., McDermott, J., Simon, D. P., & Simon, H. A. (1980). Models of competence in colving physics problems. Cognitive Science, 4, 317-345.
National Research Council. (2002). Learning and understanding. Improving advanced study of mathematics and science in U.S. high schools. Committee on Programs for Advanced study of Mathematics and Science in American High Schools. J. P. Gollub, M. W. Bertenthal, J. B. Labov, & P. C. Curtis (Eds.). Center for Education, Division of Behavioral and Social Sciences and Education. Washington, DC: National Academy Press.
Newell, A. (1990). Unified theories of cognition. Cambridge, MA: Harvard University Press.
Niemi, D. (1996). Assessing conceptual understanding in mathematics: Representation, problem solutions, justifications, and explanations. Journal of Educational Research, 89, 351-363.
Niemi, D., Baker, E. L., & Sylvester, R. (in press). Los Angeles Unified School District assessment specification and validity studies (CSE Tech. Rep.). Los Angeles: University of California, National Center for Research on Evaluation, Standards, and Student Testing (CRESST).
Porter, A. C. (1989). A curriculum out of balance: The case of elementary school mathematics. Educational Researcher, 18, 9-15.
Porter, A. C., Kirst, M. W., Osthoff, E. J., Smithson, J. S., & Schneider, S. A. (1993). Reform up close: An analysis of high school mathematics and science classrooms. (Final report

26
to the National Science Foundation on Grant No. SPA-8953446 to the Consortium for Policy Research in Education.) Madison: University of Wisconsin-Madison, Wisconsin Center for Education Research.
Renkl, A. (2002). Worked-out examples: instructional explanations support learning by self-explanations. Learning and Instruction, 12, 529-556.
Renkl, A., Atkinson, R.K. & Maier, U.H. (2000) From studying examples to solving problems: Fading worked-out solution steps helps learning. Proceedings of the 22nd Annual Conference of the Cognitive Science Society, 393-398. Mahwah, NJ: Erlbaum.
Schmidt, W. H., McKnight, C. C., & Raizen, S. A. (1997). A splintered vision: An investigation of U.S. science and mathematics education. Boston: Kluwer Academic Publishers.
Silver, E. A. (1981). Recall of mathematical problem information: Solving related problems. Journal for Research in Mathematics Education, 12, 54-64.
Sweller, J. (1989). Cognitive technology: Some procedures for facilitating learning and problem solving in mathematics and science. Journal of Educational Psychology, 81, 457-466.
Sweller, J., van Merrienboer, J. J. G., & Paas, F. G. W. C. (1998). Cognitive architecture and instructional design. Educational Psychology Review, 10, 251-296.
VanLehn, K. (1996). Cognitive skill acquisition. Annual review of Psychology, 47, 513-539.
Wineburg, S. (1996). The psychology of learning and teaching history. In D. C. Berliner & R. C. Calfee (Eds.), Handbook of educational psychology (pp. 423-437). New York: Simon and Schuster MacMillan.