the power of one - gmi analystcorpdocs.gmianalyst.com/annual/ar_2014_13598.pdf · 2014 annual...
TRANSCRIPT

Investing for the FutureThe Power of One
Hubbell Incorporated 2014 Annual Report
Hubbell Incorporated 2014 Annual Report
Hu
bb
ell Inco
rpo
rated 2014 A
nn
ual R
epo
rt

Our vision for the Hubbell of the future remains unaltered, and our accomplishments over the last year have shown that our business model is working. Continuing with our strategy of a healthy balance among organic growth, new product introductions, and acquisitions has enabled us to further penetrate new market segments. Our seven acquisitions in 2014 — four in the Power segment and three in the Electrical segment — contributed to a sales increase of 6% at an investment of $180 million.
The Financial Highlights on the next page illustrate a solid performance for the year, including increases in net sales and earnings per diluted share. In addition, in October, our Board of Directors authorized the repurchase of up to $300 million of the Company’s Class A and Class B common stock, and declared a dividend increase of 12%, marking the seventh consecutive year of increases.
We faced several challenges in 2014, and I was pleased with our leadership’s adept response. Our Electrical segment faced higher costs, particularly related to certain warranty and inventory expenses in our lighting business. Our leadership team faced these challenges head on, and the measures we have since put into place have already resulted in improvements in performance. They will also enable us to better anticipate change and react more quickly in the future.
With earnings of more than $300 million and an operating margin of better than 15%, we were able to adjust quickly as an organization and finish the year stronger. I am confident that we remain on the right path and that both our successes and our challenges make us even better prepared for the journey ahead.
The Power of OneAs we enter into the second half of the decade, Hubbell is an enterprise energized by the opportunities of the present and the promise of tomorrow. Nowhere is this captured more succinctly and powerfully than in our One Hubbell strategy, which enters its fourth year in 2015. We are realizing the many benefits that emerge when teamwork, collaboration and communication become part of daily life. Synergies across the enterprise are opening doors to deeper customer relationships, optimizing our resources for greater productivity and efficiency, and helping to build rewarding careers for our employees. Under the theme of “The Power of One: Investing for the Future,” the editorial section that follows describes how One Hubbell thinking is transforming the Company. Working together as One Hubbell offers yet another benefit: It enhances our ability to successfully pursue our four strategic objectives.
Serving Our CustomersWe serve our shareholders best by serving our customers best. Indeed, if there is a single Hubbell trait that goes back to the very beginning of the Company, it is our uncompromising commitment to our customers — not only by responding to their needs but also by providing them with business-building solutions and finding new ways to work together. Our One Hubbell focus has redefined and extended customer relationships at all levels throughout the enterprise, creating new and exciting opportunities for growth and customer satisfaction.
Hubbell continued to make progress toward its long-term strategic objectives in 2014 as the Company enhanced its position in key markets, strengthened its capabilities as a world-class competitor and maintained a sound financial footing.
To Our Shareholders
On the cover, clockwise from top, examples of recent investments for future growth in new products and new markets:
1) The 2014 acquisition of RFL Electronics has enabled our expanded presence in the growing substation automation market with products such as a substation- hardened IP Access multiplexer; 2) NutriLED™ solid state LED fixtures provide energy saving benefits for virtually any indoor horticultural application; 3) Quazite®
underground enclosures are used by utilities, telecommunications and transportation customers who depend on safe, durable and cost effective housings for equipment on their systems; 4) The BURNDY® In-Line Disconnect switch utilizes proven WEJTAP™ technology and is designed for ease of installation resulting in best in class performance for distribution switching applications; 5) Transition® Enclosed (TRE) architectural direct/indirect ceiling fixtures provide full distribution of light for comfortable, effective lighting; antimicrobial® paint option resists bacterial growth on exposed painted surfaces — ideal for healthcare, dining, dormitories or public spaces; 6) Premise Wiring copper and fiber optic connectivity solutions are widely used in mission critical institutional and enterprise networks and in data centers.
Annual MeetingThe next annual meeting of the shareholders of Hubbell Incorporated will be held at 9:00 a.m., local time, Tuesday, May 5, 2015, at the principal executive offices of the Company, 40 Waterview Drive, Shelton, Connecticut 06484. A formal notice of the meeting and proxy materials will be available to each shareholder on the following website, www.proxyvote.com, and will be mailed to any shareholder who requests a printed copy.
Shareholder ServicesAs a Hubbell shareholder, you are invited to take advantage of our convenient shareholder services or request more information about Hubbell Incorporated.
Computershare, our transfer agent, maintains the records for our registered shareholders and can help you with a variety of shareholder-related services at no charge, including:
• Change of name or address• Consolidation of accounts• Requests for duplicate mailings• Dividend reinvestment enrollment• Replacement of lost stock certificates• Transfer of stock to another person• Additional administrative services
Access your investor statements online 24 hours a day, seven days a week. Enrollment is quick and easy.
For more information, go to www.computershare.com/investor.
Market ListingThe New York Stock Exchange New York, NY 10005
Registrar and Transfer AgentComputershare 250 Royall Street Canton, MA 02021 800-874-1136 www.computershare.com/investor
Dividend Reinvestment PlanA Dividend Reinvestment Plan is available to shareholders of Hubbell Incorporated.
For details, contact: Corporate Secretary Hubbell Incorporated 40 Waterview Drive Shelton, CT 06484
Internet Addresswww.hubbell.com
Corporate Information
Des
ign
by A
ddis
on
ww
w.a
ddis
on.c
om

Operating with DisciplineDeveloping and implementing common practice standards across our many functions and locations enables Hubbell to leverage collective capabilities in a highly efficient manner. Two examples where the Company has made great strides in recent years are sourcing and logistics. Improvements in these two areas have been the cornerstone of our productivity initiatives over the past several years. Now the same discipline is being extended into additional areas, two being manufacturing and finance. With regard to the former, we are pursuing opportunities to improve the utilization of our manufacturing assets; as to the latter, we are planning to optimize work streams in our global finance organization to achieve greater consistency, efficiency and scalability.
Growing the EnterpriseAcquisition and innovation drive top line growth. In 2014, we continued our strategy of expanding through carefully targeted acquisitions, closing seven transactions and bringing the total over the past decade to 34 companies, representing nearly $1 billion in revenue. We have become skilled not only at identifying attractive acquisition targets, but also at quickly integrating them into our culture. The pace of product innovation continues to gain momentum, but rather than being satisfied, we intend to become ever-better innovators. We expect our enterprise-wide new product development process to help us more rapidly convert our expertise and ideas into high-value new products.
Developing Our PeopleHubbell is many people working in diverse industries and differing geographies, and One Hubbell is the catalyst that brings them together. The Leadership Forum and the Executive Summit — cited in the following pages — draw talented people from all over the Company. Today, there are more career advancement opportunities for people to move across Hubbell businesses. In addition, an internship program is creating new opportunities for recruiting the next generation of Hubbell employees. The program, in 2014, exposed a diverse group of more than 100 bright, young people to the Company and to their chosen career paths.
ConclusionCompleting my second year as Chief Executive Officer, I am privileged to be leading Hubbell through a dynamic period in its long history. The synergies created by acting as One Hubbell provide us greater visibility in the markets we serve and allow us to leverage our scale as never before. And our solid foundation — 126 years in the making — is the platform we are building on to realize our clearly defined vision. I am grateful for the hard work and commitment of the leadership team and to Hubbell employees everywhere who make this Company what it is. Looking at the year ahead, there are sure to be economic crosscurrents impacting our organization. Whatever unfolds, however, we believe the Company is very well positioned for the long term and prepared to adapt as warranted to short-term conditions. We will remain vigilant and continue to focus our efforts on rewarding our shareholders, serving our customers, operating with discipline and developing our people in the years ahead.
David G. Nord Chairman, President and Chief Executive Officer
» Revenue increase of 6% in 2014, with acquisitions contributing 4% while organic volume increased 2%
» Operating Margin of 15.4% was solid, although performance was dampened by the adverse impact of higher costs and product mix issues in the Electrical segment
» Dividends increased for the seventh consecutive year
» Free Cash Flow exceeded Net Income
(Dollars in millions, except per share amounts)
Year Ended December 31, 2014 2013 2012 2011 2010
Net Sales $3,359 $3,184 $3,044 $2,872 $2,541
Operating Profit Margin 15.4% 15.9% 15.5% 14.8% 14.5%
Net Income* $325 $327 $300 $268 $217
Earnings per Share — Diluted $5.48 $5.47 $5.00 $4.42 $3.59
Dividends per Share $2.06 $1.85 $1.68 $1.52 $1.44
*Attributable to Hubbell.
Financial Highlights Key Financial Highlights Include:
To watch videos of Hubbell’s management team discussing the Company, scan the QR code or visit www.hubbell.com/ar2014.
David G. Nord Chairman, President and CEO
2014 ANNUAL REPORT • 1

Left: Cable and hose management systems from Gleason Reel save time and money for drillers extracting oil and gas at hydraulic fracturing sites.
Right: Plants grow under optimal conditions while requiring less energy when growers use NutriLED™ Series horticulture lights.
™
2 • HUBBELL INCORPORATED

One Hubbell: Wearing the Company (Hard) Hat Opens an OpportunityKillark, a key brand within Hubbell Electrical Systems, is a well-established leader in the global market for electrical products designed for harsh and hazardous environments. Visiting a steel mill where Killark LED fixtures were in use, a Killark representative spotted an overhead crane and wondered why it wasn’t equipped with lighting fixtures from Hubbell. The fixtures would have to run on the DC power used by cranes and be tough enough to withstand a crane’s vibrations. A collaboration with Hubbell Industrial Lighting led to the development of HBL Series LED Highbay fixtures, which met all of the requirements. Today, that same crane is using Hubbell lighting fixtures thanks to One Hubbell thinking.
More brands, more products, more solutions for managing, moving, conserving and using electrical energy: Today’s Hubbell is picking up the pace of new product introductions and working to get promising concepts to market more rapidly.
New Products, New Markets Drive the Top Line
One example: Hubbell Lighting (HLI) has introduced the NutriLED™ Series, its entry into a new and rapidly growing global market for horticulture lighting. NutriLED fixtures provide fine-tuned light to optimize growth and yield rates while reducing energy consumption and maintenance costs. Entry into another new market — aerospace, principally lighting systems for commercial and military aircraft — was gained through HLI’s 2013 acquisition of Norlux.
Hubbell Power Systems (HPS) has formed a new business unit, Utility Automation, built around a growing line of programmable products for “smart” monitoring, communication and control of electrical distribution systems. While internally developed products have been growing the business organically, HPS complemented these efforts with the 2014 acquisition of RFL Electronics, a leading provider of communication and protection systems for electric utility substation automation and smart grid development. In a similar pattern, HPS has been growing a new business serving the telecommunications industry and counts among its customers the largest network providers in the U.S. Two additional 2014 acquisitions broadened HPS’ internal capabilities. Opti-Loop® is a well-recognized provider of fiber and cable storage and protection equipment. PenCell is a market leader in above- and below-ground plastic enclosures for the communications market, as well as for utility, commercial and industrial applications.
Hubbell Electrical Systems (HES) has developed a significant opportunity resulting from the U.S. energy renaissance. Gleason Reel is providing cable and hose management systems to companies
using advanced drilling technologies to open up previously inaccessible oil and gas resources in the Bakken Shale and similar formations. These systems allow rigs to be moved around a drilling site without takedown and setup, saving substantial time and money. Gleason Reel is not the only Hubbell brand in widespread use at hydraulic fracturing sites. Other Hubbell products found at shale basins around the country include GAI-Tronics® heavy duty industrial communications equipment, Hawke International cable glands, Killark lighting fixtures, and power resistors from the 2013 acquisition of Powerohm Resistors.
Underscoring the strategic importance of new product development, engineers from across the organization created a common process for new product development during 2014. This process improves a wide range of design activities — from idea generation to project creation all the way to design, production and launch. The new process adopted best practices from across Hubbell. The One Hubbell New Product Development Process will be rolled out to all Hubbell locations during the first half of 2015.
Among the many benefits is a more unified approach to new product development that will enable faster, more innovative product development at a lower cost. It will also enable improved project selection (risk management), better project status visibility and reporting, more collaboration and capability sharing across our businesses and locations, and enhanced engineering mobility and career development.
2014 ANNUAL REPORT • 3

To achieve its goals, Hubbell will need a skilled, diverse workforce and a strong one-company culture. Several initiatives focus on future generations of leaders, developing management depth and cementing a foundation on which to build the One Hubbell of tomorrow.
The Executive Summit brings together top leaders from across the enterprise to build a sense of unity and expose participants to Hubbell businesses beyond their own. Participants come away with connections that reach across the Company and, more importantly, an enhanced ability to solve problems that cross multiple business lines. This meeting — with resulting strengthened relationships — has been the catalyst for a number of cross-platform and cross-functional projects, including WATCH (see article below).
Another key initiative is the Leadership Forum. Launched in 2006, this program taps a small group of high potential employees each year to provide them with broader exposure and pave the way for their taking on expanded roles within the organization. In fact, 45% of Leadership Forum participants have been promoted at least once. As a key element of the program, participants are asked to work together to tackle projects of importance to the Company. A recent project to come out of the Forum was devoted to supply chain capabilities and inventory management. The result was a training and certification program that’s now required of all Hubbell
materials professionals in North America. The goal: Reducing inventory by five days while improving customer service.
Hubbell continues to educate and certify leaders in Lean methodologies and now has more than 60 individuals who have completed the rigorous eight-month training program. These leaders are equipped to lead Lean implementations throughout the Company, including newly acquired businesses.
While Hubbell is providing new opportunities for employees to advance their careers, employees are taking the initiative to provide our Company with new, more streamlined processes — driving continuous improvements across the enterprise. A leaner, more productive supply chain is just one example of what has become a way of life at Hubbell: Continuous improvement across every function. Now, common practice standards that efficiently leverage collective capabilities are becoming the norm. One example is a current initiative that seeks to optimize various work streams in Hubbell’s global finance organization to achieve greater consistency, efficiency and scalability. In addition, a high priority is manufacturing cost structure improvements. While continuous progress has been made at the business unit level, looking across Hubbell’s worldwide manufacturing sites from an enterprise perspective opens opportunities to accelerate the rate of improvement, identify previously unforeseen options and utilize assets more efficiently.
A decade or more ago, Hubbell was a company characterized by a dedication to quality products, a strong customer focus and a career-oriented workforce. While today’s Hubbell retains these important attributes, it is also a more dynamic enterprise shaped by collaborative problem-solving, greater visibility in global markets and a long-term agenda of growth with profitability.
Building a World-Class Competitor
One Hubbell: The Time Is Right for WATCHWATCH, or Women Advancing Their Careers at Hubbell, had a promising first year in 2014, highlighted by a two-day meeting of women from across the Company that was also attended by Hubbell’s senior leadership team. Attendance by women from across business platforms and a range of functions brought diverse points of view to the meeting. This led to WATCH defining goals that seek to help women not only advance their careers and develop new skills, but also to realize personal fulfillment and reward. Toward this goal, WATCH has established two workgroups for its 2015 agenda — Communication and Personal & Professional Development — that will provide guidance on networking skills, identify mentors and support other areas for personal and professional growth.
4 • HUBBELL INCORPORATED

Top: Women Advancing Their Careers at Hubbell (WATCH) was created in 2014 to help women develop their careers and realize personal fulfillment.
Bottom: The Leadership Forum helps prepare high potential employees from across the Company for expanded roles in the future.
2014 ANNUAL REPORT • 5

Top left: Hubbell Power Systems, Inc., provides custom transmission solutions for high voltage applications.
Top right: Customers can tour a virtual 3-D hospital to see where and how Hubbell products are used — and click to link to product details.
Bottom: The Lighting Solutions Center is being redesigned to leverage the Company’s leadership in advanced lighting technologies.
6 • HUBBELL INCORPORATED

When one of the largest electric utilities in the U.S. developed a concept for a high capacity transmission line, it turned to Hubbell to provide key components. The result is a multi-year agreement made possible in large part because three Hubbell brands — Anderson, BURNDY and Ohio Brass — came together to meet the customer’s needs. In another instance, Hubbell revitalized a highly valued relationship with a nationwide electrical distributor doing business with all three Hubbell platforms. Among other outcomes, Hubbell was able to generate incremental revenue opportunities by spotlighting brands the customer had not previously viewed as strategic.
Providing customers with access to product information — what they want, when, where and how they want it — is a strategic initiative for the Company. Hubbell continues to engage with customers in traditional ways, but more and more it is turning to digital communications to satisfy customers’ expectations for information on demand.
One example is virtual tours, or e-tours, currently offered by Hubbell Power Systems and Hubbell Wiring Device-Kellems. The latter offers e-tours of a university campus, a hospital, an industrial plant and a food processing facility. Customers can log on to
the Wiring Device-Kellems website to take an in-depth e-tour of their facility type to see where and how Hubbell’s wiring devices are deployed, and they can click all the way through to catalog pages that contain ordering information. The e-tours are part of a broader One Hubbell effort to focus on key vertical markets and demonstrate how Hubbell’s cross-company capabilities respond to customer needs in each market. Taking a Wiring Device-Kellems virtual tour, one can also access information about Hubbell Lighting and Hubbell Power Systems products. This virtual tour is a prelude to a new generation of e-tours in which customers will be able to click on various buildings found in an entire city and find products from across the Company in one place.
Hubbell Lighting (HLI) also has powerful digital tools for designers and architects. A key customer relationship asset is the Lighting Solutions Center, which was built in 2007 at HLI’s headquarters in Greenville, South Carolina. Since then, approximately 4,000 contractors, designers, engineers and other professionals have come through the Center annually. Today, the Center is on the verge of a major redesign that will focus on HLI’s extensive LED product line, solutions for specific vertical markets, and capabilities in leading-edge lighting technology.
Redefining customer relationships – even when they go back many decades – opens new possibilities for growth and renewal.
Growing Relationships to Grow the Company
One Hubbell: Making It Easy for Customers to Specify HubbellHubbell India is a One Hubbell solution provider that has become a key strategic resource for the entire Company. Just one example is building information models (BIMs), which serve as the templates for customers’ engineers and designers who are incorporating Hubbell components into their products. Previously, Hubbell outsourced BIMs. Creating them internally with the team in India cut the cost per BIM by 80% and reduced development time from one week to as little as two days. More important are the benefits for Hubbell customers: Having this detailed, reliable level of data and design available at the point of specification gives customers the ability to ensure full form, fit, function and, ultimately, quality of their product.
2014 ANNUAL REPORT • 7

Carlos M. Cardoso Retired Chairman, President and Chief Executive Officer of Kennametal, Inc.
(Industrial tooling)
Member of the Compensation and
Audit Committees
Lynn J. Good President and Chief Executive Officer of Duke Energy Corporation
(Electric power transmission and distribution)
Member of the Audit, Executive, and
Nominating/Corporate Governance Committees
Anthony J. Guzzi President and Chief Executive Officer of EMCOR Group, Inc.
(Mechanical, electrical construction and facilities services)
Member of the Audit, Executive, and
Nominating/Corporate Governance Committees
Neal J. Keating Chairman, President and Chief Executive Officer of Kaman Corporation
(Aerospace and industrial distribution)
Member of the Audit and Nominating/Corporate
Governance Committees
John F. Malloy Chairman, President and Chief Executive Officer of Victaulic
(Mechanical pipe joining systems)
Member of the Audit and Finance Committees
Andrew McNally IV Retired Chairman and Chief Executive Officer of Rand McNally & Company
(Printing, publishing and mapmaking); a partner of McNally Investments
(Merchant banking)
Member of the Compensation, Executive, and
Finance Committees
David G. Nord Chairman of the Board, President and Chief Executive Officer of the Company Member of the Executive Committee
G. Jackson Ratcliffe Retired Chairman of the Board, President and Chief Executive Officer
of the Company
Member of the Executive and
Finance Committees
Carlos A. Rodriguez President and Chief Executive Officer of Automatic Data Processing, Inc.
(Payroll and tax processing, and business services)
Member of the Compensation and
Finance Committees
John G. Russell President and Chief Executive Officer of CMS Energy Corporation and
Consumer Energy Company (Electric and natural gas utility)
Member of the Compensation and Nominating/
Corporate Governance Committees
Steven R. Shawley Retired Senior Vice President and Chief Financial Officer of Ingersoll Rand PLC
(Climate and residential solutions, industrial and security technologies)
Member of the Audit and Finance Committees
Richard J. Swift Former Chairman of the Financial Accounting Standards Advisory Council and
retired Chairman, President and Chief Executive Officer of Foster Wheeler Ltd.
(Design, engineering, construction and other services)
Member of the Compensation, Executive, and
Nominating/Corporate Governance Committees
Board of Directors
Gary N. Amato Executive Vice President, Hubbell Electrical Segment
Gerben W. Bakker Group Vice President, Power Systems
James H. Biggart, Jr. Vice President, Treasurer
James K. Braun Vice President, Planning and Development
Joseph A. Capozzoli Vice President, Controller
James M. Farrell Vice President, Strategic Planning and Investor Relations
An-Ping Hsieh Vice President, General Counsel
Stephen M. Mais Vice President, Human Resources
John F. Mulvihill Assistant Secretary and
Assistant General Counsel
W. Robert Murphy Executive Vice President, Marketing and Sales
David G. Nord Chairman of the Board, President and
Chief Executive Officer
Louis G. Pizzoli Vice President, Operations
Megan C. Preneta Corporate Secretary and
Assistant General Counsel
William R. Sperry Senior Vice President and
Chief Financial Officer
Charles M. Tencza Vice President, Information Technology
William T. Tolley Senior Vice President, Growth and Innovation
James H. Van Hoof, Jr. Vice President, Tax
Officers
8 • HUBBELL INCORPORATED

UNITED STATES SECURITIES AND EXCHANGE COMMISSION
Washington, DC 20549
FORM 10-KANNUAL REPORT PURSUANT TO SECTION 13 OR 15(d) OF THE SECURITIES EXCHANGE ACT OF 1934
FOR THE FISCAL YEAR ENDED DECEMBER 31, 2014
TRANSITION REPORT PURSUANT TO SECTION 13 OR 15(d) OF THE SECURITIES EXCHANGE ACT OF 1934Commission File Number 1-2958
HUBBELL INCORPORATED(Exact name of registrant as specified in its charter)
STATE OF CONNECTICUT 06-0397030(State or other jurisdiction of incorporation or organization) (I.R.S. Employer Identification No.)
40 Waterview Drive, Shelton, CT 06484(Address of principal executive offices) (Zip Code)
(475) 882-4000(Registrant's telephone number, including area code)
SECURITIES REGISTERED PURSUANT TO SECTION 12(b) OF THE ACT:Title of each Class Name of Exchange on which Registered
Class A Common — $.01 par value (20 votes per share) New York Stock ExchangeClass B Common — $.01 par value (1 vote per share) New York Stock Exchange
Series A Junior Participating Preferred Stock Purchase Rights New York Stock ExchangeSeries B Junior Participating Preferred Stock Purchase Rights New York Stock Exchange
SECURITIES REGISTERED PURSUANT TO SECTION 12(g) OF THE ACT:NONE
Indicate by check mark Yes No
• if the registrant is a well-known seasoned issuer, as defined in Rule 405 of the Securities Act.
• if the registrant is not required to file reports pursuant to Section 13 or 15(d) of the Securities Exchange Act of 1934.
• if the registrant (1) has filed all reports required to be filed by Section 13 or 15(d) of the Securities Exchange Act of 1934 during the preceding 12 months (or for such shorter period that the registrant was required to file such report), and (2) has been subject to such filing requirements for the past 90 days.
• whether the registrant has submitted electronically and posted on its corporate Web site, if any, every Interactive Data File required to be submitted and posted pursuant to Rule 405 of Regulation S-T (§232.405 of this chapter) during the preceding 12 months (or for such shorter period that the registrant was required to submit and post such files).
• if disclosure of delinquent filers pursuant to Item 405 of Regulation S-K is not contained herein, and will not be contained, to the best of registrant’s knowledge, in definitive proxy or information statements incorporated by reference in Part III of this Form 10-K or any amendment to this Form 10-K.
• whether the registrant is a large accelerated filer, an accelerated filer, a non-accelerated filer or a smaller reporting company. See the definitions of “large accelerated filer,” “accelerated filer” and “smaller reporting company” in Rule 12b-2 of the Exchange Act. (Check one):
Large accelerated filer Accelerated filer Non-accelerated filer
(Do not check if a smaller reporting company)Smaller reporting
company • whether the registrant is a shell company (as defined in Rule 12b-2 of the Exchange Act).
The approximate aggregate market value of the voting stock held by non-affiliates of the registrant as of June 30, 2014 was $$7,152,795,896*. The number of shares outstanding of the Class A Common Stock and Class B Common Stock as of February 11, 2015 was 7,167,506 and 51,339,048 respectively.
DOCUMENTS INCORPORATED BY REFERENCEPortions of the definitive proxy statement for the annual meeting of shareholders scheduled to be held on May 5, 2015, to be filed with the Securities and Exchange Commission (the “SEC”), are incorporated by reference in answer to Part III of this Form 10-K.*Calculated by excluding all shares held by Executive Officers and Directors of registrant and the Louie E. Roche Trust, the Harvey Hubbell Trust, the Harvey Hubbell Foundation and the registrant’s pension plans, without conceding that all such persons or entities are “affiliates” of registrant for purpose of the Federal Securities Laws.
50323_10K.indd 1 2/27/15 11:56 AM
Job Name: 50323PDF Page: 50323_10K 1.p1.pdf
Process Plan: Doc6060_FileDate: 15-03-13Time: 17:08:42
Operator: ____________________________
PageMark-Color-Comp
❏ OK to proceed❏ Make corrections and proceed❏ Make corrections and show another proof
Signed: ___________________ Date: ______

2 HUBBELL INCORPORATED - Form 10-K
Table of contents
PART I 3
ITEM 1 Business . . . . . . . . . . . . . . . . . . . . . . . . . . . . . . . . . . . . . . . . . . . . . . . . . . . . . . . . . . . . . . . . . . . 3ITEM 1A Risk Factors . . . . . . . . . . . . . . . . . . . . . . . . . . . . . . . . . . . . . . . . . . . . . . . . . . . . . . . . . . . . . . . . . 8ITEM 1B Unresolved Staff Comments . . . . . . . . . . . . . . . . . . . . . . . . . . . . . . . . . . . . . . . . . . . . . . . . . . . . 11ITEM 2 Properties . . . . . . . . . . . . . . . . . . . . . . . . . . . . . . . . . . . . . . . . . . . . . . . . . . . . . . . . . . . . . . . . . . 12ITEM 3 Legal Proceedings . . . . . . . . . . . . . . . . . . . . . . . . . . . . . . . . . . . . . . . . . . . . . . . . . . . . . . . . . . . . 12ITEM 4 Mine Safety Disclosures . . . . . . . . . . . . . . . . . . . . . . . . . . . . . . . . . . . . . . . . . . . . . . . . . . . . . . . 12
PART II 13
ITEM 5 Market for the Registrant’s Common Equity, Related Stockholder Matters and Issuer Purchases of Equity Securities . . . . . . . . . . . . . . . . . . . . . . . . . . . . . . . . . . . . . . . . . . . . . . . . . . 13
ITEM 6 Selected Financial Data . . . . . . . . . . . . . . . . . . . . . . . . . . . . . . . . . . . . . . . . . . . . . . . . . . . . . . . . 15ITEM 7 Management’s Discussion and Analysis of Financial Condition and Results of Operations . . . . 15ITEM 7A Quantitative and Qualitative Disclosures about Market Risk . . . . . . . . . . . . . . . . . . . . . . . . . . . . 27ITEM 8 Financial Statements and Supplementary Data . . . . . . . . . . . . . . . . . . . . . . . . . . . . . . . . . . . . . . 29ITEM 9 Changes in and Disagreements with Accountants on Accounting and Financial Disclosure . . . . 67ITEM 9A Controls and Procedures . . . . . . . . . . . . . . . . . . . . . . . . . . . . . . . . . . . . . . . . . . . . . . . . . . . . . . . 67ITEM 9B Other Information . . . . . . . . . . . . . . . . . . . . . . . . . . . . . . . . . . . . . . . . . . . . . . . . . . . . . . . . . . . . . 67
PART III 68
ITEM 10 Directors, Executive Officers and Corporate Governance . . . . . . . . . . . . . . . . . . . . . . . . . . . . . . 68ITEM 11 Executive Compensation . . . . . . . . . . . . . . . . . . . . . . . . . . . . . . . . . . . . . . . . . . . . . . . . . . . . . . . 68ITEM 12 Security Ownership of Certain Beneficial Owners and Management and Related Stockholder
Matters . . . . . . . . . . . . . . . . . . . . . . . . . . . . . . . . . . . . . . . . . . . . . . . . . . . . . . . . . . . . . . . . . . . . .68
ITEM 13 Certain Relationships and Related Transactions and Director Independence . . . . . . . . . . . . . . . 69ITEM 14 Principal Accountant Fees and Services . . . . . . . . . . . . . . . . . . . . . . . . . . . . . . . . . . . . . . . . . . . 69
PART IV 70
ITEM 15 Exhibits and Financial Statement Schedule . . . . . . . . . . . . . . . . . . . . . . . . . . . . . . . . . . . . . . . . . 70SIGNATURES . . . . . . . . . . . . . . . . . . . . . . . . . . . . . . . . . . . . . . . . . . . . . . . . . . . . . . . . . . . . . . . . . . . . . . . . . 74
50323_10K.indd 2 2/27/15 11:56 AM
Job Name: 50323PDF Page: 50323_10K 2.p1.pdf
Process Plan: Doc6060_FileDate: 15-03-13Time: 17:08:42
Operator: ____________________________
PageMark-Color-Comp
❏ OK to proceed❏ Make corrections and proceed❏ Make corrections and show another proof
Signed: ___________________ Date: ______

HUBBELL INCORPORATED - Form 10-K 3
PART I ITEM 1 Business Hubbell Incorporated (herein referred to as “Hubbell”, the “Company”, the “registrant”, “we”, “our” or “us”, which references shall include its divisions and subsidiaries as the context may require) was founded as a proprietorship in 1888, and was incorporated in Connecticut in 1905. Hubbell is primarily engaged in the design, manufacture and sale of quality electrical and electronic products for a broad range of non-residential and residential construction, industrial and utility applications. Products are either sourced complete, manufactured or assembled by subsidiaries in the United States, Canada, Switzerland, Puerto Rico, Mexico, the People’s Republic of China (“China”), Italy, the United Kingdom (“UK”), Brazil and Australia. Hubbell also participates in joint ventures in Taiwan and Hong Kong, and maintains offices in Singapore, China, India, Mexico, South Korea and countries in the Middle East. The Company’s reporting segments consist of the Electrical segment (comprised of electrical systems products and lighting products) and the Power segment, as described below. See also Item 7. Management’s Discussion and Analysis – “Executive Overview of the Business”, and “Results of Operations” as well
as Note 20 – Industry Segments and Geographic Area Information in the Notes to Consolidated Financial Statements. The Company’s annual report on Form 10-K, quarterly reports on Form 10-Q, current reports on Form 8-K, and all amendments to those reports are made available free of charge through the Investor Relations section of the Company’s website at http://www.hubbell.com as soon as practicable after such material is electronically filed with, or furnished to, the SEC. These filings are also available for reading and copying at the SEC’s Public Reference Room at 100 F Street N.E., Washington, D.C. 20549. Information on the operation of the Public Reference Room may be obtained by calling the SEC at 1-800-SEC-0330. In addition, the Company’s SEC filings can be accessed from the SEC’s homepage on the Internet at http://www.sec.gov. The information contained on the Company’s website or connected to our website is not incorporated by reference into this Annual Report on Form 10-K and should not be considered part of this report.
Electrical Segment
The Electrical segment (71%, 71% and 69% of consolidated revenues in 2014, 2013 and 2012, respectively) is comprised of businesses that sell stock and custom products including standard and special application wiring device products, rough-in electrical products, connector and grounding products, lighting fixtures and controls, as well as other electrical equipment. The products are typically used in and around industrial, commercial and institutional facilities by electrical contractors, maintenance personnel, electricians and telecommunications companies. In addition, certain businesses design and manufacture a variety of high voltage test and measurement equipment, industrial controls and communication systems used in the non-residential and industrial markets. Many of these products are designed such that they can also be used in harsh and hazardous locations where a potential for fire and explosion exists due to the presence of flammable gasses and vapors. Harsh and hazardous products are primarily used in the oil and gas (onshore and offshore) and mining industries. There are also a
variety of lighting fixtures, wiring devices and electrical products that have residential and utility applications. These products are primarily sold through electrical and industrial distributors, home centers, retail and hardware outlets, lighting showrooms and residential product oriented internet sites. Special application products are sold primarily through wholesale distributors to contractors, industrial customers and original equipment manufacturers (“OEMs”). High voltage products are sold primarily by direct sales to customers through our sales engineers. Hubbell maintains a sales and marketing organization to assist potential users with the application of certain products to their specific requirements, and with architects, engineers, industrial designers, OEMs and electrical contractors for the design of electrical systems to meet the specific requirements of industrial, non-residential and residential users. Hubbell is also represented by independent manufacturers’ sales agents for many of its product offerings.
50323_10K.indd 3 2/27/15 11:56 AM
Job Name: 50323PDF Page: 50323_10K 3.p1.pdf
Process Plan: Doc6060_FileDate: 15-03-13Time: 17:08:42
Operator: ____________________________
PageMark-Color-Comp
❏ OK to proceed❏ Make corrections and proceed❏ Make corrections and show another proof
Signed: ___________________ Date: ______

4 HUBBELL INCORPORATED - Form 10-K
Hubbell Electrical Systems Hubbell designs, manufactures and sells thousands of wiring and electrical products which are supplied principally to industrial, non-residential and residential customers. These products include items such as:
• Cable reels • Wiring devices & accessories • Junction boxes, plugs & receptacles• Cable glands & fittings • Switches & dimmers • Datacom connectivity & enclosures• Connectors & tooling • Pin & sleeve devices • Speciality communications equipment• Floor boxes • Electrical motor controls • High voltage test systems• Ground fault devices • Steel & plastic enclosures • Mining communication & controls
These wiring and electrical products are sold under various brands and/or trademarks, including:
• Hubbell® • Bell® • Victor™ • Rig Power• Kellems® • TayMac® • GAI-Tronics® • Powerohm• Bryant® • Wiegmann® • Gleason Reel® • Chalmit™• Burndy® • Killark® • Haefely® • Austdac™• CMC® • Hawke™ • Hipotronics® • Raco®
Lighting Products Hubbell manufactures and sells lighting fixtures and controls for indoor and outdoor applications. The markets served include non-residential and residential. For the non-residential market the Company typically targets products that would be considered specification grade. A fast growing trend within the lighting industry is the adoption of light emitting diode (“LED”) technology as the light source. LED technology is both energy
efficient and long–lived and as a result offers customers the economic benefits of lower energy and maintenance costs. The Company has a broad array of LED-luminaire products within its portfolio and the majority of new product development efforts are oriented towards expanding those offerings. Examples of these lighting products or applications include:
• Canopy lights • Parking lot/parking garage fixtures • Decorative landscape fixtures• Emergency lighting/exit signs • Bollards • Fluorescent fixtures• Floodlights & poles • Bath/vanity fixtures & fans • Ceiling fans• LED components • Chandeliers & sconces • Site & area lighting• Recessed, surface mounted
& track fixtures• Athletic & recreational field fixtures • Occupancy, dimming & daylight
harvesting sensors These lighting products are sold under various brands and/or trademarks, including:
• Kim Lighting® • Security Lighting Systems™ • Spaulding Lighting™ • Kurt Versen™• Sportsliter Solutions™ • Columbia Lighting® • Alera Lighting® • Prescolite®• Beacon Products™ • Precision Paragon™[P2]™ • Progress Lighting® • Dual-Lite®• Architectural Area Lighting™ • Hubbell Building Automation™ • Hubbell Outdoor Lighting™ • Litecontrol
Power Segment
The Power segment (29%, 29% and 31% of consolidated revenues in 2014, 2013 and 2012, respectively) consists of operations that design and manufacture various distribution, transmission, substation and telecommunications products primarily used by the electrical utility industry. In addition, certain of these products are used in the civil construction and transportation industries. Products are sold to distributors and
directly to users such as electric utilities, telecommunication companies, pipeline and mining operations, industrial firms, construction and engineering firms. While Hubbell believes its sales in this area are not materially dependent upon any customer or group of customers, a substantial decrease in purchases by electrical utilities would affect this segment.
50323_10K.indd 4 2/27/15 11:56 AM
Job Name: 50323PDF Page: 50323_10K 4.p1.pdf
Process Plan: Doc6060_FileDate: 15-03-13Time: 17:08:42
Operator: ____________________________
PageMark-Color-Comp
❏ OK to proceed❏ Make corrections and proceed❏ Make corrections and show another proof
Signed: ___________________ Date: ______

HUBBELL INCORPORATED - Form 10-K 5
Distribution, Transmission and Substation Utility Products Hubbell manufactures and sells a wide variety of electrical distribution, transmission, substation and telecommunications products. These products include items such as:
• Arresters • High voltage bushings • Grounding equipment• Cutouts & fuse links • Insulators • Programmable reclosers• Pole line hardware • Cable terminations & accessories • Sectionalizers• Helical anchors & foundations • Formed wire products • Lineman tools, hoses & gloves• Overhead, pad mounted & capacitor
switches• Splices, taps & connectors • Polymer concrete & fiberglass
enclosures and equipment pads These products are sold under the following brands and/or trademarks:
• Ohio Brass® • Chance® • Anderson® • PenCell®• Fargo® • Hubbell® • Polycast® • Opti-loop™• Quazite® • Quadri*sil® • Trinetics® • Reuel™• Electro Composites™ • USCO™ • CDR™ • RFL®• Hot Box® • PCORE® • Delmar™
Information Applicable to All General Categories
International Operations The Company has several operations located outside of the United States. These operations manufacture, assemble and/or market Hubbell products and service both the Electrical and Power segments. As a percentage of total net sales, shipments from foreign operations directly to third parties were 14% in 2014, 16% in 2013 and 17% in 2012, with the Canadian and UK operations representing approximately 31% and 26%, respectively, of 2014 total international net sales. Switzerland, Brazil and Mexico each represent 10% of 2014 total international sales. See also Note 20-Industry Segments and Geographic Area Information in the Notes to Consolidated Financial Statements and Item 1A. Risk Factors relating to manufacturing in and sourcing from foreign countries. Raw Materials Raw materials used in the manufacture of Hubbell products primarily include steel, aluminum, brass, copper, bronze, plastics, phenolics, zinc, nickel, elastomers and petrochemicals. Hubbell also purchases certain electrical and electronic components, including solenoids, lighting ballasts, printed circuit boards, integrated circuit chips and cord sets, from a number of suppliers. Hubbell is not materially dependent upon any one supplier for raw materials used in the manufacture of its products and equipment, and at the present time, raw materials and components essential to its operation are in adequate supply. However, some of these principal raw materials are sourced from a limited number of suppliers. See also Item 7A. Quantitative and Qualitative Disclosures about Market Risk.
Patents Hubbell has approximately 1,600 active United States and foreign patents covering many of its products, which expire at various times. While Hubbell deems these patents to be of value, it does not consider its business to be dependent upon patent protection. Hubbell also licenses products under patents owned by others, as necessary, and grants licenses under certain of its patents. Working Capital Inventory, accounts receivable and accounts payable levels, payment terms and, where applicable, return policies are in accordance with the general practices of the electrical products industry and standard business procedures. See also Item 7. Management’s Discussion and Analysis of Financial Condition and Results of Operations. Backlog Substantially all of the backlog existing at December 31, 2014 is expected to be shipped to customers in 2015. Backlog of orders believed to be firm at December 31, 2014 was approximately $333.7 million compared to $295.4 million at December 31, 2013. Although this backlog is important, the majority of Hubbell’s revenues result from sales of inventoried products or products that have short periods of manufacture. Competition Hubbell experiences substantial competition in all categories of its business, but does not compete with the same companies in all of its product categories. The number and size of competitors vary considerably depending on the product line. Hubbell cannot specify with precision the number of competitors
50323_10K.indd 5 2/27/15 11:56 AM
Job Name: 50323PDF Page: 50323_10K 5.p1.pdf
Process Plan: Doc6060_FileDate: 15-03-13Time: 17:08:42
Operator: ____________________________
PageMark-Color-Comp
❏ OK to proceed❏ Make corrections and proceed❏ Make corrections and show another proof
Signed: ___________________ Date: ______

6 HUBBELL INCORPORATED - Form 10-K
in each product category or their relative market position. However, some of its competitors are larger companies with substantial financial and other resources. Hubbell considers product performance, reliability, quality and technological innovation as important factors relevant to all areas of its business, and considers its reputation as a manufacturer of quality products to be an important factor in its business. In addition, product price, service levels and other factors can affect Hubbell’s ability to compete.
Research and Development Research and development expenditures represent costs to discover and/or apply new knowledge in developing a new product or process, or in bringing about significant improvement in an existing product or process. Research and development expenses are recorded as a component of Cost of goods sold. Expenses for research and development were approximately 2% of Cost of goods sold for each of the years 2014, 2013 and 2012. Environment The Company is subject to various federal, state and local government requirements relating to the protection of employee health and safety and the environment. The Company believes that, as a general matter, its policies, practices and procedures are properly designed to prevent unreasonable risk of
environmental damage and personal injury to its employees and its customers’ employees and that the handling, manufacture, use and disposal of hazardous or toxic substances are in accordance with environmental laws and regulations. Like other companies engaged in similar businesses, the Company has incurred or acquired through business combinations, remedial response and voluntary cleanup costs for site contamination and is a party to product liability and other lawsuits and claims associated with environmental matters, including past production of product containing toxic substances. Additional lawsuits, claims and costs involving environmental matters are likely to continue to arise in the future. However, considering past experience and reserves, the Company does not anticipate that these matters will have a material impact on earnings, capital expenditures, financial condition or competitive position. See also Item 1A. Risk Factors and Note 15 — Commitments and Contingencies in the Notes to Consolidated Financial Statements. Employees As of December 31, 2014, Hubbell had approximately 15,400 salaried and hourly employees of which approximately 8,400 of these employees, or 54%, are located in the United States. Approximately 2,400 of these U.S. employees are represented by 17 labor unions. Hubbell considers its labor relations to be satisfactory.
50323_10K.indd 6 2/27/15 11:56 AM
Job Name: 50323PDF Page: 50323_10K 6.p1.pdf
Process Plan: Doc6060_FileDate: 15-03-13Time: 17:08:42
Operator: ____________________________
PageMark-Color-Comp
❏ OK to proceed❏ Make corrections and proceed❏ Make corrections and show another proof
Signed: ___________________ Date: ______

HUBBELL INCORPORATED - Form 10-K 7
Executive Officers of the RegistrantName Age(1) Present Position Business ExperienceDavid G. Nord 57 Chairman of the Board,
President and ChiefExecutive Officer
Present position since May 2014; President and ChiefExecutive Officer since January 2013; President and ChiefOperating Officer from June 2012 to January 2013, and SeniorVice President and Chief Financial Officer from September2005 to June 2012. Previously, various positions, includingVice President, Controller, of United Technologies and itssubsidiaries, 2000-2005.
William R. Sperry 52 Senior Vice President andChief Financial Officer
Present position since June 6, 2012; Vice President, CorporateStrategy and Development August 15, 2008 to June 6, 2012;previously, Managing Director, Lehman Brothers August 2006to April 2008, various positions, including Managing Director, ofJ.P. Morgan and its predecessor institutions, 1994-2006.
Gary N. Amato 63 Executive Vice President(Electrical Segment)
Present position since June 30, 2014; Group Vice President(Electrical Systems) December 2008- June 30, 2014; GroupVice President (Electrical Products) October 2006-December2008; Vice President October 1997-September 2006; VicePresident and General Manager of the Company’s IndustrialControls Divisions (ICD) 1989-1997; Marketing Manager, ICD,April 1988-March 1989.
Gerben W. Bakker 50 Group Vice President(Power Systems)
Present position since February 1, 2014; previously, DivisionVice President, Hubbell Power Systems, Inc. (“HPS”) August2009 - February 1, 2014; President, HPS Brazil June 2005 –July 2009; Vice President, Sourcing, HPS March 2004 – May2005.
James H. Biggart, Jr. 62 Vice President andTreasurer
Present position since January 1, 1996; Treasurer since 1987;Assistant Treasurer 1986-1987; Director of Taxes 1984-1986.
Joseph A. Capozzoli 40 Vice President andController
Present position since April 22, 2013; previously, AssistantCorporate Controller of Stanley Black & Decker, Inc. (“Stanley”)April 2011 to April 2013; Global Operations Controller atStanley 2010-2011; Director of Cost Accounting at Stanley,2006-2010.
An-Ping Hsieh 54 Vice President, GeneralCounsel
Present position since September 4, 2012; previously, VicePresident, Secretary and Associate General Counsel of UnitedTechnologies Corporation (“UTC”) February 2008 toSeptember 2012; Vice President and General Counsel, UTCFire and Security 2003-2008; Deputy General Counsel, OtisElevator Company, a United Technologies company2001-2003.
Stephen M. Mais 50 Vice President,Human Resources
Present position since August 22, 2005; previously Director,Staffing and Capability, Pepsi Bottling Group (“Pepsi”)2001-2005; Director, Human Resources Southeastern U.S.,Pepsi 1997-2001.
W. Robert Murphy 65 Executive Vice President,Marketing and Sales
Present position since October 1, 2007; Senior Group VicePresident 2001-2007; Group Vice President 2000-2001; SeniorVice President Marketing and Sales (Wiring Systems)1985-1999; and various sales positions (Wiring Systems)1975-1985.
William T. Tolley 57 Senior Vice President,Growth and Innovation
Present position since February 1, 2014, previously, GroupVice President (Power Systems) December 23, 2008-February1, 2014; Group Vice President (Wiring Systems) October 1,2007-December 23, 2008; Senior Vice President of Operationsand Administration (Wiring Systems) October 2005-October2007; Director of Special Projects April 2005-October 2005;administrative leave November 2004-April 2005; Senior VicePresident and Chief Financial Officer February 2002-November2004.
(1) As of February 19, 2015.
There are no family relationships between any of the above-named executive officers. For information related to our Board of Directors, refer to Item 10. Directors, Executive Officers and Corporate Governance.
50323_10K.indd 7 2/27/15 11:56 AM
Job Name: 50323PDF Page: 50323_10K 7.p1.pdf
Process Plan: Doc6060_FileDate: 15-03-13Time: 17:08:42
Operator: ____________________________
PageMark-Color-Comp
❏ OK to proceed❏ Make corrections and proceed❏ Make corrections and show another proof
Signed: ___________________ Date: ______

8 HUBBELL INCORPORATED - Form 10-K
ITEM 1A Risk Factors Our business, operating results, financial condition, and cash flows may be impacted by a number of factors including, but not limited to those set forth below. Any one of these factors could cause our actual results to vary materially from recent results or future anticipated results. See also Item 7. Management’s Discussion and Analysis — “Executive Overview of the Business”, “Outlook”, and “Results of Operations”. We operate in markets that are subject to competitive pressures that could affect selling prices or demand for our products. We compete on the basis of product performance, quality, service and/or price. Our competitive strategy is to design and manufacture high quality products at the lowest possible cost. Our strategy is to also increase selling prices to offset rising costs of raw materials and components. Competitive pricing pressures may not allow us to offset some or all of our increased costs through pricing actions. Alternatively, if raw material and component costs decline, the Company may not be able to maintain current pricing levels. Competition could also affect future selling prices or demand for our products which could have an adverse impact on our results of operations, financial condition and cash flows. Global economic uncertainty could adversely affect us. During periods of prolonged slow growth, or a downturn in conditions in the worldwide or domestic economies, we could experience reduced orders, payment delays, supply chain disruptions or other factors caused by economic challenges faced by our customers, prospective customers and suppliers. Depending upon their severity and duration, these conditions could have an adverse impact on our results of operations, financial condition and cash flows. We may not be able to successfully implement initiatives, including our restructuring activities, that improve productivity and streamline operations to control or reduce costs. Achieving our long-term profitability goals depends significantly on our ability to control or reduce our operating costs. Because many of our costs are affected by factors outside, or substantially outside, our control, we generally must seek to control or reduce costs through productivity initiatives. If we are not able to identify and implement initiatives that control or reduce costs and increase operating efficiency, or if the cost savings initiatives we have implemented to date do not generate expected cost savings, our financial results could be adversely impacted. Our efforts to control or reduce costs may include restructuring activities involving workforce reductions, facility consolidations and other cost reduction initiatives. If we do not successfully manage our current restructuring activities, or any other restructuring activities that we may undertake in the future, expected efficiencies and benefits may be delayed or not realized, and our operations and business could be disrupted.
We manufacture and source products and materials from various countries throughout the world. A disruption in the availability, price or quality of these products or materials could impact our operating results. Our business is subject to risks associated with global manufacturing and sourcing. We use a variety of raw materials in the production of our products including steel, aluminum, brass, copper, bronze, zinc, nickel and plastics. We also purchase certain electrical and electronic components, including lighting ballasts, printed circuit boards and integrated circuit chips from third party providers. Significant shortages in the availability of these materials or significant price increases could increase our operating costs and adversely impact the competitive positions of our products, which could adversely impact our results of operations. We continue to increase the amount of materials, components and finished goods that are sourced from or manufactured in foreign countries including Mexico, China, and other international countries. Political instability in any country where we do business could have an adverse impact on our results of operations. We rely on our suppliers to produce high quality materials, components and finished goods according to our specifications. Although we have quality control procedures in place, there is a risk that products may not meet our specifications which could impact our ability to ship quality products to our customers on a timely basis, which could adversely impact our results of operations. Future tax law changes could increase our prospective tax expense. In addition, tax payments may ultimately differ from amounts currently recorded by the Company. We are subject to income taxes as well as non-income based taxes, in both the United States and various foreign jurisdictions. We are subject to ongoing tax audits in various jurisdictions. Tax authorities may disagree with certain positions we have taken and assess additional taxes. We regularly assess the likely outcomes of these audits in order to determine the appropriateness of our tax provisions. However, there can be no assurance that we will accurately predict the outcomes of these audits, and the future outcomes of these audits could adversely affect our results of operations, financial condition and cash flows. We engage in acquisitions and strategic investments and may encounter difficulty in obtaining appropriate acquisitions and in integrating these businesses. Part of the Company’s future growth strategy involves acquisitions. We have pursued and will continue to seek acquisitions and other strategic investments to complement and expand our existing businesses. The rate and extent to which acquisitions become available may impact our growth rate. The success of these transactions will depend on our ability to integrate these businesses into our operations and realize the planned synergies. We may encounter difficulties in integrating acquisitions into our operations and in managing strategic investments. Failure to effectively complete or manage
50323_10K.indd 8 2/27/15 11:56 AM
Job Name: 50323PDF Page: 50323_10K 8.p1.pdf
Process Plan: Doc6060_FileDate: 15-03-13Time: 17:08:42
Operator: ____________________________
PageMark-Color-Comp
❏ OK to proceed❏ Make corrections and proceed❏ Make corrections and show another proof
Signed: ___________________ Date: ______

HUBBELL INCORPORATED - Form 10-K 9
acquisitions may adversely affect our existing businesses as well as our results of operations, financial condition and cash flows. We are subject to risks surrounding our information systems. The proper functioning of Hubbell’s information systems is critical to the successful operation of our business. Although our information systems are protected with robust backup and security systems, these systems are still susceptible to outages due to fire, floods, power loss, telecommunications failures, viruses, break-ins and similar events, or breaches of security. A failure of our information technology systems could impact our ability to process orders, maintain proper levels of inventory, collect accounts receivable and pay expenses; all of which could have an adverse effect on our results of operations, financial condition and cash flows. In addition, security breaches could result in unauthorized disclosure of confidential information that may result in financial or reputational damage to the Company.
We have continued to work on improving our utilization of our enterprise resource planning system, expanding standardization of business processes and performing implementations at our remaining businesses. We expect to incur additional costs related to future implementations, process reengineering efforts as well as enhancements and upgrades to the system. These system modifications and implementations could result in operating inefficiencies which could adversely impact our operating results and/or our ability to perform necessary business transactions. Deterioration in the credit quality of our customers could have a material adverse effect on our operating results and financial condition. We have an extensive customer base of distributors, wholesalers, electric utilities, OEMs, electrical contractors, telecommunications companies and retail and hardware outlets. We are not dependent on a single customer, however, our top ten customers account for approximately one-third of our net sales. Deterioration in the credit quality of several major customers could adversely affect our results of operations, financial condition and cash flows. Inability to access capital markets or failure to maintain our credit ratings may adversely affect our business. Our ability to invest in our business and make strategic acquisitions may require access to the capital markets. If general economic and capital market conditions deteriorate significantly, it could impact our ability to access the capital markets. Failure to maintain our credit ratings could also impact our ability to access credit markets and could adversely impact our cost of borrowing. While we have not encountered significant financing difficulties recently, the capital and credit markets have experienced significant volatility in recent years. Market conditions could make it more difficult for us to access capital to finance our investments and acquisitions. This could adversely affect our results of operations, financial condition and cash flows.
If the underlying investments of our defined benefit plans do not perform as expected, we may have to make additional contributions to these plans. We sponsor certain pension and other postretirement defined benefit plans. The performance of the financial markets and interest rates impact these plan expenses and funding obligations. Significant changes in market interest rates, investment losses on plan assets and reductions in discount rates may increase our funding obligations and could adversely impact our results of operations and cash flows. Furthermore, there can be no assurance that the value of the defined benefit plan assets will be sufficient to meet future funding requirements. Volatility in currency exchange rates may adversely affect our financial condition, results of operations and cash flows. Our international operations accounted for approximately 14% of our net sales in 2014. We are exposed to the effects (both positive and negative) that fluctuating exchange rates have on translating the financial statements of our international operations, most of which are denominated in local currencies, into the U.S. dollar. Fluctuations in exchange rates may affectproduct demand and reported profits in our international operations. In addition, currency fluctuations may affect the prices we pay suppliers for materials used in our products. As a result, fluctuating exchange rates may adversely impact our results of operations and cash flows. Our success depends on attracting and retaining qualified personnel. Our ability to sustain and grow our business requires us to hire, retain and develop a highly skilled and diverse management team and workforce. Failure to ensure that we have the depth and breadth of personnel with the necessary skill set and experience could impede our ability to deliver our growth objectives and execute our strategy. Our reputation and our ability to conduct business may be impaired by improper conduct by any of our employees, agents or business partners. We cannot provide absolute assurance that our internal controls and compliance systems will always protect us from acts committed by our employees, agents or business partners that would violate U.S. and/or non-U.S. laws, including the laws governing payments to government officials, bribery, fraud, anti-kickback and false claims rules, competition, export and import compliance, money laundering and data privacy. In particular, the U.S. Foreign Corrupt Practices Act, the U.K. Bribery Act, and similar anti-bribery laws in other jurisdictions generally prohibit companies and their intermediaries from making improper payments to government officials for the purpose of obtaining or retaining business, and we operate in parts of the world that have experienced governmental corruption to some degree. Despite meaningful measures that we undertake to facilitate lawful conduct, which include training and internal control policies, these measures may not always prevent reckless or criminal acts by our employees or agents. Any such improper actions could damage our reputation and subject us to civil or criminal investigation in the United States and in other jurisdictions, could lead to substantial civil and criminal,
50323_10K.indd 9 2/27/15 11:56 AM
Job Name: 50323PDF Page: 50323_10K 9.p1.pdf
Process Plan: Doc6060_FileDate: 15-03-13Time: 17:08:42
Operator: ____________________________
PageMark-Color-Comp
❏ OK to proceed❏ Make corrections and proceed❏ Make corrections and show another proof
Signed: ___________________ Date: ______
10 HUBBELL INCORPORATED - Form 10-K
monetary and non-monetary penalties and could cause us to incur significant legal and investigative fees. Our inability to effectively develop and introduce new products could adversely affect our ability to compete. New product introductions and enhancement of existing products and services are key to the Company’s competitive strategy. The success of new product introductions is dependent on a number of factors, including, but not limited to, timely and successful development of new products, market acceptance of these products and the Company’s ability to manage the risks associated with these introductions. These risks include production capabilities, management of inventory levels to support anticipated demand, the risk that new products may have quality defects in the early stages of introduction, and obsolescence risk of existing products. The Company cannot predict with certainty the ultimate impact new product introductions could have on our results of operations, financial condition or cash flows. We could incur significant and/or unexpected costs in our efforts to successfully avoid, manage, defend and litigate intellectual property matters. The Company relies on certain patents, trademarks, copyrights, trade secrets and other intellectual property of which the Company cannot be certain that others have not and will not infringe upon. Although management believes that the loss or expiration of any single intellectual property right would not have a material impact on its operating results, intellectual property litigation could be costly and time consuming and the Company could incur significant legal expenses pursuing these claims against others. From time to time, we receive notices from third parties alleging intellectual property infringement. Any dispute or litigation involving intellectual property could be costly and time-consuming due to the complexity and the uncertainty of intellectual property litigation. Our intellectual property portfolio may not be useful in asserting a counterclaim, or negotiating a license, in response to a claim of infringement or misappropriation. In addition, as a result of such claims, the Company may lose its rights to utilize critical technology or may be required to pay substantial damages or license fees with respect to the infringed rights or be required to redesign our products at a substantial cost, any of which could negatively impact our operating results. Even if we successfully defend against claims of infringement, we may incur significant costs that could adversely affect our results of operations, financial condition and cash flow. See Item 3 “Legal Proceedings” for a discussion of our legal proceedings. We may be required to recognize impairment charges for our goodwill and other intangible assets. As of December 31, 2014, the net carrying value of our goodwill and other intangible assets totaled approximately $1.2 billion. As required by generally accepted accounting principles, we periodically assess these assets to determine if they are impaired. Impairment of intangibles assets may be triggered by developments both within and outside the Company’s control. Deteriorating economic conditions, technological changes, disruptions to our business, inability to effectively integrate acquired businesses, unexpected significant changes or
planned changes in use of the assets, intensified competition, divestitures, market capitalization declines and other factors may impair our goodwill and other intangible assets. Any charges relating to such impairments could adversely affect our results of operations in the periods an impairment is recognized. We have two classes of common stock with different voting rights, which results in a concentration of voting power of our common stock. As of December 31, 2014, the holders of our Class A Common Stock (with 20 votes per share) held approximately 74% of the voting power represented by all outstanding shares of our common stock and approximately 13% of the Company’s total equity value, and the Hubbell Trust and Roche Trust collectively held approximately 49% of our Class A Common Stock. The holders of the Class A Common Stock thus are in a position to influence matters that are brought to a vote of the holders of our common stock, including, among others, the election of the board of directors, any amendments to our charter documents, and the approval of material transactions. In order to further the interests of our shareholders, the Company routinely reviews various alternatives to meet its capital structure objectives, including equity, reclassification and debt transactions. We are subject to litigation and environmental regulations that may adversely impact our operating results. We are a party to a number of legal proceedings and claims, including those involving product liability, intellectual property and environmental matters, which could be significant. It is not possible to predict with certainty the outcome of every claim and lawsuit. In the future, we could incur judgments or enter into settlements of lawsuits and claims that could have a materially adverse effect on our results of operations and financial condition. In addition, while we maintain insurance coverage with respect to certain claims, such insurance may not provide adequate coverage against such claims. We establish reserves based on our assessment of contingencies, including contingencies related to legal claims asserted against us. Subsequent developments in legal proceedings may affect our assessment and estimates of the loss contingency recorded as a reserve and require us to make additional payments, which could have a materially adverse effect on our results of operations, financial condition and cash flow. We are also subject to various laws and regulations relating to environmental protection and the discharge of materials into the environment, and we could incur substantial costs as a result of the noncompliance with or liability for clean up or other costs or damages under environmental laws. In addition, we could be affected by future laws or regulations, including those imposed in response to climate change concerns. Compliance with any future laws and regulations could result in a materially adverse affect on our business and financial results. See Item 3 “Legal Proceedings” for a discussion of our legal proceedings.
50323_10K.indd 10 2/27/15 11:56 AM
Job Name: 50323PDF Page: 50323_10K 10.p1.pdf
Process Plan: Doc6060_FileDate: 15-03-13Time: 17:08:42
Operator: ____________________________
PageMark-Color-Comp
❏ OK to proceed❏ Make corrections and proceed❏ Make corrections and show another proof
Signed: ___________________ Date: ______

HUBBELL INCORPORATED - Form 10-K 11
New regulations related to conflict-free minerals may cause us to incur additional expenses and may create challenges with our customers. The Dodd-Frank Wall Street Reform and Consumer Protection Act contains provisions to improve transparency and accountability regarding the use of “conflict” minerals mined from the Democratic Republic of Congo and adjoining countries (“DRC”). In August 2012 the SEC established annual disclosure and reporting requirements for those companies who use “conflict” minerals sourced from the DRC in their products. These new requirements could limit the pool of suppliers who can provide conflict-free minerals and as a result, we cannot ensure that we will be able to obtain these conflict-free minerals at competitive prices. Compliance with these new requirements may also increase our costs. In addition, we may face challenges with our customers if we are unable to sufficiently verify the origins of the minerals used in our products. Health care reform could adversely affect our operating results. In 2010, the United States federal government enacted comprehensive health care reform legislation. Due to the breadth and complexity of this legislation, as well as its phased-in nature of implementation and lack of interpretive guidance, it
is difficult for the Company to predict the overall effects it will have on our business. To date, the Company has not experienced material costs related to the health care reform legislation, however, it is possible that our operating results could be adversely affected in the future by increased costs, expanded liability exposure and requirements that change the ways we provide healthcare and other benefits to our employees. We face the potential harms of natural disasters, terrorism, acts of war, international conflicts or other disruptions to our operations. Natural disasters, acts or threats of war or terrorism, international conflicts, and the actions taken by the United States and other governments in response to such events could cause damage to or disrupt our business operations, our suppliers or our customers, and could create political or economic instability, any of which could have an adverse effect on our business. Although it is not possible to predict such events or their consequences, these events could decrease demand for our products, make it difficult or impossible for us to deliver products, or disrupt our supply chain.
ITEM 1B Unresolved Staff Comments None
50323_10K.indd 11 2/27/15 11:56 AM
Job Name: 50323PDF Page: 50323_10K 11.p1.pdf
Process Plan: Doc6060_FileDate: 15-03-13Time: 17:08:42
Operator: ____________________________
PageMark-Color-Comp
❏ OK to proceed❏ Make corrections and proceed❏ Make corrections and show another proof
Signed: ___________________ Date: ______

12 HUBBELL INCORPORATED - Form 10-K
ITEM 2 PropertiesHubbell’s manufacturing and warehousing facilities, classified by reporting segment, are located in the following countries. The Company believes its manufacturing and warehousing facilities are adequate to carry on its business activities.
Number of FacilitiesTotal Approximate Floor
Area in Square FeetSegment Location Warehouses Manufacturing Owned LeasedElectrical segment United States 12 33 3,511,100 1,677,600 Australia 1 2 — 39,600 Brazil — 1 105,900 — Canada 2 3 178,700 24,700 Italy — 1 — 8,100 Mexico 1 3 665,700 43,300 China — 2 — 287,900 Puerto Rico — 1 162,400 — Singapore 1 — — 8,700 Switzerland — 1 95,000 —
UnitedKingdom 1 4 133,600 53,600
Power segment United States 1 13 2,438,500 157,000 Brazil — 1 138,300 — Canada — 1 30,000 — Mexico 1 1 167,300 (1) 181,100 China 1 1 — 74,600TOTAL 21 68 7,626,500 2,556,200
(1) The Power segment shares an owned manufacturing building in Mexico with the Electrical segment. The building is included in the Electrical segment facility count.
ITEM 3 Legal Proceedings The Company is subject to various legal proceedings arising in the normal course of its business. These proceedings include claims for damages arising out of use of the Company’s products, intellectual property, workers’ compensation and environmental matters. The Company is self-insured up to specified limits for certain types of claims, including product liability and workers’ compensation, and is fully self-insured for certain other types of claims, including environmental and intellectual property matters. The Company recognizes a liability for any contingency that in management’s judgment is probable of occurrence and can be reasonably estimated. We continually reassess the likelihood of adverse judgments and outcomes in these matters, as well as estimated ranges of possible losses based upon an analysis of each matter which includes consideration of outside legal counsel and, if applicable, other experts.
In the fourth quarter of 2014, the Company settled litigation involving Powerweb Energy, Inc. (“Powerweb”). The lawsuit had alleged claims arising from the Company’s development and sale of wiHUBB wireless lighting technology. The Company believes that it had meritorious defenses against the claims and had vigorously defended itself in the matter. During 2013, the Company recorded an accrual equal to the low end of its estimated range of outcome. During the third quarter of 2014 the parties engaged in settlement discussions and the Company increased the accrual by $4.0 million based on those discussions. In view of several considerations including the inherent uncertainty of litigation, and the expense of a trial, the Company settled the litigation. The settlement payment made by the Company did not exceed the amounts previously reserved for the litigation.
ITEM 4 Mine Safety Disclosures Not applicable.
50323_10K.indd 12 2/27/15 11:56 AM
Job Name: 50323PDF Page: 50323_10K 12.p1.pdf
Process Plan: Doc6060_FileDate: 15-03-13Time: 17:08:42
Operator: ____________________________
PageMark-Color-Comp
❏ OK to proceed❏ Make corrections and proceed❏ Make corrections and show another proof
Signed: ___________________ Date: ______

HUBBELL INCORPORATED - Form 10-K 13
PART II
ITEM 5 Market for the Registrant’s Common Equity, Related Stockholder Matters and Issuer Purchases of Equity SecuritiesThe Company’s Class A and Class B Common Stock is principally traded on the New York Stock Exchange under the symbols “HUBA” and “HUBB”. The following tables provide information on market prices, dividends declared, number of common shareholders, and repurchases by the Company of shares of its Class A and Class B Common Stock.
Market Prices (Dollars Per Share) Class A Common Class B CommonYears Ended December 31, High Low High Low2014 — Fourth quarter 131.60 105.27 127.29 101.442014 — Third quarter 129.50 120.22 126.96 115.342014 — Second quarter 125.68 104.20 125.40 112.712014 — First quarter 114.00 94.24 122.55 106.472013 — Fourth quarter 97.98 91.02 109.29 101.512013 — Third quarter 99.91 89.40 110.90 99.632013 — Second quarter 93.51 83.08 102.68 91.942013 — First quarter 88.00 78.62 97.73 84.80
Dividends Declared (Dollars Per Share) Class A Common Class B CommonYears Ended December 31, 2014 2013 2014 2013First quarter 0.50 0.45 0.50 0.45Second quarter 0.50 0.45 0.50 0.45Third quarter 0.50 0.45 0.50 0.45Fourth quarter 0.56 0.50 0.56 0.50
Number of Common Shareholders of Record At December 31, 2014 2013 2012 2011 2010Class A 369 394 426 458 483Class B 2,093 2,225 2,389 2,549 2,731
Our dividends are declared at the discretion of our Board of Directors. In October 2014, the Company’s Board of Directors approved an increase in the common stock dividend rate from $0.50 to $0.56 per share per quarter. The increased quarterly dividend payment commenced with the December 15, 2014 payment made to the shareholders of record on November 28, 2014. Purchases of Equity Securities
In September 2011, the Board of Directors approved a stock repurchase program and authorized the repurchase of up to $200 million of Class A and Class B Common Stock. During 2014, the Company spent $35.0 million on the repurchase of
common shares under the September 2011 program prior to its expiration in September 2014. In October 2014, the Board of Directors approved a new stock repurchase program ("October 2014 program") and authorized the repurchase of up to $300 million of Class A and Class B Common Stock. The October 2014 program expires in October 2017. As of December 31, 2014, approximately $229.5 million remains authorized for future repurchases under the October 2014 program. Depending upon numerous factors, including market conditions and alternative uses of cash, we may conduct discretionary repurchases through open market and privately negotiated transactions during our normal trading windows. The Company did not repurchase any Class A Common Stock during 2014.
50323_10K.indd 13 2/27/15 11:56 AM
Job Name: 50323PDF Page: 50323_10K 13.p1.pdf
Process Plan: Doc6060_FileDate: 15-03-13Time: 17:08:42
Operator: ____________________________
PageMark-Color-Comp
❏ OK to proceed❏ Make corrections and proceed❏ Make corrections and show another proof
Signed: ___________________ Date: ______

14 HUBBELL INCORPORATED - Form 10-K
The following table summarizes the Company's repurchase activity of Class B Common Stock during the quarter ended December 31, 2014:
Total Numberof Class B
SharesPurchased
(000's)
AveragePrice Paid
per Class BShare
Approximate Valueof Shares that MayYet Be Purchased
Under thePrograms (in
millions)BALANCE AS OF SEPTEMBER 30, 2014 $ —October 2014 200 $ 109.35 $ 278.1November 2014 431 $ 111.67 $ 230.0December 2014 5 $ 102.09 $ 229.5TOTAL FOR THE QUARTER ENDED DECEMBER 31, 2014 636 $ 110.87 $ 229.5
Corporate Performance Graph
The following graph compares the total return to shareholders on the Company’s Class B Common Stock during the five years ended December 31, 2014, with a cumulative total return on the (i) Standard & Poor’s MidCap 400 (“S&P MidCap 400”) and (ii) the Dow Jones U.S. Electrical Components & Equipment Index (“DJUSEC”). The Company is a member of the S&P MidCap 400. As of December 31, 2014, the DJUSEC reflects a group of
fourteen company stocks in the electrical components and equipment market segment, and serves as the Company’s peer group for purposes of this graph. The comparison assumes $100 was invested on December 31, 2009 in the Company’s Class B Common Stock and in each of the foregoing indices and assumes reinvestment of dividends.
COMPARISON OF 5 YEAR CUMULATIVE TOTAL RETURN*Among Hubbell Incorporated, the S&P Midcap 400 Index,
and the Dow Jones US Electrical Components & Equipment Index
*$100 invested on 12/31/09 in stock or index, including reinvestment of dividends. Fiscal year ending December 31.Copyright© 2015 S&P, a division of The McGraw-Hill Companies Inc. All rights reserved. Copyright© 2015 Dow Jones & Co. All rights reserved.
50323_10K.indd 14 2/27/15 11:56 AM
Job Name: 50323PDF Page: 50323_10K 14.p1.pdf
Process Plan: Doc6060_FileDate: 15-03-13Time: 17:08:42
Operator: ____________________________
PageMark-Color-Comp
❏ OK to proceed❏ Make corrections and proceed❏ Make corrections and show another proof
Signed: ___________________ Date: ______

HUBBELL INCORPORATED - Form 10-K 15
ITEM 6 Selected Financial Data The following summary should be read in conjunction with the consolidated financial statements and notes contained herein (dollars and shares in millions, except per share amounts).
OPERATIONS, years ended December 31, 2014 2013 2012 2011 2010Net sales $3,359.4 $3,183.9 $3,044.4 $2,871.6 $2,541.2 Gross profit $1,109.0 $1,070.5 $1,012.2 $ 923.7 $ 828.7 Operating income $ 517.4 $ 507.6 $ 471.8 $ 423.8 $ 367.8 Operating income as a % of sales 15.4% 15.9% 15.5% 14.8% 14.5%Loss on extinguishment of debt $ — $ — $ — $ — $ (14.7) (1)
Net income attributable to Hubbell $ 325.3 $ 326.5 $ 299.7 $ 267.9 $ 217.2 (1)
Net income attributable to Hubbell as a % of net sales 9.7% 10.3% 9.8% 9.3% 8.5%Net income attributable to Hubbell as a % of Hubbellshareholders’ average equity 17.0% 18.3% 19.2% 18.3% 15.8%Earnings per share — diluted $ 5.48 $ 5.47 $ 5.00 $ 4.42 $ 3.59 (1)
Cash dividends declared per common share $ 2.06 $ 1.85 $ 1.68 $ 1.52 $ 1.44 Average number of common shares outstanding — diluted 59.2 59.6 59.8 60.4 60.3 Cost of acquisitions, net of cash acquired $ 183.8 $ 96.5 $ 90.7 $ 29.6 $ — FINANCIAL POSITION, AT YEAR-END Working capital $1,130.3 $1,165.4 $1,008.9 $ 861.4 $ 781.1 Total assets $3,322.8 $3,187.2 $2,947.0 $2,846.5 $2,705.8 Total debt $ 599.0 $ 597.5 $ 596.7 $ 599.2 $ 597.7 Total Hubbell shareholders’ equity $1,927.1 $1,906.4 $1,661.2 $1,467.8 $1,459.2 NUMBER OF EMPLOYEES, AT YEAR-END 15,400 14,300 13,600 13,500 13,000(1) In 2010, the Company recorded a $14.7 million pre-tax charge ($9.1 million after-tax) related to its early extinguishment of debt. The
earnings per diluted share impact of this charge was $0.15.
ITEM 7 Management’s Discussion and Analysis of Financial Condition and Results of Operations
Executive Overview of the Business
The Company is primarily engaged in the design, manufacture and sale of quality electrical and electronic products for a broad range of non-residential and residential construction, industrial and utility applications. Products are either sourced complete, manufactured or assembled by subsidiaries in the United States, Canada, Switzerland, Puerto Rico, China, Mexico, Italy, the United Kingdom, Brazil and Australia. The Company also participates in joint ventures in Taiwan and Hong Kong, and maintains offices in Singapore, China, India, Mexico, South Korea and countries in the Middle East. The Company employs approximately 15,400 individuals worldwide. The Company made the following management changes in 2014 as part of its succession planning program.
In February 2014, the Company promoted Mr. Gerben W. Bakker to Group Vice President, Power Systems. Mr. William T.
Tolley, the previous Group Vice President, Power Systems, has been named to the newly created position of Senior Vice President, Growth and Innovation.
On May 6, 2014, the Board of Directors appointed Mr. David G. Nord to the position of Chairman of the Board, in addition to his role as President and Chief Executive Officer. Mr. Nord succeeded Mr. Timothy H. Powers, the former Chairman of the Board, who retired from the Board in May 2014.
On June 30, 2014, Mr. Gary N. Amato was appointed to the position of Executive Vice President, Hubbell Electrical Segment. In this role, he acquired oversight of the Hubbell Lighting business, in addition to his leadership role over the Electrical Systems businesses. Mr. Amato assumed responsibility for the Lighting business following the announcement of the retirement of Mr. Scott H. Muse.
50323_10K.indd 15 2/27/15 11:56 AM
Job Name: 50323PDF Page: 50323_10K 15.p1.pdf
Process Plan: Doc6060_FileDate: 15-03-13Time: 17:08:42
Operator: ____________________________
PageMark-Color-Comp
❏ OK to proceed❏ Make corrections and proceed❏ Make corrections and show another proof
Signed: ___________________ Date: ______

16 HUBBELL INCORPORATED - Form 10-K
The Company’s reporting segments consist of the Electrical segment and the Power segment. Results for 2014, 2013 and 2012 by segment are included under “Segment Results” within this Management’s Discussion and Analysis. The Company is focused on growing profits and delivering attractive returns to our shareholders by executing a business plan focused on the following key initiatives: revenue growth, price realization, productivity improvements and capital deployment. As part of our revenue growth initiative, we remain focused on expanding market share through new product introductions and more effective utilization of sales and marketing efforts across the organization. In addition, we continue to assess opportunities to expand sales through acquisitions of
businesses that fill product line gaps or allow for expansion into new markets.
Price realization and productivity improvements are key areas of focus for our company. Productivity programs impact virtually all functional areas within the Company by rationalizing our manufacturing footprint and activities through restructuring actions, reducing or eliminating waste and improving processes. We continue to expand our efforts surrounding global product and component sourcing and supplier cost reduction programs. Value engineering efforts, product transfers and the use of lean process improvement techniques are expected to continue to increase manufacturing efficiency. In addition, we continue to build upon the benefits of our enterprise resource planning system across all functions and have also implemented a sustainability program across the organization. Material costs are approximately two-thirds of our cost of goods sold therefore volatility in this area can significantly impact profitability. Our goal is to have pricing and productivity programs that offset material and other inflationary cost increases as well as pay for investments in key growth areas.
Outlook
For 2015, we expect our overall net sales to increase by five to seven percent compared to 2014, with acquisitions contributing between five and six percent. Our outlook for net sales growth from acquisitions in 2015 includes the acquisitions we completed in January 2015, which are expected to add approximately $100 million to annual net sales.
Third party forecasts for our end markets point to improving organic demand in each of our businesses, with the exception of significantly weaker energy related markets. We expect our end markets could grow approximately one to two percent in 2015 led by high single digit growth in the residential market. The non-residential market is expected to grow in the mid-single digit range, industrial market growth is expected to be in the low to mid-single digit range, while transmission and distribution products in the utility market are anticipated to grow by one to two percent. We anticipate our net sales could benefit from growth in these end markets, but could also be dampened by a fifteen to twenty percent decline in the net sales of our Harsh and Hazardous products in 2015, which reflects an expectation of continued weakness in energy related markets.
We plan to continue to work on productivity initiatives and to make other strategic investments aimed at improving our cost structure and operating efficiency, including improved sourcing, product redesign and lean projects focused on both factory and back office efficiencies. In 2015 we plan to continue and expand on restructuring activities that were initiated in 2014. In 2015 we expect our earnings per diluted share will include approximately $0.25 cents of restructuring and related costs and anticipate those activities and investments will generate savings in 2016 in excess of those costs. We also anticipate continued cost increases from certain materials, healthcare and other inflationary costs, including higher pension costs.
From a profitability standpoint, we expect organic sales growth and acquisitions will contribute to earnings per share growth in 2015; however that growth will be partially offset by weak end markets for our Harsh and Hazardous products relating to the recent decline in oil prices. Additionally, we expect that foreign exchange will also be a headwind in 2015. We expect that our full year diluted earnings per share in 2015 will be in the range of $5.35 to $5.55, including approximately $0.25 of restructuring and related costs.
In 2015, we expect free cash flow (defined as cash flows from operations less capital expenditures) to be approximately 90% of net income and will include the impact of increased spending in 2015 on restructuring and related activities as well as higher capital spending on new product development.
Finally, with our strong financial position, we expect to continue to enhance shareholder value through capital deployment including both share repurchases and acquisitions. We anticipate that our 2015 acquisitions will contribute incremental earnings, but will be approximately 30 basis points dilutive to operating margin in 2015 as those acquisitions are burdened in the early periods with the impact of purchase accounting amortization.
50323_10K.indd 16 2/27/15 11:56 AM
Job Name: 50323PDF Page: 50323_10K 16.p1.pdf
Process Plan: Doc6060_FileDate: 15-03-13Time: 17:08:42
Operator: ____________________________
PageMark-Color-Comp
❏ OK to proceed❏ Make corrections and proceed❏ Make corrections and show another proof
Signed: ___________________ Date: ______
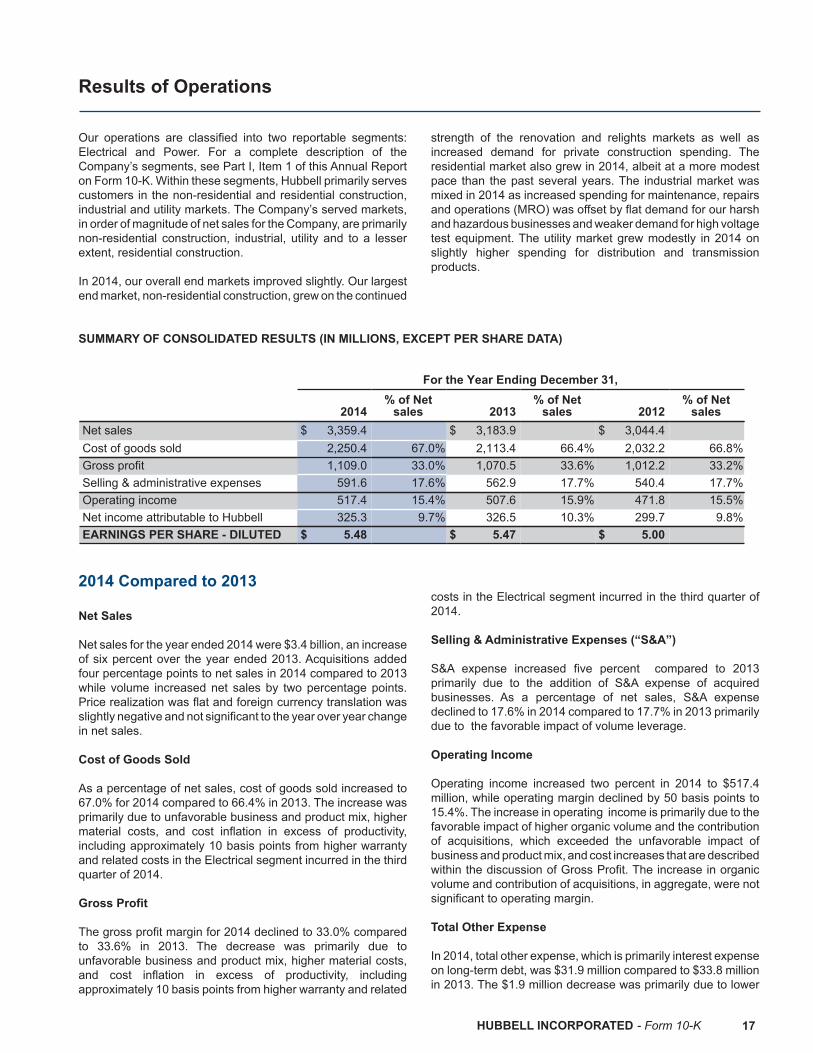
HUBBELL INCORPORATED - Form 10-K 17
Results of Operations
Our operations are classified into two reportable segments: Electrical and Power. For a complete description of the Company’s segments, see Part I, Item 1 of this Annual Report on Form 10-K. Within these segments, Hubbell primarily serves customers in the non-residential and residential construction, industrial and utility markets. The Company’s served markets, in order of magnitude of net sales for the Company, are primarily non-residential construction, industrial, utility and to a lesser extent, residential construction. In 2014, our overall end markets improved slightly. Our largest end market, non-residential construction, grew on the continued
strength of the renovation and relights markets as well as increased demand for private construction spending. The residential market also grew in 2014, albeit at a more modest pace than the past several years. The industrial market was mixed in 2014 as increased spending for maintenance, repairs and operations (MRO) was offset by flat demand for our harsh and hazardous businesses and weaker demand for high voltage test equipment. The utility market grew modestly in 2014 on slightly higher spending for distribution and transmission products.
SUMMARY OF CONSOLIDATED RESULTS (IN MILLIONS, EXCEPT PER SHARE DATA)
For the Year Ending December 31,
2014% of Net
sales 2013% of Net
sales 2012% of Net
salesNet sales $ 3,359.4 $ 3,183.9 $ 3,044.4 Cost of goods sold 2,250.4 67.0% 2,113.4 66.4% 2,032.2 66.8%Gross profit 1,109.0 33.0% 1,070.5 33.6% 1,012.2 33.2%Selling & administrative expenses 591.6 17.6% 562.9 17.7% 540.4 17.7%Operating income 517.4 15.4% 507.6 15.9% 471.8 15.5%Net income attributable to Hubbell 325.3 9.7% 326.5 10.3% 299.7 9.8%EARNINGS PER SHARE - DILUTED $ 5.48 $ 5.47 $ 5.00
2014 Compared to 2013 Net Sales Net sales for the year ended 2014 were $3.4 billion, an increase of six percent over the year ended 2013. Acquisitions added four percentage points to net sales in 2014 compared to 2013 while volume increased net sales by two percentage points. Price realization was flat and foreign currency translation was slightly negative and not significant to the year over year change in net sales. Cost of Goods Sold As a percentage of net sales, cost of goods sold increased to 67.0% for 2014 compared to 66.4% in 2013. The increase was primarily due to unfavorable business and product mix, higher material costs, and cost inflation in excess of productivity, including approximately 10 basis points from higher warranty and related costs in the Electrical segment incurred in the third quarter of 2014. Gross Profit The gross profit margin for 2014 declined to 33.0% compared to 33.6% in 2013. The decrease was primarily due to unfavorable business and product mix, higher material costs, and cost inflation in excess of productivity, including approximately 10 basis points from higher warranty and related
costs in the Electrical segment incurred in the third quarter of 2014. Selling & Administrative Expenses (“S&A”) S&A expense increased five percent compared to 2013 primarily due to the addition of S&A expense of acquired businesses. As a percentage of net sales, S&A expense declined to 17.6% in 2014 compared to 17.7% in 2013 primarily due to the favorable impact of volume leverage. Operating Income
Operating income increased two percent in 2014 to $517.4 million, while operating margin declined by 50 basis points to 15.4%. The increase in operating income is primarily due to the favorable impact of higher organic volume and the contribution of acquisitions, which exceeded the unfavorable impact of business and product mix, and cost increases that are described within the discussion of Gross Profit. The increase in organic volume and contribution of acquisitions, in aggregate, were not significant to operating margin. Total Other Expense In 2014, total other expense, which is primarily interest expense on long-term debt, was $31.9 million compared to $33.8 million in 2013. The $1.9 million decrease was primarily due to lower
50323_10K.indd 17 2/27/15 11:56 AM
Job Name: 50323PDF Page: 50323_10K 17.p1.pdf
Process Plan: Doc6060_FileDate: 15-03-13Time: 17:08:42
Operator: ____________________________
PageMark-Color-Comp
❏ OK to proceed❏ Make corrections and proceed❏ Make corrections and show another proof
Signed: ___________________ Date: ______
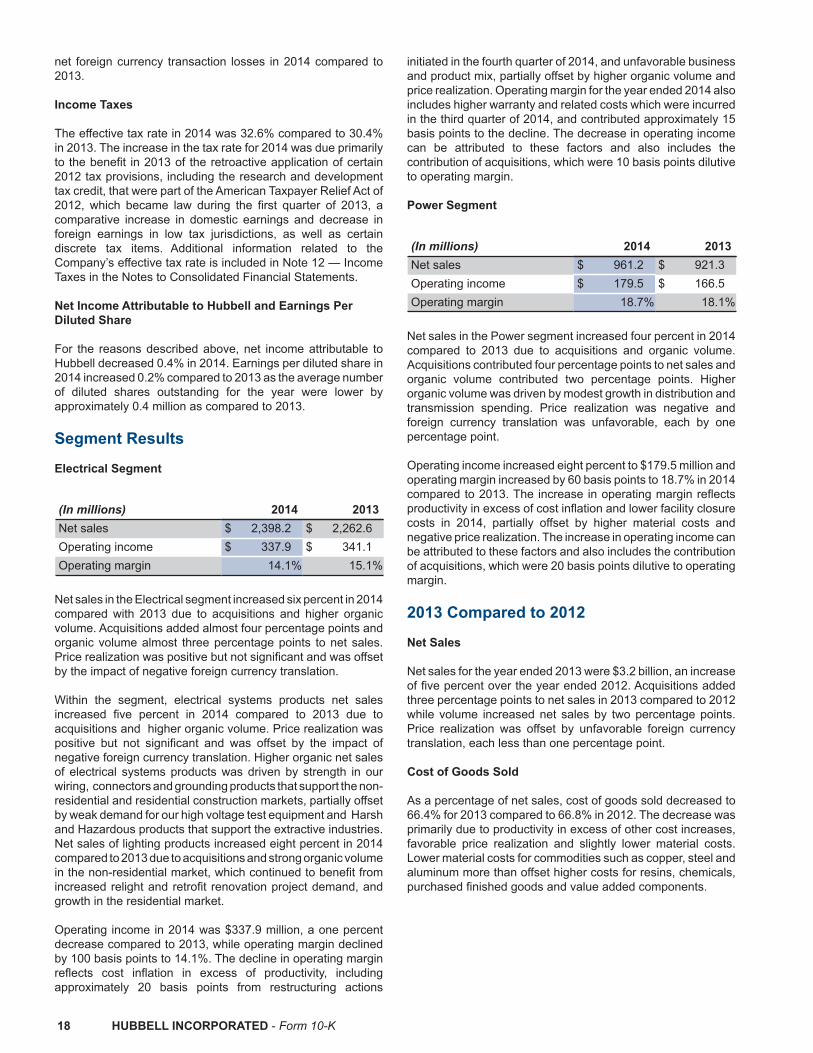
18 HUBBELL INCORPORATED - Form 10-K
net foreign currency transaction losses in 2014 compared to 2013. Income Taxes The effective tax rate in 2014 was 32.6% compared to 30.4% in 2013. The increase in the tax rate for 2014 was due primarily to the benefit in 2013 of the retroactive application of certain 2012 tax provisions, including the research and development tax credit, that were part of the American Taxpayer Relief Act of 2012, which became law during the first quarter of 2013, a comparative increase in domestic earnings and decrease in foreign earnings in low tax jurisdictions, as well as certain discrete tax items. Additional information related to the Company’s effective tax rate is included in Note 12 — Income Taxes in the Notes to Consolidated Financial Statements. Net Income Attributable to Hubbell and Earnings Per Diluted Share For the reasons described above, net income attributable to Hubbell decreased 0.4% in 2014. Earnings per diluted share in 2014 increased 0.2% compared to 2013 as the average number of diluted shares outstanding for the year were lower by approximately 0.4 million as compared to 2013. Segment Results Electrical Segment
(In millions) 2014 2013Net sales $ 2,398.2 $ 2,262.6Operating income $ 337.9 $ 341.1Operating margin 14.1% 15.1%
Net sales in the Electrical segment increased six percent in 2014 compared with 2013 due to acquisitions and higher organic volume. Acquisitions added almost four percentage points and organic volume almost three percentage points to net sales. Price realization was positive but not significant and was offset by the impact of negative foreign currency translation. Within the segment, electrical systems products net sales increased five percent in 2014 compared to 2013 due to acquisitions and higher organic volume. Price realization was positive but not significant and was offset by the impact of negative foreign currency translation. Higher organic net sales of electrical systems products was driven by strength in our wiring, connectors and grounding products that support the non-residential and residential construction markets, partially offset by weak demand for our high voltage test equipment and Harsh and Hazardous products that support the extractive industries. Net sales of lighting products increased eight percent in 2014 compared to 2013 due to acquisitions and strong organic volume in the non-residential market, which continued to benefit from increased relight and retrofit renovation project demand, and growth in the residential market. Operating income in 2014 was $337.9 million, a one percent decrease compared to 2013, while operating margin declined by 100 basis points to 14.1%. The decline in operating margin reflects cost inflation in excess of productivity, including approximately 20 basis points from restructuring actions
initiated in the fourth quarter of 2014, and unfavorable business and product mix, partially offset by higher organic volume and price realization. Operating margin for the year ended 2014 also includes higher warranty and related costs which were incurred in the third quarter of 2014, and contributed approximately 15 basis points to the decline. The decrease in operating income can be attributed to these factors and also includes the contribution of acquisitions, which were 10 basis points dilutive to operating margin. Power Segment
(In millions) 2014 2013Net sales $ 961.2 $ 921.3Operating income $ 179.5 $ 166.5Operating margin 18.7% 18.1%
Net sales in the Power segment increased four percent in 2014 compared to 2013 due to acquisitions and organic volume. Acquisitions contributed four percentage points to net sales and organic volume contributed two percentage points. Higher organic volume was driven by modest growth in distribution and transmission spending. Price realization was negative and foreign currency translation was unfavorable, each by one percentage point. Operating income increased eight percent to $179.5 million and operating margin increased by 60 basis points to 18.7% in 2014 compared to 2013. The increase in operating margin reflects productivity in excess of cost inflation and lower facility closure costs in 2014, partially offset by higher material costs and negative price realization. The increase in operating income can be attributed to these factors and also includes the contribution of acquisitions, which were 20 basis points dilutive to operating margin. 2013 Compared to 2012 Net Sales Net sales for the year ended 2013 were $3.2 billion, an increase of five percent over the year ended 2012. Acquisitions added three percentage points to net sales in 2013 compared to 2012 while volume increased net sales by two percentage points. Price realization was offset by unfavorable foreign currency translation, each less than one percentage point. Cost of Goods Sold As a percentage of net sales, cost of goods sold decreased to 66.4% for 2013 compared to 66.8% in 2012. The decrease was primarily due to productivity in excess of other cost increases, favorable price realization and slightly lower material costs. Lower material costs for commodities such as copper, steel and aluminum more than offset higher costs for resins, chemicals, purchased finished goods and value added components.
50323_10K.indd 18 2/27/15 11:56 AM
Job Name: 50323PDF Page: 50323_10K 18.p1.pdf
Process Plan: Doc6060_FileDate: 15-03-13Time: 17:08:42
Operator: ____________________________
PageMark-Color-Comp
❏ OK to proceed❏ Make corrections and proceed❏ Make corrections and show another proof
Signed: ___________________ Date: ______
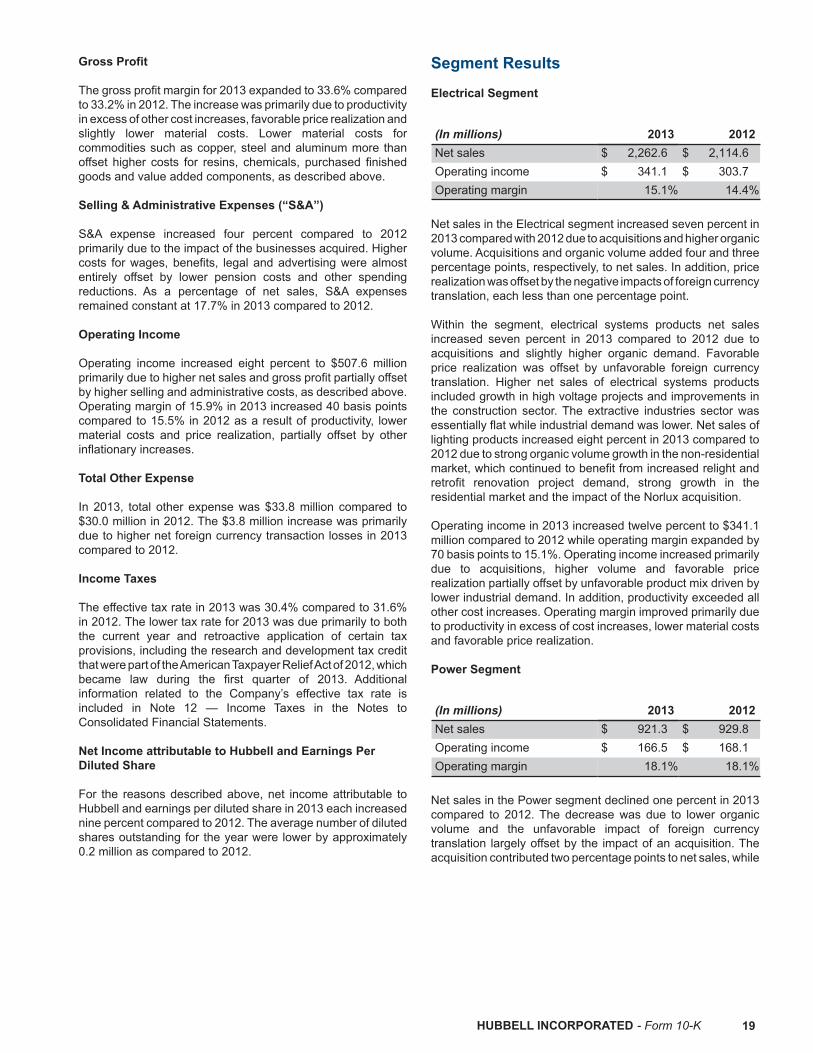
HUBBELL INCORPORATED - Form 10-K 19
Gross Profit The gross profit margin for 2013 expanded to 33.6% compared to 33.2% in 2012. The increase was primarily due to productivity in excess of other cost increases, favorable price realization and slightly lower material costs. Lower material costs for commodities such as copper, steel and aluminum more than offset higher costs for resins, chemicals, purchased finished goods and value added components, as described above. Selling & Administrative Expenses (“S&A”) S&A expense increased four percent compared to 2012 primarily due to the impact of the businesses acquired. Higher costs for wages, benefits, legal and advertising were almost entirely offset by lower pension costs and other spending reductions. As a percentage of net sales, S&A expenses remained constant at 17.7% in 2013 compared to 2012. Operating Income Operating income increased eight percent to $507.6 million primarily due to higher net sales and gross profit partially offset by higher selling and administrative costs, as described above. Operating margin of 15.9% in 2013 increased 40 basis points compared to 15.5% in 2012 as a result of productivity, lower material costs and price realization, partially offset by other inflationary increases. Total Other Expense In 2013, total other expense was $33.8 million compared to $30.0 million in 2012. The $3.8 million increase was primarily due to higher net foreign currency transaction losses in 2013 compared to 2012. Income Taxes The effective tax rate in 2013 was 30.4% compared to 31.6% in 2012. The lower tax rate for 2013 was due primarily to both the current year and retroactive application of certain tax provisions, including the research and development tax credit that were part of the American Taxpayer Relief Act of 2012, which became law during the first quarter of 2013. Additional information related to the Company’s effective tax rate is included in Note 12 — Income Taxes in the Notes to Consolidated Financial Statements.
Net Income attributable to Hubbell and Earnings Per Diluted Share For the reasons described above, net income attributable to Hubbell and earnings per diluted share in 2013 each increased nine percent compared to 2012. The average number of diluted shares outstanding for the year were lower by approximately 0.2 million as compared to 2012.
Segment Results Electrical Segment
(In millions) 2013 2012Net sales $ 2,262.6 $ 2,114.6Operating income $ 341.1 $ 303.7Operating margin 15.1% 14.4%
Net sales in the Electrical segment increased seven percent in 2013 compared with 2012 due to acquisitions and higher organic volume. Acquisitions and organic volume added four and three percentage points, respectively, to net sales. In addition, price realization was offset by the negative impacts of foreign currency translation, each less than one percentage point. Within the segment, electrical systems products net sales increased seven percent in 2013 compared to 2012 due to acquisitions and slightly higher organic demand. Favorable price realization was offset by unfavorable foreign currency translation. Higher net sales of electrical systems products included growth in high voltage projects and improvements in the construction sector. The extractive industries sector was essentially flat while industrial demand was lower. Net sales of lighting products increased eight percent in 2013 compared to 2012 due to strong organic volume growth in the non-residential market, which continued to benefit from increased relight and retrofit renovation project demand, strong growth in the residential market and the impact of the Norlux acquisition. Operating income in 2013 increased twelve percent to $341.1 million compared to 2012 while operating margin expanded by 70 basis points to 15.1%. Operating income increased primarily due to acquisitions, higher volume and favorable price realization partially offset by unfavorable product mix driven by lower industrial demand. In addition, productivity exceeded all other cost increases. Operating margin improved primarily due to productivity in excess of cost increases, lower material costs and favorable price realization. Power Segment
(In millions) 2013 2012Net sales $ 921.3 $ 929.8Operating income $ 166.5 $ 168.1Operating margin 18.1% 18.1%
Net sales in the Power segment declined one percent in 2013 compared to 2012. The decrease was due to lower organic volume and the unfavorable impact of foreign currency translation largely offset by the impact of an acquisition. The acquisition contributed two percentage points to net sales, while
50323_10K.indd 19 2/27/15 11:56 AM
Job Name: 50323PDF Page: 50323_10K 19.p1.pdf
Process Plan: Doc6060_FileDate: 15-03-13Time: 17:08:42
Operator: ____________________________
PageMark-Color-Comp
❏ OK to proceed❏ Make corrections and proceed❏ Make corrections and show another proof
Signed: ___________________ Date: ______

20 HUBBELL INCORPORATED - Form 10-K
the decline in organic volume and impact of foreign currency translation decreased net sales by two and one percentage points, respectively. The organic volume decline was almost entirely due to the impact of higher sales in the fourth quarter of 2012 related to Superstorm Sandy.
Operating income decreased one percent to $166.5 million and operating margin remained at 18.1% in 2013 compared to 2012. The drop in operating income was primarily due to lower volume, unfavorable price realization, higher material costs and other cost increases, including $5.0 million of facility consolidation costs, partially offset by productivity improvements and favorable product mix.
Financial Condition, Liquidity and Capital Resources
Cash Flow December 31,(In millions) 2014 2013 2012Net cash provided by (used in): Operating activities $ 391.5 $ 381.8 $ 349.1Investing activities (242.6) (151.1) (116.1)Financing activities (215.6) (130.9) (161.7)Effect of foreign currency exchange rate changes on cash and cash equivalents (20.1) (4.1) 4.1NET CHANGE IN CASH AND CASH EQUIVALENTS $ (86.8) $ 95.7 $ 75.4
2014 Compared to 2013 Cash provided by operating activities for 2014 increased compared to 2013 primarily due to higher net income after adjusting for the non-cash impacts of depreciation and amortization, stock-based compensation and deferred income taxes, and a lower use of cash for working capital, partially offset by higher pension contributions. Cash used for changes in working capital was $44.7 million in 2014 compared to $55.1 million of cash used in 2013 primarily due to increased collection of accounts receivable. Cash used for investing activities of $242.6 million in 2014 compared to cash used of $151.1 million in 2013. This increase is primarily due to an $87.3 million increase in net cash used for acquisitions in 2014 as compared to 2013. Cash used for financing activities of $215.6 million in 2014 compared to $130.9 million of cash used in 2013. This increase is primarily the result of $74.5 million of higher spending on the repurchase of common shares and an $11.9 million increase in dividends paid.
The unfavorable impact of foreign currency exchange rates on cash increased to $20.1 million in 2014 as compared to $4.1 million in 2013 primarily related to the U.S. dollar strengthening against several currencies, most notably the British pound, Australian dollar, Mexican peso and Canadian dollar. 2013 Compared to 2012 Cash provided by operating activities for the year ended 2013 increased compared to 2012 primarily due to higher net income and lower pension contributions, partially offset by a greater use of cash for working capital. Cash used for changes in working capital was $55.1 million in 2013 compared to $45.3 million of
cash used in 2012 primarily due to higher accounts receivable as a result of increased net sales. Investing activities used cash of $151.1 million in 2013 compared to cash used of $116.1 million in 2012. The increase was primarily due to higher capital expenditures, net acquisition investments and lower proceeds from sales of available for sale investments in 2013 as compared to 2012. Financing activities used cash of $130.9 million in 2013 compared to cash used of $161.7 million in 2012. The decrease in cash used is due to a lower spending on the repurchase of common shares, lower proceeds from the exercise of stock options and fewer dividend payments in 2013 as compared to 2012. In 2013, the Company made four dividend payments as compared to five dividend payments made in 2012.
Investments in the Business Investments in our business include both expenditures required to maintain the operation of our equipment and facilities as well as cash outlays in support of our strategic initiatives. During 2014, we used cash of $60.3 million for capital expenditures, an increase of $1.5 million from 2013. In 2014, the Company completed seven acquisitions for $183.8 million, net of cash acquired. Four of these acquisitions were added to the Power segment, while three were added to the Electrical segment. In January 2015, the Company completed three acquisitions for an aggregate cash purchase price of approximately $126 million. Two of these acquisitions were added to the Electrical segment, while one was added to the Power segment. The Company continues to assess
50323_10K.indd 20 2/27/15 11:56 AM
Job Name: 50323PDF Page: 50323_10K 20.p1.pdf
Process Plan: Doc6060_FileDate: 15-03-13Time: 17:08:42
Operator: ____________________________
PageMark-Color-Comp
❏ OK to proceed❏ Make corrections and proceed❏ Make corrections and show another proof
Signed: ___________________ Date: ______

HUBBELL INCORPORATED - Form 10-K 21
opportunities to expand sales through acquisitions of businesses that fill product gaps or allow for expansion in new markets. For more information refer to Note 2 – Business Acquisitions in the Notes to Consolidated Financial Statements. In September 2011, the Board of Directors approved a stock repurchase program and authorized the repurchase of up to $200 million of Class A and Class B Common Stock. During 2014, the Company spent $35.0 million on the repurchase of common shares under the September 2011 program prior to its expiration in September 2014. In October 2014, the Board of Directors approved a new stock repurchase program (the "October 2014 program") and authorized the repurchase of up to $300 million of Class A and Class B Common Stock. The October 2014 program expires in October 2017. As of December 31, 2014, approximately $229.5 million remains authorized for future repurchases under the October 2014 program. Depending upon numerous factors, including market conditions and alternative uses of cash, we may conduct discretionary repurchases through open market and privately negotiated transactions during our normal trading windows. Additional information with respect to future investments in the business can be found under “Outlook” within Management’s Discussion and Analysis. Debt to Capital
At December 31, 2014 and 2013, the Company had $597.6 million and $597.2 million, respectively, of senior long-term
notes outstanding, net of unamortized discount. The long-term fixed-rate notes, with amounts of $300 million due in 2018 and 2022, respectively, are callable with a make whole provision and are only subject to accelerated payment prior to maturity if we fail to meet certain non-financial covenants, all of which were met at December 31, 2014. At December 31, 2014 and 2013, the Company had $1.4 million and $0.3 million, respectively, of short-term debt outstanding. During 2013, the Company entered into a credit agreement for a 5.0 million Brazilian reais line of credit to support its Brazilian operations. This line of credit expires in October 2016; however, any undrawn balance is subject to an annual review by the lender. This line is not subject to annual commitment fees. At December 31, 2014, 3.0 million Brazilian reais (equivalent to $1.1 million) was outstanding. There were no borrowings outstanding at December 31, 2013 under this line of credit. Short-term debt is also comprised of outstanding borrowings of 1.7 million Chinese renminbi (equivalent to $0.3 million) under existing lines of credit used to support its operations in China. At December 31, 2013 there were 2.1 million Chinese renminbi (equivalent to $0.3 million) of borrowings outstanding under this line of credit. Net debt, defined as total debt less cash and investments, is a non-GAAP measure that may not be comparable to definitions used by other companies. We consider net debt to be a useful measure of our financial leverage for evaluating the Company’s ability to meet its funding needs.
The following table sets forth the reconciliation of net debt at December 31, 2014 and 2013:
December 31,(In millions) 2014 2013Total Debt $ 599.0 $ 597.5Total Hubbell Shareholders’ Equity 1,927.1 1,906.4TOTAL CAPITAL $ 2,526.1 $ 2,503.9Debt to Total Capital 24 % 24 %Cash and Investments $ 705.8 $ 786.6NET DEBT $ (106.8) $ (189.1)Net Debt to Total Capital (4)% (8)%
In November 2010, the Company completed a public debt offering for $300 million of long-term, senior, unsecured notes maturing in November 2022 (“2022 Notes”) and bearing interest at a fixed rate of 3.625%. Prior to the issuance of the 2022 Notes, the Company entered into a forward interest rate lock which resulted in a $1.6 million loss. This amount was recorded in Accumulated other comprehensive loss, net of tax, and is being amortized over the life of the 2022 Notes. In May 2008, the Company completed a public offering of $300 million long-term senior, unsecured notes maturing in May 2018 (the “2018 Notes”). The 2018 Notes bear interest at a fixed rate of 5.95%. Prior to the issuance of the 2018 Notes, the Company entered into a forward interest rate lock which resulted in a $1.2 million gain. This amount was recorded in Accumulated other comprehensive loss, net of tax, and is being amortized over the life of the notes.
The 2018 Notes and the 2022 Notes are both fixed rate indebtedness, are callable at any time with a make whole premium and are only subject to accelerated payment prior to maturity in the event of a default under the indenture governing the terms of the 2018 Notes and 2022 Notes, as modified by the supplemental indentures creating each such series, or upon a change in control event as defined in such indenture. Liquidity We measure liquidity on the basis of our ability to meet short-term and long-term operational funding needs, fund additional investments, including acquisitions, and make dividend payments to shareholders. Significant factors affecting the management of liquidity are cash flows from operating activities, capital expenditures, cash dividend payments, stock repurchases, access to bank lines of credit and our ability to attract long-term capital with satisfactory terms.
50323_10K.indd 21 2/27/15 11:56 AM
Job Name: 50323PDF Page: 50323_10K 21.p1.pdf
Process Plan: Doc6060_FileDate: 15-03-13Time: 17:08:42
Operator: ____________________________
PageMark-Color-Comp
❏ OK to proceed❏ Make corrections and proceed❏ Make corrections and show another proof
Signed: ___________________ Date: ______

22 HUBBELL INCORPORATED - Form 10-K
The Company had $653.9 million of cash and cash equivalents at December 31, 2014, of which approximately 53% was held outside of the United States. Except for a portion of current earnings, the Company’s intent is to indefinitely reinvest all of its undistributed international earnings and cash internationally. In January 2015 the Company completed three acquisitions for an aggregate cash purchase price of $126 million. Further discussion of the January 2015 acquisitions can be found in Note 22 — Subsequent Events of the Notes to Consolidated Financial Statements. As of December 31, 2014, the Company’s $500 million revolving credit facility had not been drawn against. The credit facility, which serves as a backup to our commercial paper program, is scheduled to expire in March 2018. The interest rate applicable to borrowing under the credit agreement is generally either the prime rate or a surcharge over LIBOR. The single financial covenant in the $500 million credit facility, which the Company is in compliance with, requires that total debt not exceed 55% of total capitalization. Annual commitment fees to support availability under the credit facility are not material. Although not the principal source of liquidity, we believe our credit facility is capable of providing significant financing flexibility at reasonable rates of interest. However, in the event of a significant deterioration in the results of our operations or cash flows, leading to deterioration in financial condition, our borrowing costs could increase and/or our ability to borrow could be restricted. We have not entered into any guarantees that could give rise to material unexpected cash requirements. The Company also maintains other lines of credit that are primarily used to support the issuance of letters of credit. Interest rates and other terms of borrowing under these lines of credit vary from country to country, depending on local market conditions. At December 31, 2014 and 2013 these lines totaled $54.6 million and $60.4 million, respectively, of which $27.1 million and $22.9 million was utilized to support letters of credit and the remaining amount was unused. The annual commitment fees associated with these lines of credit are not material. Internal cash generation together with currently available cash and investments, available borrowing facilities and credit lines, if needed, are expected to be sufficient to fund operations, the current rate of cash dividends, capital expenditures, and an increase in working capital that would be required to accommodate a higher level of business activity for the foreseeable future. We actively seek to expand by acquisition as well as through the growth of our current businesses. While a significant acquisition may require additional debt and/or equity financing, we believe that we would be able to obtain
additional financing based on our favorable historical earnings performance and strong financial position.
Pension Funding Status We have a number of funded and unfunded non-contributory U.S. and foreign defined benefit pension plans. Benefits under these plans are generally provided based on either years of service and final average pay or a specified dollar amount per year of service. The funded status of our qualified, defined benefit pension plans is dependent upon many factors including future returns on invested pension assets, the level of market interest rates, employee earnings and employee demographics. Changes in the value of the defined benefit plan assets and liabilities will affect the amount of pension expense ultimately recognized. Although differences between actuarial assumptions and actual results are no longer deferred for balance sheet purposes, deferral is still permitted for pension expense purposes. Unrecognized gains and losses in excess of an annual calculated minimum amount (the greater of 10% of the projected benefit obligation or 10% of the market value of assets) are amortized and recognized in net periodic pension cost over the average remaining service period of our active employees, which approximates 10-12 years. During 2014 and 2013, we recorded $3.9 million and $13.8 million, respectively, of pension expense related to the amortization of these unrecognized losses. We expect to record $12.1 million of expense related to unrecognized losses and prior service cost in 2015. The actual return on our pension assets in 2014 and for the past ten year period has exceeded our expected return. However, over that same period there has been a significant decline in long-term interest rates and a resulting increase in our pension liabilities which has more than offset our favorable return on plan assets. In 2014 and 2012, we contributed $23.5 million and $22.6 million, respectively, to our qualified foreign and domestic defined benefit pension plans. We contributed $3.2 million to our qualified foreign defined benefit pension plans in 2013. These contributions have improved the funded status of all of our plans. Although not required under the Pension Protection Act of 2006, the Company made a voluntary contribution to its qualified domestic defined benefit pension plan of $20.0 million in January 2015. We do not anticipate further contributions to the qualified domestic defined benefit pension plan in 2015. The Company expects to contribute approximately $3.0 million to its foreign plans in 2015. The anticipated 2015 level of pension funding is not expected to have a significant impact on our overall liquidity.
50323_10K.indd 22 2/27/15 11:56 AM
Job Name: 50323PDF Page: 50323_10K 22.p1.pdf
Process Plan: Doc6060_FileDate: 15-03-13Time: 17:08:42
Operator: ____________________________
PageMark-Color-Comp
❏ OK to proceed❏ Make corrections and proceed❏ Make corrections and show another proof
Signed: ___________________ Date: ______

HUBBELL INCORPORATED - Form 10-K 23
Assumptions The following assumptions were used to determine projected pension and other benefit obligations at the measurement date and the net periodic benefit costs for the year:
Pension Benefits Other Benefits
2014 2013 2014 2013Weighted-average assumptions used to determine benefitobligations at December 31, Discount rate 4.23% 5.04% 4.10% 4.60%Rate of compensation increase 3.15% 3.18% 3.00% 3.00%Weighted-average assumptions used to determine net periodicbenefit cost for years ended December 31, Discount rate 5.04% 4.22% 4.60% 4.20%Expected return on plan assets 6.06% 6.70% N/A N/ARate of compensation increase 3.18% 3.11% 4.50% 3.00%
At the end of each year, we estimate the expected long-term rate of return on pension plan assets based on the strategic asset allocation for our plans. In making this determination, we utilize expected rates of return for each asset class based upon current market conditions and expected risk premiums for each asset class. A one percentage point change in the expected long-term rate of return on pension fund assets would have an impact of approximately $8.4 million on 2015 pretax pension expense. The expected long-term rate of return is applied to the fair market value of pension fund assets to produce the expected return on fund assets that is included in pension expense. The difference between this expected return and the actual return on plan assets was recognized at December 31, 2014 for balance sheet purposes, but continues to be deferred for expense purposes. The net deferral of past asset gains (losses) ultimately affects future pension expense through the amortization of gains (losses) with an offsetting adjustment to Hubbell shareholders’ equity through Accumulated other comprehensive loss. At the end of each year, we determine the discount rate to be used to calculate the present value of our pension plan liabilities. For our U.S. and Canadian pension plans, this discount rate is determined by matching the expected cash flows associated with our benefit obligations to a yield curve based on high quality, fixed income debt instruments with maturities that closely match the expected funding period of our pension liabilities. This yield curve is derived using a bond matching approach which incorporates a selection of bonds that align with our projected benefit obligations. As of December 31, 2014, we used a discount rate of 4.3% for our U.S. pension plans compared to a discount rate of 5.1% used in 2013. For our Canadian pension plan, we used a discount rate of 3.95% in 2014, compared to the 4.75% discount rate used in 2013. For our UK pension plan the discount rate was derived using a yield curve fitted to the yields on AA bonds in the Barclays Capital Sterling Aggregate Corporate Index and uses sample plan cash flow data as a proxy to plan specific liability cash flows. The derived discount rate is the single discount rate equivalent to discounting these liability cash flows at the term-dependent spot rates of AA corporate bonds. This methodology resulted in a December 31, 2014 discount rate for the UK pension plan of 3.7% as compared to a discount rate of 4.6% used in 2013.
An increase of one percentage point in the discount rate would lower our 2015 pretax pension expense by approximately $8.6 million. A discount rate decline of one percentage point would increase our 2015 pretax pension expense by approximately $11.6 million.
In 2014 we changed the mortality table used to calculate the present value of our pension plan liabilities from RP-2000 to the RP-2000 with generational projection using Scale BB-2D. This mortality table was chosen after considering alternative tables including the RP-2014 projected with Scale MP-2014. We chose the RP-2000 with Scale BB-2D because it resulted in the closest match to the plans’ actual experience over the period 2009-2013. This change resulted in an approximately $40 million increase in the projected benefit obligation of our U.S. defined benefit pension plans upon remeasurement at December 31, 2014. Other Post Employment Benefits (“OPEB”) The Company also has a number of health care and life insurance benefit plans covering eligible employees who reached retirement age while working for the Company. These benefits have been discontinued for substantially all future retirees. These plans are not funded and, therefore, no assumed rate of return on assets is required. We use a similar methodology to derive the yield curve for our post employment benefit plan obligations that we use for our pension plans. As of December 31, 2014, the Company used a discount rate of 4.10% to determine the projected benefit obligation compared to a discount rate of 4.6% used in 2013. In accordance with the accounting guidance for retirement benefits, we recorded to Accumulated other comprehensive loss, within Hubbell shareholders’ equity, a charge net of tax of approximately $1.7 million in 2014 and a credit, net of tax, of approximately $0.2 million in 2013, related to the OPEB plans. Off-Balance Sheet Arrangements
Off-balance sheet arrangements are defined as any transaction, agreement or other contractual arrangement to which an entity that is not included in our consolidated results is a party, under which we, whether or not a party to the arrangement, have, or
50323_10K.indd 23 2/27/15 11:56 AM
Job Name: 50323PDF Page: 50323_10K 23.p1.pdf
Process Plan: Doc6060_FileDate: 15-03-13Time: 17:08:42
Operator: ____________________________
PageMark-Color-Comp
❏ OK to proceed❏ Make corrections and proceed❏ Make corrections and show another proof
Signed: ___________________ Date: ______

24 HUBBELL INCORPORATED - Form 10-K
in the future may have: (1) an obligation under a direct or indirect guarantee or similar arrangement, (2) a retained or contingent interest in assets or (3) an obligation or liability, including a contingent obligation or liability, to the extent that it is not fully reflected in the financial statements.
We do not have any off-balance sheet arrangements as defined above which have or are likely to have a material effect on our financial condition, results of operations or cash flows.
Contractual Obligations A summary of our contractual obligations and commitments at December 31, 2014 is as follows (in millions):
Payments due by period
Total 2015 2016-2017 2018-20192019 andthereafter
Debt obligations(a) $ 601.4 $ 1.4 $ — $ 300.0 $ 300.0Expected interest payments 146.6 28.7 57.4 29.2 31.3Operating lease obligations 52.7 13.3 17.2 8.8 13.4Retirement and other benefits(b) 206.1 7.2 14.7 14.9 169.3Purchase obligations 201.0 196.1 4.9 — —Obligations under customer incentive programs 40.5 40.5 — — —Income tax payments 5.3 5.3 — — —TOTAL $ 1,253.6 $ 292.5 $ 94.2 $ 352.9 $ 514.0
(a) Amounts exclude unamortized discount(b) Amounts above reflect projected funding related to the Company’s non-qualified defined benefit plans. Projected funding obligations of the
Company’s qualified defined benefit pension plans are excluded from the table as there are significant factors, such as the future market value of plan assets and projected investment return rates, which could cause actual funding requirements to differ materially from projected funding.
Our purchase obligations include amounts committed under legally enforceable contracts or purchase orders for goods and services with defined terms as to price, quantity, delivery and termination liability. These obligations primarily consist of inventory purchases made in the normal course of business to meet operational requirements and commitments for equipment purchases. As of December 31, 2014, we have $21.6 million of uncertain tax positions reflected in our Consolidated Balance Sheet. We are unable to make a reasonable estimate regarding the timing of settlement of these uncertain tax positions and, as a result, they have been excluded from the table. See Note 12 — Income Taxes in the Notes to Consolidated Financial Statements. Critical Accounting Estimates Note 1 — Significant Accounting Policies of the Notes to Consolidated Financial Statements describes the significant accounting policies used in the preparation of our financial statements. Use of Estimates We are required to make assumptions and estimates and apply judgments in the preparation of our financial statements that affect the reported amounts of assets and liabilities, revenues and expenses and related disclosures. We base our assumptions, estimates and judgments on historical experience, current trends and other factors deemed relevant by management. We continually review these estimates and their underlying assumptions to ensure they are appropriate for the circumstances. Changes in estimates and assumptions used by us could have a material impact on our financial results. We believe that the following estimates are among the most critical in fully understanding and evaluating our reported
financial results. These items utilize assumptions and estimates about the effect of future events that are inherently uncertain and are based on our judgment. Revenue Recognition We recognize revenue when persuasive evidence of an arrangement exists, delivery has occurred, the price is determinable and collection is probable. Product is considered delivered to the customer once it has been shipped and title and risk of loss have been transferred. The majority of our revenue is recognized at the time of shipment. Certain of our businesses account for sales discounts and allowances based on sales volumes, specific programs and customer deductions as is customary in the electrical products industry. These items primarily relate to sales volume incentives, special pricing allowances, and returned goods. This requires us to estimate at the time of sale the amounts that should not be recorded as revenue as these amounts are not expected to be collected from customers. We principally rely on historical experience, specific customer agreements, and anticipated future trends to estimate these amounts at the time of shipment. Inventory Valuation We routinely evaluate the carrying value of our inventories to ensure they are carried at the lower of cost or market value. Such evaluation is based on our judgment and use of estimates, including sales forecasts, gross margins for particular product groupings, planned dispositions of product lines, technological events and overall industry trends. In addition, the evaluation is based on changes in inventory management practices which may influence the timing of exiting products and method of disposing of excess inventory.
50323_10K.indd 24 2/27/15 11:56 AM
Job Name: 50323PDF Page: 50323_10K 24.p1.pdf
Process Plan: Doc6060_FileDate: 15-03-13Time: 17:08:42
Operator: ____________________________
PageMark-Color-Comp
❏ OK to proceed❏ Make corrections and proceed❏ Make corrections and show another proof
Signed: ___________________ Date: ______

HUBBELL INCORPORATED - Form 10-K 25
Excess inventory is generally identified by comparing future expected inventory usage to actual on-hand quantities. Inventory values are reduced for on-hand inventory in excess of pre-defined usage forecasts. Forecast usage is primarily determined by projecting historical (actual) sales and inventory usage levels forward to future periods. Changes in these estimates may necessitate future adjustments to inventory values. Customer Credit and Collections We maintain allowances for doubtful accounts receivable in order to reflect the potential uncollectability of receivables related to purchases of products on open credit. If the financial condition of our customers were to deteriorate, resulting in their inability to make required payments, we may be required to record additional allowances for doubtful accounts. Accrued Insurance We retain a significant portion of the risks associated with workers’ compensation, medical, automobile and general liability insurance. We estimate self-insurance liabilities using a number of factors, including historical claims experience, demographic factors, severity factors and other actuarial assumptions. The accrued liabilities associated with these programs are based upon our estimates of ultimate costs to settle known claims incurred but not reported as of the balance sheet date. These assumptions are periodically reviewed with a third-party actuary to determine the adequacy of these self-insurance reserves. Changes in these assumptions may necessitate future adjustments to these self-insurance liabilities. Employee Benefits Costs and Funding We sponsor domestic and foreign defined benefit pension, defined contribution and other postretirement plans. Major assumptions used in the accounting for these employee benefit plans include the discount rate, expected return on the pension fund assets, rate of increase in employee compensation levels and health care cost increase projections. These assumptions are determined based on Company data and appropriate market indicators, and are evaluated each year as of the plans’ measurement date. Further discussion of the assumptions used in 2014 and 2013 are included above under “Pension Funding Status” and in Note 10 — Retirement Benefits of the Notes to Consolidated Financial Statements. Taxes We account for income taxes in accordance with the applicable accounting guidance which requires that deferred tax assets and liabilities be recognized using enacted tax rates for the effect of temporary differences between the book and tax basis of recorded assets and liabilities. Additionally, deferred tax assets are required to be reduced by a valuation allowance if it is more-likely-than-not that some portion or all of the deferred tax asset will not be realized. The factors used to assess the likelihood of realization of deferred tax assets are the forecast of future taxable income, available tax planning strategies that could be implemented to realize the net deferred tax assets, and future reversals of deferred tax liabilities. Failure to achieve forecasted taxable income can affect the ultimate realization of net deferred tax assets.
We operate within multiple taxing jurisdictions and are subject to audit in these jurisdictions. The Internal Revenue Service (“IRS”) and other tax authorities routinely review our tax returns. These audits can involve complex issues, which may require an extended period of time to resolve. The Company records uncertain tax positions only when it has determined that it is more-likely-than-not that a tax position will be sustained upon examination by taxing authorities based on the technical merits of the position. The Company uses the criteria established in the accounting guidance to determine whether an item meets the definition of more-likely-than-not. The Company’s policy is to recognize these uncertain tax positions when the more-likely-than-not threshold is met, when the statute of limitations has expired or upon settlement. In management’s opinion, adequate provision has been made for potential adjustments arising from any examinations. See also Note 12 — Income Taxes in the Notes to Consolidated Financial Statements. Contingent Liabilities We are subject to proceedings, lawsuits, and other claims or uncertainties related to environmental, legal, product and other matters. We routinely assess the likelihood of an adverse judgment or outcome to these matters, as well as the range of potential losses. We record a liability when it is both probable that a liability has been incurred and the amount can be reasonably estimated. A determination of the reserves required, if any, is made after careful analysis, including consultations with outside advisors, where applicable. Where no amount within a range of estimates is more likely, the minimum is accrued. The required reserves may change in the future due to new developments. Valuation of Long-Lived Assets Our long-lived assets include land, buildings, equipment, molds and dies, software, goodwill and other intangible assets. Long-lived assets, other than land, goodwill and indefinite-lived intangibles, are depreciated over their estimated useful lives. The assets and liabilities of acquired businesses are recorded under the acquisition method of accounting at their estimated fair values at the dates of acquisition. Goodwill represents purchase price in excess of fair values assigned to the underlying identifiable net assets of acquired businesses. Intangible assets primarily consist of patents, tradenames and customer related intangibles.
We review depreciable long-lived assets for impairment whenever events or changes in circumstances indicate that the carrying amount may not be fully recoverable. If such a change in circumstances occurs, the related estimated future undiscounted cash flows expected to result from the use of the asset group and its eventual disposition is compared to the carrying amount. If the sum of the expected cash flows of the asset group is less than the carrying amount, an impairment charge is recorded. The impairment charge is measured as the amount by which the carrying amount exceeds the fair value of the asset. The fair value of impaired assets is determined using expected cash flow estimates, quoted market prices when available and appraisals as appropriate. We did not record any material impairment charges related to long-lived assets in 2014, 2013, or 2012. Goodwill and indefinite-lived intangible assets are reviewed annually for impairment unless circumstances dictate the need
50323_10K.indd 25 2/27/15 11:56 AM
Job Name: 50323PDF Page: 50323_10K 25.p1.pdf
Process Plan: Doc6060_FileDate: 15-03-13Time: 17:08:42
Operator: ____________________________
PageMark-Color-Comp
❏ OK to proceed❏ Make corrections and proceed❏ Make corrections and show another proof
Signed: ___________________ Date: ______

26 HUBBELL INCORPORATED - Form 10-K
for more frequent assessment. We perform our goodwill impairment testing as of April 1st of each year unless circumstances dictate the need for more frequent assessments. The accounting guidance provides entities an option of performing a qualitative assessment before performing a quantitative analysis. If the entity determines, on the basis of certain qualitative factors, that it is more-likely-than-not that the goodwill is not impaired, the entity would not need to proceed to the two step goodwill impairment testing process as prescribed in the guidance. The Company has elected to bypass the qualitative assessment and proceeded directly to the quantitative analysis. The goodwill impairment testing requires judgment, including the identification of reporting units, assigning assets and liabilities to reporting units, and determining the fair value of each reporting unit. Significant judgments required to estimate the fair value of reporting units include estimating future discounted cash flows, determining appropriate discount rates and other assumptions. We use internal discounted cash flow estimates to determine fair value. These cash flow estimates are derived from historical experience and future long-term business plans and the application of an appropriate discount rate. Changes in these estimates and assumptions could materially affect the determination of fair value and/or goodwill impairment for each reporting unit. As of April 1, 2014, our goodwill testing resulted in fair values for each reporting unit that substantially exceeded the reporting unit’s carrying value. We have not recorded any goodwill impairments since the initial adoption of the accounting guidance in 2002. The identification and measurement of impairment of indefinite-lived intangible assets involves an assessment of qualitative factors to determine whether events or circumstances indicate that it is more likely than not that an indefinite-lived intangible asset is impaired. If it is more likely than not that the asset is imparied, the fair value of the indefinite lived intangibles will be determined using discounted cash flow estimates. If the carrying value of these assets exceeds the estimated fair value, the carrying value will be reduced to the estimated fair value. We did not record any impairments related to indefinite-lived intangible assets in 2014, 2013, or 2012. Stock-Based Compensation We determine the grant date fair value of our stock-based compensation awards using either a lattice model or the Black-Scholes option pricing model. Both of these models require management to make certain assumptions with respect to selected model inputs. These inputs include assumptions for the expected term, stock volatility, dividend yield and risk-free interest rate. Changes in these inputs impact fair value and could impact our stock-based compensation expense in the future. In addition, we are required to estimate the expected forfeiture rate and recognize expense only for those awards expected to meet the service and performance vesting conditions. If our actual forfeiture rate is different from our estimate, adjustments to stock-based compensation expense may be required. See also Note 17 – Stock-Based Compensation in the Notes to Consolidated Financial Statements.
Forward-Looking Statements Some of the information included in this Management’s Discussion and Analysis of Financial Condition and Results of Operations, and elsewhere in this Form 10-K, contain “forward-looking statements” as defined by the Private Securities Litigation Reform Act of 1995. These include statements about liquidity, pension funding, capital resources, performance and results of operations and are based on our reasonable current expectations. In addition, all statements regarding anticipated growth or improvement in operating results, anticipated market conditions, restructuring activities and improvements to cost structure and operating efficiencies are forward looking. Forward-looking statements may be identified by the use of words, such as “believe”, “expect”, “anticipate”, “intend”, “depend”, “should”, “plan”, “estimated”, “predict”, “could”, “may”, “subject to”, “continues”, “growing”, “prospective”, “forecast”, “projected”, “purport”, “might”, “if”, “contemplate”, “potential”, “pending,” “target”, “goals”, “scheduled”, “will likely be”, and similar words and phrases. Discussions of strategies, plans or intentions often contain forward-looking statements. Important factors, among others, that could cause our actual results and future actions to differ materially from those described in forward-looking statements include, but are not limited to: • Changes in demand for our products, market conditions,
product quality, or product availability adversely affecting sales levels.
• Changes in markets or competition adversely affecting realization of price increases.
• Failure to achieve projected levels of efficiencies, cost savings and cost reduction measures, including those expected as a result of our restructuring activities, lean initiative and strategic sourcing plans.
• The expected benefits and the timing of other actions in connection with our enterprise resource planning system.
• Availability and costs of raw materials, purchased components, energy and freight.
• Changes in expected or future levels of operating cash flow, indebtedness and capital spending.
• General economic and business conditions in particular industries, markets or geographic regions, as well as inflationary trends.
• Regulatory issues, changes in tax laws or changes in geographic profit mix affecting tax rates and availability of tax incentives.
• A major disruption in one or more of our manufacturing or distribution facilities or headquarters, including the impact of plant consolidations and relocations.
• Changes in our relationships with, or the financial condition or performance of, key distributors and other customers, agents or business partners which could adversely affect our results of operations.
• Impact of productivity improvements on lead times, quality and delivery of product.
• Anticipated future contributions and assumptions including changes in interest rates and plan assets with respect to pensions.
50323_10K.indd 26 2/27/15 11:56 AM
Job Name: 50323PDF Page: 50323_10K 26.p1.pdf
Process Plan: Doc6060_FileDate: 15-03-13Time: 17:08:42
Operator: ____________________________
PageMark-Color-Comp
❏ OK to proceed❏ Make corrections and proceed❏ Make corrections and show another proof
Signed: ___________________ Date: ______

HUBBELL INCORPORATED - Form 10-K 27
• Adjustments to product warranty accruals in response to claims incurred, historical experiences and known costs.
• Unexpected costs or charges, certain of which might be outside of our control.
• Changes in strategy, economic conditions or other conditions outside of our control affecting anticipated future global product sourcing levels.
• Ability to carry out future acquisitions and strategic investments in our core businesses as well as the acquisition related costs.
• Unanticipated difficulties integrating acquisitions as well as the realization of expected synergies and benefits anticipated when we first enter into a transaction.
• The ability of governments to meet their financial obligations.
• Political unrest in foreign countries.
• Natural disasters.
• Failure of information technology systems or security breaches resulting in unauthorized disclosure of confidential information.
• Future repurchases of common stock under our common stock repurchase program.
• Changes in accounting principles, interpretations, or estimates.
• The outcome of environmental, legal and tax contingencies or costs compared to amounts provided for such contingencies.
• Adverse changes in foreign currency exchange rates and the potential use of hedging instruments to hedge the exposure to fluctuating rates of foreign currency exchange on inventory purchases.
• Other factors described in our SEC filings, including the “Business”, “Risk Factors” and “Quantitative and Qualitative Disclosures about Market Risk” sections in this Annual Report on Form 10-K for the year ended December 31, 2014.
Any such forward-looking statements are not guarantees of future performances and actual results, developments and business decisions may differ from those contemplated by such forward-looking statements. The Company disclaims any duty to update any forward-looking statement, all of which are expressly qualified by the foregoing, other than as required by law.
ITEM 7A Quantitative and Qualitative Disclosures about Market RiskIn the operation of our business, we have various exposures to areas of risk related to factors within and outside the control of management. Significant areas of risk and our strategies to manage the exposure are discussed below. We manufacture and/or assemble our products in the United States, Canada, Switzerland, Puerto Rico, Mexico, China, Italy, UK, Brazil and Australia and sell products in those markets as well as through offices in Singapore, China, India, Mexico, South Korea and countries in the Middle East. Hubbell also participates in joint ventures in Taiwan and Hong Kong. Shipments from non-U.S. subsidiaries as a percentage of the Company’s total net sales were 14% in 2014, 16% in 2013 and 17% in 2012, with the Canadian and UK operations representing approximately 31% and 26%, respectively, of 2014 total international net sales. Switzerland, Brazil and Mexico each represent 10% of 2014 total international sales. As such, our operating results could be affected by changes in foreign currency exchange rates or weak economic conditions in the foreign markets in which we sell our products. To manage this exposure, we closely monitor the working capital requirements of our international units and may enter into forward foreign exchange contracts. Further discussion of forward exchange contracts can be found in Note 14 – Fair Value Measurement in the Notes to Consolidated Financial Statements. Product purchases representing approximately 15% of our net sales are sourced from unaffiliated suppliers located outside the United States, primarily in China and other Asian countries, Europe and Brazil. We are continuously seeking to expand this
activity, particularly related to purchases from low cost areas of the world. Foreign sourcing of products may result in unexpected fluctuations in product cost or increased risk of business interruption due to lack of product or component availability due to any one of the following: • Political or economic uncertainty in the source country
• Fluctuations in the rate of exchange between the U.S. dollar and the currencies of the source countries
• Increased logistical complexity including supply chain interruption or delay, port of departure or entry disruption and overall time to market
• Loss of proprietary information
• Product quality issues outside the control of the Company
We have developed plans that address many of these risks. Such actions include careful selection of products to be outsourced and the suppliers selected; ensuring multiple sources of supply; limiting concentrations of activity by port, broker, freight forwarder, etc.; processes related to quality control; and maintaining control over operations, technologies and manufacturing deemed to provide competitive advantage. Many of our businesses have a dependency on certain basic raw materials needed to produce their products including steel, aluminum, brass, copper, bronze, plastics, phenols, zinc, nickel, elastomers and petrochemicals as well as purchased electrical and electronic components. Our financial results could be
50323_10K.indd 27 2/27/15 11:56 AM
Job Name: 50323PDF Page: 50323_10K 27.p1.pdf
Process Plan: Doc6060_FileDate: 15-03-13Time: 17:08:42
Operator: ____________________________
PageMark-Color-Comp
❏ OK to proceed❏ Make corrections and proceed❏ Make corrections and show another proof
Signed: ___________________ Date: ______

28 HUBBELL INCORPORATED - Form 10-K
affected by the availability and changes in prices of these materials and components. Certain of these materials are sourced from a limited number of suppliers. These materials are also key source materials for many other companies in our industry and within the universe of industrial manufacturers in general. As such, in periods of rising demand for these materials, we may experience both increased costs and/or limited supply. These conditions can potentially result in our inability to acquire these key materials on a timely basis to produce our products and satisfy our incoming sales orders. Similarly, the cost of these materials can rise suddenly and result in materially higher costs of producing our products. We believe we have adequate primary and secondary sources of supply for each of our key materials and that, in periods of rising prices, we expect to recover a majority of the increased cost in the form of higher selling prices. However, recoveries typically lag the effect of cost increases due to the nature of our markets. Our financial results are subject to interest rate fluctuations to the extent there is a difference between the amount of our interest-earning assets and the amount of interest-bearing liabilities. The principal objectives of our investment management activities are to preserve capital while earning net investment income that is commensurate with acceptable levels
of interest rate, default and liquidity risk taking into account our funding needs. As part of our investment management strategy, we may use derivative financial products such as interest rate hedges and interest rate swaps. From time to time or when required, we issue commercial paper, which exposes us to changes in interest rates. Our cash position includes amounts denominated in foreign currencies. We manage our worldwide cash requirements by considering available funds held by our subsidiaries and the cost effectiveness with which these funds can be accessed. We continually evaluate risk retention and insurance levels for product liability, property damage and other potential exposures to risk. We devote significant effort to maintaining and improving safety and internal control programs, which are intended to reduce our exposure to certain risks. We determine the level of insurance coverage and the likelihood of a loss and believe that the current levels of risk retention are consistent with those of comparable companies in the industries in which we operate. There can be no assurance that we will not incur losses beyond the limits of our insurance. However, our liquidity, financial position and profitability are not expected to be materially affected by the levels of risk retention that we accept.
The following table presents cost information related to fixed rate interest risk sensitive instruments by maturity at December 31, 2014 (dollars in millions):
2015 2016 2017 2018 2019 Thereafter TotalFair Value
12/31/14ASSETS Available-for-sale investments $ 7.7 $ 7.0 $ 3.8 $ 8.9 $ 7.2 $ 7.9 $ 42.5 $ 43.0Avg. interest rate 4.56% 5.00% 5.00% 5.09% 5.00% 4.86% LIABILITIES Long-term debt $ — $ — $ — $ 299.2 $ — $ 298.4 $ 597.6 $ 645.1Avg. interest rate — — — 5.95% —% 3.625%
We use derivative financial instruments only if they are matched with a specific asset, liability, or proposed future transaction. We do not speculate or use leverage when trading a financial derivative product. See also Note 6 – Investments and Note 11 – Debt in the Notes to Consolidated Financial Statements.
50323_10K.indd 28 2/27/15 11:56 AM
Job Name: 50323PDF Page: 50323_10K 28.p1.pdf
Process Plan: Doc6060_FileDate: 15-03-13Time: 17:08:43
Operator: ____________________________
PageMark-Color-Comp
❏ OK to proceed❏ Make corrections and proceed❏ Make corrections and show another proof
Signed: ___________________ Date: ______

HUBBELL INCORPORATED - Form 10-K 29
ITEM 8 Financial Statements and Supplementary Data
Financial Statement Schedule
All other schedules are omitted because they are not applicable or the required information is shown in the consolidated financial statements or notes thereto.
Reports of Management . . . . . . . . . . . . . . . . . . . . . . . . . . . . . . . . . . . . . . . . . . . . . . . . . . . . . . . . . . . . . . . . . . 30
Report of Independent Registered Public Accounting Firm . . . . . . . . . . . . . . . . . . . . . . . . . . . . . . . . . . . . . . 31
Consolidated Statement of Income . . . . . . . . . . . . . . . . . . . . . . . . . . . . . . . . . . . . . . . . . . . . . . . . . . . . . . . . . 32
Consolidated Statement of Comprehensive Income . . . . . . . . . . . . . . . . . . . . . . . . . . . . . . . . . . . . . . . . . . . . 32
Consolidated Balance Sheet . . . . . . . . . . . . . . . . . . . . . . . . . . . . . . . . . . . . . . . . . . . . . . . . . . . . . . . . . . . . . . . 33
Consolidated Statement of Cash Flows . . . . . . . . . . . . . . . . . . . . . . . . . . . . . . . . . . . . . . . . . . . . . . . . . . . . . . 34
Consolidated Statement of Changes in Equity . . . . . . . . . . . . . . . . . . . . . . . . . . . . . . . . . . . . . . . . . . . . . . . . 35
Notes to Consolidated Financial Statements . . . . . . . . . . . . . . . . . . . . . . . . . . . . . . . . . . . . . . . . . . . . . . . . . 36
Valuation and Qualifying Accounts and Reserves (Schedule II) . . . . . . . . . . . . . . . . . . . . . . . . . . . . . . . . . . . . . . . . . 75
50323_10K.indd 29 2/27/15 11:56 AM
Job Name: 50323PDF Page: 50323_10K 29.p1.pdf
Process Plan: Doc6060_FileDate: 15-03-13Time: 17:08:43
Operator: ____________________________
PageMark-Color-Comp
❏ OK to proceed❏ Make corrections and proceed❏ Make corrections and show another proof
Signed: ___________________ Date: ______

30 HUBBELL INCORPORATED - Form 10-K
Reports of Management
Report on Management’s Responsibility for Financial Statements
Our management is responsible for the preparation, integrity and fair presentation of its published financial statements. The financial statements have been prepared in accordance with accounting principles generally accepted in the United States of America and include amounts based on informed judgments made by management. We believe it is critical to provide investors and other users of our financial statements with information that is relevant, objective, understandable and timely, so that they can make informed decisions. As a result, we have established and maintain systems and practices and internal control processes designed to provide reasonable, but not absolute, assurance that transactions are properly executed and recorded and that our policies and procedures are carried out appropriately. Management strives to recruit, train and retain high quality people to ensure that controls are designed, implemented and maintained in a high-quality, reliable manner.
Our independent registered public accounting firm audited our financial statements and the effectiveness of our internal control over financial reporting in accordance with standards established by the Public Company Accounting Oversight Board (United States). Their report appears on the next page within this Annual Report on Form 10-K. Our Board of Directors normally meets nine times per year to provide oversight, to review corporate strategies and operations, and to assess management’s conduct of the business. The Audit Committee of our Board of Directors is comprised of at least three individuals all of whom must be “independent” under current New York Stock Exchange listing standards and regulations adopted by the SEC under the federal securities laws. The Audit Committee meets regularly with our internal auditors and independent registered public accounting firm, as well as management to review, among other matters, accounting, auditing, internal controls and financial reporting issues and practices. Both the internal auditors and independent registered public accounting firm have full, unlimited access to the Audit Committee.
Management’s Annual Report on Internal Control over Financial Reporting
Management is responsible for establishing and maintaining adequate systems of internal control over financial reporting as defined by Rules 13a-15(f) and 15d-15(f) under the Securities Exchange Act of 1934. Our internal control over financial reporting is designed to provide reasonable assurance regarding the reliability of financial reporting and the preparation of financial statements for external reporting purposes in accordance with generally accepted accounting principles. Because of its inherent limitations, internal control over financial reporting may not prevent or detect misstatements. Management has assessed the effectiveness of our internal control over financial reporting as of December 31, 2014. In
making this assessment, management used the criteria set forth in Internal Control-Integrated Framework (2013 framework) issued by the Committee of Sponsoring Organizations of the Treadway Commission ("COSO"). Based on this assessment, management concluded that our internal control over financial reporting was effective at a reasonable assurance level as of December 31, 2014. The effectiveness of our internal control over financial reporting as of December 31, 2014 has been audited by PricewaterhouseCoopers LLP, our independent registered public accounting firm as stated in their report which is included on the next page within this Annual Report on Form 10-K.
/s/ DAVID G. NORD /s/ WILLIAM R. SPERRYDavid G. Nord William R. SperryChairman of the Board, President andChief Executive Officer
Senior Vice Presidentand Chief Financial Officer
50323_10K.indd 30 2/27/15 11:56 AM
Job Name: 50323PDF Page: 50323_10K 30.p1.pdf
Process Plan: Doc6060_FileDate: 15-03-13Time: 17:08:43
Operator: ____________________________
PageMark-Color-Comp
❏ OK to proceed❏ Make corrections and proceed❏ Make corrections and show another proof
Signed: ___________________ Date: ______

HUBBELL INCORPORATED - Form 10-K 31
Report of Independent Registered Public Accounting Firm To the Board of Directors and Shareholders of Hubbell Incorporated: In our opinion, the consolidated financial statements listed in the accompanying index present fairly, in all material respects, the financial position of Hubbell Incorporated and its subsidiaries (the “Company”) at December 31, 2014 and 2013, and the results of their operations and their cash flows for each of the three years in the period ended December 31, 2014 in conformity with accounting principles generally accepted in the United States of America. In addition, in our opinion, the financial statement schedule listed in the accompanying index presents fairly, in all material respects, the information set forth therein when read in conjunction with the related consolidated financial statements. Also in our opinion, the Company maintained, in all material respects, effective internal control over financial reporting as of December 31, 2014, based on criteria established in Internal Control-Integrated Framework (2013 framework) issued by the Committee of Sponsoring Organizations of the Treadway Commission ("COSO"). The Company’s management is responsible for these financial statements and financial statement schedule, for maintaining effective internal control over financial reporting and for its assessment of the effectiveness of internal control over financial reporting, included in the accompanying Management’s Annual Report on Internal Control over Financial Reporting. Our responsibility is to express opinions on these financial statements, on the financial statement schedule, and on the Company’s internal control over financial reporting based on our integrated audits. We conducted our audits in accordance with the standards of the Public Company Accounting Oversight Board (United States). Those standards require that we plan and perform the audits to obtain reasonable assurance about whether the financial statements are free of material misstatement and whether effective internal control over financial reporting was maintained in all material respects. Our audits of the financial statements included examining, on a test basis, evidence supporting the amounts and disclosures in the financial statements, assessing the accounting principles used and significant estimates made by management, and evaluating the overall financial statement presentation.
Our audit of internal control over financial reporting included obtaining an understanding of internal control over financial reporting, assessing the risk that a material weakness exists, and testing and evaluating the design and operating effectiveness of internal control based on the assessed risk. Our audits also included performing such other procedures as we considered necessary in the circumstances. We believe that our audits provide a reasonable basis for our opinions. A company’s internal control over financial reporting is a process designed to provide reasonable assurance regarding the reliability of financial reporting and the preparation of financial statements for external purposes in accordance with generally accepted accounting principles. A company’s internal control over financial reporting includes those policies and procedures that (i) pertain to the maintenance of records that, in reasonable detail, accurately and fairly reflect the transactions and dispositions of the assets of the company; (ii) provide reasonable assurance that transactions are recorded as necessary to permit preparation of financial statements in accordance with generally accepted accounting principles, and that receipts and expenditures of the company are being made only in accordance with authorizations of management and directors of the company; and (iii) provide reasonable assurance regarding prevention or timely detection of unauthorized acquisition, use, or disposition of the company’s assets that could have a material effect on the financial statements. Because of its inherent limitations, internal control over financial reporting may not prevent or detect misstatements. Also, projections of any evaluation of effectiveness to future periods are subject to the risk that controls may become inadequate because of changes in conditions, or that the degree of compliance with the policies or procedures may deteriorate. /s/ PricewaterhouseCoopers LLP Hartford, Connecticut February 19, 2015
50323_10K.indd 31 2/27/15 11:56 AM
Job Name: 50323PDF Page: 50323_10K 31.p1.pdf
Process Plan: Doc6060_FileDate: 15-03-13Time: 17:08:43
Operator: ____________________________
PageMark-Color-Comp
❏ OK to proceed❏ Make corrections and proceed❏ Make corrections and show another proof
Signed: ___________________ Date: ______

32 HUBBELL INCORPORATED - Form 10-K
Consolidated Statement of Income Year Ended December 31,(in millions, except per share amounts) 2014 2013 2012Net sales $ 3,359.4 $ 3,183.9 $ 3,044.4Cost of goods sold 2,250.4 2,113.4 2,032.2Gross profit 1,109.0 1,070.5 1,012.2Selling & administrative expenses 591.6 562.9 540.4Operating income 517.4 507.6 471.8
Interest expense (31.2) (30.8) (30.8)Investment income 1.1 1.3 1.8Other expense, net (1.8) (4.3) (1.0)
Total other expense (31.9) (33.8) (30.0)Income before income taxes 485.5 473.8 441.8
Provision for income taxes 158.3 144.0 139.7Net income 327.2 329.8 302.1Less: Net income attributable to noncontrolling interest 1.9 3.3 2.4NET INCOME ATTRIBUTABLE TO HUBBELL $ 325.3 $ 326.5 $ 299.7Earnings per share
Basic $ 5.51 $ 5.51 $ 5.05Diluted $ 5.48 $ 5.47 $ 5.00
See notes to consolidated financial statements.
Consolidated Statement of Comprehensive Income
Year Ended December 31,(in millions) 2014 2013 2012Net income $ 327.2 $ 329.8 $ 302.1Other comprehensive (loss) income:
Foreign currency translation adjustments (35.7) (15.0) 8.3Pension and post retirement benefit plans’ service costs and net actuarial(losses) gains, net of taxes of $33.9, $(38.7) and $(14.2) (57.7) 63.1 23.6Unrealized loss on investments, net of taxes of $0.0, $0.2 and $0.1 (0.1) (0.3) (0.3)Unrealized gains (losses) on cash flow hedges, net of taxes of $(0.1),$(0.1) and $0.2 0.2 0.3 (0.3)
Other comprehensive (loss) income (93.3) 48.1 31.3Comprehensive income 233.9 377.9 333.4Less: Comprehensive income attributable to noncontrolling interest 1.9 3.3 2.4COMPREHENSIVE INCOME ATTRIBUTABLE TO HUBBELL $ 232.0 $ 374.6 $ 331.0
See notes to consolidated financial statements.
50323_10K.indd 32 2/27/15 11:56 AM
Job Name: 50323PDF Page: 50323_10K 32.p1.pdf
Process Plan: Doc6060_FileDate: 15-03-13Time: 17:08:43
Operator: ____________________________
PageMark-Color-Comp
❏ OK to proceed❏ Make corrections and proceed❏ Make corrections and show another proof
Signed: ___________________ Date: ______

HUBBELL INCORPORATED - Form 10-K 33
Consolidated Balance Sheet
At December 31,(In millions, except share amounts) 2014 2013ASSETS Current Assets Cash and cash equivalents $ 653.9 $ 740.7Short-term investments 7.8 10.1Accounts receivable, net 469.8 440.9Inventories, net 441.8 385.7Deferred taxes and other 56.1 55.0Total Current Assets 1,629.4 1,632.4Property, Plant, and Equipment, net 401.2 377.1Other Assets Investments 44.1 35.8Goodwill 874.7 800.4Intangible assets, net 322.8 286.6Other long-term assets 50.6 54.9TOTAL ASSETS $ 3,322.8 $ 3,187.2LIABILITIES AND EQUITY Current Liabilities Short-term debt $ 1.4 $ 0.3Accounts payable 244.0 225.9Accrued salaries, wages and employee benefits 76.0 74.7Accrued insurance 47.8 41.8Other accrued liabilities 130.0 124.3Total Current Liabilities 499.2 467.0Long-term Debt 597.6 597.2Other Non-Current Liabilities 290.3 208.2TOTAL LIABILITIES 1,387.1 1,272.4Commitments and Contingencies (see Note 15)Hubbell Shareholders’ Equity Common stock, par value $.01
Class A - Authorized 50,000,000 shares, outstanding 7,167,506 and 7,167,506 shares 0.1 0.1Class B - Authorized 150,000,000 shares, outstanding 51,328,974 and 52,005,492 shares 0.5 0.5
Additional paid-in capital 146.7 236.6Retained earnings 1,944.1 1,740.2Accumulated other comprehensive loss (164.3) (71.0)Total Hubbell Shareholders’ Equity 1,927.1 1,906.4Noncontrolling interest 8.6 8.4Total Equity 1,935.7 1,914.8TOTAL LIABILITIES AND EQUITY $ 3,322.8 $ 3,187.2
See notes to consolidated financial statements.
50323_10K.indd 33 2/27/15 11:56 AM
Job Name: 50323PDF Page: 50323_10K 33.p1.pdf
Process Plan: Doc6060_FileDate: 15-03-13Time: 17:08:43
Operator: ____________________________
PageMark-Color-Comp
❏ OK to proceed❏ Make corrections and proceed❏ Make corrections and show another proof
Signed: ___________________ Date: ______

34 HUBBELL INCORPORATED - Form 10-K
Consolidated Statement of Cash Flows
Year Ended December 31,(In millions) 2014 2013 2012Cash Flows from Operating Activities Net income $ 327.2 $ 329.8 $ 302.1Adjustments to reconcile net income to net cash provided byoperating activities: Depreciation and amortization 79.2 70.6 66.8Deferred income taxes 30.3 13.3 27.5Stock-based compensation 16.4 14.3 15.8Tax benefit on stock-based awards (9.2) (8.4) (15.6)(Gain) loss on sale of assets (1.3) 0.2 0.4Changes in assets and liabilities, net of acquisitions: Increase in accounts receivable (17.8) (30.9) (1.8)Increase in inventories (46.9) (25.9) (11.8)Increase (decrease) in current liabilities 20.0 1.7 (31.7)Changes in other assets and liabilities, net 15.4 15.8 20.7Contributions to qualified defined benefit pension plans (23.5) (3.2) (22.6)Other, net 1.7 4.5 (0.7)NET CASH PROVIDED BY OPERATING ACTIVITIES 391.5 381.8 349.1Cash Flows from Investing Activities Capital expenditures (60.3) (58.8) (49.1)Acquisitions, net of cash acquired (183.8) (96.5) (90.7)Receipt of escrow funds from acquisition — — 6.8Purchases of available-for-sale investments (17.6) (11.1) (9.5)Proceeds from sales of available-for-sale investments 12.1 10.5 19.4Proceeds from disposition of assets 6.0 3.4 4.8Other, net 1.0 1.4 2.2NET CASH USED IN INVESTING ACTIVITIES (242.6) (151.1) (116.1)Cash Flows from Financing Activities Issuance of short-term debt 2.0 0.4 0.2Payment of short-term debt (0.8) (0.1) (3.1)Payment of dividends (121.2) (109.5) (122.3)Payment of dividends to noncontrolling interest (1.7) (1.5) (1.3)Proceeds from exercise of stock options 2.4 2.4 24.8Tax benefit on stock-based awards 9.2 8.4 15.6Acquisition of common shares (105.5) (31.0) (75.6)NET CASH USED IN FINANCING ACTIVITIES (215.6) (130.9) (161.7)Effect of foreign currency exchange rate changes on cash and cashequivalents (20.1) (4.1) 4.1Increase in cash and cash equivalents (86.8) 95.7 75.4Cash and cash equivalents, beginning of year 740.7 645.0 569.6Cash and cash equivalents, end of year $ 653.9 $ 740.7 $ 645.0
See notes to consolidated financial statements.
50323_10K.indd 34 2/27/15 11:56 AM
Job Name: 50323PDF Page: 50323_10K 34.p1.pdf
Process Plan: Doc6060_FileDate: 15-03-13Time: 17:08:43
Operator: ____________________________
PageMark-Color-Comp
❏ OK to proceed❏ Make corrections and proceed❏ Make corrections and show another proof
Signed: ___________________ Date: ______
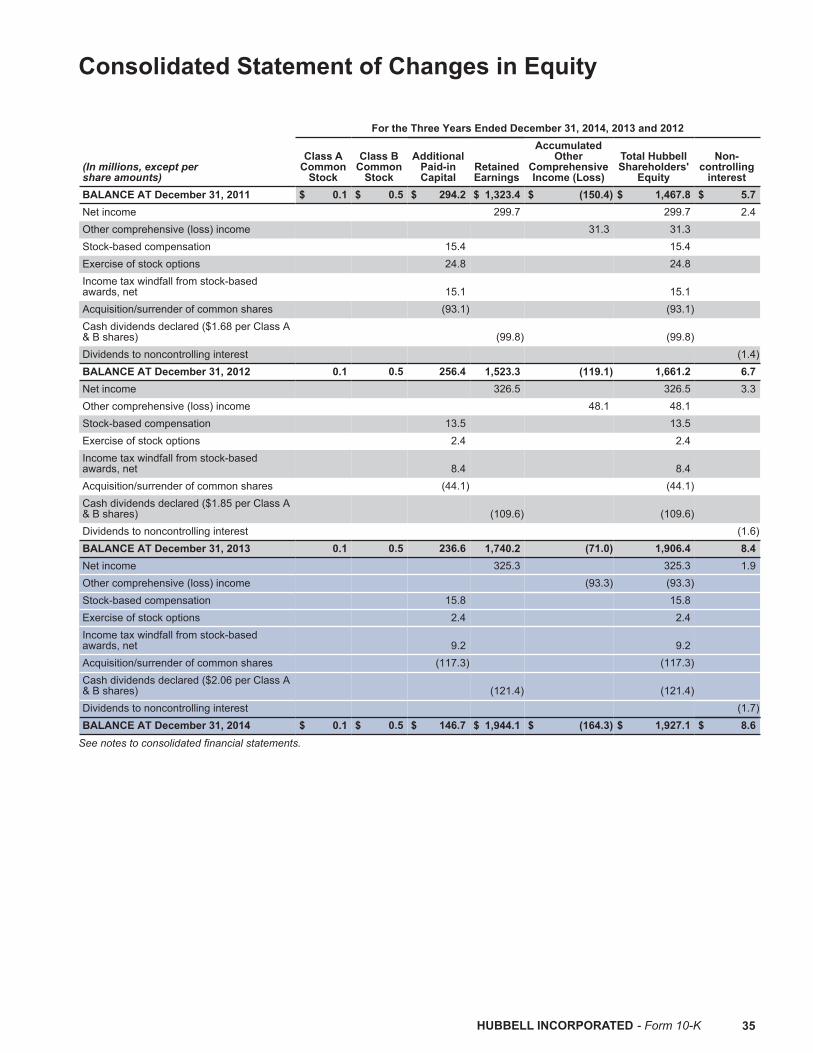
HUBBELL INCORPORATED - Form 10-K 35
Consolidated Statement of Changes in Equity For the Three Years Ended December 31, 2014, 2013 and 2012
(In millions, except pershare amounts)
Class ACommon
Stock
Class BCommon
Stock
AdditionalPaid-inCapital
RetainedEarnings
AccumulatedOther
ComprehensiveIncome (Loss)
Total HubbellShareholders'
Equity
Non-controlling
interestBALANCE AT December 31, 2011 $ 0.1 $ 0.5 $ 294.2 $ 1,323.4 $ (150.4) $ 1,467.8 $ 5.7Net income 299.7 299.7 2.4Other comprehensive (loss) income 31.3 31.3 Stock-based compensation 15.4 15.4 Exercise of stock options 24.8 24.8 Income tax windfall from stock-basedawards, net 15.1 15.1 Acquisition/surrender of common shares (93.1) (93.1) Cash dividends declared ($1.68 per Class A& B shares) (99.8) (99.8) Dividends to noncontrolling interest (1.4)BALANCE AT December 31, 2012 0.1 0.5 256.4 1,523.3 (119.1) 1,661.2 6.7Net income 326.5 326.5 3.3Other comprehensive (loss) income 48.1 48.1 Stock-based compensation 13.5 13.5 Exercise of stock options 2.4 2.4 Income tax windfall from stock-basedawards, net 8.4 8.4 Acquisition/surrender of common shares (44.1) (44.1) Cash dividends declared ($1.85 per Class A& B shares) (109.6) (109.6) Dividends to noncontrolling interest (1.6)BALANCE AT December 31, 2013 0.1 0.5 236.6 1,740.2 (71.0) 1,906.4 8.4Net income 325.3 325.3 1.9Other comprehensive (loss) income (93.3) (93.3) Stock-based compensation 15.8 15.8 Exercise of stock options 2.4 2.4 Income tax windfall from stock-basedawards, net 9.2 9.2 Acquisition/surrender of common shares (117.3) (117.3) Cash dividends declared ($2.06 per Class A& B shares) (121.4) (121.4) Dividends to noncontrolling interest (1.7)BALANCE AT December 31, 2014 $ 0.1 $ 0.5 $ 146.7 $ 1,944.1 $ (164.3) $ 1,927.1 $ 8.6
See notes to consolidated financial statements.
50323_10K.indd 35 2/27/15 11:56 AM
Job Name: 50323PDF Page: 50323_10K 35.p1.pdf
Process Plan: Doc6060_FileDate: 15-03-13Time: 17:08:43
Operator: ____________________________
PageMark-Color-Comp
❏ OK to proceed❏ Make corrections and proceed❏ Make corrections and show another proof
Signed: ___________________ Date: ______
36 HUBBELL INCORPORATED - Form 10-K
Notes to Consolidated Financial Statements
NOTE 1 Significant Accounting Policies
Basis of Presentation The accompanying consolidated financial statements of the Company have been prepared in accordance with accounting principles generally accepted in the United States of America (“GAAP”). Principles of Consolidation The Consolidated Financial Statements include all wholly owned subsidiaries. All significant intercompany balances and transactions have been eliminated. The Company participates in two joint ventures, one of which is accounted for using the equity method, the other has been consolidated in accordance with the consolidation accounting guidance. An analysis is performed to determine which reporting entity, if any, has a controlling financial interest in a variable interest entity (“VIE”) with a primarily qualitative analysis. The qualitative analysis is based on identifying the party that has both the power to direct the activities that most significantly impact the VIE’s economic performance (the “power criterion”) and the obligation to absorb losses from or the right to receive benefits of the VIE that could potentially be significant to the VIE (the “losses/benefit criterion”). The party that meets both these criteria is deemed to have a controlling financial interest. The party with the controlling financial interest is considered to be the primary beneficiary and as a result is required to consolidate the VIE. The Company has a 50% interest in a joint venture in Hong Kong, established as Hubbell Asia Limited (“HAL”). The principal objective of HAL is to manage the operations of its wholly-owned manufacturing company in China. Under the accounting guidance, the Company is the primary beneficiary of HAL and as a result consolidates HAL. This determination is based on the fact that HAL’s sole business purpose is to manufacture product exclusively for the Company (the power criterion) and the Company is financially responsible for ensuring HAL maintains a fixed operating margin (the losses/benefit criterion). The consolidation of HAL is not material to the Company’s consolidated financial statements. Use of Estimates The preparation of financial statements in accordance with GAAP requires management to make estimates and assumptions that affect the reported amounts in the Consolidated Financial Statements and accompanying Notes to Consolidated Financial Statements. Actual results could differ from the estimates that are used. Revenue Recognition The Company recognizes revenue when persuasive evidence of an arrangement exists, delivery has occurred, the price is fixed and determinable and collection is probable. Product is considered delivered to the customer once it has been shipped
and title and risk of loss have been transferred. The majority of the Company’s revenue is recognized at the time of shipment. The Company recognizes less than one percent of total annual consolidated net revenue from post shipment obligations and service contracts, primarily within the Electrical segment. Revenue is recognized under these contracts when the service is completed and all conditions of sale have been met. In addition, within the Electrical segment, certain businesses sell large and complex equipment which requires construction and assembly and occasionally has long lead times. It is customary in these businesses to require a portion of the selling price to be paid in advance of construction. These payments are treated as deferred revenue and are classified in Other accrued liabilities in the Consolidated Balance Sheet. Once the equipment is shipped to the customer and meets the revenue recognition criteria, the deferred revenue is recognized in the Consolidated Statement of Income. Further, certain of our businesses provide for sales discounts and allowances based on sales volumes, specific programs and customer deductions, as is customary in the electrical products industry. These items primarily relate to sales volume incentives, special pricing allowances, and returned goods. Sales volume incentives represent rebates with specific sales volume targets for specific customers. Certain distributors qualify for price rebates by subsequently reselling the Company’s products into select channels of end users. Following a distributor’s sale of an eligible product, the distributor submits a claim for a price rebate. Customers also have a right to return goods under certain circumstances which are reasonably estimable by affected businesses. Customer returns have historically ranged from 1%-3% of gross sales. These arrangements require us to estimate at the time of sale the amounts that should not be recorded as revenue as these amounts are not expected to be collected from customers. The Company principally relies on historical experience, specific customer agreements and anticipated future trends to estimate these amounts at the time of shipment. Shipping and Handling Fees and Costs The Company records shipping and handling costs as part of Cost of goods sold in the Consolidated Statement of Income. Any amounts billed to customers for reimbursement of shipping and handling are included in Net sales in the Consolidated Statement of Income. Foreign Currency Translation The assets and liabilities of international subsidiaries are translated to U.S. dollars at exchange rates in effect at the end of the year, and income and expense items are translated at average exchange rates in effect during the year. The effects of exchange rate fluctuations on the translated amounts of foreign currency assets and liabilities are included as translation adjustments in Accumulated other comprehensive loss within
50323_10K.indd 36 2/27/15 11:56 AM
Job Name: 50323PDF Page: 50323_10K 36.p1.pdf
Process Plan: Doc6060_FileDate: 15-03-13Time: 17:08:43
Operator: ____________________________
PageMark-Color-Comp
❏ OK to proceed❏ Make corrections and proceed❏ Make corrections and show another proof
Signed: ___________________ Date: ______

HUBBELL INCORPORATED - Form 10-K 37
Hubbell shareholders’ equity. Gains and losses from foreign currency transactions are included in results of operations. Cash and Cash Equivalents The carrying value of cash equivalents approximates fair value. Cash equivalents consist of highly liquid investments with original maturities to the company of three months or less. Investments Investments in debt and equity securities are classified by individual security as available-for-sale, held-to-maturity or trading investments. Our available-for-sale investments, consisting of municipal bonds, are carried on the balance sheet at fair value with current period adjustments to carrying value recorded in Accumulated other comprehensive loss within Hubbell shareholders’ equity, net of tax. Realized gains and losses are recorded in income in the period of sale. The Company’s trading investments are carried on the balance sheet at fair value and consist primarily of debt and equity mutual funds. Gains and losses associated with these trading investments are reflected in the results of operations. The Company did not have any investments classified as held-to-maturity as of December 31, 2014 and 2013. Accounts Receivable and Allowances Trade accounts receivable are recorded at the invoiced amount and generally do not bear interest. The allowance for doubtful accounts is based on an estimated amount of probable credit losses in existing accounts receivable. The allowance is calculated based upon a combination of historical write-off experience, fixed percentages applied to aging categories and specific identification based upon a review of past due balances and problem accounts. Account balances are charged off against the allowance when it is determined that internal collection efforts should no longer be pursued. The Company also maintains a reserve for credit memos, cash discounts and product returns which are principally calculated based upon historical experience, specific customer agreements, as well as anticipated future trends. Inventories Inventories are stated at the lower of cost or market value. Approximately 74% of total net inventory value is determined utilizing the last-in, first-out (LIFO) method of inventory accounting. The cost of foreign inventories and certain domestic inventories is determined utilizing average cost or first-in, first-out (FIFO) methods of inventory accounting. Reserves for excess and obsolete inventory are provided based on current assessments about future demand compared to on-hand quantities. Property, Plant, and Equipment Property, plant, and equipment values are stated at cost less accumulated depreciation. Maintenance and repair expenditures that do not significantly increase the life of an asset are charged to expense when incurred. Property, plant, and equipment placed in service prior to January 1, 1999 are depreciated over their estimated useful lives, principally using
accelerated methods. Assets placed in service subsequent to January 1, 1999 are depreciated over their estimated useful lives, using straight-line methods. Leasehold improvements are amortized over the shorter of their economic lives or the lease term. Gains and losses arising on the disposal of property, plant and equipment are included in Operating income in the Consolidated Statement of Income. Capitalized Computer Software Costs Capitalized computer software costs, net of amortization, were $12.7 million and $10.9 million at December 31, 2014 and 2013, respectively. This balance is reflected in Other long-term assets in the Consolidated Balance Sheet. Capitalized computer software is for internal use and costs primarily consist of purchased materials and services. Software is amortized on a straight-line basis over appropriate periods, generally five years. The Company recorded amortization expense of $4.3 million in both 2014 and 2013, and $3.5 million in 2012 relating to capitalized computer software. Goodwill and Other Intangible Assets Goodwill represents purchase price in excess of fair values of the underlying net assets of acquired companies. Indefinite-lived intangible assets and goodwill are subject to annual impairment testing using the specific guidance and criteria described in the accounting guidance. The Company performs its goodwill impairment testing as of April 1st of each year, unless circumstances dictate the need for more frequent assessments. The accounting guidance provides entities an option of performing a qualitative assessment before performing a quantitative analysis. If the entity determines, on the basis of certain qualitative factors, that it is more-likely-than-not that the goodwill is not impaired, the entity would not need to proceed to the two step goodwill impairment testing process as prescribed in the guidance. The Company elected to bypass the qualitative assessment and proceeded directly to the quantitative analysis. Step 1 compares the fair value of the Company’s reporting units to their carrying values. If the fair value of the reporting unit exceeds its carrying value, no further analysis is necessary. If the carrying value of the reporting unit exceeds its fair value, Step 2 must be completed to quantify the amount of impairment. Goodwill impairment testing requires judgment, including the identification of reporting units, assigning assets and liabilities to reporting units and determining the fair value of each reporting unit. Significant judgments required to estimate the fair value of reporting units include estimating future cash flows, determining appropriate discount rates and other assumptions. The Company uses internal discounted cash flow estimates to determine fair value. These cash flow estimates are derived from historical experience and future long-term business plans and the application of an appropriate discount rate. Changes in these estimates and assumptions could materially affect the determination of fair value and/or goodwill impairment for each reporting unit. The Company’s estimated aggregate fair value of its reporting units are reasonable when compared to the Company’s market capitalization on the valuation date. As of April 1, 2014, the impairment testing resulted in implied fair values for each reporting unit that exceeded the reporting unit’s carrying value, including goodwill. The Company did not
50323_10K.indd 37 2/27/15 11:56 AM
Job Name: 50323PDF Page: 50323_10K 37.p1.pdf
Process Plan: Doc6060_FileDate: 15-03-13Time: 17:08:43
Operator: ____________________________
PageMark-Color-Comp
❏ OK to proceed❏ Make corrections and proceed❏ Make corrections and show another proof
Signed: ___________________ Date: ______
38 HUBBELL INCORPORATED - Form 10-K
have any reporting units at risk of failing Step 1 of the impairment test as the excess of the estimated fair value over carrying value (expressed as a percentage of carrying value) ranged from approximately 100% to approximately 400% for the respective reporting units. Additionally, the Company did not have any reporting units with zero or negative carrying amounts. The Company has not recorded any goodwill impairments since the initial adoption of the accounting guidance in 2002. The Company’s intangible assets consist primarily of patents, tradenames and customer relationships. Intangible assets with definite lives are being amortized over periods generally ranging from 5-30 years. These definite lived intangibles are tested for impairment whenever events or circumstances indicate that the carrying amount of an asset (asset group) may not be recoverable. An impairment loss is recognized when the carrying amount of an asset exceeds the estimated undiscounted cash flows used in determining the fair value of the asset. The Company did not record any impairments related to its definite lived intangible assets in 2014, 2013 or 2012. The Company also has some tradenames that are considered to be indefinite-lived intangible assets. These indefinite-lived are not amortized and are tested for impairment annually, unless circumstances dictate the need for more frequent assessment. The accounting guidance related to testing indefinite-lived intangible assets for impairment provides entities an option of performing a qualitative assessment before calculating the fair value of the asset. If the entity determines, on the basis of certain qualitative factors, that it is more-likely-than-not that the asset is not impaired, the entity would not need to calculate the fair value of the asset. The Company performed the qualitative assessment, which resulted in no impairment in 2014, 2013 or 2012 . Other Long-Lived Assets The Company reviews depreciable long-lived assets for impairment whenever events or changes in circumstances indicate that the carrying amount may not be fully recoverable. If such a change in circumstances occurs, the related estimated future undiscounted cash flows expected to result from the use of the asset group and its eventual disposition is compared to the carrying amount. If the sum of the expected cash flows is less than the carrying amount, an impairment charge is recorded. The impairment charge is measured as the amount by which the carrying amount exceeds the fair value of the asset. The fair value of impaired assets is determined using expected cash flow estimates, quoted market prices when available and appraisals as appropriate. The Company did not record any material impairment charges in 2014, 2013 or 2012. Accrued Insurance
The Company retains a significant portion of the risks associated with workers’ compensation, medical, automobile and general liability insurance. The Company estimates self-insurance liabilities using a number of factors, including historical claims experience, demographic factors, severity factors and other actuarial assumptions. The accrued liabilities associated with these programs are based on the Company’s estimate of the ultimate costs to settle known claims as well as claims incurred but not reported as of the balance sheet date. The Company
periodically reviews the assumptions with a third party actuary to determine the adequacy of these self-insurance reserves.
Income Taxes The Company operates within multiple taxing jurisdictions and is subject to audit in these jurisdictions. The IRS and other tax authorities routinely review the Company’s tax returns. These audits can involve complex issues which may require an extended period of time to resolve. The Company makes adequate provisions for best estimates of exposures on previously filed tax returns. Deferred income taxes are recognized for the tax consequence of differences between financial statement carrying amounts and the tax basis of assets and liabilities by applying the currently enacted statutory tax rates in accordance with the accounting guidance for income taxes. The effect of a change in statutory tax rates is recognized in the period that includes the enactment date. Additionally, deferred tax assets are required to be reduced by a valuation allowance if it is more-likely-than-not that some portion or all of the deferred tax asset will not be realized. The Company uses factors to assess the likelihood of realization of deferred tax assets such as the forecast of future taxable income and available tax planning strategies that could be implemented to realize the deferred tax assets. In addition, the accounting guidance prescribes a recognition threshold and measurement attribute for the financial statement recognition and measurement of the tax position taken or expected to be taken in a tax return. For any amount of benefit to be recognized, it must be determined that it is more-likely-than-not that a tax position will be sustained upon examination by taxing authorities based on the technical merits of the position. The amount of benefit to be recognized is based on the Company’s assertion of the most likely outcome resulting from an examination, including resolution of any related appeals or litigation processes. Companies are required to reflect only those tax positions that are more-likely-than-not to be sustained. See also Note 12 — Income Taxes. Research and Development Research and development expenditures represent costs to discover and/or apply new knowledge in developing a new product, process, or in bringing about a significant improvement to an existing product or process. Research and development expenses are recorded as a component of Cost of goods sold. Expenses for research and development were approximately 2% of Cost of goods sold for each of the years 2014, 2013 or 2012. Retirement Benefits
The Company maintains various defined benefit pension plans for some of its U.S. and foreign employees. The accounting guidance for retirement benefits requires the Company to recognize the funded status of its defined benefit pension and postretirement plans as an asset or liability in the Consolidated Balance Sheet. Gains or losses, prior service costs or credits, and transition assets or obligations that have not yet been included in net periodic benefit cost as of the end of the year are recognized as components of Accumulated other comprehensive loss, net of tax, within Hubbell shareholders’ equity. The Company’s policy is to fund pension costs within the
50323_10K.indd 38 2/27/15 11:56 AM
Job Name: 50323PDF Page: 50323_10K 38.p1.pdf
Process Plan: Doc6060_FileDate: 15-03-13Time: 17:08:43
Operator: ____________________________
PageMark-Color-Comp
❏ OK to proceed❏ Make corrections and proceed❏ Make corrections and show another proof
Signed: ___________________ Date: ______

HUBBELL INCORPORATED - Form 10-K 39
ranges prescribed by applicable regulations. In addition to providing defined benefit pension benefits, the Company provides health care and life insurance benefits for some of its active and retired employees. The Company’s policy is to fund these benefits through insurance premiums or as actual expenditures are made. See also Note 10 — Retirement Benefits. Earnings Per Share The earnings per share accounting guidance requires use of the two-class method in determining earnings per share. The two-class method is an earnings allocation formula that determines earnings per share for common stock and participating securities. Restricted stock granted by the Company is considered a participating security since it contains a non-forfeitable right to dividends. Basic earnings per share is calculated as net income available to common shareholders divided by the weighted average number of shares of common stock outstanding. Earnings per diluted share is calculated as net income available to common shareholders divided by the weighted average number of shares outstanding of common stock plus the incremental shares outstanding assuming the exercise of dilutive stock options, stock appreciation rights and performance shares. See also Note 18 — Earnings Per Share. Stock-Based Compensation The Company recognizes the grant-date fair value of all stock-based awards on a straight-line basis over their respective requisite service periods (generally equal to an award’s vesting period), except for certain restricted stock awards granted in 2013 with a performance condition, which are expensed using the graded vesting attribution method. A stock-based award is considered vested for expense attribution purposes when the retention of the award is no longer contingent on providing subsequent service. Accordingly, the Company recognizes compensation cost immediately for awards granted to retirement-eligible individuals or over the period from the grant date to the date retirement eligibility is achieved, if less than the stated vesting period. The expense is recorded in Cost of goods sold and S&A expense in the Consolidated Statement of Income based on the recipients’ respective functions within the organization. The Company records deferred tax assets for awards that will result in deductions on its tax returns, based upon the amount of compensation cost recognized and the statutory tax rate in the jurisdiction in which it will receive a deduction. Differences between the deferred tax assets recognized for financial reporting purposes and the actual tax deduction reported in the Company’s tax return are recorded to Additional paid-in capital to the extent that previously recognized credits to paid-in capital are still available. See also Note 17 — Stock-Based Compensation. Derivatives In order to limit financial risk in the management of its assets, liabilities and debt, the Company may use derivative financial instruments such as foreign currency hedges, commodity hedges, interest rate hedges and interest rate swaps. All derivative financial instruments are matched with an existing Company asset, liability or proposed transaction. The Company
does not speculate or use leverage when trading a derivative product. Market value gains or losses on the derivative financial instrument are recognized in income when the effects of the related price changes of the underlying asset or liability are recognized in income. See Note 14 – Fair Value Measurement for more information regarding our derivative instruments. Recent Accounting Pronouncements
In January 2015, the Financial Accounting Standards Board ("FASB") issued new guidance to eliminate the concept of extraordinary items as part of its initiative to reduce complexity in accounting standards. The guidance is effective for annual and interim periods beginning after December 2015 and may be applied prospectively or retrospectively. The Company does not expect adoption of this standard will have a material impact on its financial statements.
In November 2014, the FASB issued new guidance to clarify how current GAAP should be interpreted in evaluating the economic characteristics and risks of a host contract in a hybrid financial instrument that is issued in the form of a share. The guidance is effective for annual and interim periods beginning after December 15, 2015, with early adoption permitted. The Company does not expect adoption of this standard will have a material impact on its financial statements.
In August 2014, the FASB issued new guidance requiring an entity’s management to evaluate whether there are conditions or events, considered in the aggregate, that raise substantial doubt about the entity’s ability to continue as a going concern and if those conditions exist, the required disclosures. The guidance is effective for the annual period ending after December 15, 2016, and for annual and interim periods thereafter. The Company does not expect adoption of this standard will have a material impact on its financial statements.
In June 2014, the FASB issued new guidance to resolve diverse accounting treatment for share based awards in which the terms of the award provide that a performance target that affects vesting could be achieved after the requisite service period. The guidance is effective for annual periods and interim periods within those annual periods beginning after December 15, 2015 and may be applied prospectively or retrospectively. The Company does not expect adoption of this standard will have a material impact on its financial statements.
In May 2014, the FASB issued new revenue recognition guidance that supersedes the existing revenue recognition guidance and most industry-specific guidance applicable to revenue recognition. According to the new guidance an entity will apply a principles-based five step model to recognize revenue upon the transfer of promised goods or services to customers and in an amount that reflects the consideration for which the entity expects to be entitled in exchange for those goods or services. The guidance is effective for annual periods beginning after December 15, 2016, including interim periods within that reporting period and early application is not permitted. The Company is currently assessing the impact of adopting this standard on its financial statements.
In April 2014, the FASB issued new guidance changing the criteria for determining which disposals of components of an entity can be presented as discontinued operations and modifying the related disclosure requirements. The guidance
50323_10K.indd 39 2/27/15 11:56 AM
Job Name: 50323PDF Page: 50323_10K 39.p1.pdf
Process Plan: Doc6060_FileDate: 15-03-13Time: 17:08:43
Operator: ____________________________
PageMark-Color-Comp
❏ OK to proceed❏ Make corrections and proceed❏ Make corrections and show another proof
Signed: ___________________ Date: ______

40 HUBBELL INCORPORATED - Form 10-K
applies prospectively to new disposals and new classifications of assets as held for sale after the effective date and is effective for annual and interim periods beginning after December 15, 2014, with early adoption permitted. The Company does not expect adoption of this standard will have a material impact on its financial statements.
In July 2013, the FASB amended its guidance on the financial statement presentation of an unrecognized tax benefit when a net operating loss carry-forward, similar tax loss, or a tax credit carry-forward exists. This amendment was adopted by the Company effective January 1, 2014 and did not have a material impact on its financial statements.
NOTE 2 Business Acquisitions
The Company periodically reviews acquisition targets that it believes will be a complementary strategic fit to its existing product portfolio. During 2014, the Company completed seven acquisitions with an aggregate purchase price of $183.8 million, net of cash acquired.
During the fourth quarter of 2014, the Company purchased all of the outstanding common stock of RFL Electronics ("RFL"). RFL is a leading North American designer and manufacturer of protection and communication products as well as customized systems primarily for the electric utility industry. RFL was purchased for $20.0 million, net of cash received, and has been added to the Power segment, resulting in the recognition of intangible assets of $5.3 million and goodwill of $7.3 million. The $5.3 million of intangible assets consists primarily of tradenames and customer relationships that will be amortized over a weighted average period of approximately 15 years. None of the $7.3 million of goodwill associated with the RFL acquisition is expected to be deductible for tax purposes.
During the third quarter of 2014, the Company purchased all of the membership interests of RigPower, LLC (“RigPower”), a manufacturer of high amperage electrical connectors used primarily in the oil and gas industry. RigPower was purchased for $15.2 million, net of cash received, and has been added to the Electrical segment, resulting in the recognition of intangible assets of $3.5 million and goodwill of $9.0 million. The $3.5 million of intangible assets consists primarily of customer relationships and noncompete agreements that will be amortized over a weighted average period of approximately 10 years. All of the goodwill associated with the RigPower acquisition is expected to be deductible for tax purposes.
During the second quarter of 2014, the Company purchased all of the outstanding common stock of Reuel, Inc. (“Reuel”), an industry leader in the manufacture of durable and weather resistant epoxy molded electrical products. Reuel was purchased for $11.5 million, net of cash received, and has been added to the Power segment, resulting in the recognition of intangible assets of $5.7 million and goodwill of $3.4 million. The $5.7 million of intangible assets consists primarily of customer relationships and tradenames that will be amortized over a weighted average period of approximately 12 years. None of the goodwill associated with the Reuel acquisition is expected to be deductible for tax purposes.
During the second quarter of 2014, the Company purchased all of the outstanding common stock of Litecontrol Corporation (“Litecontrol”), a manufacturer of linear architectural lighting products with significant custom capabilities. Litecontrol was purchased for $45.3 million, net of cash received, and has been added to the Electrical segment, resulting in the recognition of intangible assets of $16.7 million and goodwill of $12.0 million.
The $16.7 million of intangible assets consists primarily of customer relationships and tradenames that will be amortized over a weighted average period of approximately 12 years. All of the goodwill associated with the Litecontrol acquisition is expected to be deductible for tax purposes.
During the first quarter of 2014, the Company purchased all of the outstanding common stock of Powerohm Resistors, Inc. (“Powerohm”), which manufactures and sells power and braking resistors. Powerohm was purchased for $51.1 million, net of cash received, and has been added to the Electrical segment, resulting in the recognition of intangible assets of $22.3 million and goodwill of $32.5 million. The $22.3 million of intangible assets consists primarily of customer relationships and tradenames that will be amortized over a weighted average period of approximately 19 years. None of the goodwill associated with the Powerohm acquisition is expected to be deductible for tax purposes.
During the first quarter of 2014, the Company purchased all of the outstanding common stock of PenCell Plastics, Inc. and all of the membership interests of English Road Holdings, LLC, collectively referred to as “PenCell”, for $32.4 million, resulting in the recognition of intangible assets of $5.2 million and goodwill of $13.8 million. PenCell manufactures and sells plastic enclosure boxes and has been added to the Power segment. The $5.2 million of intangible assets consists primarily of customer relationships and tradenames that will be amortized over a weighted average period of approximately 22 years. All of the goodwill associated with the PenCell acquisition is expected to be deductible for tax purposes.
During the first quarter of 2014, the Company purchased all of the outstanding common stock of Fiber and Cable Accessories, Inc. (“FCA”), a manufacturer of aerial slack storage devices for outside plant optical networks. FCA was purchased for $8.3 million and has been added to the Power segment, resulting in the recognition of intangible assets of $4.3 million and goodwill of $2.9 million. The $4.3 million of intangible assets consists primarily of customer relationships and tradenames that will be amortized over a weighted average period of approximately 19 years. All of the goodwill associated with the FCA acquisition is expected to be deductible for tax purposes.
All of these business acquisitions have been accounted for as business combinations and have resulted in the recognition of goodwill. The goodwill relates to a number of factors built into the purchase price, including the future earnings and cash flow potential of the businesses as well as the complementary strategic fit and resulting synergies they bring to the Company’s existing operations.
50323_10K.indd 40 2/27/15 11:56 AM
Job Name: 50323PDF Page: 50323_10K 40.p1.pdf
Process Plan: Doc6060_FileDate: 15-03-13Time: 17:08:43
Operator: ____________________________
PageMark-Color-Comp
❏ OK to proceed❏ Make corrections and proceed❏ Make corrections and show another proof
Signed: ___________________ Date: ______

HUBBELL INCORPORATED - Form 10-K 41
The following table summarizes the preliminary estimated fair values of the assets acquired and liabilities assumed at the date of acquisition related to these transactions (in millions):
Tangible assets acquired $ 71.3Intangible assets 63.0Goodwill 80.9Deferred tax liabilities (11.4)Liabilities assumed (20.0)TOTAL CASH CONSIDERATION $ 183.8
The Consolidated Financial Statements include the results of operations of the acquired businesses from their respective dates of acquisition. Net sales and earnings related to these acquisitions for the year ended December 31, 2014 were not significant to the consolidated results. Pro forma information related to these acquisitions has not been included because the impact to the Company’s consolidated results of operations was not material.
NOTE 3 Receivables and Allowances
Receivables consist of the following components at December 31, (in millions):
2014 2013Trade accounts receivable $ 494.0 $ 461.1Non-trade receivables 15.9 13.5Accounts receivable, gross 509.9 474.6Allowance for credit memos, returns and cash discounts (36.7) (31.6)Allowance for doubtful accounts (3.4) (2.1)Total allowances (40.1) (33.7)ACCOUNTS RECEIVABLE, NET $ 469.8 $ 440.9
NOTE 4 Inventories
Inventories are classified as follows at December 31, (in millions):
2014 2013Raw material $ 153.8 $ 122.3Work-in-process 94.8 87.2Finished goods 277.6 259.4 526.2 468.9Excess of FIFO over LIFO cost basis (84.4) (83.2)INVENTORIES, NET $ 441.8 $ 385.7
50323_10K.indd 41 2/27/15 11:56 AM
Job Name: 50323PDF Page: 50323_10K 41.p1.pdf
Process Plan: Doc6060_FileDate: 15-03-13Time: 17:08:43
Operator: ____________________________
PageMark-Color-Comp
❏ OK to proceed❏ Make corrections and proceed❏ Make corrections and show another proof
Signed: ___________________ Date: ______

42 HUBBELL INCORPORATED - Form 10-K
NOTE 5 Goodwill and Other Intangible Assets
Changes in the carrying amounts of goodwill for the years ended December 31, 2014 and 2013, by segment, were as follows (in millions):
Segment
Electrical Power TotalBALANCE AT DECEMBER 31, 2012 $ 474.6 $ 280.9 $ 755.5Current year acquisitions 49.6 — 49.6Foreign currency translation and prior year acquisitions (3.3) (1.4) (4.7)BALANCE AT DECEMBER 31, 2013 $ 520.9 $ 279.5 $ 800.4Current year acquisitions 53.5 27.4 80.9Foreign currency translation and prior year acquisitions (5.5) (1.1) (6.6)BALANCE AT DECEMBER 31, 2014 $ 568.9 $ 305.8 $ 874.7
In 2014, the Company completed seven acquisitions for an aggregate purchase price of $183.8 million, net of cash received. These acquisitions have been accounted for as business combinations and have resulted in the recognition of $80.9 million of goodwill. See also Note 2 - Business Acquisitions. The Company has not recorded any goodwill impairments since the initial adoption of the accounting guidance in 2002. Identifiable intangible assets are recorded in Intangible assets, net in the Consolidated Balance Sheet. Identifiable intangible assets are comprised of the following (in millions):
December 31, 2014 December 31, 2013
Gross
AmountAccumulatedAmortization
GrossAmount
AccumulatedAmortization
Definite-lived: Patents, tradenames and trademarks $ 125.1 $ (32.5) $ 111.2 $ (27.7)Customer/agent relationships and other 263.0 (87.8) 222.2 (75.0)TOTAL DEFINITE-LIVED INTANGIBLES 388.1 (120.3) 333.4 (102.7)Indefinite-lived: Tradenames and other 55.0 — 55.9 —TOTAL INTANGIBLE ASSETS $ 443.1 $ (120.3) $ 389.3 $ (102.7)
Amortization expense associated with these definite-lived intangible assets was $23.8 million, $19.9 million and $18.1 million in 2014, 2013 and 2012, respectively. Amortization expense associated with these intangible assets is expected to be $22.2 million in 2015, $21.4 million in 2016, $20.1 million in 2017, $18.4 million in 2018 and $17 million in 2019.
NOTE 6 Investments
At December 31, 2014 and December 31, 2013, the Company had both available-for-sale and trading investments. The available-for-sale investments consisted entirely of municipal bonds while the trading investments were comprised primarily of debt and equity mutual funds. These investments are stated at fair market value based on current quotes. The following table sets forth selected data with respect to the Company’s investments at December 31, (in millions):
2014 2013
Amortized
Cost
Gross Unrealized
Gains
GrossUnrealized
LossesFair
ValueCarrying
ValueAmortized
Cost
GrossUnrealized
Gains
GrossUnrealized
LossesFair
ValueCarrying
ValueAvailable-for-saleinvestments $ 42.5 $ 0.6 $ (0.1) $ 43.0 $ 43.0 $ 38.0 $ 0.6 $ — $ 38.6 $ 38.6Trading investments 6.6 2.3 — 8.9 8.9 5.4 1.9 — 7.3 7.3TOTAL INVESTMENTS $ 49.1 $ 2.9 $ (0.1) $ 51.9 $ 51.9 $ 43.4 $ 2.5 $ — $ 45.9 $ 45.9
50323_10K.indd 42 2/27/15 11:56 AM
Job Name: 50323PDF Page: 50323_10K 42.p1.pdf
Process Plan: Doc6060_FileDate: 15-03-13Time: 17:08:43
Operator: ____________________________
PageMark-Color-Comp
❏ OK to proceed❏ Make corrections and proceed❏ Make corrections and show another proof
Signed: ___________________ Date: ______
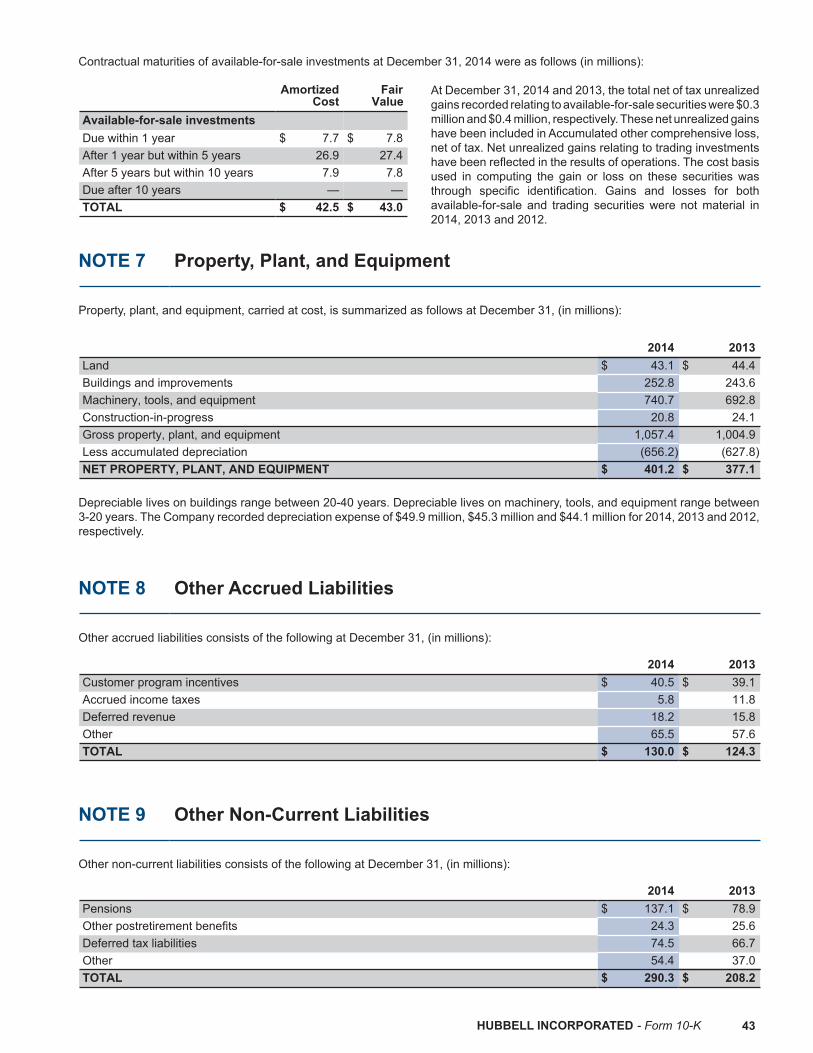
HUBBELL INCORPORATED - Form 10-K 43
Contractual maturities of available-for-sale investments at December 31, 2014 were as follows (in millions):
Amortized
CostFair
ValueAvailable-for-sale investments Due within 1 year $ 7.7 $ 7.8After 1 year but within 5 years 26.9 27.4After 5 years but within 10 years 7.9 7.8Due after 10 years — —TOTAL $ 42.5 $ 43.0
At December 31, 2014 and 2013, the total net of tax unrealized gains recorded relating to available-for-sale securities were $0.3 million and $0.4 million, respectively. These net unrealized gains have been included in Accumulated other comprehensive loss, net of tax. Net unrealized gains relating to trading investments have been reflected in the results of operations. The cost basis used in computing the gain or loss on these securities was through specific identification. Gains and losses for both available-for-sale and trading securities were not material in 2014, 2013 and 2012.
NOTE 7 Property, Plant, and Equipment
Property, plant, and equipment, carried at cost, is summarized as follows at December 31, (in millions):
2014 2013Land $ 43.1 $ 44.4Buildings and improvements 252.8 243.6Machinery, tools, and equipment 740.7 692.8Construction-in-progress 20.8 24.1Gross property, plant, and equipment 1,057.4 1,004.9Less accumulated depreciation (656.2) (627.8)NET PROPERTY, PLANT, AND EQUIPMENT $ 401.2 $ 377.1
Depreciable lives on buildings range between 20-40 years. Depreciable lives on machinery, tools, and equipment range between 3-20 years. The Company recorded depreciation expense of $49.9 million, $45.3 million and $44.1 million for 2014, 2013 and 2012, respectively.
NOTE 8 Other Accrued Liabilities
Other accrued liabilities consists of the following at December 31, (in millions):
2014 2013Customer program incentives $ 40.5 $ 39.1Accrued income taxes 5.8 11.8Deferred revenue 18.2 15.8Other 65.5 57.6TOTAL $ 130.0 $ 124.3
NOTE 9 Other Non-Current Liabilities
Other non-current liabilities consists of the following at December 31, (in millions):
2014 2013Pensions $ 137.1 $ 78.9Other postretirement benefits 24.3 25.6Deferred tax liabilities 74.5 66.7Other 54.4 37.0TOTAL $ 290.3 $ 208.2
50323_10K.indd 43 2/27/15 11:56 AM
Job Name: 50323PDF Page: 50323_10K 43.p1.pdf
Process Plan: Doc6060_FileDate: 15-03-13Time: 17:08:43
Operator: ____________________________
PageMark-Color-Comp
❏ OK to proceed❏ Make corrections and proceed❏ Make corrections and show another proof
Signed: ___________________ Date: ______
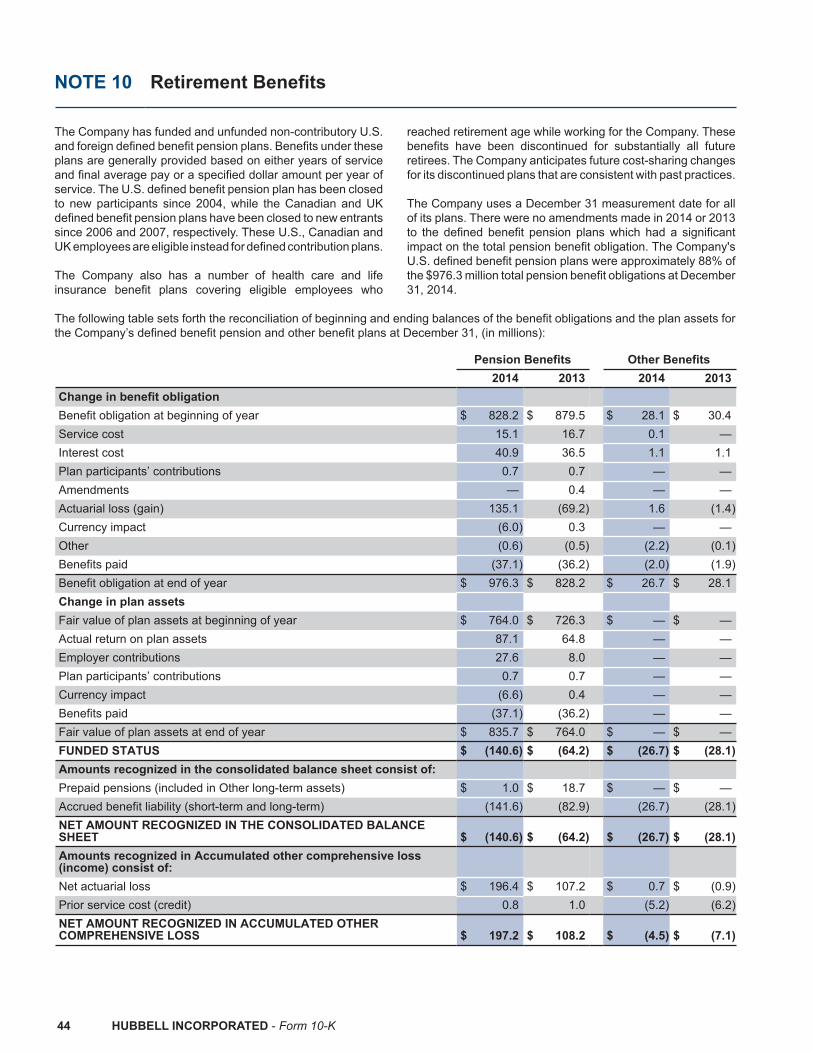
44 HUBBELL INCORPORATED - Form 10-K
NOTE 10 Retirement Benefits
The Company has funded and unfunded non-contributory U.S. and foreign defined benefit pension plans. Benefits under these plans are generally provided based on either years of service and final average pay or a specified dollar amount per year of service. The U.S. defined benefit pension plan has been closed to new participants since 2004, while the Canadian and UK defined benefit pension plans have been closed to new entrants since 2006 and 2007, respectively. These U.S., Canadian and UK employees are eligible instead for defined contribution plans. The Company also has a number of health care and life insurance benefit plans covering eligible employees who
reached retirement age while working for the Company. These benefits have been discontinued for substantially all future retirees. The Company anticipates future cost-sharing changes for its discontinued plans that are consistent with past practices. The Company uses a December 31 measurement date for all of its plans. There were no amendments made in 2014 or 2013 to the defined benefit pension plans which had a significant impact on the total pension benefit obligation. The Company's U.S. defined benefit pension plans were approximately 88% of the $976.3 million total pension benefit obligations at December 31, 2014.
The following table sets forth the reconciliation of beginning and ending balances of the benefit obligations and the plan assets for the Company’s defined benefit pension and other benefit plans at December 31, (in millions):
Pension Benefits Other Benefits 2014 2013 2014 2013Change in benefit obligation Benefit obligation at beginning of year $ 828.2 $ 879.5 $ 28.1 $ 30.4Service cost 15.1 16.7 0.1 —Interest cost 40.9 36.5 1.1 1.1Plan participants’ contributions 0.7 0.7 — —Amendments — 0.4 — —Actuarial loss (gain) 135.1 (69.2) 1.6 (1.4)Currency impact (6.0) 0.3 — —Other (0.6) (0.5) (2.2) (0.1)Benefits paid (37.1) (36.2) (2.0) (1.9)Benefit obligation at end of year $ 976.3 $ 828.2 $ 26.7 $ 28.1Change in plan assets Fair value of plan assets at beginning of year $ 764.0 $ 726.3 $ — $ —Actual return on plan assets 87.1 64.8 — —Employer contributions 27.6 8.0 — —Plan participants’ contributions 0.7 0.7 — —Currency impact (6.6) 0.4 — —Benefits paid (37.1) (36.2) — —Fair value of plan assets at end of year $ 835.7 $ 764.0 $ — $ —FUNDED STATUS $ (140.6) $ (64.2) $ (26.7) $ (28.1)Amounts recognized in the consolidated balance sheet consist of: Prepaid pensions (included in Other long-term assets) $ 1.0 $ 18.7 $ — $ —Accrued benefit liability (short-term and long-term) (141.6) (82.9) (26.7) (28.1)NET AMOUNT RECOGNIZED IN THE CONSOLIDATED BALANCESHEET $ (140.6) $ (64.2) $ (26.7) $ (28.1)Amounts recognized in Accumulated other comprehensive loss(income) consist of: Net actuarial loss $ 196.4 $ 107.2 $ 0.7 $ (0.9)Prior service cost (credit) 0.8 1.0 (5.2) (6.2)NET AMOUNT RECOGNIZED IN ACCUMULATED OTHERCOMPREHENSIVE LOSS $ 197.2 $ 108.2 $ (4.5) $ (7.1)
50323_10K.indd 44 2/27/15 11:56 AM
Job Name: 50323PDF Page: 50323_10K 44.p1.pdf
Process Plan: Doc6060_FileDate: 15-03-13Time: 17:08:43
Operator: ____________________________
PageMark-Color-Comp
❏ OK to proceed❏ Make corrections and proceed❏ Make corrections and show another proof
Signed: ___________________ Date: ______

HUBBELL INCORPORATED - Form 10-K 45
The accumulated benefit obligation for all defined benefit pension plans was $907.1 million and $771.9 million at December 31, 2014 and 2013, respectively. Information with respect to plans with accumulated benefit obligations in excess of plan assets is as follows, (in millions):
2014 2013Projected benefit obligation $ 266.5 $ 77.2Accumulated benefit obligation $ 261.1 $ 74.5Fair value of plan assets $ 168.9 $ —
The following table sets forth the components of pension and other benefit costs for the years ended December 31, (in millions):
Pension Benefits Other Benefits 2014 2013 2012 2014 2013 2012Components of net periodic benefit cost: Service cost $ 15.1 $ 16.7 $ 16.0 $ 0.1 $ — $ —Interest cost 40.9 36.5 36.5 1.1 1.1 1.3Expected return on plan assets (45.2) (46.7) (39.9) — — —Amortization of prior service cost (credit) 0.2 0.2 0.2 (1.0) (1.0) (1.0)Amortization of actuarial losses (gains) 3.9 13.8 17.4 (0.1) (0.1) —Other — — — (2.2) — —Curtailment and settlement losses (gains) — — — — — —Net periodic benefit cost (credit) $ 14.9 $ 20.5 $ 30.2 $ (2.1) $ — $ 0.3Changes recognized in other comprehensive loss (income),before tax: Current year net actuarial loss (gain) $ 93.1 $ (87.8) $ (19.1) $ 1.5 $ (1.4) $ (2.5)Current year prior service credit — 0.4 — — — —Amortization of prior service (cost) credit (0.2) (0.2) (0.2) 1.0 1.0 1.0Amortization of net actuarial (losses) gains (3.9) (13.8) (17.4) 0.1 0.1 —Currency impact — (0.1) (0.2) — — —Other adjustments — — 0.3 — — 0.3Total recognized in other comprehensive loss (income) 89.0 (101.5) (36.6) 2.6 (0.3) (1.2)TOTAL RECOGNIZED IN NET PERIODIC PENSION COSTAND OTHER COMPREHENSIVE LOSS (INCOME) $ 103.9 $ (81.0) $ (6.4) $ 0.5 $ (0.3) $ (0.9)Amortization expected to be recognized through incomeduring 2015 Amortization of prior service cost (credit) $ 0.2 $ (1.0) Amortization of net loss (gain) 11.9 (0.1) TOTAL EXPECTED TO BE RECOGNIZED THROUGHINCOME DURING NEXT FISCAL YEAR $ 12.1 $ (1.1)
The Company also maintains six defined contribution pension plans. The total cost of these plans was $12.9 million in 2014, $11.2 million in 2013 and $10.5 million in 2012, excluding the employer match for the 401(k) plan. This cost is not included in the above net periodic benefit cost for the defined benefit pension plans. As of December 31, 2014 and 2013, the Company participated in three multiemployer defined benefit pension plans under the terms of collective-bargaining agreements that cover its union represented employees. As of December 31, 2014 and 2013
one of the three multiemployer defined benefit pension plans in which the Company participates is considered to be less than 65 percent funded. The Company’s total contributions to these plans were $0.8 million in 2014, $0.9 million in 2013 and $0.7 million in 2012. These contributions represent more than five percent of the total contributions made to each of these plans during the past three years. After assessing future required contributions and/or the potential liabilities associated with withdrawing from these plans, the Company has concluded that none of these plans are significant.
50323_10K.indd 45 2/27/15 11:56 AM
Job Name: 50323PDF Page: 50323_10K 45.p1.pdf
Process Plan: Doc6060_FileDate: 15-03-13Time: 17:08:43
Operator: ____________________________
PageMark-Color-Comp
❏ OK to proceed❏ Make corrections and proceed❏ Make corrections and show another proof
Signed: ___________________ Date: ______
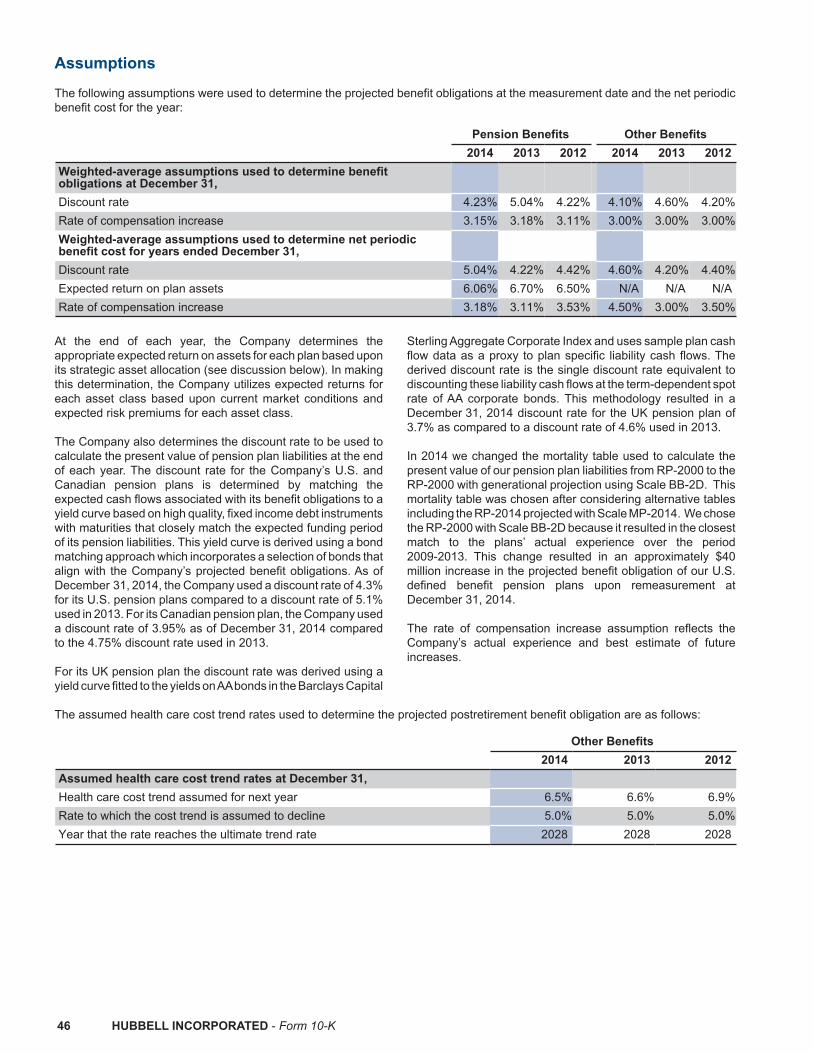
46 HUBBELL INCORPORATED - Form 10-K
Assumptions The following assumptions were used to determine the projected benefit obligations at the measurement date and the net periodic benefit cost for the year:
Pension Benefits Other Benefits 2014 2013 2012 2014 2013 2012Weighted-average assumptions used to determine benefitobligations at December 31, Discount rate 4.23% 5.04% 4.22% 4.10% 4.60% 4.20%Rate of compensation increase 3.15% 3.18% 3.11% 3.00% 3.00% 3.00%Weighted-average assumptions used to determine net periodicbenefit cost for years ended December 31, Discount rate 5.04% 4.22% 4.42% 4.60% 4.20% 4.40%Expected return on plan assets 6.06% 6.70% 6.50% N/A N/A N/ARate of compensation increase 3.18% 3.11% 3.53% 4.50% 3.00% 3.50%
At the end of each year, the Company determines the appropriate expected return on assets for each plan based upon its strategic asset allocation (see discussion below). In making this determination, the Company utilizes expected returns for each asset class based upon current market conditions and expected risk premiums for each asset class. The Company also determines the discount rate to be used to calculate the present value of pension plan liabilities at the end of each year. The discount rate for the Company’s U.S. and Canadian pension plans is determined by matching the expected cash flows associated with its benefit obligations to a yield curve based on high quality, fixed income debt instruments with maturities that closely match the expected funding period of its pension liabilities. This yield curve is derived using a bond matching approach which incorporates a selection of bonds that align with the Company’s projected benefit obligations. As of December 31, 2014, the Company used a discount rate of 4.3% for its U.S. pension plans compared to a discount rate of 5.1% used in 2013. For its Canadian pension plan, the Company used a discount rate of 3.95% as of December 31, 2014 compared to the 4.75% discount rate used in 2013. For its UK pension plan the discount rate was derived using a yield curve fitted to the yields on AA bonds in the Barclays Capital
Sterling Aggregate Corporate Index and uses sample plan cash flow data as a proxy to plan specific liability cash flows. The derived discount rate is the single discount rate equivalent to discounting these liability cash flows at the term-dependent spot rate of AA corporate bonds. This methodology resulted in a December 31, 2014 discount rate for the UK pension plan of 3.7% as compared to a discount rate of 4.6% used in 2013.
In 2014 we changed the mortality table used to calculate the present value of our pension plan liabilities from RP-2000 to the RP-2000 with generational projection using Scale BB-2D. This mortality table was chosen after considering alternative tables including the RP-2014 projected with Scale MP-2014. We chose the RP-2000 with Scale BB-2D because it resulted in the closest match to the plans’ actual experience over the period 2009-2013. This change resulted in an approximately $40 million increase in the projected benefit obligation of our U.S. defined benefit pension plans upon remeasurement at December 31, 2014. The rate of compensation increase assumption reflects the Company’s actual experience and best estimate of future increases.
The assumed health care cost trend rates used to determine the projected postretirement benefit obligation are as follows:
Other Benefits 2014 2013 2012Assumed health care cost trend rates at December 31, Health care cost trend assumed for next year 6.5% 6.6% 6.9%Rate to which the cost trend is assumed to decline 5.0% 5.0% 5.0%Year that the rate reaches the ultimate trend rate 2028 2028 2028
50323_10K.indd 46 2/27/15 11:56 AM
Job Name: 50323PDF Page: 50323_10K 46.p1.pdf
Process Plan: Doc6060_FileDate: 15-03-13Time: 17:08:43
Operator: ____________________________
PageMark-Color-Comp
❏ OK to proceed❏ Make corrections and proceed❏ Make corrections and show another proof
Signed: ___________________ Date: ______

HUBBELL INCORPORATED - Form 10-K 47
Assumed health care cost trend rates have an effect on the amounts reported for the postretirement benefit plans. A one-percentage-point change in assumed health care cost trend rates would have the following effects (in millions):
OnePercentage
PointIncrease
OnePercentage
PointDecrease
Effect on total of service and interest cost $ 0.1 $ (0.1)Effect on postretirement benefit obligation $ 1.5 $ (1.5)
Plan Assets The Company’s combined targeted 2015 weighted average asset allocation for domestic and foreign pension plans and the actual weighted average asset allocation for domestic and foreign pension plans at December 31, 2014 and 2013 by asset category are as follows:
Percentage of Plan Assets Target Actual
Asset Category 2015 2014 2013Equity securities 37% 30% 40%Debt securities & Cash 37% 48% 43%Alternative Investments 26% 22% 17%TOTAL 100% 100% 100%
At the end of each year, the Company estimates the expected long-term rate of return on pension plan assets based on the strategic asset allocation for its plans. In making this determination, the Company utilizes expected rates of return for each asset class based upon current market conditions and expected risk premiums for each asset class. The Company has written investment policies and asset allocation guidelines for its domestic and foreign pension plans. In establishing these policies, the Company has considered that its various pension plans are a major retirement vehicle for most plan participants and has acted to discharge its fiduciary responsibilities with regard to the plans solely in the interest of such participants and their beneficiaries. The goal underlying the establishment of the investment policies is to provide that pension assets shall be invested in a prudent manner and so that, together with the expected contributions to the plans, the funds will be sufficient to meet the obligations of the plans as they become due. To achieve this result, the Company conducts a periodic strategic
asset allocation study to form a basis for the allocation of pension assets between various asset categories. Specific policy benchmark percentages are assigned to each asset category with minimum and maximum ranges established for each. The assets are then tactically managed within these ranges. Equity securities include investments in large-cap, mid-cap and small-cap companies located inside and outside the United States. Fixed income securities include corporate bonds of companies from diversified industries, mortgage-backed securities and US Treasuries. Derivative investments include futures contracts used by the plan to adjust the level of its investments within an asset allocation category. All futures contracts are 100% supported by cash or cash equivalent investments. At no time may derivatives be utilized to leverage the asset portfolio.Equity securities include Company common stock in the amounts of $37.6 million (5.2% of total domestic plan assets) and $35.0 million (5.3% of total domestic plan assets) at December 31, 2014 and 2013, respectively.
50323_10K.indd 47 2/27/15 11:56 AM
Job Name: 50323PDF Page: 50323_10K 47.p1.pdf
Process Plan: Doc6060_FileDate: 15-03-13Time: 17:08:43
Operator: ____________________________
PageMark-Color-Comp
❏ OK to proceed❏ Make corrections and proceed❏ Make corrections and show another proof
Signed: ___________________ Date: ______

48 HUBBELL INCORPORATED - Form 10-K
The fair value of the Company’s pension plan assets at December 31, 2014 and 2013, by asset category are as follows (in millions):
Quoted Prices inActive Markets forIdentical Assets
Quoted Prices inActive Market for
Similar Asset
SignificantUnobservable
InputsAsset Category Total (Level 1) (Level 2) (Level 3)Cash and cash equivalents $ 26.2 $ 26.2 $ — $ —Equity securities: US Large-cap (a) 35.1 35.1 — —US Mid-cap and Small-cap Growth (b) 41.5 41.5 — —International Large-cap 23.4 23.4 — —Emerging Markets (c) 11.3 11.3 — —Fixed Income Securities: US Treasuries 57.7 — 57.7 —Corporate Bonds (d) 214.1 — 214.1 —Asset Backed Securities and Other 87.9 0.4 87.5 —Derivatives: Assets (e) 150.1 149.1 1.0 — (Liabilities) (e) (15.9) (15.9) — —Alternative Investment Funds (f) 188.2 110.1 — 78.1Common Pooled Fund (g) 16.1 — 16.1 —BALANCE AT DECEMBER 31, 2014 $ 835.7 $ 381.2 $ 376.4 $ 78.1
Quoted Prices in Active
Markets for Identical
Quoted Prices in Active
Market for Similar Asset
SignificantUnobservable
InputsAsset Category Total Assets (Level 1) (Level 2) (Level 3)Cash and cash equivalents $ 23.9 $ 23.9 $ — $ —Equity securities: US Large-cap (a) 75.7 75.7 — —US Mid-cap and Small-cap Growth (b) 42.0 42.0 — —International Large-cap 80.7 80.7 — —Emerging Markets (c) 28.3 28.3 — —Fixed Income Securities: US Treasuries 59.6 — 59.6 —Corporate Bonds (d) 120.7 — 120.7 —Asset Backed Securities and Other 91.8 1.1 90.7 —Derivatives: Assets (e) 97.5 97.5 — — (Liabilities) (e) (37.2) (37.2) — —Alternative Investment Funds (f) 165.6 33.3 — 132.3Common Pooled Funds (g) 15.4 — 15.4 —BALANCE AT DECEMBER 31, 2013 $ 764.0 $ 345.3 $ 286.4 $ 132.3
(a) Includes an actively managed portfolio of large-cap US stocks.(b) Includes $37.6 million and $35.0 million of the Company’s common stock at December 31, 2014 and 2013, respectively, and an investment
in a small cap open ended mutual fund.(c) Includes open ended emerging markets mutual funds.(d) Includes primarily investment grade bonds of U.S. issuers from diverse industries.(e) Includes primarily large-cap U.S. and foreign equity futures as well as short positions on U.S. Treasuries to adjust the duration of the portfolio.(f) Includes investments in hedge funds, including fund of funds products and open end mutual funds(g) Investments in Common Pooled Funds, consisting of equities and fixed income securities. The fair value of the Common Pooled Funds
has been calculated using the Funds Net Asset Value per share of the underlying investments.
50323_10K.indd 48 2/27/15 11:56 AM
Job Name: 50323PDF Page: 50323_10K 48.p1.pdf
Process Plan: Doc6060_FileDate: 15-03-13Time: 17:08:43
Operator: ____________________________
PageMark-Color-Comp
❏ OK to proceed❏ Make corrections and proceed❏ Make corrections and show another proof
Signed: ___________________ Date: ______
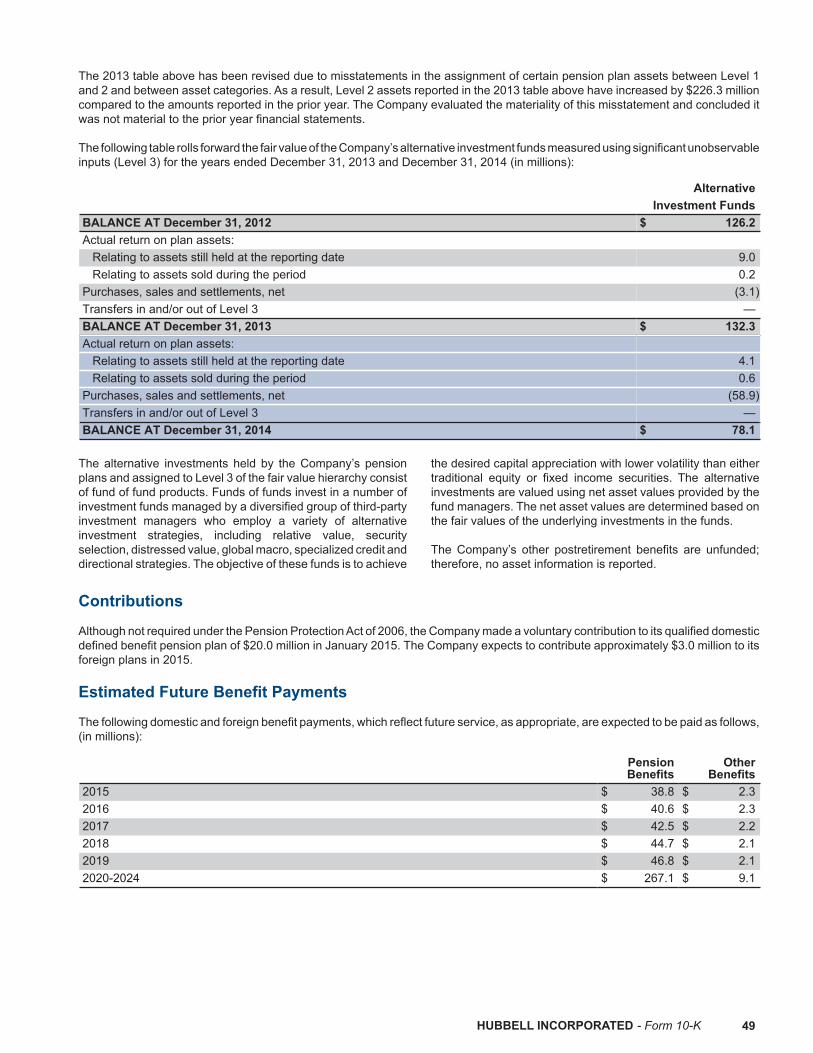
HUBBELL INCORPORATED - Form 10-K 49
The 2013 table above has been revised due to misstatements in the assignment of certain pension plan assets between Level 1 and 2 and between asset categories. As a result, Level 2 assets reported in the 2013 table above have increased by $226.3 million compared to the amounts reported in the prior year. The Company evaluated the materiality of this misstatement and concluded it was not material to the prior year financial statements.
The following table rolls forward the fair value of the Company’s alternative investment funds measured using significant unobservable inputs (Level 3) for the years ended December 31, 2013 and December 31, 2014 (in millions):
Alternative Investment FundsBALANCE AT December 31, 2012 $ 126.2Actual return on plan assets: Relating to assets still held at the reporting date 9.0 Relating to assets sold during the period 0.2Purchases, sales and settlements, net (3.1)Transfers in and/or out of Level 3 —BALANCE AT December 31, 2013 $ 132.3Actual return on plan assets: Relating to assets still held at the reporting date 4.1 Relating to assets sold during the period 0.6Purchases, sales and settlements, net (58.9)Transfers in and/or out of Level 3 —BALANCE AT December 31, 2014 $ 78.1
The alternative investments held by the Company’s pension plans and assigned to Level 3 of the fair value hierarchy consist of fund of fund products. Funds of funds invest in a number of investment funds managed by a diversified group of third-party investment managers who employ a variety of alternative investment strategies, including relative value, security selection, distressed value, global macro, specialized credit and directional strategies. The objective of these funds is to achieve
the desired capital appreciation with lower volatility than either traditional equity or fixed income securities. The alternative investments are valued using net asset values provided by the fund managers. The net asset values are determined based on the fair values of the underlying investments in the funds. The Company’s other postretirement benefits are unfunded; therefore, no asset information is reported.
Contributions Although not required under the Pension Protection Act of 2006, the Company made a voluntary contribution to its qualified domestic defined benefit pension plan of $20.0 million in January 2015. The Company expects to contribute approximately $3.0 million to its foreign plans in 2015. Estimated Future Benefit Payments The following domestic and foreign benefit payments, which reflect future service, as appropriate, are expected to be paid as follows, (in millions):
PensionBenefits
OtherBenefits
2015 $ 38.8 $ 2.32016 $ 40.6 $ 2.32017 $ 42.5 $ 2.22018 $ 44.7 $ 2.12019 $ 46.8 $ 2.12020-2024 $ 267.1 $ 9.1
50323_10K.indd 49 2/27/15 11:56 AM
Job Name: 50323PDF Page: 50323_10K 49.p1.pdf
Process Plan: Doc6060_FileDate: 15-03-13Time: 17:08:43
Operator: ____________________________
PageMark-Color-Comp
❏ OK to proceed❏ Make corrections and proceed❏ Make corrections and show another proof
Signed: ___________________ Date: ______

50 HUBBELL INCORPORATED - Form 10-K
NOTE 11 Debt
The following table sets forth the Company’s long-term debt at December 31, (in millions):
Maturity 2014 2013Senior notes at 5.95%, net ofunamortized discount 2018 $ 299.2 $ 299.0Senior notes at 3.625%, netof unamortized discount 2022 298.4 298.2TOTAL LONG-TERM DEBT $ 597.6 $ 597.2
In November 2010, the Company completed a public debt offering for $300 million of long-term, senior, unsecured notes maturing in November 2022 and bearing interest at a fixed rate of 3.625%. Prior to the issuance of the 2022 Notes, the Company entered into a forward interest rate lock which resulted in a $1.6 million loss. This amount was recorded in Accumulated other comprehensive loss, net of tax and is being amortized over the life of the 2022 Notes. In May 2008, the Company completed a public offering of $300 million long-term senior, unsecured notes maturing in May 2018. The 2018 Notes bear interest at a fixed rate of 5.95%. Prior to the issuance of the 2018 Notes, the Company entered into a forward interest rate lock which resulted in a $1.2 million gain. This amount was recorded in Accumulated other comprehensive loss, net of tax, and is being amortized over the life of the notes. The 2018 Notes and the 2022 Notes are both fixed rate indebtedness, are callable at any time with a make whole premium and are only subject to accelerated payment prior to maturity in the event of a default under the indenture governing the 2018 Notes and 2022 Notes, as modified by the supplemental indentures creating such series, or upon a change in control event as defined in such indenture. The Company was in compliance with all of its covenants as of December 31, 2014. At December 31, 2014 and 2013, the Company had $1.4 million and $0.3 million, respectively, of short-term debt outstanding. During 2013, the Company entered into an credit agreement for a 5.0 million Brazilian reais line of credit to support its Brazilian operations. This line of credit expires in October 2016; however, an undrawn balance is subject to an annual review by the lender. This line is not subject to annual commitment fees. At December 31, 2014, 3.0 million Brazilian reais (equivalent to
$1.1 million) was outstanding. There were no borrowings outstanding at December 31, 2013 under this line of credit. Short-term debt is also comprised of outstanding borrowings under existing lines of credit used to support its operations in China. At December 31, 2014 and 2013 there were 1.7 million and 2.1 million Chinese renminbi, respectively, (equivalent to $0.3 million) of borrowings outstanding under this line of credit.
Other information related to short-term debt at December 31, is summarized below:
2014 2013Interest rate on short-term debt: At year end 14.54% 6.00%Paid during the year (weighted average) 14.35% 5.20%
As of December 31, 2014, the Company’s $500 million revolving credit facility had not been drawn against. The credit facility, which serves as a backup to our commercial paper program, was scheduled to expire in October 2016. In March 2013, the facility was amended to extend the maturity date to March 2018. The interest rate applicable to borrowing under the credit agreement is generally either the prime rate or a surcharge over LIBOR. The single financial covenant in the $500 million credit facility, which the Company is in compliance with, requires that total debt not exceed 55% of total capitalization. Annual commitment fees to support availability under the credit facility are not material. The Company also maintains other lines of credit that are primarily used to support the issuance of letters of credit. Interest rates and other terms of borrowing under these lines of credit vary from country to country, depending on local market conditions. At December 31, 2014 and 2013 these lines totaled $54.6 million and $60.4 million, respectively, of which $27.1 million and $22.9 million was utilized to support letters of credit and the remaining amount was unused. The annual commitment fees associated with these lines of credit are not material. Interest and fees paid related to total indebtedness was $29.4 million, $29.7 million and $29.8 million in 2014, 2013, and 2012, respectively.
50323_10K.indd 50 2/27/15 11:56 AM
Job Name: 50323PDF Page: 50323_10K 50.p1.pdf
Process Plan: Doc6060_FileDate: 15-03-13Time: 17:08:43
Operator: ____________________________
PageMark-Color-Comp
❏ OK to proceed❏ Make corrections and proceed❏ Make corrections and show another proof
Signed: ___________________ Date: ______

HUBBELL INCORPORATED - Form 10-K 51
NOTE 12 Income Taxes
The following table sets forth selected data with respect to the Company’s income tax provisions for the years ended December 31, (in millions):
2014 2013 2012Income before income taxes: United States $ 385.6 $ 360.8 $ 330.2International 99.9 113.0 111.6TOTAL INCOME BEFORE INCOME TAXES $ 485.5 $ 473.8 $ 441.8Provision for income taxes — current: Federal $ 90.1 $ 94.6 $ 66.4State 15.4 15.1 12.8International 22.5 21.0 33.0Total provision-current 128.0 130.7 112.2Provision for income taxes — deferred: Federal 24.4 14.4 25.6State 2.7 0.1 1.8International 3.2 (1.2) 0.1Total provision — deferred 30.3 13.3 27.5TOTAL PROVISION FOR INCOME TAXES $ 158.3 $ 144.0 $ 139.7
Deferred tax assets and liabilities result from differences in the basis of assets and liabilities for tax and financial statement purposes. The components of the deferred tax assets/(liabilities) at December 31, were as follows (in millions):
2014 2013Deferred tax assets: Inventory $ 4.6 $ 4.7Income tax credits 30.6 31.3Accrued liabilities 23.3 19.0Pension 43.6 23.4Post retirement and post employment benefits 11.3 11.0Stock-based compensation 11.4 10.1Net operating loss carryforwards 46.3 53.1Miscellaneous other 7.5 3.4Gross deferred tax assets 178.6 156.0Valuation allowance (34.3) (28.5)Total deferred tax assets, net of valuation allowance 144.3 127.5Deferred tax liabilities: Acquisition basis difference (145.8) (123.3)Property, plant, and equipment (41.9) (40.4)Total deferred tax liabilities (187.7) (163.7)TOTAL NET DEFERRED TAX LIABILITY $ (43.4) $ (36.2)Deferred taxes are reflected in the Consolidated Balance Sheet as follows: Current tax assets (included in Deferred taxes and other) $ 31.2 $ 31.0Non-current tax assets (included in Other long-term assets) 1.1 1.0Current tax liabilities (included in Other accrued liabilities) (1.2) (1.5)Non-current tax liabilities (included in Other Non-current liabilities) (74.5) (66.7)TOTAL NET DEFERRED TAX LIABILITY $ (43.4) $ (36.2)
As of December 31, 2014, the Company had a total of $30.6 million of Federal, State (net of Federal benefit) and foreign (fully valued) tax credit carryforwards, available to offset future
income taxes. As of December 31, 2014, $9.1 million of the tax credits may be carried forward indefinitely while the remaining $21.5 million will begin to expire at various times in 2015 through
50323_10K.indd 51 2/27/15 11:56 AM
Job Name: 50323PDF Page: 50323_10K 51.p1.pdf
Process Plan: Doc6060_FileDate: 15-03-13Time: 17:08:43
Operator: ____________________________
PageMark-Color-Comp
❏ OK to proceed❏ Make corrections and proceed❏ Make corrections and show another proof
Signed: ___________________ Date: ______
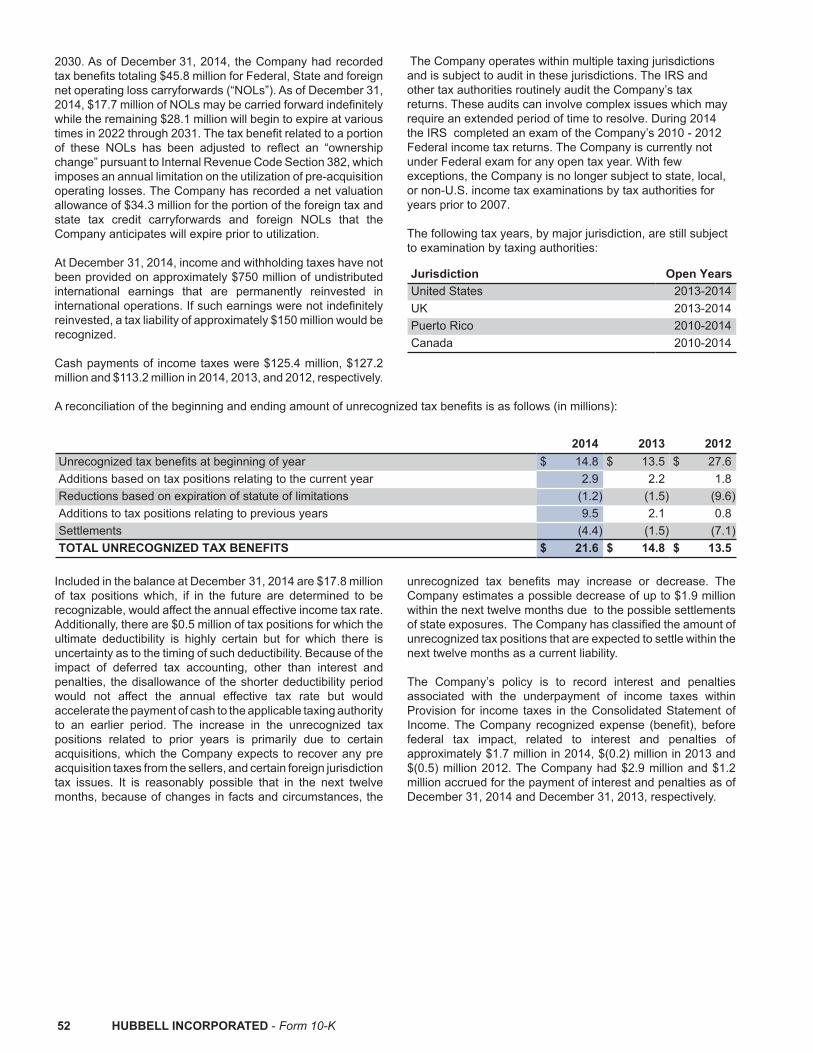
52 HUBBELL INCORPORATED - Form 10-K
2030. As of December 31, 2014, the Company had recorded tax benefits totaling $45.8 million for Federal, State and foreign net operating loss carryforwards (“NOLs”). As of December 31, 2014, $17.7 million of NOLs may be carried forward indefinitely while the remaining $28.1 million will begin to expire at various times in 2022 through 2031. The tax benefit related to a portion of these NOLs has been adjusted to reflect an “ownership change” pursuant to Internal Revenue Code Section 382, which imposes an annual limitation on the utilization of pre-acquisition operating losses. The Company has recorded a net valuation allowance of $34.3 million for the portion of the foreign tax and state tax credit carryforwards and foreign NOLs that the Company anticipates will expire prior to utilization. At December 31, 2014, income and withholding taxes have not been provided on approximately $750 million of undistributed international earnings that are permanently reinvested in international operations. If such earnings were not indefinitely reinvested, a tax liability of approximately $150 million would be recognized.
Cash payments of income taxes were $125.4 million, $127.2 million and $113.2 million in 2014, 2013, and 2012, respectively.
The Company operates within multiple taxing jurisdictions and is subject to audit in these jurisdictions. The IRS and other tax authorities routinely audit the Company’s tax returns. These audits can involve complex issues which may require an extended period of time to resolve. During 2014 the IRS completed an exam of the Company’s 2010 - 2012 Federal income tax returns. The Company is currently not under Federal exam for any open tax year. With few exceptions, the Company is no longer subject to state, local, or non-U.S. income tax examinations by tax authorities for years prior to 2007. The following tax years, by major jurisdiction, are still subject to examination by taxing authorities:
Jurisdiction Open YearsUnited States 2013-2014UK 2013-2014Puerto Rico 2010-2014Canada 2010-2014
A reconciliation of the beginning and ending amount of unrecognized tax benefits is as follows (in millions):
2014 2013 2012Unrecognized tax benefits at beginning of year $ 14.8 $ 13.5 $ 27.6Additions based on tax positions relating to the current year 2.9 2.2 1.8Reductions based on expiration of statute of limitations (1.2) (1.5) (9.6)Additions to tax positions relating to previous years 9.5 2.1 0.8Settlements (4.4) (1.5) (7.1)TOTAL UNRECOGNIZED TAX BENEFITS $ 21.6 $ 14.8 $ 13.5
Included in the balance at December 31, 2014 are $17.8 million of tax positions which, if in the future are determined to be recognizable, would affect the annual effective income tax rate. Additionally, there are $0.5 million of tax positions for which the ultimate deductibility is highly certain but for which there is uncertainty as to the timing of such deductibility. Because of the impact of deferred tax accounting, other than interest and penalties, the disallowance of the shorter deductibility period would not affect the annual effective tax rate but would accelerate the payment of cash to the applicable taxing authority to an earlier period. The increase in the unrecognized tax positions related to prior years is primarily due to certain acquisitions, which the Company expects to recover any pre acquisition taxes from the sellers, and certain foreign jurisdiction tax issues. It is reasonably possible that in the next twelve months, because of changes in facts and circumstances, the
unrecognized tax benefits may increase or decrease. The Company estimates a possible decrease of up to $1.9 million within the next twelve months due to the possible settlements of state exposures. The Company has classified the amount of unrecognized tax positions that are expected to settle within the next twelve months as a current liability. The Company’s policy is to record interest and penalties associated with the underpayment of income taxes within Provision for income taxes in the Consolidated Statement of Income. The Company recognized expense (benefit), before federal tax impact, related to interest and penalties of approximately $1.7 million in 2014, $(0.2) million in 2013 and $(0.5) million 2012. The Company had $2.9 million and $1.2 million accrued for the payment of interest and penalties as of December 31, 2014 and December 31, 2013, respectively.
50323_10K.indd 52 2/27/15 11:56 AM
Job Name: 50323PDF Page: 50323_10K 52.p1.pdf
Process Plan: Doc6060_FileDate: 15-03-13Time: 17:08:43
Operator: ____________________________
PageMark-Color-Comp
❏ OK to proceed❏ Make corrections and proceed❏ Make corrections and show another proof
Signed: ___________________ Date: ______
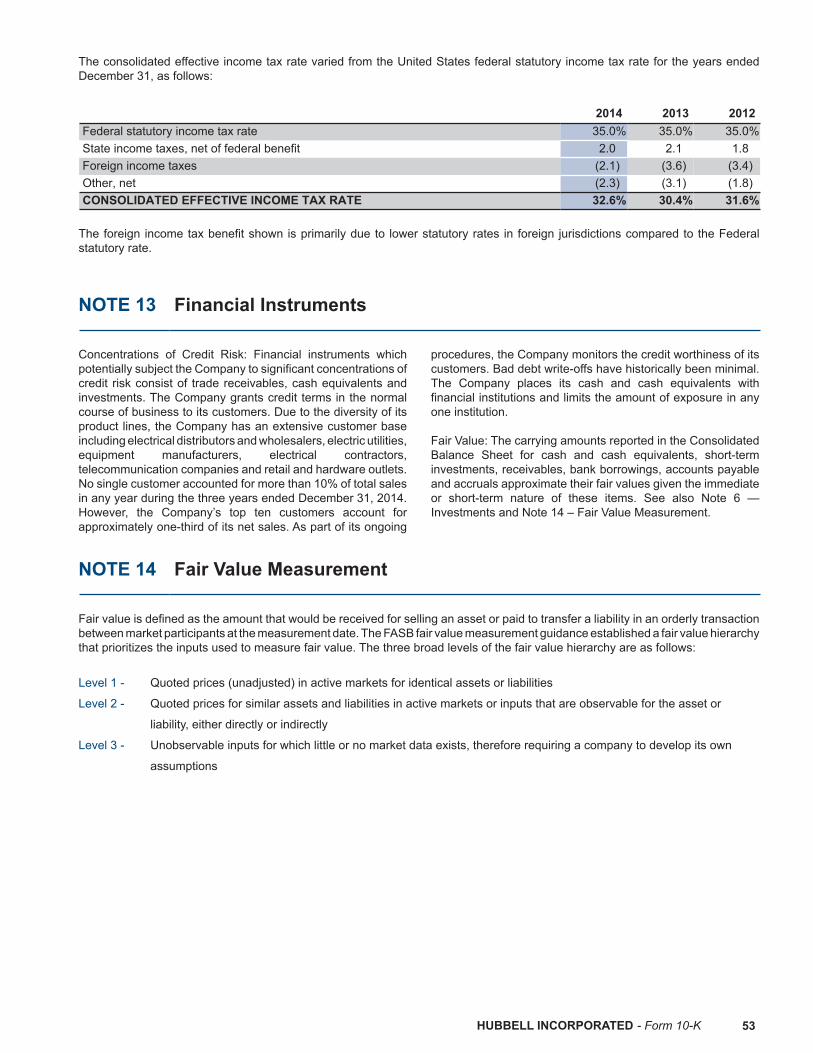
HUBBELL INCORPORATED - Form 10-K 53
The consolidated effective income tax rate varied from the United States federal statutory income tax rate for the years ended December 31, as follows:
2014 2013 2012Federal statutory income tax rate 35.0% 35.0% 35.0%State income taxes, net of federal benefit 2.0 2.1 1.8Foreign income taxes (2.1) (3.6) (3.4)Other, net (2.3) (3.1) (1.8)CONSOLIDATED EFFECTIVE INCOME TAX RATE 32.6% 30.4% 31.6%
The foreign income tax benefit shown is primarily due to lower statutory rates in foreign jurisdictions compared to the Federal statutory rate.
NOTE 13 Financial Instruments
Concentrations of Credit Risk: Financial instruments which potentially subject the Company to significant concentrations of credit risk consist of trade receivables, cash equivalents and investments. The Company grants credit terms in the normal course of business to its customers. Due to the diversity of its product lines, the Company has an extensive customer base including electrical distributors and wholesalers, electric utilities, equipment manufacturers, electrical contractors, telecommunication companies and retail and hardware outlets. No single customer accounted for more than 10% of total sales in any year during the three years ended December 31, 2014. However, the Company’s top ten customers account for approximately one-third of its net sales. As part of its ongoing
procedures, the Company monitors the credit worthiness of its customers. Bad debt write-offs have historically been minimal. The Company places its cash and cash equivalents with financial institutions and limits the amount of exposure in any one institution. Fair Value: The carrying amounts reported in the Consolidated Balance Sheet for cash and cash equivalents, short-term investments, receivables, bank borrowings, accounts payable and accruals approximate their fair values given the immediate or short-term nature of these items. See also Note 6 — Investments and Note 14 – Fair Value Measurement.
NOTE 14 Fair Value Measurement
Fair value is defined as the amount that would be received for selling an asset or paid to transfer a liability in an orderly transaction between market participants at the measurement date. The FASB fair value measurement guidance established a fair value hierarchy that prioritizes the inputs used to measure fair value. The three broad levels of the fair value hierarchy are as follows:
Level 1 - Quoted prices (unadjusted) in active markets for identical assets or liabilities
Level 2 - Quoted prices for similar assets and liabilities in active markets or inputs that are observable for the asset or
liability, either directly or indirectly
Level 3 - Unobservable inputs for which little or no market data exists, therefore requiring a company to develop its own
assumptions
50323_10K.indd 53 2/27/15 11:56 AM
Job Name: 50323PDF Page: 50323_10K 53.p1.pdf
Process Plan: Doc6060_FileDate: 15-03-13Time: 17:08:43
Operator: ____________________________
PageMark-Color-Comp
❏ OK to proceed❏ Make corrections and proceed❏ Make corrections and show another proof
Signed: ___________________ Date: ______
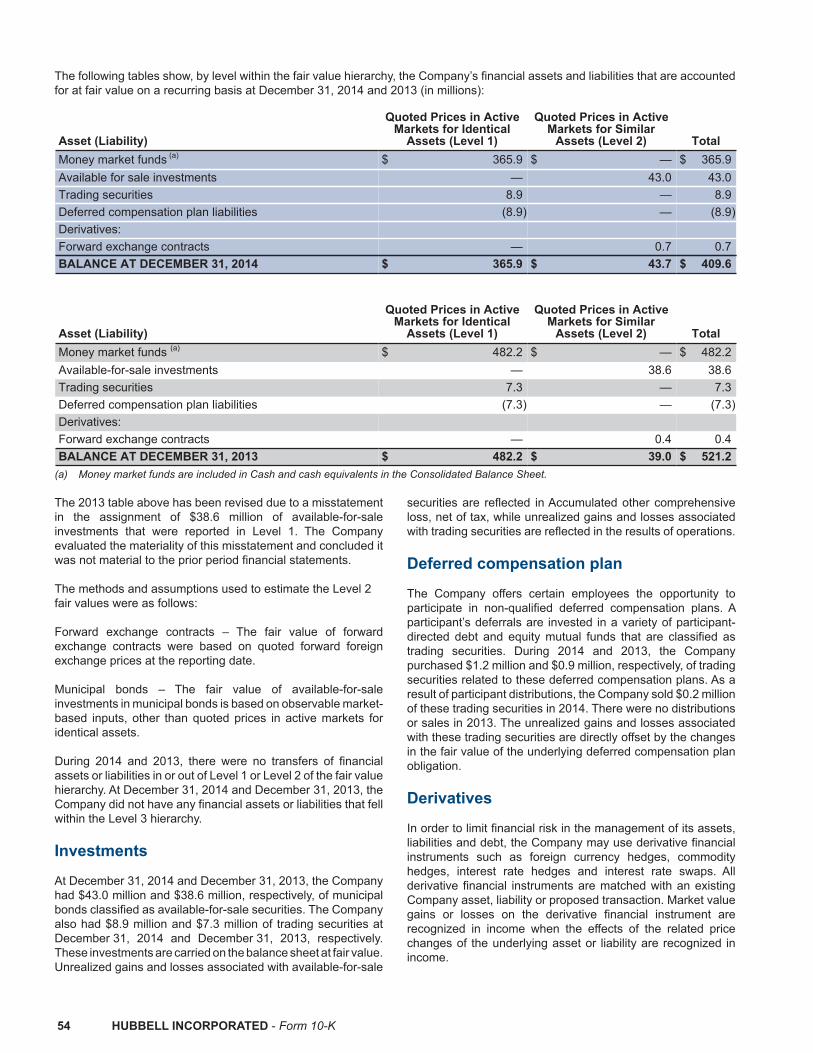
54 HUBBELL INCORPORATED - Form 10-K
The following tables show, by level within the fair value hierarchy, the Company’s financial assets and liabilities that are accounted for at fair value on a recurring basis at December 31, 2014 and 2013 (in millions):
Asset (Liability)
Quoted Prices in ActiveMarkets for Identical
Assets (Level 1)
Quoted Prices in ActiveMarkets for Similar
Assets (Level 2) TotalMoney market funds (a) $ 365.9 $ — $ 365.9Available for sale investments — 43.0 43.0Trading securities 8.9 — 8.9Deferred compensation plan liabilities (8.9) — (8.9)Derivatives: Forward exchange contracts — 0.7 0.7BALANCE AT DECEMBER 31, 2014 $ 365.9 $ 43.7 $ 409.6
Asset (Liability)
Quoted Prices in ActiveMarkets for Identical
Assets (Level 1)
Quoted Prices in ActiveMarkets for Similar
Assets (Level 2) TotalMoney market funds (a) $ 482.2 $ — $ 482.2Available-for-sale investments — 38.6 38.6Trading securities 7.3 — 7.3Deferred compensation plan liabilities (7.3) — (7.3)Derivatives: Forward exchange contracts — 0.4 0.4BALANCE AT DECEMBER 31, 2013 $ 482.2 $ 39.0 $ 521.2
(a) Money market funds are included in Cash and cash equivalents in the Consolidated Balance Sheet.
The 2013 table above has been revised due to a misstatement in the assignment of $38.6 million of available-for-sale investments that were reported in Level 1. The Company evaluated the materiality of this misstatement and concluded it was not material to the prior period financial statements.
The methods and assumptions used to estimate the Level 2 fair values were as follows: Forward exchange contracts – The fair value of forward exchange contracts were based on quoted forward foreign exchange prices at the reporting date.
Municipal bonds – The fair value of available-for-sale investments in municipal bonds is based on observable market-based inputs, other than quoted prices in active markets for identical assets. During 2014 and 2013, there were no transfers of financial assets or liabilities in or out of Level 1 or Level 2 of the fair value hierarchy. At December 31, 2014 and December 31, 2013, the Company did not have any financial assets or liabilities that fell within the Level 3 hierarchy. Investments
At December 31, 2014 and December 31, 2013, the Company had $43.0 million and $38.6 million, respectively, of municipal bonds classified as available-for-sale securities. The Company also had $8.9 million and $7.3 million of trading securities at December 31, 2014 and December 31, 2013, respectively. These investments are carried on the balance sheet at fair value. Unrealized gains and losses associated with available-for-sale
securities are reflected in Accumulated other comprehensive loss, net of tax, while unrealized gains and losses associated with trading securities are reflected in the results of operations. Deferred compensation plan The Company offers certain employees the opportunity to participate in non-qualified deferred compensation plans. A participant’s deferrals are invested in a variety of participant-directed debt and equity mutual funds that are classified as trading securities. During 2014 and 2013, the Company purchased $1.2 million and $0.9 million, respectively, of trading securities related to these deferred compensation plans. As a result of participant distributions, the Company sold $0.2 million of these trading securities in 2014. There were no distributions or sales in 2013. The unrealized gains and losses associated with these trading securities are directly offset by the changes in the fair value of the underlying deferred compensation plan obligation. Derivatives In order to limit financial risk in the management of its assets, liabilities and debt, the Company may use derivative financial instruments such as foreign currency hedges, commodity hedges, interest rate hedges and interest rate swaps. All derivative financial instruments are matched with an existing Company asset, liability or proposed transaction. Market value gains or losses on the derivative financial instrument are recognized in income when the effects of the related price changes of the underlying asset or liability are recognized in income.
50323_10K.indd 54 2/27/15 11:56 AM
Job Name: 50323PDF Page: 50323_10K 54.p1.pdf
Process Plan: Doc6060_FileDate: 15-03-13Time: 17:08:43
Operator: ____________________________
PageMark-Color-Comp
❏ OK to proceed❏ Make corrections and proceed❏ Make corrections and show another proof
Signed: ___________________ Date: ______
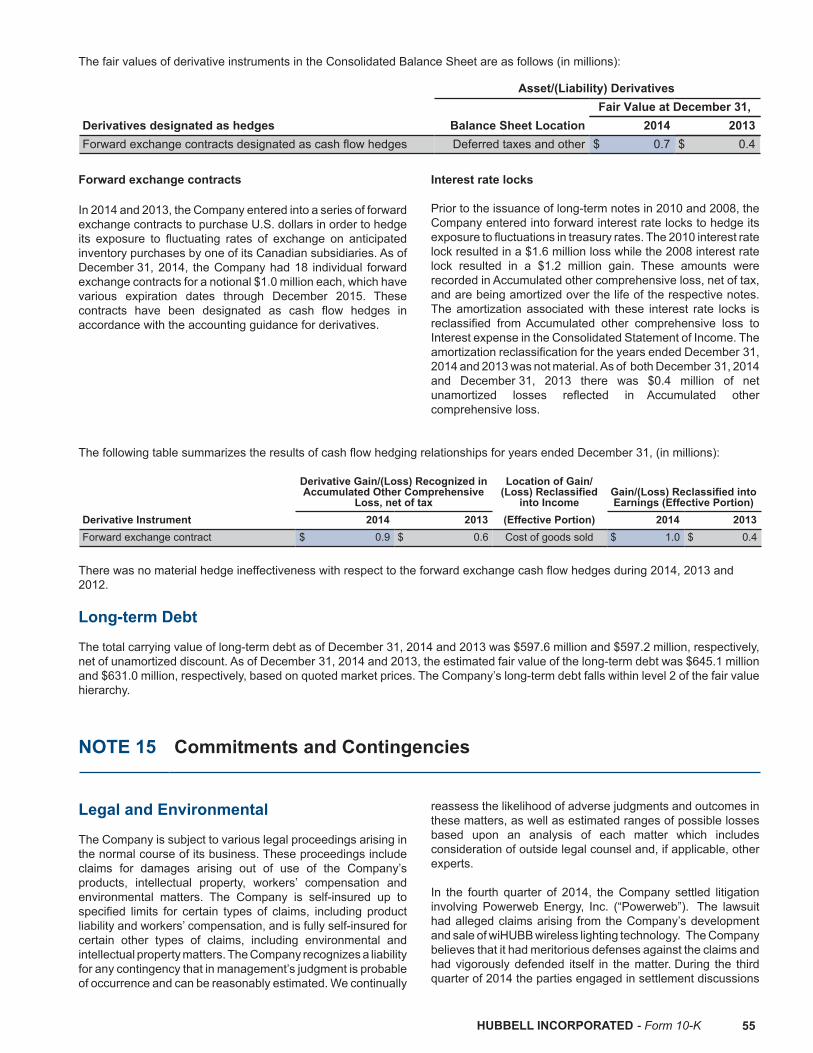
HUBBELL INCORPORATED - Form 10-K 55
The fair values of derivative instruments in the Consolidated Balance Sheet are as follows (in millions):
Asset/(Liability) Derivatives Fair Value at December 31,Derivatives designated as hedges Balance Sheet Location 2014 2013Forward exchange contracts designated as cash flow hedges Deferred taxes and other $ 0.7 $ 0.4
Forward exchange contracts In 2014 and 2013, the Company entered into a series of forward exchange contracts to purchase U.S. dollars in order to hedge its exposure to fluctuating rates of exchange on anticipated inventory purchases by one of its Canadian subsidiaries. As of December 31, 2014, the Company had 18 individual forward exchange contracts for a notional $1.0 million each, which have various expiration dates through December 2015. These contracts have been designated as cash flow hedges in accordance with the accounting guidance for derivatives.
Interest rate locks Prior to the issuance of long-term notes in 2010 and 2008, the Company entered into forward interest rate locks to hedge its exposure to fluctuations in treasury rates. The 2010 interest rate lock resulted in a $1.6 million loss while the 2008 interest rate lock resulted in a $1.2 million gain. These amounts were recorded in Accumulated other comprehensive loss, net of tax, and are being amortized over the life of the respective notes. The amortization associated with these interest rate locks is reclassified from Accumulated other comprehensive loss to Interest expense in the Consolidated Statement of Income. The amortization reclassification for the years ended December 31, 2014 and 2013 was not material. As of both December 31, 2014 and December 31, 2013 there was $0.4 million of net unamortized losses reflected in Accumulated other comprehensive loss.
The following table summarizes the results of cash flow hedging relationships for years ended December 31, (in millions):
Derivative Gain/(Loss) Recognized inAccumulated Other Comprehensive
Loss, net of tax
Location of Gain/(Loss) Reclassified
into IncomeGain/(Loss) Reclassified intoEarnings (Effective Portion)
Derivative Instrument 2014 2013 (Effective Portion) 2014 2013Forward exchange contract $ 0.9 $ 0.6 Cost of goods sold $ 1.0 $ 0.4
There was no material hedge ineffectiveness with respect to the forward exchange cash flow hedges during 2014, 2013 and 2012. Long-term Debt The total carrying value of long-term debt as of December 31, 2014 and 2013 was $597.6 million and $597.2 million, respectively, net of unamortized discount. As of December 31, 2014 and 2013, the estimated fair value of the long-term debt was $645.1 million and $631.0 million, respectively, based on quoted market prices. The Company’s long-term debt falls within level 2 of the fair value hierarchy.
NOTE 15 Commitments and Contingencies
Legal and Environmental The Company is subject to various legal proceedings arising in the normal course of its business. These proceedings include claims for damages arising out of use of the Company’s products, intellectual property, workers’ compensation and environmental matters. The Company is self-insured up to specified limits for certain types of claims, including product liability and workers’ compensation, and is fully self-insured for certain other types of claims, including environmental and intellectual property matters. The Company recognizes a liability for any contingency that in management’s judgment is probable of occurrence and can be reasonably estimated. We continually
reassess the likelihood of adverse judgments and outcomes in these matters, as well as estimated ranges of possible losses based upon an analysis of each matter which includes consideration of outside legal counsel and, if applicable, other experts. In the fourth quarter of 2014, the Company settled litigation involving Powerweb Energy, Inc. (“Powerweb”). The lawsuit had alleged claims arising from the Company’s development and sale of wiHUBB wireless lighting technology. The Company believes that it had meritorious defenses against the claims and had vigorously defended itself in the matter. During the third quarter of 2014 the parties engaged in settlement discussions
50323_10K.indd 55 2/27/15 11:56 AM
Job Name: 50323PDF Page: 50323_10K 55.p1.pdf
Process Plan: Doc6060_FileDate: 15-03-13Time: 17:08:43
Operator: ____________________________
PageMark-Color-Comp
❏ OK to proceed❏ Make corrections and proceed❏ Make corrections and show another proof
Signed: ___________________ Date: ______

56 HUBBELL INCORPORATED - Form 10-K
and the Company increased the accrual by $4.0 million based on those discussions. In view of several considerations including the inherent uncertainty of litigation, and the expense of a trial, the Company settled the litigation. The settlement payment made by the Company did not exceed the amounts previously reserved for the litigation.
The Company is subject to environmental laws and regulations which may require that it investigate and remediate the effects of potential contamination associated with past and present operations as well as those acquired through business combinations. Environmental liabilities are recorded when remedial efforts are probable and the costs can be reasonably estimated. The Company continues to monitor these environmental matters and revalues its liabilities as necessary. Total environmental liabilities were $13.9 million and $12.3 million as of December 31, 2014 and 2013, respectively. The Company accounts for conditional asset retirement and environmental obligations in accordance with the applicable accounting guidance. The accounting guidance defines “conditional asset retirement obligation” as a legal obligation to
perform an asset retirement activity in which the timing and/or method of settlement are conditional on a future event that may or may not be within the control of the Company. Accordingly, an entity is required to recognize a liability for the fair value of a conditional asset retirement obligation if the fair value of the liability can be reasonably estimated. Asset retirement obligations were not material as of December 31, 2014 and 2013. Leases Total rental expense under operating leases was $24.7 million in 2014, $23.2 million in 2013 and $21.9 million in 2012. The minimum annual rentals on non-cancelable, long-term, operating leases in effect at December 31, 2014 are expected to approximate $13.3 million in 2015, $10.4 million in 2016, $6.8 million in 2017, $5.3 million in 2018, $3.5 million in 2019 and $13.4 million thereafter. The Company’s leases primarily consist of operating leases for buildings or equipment. The terms for building leases typically range from 5-25 years with 5-10 year renewal periods.
NOTE 16 Capital Stock
Activity in the Company’s common shares outstanding is set forth below for the three years ended December 31, 2014 (in thousands):
Common Stock Class A Class BOUTSTANDING AT DECEMBER 31, 2011 7,167 52,071Exercise of stock options/stock appreciation rights — 804Director compensation arrangements, net — 18Restricted/performance shares activity, net of forfeitures — 197Acquisition/surrender of shares — (1,021)OUTSTANDING AT DECEMBER 31, 2012 7,167 52,069Exercise of stock options/stock appreciation rights — 157Director compensation arrangements, net — 16Restricted/performance shares activity, net of forfeitures — 138Acquisition/surrender of shares — (375)OUTSTANDING AT DECEMBER 31, 2013 7,167 52,005Exercise of stock options/stock appreciation rights — 155Director compensation arrangements, net — 13Restricted/performance shares activity, net of forfeitures — 136Acquisition/surrender of shares — (980)OUTSTANDING AT DECEMBER 31, 2014 7,167 51,329
For accounting purposes, the Company treats repurchased shares as constructively retired when acquired and accordingly charges the purchase price against Common stock par value, Additional paid-in capital and Retained earnings to the extent required. Shares may be repurchased through the Company’s stock repurchase program, acquired by the Company from employees under the Hubbell Incorporated Stock Option Plan for Key Employees (the “Option Plan”) or surrendered to the Company by employees in settlement of their minimum tax liability on vesting of restricted shares and performance shares under the Hubbell Incorporated 2005 Incentive Award Plan as amended and restated, (the “Award Plan”). Class A Common
shares have twenty votes per share, while Class B Common shares have one vote per share. In addition, the Company has 5.9 million authorized shares of preferred stock; no preferred shares are outstanding.
In 2014 the Company identified a misstatement related to the accounting for repurchases of Class A Common Stock prior to 2012. The repurchase price in excess of par value was applied to Additional paid-in capital, however, a portion of the repurchase price should have been applied to Retained earnings. As a result, the Company increased Additional paid-in capital by $192 million and decreased Retained earnings for
50323_10K.indd 56 2/27/15 11:56 AM
Job Name: 50323PDF Page: 50323_10K 56.p1.pdf
Process Plan: Doc6060_FileDate: 15-03-13Time: 17:08:43
Operator: ____________________________
PageMark-Color-Comp
❏ OK to proceed❏ Make corrections and proceed❏ Make corrections and show another proof
Signed: ___________________ Date: ______

HUBBELL INCORPORATED - Form 10-K 57
the periods presented herein. The misstatement had no impact on total shareholders' equity. The Company evaluated the materiality of this misstatement and concluded that it was not material to all prior periods. The Company has an amended and restated Rights Agreement under which holders of Class A Common Stock have Class A Rights and holders of Class B Common Stock have Class B Rights (collectively, “Rights”). These Rights become exercisable after a specified period of time only if a person or group of affiliated persons acquires beneficial ownership of 20 percent or more of the outstanding Class A Common Stock of the Company or announces or commences a tender or exchange offer that would result in the offeror acquiring beneficial ownership of 20 percent or more of the outstanding Class A Common Stock of the Company. Each Class A Right entitles the holder to purchase from the Company one one-thousandth of a share of Series A Junior Participating Preferred Stock (“Series A Preferred Stock”), without par value, at a price of $175.00 per one one-thousandth of a share. Similarly, each Class B Right entitles the holder to purchase one one-thousandth of a share of Series B Junior Participating Preferred Stock (“Series B Preferred Stock”), without par value, at a price of $175.00 per one one-thousandth of a share. The Rights may be redeemed by the Company for one cent per Right prior to the day a person or group of affiliated persons acquires 20 percent or more of the outstanding Class A Common Stock of the Company. The Rights will expire in December 31, 2018 (the “Final Expiration Date”), unless the Final Expiration Date is advanced or extended or unless the Rights are earlier redeemed or exchanged by the Company.
Shares of Series A Preferred Stock or Series B Preferred Stock purchasable upon exercise of the Rights will not be redeemable. Each share of Series A Preferred Stock or Series B Preferred Stock will be entitled, when, as and if declared, to a minimum preferential quarterly dividend payment of $10.00 per share but will be entitled to an aggregate dividend of 1,000 times the dividend declared per share of Common Stock. In the event of liquidation, the holders of the Series A Preferred Stock or Series B Preferred Stock will be entitled to a minimum preferential liquidation payment of $100 per share (plus any accrued but unpaid dividends) but will be entitled to an aggregate payment of 1,000 times the payment made per share of Class A Common Stock or Class B Common Stock, respectively. Each share of Series A Preferred Stock will have 20,000 votes and each share of Series B Preferred Stock will have 1,000 votes, voting together with the Common Stock. Finally, in the event of any merger, consolidation, transfer of assets or earning power or other transaction in which shares of Common Stock are converted or exchanged, each share of Series A Preferred Stock or Series B Preferred Stock will be entitled to receive 1,000 times the amount received per share of Common Stock. These rights are protected by customary antidilution provisions. Upon the occurrence of certain events or transactions specified in the Rights Agreement, each holder of a Right will have the right to receive, upon exercise, that number of shares of the Company’s common stock or the acquiring company’s shares having a market value equal to twice the exercise price.
Shares of the Company’s common stock were reserved at December 31, 2014 as follows (in thousands):
Common StockPreferred
Stock Class A Class BFuture grant of stock-based compensation — 1,475 —Exercise of stock purchase rights — — 58Shares reserved under other equity compensation plans — 96 —TOTAL — 1,571 58
NOTE 17 Stock-Based Compensation
As of December 31, 2014, the Company had various stock-based awards outstanding which were issued to executives and other key employees. The Company recognizes the grant-date fair value of all stock-based awards to employees over their respective requisite service periods (generally equal to an award’s vesting period), net of estimated forfeitures. A stock-based award is considered vested for expense attribution purposes when the employee’s retention of the award is no longer contingent on providing subsequent service. Accordingly, the Company recognizes compensation cost immediately for awards granted to retirement-eligible individuals or over the period from the grant date to the date retirement eligibility is achieved, if less than the stated vesting period. The Company’s long-term incentive program for awarding stock-based compensation uses a combination of restricted stock, stock appreciation rights (“SARs”), and performance shares of the Company’s Class B Common Stock pursuant to the Award Plan. Under the Award Plan, the Company may authorize up to 6.9 million shares of Class B Common Stock in settlement of restricted stock, performance shares, SARs or any-post 2004 grants of stock options. The Company issues new shares for settlement of any stock-based awards. In 2014, the Company granted stock-based awards using a combination of restricted stock, SARs and performance shares. In 2014, 2013, and 2012, the Company recorded $16.4 million, $14.3 million and $15.8 million of stock-based compensation costs, respectively. The total income tax benefit recognized in 2014 was $7.8 million, $8.3 million during 2013, and $17.6 million during 2012. The net tax windfall recorded as a result of exercise or vesting (depending on the type of award) was $9.2 million, $8.4 million, and $15.1 million for the years ended December 31, 2014, 2013 and 2012, respectively. As of December 31, 2014, there
50323_10K.indd 57 2/27/15 11:56 AM
Job Name: 50323PDF Page: 50323_10K 57.p1.pdf
Process Plan: Doc6060_FileDate: 15-03-13Time: 17:08:43
Operator: ____________________________
PageMark-Color-Comp
❏ OK to proceed❏ Make corrections and proceed❏ Make corrections and show another proof
Signed: ___________________ Date: ______

58 HUBBELL INCORPORATED - Form 10-K
was $26.5 million, pretax, of total unrecognized compensation cost related to non-vested share-based compensation arrangements. This cost is expected to be recognized through 2017.
Stock-based compensation expense is recorded in S&A expense as well as Cost of goods sold. Of the total 2014 expense, $15.7 million was recorded to S&A expense and $0.7 million was recorded to Cost of goods sold. In 2013 and 2012, $13.4 million and $15.1 million, respectively, was recorded to S&A expense and $0.9 million in 2013 and $0.7 million in 2012, was recorded to Cost of goods sold. Stock-based compensation costs capitalized to inventory was $0.2 million in 2014, 2013 and 2012.
Each of the compensation arrangements is discussed below.
Restricted Stock
The Company issues several types of restricted stock awards all of which are considered outstanding at the time of grant, as the award holders are entitled to dividends and voting rights. Unvested restricted stock awards are considered participating securities in computing earnings per share. Restricted stock granted is not transferable and is subject to forfeiture in the event of the recipient’s termination of employment prior to vesting
Restricted stock Issued to Employees - Service Condition Service-based restricted stock awards are expensed on a straight-line basis over the requisite service period. The restricted stock vests in one-third increments annually for three years on each anniversary of the date of grant. The restricted stock fair values are measured using the average between the high and low trading prices of the Company’s Class B Common Stock on the most recent trading day immediately preceding the grant date (“measurement date”).
Restricted stock Issued to Employees - Market Condition
Certain restricted stock awards issued in 2014 will vest subject to the achievement of a market-based condition. The awards are expensed on a straight-line basis over the requisite service period which starts on the date of the grant and ends upon the completion of the performance period. Expense is recognized irrespective of the market condition being achieved.
The market-based condition associated with the awards is the Company’s total shareholder return (“TSR”) compared to the TSR generated by the companies that comprise the S&P Capital Goods 900 Index and is measured over a three year performance period beginning on January 1, 2015 and ending on December 31, 2017. The awards will vest contingent on achievement of the market condition, service through the requisite service period or to the date an employee becomes retirement-eligible, and approval by the Company's Compensation Committee. If the market-based condition is achieved, the awards will vest at 100% of the restricted stock awards granted. If the market-based condition is not achieved the awards will not vest. The fair value of these awards was determined based upon a lattice model.
The following table summarizes the assumptions used in estimating the fair value of these awards issued in 2014:
Stock Price onMeasurement
Date Dividend YieldExpectedVolatility
Risk FreeInterest Rate Expected Term
Weighted Avg.Grant Date Fair
Value2014 $ 106.44 2.1% 22.7% 1.0% 3 Years $ 95.96
Restricted stock Issued to Employees - Performance Condition
Certain restricted stock issued in 2013 will vest subject to the achievement of an annual performance-based condition. The awards vest in one-third increments for each of the years ending December 31, 2014, 2015 and 2016, contingent upon meeting the annual performance condition, and approval by the Company’s Compensation Committee. These awards are expensed on a graded basis over the requisite service period. The probability of vesting is reassessed each reporting period and compensation cost is adjusted accordingly. The fair value of the award is measured based upon the average between the high and low trading prices of the Company’s Class B Common Stock on the measurement date.
The performance condition for the year ending December 31, 2014 was met and 8,586 shares vested and were approved by the Compensation Committee in February 2015. The fair value of the shares at vesting was $1.0 million.
Restricted Stock Issued to Non-employee Directors In 2014, 2013, and 2012, each non-employee director received a grant of Class B Common Stock. These grants were made on the date of the annual meeting of shareholders and vested or will vest at the following year’s annual meeting of shareholders, upon a change of control or termination of service by reason of death. These shares will be subject to forfeiture if the director’s service terminates prior to the date of the next regularly scheduled annual meeting of shareholders to be held in the following calendar
50323_10K.indd 58 2/27/15 11:56 AM
Job Name: 50323PDF Page: 50323_10K 58.p1.pdf
Process Plan: Doc6060_FileDate: 15-03-13Time: 17:08:43
Operator: ____________________________
PageMark-Color-Comp
❏ OK to proceed❏ Make corrections and proceed❏ Make corrections and show another proof
Signed: ___________________ Date: ______
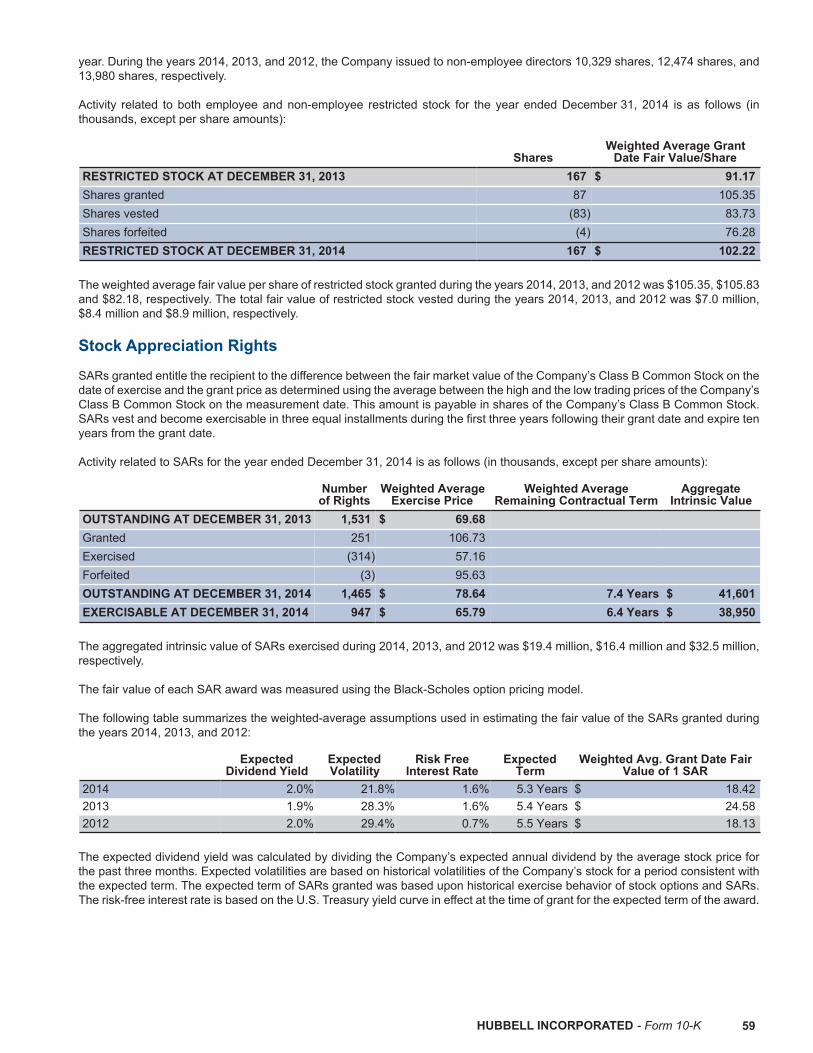
HUBBELL INCORPORATED - Form 10-K 59
year. During the years 2014, 2013, and 2012, the Company issued to non-employee directors 10,329 shares, 12,474 shares, and 13,980 shares, respectively. Activity related to both employee and non-employee restricted stock for the year ended December 31, 2014 is as follows (in thousands, except per share amounts):
SharesWeighted Average Grant
Date Fair Value/ShareRESTRICTED STOCK AT DECEMBER 31, 2013 167 $ 91.17Shares granted 87 105.35Shares vested (83) 83.73Shares forfeited (4) 76.28RESTRICTED STOCK AT DECEMBER 31, 2014 167 $ 102.22
The weighted average fair value per share of restricted stock granted during the years 2014, 2013, and 2012 was $105.35, $105.83 and $82.18, respectively. The total fair value of restricted stock vested during the years 2014, 2013, and 2012 was $7.0 million, $8.4 million and $8.9 million, respectively. Stock Appreciation Rights SARs granted entitle the recipient to the difference between the fair market value of the Company’s Class B Common Stock on the date of exercise and the grant price as determined using the average between the high and the low trading prices of the Company’s Class B Common Stock on the measurement date. This amount is payable in shares of the Company’s Class B Common Stock. SARs vest and become exercisable in three equal installments during the first three years following their grant date and expire ten years from the grant date. Activity related to SARs for the year ended December 31, 2014 is as follows (in thousands, except per share amounts):
Numberof Rights
Weighted AverageExercise Price
Weighted AverageRemaining Contractual Term
AggregateIntrinsic Value
OUTSTANDING AT DECEMBER 31, 2013 1,531 $ 69.68 Granted 251 106.73 Exercised (314) 57.16 Forfeited (3) 95.63 OUTSTANDING AT DECEMBER 31, 2014 1,465 $ 78.64 7.4 Years $ 41,601EXERCISABLE AT DECEMBER 31, 2014 947 $ 65.79 6.4 Years $ 38,950
The aggregated intrinsic value of SARs exercised during 2014, 2013, and 2012 was $19.4 million, $16.4 million and $32.5 million, respectively. The fair value of each SAR award was measured using the Black-Scholes option pricing model.
The following table summarizes the weighted-average assumptions used in estimating the fair value of the SARs granted during the years 2014, 2013, and 2012:
ExpectedDividend Yield
ExpectedVolatility
Risk FreeInterest Rate
ExpectedTerm
Weighted Avg. Grant Date FairValue of 1 SAR
2014 2.0% 21.8% 1.6% 5.3 Years $ 18.422013 1.9% 28.3% 1.6% 5.4 Years $ 24.582012 2.0% 29.4% 0.7% 5.5 Years $ 18.13
The expected dividend yield was calculated by dividing the Company’s expected annual dividend by the average stock price for the past three months. Expected volatilities are based on historical volatilities of the Company’s stock for a period consistent with the expected term. The expected term of SARs granted was based upon historical exercise behavior of stock options and SARs. The risk-free interest rate is based on the U.S. Treasury yield curve in effect at the time of grant for the expected term of the award.
50323_10K.indd 59 2/27/15 11:56 AM
Job Name: 50323PDF Page: 50323_10K 59.p1.pdf
Process Plan: Doc6060_FileDate: 15-03-13Time: 17:08:43
Operator: ____________________________
PageMark-Color-Comp
❏ OK to proceed❏ Make corrections and proceed❏ Make corrections and show another proof
Signed: ___________________ Date: ______
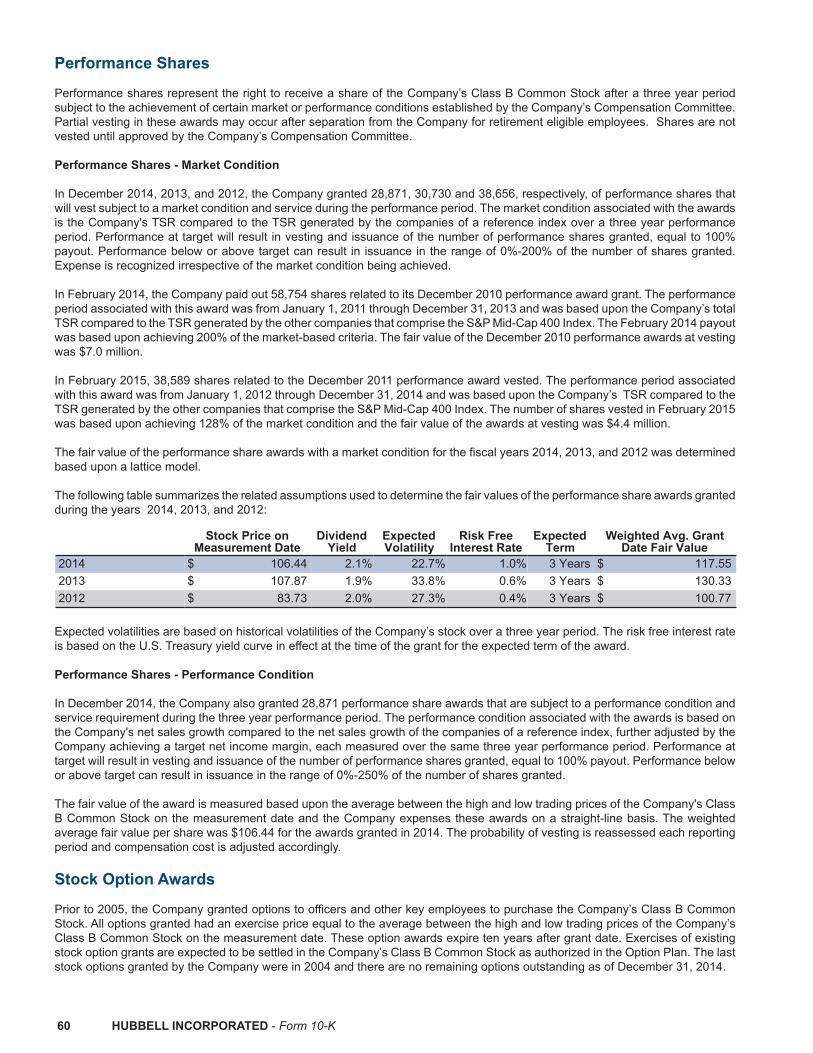
60 HUBBELL INCORPORATED - Form 10-K
Performance Shares
Performance shares represent the right to receive a share of the Company’s Class B Common Stock after a three year period subject to the achievement of certain market or performance conditions established by the Company’s Compensation Committee. Partial vesting in these awards may occur after separation from the Company for retirement eligible employees. Shares are not vested until approved by the Company’s Compensation Committee.
Performance Shares - Market Condition
In December 2014, 2013, and 2012, the Company granted 28,871, 30,730 and 38,656, respectively, of performance shares that will vest subject to a market condition and service during the performance period. The market condition associated with the awards is the Company's TSR compared to the TSR generated by the companies of a reference index over a three year performance period. Performance at target will result in vesting and issuance of the number of performance shares granted, equal to 100% payout. Performance below or above target can result in issuance in the range of 0%-200% of the number of shares granted. Expense is recognized irrespective of the market condition being achieved.
In February 2014, the Company paid out 58,754 shares related to its December 2010 performance award grant. The performance period associated with this award was from January 1, 2011 through December 31, 2013 and was based upon the Company’s total TSR compared to the TSR generated by the other companies that comprise the S&P Mid-Cap 400 Index. The February 2014 payout was based upon achieving 200% of the market-based criteria. The fair value of the December 2010 performance awards at vesting was $7.0 million. In February 2015, 38,589 shares related to the December 2011 performance award vested. The performance period associated with this award was from January 1, 2012 through December 31, 2014 and was based upon the Company’s TSR compared to the TSR generated by the other companies that comprise the S&P Mid-Cap 400 Index. The number of shares vested in February 2015 was based upon achieving 128% of the market condition and the fair value of the awards at vesting was $4.4 million. The fair value of the performance share awards with a market condition for the fiscal years 2014, 2013, and 2012 was determined based upon a lattice model.
The following table summarizes the related assumptions used to determine the fair values of the performance share awards granted during the years 2014, 2013, and 2012:
Stock Price onMeasurement Date
DividendYield
ExpectedVolatility
Risk FreeInterest Rate
ExpectedTerm
Weighted Avg. GrantDate Fair Value
2014 $ 106.44 2.1% 22.7% 1.0% 3 Years $ 117.552013 $ 107.87 1.9% 33.8% 0.6% 3 Years $ 130.332012 $ 83.73 2.0% 27.3% 0.4% 3 Years $ 100.77
Expected volatilities are based on historical volatilities of the Company’s stock over a three year period. The risk free interest rate is based on the U.S. Treasury yield curve in effect at the time of the grant for the expected term of the award.
Performance Shares - Performance Condition
In December 2014, the Company also granted 28,871 performance share awards that are subject to a performance condition and service requirement during the three year performance period. The performance condition associated with the awards is based on the Company's net sales growth compared to the net sales growth of the companies of a reference index, further adjusted by the Company achieving a target net income margin, each measured over the same three year performance period. Performance at target will result in vesting and issuance of the number of performance shares granted, equal to 100% payout. Performance below or above target can result in issuance in the range of 0%-250% of the number of shares granted.
The fair value of the award is measured based upon the average between the high and low trading prices of the Company's Class B Common Stock on the measurement date and the Company expenses these awards on a straight-line basis. The weighted average fair value per share was $106.44 for the awards granted in 2014. The probability of vesting is reassessed each reporting period and compensation cost is adjusted accordingly.
Stock Option Awards Prior to 2005, the Company granted options to officers and other key employees to purchase the Company’s Class B Common Stock. All options granted had an exercise price equal to the average between the high and low trading prices of the Company’s Class B Common Stock on the measurement date. These option awards expire ten years after grant date. Exercises of existing stock option grants are expected to be settled in the Company’s Class B Common Stock as authorized in the Option Plan. The last stock options granted by the Company were in 2004 and there are no remaining options outstanding as of December 31, 2014.
50323_10K.indd 60 2/27/15 11:56 AM
Job Name: 50323PDF Page: 50323_10K 60.p1.pdf
Process Plan: Doc6060_FileDate: 15-03-13Time: 17:08:43
Operator: ____________________________
PageMark-Color-Comp
❏ OK to proceed❏ Make corrections and proceed❏ Make corrections and show another proof
Signed: ___________________ Date: ______

HUBBELL INCORPORATED - Form 10-K 61
Stock option activity for the year ended December 31, 2014 is set forth below (in thousands, except per share amounts):
Number ofShares
Weighted AverageExercise Price
Weighted Average RemainingContractual Term
AggregateIntrinsic Value
OUTSTANDING AT DECEMBER 31, 2013 51 $ 47.95 Exercised (51) 47.95 OUTSTANDING AT DECEMBER 31, 2014 — $ — — $ —EXERCISABLE AT DECEMBER 31, 2014 — $ — — $ —
The aggregate intrinsic value of stock options exercised during 2014, 2013, and 2012 was $3.4 million, $2.9 million and $16.5 million, respectively. Cash received from option exercises was $2.4 million, $2.4 million and $24.8 million for 2014, 2013 and 2012, respectively.
NOTE 18 Earnings Per Share
The Company computes earnings per share using the two-class method, which is an earnings allocation formula that determines earnings per share for common stock and participating securities. Restricted stock granted by the Company is considered a participating security since it contains a non-forfeitable right to dividends. The following table sets forth the computation of earnings per share for the three years ended December 31 (in millions, except per share amounts):
2014 2013 2012Numerator: Net income attributable to Hubbell $ 325.3 $ 326.5 $ 299.7Less: Earnings allocated to participating securities 0.9 1.0 1.0Net income available to common shareholders $ 324.4 $ 325.5 $ 298.7Denominator: Average number of common shares outstanding 58.8 59.1 59.1Potential dilutive shares 0.4 0.5 0.7Average number of diluted shares outstanding 59.2 59.6 59.8Earnings per share: Basic $ 5.51 $ 5.51 $ 5.05Diluted $ 5.48 $ 5.47 $ 5.00
The Company did not have any significant anti-dilutive securities in 2014, 2013 or 2012. In December 2014, the Company granted 28,871 performance shares that are subject to a performance condition. Those shares are excluded from the calculation of 2014 diluted earnings per share because all necessary performance conditions have not been satisfied at the end of the reporting period. Refer to Note 17 - Stock-Based Compensation for further information about those awards.
50323_10K.indd 61 2/27/15 11:56 AM
Job Name: 50323PDF Page: 50323_10K 61.p1.pdf
Process Plan: Doc6060_FileDate: 15-03-13Time: 17:08:43
Operator: ____________________________
PageMark-Color-Comp
❏ OK to proceed❏ Make corrections and proceed❏ Make corrections and show another proof
Signed: ___________________ Date: ______
62 HUBBELL INCORPORATED - Form 10-K
NOTE 19 Accumulated Other Comprehensive Loss
A summary of the changes in Accumulated other comprehensive loss (net of tax) for the three years ended December 31, 2014 is provided below (in millions):
(Debit) credit
Cash FlowHedge
(Loss) Gain
UnrealizedGain (Loss) onAvailable-for-
Sale Securities
Pension andPost Retirement
Benefit Plan Adjustment
CumulativeTranslation Adjustment Total
BALANCE AT DECEMBER 31, 2011 $ (0.2) $ 1.0 $ (153.7) $ 2.5 $ (150.4)Other comprehensive income (loss)before Reclassifications (0.4) (0.3) 13.0 8.3 20.6
Amounts reclassified from accumulatedother comprehensive loss 0.1 — 10.6 — 10.7
Current period other comprehensiveincome (loss) (0.3) (0.3) 23.6 8.3 31.3BALANCE AT DECEMBER 31, 2012 $ (0.5) $ 0.7 $ (130.1) $ 10.8 $ (119.1)Other comprehensive income (loss)before Reclassifications 0.6 (0.3) 54.8 (15.0) 40.1
Amounts reclassified from accumulatedother comprehensive loss (0.3) — 8.3 — 8.0
Current period other comprehensiveincome (loss) 0.3 (0.3) 63.1 (15.0) 48.1BALANCE AT DECEMBER 31, 2013 $ (0.2) $ 0.4 $ (67.0) $ (4.2) $ (71.0)Other comprehensive income (loss)before Reclassifications 0.9 (0.1) (59.8) (35.7) (94.7)Amounts reclassified from accumulatedother comprehensive loss (0.7) — 2.1 — 1.4Current period other comprehensiveincome (loss) 0.2 (0.1) (57.7) (35.7) (93.3)BALANCE AT DECEMBER 31, 2014 $ — $ 0.3 $ (124.7) $ (39.9) $ (164.3)
A summary of the gain (loss) reclassifications out of Accumulated other comprehensive loss for the two years ended December 31 is provided below (in millions):
Details about Accumulated Other ComprehensiveLoss Components 2014 2013
Location of Gain (Loss)Reclassified into Income
Cash flow hedges gain (loss): Forward exchange contracts $ 1.0 $ 0.4 Cost of goods sold 1.0 0.4 Total before tax (0.3) (0.1) Tax (expense) benefit $ 0.7 $ 0.3 Gain (loss) net of taxAmortization of defined benefit pension and postretirement benefit items: Prior-service costs $ 0.8 (a) $ 0.8 (a) Actuarial gains/(losses) (3.8) (a) (13.7) (a) (3.0) (12.9) Total before tax 0.9 4.6 Tax benefit (expense) $ (2.1) $ (8.3) (Loss) gain net of taxLosses reclassified into earnings $ (1.4) $ (8.0) (Loss) gain net of tax(a) These accumulated other comprehensive loss components are included in the computation of net periodic pension cost (see Note 10 -
Retirement Benefits for additional details).
50323_10K.indd 62 2/27/15 11:56 AM
Job Name: 50323PDF Page: 50323_10K 62.p1.pdf
Process Plan: Doc6060_FileDate: 15-03-13Time: 17:08:43
Operator: ____________________________
PageMark-Color-Comp
❏ OK to proceed❏ Make corrections and proceed❏ Make corrections and show another proof
Signed: ___________________ Date: ______

HUBBELL INCORPORATED - Form 10-K 63
NOTE 20 Industry Segments and Geographic Area Information
Nature of Operations Hubbell Incorporated was founded as a proprietorship in 1888, and was incorporated in Connecticut in 1905. Hubbell designs, manufactures and sells quality electrical and electronic products for a broad range of non-residential and residential construction, industrial and utility applications. Products are either sourced complete, manufactured or assembled by subsidiaries in the United States, Canada, Switzerland, Puerto Rico, China, Mexico, Italy, the UK, Brazil and Australia. Hubbell also participates in joint ventures in Taiwan and Hong Kong, and maintains offices in Singapore, China, India, Mexico, South Korea and countries in the Middle East. The Company’s reporting segments consist of the Electrical segment (comprised of electrical systems products and lighting products), and the Power segment, as described below. The Electrical segment is comprised of businesses that sell stock and custom products including standard and special application wiring device products, rough-in electrical products, connector and grounding products, lighting fixtures and controls, and other electrical equipment. The products are typically used in and around industrial, commercial and institutional facilities by electrical contractors, maintenance personnel, electricians, and telecommunications companies. In addition, certain businesses design and manufacture a variety of high voltage test and measurement equipment, industrial controls and communication systems used in the non-residential and industrial markets. Many of these products are designed such that they can also be used in harsh and hazardous locations where a potential for fire and explosion exists due to the presence of flammable gasses and vapors. Harsh and hazardous products are primarily used in the oil and gas (onshore and offshore) and mining industries. There are also a variety of lighting fixtures, wiring devices and electrical products that have residential and utility applications. These products are primarily sold through electrical and industrial distributors, home
centers, some retail and hardware outlets, lighting showrooms and residential product oriented internet sites. Special application products are sold primarily through wholesale distributors to contractors, industrial customers and OEMs. High voltage products are also sold direct to customers through our sales engineers. The Power segment consists of operations that design and manufacture various distribution, transmission, substation and telecommunications products primarily used by the electrical utility industry. In addition, certain of these products are used in the civil construction and transportation industries. Products are sold to distributors and directly to users such as electric utilities, telecommunication companies, mining operations, industrial firms, construction and engineering firms. Financial Information Financial information by industry segment, product class and geographic area for the three years ended December 31, 2014, is summarized below (in millions). When reading the data the following items should be noted: • Net sales comprise sales to unaffiliated customers — inter-
segment and inter-area sales are not significant.• Segment operating income consists of net sales less
operating expenses, including total corporate expenses, which are generally allocated to each segment on the basis of the segment’s percentage of consolidated net sales. Interest expense and investment income and other expense, net have not been allocated to segments as these items are centrally managed by the Company.
• General corporate assets not allocated to segments are principally cash, prepaid pensions, investments and deferred taxes. These assets have not been allocated as they are centrally managed by the Company.
50323_10K.indd 63 2/27/15 11:56 AM
Job Name: 50323PDF Page: 50323_10K 63.p1.pdf
Process Plan: Doc6060_FileDate: 15-03-13Time: 17:08:43
Operator: ____________________________
PageMark-Color-Comp
❏ OK to proceed❏ Make corrections and proceed❏ Make corrections and show another proof
Signed: ___________________ Date: ______

64 HUBBELL INCORPORATED - Form 10-K
INDUSTRY SEGMENT DATA
2014 2013 2012Net Sales: Electrical $ 2,398.2 $ 2,262.6 $ 2,114.6Power 961.2 921.3 929.8TOTAL NET SALES $ 3,359.4 $ 3,183.9 $ 3,044.4Operating Income: Electrical $ 337.9 $ 341.1 $ 303.7Power 179.5 166.5 168.1Operating Income $ 517.4 $ 507.6 $ 471.8Interest expense (31.2) (30.8) (30.8)Investment income and other expense, net (0.7) (3.0) 0.8INCOME BEFORE INCOME TAXES $ 485.5 $ 473.8 $ 441.8Assets: Electrical $ 1,963.0 $ 1,813.8 $ 1,659.2Power 832.0 707.0 710.4General Corporate 527.8 666.4 577.4TOTAL ASSETS $ 3,322.8 $ 3,187.2 $ 2,947.0Capital Expenditures: Electrical $ 35.1 $ 32.4 $ 27.1Power 21.8 25.0 20.4General Corporate 3.4 1.4 1.6TOTAL CAPITAL EXPENDITURES $ 60.3 $ 58.8 $ 49.1Depreciation and Amortization: Electrical $ 53.4 $ 48.0 $ 45.8Power 25.8 22.6 21.0TOTAL DEPRECIATION AND AMORTIZATION $ 79.2 $ 70.6 $ 66.8
PRODUCT CLASS DATA
2014 2013 2012Net Sales: Electrical Systems $ 1,538.7 $ 1,466.4 $ 1,376.1Lighting 859.5 796.2 738.5Power 961.2 921.3 929.8TOTAL NET SALES $ 3,359.4 $ 3,183.9 $ 3,044.4
GEOGRAPHIC AREA DATA
2014 2013 2012Net Sales: United States $ 2,883.8 $ 2,687.6 $ 2,541.6International 475.6 496.3 502.8TOTAL NET SALES $ 3,359.4 $ 3,183.9 $ 3,044.4Operating Income: United States $ 447.2 $ 417.5 $ 383.8International 70.2 90.1 88.0TOTAL OPERATING INCOME $ 517.4 $ 507.6 $ 471.8Long-lived Assets: United States $ 1,492.5 $ 1,341.4 $ 1,225.4International 199.7 212.3 227.0TOTAL LONG-LIVED ASSETS $ 1,692.2 $ 1,553.7 $ 1,452.4
50323_10K.indd 64 2/27/15 11:56 AM
Job Name: 50323PDF Page: 50323_10K 64.p1.pdf
Process Plan: Doc6060_FileDate: 15-03-13Time: 17:08:43
Operator: ____________________________
PageMark-Color-Comp
❏ OK to proceed❏ Make corrections and proceed❏ Make corrections and show another proof
Signed: ___________________ Date: ______

HUBBELL INCORPORATED - Form 10-K 65
On a geographic basis, the Company defines “international” as operations based outside of the United States and its possessions. As a percentage of total net sales, shipments from foreign operations directly to third parties were 14% in 2014, 16% in 2013 and 17% in 2012, with the Canadian and UK operations representing approximately 31% and 26%, respectively, of 2014 total international net sales. Switzerland, Brazil and Mexico each represent 10% of 2014 total international
sales. Long-lived assets, excluding deferred tax assets, of international subsidiaries were 12% of the consolidated total in 2014, 14% in 2013 and 16% in 2012, with the UK, Mexico and Canada operations representing approximately 28%, 20%, and 18%, respectively, of the 2014 international total. Export sales from United States operations were $234.5 million in 2014, $213.0 million in 2013 and $243.9 million in 2012.
NOTE 21 Guarantees
The Company records a liability equal to the fair value of guarantees in the Consolidated Balance Sheet in accordance with the accounting guidance for guarantees. When it is probable that a liability has been incurred and the amount can be reasonably estimated, the Company accrues for costs associated with guarantees. The most likely costs to be incurred are accrued based on an evaluation of currently available facts and, where no amount within a range of estimates is more likely, the minimum is accrued. As of December 31, 2014, the fair value and maximum potential payment related to the Company’s guarantees were not material. The Company offers product warranties which cover defects on most of its products. These warranties primarily apply to products that are properly installed, maintained and used for their intended purpose. The Company accrues estimated
warranty costs at the time of sale. Estimated warranty expenses, recorded in cost of goods sold, are based upon historical information such as past experience, product failure rates, or the estimated number of units to be repaired or replaced. Adjustments are made to the product warranty accrual as claims are incurred, additional information becomes known or as historical experience indicates. Changes in the accrual for product warranties in 2014 are set forth below (in millions):
BALANCE AT DECEMBER 31, 2013 $ 6.6Provision 18.3Expenditures/other (11.2)BALANCE AT DECEMBER 31, 2014 $ 13.7
50323_10K.indd 65 2/27/15 11:57 AM
Job Name: 50323PDF Page: 50323_10K 65.p1.pdf
Process Plan: Doc6060_FileDate: 15-03-13Time: 17:08:43
Operator: ____________________________
PageMark-Color-Comp
❏ OK to proceed❏ Make corrections and proceed❏ Make corrections and show another proof
Signed: ___________________ Date: ______

66 HUBBELL INCORPORATED - Form 10-K
NOTE 22 Subsequent Events
In January 2015 the Company completed the following acquisitions for an aggregate cash purchase price of approximately $126 million.
On January 21, 2015, the Company acquired the majority of the net assets of the Acme Electric business division of Power Products, LLC and all of the outstanding common stock of Acme Electric de Mexico S. de R.L. de C.V. and Acme Electric Manufacturing de Mexico S. de R.L. de C.V. (collectively "Acme") for approximately $67 million. Acme is a market leader in power conditioning equipment for use in industrial, commercial, and OEM applications and will be reported in the Electrical segment.
On January 21, 2015, the Company acquired the majority of net assets of the Turner Electric business division of Power Products, LLC ("Turner") constituting the transmission and substation switching business for approximately $38 million. Turner is a leading manufacturer of high voltage, air insulated
disconnect switches for electric substations and transmission lines and a leader in key switch accessories.Turner will be reported in the Power segment.
On January 20, 2015, the Company acquired all of the membership interests of the Electric Controller and Manufacturing Company, LLC ("EC&M") for approximately $21 million. EC&M designs and manufactures crane control products used in a wide range of heavy industry markets and is a premium brand and recognized leader in those markets. EC&M will be reported in the Electrical segment.
These acquisitions will be accounted for as business combinations whereby purchase accounting requires the assets acquired and liabilities assumed be recognized at their fair values as of the acquisition date and goodwill and other intangible assets associated with tradenames and customer lists, among others, to be recognized. The preliminary purchase accounting for the acquisitions is not yet complete.
NOTE 23 Quarterly Financial Data (Unaudited)
The table below sets forth summarized quarterly financial data for the years ended December 31, 2014 and 2013 (in millions, except per share amounts):
First Quarter Second Quarter Third Quarter Fourth Quarter2014 Net Sales $ 759.5 $ 855.8 $ 895.3 $ 848.8Gross Profit $ 245.0 $ 292.5 $ 296.2 $ 275.3Net Income $ 65.3 $ 90.8 $ 90.5 $ 80.6Net Income attributable to Hubbell $ 64.2 $ 90.2 $ 89.6 $ 81.3Earnings Per Share — Basic $ 1.08 $ 1.53 $ 1.52 $ 1.39Earnings Per Share — Diluted $ 1.08 $ 1.51 $ 1.51 $ 1.382013 Net Sales $ 740.1 $ 801.3 $ 835.9 $ 806.6Gross Profit $ 236.3 $ 272.0 $ 291.3 $ 270.9Net Income $ 66.8 $ 83.0 $ 97.2 $ 82.8Net Income attributable to Hubbell $ 65.9 $ 82.1 $ 96.5 $ 82.0Earnings Per Share — Basic $ 1.11 $ 1.38 $ 1.63 $ 1.39Earnings Per Share — Diluted $ 1.10 $ 1.37 $ 1.62 $ 1.38
50323_10K.indd 66 2/27/15 11:57 AM
Job Name: 50323PDF Page: 50323_10K 66.p1.pdf
Process Plan: Doc6060_FileDate: 15-03-13Time: 17:08:43
Operator: ____________________________
PageMark-Color-Comp
❏ OK to proceed❏ Make corrections and proceed❏ Make corrections and show another proof
Signed: ___________________ Date: ______

HUBBELL INCORPORATED - Form 10-K 67
ITEM 9 Changes in and Disagreements with Accountants on Accounting and Financial DisclosureNot applicable.
ITEM 9A Controls and Procedures The Company maintains disclosure controls and procedures that are designed to ensure that information required to be disclosed in Exchange Act reports is recorded, processed, summarized and reported within the time periods specified in the SEC’s rules and forms, and that such information is accumulated and communicated to management, including the Chief Executive Officer and Chief Financial Officer, as appropriate, to allow timely decisions regarding required disclosure. Management necessarily applied its judgment in assessing the costs and benefits of such controls and procedures which, by their nature, can provide only reasonable assurance that the controls and procedures will meet their objectives. The Company carried out an evaluation, under the supervision and with the participation of management, including the Chief Executive Officer and Chief Financial Officer, of the effectiveness of the design and operation of the Company’s disclosure controls and procedures as defined in Exchange Act Rules 13a-15(e) and 15d-15(e), as of the end of the period covered by this report on Form 10-K. Based upon that evaluation, each of the Chief Executive Officer and Chief Financial Officer concluded that the Company’s disclosure controls and procedures are effective at a reasonable assurance level. Management’s annual report on internal control over financial reporting and the independent registered public accounting firm’s audit report on the effectiveness of our internal control over financial reporting as of December 31, 2014 are included in Item 8 of this Annual Report on Form 10-K. There have been no changes in the Company’s internal control over financial reporting that occurred during the Company’s most recently completed quarter that have materially affected, or are reasonably likely to materially affect, the Company’s internal control over financial reporting.
ITEM 9B Other Information Not applicable.
50323_10K.indd 67 2/27/15 11:57 AM
Job Name: 50323PDF Page: 50323_10K 67.p1.pdf
Process Plan: Doc6060_FileDate: 15-03-13Time: 17:08:43
Operator: ____________________________
PageMark-Color-Comp
❏ OK to proceed❏ Make corrections and proceed❏ Make corrections and show another proof
Signed: ___________________ Date: ______

68 HUBBELL INCORPORATED - Form 10-K
PART III
ITEM 10 Directors, Executive Officers and Corporate Governance(1)
ITEM 11 Executive Compensation(2)
ITEM 12 Security Ownership of Certain Beneficial Owners and Management and Related Stockholder Matters
Equity Compensation Plan Information
The following table provides information as of December 31, 2014 with respect to the Company’s common stock that may be issued under the Company’s equity compensation plans (in thousands, except per share amounts):
A B C
Plan Category
Number of Securities to beIssued upon Exercise of
OutstandingOptions,Warrants and Rights
Weighted AverageExercise Price of
Outstanding Options,Warrants and Rights
Number of SecuritiesRemaining Available forFuture Issuance Under
Equity Compensation Plans(Excluding Securities
Reflected in Column A) Equity Compensation Plans Approved by Shareholders(a) 1,710
(c)(e)$ 78.69
(f)1,475
(c)
Equity Compensation Plans Not Requiring Shareholder Approval(b)
(c)(d)— 35
(c)
TOTAL 1,710 $ 78.69 1,510 (a) The Company’s (1) Option Plan and (2) Award Plan.(b) The Company’s Deferred Compensation Plan for Directors.(c) Class B Common Stock.(d) Represents amount of shares currently deferred under this plan. These shares are not included in the total weighted average exercise price
included in column B.(e) Includes 242 performance share awards assuming a maximum payout target. The Company does not anticipate that the maximum payout
target will be achieved for all of these awards.(f) Weighted average exercise price excludes performance share awards included in column A.
The remaining information required by this item is incorporated by reference to the subheading “Voting Rights and Security Ownership of Certain Beneficial Owners and Management” of the definitive proxy statement for the Company’s annual meeting of shareholders scheduled to be held on May 5, 2015.
(1) Certain of the information required by this item regarding executive officers is included under the subheading “Executive Officers of the Registrant” at the end of Part I of this Form 10-K and the remaining required information is incorporated by reference to the subheadings “Item 1 – Election of Directors,” “General – Information Regarding Executive Officers,” “General – Section 16(a) Beneficial Ownership Reporting Compliance,” “Corporate Governance – Code of Ethics,” and “Corporate Governance – Board Committees – Audit Committee” of the definitive proxy statement for the Company’s annual meeting of shareholders scheduled to be held on May 5, 2015.
(2) The information required by this item is incorporated by reference to the subheadings “Compensation Discussion and Analysis,” “Compensation Committee Report,” “Executive Compensation” and “Compensation of Directors” of the definitive proxy statement for the Company’s annual meeting of shareholders scheduled to be held on May 5, 2015.
50323_10K.indd 68 2/27/15 11:57 AM
Job Name: 50323PDF Page: 50323_10K 68.p1.pdf
Process Plan: Doc6060_FileDate: 15-03-13Time: 17:08:43
Operator: ____________________________
PageMark-Color-Comp
❏ OK to proceed❏ Make corrections and proceed❏ Make corrections and show another proof
Signed: ___________________ Date: ______

HUBBELL INCORPORATED - Form 10-K 69
ITEM 13 Certain Relationships and Related Transactions and Director Independence(3)
ITEM 14 Principal Accountant Fees and Services(4)
(3) The information required by this item is incorporated by reference to the subheadings “General – Review and Approval of Related Person Transactions” and “Corporate Governance – Director Independence” of the definitive proxy statement for the Company’s annual meeting of shareholders scheduled to be held on May 5, 2015.
(4) The information required by this item is incorporated by reference to the heading “Item 2 – Ratification of the Selection of Independent Registered Public Accounting Firm” of the definitive proxy statement for the Company’s annual meeting of shareholders scheduled to be held on May 5, 2015.
50323_10K.indd 69 2/27/15 11:57 AM
Job Name: 50323PDF Page: 50323_10K 69.p1.pdf
Process Plan: Doc6060_FileDate: 15-03-13Time: 17:08:43
Operator: ____________________________
PageMark-Color-Comp
❏ OK to proceed❏ Make corrections and proceed❏ Make corrections and show another proof
Signed: ___________________ Date: ______

70 HUBBELL INCORPORATED - Form 10-K
PART IV
ITEM 15 Exhibits and Financial Statement Schedule
1. Financial Statements and Schedule
Financial statements and schedule listed in the Index to Financial Statements and Schedule are filed as part of this Annual Report on Form 10-K.
2. Exhibits
Incorporated by Reference
Number Description Form File No. ExhibitFilingDate
Filed/Furnished
Herewith3.1 Restated Certificate of Incorporation, as amended and
restated as of September 23, 200310-Q 001-02958 3a 11/10/2003
3.2 Amended and Restated By-Laws of Hubbell Incorporated,as amended on May 7, 2013
8-K 001-02958 3.1 5/10/2013
4.1 Senior Indenture, dated as of September 15, 1995, betweenHubbell Incorporated and JPMorgan Chase Bank (formerlyknown as The Chase Manhattan Bank and Chemical Bank),as trustee
S-4 333-90754 4a 6/18/2002
4.2 First Supplemental Indenture, dated as of June 2, 2008,between Hubbell Incorporated and The Bank of New YorkTrust Company, N.A. (as successor to JPMorgan ChaseBank, N.A., The Chase Manhattan Bank and ChemicalBank), as trustee, including the form of 5.95% Senior Notesdue 2018
8-K 001-02958 4.2 6/2/2008
4.3 Second Supplemental Indenture, dated as of November 17,2010, between Hubbell Incorporated and The Bank of NewYork Mellon Trust Company, N.A. (as successor to The Bankof New York Trust Company, N.A., JPMorgan Chase Bank,N.A., The Chase Manhattan Bank and Chemical Bank), astrustee, including the form of 3.625% Senior Notes due 2022
8-K 001-02958 4.2 11/17/2010
4.4 Amended and Restated Rights Agreement, dated as ofDecember 17, 2008, between Hubbell Incorporated andMellon Investor Services LLC (successor to ChaseMellonShareholder Services, L.L.C.), as Rights Agent
8-K 001-02958 4.1 12/17/2008
10.1† Hubbell Incorporated Amended and Restated SupplementalExecutive Retirement Plan, as amended and restatedeffective January 1, 2005
10-Q 001-02958 10a 10/26/2007
10.1(a)† Amendment, dated February 15, 2008, to HubbellIncorporated Amended and Restated SupplementalExecutive Retirement Plan, as amended and restatedeffective January 1, 2005
10-K 001-02958 10.nn 2/25/2008
10.1(b)† Amendment, dated December 28, 2010, to HubbellIncorporated Amended and Restated SupplementalExecutive Retirement Plan, as amended and restatedeffective January 1, 2005
10-K 001-02958 10a(1) 2/16/2011
10.2† Hubbell Incorporated Retirement Plan for Directors, asamended and restated effective January 1, 2005
10-Q 001-02958 10i 10/26/2007
10.3† Hubbell Incorporated Supplemental ManagementRetirement Plan, effective September 12, 2007
10-Q 001-02958 10.kk 10/26/2007
10.3(a)† Amendment to Hubbell Incorporated SupplementalManagement Retirement Plan, effective September 12,2007
10-K 001-02958 10.kk(1) 2/16/2011
10.4† Hubbell Incorporated Stock Option Plan for Key Employees,as amended and restated effective May 5, 2003
10-Q 001-02958 10(1) 8/12/2003
50323_10K.indd 70 2/27/15 11:57 AM
Job Name: 50323PDF Page: 50323_10K 70.p1.pdf
Process Plan: Doc6060_FileDate: 15-03-13Time: 17:08:43
Operator: ____________________________
PageMark-Color-Comp
❏ OK to proceed❏ Make corrections and proceed❏ Make corrections and show another proof
Signed: ___________________ Date: ______

HUBBELL INCORPORATED - Form 10-K 71
Incorporated by Reference
Number Description Form File No. ExhibitFilingDate
Filed/Furnished
Herewith10.4(a)† Amendment, dated June 9, 2004, to the Hubbell
Incorporated Stock Option Plan for Key Employees10-Q 001-02958 10ee 8/5/2004
10.4(b)† Amendment, dated September 21, 2006, to the HubbellIncorporated Stock Option Plan for Key Employees
10-Q 001-02958 10.2 11/7/2006
10.5† Hubbell Incorporated Deferred Compensation Plan forDirectors, as amended and restated effective January 1,2005, as amended December 4, 2007
10-K 001-02958 10f 2/25/2008
10.5(a)† Amendment, dated December 10, 2008, to the HubbellIncorporated Deferred Compensation Plan for Directors
10-K 001-02958 10f(1) 2/20/2009
10.5(b)† Amendment, dated December 21, 2011, to the HubbellIncorporated Deferred Compensation Plan for Directors
10-K 001-02958 10f(2) 2/15/2012
10.6† Hubbell Incorporated Amended and Restated DeferredCompensation Plan for Directors, as amended and restatedeffective February 7, 2013
10-Q 001-02958 10f 4/19/2013
10.7† Hubbell Incorporated Executive Deferred CompensationPlan, effective January 1, 2008
10-Q 001-02958 10.jj 10/26/2007
10.8† Hubbell Incorporated Amended and Restated Top HatRestoration Plan, as amended and restated effectiveJanuary 1, 2005
10-Q 001-02958 10w 10/26/2007
10.8(a)† Amendment, dated December 28, 2010, to HubbellIncorporated Amended and Restated Top Hat RestorationPlan, as amended and restated effective January 1, 2005
10-K 001-02958 10w(1) 2/16/2011
10.9† Hubbell Incorporated Incentive Compensation Plan, adoptedeffective January 1, 2002
10-K 001-02958 10z 3/20/2002
10.10† Hubbell Incorporated Senior Executive IncentiveCompensation Plan, effective January 1, 2011
8-K 001-02958 10.1 5/5/2011
10.11† Hubbell Incorporated 2005 Incentive Award Plan, asamended and restated effective as of May 3, 2010
8-K 001-02958 10.1 5/7/2010
10.12† Form of Restricted Stock Award Agreement under theHubbell Incorporated 2005 Incentive Award Plan, asamended and restated
10-Q 001-02958 10.5 7/19/2013
10.13† Form of Restricted Stock Award Agreement for Directorsunder the Hubbell Incorporated 2005 Incentive Award Plan,as amended and restated
10-Q 001-02958 10.8 7/19/2013
10.14† Form of Stock Appreciation Rights Award Agreement underthe Hubbell Incorporated 2005 Incentive Award Plan, asamended and restated
*
10.15† Form of Performance Share Award Agreement under theHubbell Incorporated 2005 Incentive Award Plan, asamended and restated
*
10.16 Form of Performance Based Restricted Stock AwardAgreement under the Hubbell Incorporated 2005 IncentiveAward Plan, as amended and restated
*
10.17† Hubbell Incorporated Key Employee Supplemental MedicalPlan, as amended and restated effective January 1, 2005
10-Q 001-02958 10h 10/26/2007
10.18† Hubbell Incorporated Defined Contribution Restoration Plan,effective January 1, 2011
8-K 001-02958 10.1 12/13/2010
10.19† Hubbell Incorporated Policy for Providing SeverancePayments to Senior Employees, effective February 11, 2011
8-K 001-02958 10.1 2/16/2011
10.20† Grantor Trust for Senior Management Plans TrustAgreement, dated as of March 14, 2005, between HubbellIncorporated and The Bank of New York, as Trustee
8-K 001-02958 10.9 3/15/2005
10.20(a)† First Amendment, dated as of December 3, 2007, to theHubbell Incorporated Grantor Trust for Senior ManagementPlans Trust Agreement, effective January 1, 2005.
10-K 001-02958 10.9.1 2/25/2008
10.20(b)† Second Amendment, dated as of June 3, 2009, to theHubbell Incorporated Grantor Trust for Senior ManagementPlans Trust Agreement
10-Q 001-02958 10.9.2 7/24/2009
10.20(c)† Third Amendment, dated as of May 11, 2012, to the HubbellIncorporated Grantor Trust for Senior Management PlansTrust Agreement
10-Q 001-02958 10.9.3 7/20/2012
10.21† Grantor Trust for Non-Employee Director Plans TrustAgreement, dated as of March 14, 2005, between HubbellIncorporated and The Bank of New York
8-K 001-02958 10.10 3/15/2005
50323_10K.indd 71 2/27/15 11:57 AM
Job Name: 50323PDF Page: 50323_10K 71.p1.pdf
Process Plan: Doc6060_FileDate: 15-03-13Time: 17:08:43
Operator: ____________________________
PageMark-Color-Comp
❏ OK to proceed❏ Make corrections and proceed❏ Make corrections and show another proof
Signed: ___________________ Date: ______

72 HUBBELL INCORPORATED - Form 10-K
Incorporated by Reference
Number Description Form File No. ExhibitFilingDate
Filed/Furnished
Herewith10.21(a)† First Amendment, dated as of December 3, 2007, to the
Hubbell Incorporated Grantor Trust for Non-EmployeeDirector Plans Trust Agreement, effective January 1, 2005
10-K 001-02958 10.10.1 2/25/2008
10.21(b)† Second Amendment, dated as of May 11, 2012, to theHubbell Incorporated Grantor Trust for Non-EmployeeDirector Plans Trust Agreement
10-Q 001-02958 10.10.2 7/20/2012
10.22† Trust Agreement, dated as of January 1, 2008, by andbetween Hubbell Incorporated and T. Rowe Price TrustCompany, as Trustee
10-K 001-02958 10.mm 2/25/2008
10.23† Change in Control Severance Agreement, dated as ofDecember 31, 2010, between Hubbell Incorporated andJames H. Biggart
8-K 001-02958 10.4 1/5/2011
10.24† Change in Control Severance Agreement, dated as ofDecember 31, 2010, between Hubbell Incorporated andWilliam R. Murphy
8-K 001-02958 10.5 1/5/2011
10.25† Change in Control Severance Agreement, dated as ofDecember 31, 2010, between Hubbell Incorporated andGary N. Amato
8-K 001-02958 10.7 1/5/2011
10.26† Change in Control Severance Agreement, dated as ofDecember 31, 2010, between Hubbell Incorporated andDavid G. Nord
8-K 001-02958 10.2 1/5/2011
10.26(a)† Amendment, dated as of January 1, 2013, to Change inControl Severance Agreement between HubbellIncorporated and David G. Nord
8-K 001-02958 10.1 12/6/2012
10.27† Letter Agreement, dated August 24, 2005, between HubbellIncorporated and David G. Nord
8-K 001-02958 99.1 9/6/2005
10.28† Change in Control Severance Agreement, dated as ofDecember 31, 2010, between Hubbell Incorporated andScott H. Muse
8-K 001-02958 10.8 1/5/2011
10.29† Change in Control Severance Agreement, dated as ofDecember 31, 2010, between Hubbell Incorporated andWilliam T. Tolley
8-K 001-02958 10.9 1/5/2011
10.30† Change in Control Severance Agreement, dated as ofDecember 31, 2010, between Hubbell Incorporated andWilliam R. Sperry
8-K 001-02958 10.1 9/17/2012
10.30(a)† Amendment, dated September 11, 2012, to Change inControl Severance Agreement between HubbellIncorporated and William R. Sperry
8-K 001-02958 10.2 9/17/2012
10.31† Change in Control Severance Agreement, dated as ofSeptember 11, 2012, between Hubbell Incorporated and An-Ping Hsieh
10-Q 001-02958 10.xx 10/19/2012
10.32† Letter Agreement, dated as of August 2, 2012, betweenHubbell Incorporated and An-Ping Hsieh
10-Q 001-02958 10.1 7/19/2013
10.33† Change in Control Severance Agreement, dated as of April15, 2013, between Hubbell Incorporated and Mr. Joseph A.Capozzoli
8-K 001-02958 10.1 4/19/2013
10.34† Letter Agreement, dated as of February 15, 2013, betweenHubbell Incorporated and Mr. Joseph A. Capozzoli
8-K 001-02958 10.2 4/19/2013
10.35† Change in Control Severance Agreement, dated as ofDecember 31, 2010, between Hubbell Incorporated andStephen M. Mais
10-Q 001-02958 10.3 7/19/2013
10.36† Change in Control Severance Agreement, dated as ofJanuary 24, 2014, between Hubbell Incorporated andGerben W. Bakker
10-K 001-02958 10.36 2/18/2014
10.37 Credit Agreement, dated as of October 20, 2011 by andamong Hubbell Incorporated, Hubbell Cayman Limited,Hubbell Investments Limited, the Lenders Party thereto,Wells Fargo Bank, National Association and HSBC BankUSA National Association as Syndication Agents and Bankof America, N.A. and U.S. Bank National Association asDocumentation Agents, JPMorgan Chase Bank, N.A., asAdministrative Agent, and J.P. Morgan Securities, LLC,Wells Fargo Securities, LLC and HSBC Bank USA, NationalAssociation as Joint Lead Arrangers and Joint Bookrunners
8-K 001-02958 99.1 10/20/2011
10.37(a) Amendment No. 1, dated as of March 7, 2013, to CreditAgreement by and among Hubbell Incorporated, HubbellCayman Limited, Hubbell Investments Limited, JPMorganChase Bank, N.A., as Administrative Agent, and the Lendersparty thereto
10-Q 001-02958 10.1 10/18/2013
50323_10K.indd 72 2/27/15 11:57 AM
Job Name: 50323PDF Page: 50323_10K 72.p1.pdf
Process Plan: Doc6060_FileDate: 15-03-13Time: 17:08:43
Operator: ____________________________
PageMark-Color-Comp
❏ OK to proceed❏ Make corrections and proceed❏ Make corrections and show another proof
Signed: ___________________ Date: ______
HUBBELL INCORPORATED - Form 10-K 73
Incorporated by Reference
Number Description Form File No. ExhibitFilingDate
Filed/Furnished
Herewith10.37(b) Amendment No. 2, dated as of October 31, 2013, to Credit
Agreement by and among Hubbell Incorporated, HubbellCayman Limited, Hubbell Investments Limited, JPMorganChase Bank, N.A., as Administrative Agent, and the Lendersparty thereto
10-K 001-02958 10.37(b) 2/18/2014
21.1 List of subsidiaries *23.1 Consent of PricewaterhouseCoopers LLP *31.1 Certification of Chief Executive Officer pursuant to Exchange
Act Rule 13a-14(a)/15d-14(a), as adopted pursuant toSection 302 of the Sarbanes-Oxley Act of 2002
*
31.2 Certification of Chief Financial Officer pursuant to ExchangeAct Rule 13a-14(a)/15d-14(a), as adopted pursuant toSection 302 of the Sarbanes-Oxley Act of 2002
*
32.1 Certification of Chief Executive Officer Pursuant to 18 U.S.C.Section 1350, as adopted pursuant to Section 906 of theSarbanes-Oxley Act of 2002
**
32.2 Certification of Chief Financial Officer Pursuant to 18 U.S.CSection 1350, as adopted pursuant to Section 906 of theSarbanes-Oxley Act of 2002
**
101.INS XBRL Instance Document *101.SCH XBRL Taxonomy Extension Schema Document *101.CAL XBRL Taxonomy Extension Calculation Linkbase Document *101.DEF XBRL Taxonomy Extension Definition Linkbase Document *101.LAB XBRL Taxonomy Extension Label Linkbase Document *101.PRE XBRL Taxonomy Extension Presentation Linkbase
Document *
† A management contract or compensatory plan or arrangement required to be filed as an exhibit pursuant to Item 15(a)(3) of Form 10-K.* Filed herewith.** Furnished herewith.
50323_10K.indd 73 2/27/15 11:57 AM
Job Name: 50323PDF Page: 50323_10K 73.p1.pdf
Process Plan: Doc6060_FileDate: 15-03-13Time: 17:08:43
Operator: ____________________________
PageMark-Color-Comp
❏ OK to proceed❏ Make corrections and proceed❏ Make corrections and show another proof
Signed: ___________________ Date: ______

74 HUBBELL INCORPORATED - Form 10-K
Signatures Pursuant to the requirements of Section 13 or 15(d) of the Securities Exchange Act of 1934, the registrant has duly caused this report to be signed on its behalf by the undersigned, thereunto duly authorized.
HUBBELL INCORPORATED By /s/ JOSEPH A. CAPOZZOLI By /s/ WILLIAM R. SPERRY Joseph A. Capozzoli William R. Sperry Vice President and Controller Senior Vice President and Chief (Principal Accounting Officer) Financial OfficerDate: February 19, 2015
Pursuant to the requirements of the Securities Exchange Act of 1934, this report has been signed below by the following persons on behalf of the registrant and in the capacities and on the dates indicated.
Title DateBy /s/ D. G. NORD
D. G. NordChariman, President and Chief Executive Officer and Director 2/19/2015
By /s/ W. R. SPERRYW. R. Sperry
Senior Vice President and Chief Financial Officer 2/19/2015
By /s/ J. A. CAPOZZOLIJ. A. Capozzoli
Vice President, Controller 2/19/2015
By /s/ C. M. CARDOSOC. M. Cardoso
Director 2/19/2015
By /s/ L. J. GOODL. J. Good
Director 2/19/2015
By /s/ A. J. GUZZIA. J. Guzzi
Director 2/19/2015
By /s/ N. J. KEATINGN. J. Keating
Director 2/19/2015
By /s/ J. F. MALLOYJ. F. Malloy
Director 2/19/2015
By /s/ A. MCNALLY IVA. McNally IV
Director 2/19/2015
By /s/ G. J. RATCLIFFEG. J. Ratcliffe
Director 2/19/2015
By /s/ C. A. RODRIGUEZC. A. Rodriguez
Director 2/19/2015
By /s/ J. G. RUSSELLJ. G. Russell
Director 2/19/2015
By /s/ S. R. SHAWLEYS. R. Shawley
Director 2/19/2015
By /s/ R. J. SWIFTR. J. Swift
Director 2/19/2015
50323_10K.indd 74 2/27/15 11:57 AM
Job Name: 50323PDF Page: 50323_10K 74.p1.pdf
Process Plan: Doc6060_FileDate: 15-03-13Time: 17:08:44
Operator: ____________________________
PageMark-Color-Comp
❏ OK to proceed❏ Make corrections and proceed❏ Make corrections and show another proof
Signed: ___________________ Date: ______

HUBBELL INCORPORATED - Form 10-K 75
Valuation and Qualifying Accounts and Reserves for the Years Ended December 31, 2012, 2013 and 2014 Reserves deducted in the balance sheet from the assets to which they apply (in millions):
Balanceat Beginning
of Year
Additions / (Reversals)Charged to Costs and
Expenses Deductions Acquisitions Balance atEnd of Year
Allowances for doubtful accounts receivable: Year 2012 $ 3.0 $ 1.4 $ (1.2) $ — $ 3.2Year 2013 $ 3.2 $ (0.2) $ (0.9) $ — $ 2.1Year 2014 $ 2.1 $ 1.6 $ (0.3) $ — $ 3.4Allowance for credit memos, returns and cash discounts: Year 2012 $ 22.8 $ 192.5 $ (192.4) $ — $ 22.9Year 2013 $ 22.9 $ 208.0 $ (199.3) $ — $ 31.6Year 2014 $ 31.6 $ 222.4 $ (217.3) $ — $ 36.7Valuation allowance on deferred tax assets: Year 2012 $ 19.7 $ 6.4 $ — $ — $ 26.1Year 2013 $ 26.1 $ 2.6 $ (0.2) $ — $ 28.5Year 2014 $ 28.5 $ 4.5 $ — $ 1.3 $ 34.3
50323_10K.indd 75 2/27/15 11:57 AM
Job Name: 50323PDF Page: 50323_10K 75.p1.pdf
Process Plan: Doc6060_FileDate: 15-03-13Time: 17:08:44
Operator: ____________________________
PageMark-Color-Comp
❏ OK to proceed❏ Make corrections and proceed❏ Make corrections and show another proof
Signed: ___________________ Date: ______
76 HUBBELL INCORPORATED - Form 10-K
EXHIBIT 31.1
I, David G. Nord, certify that: 1. I have reviewed this annual report on Form 10-K of Hubbell Incorporated (the “registrant”);
2. Based on my knowledge, this report does not contain any untrue statement of a material fact or omit to state a material fact necessary to make the statements made, in light of the circumstances under which such statements were made, not misleading with respect to the period covered by this report;
3. Based on my knowledge, the financial statements, and other financial information included in this report, fairly present in all material respects the financial condition, results of operations and cash flows of the registrant as of, and for, the periods presented in this report;
4. The registrant’s other certifying officer(s) and I are responsible for establishing and maintaining disclosure controls and procedures (as defined in Exchange Act Rules 13a-15(e) and 15d-15(e)) and internal control over financial reporting (as defined in Exchange Act Rules 13a-15(f) and 15d-15(f)) for the registrant and have:
a) Designed such disclosure controls and procedures, or caused such disclosure controls and procedures to be designed under our supervision, to ensure that material information relating to the registrant, including its consolidated subsidiaries, is made known to us by others within those entities, particularly during the period in which this report is being prepared;
b) Designed such internal control over financial reporting, or caused such internal control over financial reporting to be designed under our supervision, to provide reasonable assurance regarding the reliability of financial reporting and the preparation of financial statements for external purposes in accordance with generally accepted accounting principles;
c) Evaluated the effectiveness of the registrant’s disclosure controls and procedures and presented in this report our conclusions about the effectiveness of the disclosure controls and procedures, as of the end of the period covered by this report based on such evaluation; and
d) Disclosed in this report any change in the registrant’s internal control over financial reporting that occurred during the registrant’s most recent fiscal quarter (the registrant’s fourth fiscal quarter in the case of an annual report) that has materially affected, or is reasonably likely to materially affect, the registrant’s internal control over financial reporting; and
5. The registrant’s other certifying officer(s) and I have disclosed, based on our most recent evaluation of internal control over financial reporting, to the registrant’s auditors and the audit committee of the registrant’s board of directors (or persons performing the equivalent functions):
a) All significant deficiencies and material weaknesses in the design or operation of internal control over financial reporting which are reasonably likely to adversely affect the registrant’s ability to record, process, summarize and report financial information; and
b) Any fraud, whether or not material, that involves management or other employees who have a significant role in the registrant’s internal control over financial reporting.
/s/ DAVID G. NORD David G. Nord Chairman of the Board, President and Chief Executive Officer
Date: February 19, 2015
50323_10K.indd 76 2/27/15 11:57 AM
Job Name: 50323PDF Page: 50323_10K 76.p1.pdf
Process Plan: Doc6060_FileDate: 15-03-13Time: 17:08:44
Operator: ____________________________
PageMark-Color-Comp
❏ OK to proceed❏ Make corrections and proceed❏ Make corrections and show another proof
Signed: ___________________ Date: ______
HUBBELL INCORPORATED - Form 10-K 77
EXHIBIT 31.2
I, William R. Sperry, certify that: 1. I have reviewed this annual report on Form 10-K of Hubbell Incorporated (the “registrant”);
2. Based on my knowledge, this report does not contain any untrue statement of a material fact or omit to state a material fact necessary to make the statements made, in light of the circumstances under which such statements were made, not misleading with respect to the period covered by this report;
3. Based on my knowledge, the financial statements, and other financial information included in this report, fairly present in all material respects the financial condition, results of operations and cash flows of the registrant as of, and for, the periods presented in this report;
4. The registrant’s other certifying officer(s) and I are responsible for establishing and maintaining disclosure controls and procedures (as defined in Exchange Act Rules 13a-15(e) and 15d-15(e)) and internal control over financial reporting (as defined in Exchange Act Rules 13a-15(f) and 15d-15(f)) for the registrant and have:
a) Designed such disclosure controls and procedures, or caused such disclosure controls and procedures to be designed under our supervision, to ensure that material information relating to the registrant, including its consolidated subsidiaries, is made known to us by others within those entities, particularly during the period in which this report is being prepared;
b) Designed such internal control over financial reporting, or caused such internal control over financial reporting to be designed under our supervision, to provide reasonable assurance regarding the reliability of financial reporting and the preparation of financial statements for external purposes in accordance with generally accepted accounting principles;
c) Evaluated the effectiveness of the registrant’s disclosure controls and procedures and presented in this report our conclusions about the effectiveness of the disclosure controls and procedures, as of the end of the period covered by this report based on such evaluation; and
d) Disclosed in this report any change in the registrant’s internal control over financial reporting that occurred during the registrant’s most recent fiscal quarter (the registrant’s fourth fiscal quarter in the case of an annual report) that has materially affected, or is reasonably likely to materially affect, the registrant’s internal control over financial reporting; and
5. The registrant’s other certifying officer(s) and I have disclosed, based on our most recent evaluation of internal control over financial reporting, to the registrant’s auditors and the audit committee of the registrant’s board of directors (or persons performing the equivalent functions):
a) All significant deficiencies and material weaknesses in the design or operation of internal control over financial reporting which are reasonably likely to adversely affect the registrant’s ability to record, process, summarize and report financial information; and
b) Any fraud, whether or not material, that involves management or other employees who have a significant role in the registrant’s internal control over financial reporting.
/s/ WILLIAM R. SPERRY William R. Sperry Senior Vice President and Chief Financial Officer
Date: February 19, 2015
50323_10K.indd 77 2/27/15 11:57 AM
Job Name: 50323PDF Page: 50323_10K 77.p1.pdf
Process Plan: Doc6060_FileDate: 15-03-13Time: 17:08:44
Operator: ____________________________
PageMark-Color-Comp
❏ OK to proceed❏ Make corrections and proceed❏ Make corrections and show another proof
Signed: ___________________ Date: ______

78 HUBBELL INCORPORATED - Form 10-K
EXHIBIT 32.1 Certification Pursuant to 18 U.S.C. Section 1350, as Adopted Pursuant to Section 906 of the Sarbanes-Oxley Act of 2002
In connection with the Annual Report of Hubbell Incorporated (the “Company”) on Form 10-K for the period ended December 31, 2014 as filed with the Securities and Exchange Commission on the date hereof (the “Report”), I, David G. Nord, certify, pursuant to 18 U.S.C. §1350, as adopted pursuant to §906 of the Sarbanes-Oxley Act of 2002, that: (1) The Report fully complies with the requirements of Section 13(a) or 15(d), as applicable, of the Securities Exchange
Act of 1934, as amended; and(2) The information contained in the Report fairly presents, in all material respects, the financial condition and results of
operations of the Company.
/s/ DAVID. G. NORD David G. Nord Chairman of the Board, President and Chief Executive Officer February 19, 2015
A signed original of this written statement required by Section 906 has been provided to the Company and will be retained by the Company and furnished to the Securities and Exchange Commission or its staff upon request.
50323_10K.indd 78 2/27/15 11:57 AM
Job Name: 50323PDF Page: 50323_10K 78.p1.pdf
Process Plan: Doc6060_FileDate: 15-03-13Time: 17:08:44
Operator: ____________________________
PageMark-Color-Comp
❏ OK to proceed❏ Make corrections and proceed❏ Make corrections and show another proof
Signed: ___________________ Date: ______

HUBBELL INCORPORATED - Form 10-K 79
EXHIBIT 32.2 Certification Pursuant to 18 U.S.C. Section 1350, as Adopted Pursuant to Section 906 of the Sarbanes-Oxley Act of 2002
In connection with the Annual Report of Hubbell Incorporated (the “Company”) on Form 10-K for the period ended December 31, 2014 as filed with the Securities and Exchange Commission on the date hereof (the “Report”), I, William R. Sperry, certify, pursuant to 18 U.S.C. §1350, as adopted pursuant to §906 of the Sarbanes-Oxley Act of 2002, that: (1) The Report fully complies with the requirements of Section 13(a) or 15(d), as applicable, of the Securities Exchange
Act of 1934, as amended; and(2) The information contained in the Report fairly presents, in all material respects, the financial condition and results of
operations of the Company.
/s/ WILLIAM R. SPERRY William R. Sperry Senior Vice President and Chief Financial Officer February 19, 2015
A signed original of this written statement required by Section 906 has been provided to the Company and will be retained by the Company and furnished to the Securities and Exchange Commission or its staff upon request.
50323_10K.indd 79 2/27/15 11:57 AM
Job Name: 50323PDF Page: 50323_10K 79.p1.pdf
Process Plan: Doc6060_FileDate: 15-03-13Time: 17:08:44
Operator: ____________________________
PageMark-Color-Comp
❏ OK to proceed❏ Make corrections and proceed❏ Make corrections and show another proof
Signed: ___________________ Date: ______

50323_10K.indd 80 2/27/15 11:57 AM
Job Name: 50323PDF Page: 50323_10K 80.p1.pdf
Process Plan: Doc6060_FileDate: 15-03-13Time: 17:08:44
Operator: ____________________________
PageMark-Color-Comp
❏ OK to proceed❏ Make corrections and proceed❏ Make corrections and show another proof
Signed: ___________________ Date: ______

Our vision for the Hubbell of the future remains unaltered, and our accomplishments over the last year have shown that our business model is working. Continuing with our strategy of a healthy balance among organic growth, new product introductions, and acquisitions has enabled us to further penetrate new market segments. Our seven acquisitions in 2014 — four in the Power segment and three in the Electrical segment — contributed to a sales increase of 6% at an investment of $180 million.
The Financial Highlights on the next page illustrate a solid performance for the year, including increases in net sales and earnings per diluted share. In addition, in October, our Board of Directors authorized the repurchase of up to $300 million of the Company’s Class A and Class B common stock, and declared a dividend increase of 12%, marking the seventh consecutive year of increases.
We faced several challenges in 2014, and I was pleased with our leadership’s adept response. Our Electrical segment faced higher costs, particularly related to certain warranty and inventory expenses in our lighting business. Our leadership team faced these challenges head on, and the measures we have since put into place have already resulted in improvements in performance. They will also enable us to better anticipate change and react more quickly in the future.
With earnings of more than $300 million and an operating margin of better than 15%, we were able to adjust quickly as an organization and finish the year stronger. I am confident that we remain on the right path and that both our successes and our challenges make us even better prepared for the journey ahead.
The Power of OneAs we enter into the second half of the decade, Hubbell is an enterprise energized by the opportunities of the present and the promise of tomorrow. Nowhere is this captured more succinctly and powerfully than in our One Hubbell strategy, which enters its fourth year in 2015. We are realizing the many benefits that emerge when teamwork, collaboration and communication become part of daily life. Synergies across the enterprise are opening doors to deeper customer relationships, optimizing our resources for greater productivity and efficiency, and helping to build rewarding careers for our employees. Under the theme of “The Power of One: Investing for the Future,” the editorial section that follows describes how One Hubbell thinking is transforming the Company. Working together as One Hubbell offers yet another benefit: It enhances our ability to successfully pursue our four strategic objectives.
Serving Our CustomersWe serve our shareholders best by serving our customers best. Indeed, if there is a single Hubbell trait that goes back to the very beginning of the Company, it is our uncompromising commitment to our customers — not only by responding to their needs but also by providing them with business-building solutions and finding new ways to work together. Our One Hubbell focus has redefined and extended customer relationships at all levels throughout the enterprise, creating new and exciting opportunities for growth and customer satisfaction.
Hubbell continued to make progress toward its long-term strategic objectives in 2014 as the Company enhanced its position in key markets, strengthened its capabilities as a world-class competitor and maintained a sound financial footing.
To Our Shareholders
On the cover, clockwise from top, examples of recent investments for future growth in new products and new markets:
1) The 2014 acquisition of RFL Electronics has enabled our expanded presence in the growing substation automation market with products such as a substation- hardened IP Access multiplexer; 2) NutriLED™ solid state LED fixtures provide energy saving benefits for virtually any indoor horticultural application; 3) Quazite®
underground enclosures are used by utilities, telecommunications and transportation customers who depend on safe, durable and cost effective housings for equipment on their systems; 4) The BURNDY® In-Line Disconnect switch utilizes proven WEJTAP™ technology and is designed for ease of installation resulting in best in class performance for distribution switching applications; 5) Transition® Enclosed (TRE) architectural direct/indirect ceiling fixtures provide full distribution of light for comfortable, effective lighting; antimicrobial® paint option resists bacterial growth on exposed painted surfaces — ideal for healthcare, dining, dormitories or public spaces; 6) Premise Wiring copper and fiber optic connectivity solutions are widely used in mission critical institutional and enterprise networks and in data centers.
Annual MeetingThe next annual meeting of the shareholders of Hubbell Incorporated will be held at 9:00 a.m., local time, Tuesday, May 5, 2015, at the principal executive offices of the Company, 40 Waterview Drive, Shelton, Connecticut 06484. A formal notice of the meeting and proxy materials will be available to each shareholder on the following website, www.proxyvote.com, and will be mailed to any shareholder who requests a printed copy.
Shareholder ServicesAs a Hubbell shareholder, you are invited to take advantage of our convenient shareholder services or request more information about Hubbell Incorporated.
Computershare, our transfer agent, maintains the records for our registered shareholders and can help you with a variety of shareholder-related services at no charge, including:
• Change of name or address• Consolidation of accounts• Requests for duplicate mailings• Dividend reinvestment enrollment• Replacement of lost stock certificates• Transfer of stock to another person• Additional administrative services
Access your investor statements online 24 hours a day, seven days a week. Enrollment is quick and easy.
For more information, go to www.computershare.com/investor.
Market ListingThe New York Stock Exchange New York, NY 10005
Registrar and Transfer AgentComputershare 250 Royall Street Canton, MA 02021 800-874-1136 www.computershare.com/investor
Dividend Reinvestment PlanA Dividend Reinvestment Plan is available to shareholders of Hubbell Incorporated.
For details, contact: Corporate Secretary Hubbell Incorporated 40 Waterview Drive Shelton, CT 06484
Internet Addresswww.hubbell.com
Corporate InformationD
esig
n by
Add
ison
w
ww
.add
ison
.com

Investing for the FutureThe Power of One
Hubbell Incorporated 2014 Annual Report
Hubbell Incorporated 2014 Annual Report
Hu
bb
ell Inco
rpo
rated 2014 A
nn
ual R
epo
rt