the power of water : how moving water affects our … power of water : how moving water affects our...
TRANSCRIPT

The Power of Water : How moving water affects our physical world By: Jonathan McCabe
Abstract
The goal of these lesson plans is to bring into focus how rivers and streams change the physical
environment that they move through and the complications that arise when humans make changes or try
to control those systems. Students will use a model to recreate stream features that normally take long
periods of time to form. Students will also perform experiments to observe the properties of soil and
how humans can mitigate erosion of soils by streams. Students will also run a laboratory experiment that
attempts to solve a water contamination problem. Finally, students will take part in an assessment that
has them making choices about development along riverfront properties and the implications of that
development on erosion, pollution, and water quality. These lesson plans use low cost materials and
models that could be constructed in many different ways for a variety of budgets. A field trip to a storm
water runoff feature such as a bioswale or channelized riverbed is a nice addition and can further student
understanding through visualization.
Project Overview
RET I: Research (Summer 2014)
My research experience was with Dr. Alex Simms in the Sedimentology Lab, Department of
Geology, and involved precision dating using radiocarbon techniques for events in the recent geologic
past. My project leader, Laura Reynolds, proposed using charcoal deposition history as a proxy for
determining dates for significant events in the Carpinteria Marsh. The Transverse Ranges in Southern
California are responsible for considerable seismic activity; to include undersea landslides and
associated tsunamis. According to historical records, a pair of events in December 1812 resulted in at
least one tsunami, which possibly left a depositional record in the Carpinteria Marsh. By recording the
abundance of charcoal in vibracore samples from the marsh we are able to create an additional date
constraint on this sand facies in order to establish it as a tsunamite and not a storm deposit. A charcoal
peak dated to ~1862 is most likely associated with a significant storm event and occurs above the sand
facies, indicating that the sand was deposited sometime prior to this date. Charcoal analysis of additional
cores from the marsh, as well as further radiocarbon dating, pollen analysis, and X-ray fluorescence
(XRF) will help to further constrain this date and contribute to the multi-proxy approach for defining
tsunamites.
RET II: Project Rationale (Summer 2015)
In the past, detailed information about water transport and deposition of sediments has not been
thoroughly discussed in my district because there was no state standard for 9th grade Earth Science.
Adoption of NGSS however, brings back into focus at the secondary school level the role of water in
transporting sediments and changing the Earth’s surface appearance. My objective this summer was to
find practical, low cost ways to present this information to students. Students learn best when they can
use multiple senses to explore and observe real world phenomena and the use of physical models allows
for this observation on a practical basis.
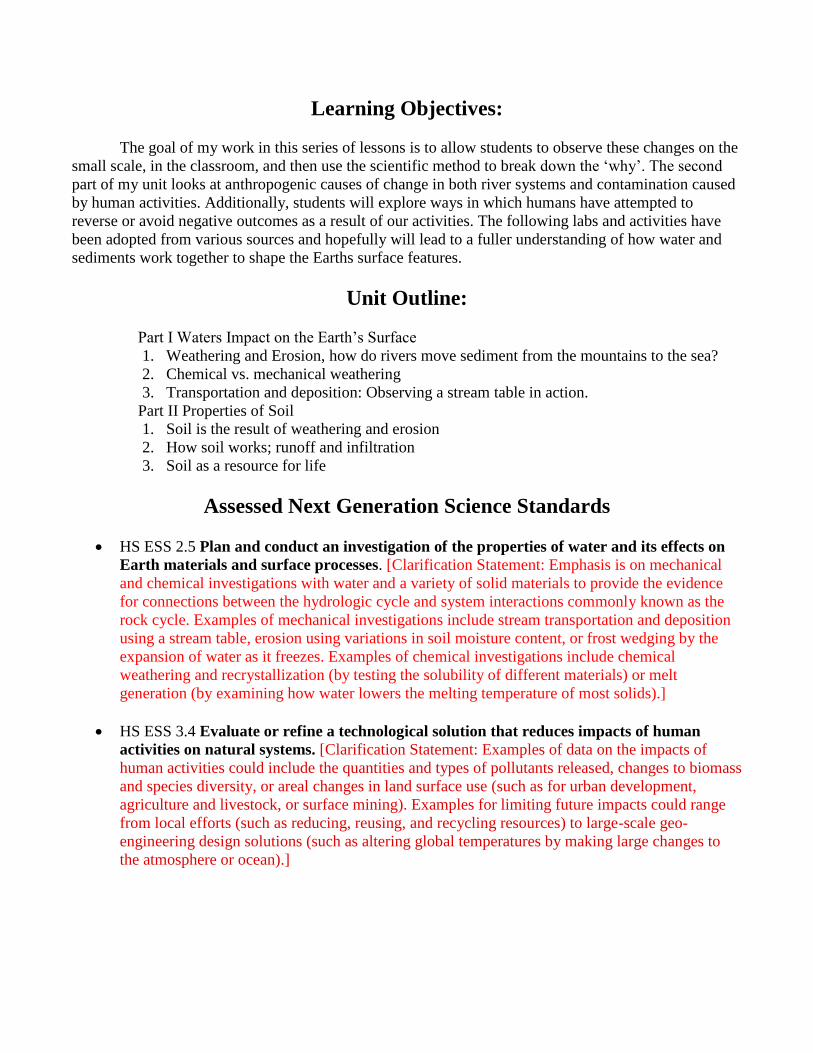
Learning Objectives:
The goal of my work in this series of lessons is to allow students to observe these changes on the
small scale, in the classroom, and then use the scientific method to break down the ‘why’. The second
part of my unit looks at anthropogenic causes of change in both river systems and contamination caused
by human activities. Additionally, students will explore ways in which humans have attempted to
reverse or avoid negative outcomes as a result of our activities. The following labs and activities have
been adopted from various sources and hopefully will lead to a fuller understanding of how water and
sediments work together to shape the Earths surface features.
Unit Outline:
Part I Waters Impact on the Earth’s Surface
1. Weathering and Erosion, how do rivers move sediment from the mountains to the sea?
2. Chemical vs. mechanical weathering
3. Transportation and deposition: Observing a stream table in action.
Part II Properties of Soil
1. Soil is the result of weathering and erosion
2. How soil works; runoff and infiltration
3. Soil as a resource for life
Assessed Next Generation Science Standards
HS ESS 2.5 Plan and conduct an investigation of the properties of water and its effects on
Earth materials and surface processes. [Clarification Statement: Emphasis is on mechanical
and chemical investigations with water and a variety of solid materials to provide the evidence
for connections between the hydrologic cycle and system interactions commonly known as the
rock cycle. Examples of mechanical investigations include stream transportation and deposition
using a stream table, erosion using variations in soil moisture content, or frost wedging by the
expansion of water as it freezes. Examples of chemical investigations include chemical
weathering and recrystallization (by testing the solubility of different materials) or melt
generation (by examining how water lowers the melting temperature of most solids).]
HS ESS 3.4 Evaluate or refine a technological solution that reduces impacts of human
activities on natural systems. [Clarification Statement: Examples of data on the impacts of
human activities could include the quantities and types of pollutants released, changes to biomass
and species diversity, or areal changes in land surface use (such as for urban development,
agriculture and livestock, or surface mining). Examples for limiting future impacts could range
from local efforts (such as reducing, reusing, and recycling resources) to large-scale geo-
engineering design solutions (such as altering global temperatures by making large changes to
the atmosphere or ocean).]
Disciplinary Core Ideas
ESS2.C: The Roles of Water in Earth's Surface Processes
The abundance of liquid water on Earth’s surface and its unique combination of physical and
chemical properties are central to the planet’s dynamics. These properties include water’s
exceptional capacity to absorb, store, and release large amounts of energy, transmit sunlight,
expand upon freezing, dissolve and transport materials, and lower the viscosities and melting
points of rocks. (HS-ESS2-5)
ESS3.C: Human Impacts on Earth Systems
The sustainability of human societies and the biodiversity that supports them requires responsible
management of natural resources. (HS-ESS3-3)
Scientists and engineers can make major contributions by developing technologies that produce
less pollution and waste and that preclude ecosystem degradation. (HS-ESS3-4)
Science and Engineering Practices
Planning and Carrying Out Investigations
Planning and carrying out investigations in 9-12 builds on K-8 experiences and progresses to include
investigations that provide evidence for and test conceptual, mathematical, physical, and empirical
models.
Plan and conduct an investigation individually and collaboratively to produce data to serve as the
basis for evidence, and in the design: decide on types, how much, and accuracy of data needed to
produce reliable measurements and consider limitations on the precision of the data (e.g., number
of trials, cost, risk, time), and refine the design accordingly. (HS-ESS2-5)
Constructing Explanations and Designing Solutions
Constructing explanations and designing solutions in 9–12 builds on K–8 experiences and progresses to
explanations and designs that are supported by multiple and independent student-generated sources of
evidence consistent with scientific knowledge, principles, and theories.
Design or refine a solution to a complex real-world problem, based on scientific knowledge,
student-generated sources of evidence, prioritized criteria, and tradeoff considerations. (HS-
ESS3-4)

Table Of Contents
Part I: Waters Impact on Earth
1. Activity 1: Basic Stream Table Observations
2. Activity 2: Stream Velocity and Erosion
3. Activity 3: Chemical Weathering of Candy
4. Teachers Guide to Using a Stream Table and Activities 1-3
5. Desktop Delta or Flume resources
Part II The Soil and its Relation to Water
1. Teachers guide to Soil
2. Percolation Lab
3. Percolation Lab answer key
4. Sponge Runoff Lab
5. Sponge Runoff lab answer key
Glossary
Mechanical Weathering Mechanical weathering occurs when physical forces break rock into smaller and smaller pieces without changing the rock’s mineral composition.
Chemical Weathering Chemical weathering is the transformation of rock into one or more new compounds.
Surface Area A measure of the total area that the surface of an object occupies.
Soil Soil is the portion of Earth's surface that can support plants. Soil has four major components: mineral matter, or broken-down rock; organic matter, or humus, which is the decayed remains of organisms; water; and air.
Porosity The amount of open space between soil particles.
Percolation Rate The rate at which water moves through a soil.
Permeability The soils capability to allow water to pass through it.
Infiltration The movement of surface water into rock or soil through cracks and pore spaces.
Runoff Water that flows over the land surface rather than seeping into the ground.
Meander A loop-like bend in the course of a stream.
Delta An accumulation of sediment formed where a stream enters a lake or an ocean.
Bed Load Sediment that is carried by a stream along the bottom of its channel.

Deposition The process by which an agent of erosion loses energy and drops the sediment it is carrying.
Floodplain The flat, low-lying portion of a stream valley subject to periodic flooding.
Alluvial Fan A fan-shaped deposit of sediment formed when a stream's slope is abruptly reduced.
Cut Bank A cut bank, also known as a river cliff or river-cut cliff, is the outside bank of a water channel (stream), which is continually undergoing erosion.
Tributary A stream that empties itself into another stream.
V-Shaped Valley A valley formed by flowing water, or river valley, is usually V-shaped. The exact shape will depend on the characteristics of the stream flowing through it. Rivers with steep gradients, as in mountain ranges, produce steep walls and a bottom.
Point Bar A point bar is a depositional feature made of alluvium that accumulates on the inside bend of streams and rivers below the slip-off slope. Point bars are found in abundance in mature or meandering streams.
Stream The course that water follows over land.
Divide An imaginary line that separates the drainage of two streams; often found along a ridge.
Channel The course that the water in a stream follows.
Drainage Basin The land area that contributes water to a stream.
Capacity The total amount of sediment a stream is able to transport.
Base Level The base level of a river or stream is the lowest point to which it can flow, often referred to as the 'mouth of the river'. For large rivers, sea level is usually the base level, but a large river or lake is likewise the base level for tributary streams.
Headward Erosion Erosion at the origin of a stream channel, which causes the origin to move back away from the direction of the stream flow, and so causes the stream channel to lengthen.
Gradient The slope of a stream over a certain distance.
Competence Measure of the maximum size of the particles that the stream can transport. It is proportional to the velocity of the flow.
Groundwater Water underground in the zone of saturation
Bioswale Landscape elements designed to remove silt and pollution from surface runoff water. They consist of a swaled drainage course with gently sloped sides (less than six percent) and filled with vegetation, compost and/or riprap.

Denitrification Process of nitrate reduction (performed by a large group of heterotrophic facultative anaerobic bacteria) that may ultimately produce molecular nitrogen (N2) through a series of intermediate gaseous nitrogen oxide products.
Activity 1: Basic Stream Table Observations
1
Objective:
You will be able to identify stream formations and explain the causes of different features
using diagrams, observations and key terms. This observation will prepare you for Activity #2.
Background:
Streams are Earth’s most important agents of erosion. They can down-cut or erode their
channels. They can also transport enormous amounts of sediment. Most of the sediment a
stream carries comes from weathering. Weathering produces huge amounts of material that are
delivered to the stream by sheet flow, mass movements, and groundwater. Eventually, streams
drop much of this material to create many different depositional features. (Prentice Hall Earth Science,
2006)
List of materials:
1. Demo sized stream table Projector or smart board (for pictures)
2. Pencil with eraser
3. Science notebook
4. Computer with access to google maps
Procedure:
We will be observing features that form over time on the stream table; in addition, there will be
video footage of each formation for us to review. You will then need to examine imagery from
google maps and identify any features you recognize from our model.
1. Watch: the structures that form over a 10-minute time period.
2. Listen: as your teacher identifies different features that form while the water is running.
3. Observe: the sample images on the board.
4. Sketch: the resulting stream and its formations in the space o page 2.
5. Label: the stream with as many of the key terms as possible. Use the provided figures
and chapter 6.2 in your textbook, to help with your labeling.
6. Using the computer, navigate to the following coordinates on google maps, identify any
features you recognize in the image and sketch them in the boxes provided on page 3.
a. 39.318255N , 121.620175W
b. 29.521236N , 91.435260W
c. 5.626012S , 64.017677W
d. 28.443157N , 82.965618E
7. Check: Can you label where erosion and deposition would occur in your drawings after
observing the running stream table? Put a “D” for any deposition locations and an
“E” for erosion.

Activity 1: Basic Stream Table Observations
2
Sketch of the stream table model:
Label each feature on your
sketch with the number that
matches:
1. Meander
2. Delta
3. Cut Bank
4. Point Bar
5. Oxbow Lake
6. Channel
7. V-shaped Valley
8. Divide
9. Tributary
10. Drainage Basin
Questions:
1. What limitations does our stream table have in modeling a real stream? How is our model
similar; how is it different?
2. How would a scientist make the model more accurate?

Activity 1: Basic Stream Table Observations
3
Stream Sketches:
Coordinate #1 Coordinate #2
Coordinate #3 Coordinate #4
3. What limits do satellite observations have when observing stream systems?
4. What advantages do satellite images have? What can we see here that is not observable
from the ground?


Streambed)Forma,ons)
For)use)with)Ac,vity)1:)Basic)Stream)Table)Observa,ons)
What)is)this?)
How)about)this)one?) What)is)this?)
These)are)called?) Did)you)see)anything)like)this?)


Activity 2. Stream Velocity and Erosion
1
Objectives: You will be setting up an experiment to measure how much of an effect stream velocity has on erosion and deposition of sediments. You will practice the steps of how to conduct an experiment. Background: In activity 1, you witnessed several processes and formations that are the result of stream transportation of sediment. Sediment is eroded (moved) from the top of a watershed by a stream and its tributaries. That sediment is then deposited at the mouth of the stream, located in the bottom portion of a watershed. The amount of erosion and deposition that occurs can be determined by measuring how large a stream’s delta grows over time. This process is dependent upon the velocity of the stream. Velocity is the speed of the water in the stream, usually measured in meters per second. Another key is the amount of water, or discharge involved. Sediments Removed Sediments Deposited List of possible materials:
Stream table Stopwatch Plastic gutter A ruler or other tool Pencil Calculator Plexiglas sheet 250ml beaker Dry sand Plastic shovel/scooper
Procedure: 1. Examine the Question found below and develop a hypothesis from it. What will happen to the sediment in your streambed as you increase/decrease the velocity of the water? 2. Under Methods, design an experiment that could test your hypothesis. Your design should include at least the following:
Conduct at least three trials with the same stream shape each time at a slow, medium and fast flow (velocity!)

Activity 2. Stream Velocity and Erosion
2
Conduct each trial for the same amount of time (Why?!) Measure the “volume” of the delta after each trial in cubic centimeters (length x width x height) Record your data in your science notebook.
3. Construct your defined stream on the stream table (straight and narrow works well) Be sure to set up the experiment exactly the same for each trial to eliminate variables. 4. Assign the needed roles in your group (these should stay the same through the whole experiment to keep data collection consistent), you may have more than one role!:
Flow director Time keepers Delta measurer Data recorder Engineer to keep the same stream size and shape and to redistribute the sediments
5. Carry out the experiment that you designed under the Methods section. 6. Determine if your hypothesis was correct. 7. Answer follow-up questions. Question: How does the velocity of a stream affect how much erosion and ultimately deposition will occur? What is your hypothesis? Methods: Explain how you will test your hypothesis. What are your independent and dependent variables? What will remain constant in your experiment? Observations: Record what happens. Provide any measurements in a table. Use a separate sheet of paper if needed.

Activity 2. Stream Velocity and Erosion
3
Results/Conclusion: Was your hypothesis correct? Explain. Follow-up questions 1) What do you think would happen if we increased or decreased this stream’s slope (make it steeper or flatter) instead of increasing the flow of water? 2) What events in nature did rate of flow represent in this experiment? Hint: Think about weather and climate. 3) How do people try to control rivers and streams in “real life?” How would engineers keep a real stream from changing its size or course?


Adapted from Cornell Science Inquiry Partnerships http://csip.cornell.edu
Weathering and Surface Area Objectives:
To understand the importance of surface area when it comes to weathering of rocks and minerals.
To learn how to design your own independent experiment. Background: There are two types of weathering; mechanical and chemical. Mechanical, or physical, weathering is the breakdown of rocks or minerals into smaller pieces, while chemical weathering breaks a rock or mineral down by altering a rock or mineral’s chemical composition. Weathering can be affected by several forces, including exposure, particle size, mineral composition, and climate. This activity will look at the role of particle size and how fast a material can be weathered. By breaking a rock into smaller pieces, mechanical weathering increases the rock’s surface area that can be exposed to chemical weathering.
List of materials:
Acid solution (dilute vinegar) SweeTARTS TM (the same color) Hammer Stop watch Clear cups or beakers Safety goggles (if stronger acid)
Procedure:
Adapted from Cornell Science Inquiry Partnerships http://csip.cornell.edu
1. Break into groups of 3 or 4. 2. Develop a question based on your previous knowledge of weathering of rocks and
minerals and the figure above. 3. Turn that question into a hypothesis. 4. Design an experiment that could test that hypothesis with the materials provided to
you. 5. Carry out your experiment. 6. Determine if your hypothesis was correct. 7. Answer follow-up questions. Planning your Experiment: What is your question about weathering of rocks and minerals? What is your hypothesis? Methods: Explain how you will test your hypothesis. What are your independent and dependent variables? What will you be keeping constant during your experiment? Provide a sketch of your set-up.

Adapted from Cornell Science Inquiry Partnerships http://csip.cornell.edu
Observations: Record what happens. Provide any measurements in a table. Results/Conclusion: Was your hypothesis correct? Explain. Follow-up questions 1) Based on the results of your experiment, predict which of these would weather the fastest - a smooth round pebble or a jagged piece of rock. Why? 2) Explain how water could be a form of both mechanical and chemical weathering.
Activity 4. Weathering and Surface Area
KEY

Adapted from Cornell Science Inquiry Partnerships http://csip.cornell.edu
Teacher Tips:
Note, in using SweeTARTS TM in the weathering activity, it was found helpful if they used the same colored
candy for each treatment. It was found out that a good way to measure how much the SweeTARTS TM had
dissolved was by looking at the color of the water that resulted. Also it is important to note that the candy will
not dissolve completely, so one of the independent variables should be a set time. Between 5 and 10 minutes
was found to be appropriate enough to determine their results.
Materials:
Acid solution (dilute vinegar)
SweeTARTS TM (the same color for each group)
Hammers
Stop watch (students can use their phones)
Clear cups or beakers
Safety goggles (if stronger acid)
Procedure:
1. Break students into groups of 3 or 4.
2. Students may need guidance to develop a question based on previous knowledge of weathering of rocks. This
activity is designed to follow a unit on rocks and minerals. Prentice Hall Earth Science (2006) references rocks
and minerals in chapters 2 and 3
3. Turn that question into a hypothesis. A good hypothesis could be an If-Then statement. It’s ok if students
don’t actually prove their hypothesis correct!
4. Design an experiment that could test that hypothesis with the materials provided to you.
5. Carry out your experiment.
6. Determine if your hypothesis was correct
7. Answer follow-up questions
Possible Answers below in italics
Question:
Which dissolves faster – a solid SweeTARTS TM or a SweeTARTS TM that is broken up into smaller pieces?
What is your hypothesis?
If the particle size is smaller (more surface area), then the candy will dissolve (weather) faster.
Methods: Explain how you will test your hypothesis. What are your controls? What are your independent
and dependent variables? Provide a sketch of your set-up.
We will have two cups of acid – CONTROL
A whole piece of candy will be put into one cup and a piece of candy smashed with a hammer will be put in the
other – INDEPENDENT VARIABLE
They will both stay in the acid for 10 minutes – CONTROL
After 10 minutes, will we examine the amount of candy left and the color of the water to determine which
“weathered” faster – DEPENDENT VARIABLE
Observations: Record what happens. Provide any measurements in a table.
The smaller particle size (the broken candy) dissolved faster.
Results/Conclusion: Was your hypothesis correct? Explain.
Yes – the SweeTARTS TM that was broken up into smaller pieces dissolved the most
Follow-up questions

Adapted from Cornell Science Inquiry Partnerships http://csip.cornell.edu
1) Based on the results of your experiment, predict which of these would weather the fastest - a smooth round
pebble or a jagged piece of rock. Why?
The jagged piece of rock has more surface area and can be weathered faster.
2) Explain how water could be a form of both mechanical and chemical weathering.
Water can continually wash over rock, breaking it down over time like waves hitting the shore (physical), or
water can be acidic and dissolve particles like limestone chemically.


Experiments with Weathering, Erosion and Deposition
For Teachers
1. Overview
The lessons in this unit were adapted from the work of Molly Moffe at Cornell University and
Rosemarie Wolf at East High School, Rochester, NY. The first two lab activities are designed to get students
looking at how streams form and features that develop as a result of erosion and deposition, at both the macro
(streams moving material from high to low elevations) and the micro (features in the stream watershed itself)
levels. The third activity of the series will help students explore and understand how surface area relates to the
rate of weathering of minerals and rocks. These activities complement an Earth Science curriculum that deals
with weathering, erosion and deposition. Its main focus is on water as the driving force of these processes and
does not deal with glaciers or wind. These activities are in the form of short-term experiments. If all of the
activities in this series are done, it will serve to connect the three processes of weathering, erosion and
deposition, which are not always expressed in textbooks.
These activities require a stream table, either with an automatic pump or a head tank of sufficient size to
run a stream for 10 minutes. The table should be at least 2 feet x 4 feet. They can be ordered online from
Science Kit & Boreal Laboratories and also WARD’s Natural Science. For the adventurous or budget conscious
teacher, a table can be built for les than $100 by following the instructions provided at the end of this teacher
guide. The following is a diagram of what one should include.
2. Subject
Earth Science. Based on: Lutgens,Tarbuck 11th ed., 2006. Earth Science. Prentice-Hall, Inc., NJ.
3. Audience
9-12th grade
4. Time required
One lab period per activity
Tubing to take water from pump to
start of the stream table. Tray to hold water (pump will
keep re-circulating it)
2x4ft tray filled with sand,
slightly sloped
Pump (as used in
fish tanks-has both
an inlet and outlet)
Hole for water to
exit (~1” diameter)
Stream that may form

5. Background
In order to use these activities, students should have covered units on rocks and minerals previously. It
may be helpful also if they are aware of the different forces that can cause weathering, mainly chemical vs.
physical. It may also be helpful if they are aware of other different forces of erosion already, mainly streams,
glaciers, waves and wind. However, the class that this was piloted used these activities as an introduction to
weathering, erosion and deposition. Their homework consisted reading of the relevant chapters in their text the
day before that experiment was to be done, so that they had the relevant background information. These
activities are not meant to define important terms. They are meant to supplement the text so that the students
can see those terms “in action.”
6. Learning and Behavioral Objectives
The students will learn the following concepts:
Importance of particle size and the role of surface area in weathering
Water erosion and the different parts of a stream (meander, tributary, stream bank, flood plain,
mouth, delta, etc)
The processes of erosion and deposition in a stream, including where they occur on both a large and
small scale.
How stream velocity relates to the rate of erosion and deposition
The sorting of sediment in streams and how that can relate to velocity.
They will also learn to:
Make good observations
Learn the different parts of the Scientific Method
Learn to design a simple experiment with provided materials.
7. Next Generation Science Standards
HS ESS 2.5 Plan and conduct an investigation of the properties of water and its effects on Earth
materials and surface processes. [Clarification Statement: Emphasis is on mechanical and chemical
investigations with water and a variety of solid materials to provide the evidence for connections
between the hydrologic cycle and system interactions commonly known as the rock cycle. Examples of
mechanical investigations include stream transportation and deposition using a stream table, erosion
using variations in soil moisture content, or frost wedging by the expansion of water as it freezes.
Examples of chemical investigations include chemical weathering and recrystallization (by testing the
solubility of different materials) or melt generation (by examining how water lowers the melting
temperature of most solids).]
8. Assessment Strategy
Follow-up questions are provided at the end of each activity, including questions related to hypothesis
testing.
9. Teaching Tips/Potential Problems
Completed labs are included at the end of this document.
Note, in using SweeTARTS TM in the weathering activity, it was found helpful if they used the same
colored candy for each treatment. It was found out that a good way to measure how much the
SweeTARTS TM had dissolved was by looking at the color of the water that resulted. Also it is
important to note that the candy will not dissolve completely, so one of the independent variables should
be a set time. Between 5 and 10 minutes was found to be appropriate enough to determine their results.

Activity 1: Basic Stream Table Observations
Objective:
This observation will prepare students for Activity #2. Students will gain experience with the
streambed and learn what many of the key features that they will see in pictures will look like in
miniature. Students should have practice with the vocabulary terms ahead of time.
Background:
Streams are Earth’s most important agents of erosion. They can down-cut or erode their
channels. They can also transport enormous amounts of sediment. Most of the sediment a
stream carries comes from weathering. Weathering produces huge amounts of material that are
delivered to the stream by sheet flow, mass movements, and groundwater. Eventually, streams
drop much of this material to create many different depositional features. (Prentice Hall Earth Science,
2006)
List of materials:
1. Demo sized stream table
2. Projector or smart board (for pictures)
3. Pencil with eraser
4. Science notebook
Procedure:
1. Start with a “blank” stream table. (No
landforms, no channels)
2. Start the flow of water by turning the valve,
adjust the flow to maximum.
3. Watch: the structures that form over a 10-
minute time period.
4. Listen: as your teacher identifies different
features that form while the water is running.
5. Sketch: the resulting stream and its formations
in your science notebook.
6. Label: the stream with as many of the key
terms as possible. Use the provided figures and
chapter 6.2 in your textbook, to help with your
labeling.
7. Check: Can you label where erosion and
deposition would occur in the provided figures
after observing the running stream table?

Word Bank of Key Terms:
Meander Deposition Cut Bank Point Bar Channel
Delta Floodplain Tributary Stream Drainage
Basin
Bed Load Alluvium V-Shaped
Valley
Divide Capacity
Stream Sketch:
Possible features:
Meander Delta Cut Bank Point Bar Oxbow Lake Channel
V-shaped Valley Divide Tributary Drainage Basin
Run the model once ahead of time and sketch a representation of the stream that develops. The sketch
should show as many of the key features as possible.
Each run will produce a slightly different stream and all features may not be present at the same time. It is
important for students to take notes and quick sketches of what they see.
Activity 2. Stream Velocity and Erosion
Topic:
Erosion and deposition caused by a stream, depending on how fast or slow the stream is flowing.
Conducting Scientific Experiments
Grade Level: 9th grade Earth Science
Background: Sediment is eroded from the top of a watershed by a stream and its tributaries. That sediment is
then deposited at the mouth of the stream, located in the bottom portion of a watershed. The amount of erosion
and deposition that occurs can be determined by measuring how large the stream’s delta grows overtime. List of materials:
Stream Table
Defined streambed (rain gutter, or other long, narrow channel)
Calculators
Plexiglas with a 30cm by 30cm grid drawn on it. (for measuring the size of the delta that forms)
Procedure:
1. Examine the Question found below and develop a hypothesis from it.
2. Under Methods, design an experiment that could test your hypothesis. Your design should include at least
the following:
Conduct at least three trials with the same stream shape each time at a slow, medium and fast pump
speed
Conduct each trial for the same amount of time (Why?!)
Measure the “volume” of the delta after each trial in centimeters (length x width x height)
Record data
Return the sediments to the top of the watershed after each trial (Why?!)
3. Construct your defined stream on the stream table (straight and narrow works well)
4. Assign the needed roles in your group (these should stay the same through the whole experiment to keep data
collection consistent):
Pump operator
Time keepers
Delta measurer
Data recorder
Engineer to keep the same stream size and shape and to redistribute the sediments
5. Carry out the Experiment that you designed under the Methods section.
6. Determine if your hypothesis was correct.
7. Answer follow-up questions
Answer Key
Question: How does the velocity of a stream affect how much erosion and ultimately deposition occurs?
What is your hypothesis?
My hypothesis is that the faster the water flows, the more erosion will occur and the larger the delta will grow.

Methods: Explain how you will test your hypothesis. What are your controls? What are your independent
and dependent variables?
We will construct one sized and shaped stream to run 3 trials because the shape of a stream (straight vs.
meander) can affect its velocity and how long it is can change the amount of erosion– CONTROL
We will have three trials; one slow, one medium and one fast speed - INDEPENDENT VARIABLE
Each trial will be for the same amount of time; One minute – CONTROL
The volume of the delta will be measured in centimeters and recorded after each trial – DEPENDENT
VARIABLE
The “sediments” will be returned to the top of the “watershed”, so that there is the same amount of sand present
for each trial - CONTROL
Observations: Record what happens. Provide any measurements in a table.
Trial # Volume of Delta
#1 (slow)
#2 (medium)
#3 (fast)
Results/Conclusion: Was your hypothesis correct? Explain.
Yes – the faster the speed, the larger the delta
Follow-up questions
1) What do you think would happen if we increased or decreased this stream’s slope (make it steeper or flatter)
instead of the speed of the pump?
Increasing the slope would cause more erosion, too.
2) What events in nature did the speed of the pump represent in this experiment? Hint: Think about weather
and climate.
Rainfall and snowmelt
3) How do people try to control rivers and streams in “real life?” How would engineers keep a real stream from
changing its size or course? Dams and levees

Activity 3. Weathering and Surface Area
KEY
Objectives:
To understand the importance of surface area when it comes to weathering of rocks and minerals.
To learn how to design your own independent experiment.
Background: There are two types of weathering; mechanical and chemical. Mechanical, or physical,
weathering is the breakdown into smaller pieces, while chemical weathering breaks a rock or mineral down by
altering a rock or mineral’s chemical composition. Weathering can be affected by several forces, including
exposure, particle size, mineral composition, and climate. This activity will look at the role of particle size and
how fast a material can be weathered. See Figure 9-2
FIGURE 9-2 – as found in Student Handouts
List of materials:
Acid solution (dilute vinegar)
SweeTARTS TM (the same color)
Hammer
Stop watch
Clear cups or beakers
Safety goggles (if stronger acid)
Procedure:
1. Break into groups of 3 or 4.
2. Develop a question based on your previous knowledge of weathering of rocks and minerals and Figure 9-2.
3. Turn that question into a hypothesis.
4. Design an experiment that could test that hypothesis with the materials provided to you.
5. Carry out your experiment.
6. Determine if your hypothesis was correct
7. Answer follow-up questions
Question: Which dissolves faster – a solid SweeTARTS TM or a SweeTARTS TM that is broken up into smaller
pieces?
What is your hypothesis?
The smaller the particle size, the faster it will dissolve.
Methods: Explain how you will test your hypothesis. What are your controls? What are your independent
and dependent variables? Provide a sketch of your set-up.
We will have two cups of acid – CONTROL
A whole piece of candy will be put into one cup and a piece of candy smashed with a hammer will be put in the
other – INDEPENDENT VARIABLE
They will both stay in the acid for 10 minutes – CONTROL
After 10 minutes, will we examine the amount of candy left and the color of the water to determine which
“weathered” faster – DEPENDENT VARIABLE
Observations: Record what happens. Provide any measurements in a table.
The smaller particle size (the broken candy) dissolved faster.
Results/Conclusion: Was your hypothesis correct? Explain.
Yes – the SweeTARTS TM that was broken up into smaller pieces dissolved the most
Follow-up questions
1) Based on the results of your experiment, predict which of these would weather the fastest - a smooth round
pebble or a jagged piece of rock. Why?
The jagged piece of rock has more surface area and can be weathered faster.
2) Explain how water could be a form of both mechanical and chemical weathering.
Water can continually wash over rock, breaking it down over time like waves hitting the shore (physical), or
water can be acidic and dissolve particles like limestone chemically.

Desktop Delta For more “desktop delta” or “flume” resources see: http://serc.carleton.edu/NAGTWorkshops/sedimentary/models/desktop_delta.html#plans


Information is from lesson 2 of From the Ground Up: The Science of Soil http://www.thescienceofsoil.com/teacher-resources
Teacher Background
Properties of Soil
We generally don’t think much about soil. In fact, “soil” can have a negative connotation. We
call it dirt and wash it off our clothes and our bodies. In reality, the soil is essential to our survival and
that of nearly every organism on Earth. Our planet is mostly made of rock with an iron-nickel core.
Plants and animals, including us, occupy a thin veneer on its surface. Our existence is possible because
of a thin layer of soil that comes between the planet’s rocky interior and us.
The weathering of rock slowly produces soils. Constant exposure to wind and rain cause the
rocky crust to slowly break down into smaller particles. It can take centuries to produce fertile topsoil.
As rainwater seeps into cracks, temperature extremes cause the water to freeze. The rock expands,
contracts, and fractures. These weathering actions are helped along by organisms that live on and in
the soil. Soils are composed of inorganic material derived from rock and organic material derived from
living and dead organisms. Both are important to support plant growth. Some scientists believe that
without life, soils are just dirt.
As weathering breaks down inorganic material, particles of various sizes are produced. Soil
texture refers to the relative proportions of different-sized particles found in the soil. Scientists classify
soil particles into three categories. The smallest particles, which measure less than 0.002 millimeters,
are called clay.16 Clay is important in holding nutrients. Clay particles form plate like structures that act
like magnets, holding nutrients until they are displaced by another element, absorbed by a plant root,
eaten by a soil microbe, or chemically absorbed into the soil. The next largest particles are called silt.
Silt particles range in size from 0.002 millimeters to 0.06 millimeters. Sand refers to the largest
particles. Sand grains range in size from 0.06 millimeters to 2 millimeters. Soils vary in their proportions
of clay, silt, and sand. Soil scientists classify different soil types using the soil triangle. Each side of the
soil triangle represents the amount of a soil component, clay, silt, or sand. The relative amounts of
these three particle sizes intersect within the triangle and determine to what type of soil those
proportions correspond.

Information is from lesson 2 of From the Ground Up: The Science of Soil http://www.thescienceofsoil.com/teacher-resources
Figure 1. The soil triangle is used to classify soil types.
The ability of a soil to accept and retain water is largely determined by the relative amounts of
clay, silt, and sand present. Porosity refers to spaces in the soil that can hold either air or water.
Permeability is defined as the rate at which water can travel through soil. Table 8 lists properties of
particle size that relate to soils’ interactions with water. Soils with desirable properties for farming are
called loams. Loamy soils typically contain about 50 percent air space, which allows root systems to
“breathe” (i.e. obtain O2 for respiration). The solid half of soils is about 90 percent minerals and 10
percent organic material. Usually, loamy soils have names that more accurately reflect their
composition, such as clay loam or silt loam.

Information is from lesson 2 of From the Ground Up: The Science of Soil http://www.thescienceofsoil.com/teacher-resources
Properties of Soil Particles
Property Clay Silt Sand
Porosity Mostly small pores Mostly small pores Mostly large pores
Permeability Slow Slow to moderate Rapid
Water-holding capacity
Large Moderate Limited
Although the organic fraction of most soils is small in volume compared to the mineral fraction, it
plays an important role in supporting plant growth. The organic material is composed of living
organisms, plant roots, and plant and animal residue. A single gram of healthy topsoil may contain 100
nematodes (small roundworms), 1 million fungi, and 1 billion bacteria.24 Present in smaller numbers
may be earthworms and a wide variety of insects. Organic material contains a significant amount of
nutrients and it, together with plant roots, helps:
Decrease erosion
Increase water infiltration and storage
Act as a pH buffer (to maintain an acid-base balance)
Decompose organic material, releasing nutrients
Recycle carbon, nitrogen, and other nutrients
Retain available nutrients such as metal ions.
The soil is a “bank” for nutrients that are taken up by plants, and these nutrients must be
replenished for continued plant growth. Before the advent of modern agriculture, farmers relied solely
upon tillage to break down existing organic material and release existing soil nutrients. This practice is
still used in many less developed countries.


TEACHERS GUIDE
Soil Percolation Lab
BACKGROUND INFORMATION: Most of the rain that falls on land soaks into the ground. The rest runs off into streams and rivers. How well rain soaks into the ground depends on a number of factors including: the slope of the land, the amount of open space between the soil particles, (its porosity), and the soil or rock’s capability to allow water to pass through it (permeability). The shape of the particles, how tightly the particles are packed, and how many different sizes of particles there are determine porosity. These characteristics and changes in the amount and rate that water soaks in can vary among different soil layers. This activity will demonstrate the variation in the rate that water moves through various soil layers by testing the rate at which water moves through clay, topsoil and sand. The rate that water moves through a soil is called the percolation rate. Define the following words Porosity: the amount of open space between particles Permeability: the soil or rocks capability to allow water to pass through it Percolation rate: The rate that water moves through the soil HYPOTHESIS: Develop a one-sentence prediction for the outcome of this experiment. Answers will vary: I predict that the percolation rate of the sand will be the fastest because the pore space appears to be the largest. MATERIALS: 3 samples (topsoil, sand, clay) water 1 graduated cylinder 1 stopwatch/cell phone 1 cup (use same cup for all 3 samples) 1 pencil 1 plastic beaker tweezers 3 cotton balls/pads

TEACHERS GUIDE PROCEDURE: 1) Gather your materials 2) Carefully poke a hole with a pencil through the bottom of the cup. 3) Place a cotton ball over the hole in the cup. 4) Use a beaker to measure 100mL of soil and place it in the cup. **Use topsoil or sand first, test the clay last. 5) Measure 50 mL of water in the graduated cylinder. 6) With one group member ready to start timing with a stopwatch, pour the water through the sample all at once, while holding the paper cup over the beaker. 7) WHEN WATER STARTS TO DRIP FROM THE BOTTOM OF THE CUP, time the flow of water for 30 seconds. 8) After 30 seconds, measure the collected water by pouring the contents of the beaker into the graduated cylinder and recording the volume in your data table. 9) Determine the percolation rate of the sample by dividing the amount of percolated water by the amount of time (30 sec.)
EX: 30 mL percolated through a sample in 30 sec. 30mL/30 sec. = percolation rate Percolation rate = 1 mL/sec.
10) Remove the cotton ball with a pair of tweezers and throw it away. 11) Empty the used sample into the appropriate used sample bucket at the front of the room. 12) Repeat steps 3-11 for the remaining 2 samples.
OBSERVATIONS AND DATA ANALYSIS Data will vary, below are some sample values that could be possible. This will depend on your soil samples and where you got them Data Table
SAMPLE WATER VOLUME (mL)
(mL/sec) PERCOLATION RATE (mL/sec)
Topsoil 45 /30 sec. 1.5
Sand 25 /30 sec. .83
Clay 10 /30 sec. .33
Create a bar graph with the results from your data table

TEACHERS GUIDE
TOPSOIL SAND
CLAY
QUESTIONS: 1) In this experiment, what was the independent variable? The amount of water 2) What was the dependent variable? The type of soil 3) What could we have used as an appropriate control for this experiment? A precise mixture of the three soil types 4) Was your hypothesis correct or incorrect? Yes, the topsoil had the greatest space between particles and allowed the water to flow through. 5) List 3 possible sources of error that could have affected your results.
Answers will vary, some possible ones are listed below a) The water was poured too fast and created a hole in the soil sample b) The soil sample was accidently compacted in the cup, reducing pore space c) The sample was already wet, which resulted in more water passing through the sample instead of being retained.
2
1.9
1.8
1.7
1.6
1.5
1.4
1.3
1.2
1.1
1
0.9
0.8
0.7
0.6
0.5
0.4
0.3
0.2
0.1
0
PE
RC
OL
AT
ION
RA
TE
ML
/SE
C
SOIL TYPE

TEACHERS GUIDE CONCLUSION: Answer the following questions based on the activity using complete sentences. 6) Which soil component had the fastest percolation rate? The topsoil had the fastest percolation rate 7) Why does the soil component from question #1 percolate the quickest? What properties/characteristics does it have that may contribute to its percolation rate? The topsoil has the largest pore space, which gives it greater permeability. 8) Which soil component had the slowest percolation rate? The clay 9) Why does the soil component from question #3 percolate the slowest? What properties/characteristics does it have that may contribute to its percolation rate? The clay was slowest because it has the smallest pore space of the three samples, this gives it the lowest permeability. 10) List at least 3 people or occupations that may find knowing the percolation rate of various soil components to be useful. For each, explain how they would use this information.
a) b) c)
11) Suppose you are a farmer and you have 2 samples of soil—one is mostly sand and the other is mostly clay. You want to grow soybeans in one of these 2 soils. What questions would you need to ask before choosing the soil in which to plant your soybeans? (Write at least 2 questions). Questions will vary, here are some possible ones 1. How much water do soybeans need? If they need large amounts of water then I will need a soil with good permeability to allow water to get to the roots. 2.

NAME_________________________PERIOD_____________________________DATE_________________
Soil Percolation Lab
BACKGROUND INFORMATION: Most of the rain that falls on land soaks into the ground. The rest runs off into streams and rivers. How well rain soaks into the ground depends on a number of factors including: the slope of the land, the amount of open space between the soil particles, (its porosity), and the soil or rock’s capability to allow water to pass through it (permeability). The shape of the particles, how tightly the particles are packed, and how many different sizes of particles there are determine porosity. These characteristics and changes in the amount and rate that water soaks in can vary among different soil layers. This activity will demonstrate the variation in the rate that water moves through various soil layers by testing the rate at which water moves through clay, topsoil and sand. The rate that water moves through a soil is called the percolation rate. Define the following words Porosity:______________________________________________________________ Permeability:__________________________________________________________ Percolation rate:________________________________________________________ HYPOTHESIS: Develop a one-sentence prediction for the outcome of this experiment. ______________________________________________________________________________________________________________________________________________________________________________ MATERIALS: 3 samples (topsoil, sand, clay) water 1 graduated cylinder 1 stopwatch/cell phone 1 cup (use same cup for all 3 samples) 1 pencil 1 plastic beaker tweezers 3 cotton balls/pads

NAME_________________________PERIOD_____________________________DATE_________________
PROCEDURE: 1) Gather your materials 2) Carefully poke a hole with a pencil through the bottom of the cup. 3) Place a cotton ball over the hole in the cup. 4) Use a beaker to measure 100mL of soil and place it in the cup. **Use topsoil or sand first, test the clay last. 5) Measure 50 mL of water in the graduated cylinder. 6) With one group member ready to start timing with a stopwatch, pour the water through the sample all at once, while holding the paper cup over the beaker. 7) WHEN WATER STARTS TO DRIP FROM THE BOTTOM OF THE CUP, time the flow of water for 30 seconds. 8) After 30 seconds, measure the collected water by pouring the contents of the beaker into the graduated cylinder and recording the volume in your data table. 9) Determine the percolation rate of the sample by dividing the amount of percolated water by the amount of time (30 sec.)
EX: 30 mL percolated through a sample in 30 sec. 30mL/30 sec. = percolation rate Percolation rate = 1 mL/sec.
10) Remove the cotton ball with a pair of tweezers and throw it away. 11) Empty the used sample into the appropriate used sample bucket at the front of the room. 12) Repeat steps 3-11 for the remaining 2 samples.
OBSERVATIONS AND DATA ANALYSIS Data Table
SAMPLE WATER VOLUME (mL)
(mL/sec) PERCOLATION RATE (mL/sec)
Topsoil /30 sec.
Sand /30 sec.
Clay /30 sec.
Create a bar graph with the results from your data table
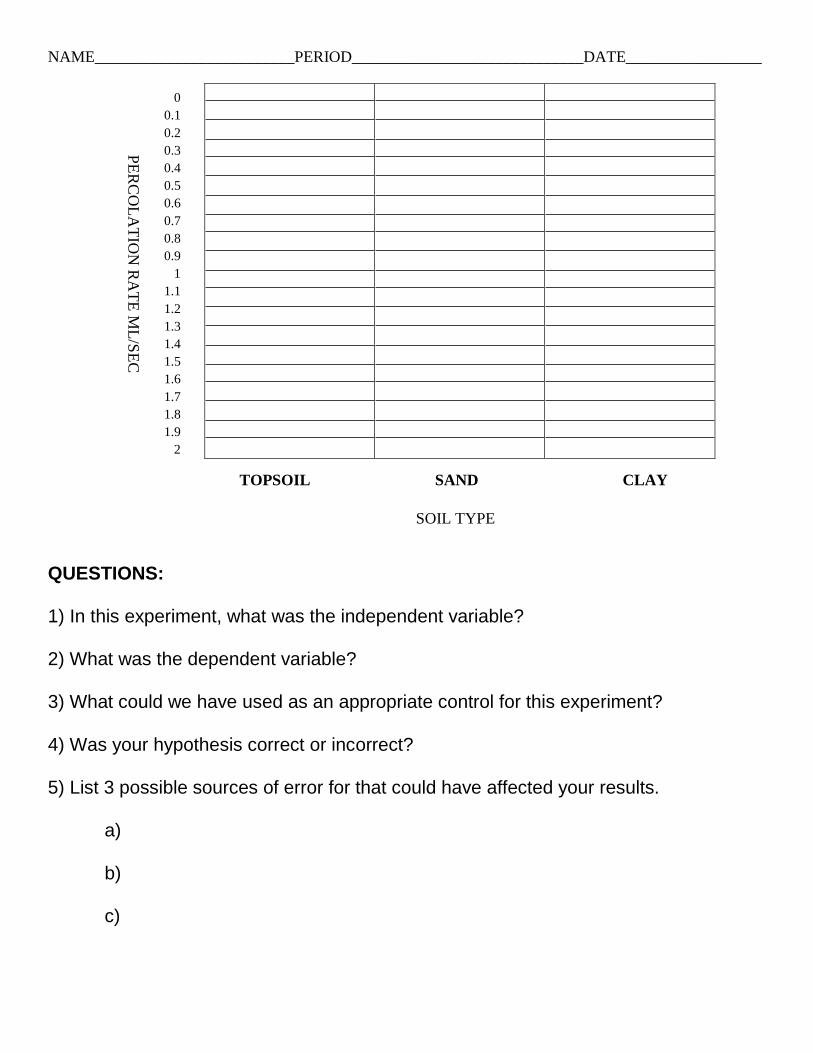
NAME_________________________PERIOD_____________________________DATE_________________
TOPSOIL SAND CLAY
QUESTIONS: 1) In this experiment, what was the independent variable? 2) What was the dependent variable? 3) What could we have used as an appropriate control for this experiment? 4) Was your hypothesis correct or incorrect? 5) List 3 possible sources of error for that could have affected your results.
a) b) c)
0
0.1
0.2
0.3
0.4
0.5
0.6
0.7
0.8
0.9
1
1.1
1.2
1.3
1.4
1.5
1.6
1.7
1.8
1.9
2
PE
RC
OL
AT
ION
RA
TE
ML
/SE
C
SOIL TYPE
NAME_________________________PERIOD_____________________________DATE_________________
CONCLUSION: Answer the following questions based on the activity using complete sentences. 6) Which soil component had the fastest percolation rate? 7) Why does the soil component from question #1 percolate the quickest? What properties/characteristics does it have that may contribute to its percolation rate? 8) Which soil component had the slowest percolation rate? 9) Why does the soil component from question #3 percolate the slowest? What properties/characteristics does it have that may contribute to its percolation rate? 10) List at least 3 people or occupations that may find knowing the percolation rate of various soil components to be useful. For each, explain how they would use this information.
a) b) c)
11) Suppose you are a farmer and you have 2 samples of soil—one is mostly sand and the other is mostly clay. You want to grow soybeans in one of these 2 soils. What questions would you need to ask before choosing the soil in which to plant your soybeans? (Write at least 2 questions). 1. 2.

Adapted from an activity developed by Cornell Science Inquiry Partnership program (http://csip.cornell.edu)
Runoff and Infiltration: Where does rainfall go?
Runoff: water that does not soak into the ground but instead runs over the surface… where does it
go? (Name three places)
Infiltration: When water seeps into the soil and rocks from the surface … where does it go?
(Name three places)
Materials:
1 of the following: Plastic bottle, pipette, eye dropper
Optional: Ring stands with clamps
2 types of sponges, small pores/large pores
Plastic bin to catch runoff
250ml beakers
Plastic sheet (acrylic, binder divider or similar) to simulate pavement
Soil is like a Sponge
1. A drizzle: Use plastic pipettes, eye droppers, or a small soda bottle rainfall simulator set at a
drizzle and hold it over a sponge. Where is the water going? Write down your observations:
2. A rainstorm … a flood: Fill beaker with water, and first very, very slowly pour it onto sponge.
Then keep on increasing speed at which you are pouring (you may need to refill the beaker!)
Experiment with different speeds. Where is the water going when you pour slowly? How is this
different when you pour fast? Write down your observations:
Slow:
Fast:
3. What do you think would change if the pores in the sponge (in
the soil) were much, much smaller? (Try this out with a fine-pored
sponge)

Adapted from an activity developed by Cornell Science Inquiry Partnership program (http://csip.cornell.edu)
4. Explain the differences in runoff and infiltration you have observed so far in your own words –
how does the sponge show what happens when rain falls on soil?
5. Paving a road: Cover the sponge with plastic, and pour water onto it again. Where is the water
going?
Write down your observations:
How does paving over the soil affect runoff and infiltration?
6. In what ways are people using land differently now than 200 years ago? Do you think there was
more or less runoff 200 years ago? Why?
7. What effects do you think runoff can have on the environment? How could runoff play a part in
pollution? How would it affect streams, rivers and lakes? How would it affect the groundwater?

Adapted from an activity developed by Cornell Science Inquiry Partnership program (http://csip.cornell.edu)
Runoff and Infiltration: Where does rainfall go?
Runoff: water that does not soak into the ground but instead runs over the surface… where does it
go? (Name three places)
Infiltration: When water seeps into the soil and rocks from the surface … where does it go?
(Name three places)
Wetlands, rivers, lakes, the ocean, floods in a city, … (there are more right answers)
Materials:
1 of the following: Plastic bottle, pipette, eye dropper
Optional: Ring stands with clamps
2 types of sponges, small pores/large pores
Plastic bin to catch runoff
250ml beakers
Plastic sheet (acrylic, binder divider or similar) to simulate pavement
Soil is like a Sponge
1. A drizzle: Use plastic pipettes, eye droppers, or a small soda bottle rainfall simulator set at a
drizzle and hold it over a sponge. Where is the water going? Write down your observations:
Students should find that the water goes into the sponge, and maybe that some is dripping out of
the sponge at the bottom.
2. A rainstorm … a flood: Fill beaker with water, and first very, very slowly pour it onto sponge.
Then keep on increasing speed at which you are pouring (you may need to refill the beaker!)
Experiment with different speeds. Where is the water going when you pour slowly? How is this
different when you pour fast? Write down your observations:
Slow:
Most, if not all water will be going into the sponge, and flowing out
the bottom. A small amount may flow over the top and run off the
sides.
Fast:
Most of the water will flow over the top of the sponge and off the
sides, it will be harder to see that some is still flowing through the
sponge.

Adapted from an activity developed by Cornell Science Inquiry Partnership program (http://csip.cornell.edu)
3. What do you think would change if the pores in the sponge (in the soil) were much, much
smaller? (Try this out with a fine-pored sponge)
More water would run off in a sponge with smaller pores, less water would infiltrate.
4. Explain the differences in runoff and infiltration you have observed so far in your own words –
how does the sponge show what happens when rain falls on soil?
Small amounts of water can go into and through the pores in the sponge, but larger amounts
poured faster can’t all fit into the pores at once. So the pores are filled up with water, and the rest
of the water flows over the top. When the pores are smaller, less water fits into them, and it flows
slower, so even more water will run off over the top. The same thing happens with soils… water
from a light drizzle will be absorbed, but when there’s a rainstorm, the soil pores become full, and
some water will run off. Soils with smaller pores at the surface will cause more runoff.
The teacher may especially need to help students think this explanation through – this seems to often be the hardest
part for students. Make sure that students are gaining the connection to the real world during this exercise.
5. Paving a road: Cover the sponge with plastic, and pour water onto it again. Where is the water
going?
Write down your observations:
How does paving over the soil affect runoff and infiltration?
All the water runs off the surface, none is able to get through the plastic (pavement), and therefore
no water goes into the soil.
6. In what ways are people using land differently now than 200 years ago? Do you think there was
more or less runoff 200 years ago? Why?
Some possible answers: More roads, larger roads, roads are paved now, more buildings, more flat
ball fields, fewer wetlands, more mechanized agriculture, larger agricultural fields, less forested
land,… There is more runoff now, because so many more surfaces are covered, paved, compacted,
or flattened now than 200 years ago
7. What effects do you think runoff can have on the environment? How could runoff play a part in
pollution? How would it affect streams, rivers and lakes? How would it affect the groundwater?
Many possible answers here: erosion of agricultural land, fertilizers and pesticides can be washed
away; sediment, nutrients, pesticides, chemicals from cities such as gasoline and oil, can all be
washed into rivers and lakes and pollute these. More runoff can create floods. With more runoff
there is less groundwater recharge, so this can contribute to the groundwater level going down, etc