the power to reduce co 2 emissions the full portfolio wspe discovery conference
DESCRIPTION
The Power to Reduce CO 2 Emissions The Full Portfolio WSPE Discovery Conference. April 23, 2009 Dan Bartel, EPRI Senior Account Executive. About EPRI. Together…Shaping the Future of Electricity. - PowerPoint PPT PresentationTRANSCRIPT

The Power to Reduce CO2 EmissionsThe Full Portfolio
WSPE Discovery Conference
April 23, 2009
Dan Bartel, EPRISenior Account Executive

2© 2007 Electric Power Research Institute, Inc. All rights reserved.
About EPRI
• Founded in 1973 as an independent, nonprofit center for public interest energy and environmental research.
• Objective, tax-exempt, collaborative electricity research organization
• Science and technology focus--development, integration, demonstration and applications
• Broad technology portfolio ranging from near-term solutions to long-term strategic research
Together…Shaping the Future of Electricity

3© 2007 Electric Power Research Institute, Inc. All rights reserved.
Large and Successful R&D Collaboration
• More than 450 participants in over 40 countries
– Over 90% of North American electricity generated
• 66 technical programs
– Generation
– Power Delivery and Utilization
– Nuclear
– Environment
– Technology Innovation
• 1600+ R&D projects annually
• 10 to 1 average funding leverage
• Research is directed to the public benefit
• Limited regulatory, judicial and legislative participation

4© 2007 Electric Power Research Institute, Inc. All rights reserved.
EPRI’s Role
Depends Upon The Specific Technology or Discipline
National Laboratories
Universities
Suppliers
Vendors
EPRI
BasicResearch
&Development
TechnologyCommercialization
CollaborativeTechnology
DevelopmentIntegrationApplication

5© 2007 Electric Power Research Institute, Inc. All rights reserved.
The Bottom Line – It’s Not a Silver Bullet, It’s Silver Buckshot: Using Technology to Reduce Carbon Emissions
• There is substantial potential for reducing U.S. electricity sector CO2 emissions.
• Decarbonizing the electricity sector will be expensive, but availability of a full portfolio of low-cost, low-carbon technologies can substantially reduce costs to the nation’s economy.
• No one technology will be a silver bullet – a portfolio of technologies will be needed.
• A low carbon-emitting electric sector is critical to decarbonizing the rest of the U.S. economy at a manageable cost.
• Much of the needed technology isn’t available yet – substantial R&D, demonstration is required.
• The economic and environmental benefits of a full portfolio of low-emitting technologies far outweigh the costs of RD&D investment.

6© 2007 Electric Power Research Institute, Inc. All rights reserved.
Assess the Technical Potential for Reducing Electricity Sector Emissions
PRISM
Economic Analysis (MERGE)
Technology Pathways
• Aggressive, successful RD&D
• 2030 horizon
• Compare to EIA 2007-2008
• No economic, policy barriers to deployment
• Compare limited and full technology portfolios
• Full portfolio approximates PRISM assumptions
• 2050 horizon
• Generic CO2 emissions reductions policies
• Lowest-cost technology portfolio that meets policy
• Inflation adjusted, constant 2000 $
• 2030 horizon
• Use existing technology roadmaps where possible
• Focus on 4 major technology conclusions from PRISM
• Timing and sequence of major RD&D activities
• Preliminary estimate of RD&D funding needs
7© 2007 Electric Power Research Institute, Inc. All rights reserved.
0
500
1000
1500
2000
2500
3000
3500
1990 1995 2000 2005 2010 2015 2020 2025 2030
U.S
. Ele
ctri
c S
ecto
rC
O2 E
mis
sio
ns
(mill
ion
met
ric
ton
s)
EIA Base Case 2007
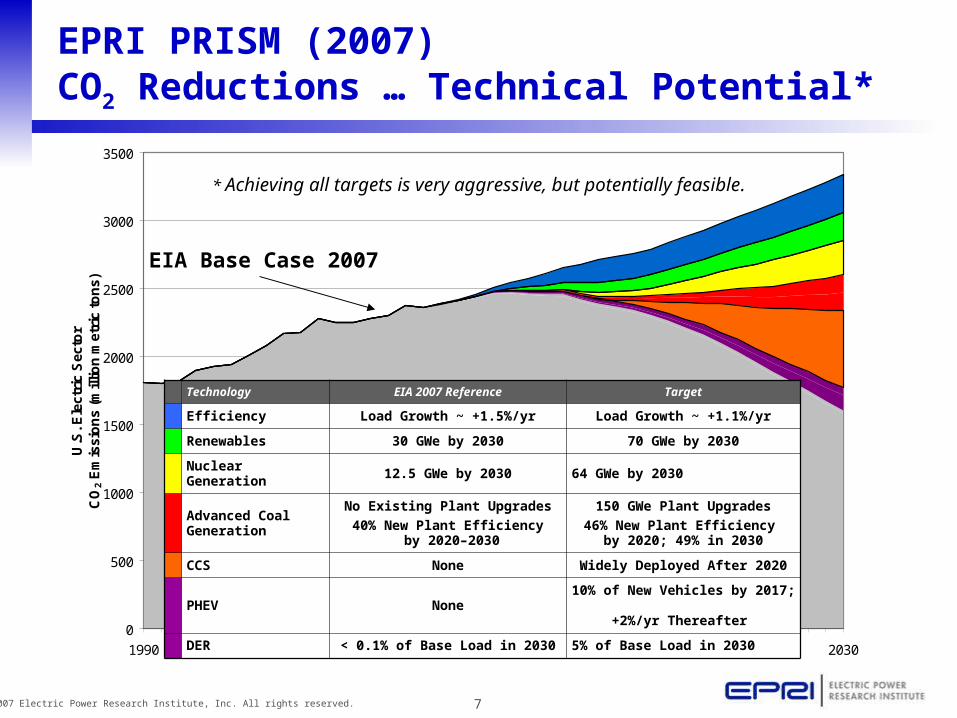
EPRI PRISM (2007)CO2 Reductions … Technical Potential*
Technology EIA 2007 Reference Target
Efficiency Load Growth ~ +1.5%/yr Load Growth ~ +1.1%/yr
Renewables 30 GWe by 2030 70 GWe by 2030
Nuclear Generation 12.5 GWe by 2030 64 GWe by 2030
Advanced Coal Generation
No Existing Plant Upgrades
40% New Plant Efficiency by 2020–2030
150 GWe Plant Upgrades
46% New Plant Efficiency by 2020; 49% in 2030
CCS None Widely Deployed After 2020
PHEV None10% of New Vehicles by 2017;
+2%/yr Thereafter
DER < 0.1% of Base Load in 2030 5% of Base Load in 2030
* Achieving all targets is very aggressive, but potentially feasible.

8© 2007 Electric Power Research Institute, Inc. All rights reserved.
0
500
1000
1500
2000
2500
3000
3500
1990 1995 2000 2005 2010 2015 2020 2025 2030
U.S
. E
lectr
ic S
ecto
rC
O2 E
mis
sio
ns (
millio
n m
etr
ic t
on
s)
CO2 Reductions … Technical Potential from Electricity Sector
Projected CO2 Emissions in 2030
(due to economic and population growth)CO2 Emissions Today
On a Path to De-carbonize the Electricity Sector
On a Path to De-carbonize the Electricity Sector
Efficiency in Homes and Business
Wind Power
Nuclear Power
Advanced Coal
CO2 Capture & Storage
Solar and PHEVs
9© 2007 Electric Power Research Institute, Inc. All rights reserved.
0
500
1000
1500
2000
2500
3000
3500
1990 1995 2000 2005 2010 2015 2020 2025 2030
U.S
. Ele
ctri
c S
ecto
rC
O2 E
mis
sio
ns
(mill
ion
met
ric
ton
s)
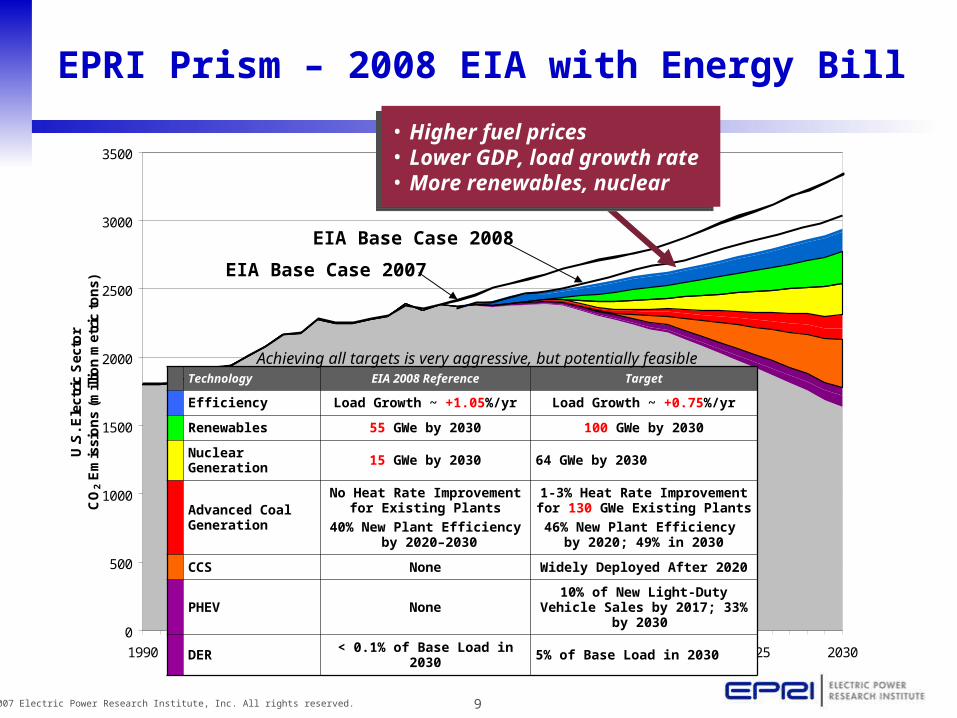
EIA Base Case 2008
Technology EIA 2008 Reference Target
Efficiency Load Growth ~ +1.05%/yr Load Growth ~ +0.75%/yr
Renewables 55 GWe by 2030 100 GWe by 2030
Nuclear Generation 15 GWe by 2030 64 GWe by 2030
Advanced Coal Generation
No Heat Rate Improvement for Existing Plants
40% New Plant Efficiency by 2020–2030
1-3% Heat Rate Improvement for 130 GWe Existing Plants
46% New Plant Efficiency by 2020; 49% in 2030
CCS None Widely Deployed After 2020
PHEV None10% of New Light-Duty Vehicle
Sales by 2017; 33% by 2030
DER < 0.1% of Base Load in 2030 5% of Base Load in 2030
EIA Base Case 2007
EPRI Prism – 2008 EIA with Energy Bill
Achieving all targets is very aggressive, but potentially feasible
• Higher fuel prices• Lower GDP, load growth rate • More renewables, nuclear
• Higher fuel prices• Lower GDP, load growth rate • More renewables, nuclear

10© 2007 Electric Power Research Institute, Inc. All rights reserved.
Generation Mix
Coalw/o CCS
39%
Advanced Coalw/CCS, 13%
Natural Gas5%
Nuclear29%
ConventionalHydropower
5%
Non-HydroRenewables, 9%
EPRI “Prism” Projected 2030 Generation Mix
EIA 2008 with Energy Bill – Projection for 2030
Petroleum, 1%
Coal, 58%
Natural Gas, 11%
Conventional Hydropower, 6% Non-Hydro Renewables, 5%
Nuclear, 19%
2007 U.S. Electricity Generation Mix
Petroleum, 1%
Coal, 51%
Natural Gas, 18%
Conventional Hydropower, 7%
Non-Hydro Renewables, 2%
Nuclear, 21%

11© 2007 Electric Power Research Institute, Inc. All rights reserved.
Key Technology Challenges
1. Smart grids and communications infrastructures to enable end-use efficiency and demand response, distributed generation, and PHEVs.
2. A grid infrastructure with the capacity and reliability to operate with 20-30% intermittent renewables in specific regions.
3. Significant expansion of nuclear energy enabled by continued safe and economic operation of existing nuclear fleet; and a viable strategy for managing spent fuel.
4. Commercial-scale coal-based generation units operating with 90+% CO2 capture and storage in a variety of geologies.
Advanced Electricity Technologies needed to achieve “Prism” profile
Achieving “Prism” profile will require aggressive public and private sector RD&D programs and accelerated commercial deployment

12© 2007 Electric Power Research Institute, Inc. All rights reserved.
Evaluate the Economic Impact of Developing Advanced Technologies to Reduce Emissions
PRISM
Economic Analysis (MERGE)
Technology Pathways
• Aggressive, successful RD&D
• 2030 horizon
• Compare to EIA 2007
• No economic, policy barriers to deployment
• Compare limited and full technology portfolios
• Full portfolio approximates PRISM assumptions
• 2050 horizon
• Generic CO2 emissions reductions policies
• Lowest-cost technology portfolio that meets policy
• Inflation adjusted, constant 2000 $
• 2030 horizon
• Use existing technology roadmaps where possible
• Focus on 4 major technology conclusions from PRISM
• Timing and sequence of major RD&D activities
• Preliminary estimate of RD&D funding needs

13© 2007 Electric Power Research Institute, Inc. All rights reserved.
MERGE Model Overview
• A Model for Evaluating Regional and Global Effects of GHG reduction policies
• Global intertemporal optimization model
• Nine regions (USA, Western Europe, China, India, etc.)
• Each country or group of countries maximizes its own welfare
• Top-down model of economic growth and energy use
• Process model of energy sector technology:
– Electric Generation
– Non-Electric Energy
• Capable of representing a variety of greenhouse gas control scenarios
• Captures economy-wide impact of carbon policy
One of three models used by US Climate Change Science Program and in many other international and domestic studies

14© 2007 Electric Power Research Institute, Inc. All rights reserved.
• PRISM electric sector CO2
profile most closely modeled by economy-wide constraint which:
−Caps emissions at 2010 levels until 2020
−Requires 3% decline beginning in 2020
Assumed U.S. Economy-Wide CO2 Constraint
0
1
2
3
4
5
6
7
8
9
2000 2010 2020 2030 2040 2050
Bil
lio
n T
on
s C
O2 p
er y
ear
Starting Point is Current Intensity Target
2010 Cap to 2020
3% decline

15© 2007 Electric Power Research Institute, Inc. All rights reserved.
Electricity Technology Scenarios
Full Portfolio Limited Portfolio
Supply-Side
Carbon Capture and Storage (CCS)
Available Unavailable
New NuclearProduction Can
ExpandExisting Production
Levels ~100 GW
Renewables Costs Decline Costs Decline Slower
New Coal and Gas Improvements Improvements
Demand-Side
Plug-in Hybrid Electric Vehicles (PHEV)
Available Unavailable
End-Use EfficiencyAccelerated
ImprovementsImprovements

16© 2007 Electric Power Research Institute, Inc. All rights reserved.
U.S. Electric Generation – Full Portfolio
Gas and non-captured coal are the only supply options paying a CO2 cost
Gas and non-captured coal are the only supply options paying a CO2 cost
The vast majority of electricity supply is CO2-free
The vast majority of electricity supply is CO2-free
Public Policy (RPS) can modify this economic allocation
Public Policy (RPS) can modify this economic allocation
Coal
Coal with CCS
Gas
Nuclear
HydroWind

17© 2007 Electric Power Research Institute, Inc. All rights reserved.
U.S. Electric Generation – Limited Portfolio
Gas (with half the CO2 of coal) pays a significant CO2 cost
Gas (with half the CO2 of coal) pays a significant CO2 cost
With a less de-carbonized supply, electricity load must decline to meet the CO2 emissions target
With a less de-carbonized supply, electricity load must decline to meet the CO2 emissions target
Biomass
Coal
Gas
Nuclear
Hydro
Wind

18© 2007 Electric Power Research Institute, Inc. All rights reserved.
2000 2010 2020 2030 2040 2050
0
50
100
150
200
250
300
350
Full
Limited
$/to
n C
O2*
*Real (inflation-adjusted) 2000$
CO2 Emission Cost – Economy Wide
Year
With a de-carbonized electricity supply, other parts of the economy pay a CO2 cost…not the electricity sector
With a de-carbonized electricity supply, other parts of the economy pay a CO2 cost…not the electricity sector

19© 2007 Electric Power Research Institute, Inc. All rights reserved.
2000 2010 2020 2030 2040 2050
0
50
100
150
200
250
300
350
$/to
n C
O2*
*Real (inflation-adjusted) 2000$
CO2 Emission Cost – Economy Wide
Year
With a less de-carbonized supply, the electricity sector pays a significant CO2 cost…along with other sectors
With a less de-carbonized supply, the electricity sector pays a significant CO2 cost…along with other sectors
Full
Limited

20© 2007 Electric Power Research Institute, Inc. All rights reserved.
Wholesale Electricity Price
Full
Limited
$/M
Wh*
Inde
x R
elat
ive
to Y
ear
2000
*Real (inflation-adjusted) 2000$Year
0
20
40
60
80
100
120
140
160
180
2000 2010 2020 2030 2040 2050
0.0
0.5
1.0
1.5
2.0
2.5
3.0
3.5
4.0
In the Full Portfolio the price of electricity has a low CO2 cost component and increases less
In the Full Portfolio the price of electricity has a low CO2 cost component and increases less

21© 2007 Electric Power Research Institute, Inc. All rights reserved.
+45%
Both Scenarios meet the same economy-wide CO2 Cap*Both Scenarios meet the same economy-wide CO2 Cap*
*Economy-wide CO2 emissions capped at 2010 levels until 2020 and then reduced at 3%/yr
Increase in Real Electricity Prices…2000 to 2050
+260%
22© 2007 Electric Power Research Institute, Inc. All rights reserved.
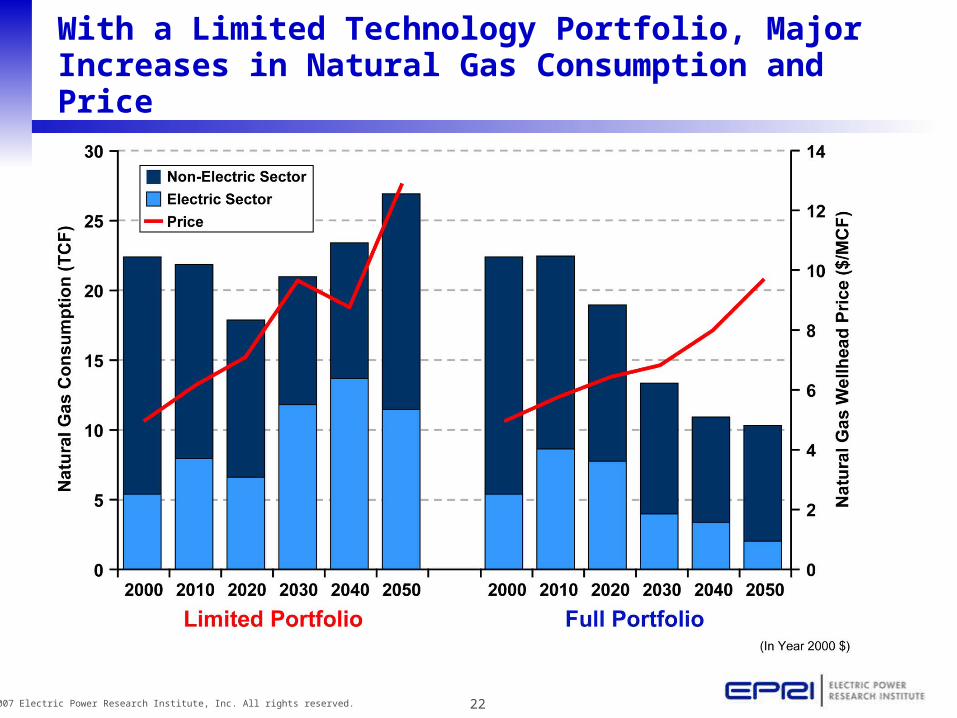
With a Limited Technology Portfolio, Major Increases in Natural Gas Consumption and Price

23© 2007 Electric Power Research Institute, Inc. All rights reserved.
Full Technology Portfolio Reduces Costs of a CO2 Emissions Reduction Policy by 60%
0.0
-0.5
-1.0
-1.5
Ch
ang
e i
n G
DP
Dis
cou
nte
d T
hro
ug
h 2
050
($T
rill
ion
s)
Cost ofPolicy
Reduction in Policy Cost with AdvancedTechnology
Value of R&D Investment
Lim
ited
Po
rtfo
lio
+ P
HE
V O
nly
+ R
enew
able
s O
nly
+ E
ffic
ien
cy O
nly
+ N
ucl
ear
On
ly
+ C
CS
On
ly
Fu
ll P
ort
folio
$1 T
rilli
on

24© 2007 Electric Power Research Institute, Inc. All rights reserved.
Research, Development and Demonstration is a good investment!!!
$1,000B
$30B
RD&D Investment(2005-2030, present value in 2000 $)
Avoided Cost to U.S. Economy
(2000-2050, present value in 2000 $)

25© 2007 Electric Power Research Institute, Inc. All rights reserved.
Summary of Key Messages From MERGE
• Very expensive without new technology
• Much less expensive with new technology
• Economic benefits much larger than cost of R&D
• New technology accelerates electrification

26© 2007 Electric Power Research Institute, Inc. All rights reserved.
What Has to be Done to Develop and Deploy the Needed Technologies?
PRISM
Economic Analysis (MERGE)
Technology Pathways
• Aggressive, successful RD&D
• 2030 horizon
• Compare to EIA 2007
• No economic, policy barriers to deployment
• Compare limited and full technology portfolios
• Full portfolio approximates PRISM assumptions
• 2050 horizon
• Generic CO2 emissions reductions policies
• Lowest-cost technology portfolio that meets policy
• Inflation adjusted, constant 2000 $
• 2030 horizon
• Use existing technology roadmaps where possible
• Focus on 4 major technology conclusions from PRISM
• Timing and sequence of major RD&D activities
• Preliminary estimate of RD&D funding needs
27© 2007 Electric Power Research Institute, Inc. All rights reserved.
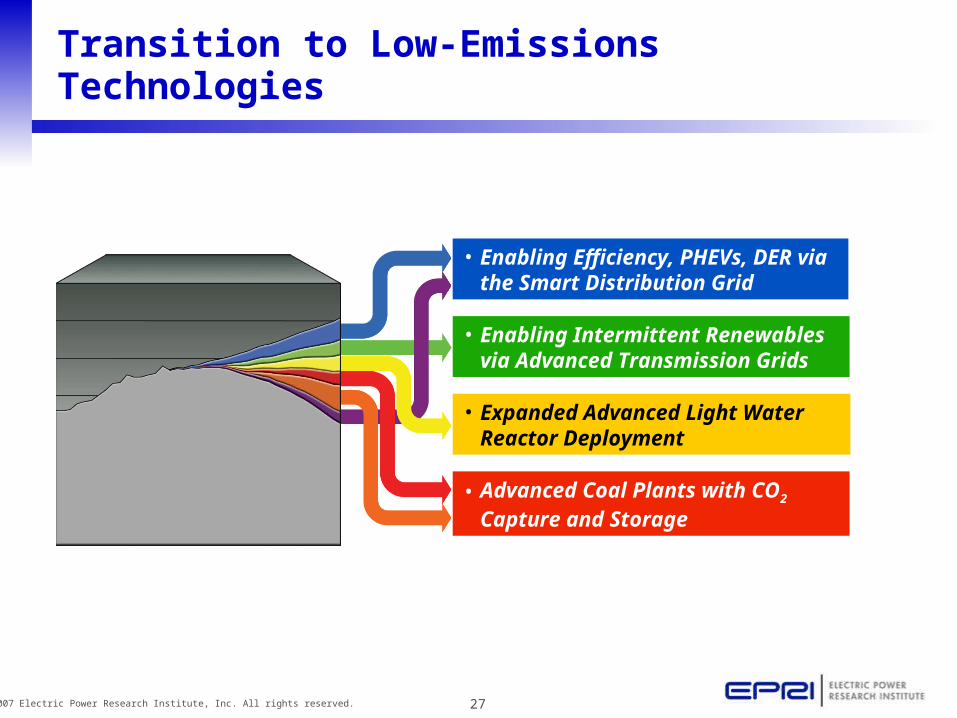
Transition to Low-Emissions Technologies
• Expanded Advanced Light Water Reactor Deployment
• Enabling Efficiency, PHEVs, DER via the Smart Distribution Grid
• Enabling Intermittent Renewables via Advanced Transmission Grids
• Advanced Coal Plants with CO2 Capture and Storage

28© 2007 Electric Power Research Institute, Inc. All rights reserved.
Demonstration Projects
Smart Grids
Energy Efficiency
Compressed Air Energy Storage
Concentrated Solar Power Plant (CSP)
CCS Using Chilled Ammonia
CCS Using a Different Technology
Low-Cost O2 Production
IGCC with CCS
Adv. Pulv. Coal Plant – UltraGen I (Future)
Analysis to Action
Technology Challenges
1. Smart Grids and Communication Infrastructure
2. Transmission Grids and Associated Energy Storage Infrastructures
3. Advanced Light Water Reactors
4. Coal-Based Generation Units with CO2 Capture and Storage

29© 2007 Electric Power Research Institute, Inc. All rights reserved.
Building for the FutureEnabling Efficiency, PHEVs, DER via the Smart Distribution Grid
Major penetration of PHEVs into new
light vehicle market.
Deployment of Smart Distribution
grids.
Smart Distribution System Demonstrations
Intelligent devices and automatic energy
management widespread.

30© 2007 Electric Power Research Institute, Inc. All rights reserved.
Building for the FutureEnabling Intermittent Renewables viaAdvanced Transmission Grids
Advanced 350 MW CAES Demonstration
Concentrated Solar Power Plant (CSP)
Intermittent renewables could provide as much as 20-30% of generation in
some areas.
Deployment ofadvanced transmission
grid technologies.
31© 2007 Electric Power Research Institute, Inc. All rights reserved.
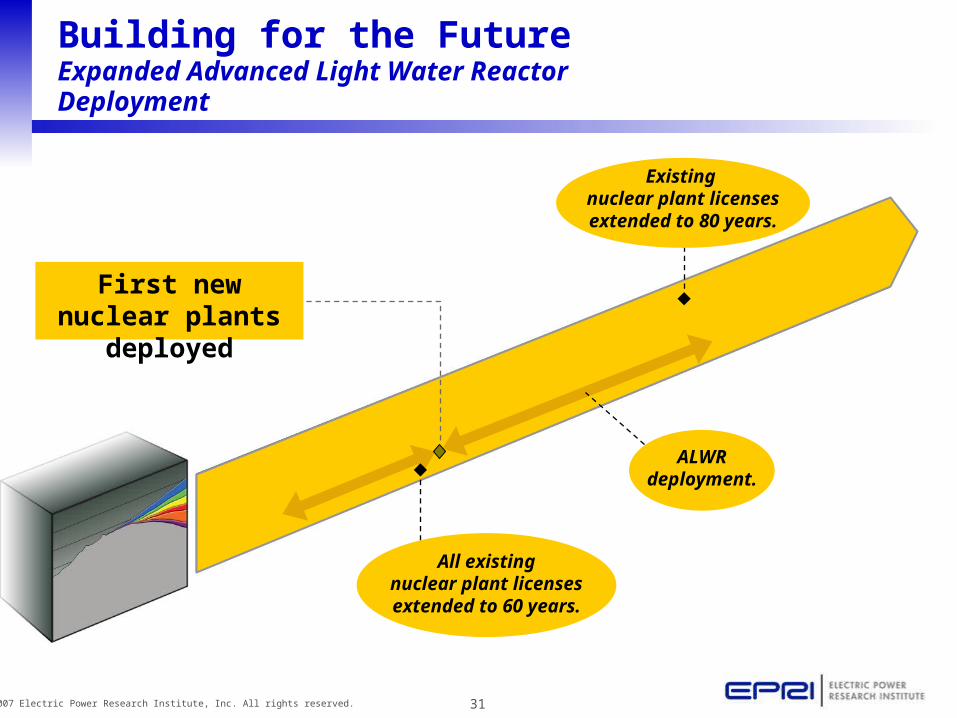
Building for the FutureExpanded Advanced Light Water Reactor Deployment
Existing nuclear plant licenses extended to 80 years.
ALWR deployment.
All existingnuclear plant licenses extended to 60 years.
First new nuclear plants deployed

32© 2007 Electric Power Research Institute, Inc. All rights reserved.
Building for the FutureAdvanced Coal Plants withCO2 Capture and Storage
CO2 Capture Demonstrations
CO2 Storage Demonstrations
Potential CO2 capture retrofits?
PotentialCO2 capture for
Natural Gas Combined Cycle plants?
All new coal plants capture 90% of CO2
Commercial availability of CO2
storage.
UltraGen I—Advanced Pulverized Coal Plant (with CO2 Capture)

33© 2007 Electric Power Research Institute, Inc. All rights reserved.
The Full Portfolio: Lower CO2, Lower Prices
+45%
*Economy-wide CO2 emissions capped at 2010 levels until 2020 and then reduced at 3%/yr
+260%

34© 2007 Electric Power Research Institute, Inc. All rights reserved.
The Bottom Line - It’s Not a Silver Bullet, It’s Silver Buckshot: Using Technology to Reduce Carbon Emissions
• There is substantial potential for reducing U.S. electricity sector CO2 emissions.
• Decarbonizing the electricity sector will be expensive, but availability of a full portfolio of low-cost, low-carbon technologies can substantially reduce costs to the nation’s economy.
• No one technology will be a silver bullet – a portfolio of technologies will be needed.
• A low carbon-emitting electric sector is critical to decarbonizing the rest of the U.S. economy at a manageable cost.
• Much of the needed technology isn’t available yet – substantial R&D, demonstration is required.
• The economic and environmental benefits of a full portfolio of low-emitting technologies far outweigh the costs of RD&D investment.

35© 2007 Electric Power Research Institute, Inc. All rights reserved.Image courtesy of Image courtesy of NASA Visible EarthNASA Visible Earth