the predictive power of yield curve - … · · 2015-01-19the predictive power of yield curve ......
TRANSCRIPT

THE PREDICTIVE POWER OF YIELD CURVE FOR OUTPUT AND INFLATION IN THAILAND
Yuwanee Ouinong
MOTIVATION
– 1 –
• Concerning with growth and stability in economy, current and future information on economic activities and inflation are important to all economic agents.
• The policymakers, who have to make decision today, must take into account the forward-looking of the economy.
• They rely on various data and methods used as predictors.
• Yield curve is one of the most closely watched financial indicators.
OUTLINE
– 2 –
1. Introduction
2. Objective
3. Hypothesis
4. Data
5. Methodology & Results
6. Conclusions
– 3 –
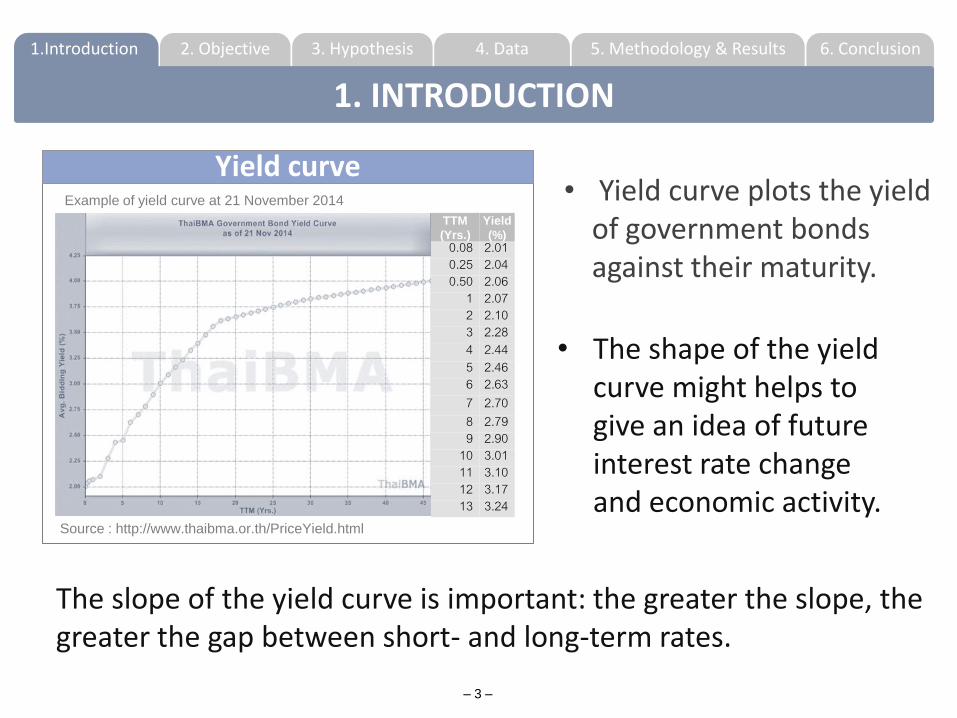
Yield curve
TTM
(Yrs.)
Yield
(%) 0.08 2.01 0.25 2.04 0.50 2.06
1 2.07 2 2.10 3 2.28 4 2.44 5 2.46 6 2.63 7 2.70 8 2.79 9 2.90
10 3.01 11 3.10 12 3.17 13 3.24
Source : http://www.thaibma.or.th/PriceYield.html
Example of yield curve at 21 November 2014 • Yield curve plots the yield of government bonds against their maturity.
2. Objective 6. Conclusion 5. Methodology & Results 4. Data 3. Hypothesis 1.Introduction
1. INTRODUCTION
• The shape of the yield curve might helps to give an idea of future interest rate change and economic activity.
The slope of the yield curve is important: the greater the slope, the greater the gap between short- and long-term rates.

– 4 –
Literature review:
• Most studies found usefulness of slope of yield curve. • Wheelock & Wohar (2009) did survey of the literature.
• Mehl (2006) found its usefulness in emerging countries.
• Hamilton (2001) decomposed the sources of its predictive power.
Slope of the yield curve
• The difference in yields between long-term and short-term interest rate.
• Also called term spread or yield spread.
2. Objective 6. Conclusion 5. Methodology & Results 4. Data 3. Hypothesis 1.Introduction
1. INTRODUCTION

Investigate the usefulness of yield spread to predict inflation and output growth in Thailand.
Also examine whether yield spreads have marginal predictive power over other variables.
Find reasons behind those relationships..
This study aims to:
1
2
– 5 –
2. Objective 6. Conclusion 5. Methodology & Results 4. Data 3. Hypothesis 1.Introduction
2. OBJECTIVE

– 6 –
Where denote inflation rate, nominal interest rate, and real interest rate from time t to t+n. n
t
n
t
n
t ri ,,
Predictive power of the yield curve for output Based on the expectation hypothesis.
Predictive power of the yield curve for inflation Based on the Fisher equation.
• If market participants anticipate an economic boom and future higher rate of return on investment.
• Then expected future short rates exceed the current short rate. • And the yield on long-term bonds should rise relative to short-
term yields.
2. Objective 6. Conclusion 5. Methodology & Results 4. Data 3. Hypothesis 1.Introduction
3. HYPOTHESIS

– 7–
Yield variable:
• Yield spread: Difference between 10-year government bonds yield and 3-month treasury bills yield.
Macroeconomic variable:
• Output growth : Manufacturing Production index (MPI).
• Inflation : Consumer Price Index (CPI).
• Leading indicators from BOT (Estimated as one principal component factor).
• Monetary policy measures : Policy rate, M1, M2.
From 2001 to 2013, monthly.
2. Objective 6. Conclusion 5. Methodology & Results 4. Data 3. Hypothesis 1.Introduction
4. DATA

– 8 –
STEP I STEP II STEP III
In-sample measurements of predictive content.
• One-step ahead prediction
• Multi-step ahead
prediction.
Out-of-sample measurements of predictive content.
Decomposition of why the yield curve helps predict output.
• Based on Expectation Hypothesis
2. Objective 6. Conclusion 5. Methodology & Results 4. Data 3. Hypothesis 1.Introduction
5. METHODOLOGY & RESULTS
• From 3 up to 24 horizons ahead.

Marginal predictive power over other variables
STEP I : In-sample measures of predictive content
From the previous hypothesis, the value of β1 is expected to be positive.
– 9 –
Predictive power of yield spread
= Output growth / Inflation in next k period
= 10-yr government bond yield minuses 3- month treasury bill yield
(1)
(2)
2. Objective 6. Conclusion 5. Methodology & Results 4. Data 3. Hypothesis 1.Introduction
5. METHODOLOGY & RESULTS
tjt
d
jit
c
ittt
k
t DMonetLeadYSpreadY
50
40
311
210
– 10 –
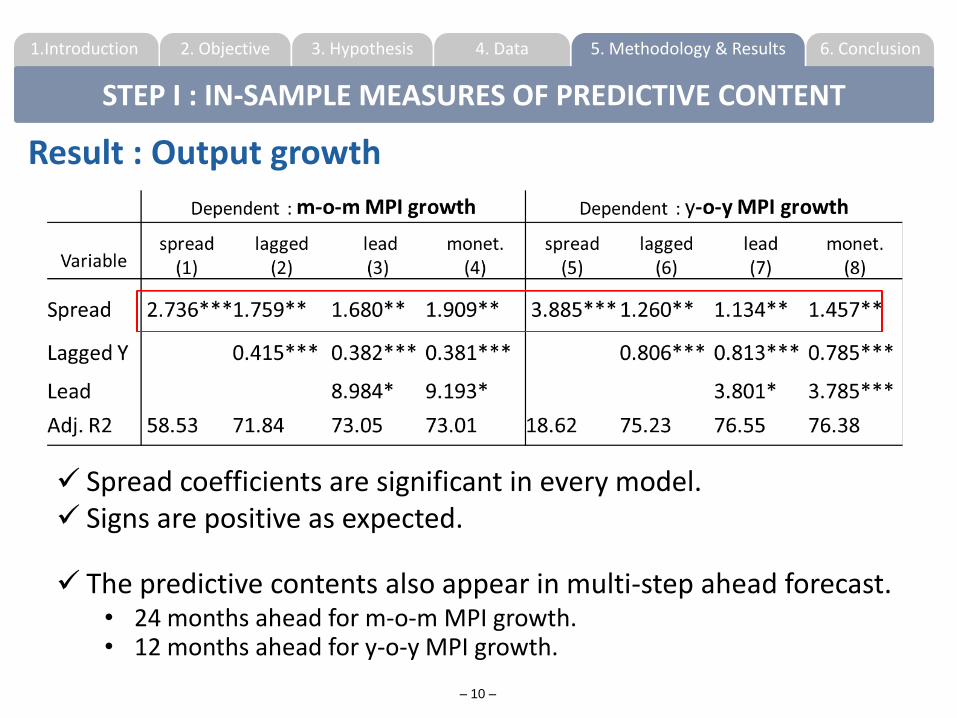
Result : Output growth
2. Objective 6. Conclusion 5. Methodology & Results 4. Data 3. Hypothesis 1.Introduction
STEP I : IN-SAMPLE MEASURES OF PREDICTIVE CONTENT
Spread coefficients are significant in every model. Signs are positive as expected.
The predictive contents also appear in multi-step ahead forecast. • 24 months ahead for m-o-m MPI growth. • 12 months ahead for y-o-y MPI growth.
– 11 –
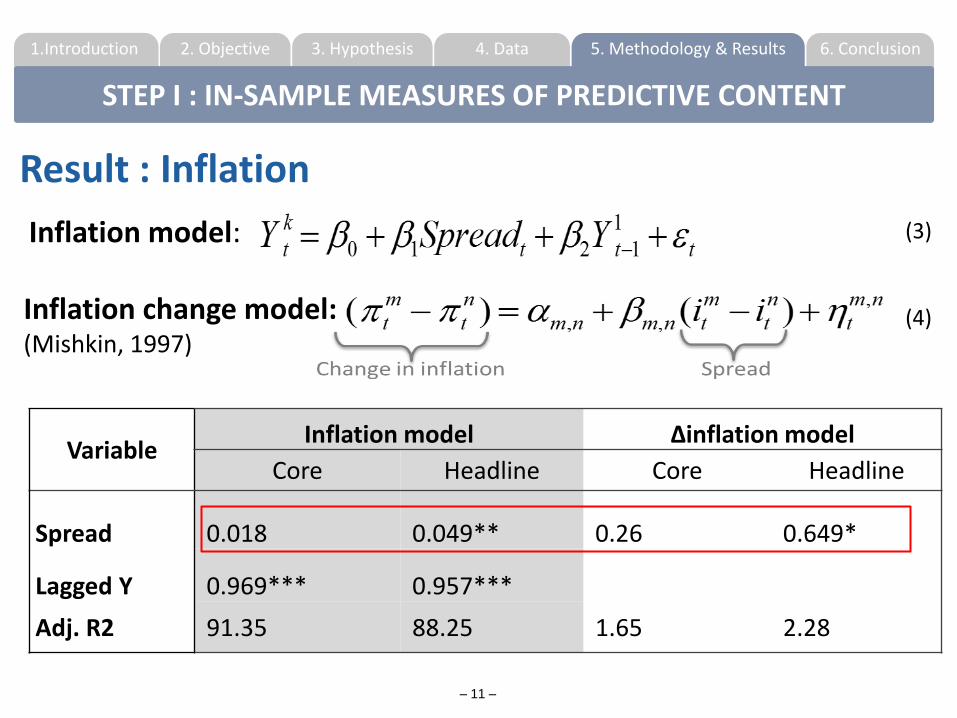
Result : Inflation
Inflation model:
Inflation change model: (Mishkin, 1997)
(3)
(4)
2. Objective 6. Conclusion 5. Methodology & Results 4. Data 3. Hypothesis 1.Introduction
STEP I : IN-SAMPLE MEASURES OF PREDICTIVE CONTENT
Variable Inflation model Δinflation model
Core Headline Core Headline
Spread 0.018 0.049** 0.26 0.649*
Lagged Y 0.969*** 0.957***
Adj. R2 91.35 88.25 1.65 2.28

– 12 –
• Estimate model from 2001m1 to 2011m12. • Forecast Y beginning at 2012m1 to the next 3, 6,12,18 and 24 horizons ahead.
Relative RMSE ratio < 1 means :
the spread forecasting model outperforms the AR model. Results: only 10 out of 20 cases that spreads outperforms
AR model.
2. Objective 6. Conclusion 5. Methodology & Results 4. Data 3. Hypothesis 1.Introduction
STEP II : OUT-OF-SAMPLE MEASURES OF PREDICTIVE CONTENT

2. Objective 6. Conclusion 5. Methodology & Results 4. Data 3. Hypothesis 1.Introduction
STEP III : DECOMPOSITION OF WHY YIELD SPREADS HELP PREDICTION
– 13 –
Spread decomposition model (Hamilton, 2001)
Expected change of short term rate Time-varying term premium
Spread can be written as
From expectation hypothesis:
Substitute spread from (6) into
(5)
(6)
(7)
Where = Long term interest rate, = Short term interest rate

– 14 –
2. Objective 6. Conclusion 5. Methodology & Results 4. Data 3. Hypothesis 1.Introduction
STEP III : DECOMPOSITION OF WHY YIELD SPREADS HELP PREDICTION
The model decomposes the contribution of the spread into 2 effects.
Expected change of short term rate Time-varying term premium
The regression results show that : • The estimated coefficient of expectation is statistically
significant up to 12 months ahead. • The contribution of the future expected change of short-term
rates is statistically bigger than that of term premium.
The result implies that the important reason that a negative yield spread might predict slower output growth is that a low spread implies falling future short-term interest rates (from expectation).

– 15–
• Term spreads can predict both m-o-m and y-o-y growth of MPI from 1 up to 12 months ahead.
• For inflation, the predictive content appears in case of headline inflation rather than core inflation.
• By using spread decomposition, the expected future short rate component has more influence on real activity growth than the term premium component.
• Further study on yield spreads would contribute to a useful indicator for economic activity.
2. Objective 6. Conclusion 5. Methodology & Results 4. Data 3. Hypothesis 1.Introduction
6. CONCLUSION