the prescription drug benefit cost and plan design …/media/images/publications/archi… · i dear...
TRANSCRIPT

The Prescription Drug BenefitCost and Plan Design Survey Report
provided by Takeda
2003 Edition
Creating Opportunities With Healthcare Solutions

i
Dear Healthcare Professional:
Takeda Pharmaceuticals America, Inc. is pleased to present you with the 2003 Prescription
Drug Benefit Cost and Plan Design Survey Report. Conducted annually by the Pharmacy Benefit
Management Institute, Inc., the report is based on data collected from 535 employers
(representing approximately 17.4 million beneficiaries). This information provides you
with a comprehensive overview of prescription drug coverage, utilization, and costs. In
addition, we hope you will garner a greater understanding of the current management
trends and issues in pharmacy benefit design.
We value our relationships with healthcare leaders and strive to provide quality products
and services to help you meet your needs. We hope you find the information in this report
useful to your organization. As always, we measure our success based on your success.
Sincerely,
Steve Shockley
National Director of Managed Care Markets
Takeda Pharmaceuticals North America, Inc.

CreatingOpportunities with HealthcareSolutions
Takeda Pharmaceuticals North America, Inc. is creating opportunities to help enhance patient care by providing:
• A comprehensive approach to research and development
• Resources and services designed to meet your needs
• Ongoing support for an evolving healthcare environment
For more information about healthcare solutions that are uniquely Takeda,please call 1-877-872-3700. We look forward to creating a partnership that helps you meet the challenges of healthcare now and in the future.
©2003 Takeda Pharmaceuticals North America, Inc. MC01-0144-1 6/03 Printed in U.S.A.

CONTENTS
Message From Takeda Pharmaceuticals North America, Inc. ............................................................................iMessage From The National Business Coalition on Health ............................................................................viiMessage From The American College of Occupational and Environmental Medicine (ACOEM) ............................x Executive Summary....................................................................................................................................1
Introduction ......................................................................................................................................1Key Findings ......................................................................................................................................1Implications of Findings ......................................................................................................................2
Methodology ............................................................................................................................................3Respondent Demographics ..................................................................................................................3
Research Findings ....................................................................................................................................5Pharmacy Reimbursement....................................................................................................................5
Retail Pharmacy Reimbursement........................................................................................................6Mail Service Pharmacy Reimbursement................................................................................................7
Administrative Fees ............................................................................................................................8Formularies and Rebates......................................................................................................................8
Formulary ....................................................................................................................................8Employer Initiated Formulary Changes ..............................................................................................9Rebates ......................................................................................................................................10
Cost Sharing ....................................................................................................................................10Three-Tier Copayments ................................................................................................................12Four-Tier Copayments ..................................................................................................................12Coinsurance ................................................................................................................................12
Drug Exclusions ................................................................................................................................13OTC Conversions ........................................................................................................................14Mandatory Mail Service ..................................................................................................................14Governmental Requirements ..........................................................................................................14Drug Access Controls ....................................................................................................................14
Utilization Management Tools ............................................................................................................16Concurrent Drug Utilization Review..................................................................................................18Retrospective Drug Utilization Review ................................................................................................19Step Therapy................................................................................................................................19Prior Authorization ......................................................................................................................19Therapeutic Substitution ................................................................................................................19Disease Management ......................................................................................................................19
Utilization Patterns...........................................................................................................................20Mail Service Utilization..................................................................................................................20Generic Utilization ......................................................................................................................20
Emerging Cost Containment Strategies ......................................................................................................23Employers Embrace Sophisticated Cost Sharing Designs ..........................................................................23OIG Compliance Guidelines for Drug Industry May be Boon to Employers ................................................24
Appendix: Supplemental Figures and Tables ................................................................................................26Notes....................................................................................................................................................30
iii
Sponsored by:Takeda Pharmaceuticals North America, Inc. 475 Half Day RoadSuite 500Lincolnshire, IL 60069General Offices: (847) 383-3000Customer Service: (877) 582-5332 or (877) 5TAKEDA
For questions relating to the report, please call:Michael H. Deskin, PresidentThe Pharmacy Benefit Management Institute, Inc.PO Box 27831Tempe, AZ 85285-7831Phone: (480) 730-0814Fax: (602) 241-6914Email: [email protected]
For further information relating to this publication, please contact:Kikaku America International2600 Virginia Avenue NW, Suite 517Washington, DC 20037Phone: (202) 338-8256Fax: (202) 337-3496Email: [email protected]
Published by:Wellman Publishing, Inc.6933 Lamar Ave NWAlbuquerque, NM 87120 USAPhone: (505) 890-6723Fax: (505): 899-4008Email: [email protected]
© Copyright 2003 by PBMI, Inc.All rights reserved. No portion of this publication may bereproduced in any format, print, electronic, or otherwise,without the express written permission of PBMI.
Made possible by a grant from Takeda PharmaceuticalsNorth America, Inc.
iv
CO-CHAIRS
EMPLOYER ASSOCIATIONS
v
Kelli MolerDirector, Membership and Government Relations ServicesNational Business Coalition on Health (NBCH)1015 18th Street NW, Suite 730Washington, DC 20036(202) 775-9300Fax: (202) 775-1569Email: [email protected]
Kathleen Y. KleinWEB Executive Director(214) 369-2219Fax: (214) [email protected]
Susan MamolaDirector of Membership American College of Occupational andEnvironmental Medicine (ACOEM)1114 N. Arlington Heights RoadArlington Heights, IL 60004(847) 818-1800, extension 383Fax: (847) 818-9266Email: [email protected]
Raymond J. BruscaVice President of BenefitsThe Black & Decker Corporation
Wayne N. Burton, MDSenior Vice PresidentCorporate Medical DirectorBank OneChicago, Illinois
Tracy CasteubleDirector, HDMA Research & InformationHealthcare Distribution Management AssociationReston, VA
Charles ConnollyClient ExecutiveMarsh USA Inc. Baltimore, MD
Joseph A. DiMasi, PhDDirector of Economic AnalysisTufts Center for the Study of Drug DevelopmentBoston, MA
Christopher V. Goff, JDPresident & CEOEmployers Health PurchasingCorporation of OhioCanton, OH
Paul HansenPrincipalTowers PerrinNew York, NY
Ed KaplanVice-PresidentThe Segal CompanyNew York, NY
Debbie MartinWilliam M. MercerNew York, NY
Laurel Pickering, MPHManaging DirectorThe NY Business Group on Health, Inc.New York, NY
Kevin B. (Kip) Piper, MA, CHEPresidentHealth Results Group LLCFalls Church, VA
Dr. Dennis Richling, MDPresident, Midwest Business Group on HealthChicago, IL
Kenneth G. RobbertNational PresidentWorldwide Employee Benefits Network (WEB)Potomac Falls, VA
Debra Stern, RPhRxperts Managed Care ConsultingIrvine, CA
F. Randy Vogenberg, RPh, PhDVice President & National Practice LeaderAon ConsultingWellesley, MA
Andrew WebberPresident & CEONational Business Coalition on Health (NBCH)1015 18th Street N.W., Suite 730Washington, DC 20036202-775-9300FAX 202-775-1569 Email: [email protected]
Barry S. Eisenberg Executive Director American College of Occupational andEnvironmental Medicine (ACOEM)1114 N. Arlington Heights RoadArlington Heights, IL 60004(847) 818-1800Fax: (847) 818-9266Email: [email protected]
We would like to thank the following individuals for their invaluable expertise in the review of this document:
For additional information please contact:

vi
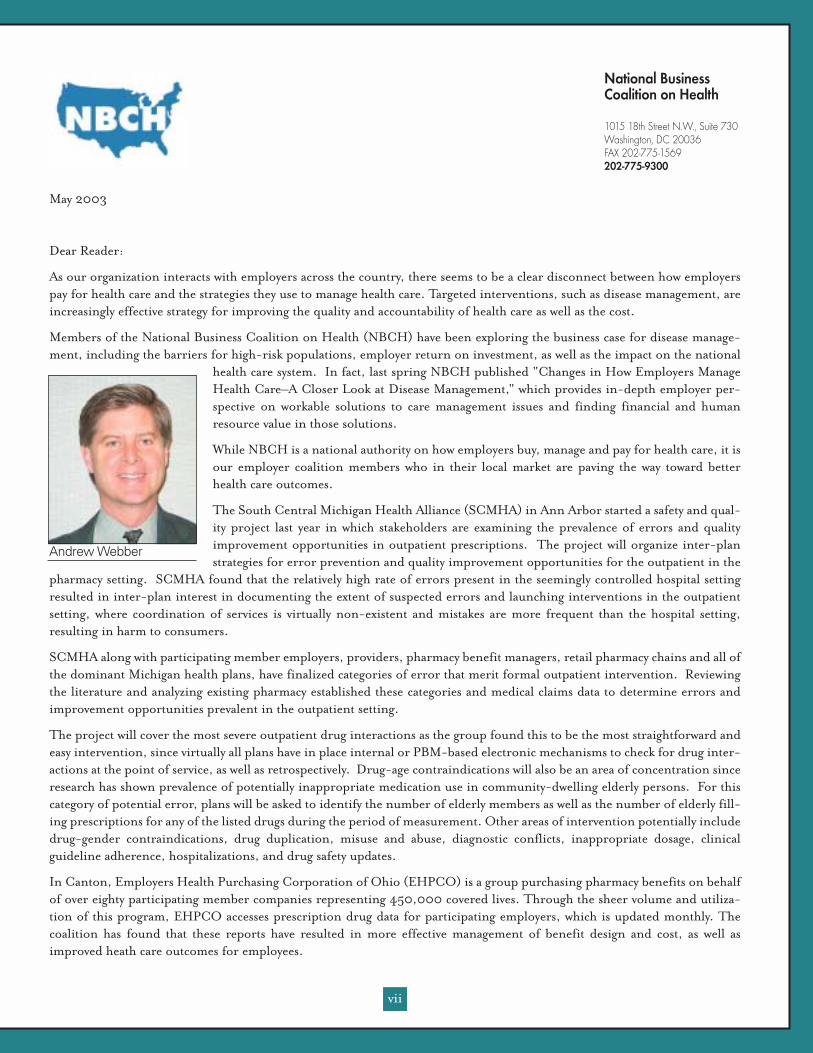
May 2003
Dear Reader:
As our organization interacts with employers across the country, there seems to be a clear disconnect between how employerspay for health care and the strategies they use to manage health care. Targeted interventions, such as disease management, areincreasingly effective strategy for improving the quality and accountability of health care as well as the cost.
Members of the National Business Coalition on Health (NBCH) have been exploring the business case for disease manage-ment, including the barriers for high-risk populations, employer return on investment, as well as the impact on the national
health care system. In fact, last spring NBCH published "Changes in How Employers ManageHealth Care–A Closer Look at Disease Management," which provides in-depth employer per-spective on workable solutions to care management issues and finding financial and humanresource value in those solutions.
While NBCH is a national authority on how employers buy, manage and pay for health care, it isour employer coalition members who in their local market are paving the way toward betterhealth care outcomes.
The South Central Michigan Health Alliance (SCMHA) in Ann Arbor started a safety and qual-ity project last year in which stakeholders are examining the prevalence of errors and qualityimprovement opportunities in outpatient prescriptions. The project will organize inter-planstrategies for error prevention and quality improvement opportunities for the outpatient in the
pharmacy setting. SCMHA found that the relatively high rate of errors present in the seemingly controlled hospital settingresulted in inter-plan interest in documenting the extent of suspected errors and launching interventions in the outpatientsetting, where coordination of services is virtually non-existent and mistakes are more frequent than the hospital setting,resulting in harm to consumers.
SCMHA along with participating member employers, providers, pharmacy benefit managers, retail pharmacy chains and all ofthe dominant Michigan health plans, have finalized categories of error that merit formal outpatient intervention. Reviewingthe literature and analyzing existing pharmacy established these categories and medical claims data to determine errors andimprovement opportunities prevalent in the outpatient setting.
The project will cover the most severe outpatient drug interactions as the group found this to be the most straightforward andeasy intervention, since virtually all plans have in place internal or PBM-based electronic mechanisms to check for drug inter-actions at the point of service, as well as retrospectively. Drug-age contraindications will also be an area of concentration sinceresearch has shown prevalence of potentially inappropriate medication use in community-dwelling elderly persons. For thiscategory of potential error, plans will be asked to identify the number of elderly members as well as the number of elderly fill-ing prescriptions for any of the listed drugs during the period of measurement. Other areas of intervention potentially includedrug-gender contraindications, drug duplication, misuse and abuse, diagnostic conflicts, inappropriate dosage, clinicalguideline adherence, hospitalizations, and drug safety updates.
In Canton, Employers Health Purchasing Corporation of Ohio (EHPCO) is a group purchasing pharmacy benefits on behalfof over eighty participating member companies representing 450,000 covered lives. Through the sheer volume and utiliza-tion of this program, EHPCO accesses prescription drug data for participating employers, which is updated monthly. Thecoalition has found that these reports have resulted in more effective management of benefit design and cost, as well asimproved heath care outcomes for employees.
vii
National Business Coalition on Health
1015 18th Street N.W., Suite 730Washington, DC 20036FAX 202-775-1569202-775-9300
Andrew Webber
viii
Reports to members vary as EHPCO has the ability to broadly aggregate utilization data or focus on drug-specific analysis. Byusing this warehouse, the coalition has provided extensive information helping employer members make informed decisionsregarding plan design and trend management, including the identification of top prescribers. EHPCO regularly aggregates allemployers’ data, which enables trend analysis of local prescribing patterns and provides employers with comparative bench-marking data. In turn, this data also allows EHPCO to monitor the effectiveness of its prescription drug program. Accordingto EHPCO, the capabilities of the data warehouse are enormous and have provided considerable value to their employer mem-bers.
A few years ago, the governing board of the Employers' Coalition on Health (ECOH) of Rockford, Illinois wanted to measurethe effectiveness of ECOH and its programs on the delivery of health care in the Rockford area using information andresources already available. This led to the development of a project in which the ECOH negotiated a contract with primarycare physicians of two local hospitals. The contracts provide incentive for the physicians to meet certain thresholds in the treat-ment of ECOH's diabetic population. ECOH uses the contract thresholds as well as claims data to measure the health status ofthe diabetic population within its employer membership. At the time, diabetics in general comprised six percent of the ECOHpopulation, but accounted for approximately fifteen percent of total health care costs.
The coalition decided to measure the health of the diabetic population against the overall ECOH population using claims data.The primary measurement tools are the Health Care Quality Improvement Project (HCQIP), and the Illinois Foundation forQuality Health Care's Health "Project-in-a-Box," which is comprised of a diabetic flow chart, intervention suggestions andliterature reprints.
This project began in January 1, 1999 as an effort to move local diabetes practice patterns toward "best practices" developedthrough clinical research. ECOH will use accumulated data for the period of January 1, 1999 through June 30, 2000 as thebenchmark for measuring ECOH's impact for the following three years, 2001-2003. It is anticipated that over time such indi-cators as admissions per 1000 covered lives and hospital days per 1000 will be reduced as better treatment is delivered throughthe "project-in-a-box." The benchmark data may also reveal that indicators such as number of services for the diabetic patientsmay rise during the early years of the study, and decline as treatment and health status improve later on in the study.
According to Sam Schmitz, the coalition’s executive director, the influence of the ECOH on local health care delivery systemshas gained momentum in the past few years. With ever-increasing enrollment, the coalition now has approximately ten per-cent of the market and represents some of the larger and most influential employers in the market place. The combination ofsize and representation has afforded the coalition the opportunity to be creative in its attempts to drive quality and cost in thelocal market.
In addition to completing the data collection and measurement aspect of the diabetic project, ECOH also is exploring newopportunities to carry this incentive model to a higher level in diabetic care by changing the way a diabetic receives care at thephysician’s office.
Oregon Coalition of Health Care Purchasers near Portland is spearheading a state chronic disease data clearinghouse for bet-ter management of asthma and diabetes with the goal of eventual application to other chronic disease states. According toD’Anne Turner Gilmore, executive director of the Oregon Coalition of Health Care Purchasers, the pilot phase of this proj-ect is approximately 60 percent complete. The project, led by a joint working group of the Oregon Health Care QualityCorporation, created by the Oregon Coalition of Health Care Purchasers, the Oregon Diabetes Coalition, and the OregonAsthma Network, was developed to prototype a clearinghouse that interacts with physician and plan tracking systems.
The primary object of the clearinghouse is to deliver essential, timely information to physicians about their patients withchronic diseases so that they can provide the better patient outcomes. This data platform also will facilitate better health deci-sions by health plans and policy makers by providing a more accurate picture of utilization and treatment. This is an area thatis lacking in Oregon’s health care system.

ix
The only universally collected data sets are those used for billing purposes, which notoriously lack key clinical information, andare not integrated with other information systems that could improve treatment decisions. By comparison, even one of thestate’s largest health plan providers, with an internally integrated system that incorporates all clinical information for its ownpatients, does not have the data to make comparisons with the "outside" patient community.
Although some doctor groups and health plans have independently developed or adopted several separate diabetes and asthmatracking systems in Oregon, they do not share or integrate information among systems. Automated information is frequent-ly received on paper and re-entered into another computer. Without a coordinated collaborative effort, the adoption of track-ing systems by physicians and providers will be slow, will not capitalize on the potential for cross-communication and connec-tivity, and will not efficiently capture the information that physicians need.
This pilot project was intended to create a clearinghouse that interacts with four to six major functioning tracking systems thathelp physicians provide comprehensive quality care for their patients with diabetes or asthma. The exploration, testing andresolution of legal, technical and software solutions developed by these pilots will be available for implementation in physicianpractices throughout Oregon and the nation.
In January 2003, the Dallas Fort Worth Business Group on Health started a new disease management intervention project withthe Federal Reserve Bank of Dallas and TXU. Once a month, Federal Reserve and TXU employees who have enrolled in theprogram attend an educational "Lunch & Learn" session taught by a Certified Diabetes Educator from Baylor University’sDiabetes Center. The monthly diabetes education series continued until June for a total of six sessions. In addition to thelunchtime consultations, program participants also receive weekly reinforcement messages via email to help them stay on trackwith glucose monitoring and healthy diet and exercise habits. Participants at both companies have received baseline health riskassessments (HRAs) and blood tests for glucose, lipids and Hemoglobin A1C. Participants will be re-tested at the completionof the intervention phase in order to assess the effectiveness and ROI of this type of multifaceted worksite disease managementprogram.
NBCH is pleased to provide employers and consumers access to HEALTHSMART.org, an Internet–based health educationwebsite. Through unrestricted educational grants, NBCH has carefully developed this site using a variety of academic and pro-fessional health care resources. Available for both Intranet and Internet use, HEALTHSMART is consumer–friendly provid-ing thorough, high quality information. With the principal objective of preparing consumers for interaction with the healthcare system, HEALTHSMART equips them with tools to communicate more confidently with providers, as well as informa-tion on what to do in the event of diagnosis with a disease or health condition.
Clinical, economic and workplace studies provide revealing and persuasive evidence that chronic disease has a major impacton workplace productivity, significantly linking burdensome direct and indirect costs to our nation’s employers. Consequently,common needs have arisen among employers as they strive to manage productivity and labor costs while at the same time retain-ing and attracting employees in an uncertain labor market.
Most employers now understand the future benefits gained by empowering consumers through technology and providing thetools and skills to effectively interact within our nation’s complex health care system. Consumer education, disease preven-tion and health care intervention should be key strategies of policymakers, public and private purchasers, and providers toimprove our nation’s productivity and reduce health care spending.
Sincerely,
Andrew WebberPresident & CEO
Dear Reader:
On behalf of the American College of Occupational and Environmental Medicine (ACOEM), I am pleased to serve as Co-Chair for the Prescription Drug Benefit Cost and Plan Design Survey. ACOEM, as the nation’s largest society of occupation-al and environmental medicine physicians, is committed to advancing the optimal health and safety of workers, workplaces,and environments by working with employers, health care delivery and financing organizations, pharmaceutical companies,
and other health care professionals to ensure the health of workers. I am confident thatACOEM’s involvement will enhance the Survey’s value because of our occupational and environ-mental medicine (OEM) expertise. ACOEM hopes to partner with the pharmaceutical industryto measure workforce productivity increases related to the proper management of diseases inworking-aged individuals.
Occupational and environmental medicine is the medical specialty devoted to prevention andmanagement of occupational and environmental injury, illness and disability, and promotion ofhealth and productivity of workers, their families, and communities. Health and productivityand disease management are major components of occupational and environmental medicine.Traditionally, employers have turned to OEM professionals to increase productivity by manag-ing occupational injuries and illnesses. Today, the continual emergence of new chemicals, com-plex tools, manufacturing methodologies, pollution and environmental impacting activities, and
health care reform have focused on and mandated a greater need for trained occupational and environmental medical spe-cialists. ACOEM members are knowledgeable and skilled in treating job-related diseases, recognizing and resolving workplacehazards, instituting rehabilitation methods, and providing well-managed care. In addition, their unique training enablesoccupational and environmental physicians to appreciate and understand business needs, ergonomics, industrial hygiene,clinical/preventive medicine, epidemiology, and biostatistics.
Employers are increasingly concerned about the burden of illness in their workforce and its impact on productivity. The totalcost of ill health to business and industry is comprised of not only direct medical costs, but of health-related productivity costsdue to absenteeism and presenteeism. Employers are recognizing that their employees are their most valuable asset and thattheir health is the key to a healthy bottom line.
Since its inception in 1916, ACOEM has been involved in many initiatives that aim to improve employee health, wellness, andproductivity through disease management. A number of these initiatives have been directed through the corporate medicaldirector members of ACOEM who have taken on an increasingly important role within industry in guiding key health policydecisions.
In the fall of 2002, ACOEM partnered with The Benfield Group to conduct a survey on health and productivity management.The survey instrument was distributed to more than 1,200 employer-based physicians and health management professionals,and was supplemented with selected interviews. The survey and interviews have provided valuable information on the status ofhealth and productivity management among U.S. employers, as well as the perspectives, opinions, and priorities of physicianswho are guiding and managing employer-based health programs.
These results will help ACOEM design programs and services that best support mutual interests in health, wellness, and pro-ductivity management efforts. The survey results show that while corporations have a great interest in health initiative pro-grams, several areas with great potential to both improve health, and to generate a substantial return on investment for corpo-rations are relatively unexplored. Areas such as disease management, return-to-work-programs, safety programs, and absence
x
Barry S. Eisenberg
management are all seen as being of great importance in improving health and productivity.
In recent years, disease management in the workplace has been a particular focus of ACOEM education efforts. Last year, theCollege developed an educational session and a CD-ROM on the public health aspects of hepatitis C. This session addressedthe natural history of hepatitis C; its epidemiology; the clinical history of patients; guidelines and cost effectiveness of screen-ing for chronic hepatitis C; advances in treatment; and the financial and legal implications of hepatitis C in the workplace.Members were offered educational materials and a patient management program for hepatitis C that they could use for theiremployees.
These resources were intended to create among employers an awareness of hepatitis C hazards and to assist employees who maybe suffering from the disease. Managing hepatitis C in the workplace will not only improve employees’ health and quality oflife but can result in great benefits to employers by reducing long-term costs, including per person claims for both lifetimemedical and lifetime indemnity insurance claims. In fact, Milliman USA, an Actuarial Consultancy firm, found "a 4:1 returnon investment for dollars paid for treatment today against future medical care dollars" (Sherrie Dulworth, RN, MillimanUSA).
This effort was highly rated by the membership and is an example of the effectiveness of multiple communications efforts thatare based on the very best clinical and scientific information available. The methods developed in this session can be tailoredto a variety of other medical conditions.
In January 2002, ACOEM convened an Expert Panel to identify which productivity instruments best measured work loss dueto migraines. The Expert Panel identified the numerous components of productivity and identified the key elements of lostproductivity measurement to be absenteeism, presenteeism, and employee turnover or replacement costs. This study can assistemployers and health care decision-makers in developing sustainable strategies to measure the impact of migraine headacheon workplace productivity loss. Employers need to have a better understanding of the impact of medical conditions such asmigraine headache on employees’ productivity to assist in more knowledgeable and effective decision-making regarding theirinvestment in health-related productivity improvement initiatives. For those employers wishing to implement a health-relat-ed productivity measurement program within their company, this project provides information to help determine the instru-ment most appropriate for their program.
The Panel also determined that areas within the field of health-related workplace productivity measurement that need furtherstudy include the:➢ Identification of the necessary metrics for effective business decision-making and the explicit incorporation of those met-
rics into workplace productivity measurement tools,➢ Creation of a standardized definition of employee turnover and replacement costs, and Examination of the impact of an
individual’s absenteeism and presenteeism on team dynamics and interdependent work groups within the workplace envi-ronment.
For more detail on this study, please refer to "Health-Related Workplace Productivity Measurement: General and MigraineSpecific Recommendations from ACOEM Expert Panel" in the Journal of Occupational and Environmental Medicine, April2003.
In addition, over the last two years, ACOEM has initiated, fostered, and participated in strategic alliances in order to furtherhealth and productivity research by:➢ Developing metrics for the measurement of health and productivity.➢ Enhancing the "business case" for health and productivity.➢ Educating its members on health and productivity management and measurement.➢ Partnering with other organizations working on health and productivity initiatives.Workforce demographics continue to change. By 2010, the proportion of the workforce over age 54 will equal the proportionunder 25. Out of necessity, corporations must address the increasing effects of chronic diseases associated with aging on the
xi
ability to perform work. The prevention and treatment of chronic diseases – such as diabetes – is especially important as theworking population ages.
However, employers also desire health management that cares for all of their employees and families, rather than only the selectfew who are touched by specific disease management programs. Therefore, there needs to be more initiatives involving analy-sis of employee populations to ascertain not only which employees have an existing medical condition that needs management,but also to identify those employees who are at risk of developing future medical conditions so they can be prevented. Theremust be attempts to build on the strengths of disease management, but also to integrate health and disability management andcoordinate the care for the whole person and an entire employee population. Best practice guidelines from evidence-basedmedicine can empower patients and providers. With the emerging consumer movement in health care, individuals desire coor-dination across the health care continuum with quality-driven, outcomes-based, patient-centered care.
Health and productivity are inextricably linked. Due to increasing medical costs, health-related productivity losses, and limit-ed available resources, employers need to be able to determine the value or return on investment of the health care interven-tions that they purchase and their employees receive.
Potential benefits from employer-purchased health care interventions such as disease management, disability management,optimal pharmaceutical utilization, and health promotion programs include reduced medical costs and decreased productiv-ity losses associated with the firm’s workforce. We believe that by working together, we can develop the tools that will contributeto a healthier nation and healthier economy.
Respectfully,
Barry S. EisenbergExecutive DirectorAmerican College of Occupational and Environmental Medicine
xii
1
INTRODUCTIONThe Pharmacy Benefit
Management Institute, Inc.has conducted a survey of thenation’s large employers toassess trends in pharmacy
benefit management, plan design, and cost issues every yearsince 1995. Survey data are collected, compared, and ana-lyzed to provide employers with a comprehensive overview ofthe current state of prescription drug coverage costs and plandesign issues.
Each year, PBMI receives valuable input from respon-dents that is used to improve the scope of the survey andreport. PBMI has expanded its report to include updates oncost sharing strategies, the importation of drugs fromCanada, drug discount card programs, and the impact ofrecent OIG guidance on the PBM industry.
KEY FINDINGSPharmacy Reimbursement Decreases
Discounts for both retail and mail service pharmacyreimbursement continue to increase. The average AWP andthe average dispensing fee paid to retail pharmacies for branddrugs is now 85.9% and $2.13, respectively. The averageAWP and the average dispensing fee for paid to mail servicepharmacies for brand drugs is now 80.3% and $0.87,respectively.
In addition to decreases in the absolute value of the dis-pensing fee, the value of the fee relative to the ingredient costhas decreased over time. As the average ingredient cost hasincreased year after year, the dispensing fee has not.
PBM Administrative Fees DecreasePBM administrative fees for both retail and mail service
also are decreasing. In 2001, the average administrative feepaid for each retail claim was $0.38. In 2002, it decreasedto $0.28. The average administrative fee paid per mail serv-ice pharmacy claim in 2002 was $0.16, as compared to $0.23in 2001.
Formulary Use On the RiseThe use of formularies continues to increase. In 1995,
only 54% of respondents reported using a formulary. Thispercentage increased to 89% in 2002. The traditional openformulary has been replaced by the incented formulary con-cept, which has grown from just 25% of employers in 1999 toalmost two-thirds (63%) of employers in 2002. During this
time, the percentage of employers offering closed formula-ries decreased from 8% in 1999 to 2% in 2002.
PBMI added a survey question this year asking therespondents to indicate whether they had requested theirPBM change the formulary status of a drug (e.g., from pre-ferred status to nonpreferred status). Surprisingly, 19% ofthe respondents indicated they had requested a change. Infollow-up calls to a number of respondents, PBMI learnedthat some of the requested changes were for simple issuessuch as making sure that the brand version of drugs that hadbecome available generically was moved to nonpreferred sta-tus. Other changes were related to employer requests toinclude a step-therapy edit or a prior-authorization require-ment on a preferred product. Finally, some employers askedtheir PBMs to change the drugs included on the preferredproduct list.
Plan Sponsors Capturing More Rebate DollarsEmployers are receiving a greater percentage of the
rebate pie, on average, with receipts of 79% of the total rebatedollars collected as compared to 73% in 2001. Employersreceiving the greater of a percentage and a fixed amountreported receiving 86% of total rebate dollars collected.Employer size appears to have the greatest impact on the per-centage of rebates received with the largest employers receiv-ing 91% of rebates and the smallest employers only receiving64%.
Retail, Mail Cost Sharing Moves Upward at Different Rates
Retail copayments increased by approximately 10% forall tiers from 2001 to 2002. However, these increases aremore pronounced in mail. From 2001 to 2002, averagefirst-tier mail service copayments increased by 16%, second-tier increased by 20%, and third-tier by 10%. Because mailservice copayments have increased more quickly than retailcopayments for the last few years, the mail service second-tiercopayment is now 1.8 times the retail second-tier copaymentas compared to 1.6 times in 2001.
The percentage of employers using coinsurance for sec-ond-tier retail cost sharing increased from 22% in 2001 to26% in 2002. Although most employers who use coinsur-ance generally use coinsurance for all drug categories, someemployers use coinsurance only for second- or third-tierdrug prescriptions, with flat dollar first-tier copayments.This approach for the second- and third-tiers gives plansmore flexibility to ensure patients pay a consistent portion of
EXECUTIVE SUMMARY
2
the benefit cost, while providing an additional incentive touse generic drugs.
Prior Authorization Continues to IncreaseThe percentage of employers using prior authorization
programs to control costs and manage access to certain drugshas increased from 43% in 1996 to 76% in 2002. Theseprograms are similar to step therapy programs in that accessto selected drugs is restricted to those individuals who canmost benefit from their use. The difference is that theapproval process is manual rather than automatic.
Utilization Patterns Change With TimePBMI collects a limited amount of utilization data to
quantify the impact of various benefit plan design elementson utilization. On average, 13% of prescriptions are filledthrough a mail service pharmacy. However, a mandatory mailservice use requirement generates 3 times more mail serviceutilization than does the voluntary mail service option, withutilization rates of 34% and 11% respectively.
Average retail generic utilization increased from 40.4%in 2001 to 41.5% in 2002. Average mail service generic uti-lization increased from 30.4% in 2001 to 31.8% in 2002.Having a greater difference between the generic and branddrug copayments, and requiring patients to pay the differ-ence between the generic and brand drug costs appear toincrease generic drug use slightly.
IMPLICATIONS OF FINDINGSEmployers’ prescription drug costs rose 16.9% in 2002,
according to a recent survey by Mercer Human ResourceConsulting. This increase follows an increase of 17.8% in2001 and an 18.3% increase in 2000. Plan sponsors arelooking for ways to reduce these increases. The methodsavailable to plan sponsors to control drug benefit costs aregenerally grouped in the following baskets:➢ Reducing reimbursement,➢ Changing drug mix, and➢ Decreasing utilization.
Our research indicates plan sponsors use all of theseapproaches to varying degrees in their drug benefit programsto manage this trend.
Every year, pharmacy reimbursement rates decreaseincrementally. Plan sponsors, through their PBM partners,
constantly negotiate deeper discounts. These reimburse-ment discounts save plan sponsors significant amounts ofmoney. However, in terms of the trend rate, they have onlya minimal impact.
Plan sponsors also use cost sharing to manage pharmacyreimbursement and the trend rate. Cost sharing reduces theamount the plan sponsor pays. To the extent a plan sponsorcan determine in advance the expected growth in benefitcosts for any given year, the cost sharing can be modified toattain specific cost goals. Recognizing that one side effect ofincreases in cost sharing is decreases in utilization, cost shar-ing can be viewed as a cost trend management tool. However,its primary use is to mitigate cost increases.
Strictly speaking, rebates do not reduce reimbursement.They may more appropriately be viewed as reimbursementrefunds. The plan sponsor is returned money previouslyused to pay for certain drugs. Although valuable, these pay-ments also have little impact on the trend rate.
The primary causes of the drug benefit cost increases, asreported by many sources, have been changes in drug mixand increases in utilization. Beneficiaries are using moredrugs and higher cost drugs. The management tools havingthe greatest impact on the trend rate are those that affectthese factors. Plan sponsors:➢ Encourage generic drug use to replace the use of iden-
tical, expensive brand products,➢ Use formularies to encourage the use of lower cost pre-
ferred brand drug products rather than higher costnonpreferred products,
➢ Implement drug exclusions, quantity limits and othersystem edits to curb excessive utilization, and
➢ Implement utilization management programs toencourage appropriate use.Most plan sponsors use a variety of utilization manage-
ment tools—DUR, step therapy, and prior authorization—toidentify inappropriate utilization or restrict utilization tothose individuals that can clinically benefit from a particularproduct.
PBMI recommends plan sponsors continue to use all ofthese tools to affect their trend rates. It is equally importantfor PBMs to clearly communicate the impact of these tools onthis trend. Although many plan sponsors use these tools,measuring the success of these activities has been difficultgiven the ongoing increases in drug benefit costs.
3
RESPONDENT DEMOGRAPHICS
The breakdown ofrespondents according toemployer size has remainedrelatively constant since the
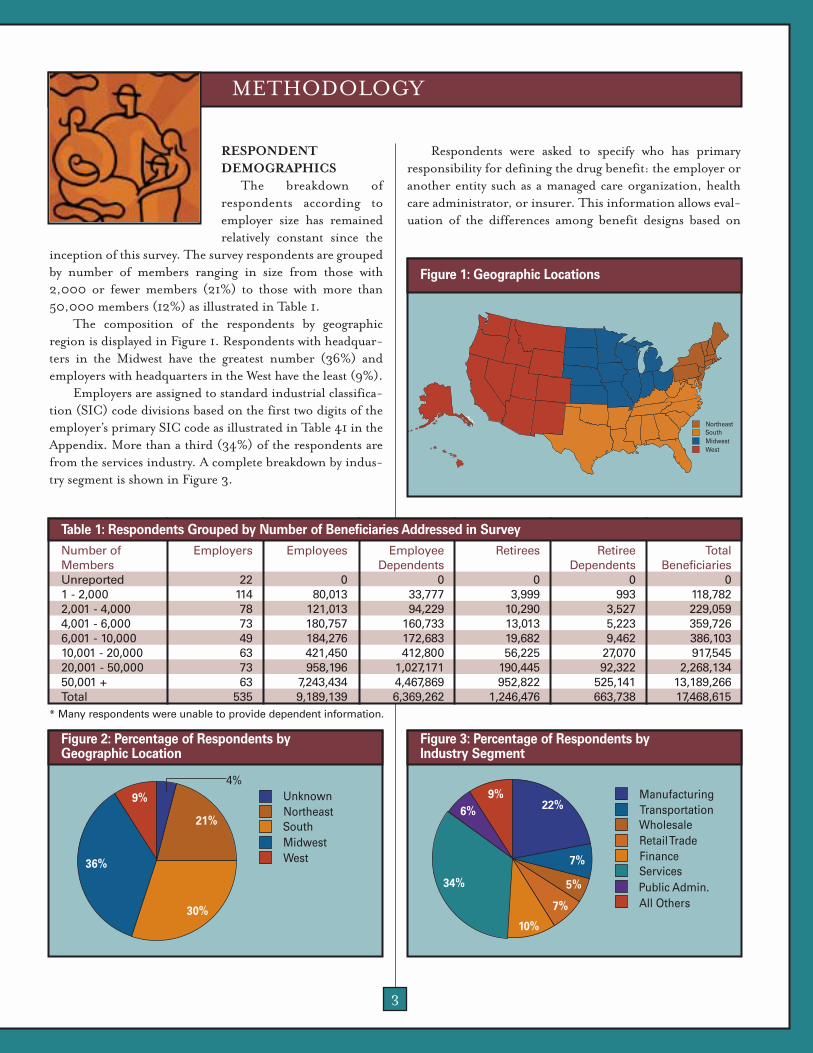
inception of this survey. The survey respondents are groupedby number of members ranging in size from those with2,000 or fewer members (21%) to those with more than50,000 members (12%) as illustrated in Table 1.
The composition of the respondents by geographicregion is displayed in Figure 1. Respondents with headquar-ters in the Midwest have the greatest number (36%) andemployers with headquarters in the West have the least (9%).
Employers are assigned to standard industrial classifica-tion (SIC) code divisions based on the first two digits of theemployer’s primary SIC code as illustrated in Table 41 in theAppendix. More than a third (34%) of the respondents arefrom the services industry. A complete breakdown by indus-try segment is shown in Figure 3.
Respondents were asked to specify who has primaryresponsibility for defining the drug benefit: the employer oranother entity such as a managed care organization, healthcare administrator, or insurer. This information allows eval-uation of the differences among benefit designs based on
METHODOLOGY
Number of Employers Employees Employee Retirees Retiree TotalMembers Dependents Dependents BeneficiariesUnreported 22 0 0 0 0 01 - 2,000 114 80,013 33,777 3,999 993 118,7822,001 - 4,000 78 121,013 94,229 10,290 3,527 229,0594,001 - 6,000 73 180,757 160,733 13,013 5,223 359,7266,001 - 10,000 49 184,276 172,683 19,682 9,462 386,10310,001 - 20,000 63 421,450 412,800 56,225 27,070 917,54520,001 - 50,000 73 958,196 1,027,171 190,445 92,322 2,268,13450,001 + 63 7,243,434 4,467,869 952,822 525,141 13,189,266Total 535 9,189,139 6,369,262 1,246,476 663,738 17,468,615
Table 1: Respondents Grouped by Number of Beneficiaries Addressed in Survey
WestMidwestSouthNortheast
Figure 1: Geographic Locations
WestMidwestSouthNortheastUnknown
36%
21%
30%
4%9%
Figure 2: Percentage of Respondents by Geographic Location
All OthersPublic AdministrationServices
FinanceRetail TradeWholesaleTransportationManufacturing
All OthersPublic Admin.ServicesFinanceRetail TradeWholesaleTransportationManufacturing
6%
34%
22%
7%
5%
7%
10%
9%
Figure 3: Percentage of Respondents by Industry Segment
* Many respondents were unable to provide dependent information.

4
whether the employer or a third party is responsible fordefining the drug benefit. It is important to note that thedata provided by the respondent are for a single plan forwhich the employer has chosen to respond, and is not neces-sarily representative of the employer’s entire book of business
The vast majority of respondents describe their pharma-cy benefits as self-defined as shown in Table 2. In general,whether benefits are self-defined or not resulted in little dif-ference in design. These differences are discussed, wherebelieved to be relevant, in applicable sections of this report.
Respondents also were asked to identify whether theypurchase PBM services as part of a coalition. The majority ofemployers (83%) do not buy these services as part of a coali-tion as illustrated in Table 3. In general, whether theemployer participated in a coalition or not resulted in littledifference in design. These differences are discussed, wherebelieved to be relevant, in applicable sections of this report.
Plan Design Decision Maker Percentage of EmployersEmployer 82%External Organization 18% (e.g., HMO, insurer, third-party administrator)
Table 2: Percentage of Respondents by Plan Design Responsibility
Coalition Member Status Percentage of EmployersCoalition Member 17%Coalition Nonmember 83%
Table 3: Percentage of Employers Participating in Coalitions

5
PHARMACY REIMBURSEMENT
Discounts in retail,brand-drug AWP continue toincrease. Overall, the AWPdiscount increased by 2.3%
from 1995 to 2002. During this time, the average retail dis-pensing fee also decreased from a high of $2.50 per script in1995 to its current low of $2.13 in 2002. The average reim-bursement rate, which is a combination of average AWP and
average dispensing fee, declined from 96.5% in 1995 to88.5% in 2002—a reduction of 8.0%. (See sidebar for amore detailed discussion regarding pharmacy reimburse-ment rate.) These trends are shown in Table 4.
A similar trend was evident in mail, although thedecreases in mail reimbursement were greater as shown inTable 5. The average, brand-mail AWP discount increasedby almost 5% from 85.0% in 1995 to 80.3% in 2002.Average mail dispensing fees also have declined from a highof $1.82 in 1995 to $0.87 in 2002. This is more than a 50%
RESEARCH FINDINGS
Calculating Pharmacy Reimbursement RatesFor purposes of measuring the
impact of both aspects of pharmacyreimbursement, PBMI created avalue that combines the discountedAWP and dispensing fee. This valuehas been labeled or referred to as"Reimbursement Rate". To createthis value, PBMI converts the dis-pensing fee into an AWP value andadds it to the discounted AWP. Thesecalculations are performed for bothretail and mail service brand pre-scriptions.
In previous reports, the conver-sion of the dispensing fee was calcu-lated using an assumed ingredientcost that has been held constant since1995. This methodology evaluateschanges in reimbursement in theabstract assuming no inflation.
Although PBMI does not believe theaverage ingredient cost is the bestmeasure of inflation, it believes cal-culating the reimbursement ratevalue using an ingredient cost num-ber that changes over time providesmore information than the previousmethodology.
Because the average dispensingfee is decreasing while the averageingredient cost is increasing, theimpact of the dispensing fee on thereimbursement rate has alsodecreased. Using an ingredient costthat increases over time causes theimpact of the dispensing fee on thereimbursement rate value to decreaseover time. The reimbursement ratevalue decreases over time regardlesswhether the discounted AWP or dis-
pensing fee decreases by virtue of aningredient cost that increases.Although not a true measure of gen-eral inflation, this reflects a de factoimpact of inflation.
Tables 4 and 5 show the retailand mail information for brand pre-scriptions. The average reimburse-ment rate is calculated Average AWP+ (Average Dispensing Fee/AverageIngredient Cost). Because theAverage Dispensing Fee is decreasingwhile the Average Ingredient Cost isincreasing, the impact of the dis-pensing fee on the reimbursementrate has also decreased. The AverageIngredient Cost value used is basedupon industry information. Thesecalculations can be replicated usingany average ingredient cost.
Year Average Average Average AverageAWP Dispensing Ingredient Reimbursement
Fee Cost Rate2002 85.9% $2.13 $79.80 88.5%2001 86.1% $2.21 $69.39 89.3%2000 86.5% $2.31 $60.34 90.3%1999 86.9% $2.30 $52.47 91.3%1998 86.8% $2.35 $45.63 91.9%1997 87.4% $2.32 $39.68 93.2%1996 87.9% $2.47 $34.50 95.1%1995 88.2% $2.50 $30.00 96.5%
Table 4: Retail Brand Reimbursement
Year Average Average AverageAWP Dispensing Reimbursement
Fee Rate2002 80.3% $0.86 81.1%2001 81.1% $1.09 82.2%2000 81.5% $1.15 82.7%1999 82.6% $1.38 84.0%1998 82.9% $1.51 84.4%1997 83.4% $1.61 85.0%1996 84.4% $1.71 86.1%1995 85.0% $1.82 86.8%
Table 5: Mail Service Brand Reimbursement
6
decrease in the dispensing fee over the past seven years.When AWP discounts and dispensing fees are combined,there was an overall 6.2% reduction in the average mail reim-bursement rate from 86.8% in 1995 to 80.6% in 2002.Because of increased competition among mail service phar-macies to increase their overall volume, mail reimbursementis expected to continue to decrease.
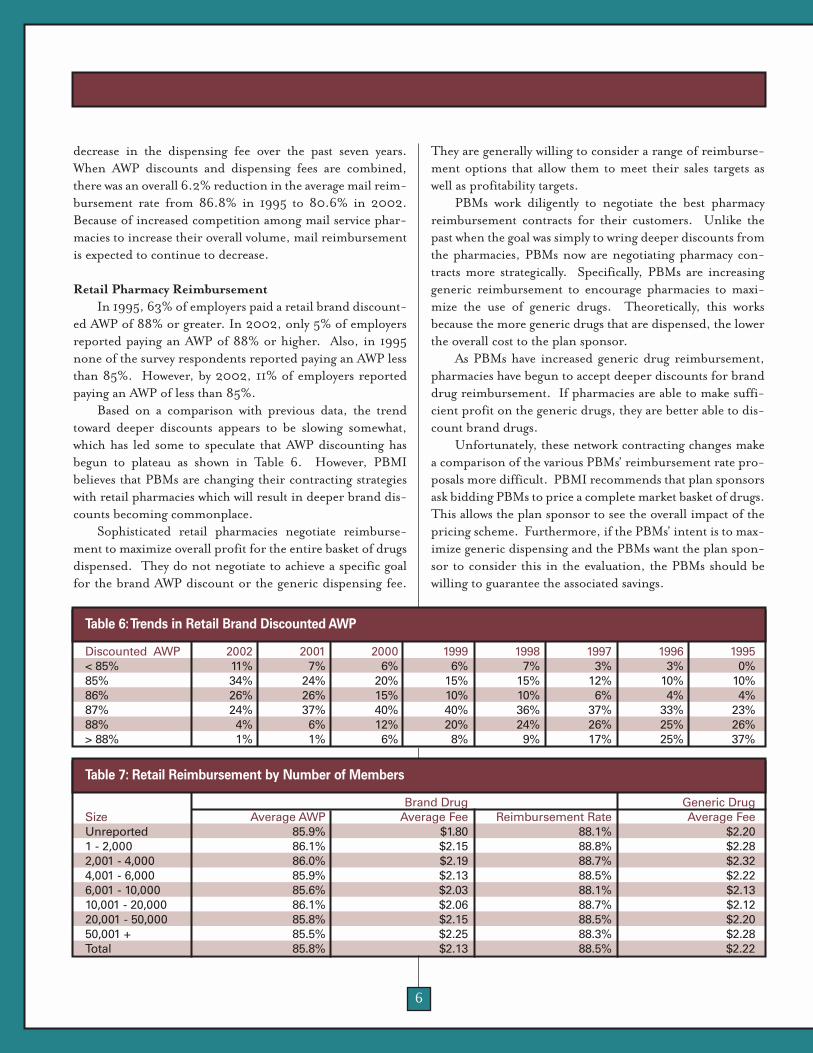
Retail Pharmacy ReimbursementIn 1995, 63% of employers paid a retail brand discount-
ed AWP of 88% or greater. In 2002, only 5% of employersreported paying an AWP of 88% or higher. Also, in 1995none of the survey respondents reported paying an AWP lessthan 85%. However, by 2002, 11% of employers reportedpaying an AWP of less than 85%.
Based on a comparison with previous data, the trendtoward deeper discounts appears to be slowing somewhat,which has led some to speculate that AWP discounting hasbegun to plateau as shown in Table 6. However, PBMIbelieves that PBMs are changing their contracting strategieswith retail pharmacies which will result in deeper brand dis-counts becoming commonplace.
Sophisticated retail pharmacies negotiate reimburse-ment to maximize overall profit for the entire basket of drugsdispensed. They do not negotiate to achieve a specific goalfor the brand AWP discount or the generic dispensing fee.
They are generally willing to consider a range of reimburse-ment options that allow them to meet their sales targets aswell as profitability targets.
PBMs work diligently to negotiate the best pharmacyreimbursement contracts for their customers. Unlike thepast when the goal was simply to wring deeper discounts fromthe pharmacies, PBMs now are negotiating pharmacy con-tracts more strategically. Specifically, PBMs are increasinggeneric reimbursement to encourage pharmacies to maxi-mize the use of generic drugs. Theoretically, this worksbecause the more generic drugs that are dispensed, the lowerthe overall cost to the plan sponsor.
As PBMs have increased generic drug reimbursement,pharmacies have begun to accept deeper discounts for branddrug reimbursement. If pharmacies are able to make suffi-cient profit on the generic drugs, they are better able to dis-count brand drugs.
Unfortunately, these network contracting changes makea comparison of the various PBMs’ reimbursement rate pro-posals more difficult. PBMI recommends that plan sponsorsask bidding PBMs to price a complete market basket of drugs.This allows the plan sponsor to see the overall impact of thepricing scheme. Furthermore, if the PBMs’ intent is to max-imize generic dispensing and the PBMs want the plan spon-sor to consider this in the evaluation, the PBMs should bewilling to guarantee the associated savings.
Brand Drug Generic DrugSize Average AWP Average Fee Reimbursement Rate Average FeeUnreported 85.9% $1.80 88.1% $2.201 - 2,000 86.1% $2.15 88.8% $2.282,001 - 4,000 86.0% $2.19 88.7% $2.324,001 - 6,000 85.9% $2.13 88.5% $2.226,001 - 10,000 85.6% $2.03 88.1% $2.1310,001 - 20,000 86.1% $2.06 88.7% $2.1220,001 - 50,000 85.8% $2.15 88.5% $2.2050,001 + 85.5% $2.25 88.3% $2.28Total 85.8% $2.13 88.5% $2.22
Table 7: Retail Reimbursement by Number of Members
Discounted AWP 2002 2001 2000 1999 1998 1997 1996 1995< 85% 11% 7% 6% 6% 7% 3% 3% 0%85% 34% 24% 20% 15% 15% 12% 10% 10%86% 26% 26% 15% 10% 10% 6% 4% 4%87% 24% 37% 40% 40% 36% 37% 33% 23%88% 4% 6% 12% 20% 24% 26% 25% 26%> 88% 1% 1% 6% 8% 9% 17% 25% 37%
Table 6:Trends in Retail Brand Discounted AWP
7
When considering survey results based upon the variousdemographic options available, it appears that employers inthe Northeastern region are negotiating better retail brandreimbursement rates than employers in the Western region.Northeastern region employers achieve a 88.3%-reimburse-ment rate, whereas Western region employers achieve a88.9%-reimbursement rate as shown in Table 42 in theappendix.
Similarly, employers participating in coalitions achieveda 87.9% retail reimbursement rate while employers not par-ticipating in coalitions achieved a 88.7% reimbursementrate. There is less variation by employer size. Although itappears the largest employers receive the deepest AWP dis-counts, they also pay the greatest dispensing fees. See Table 7.
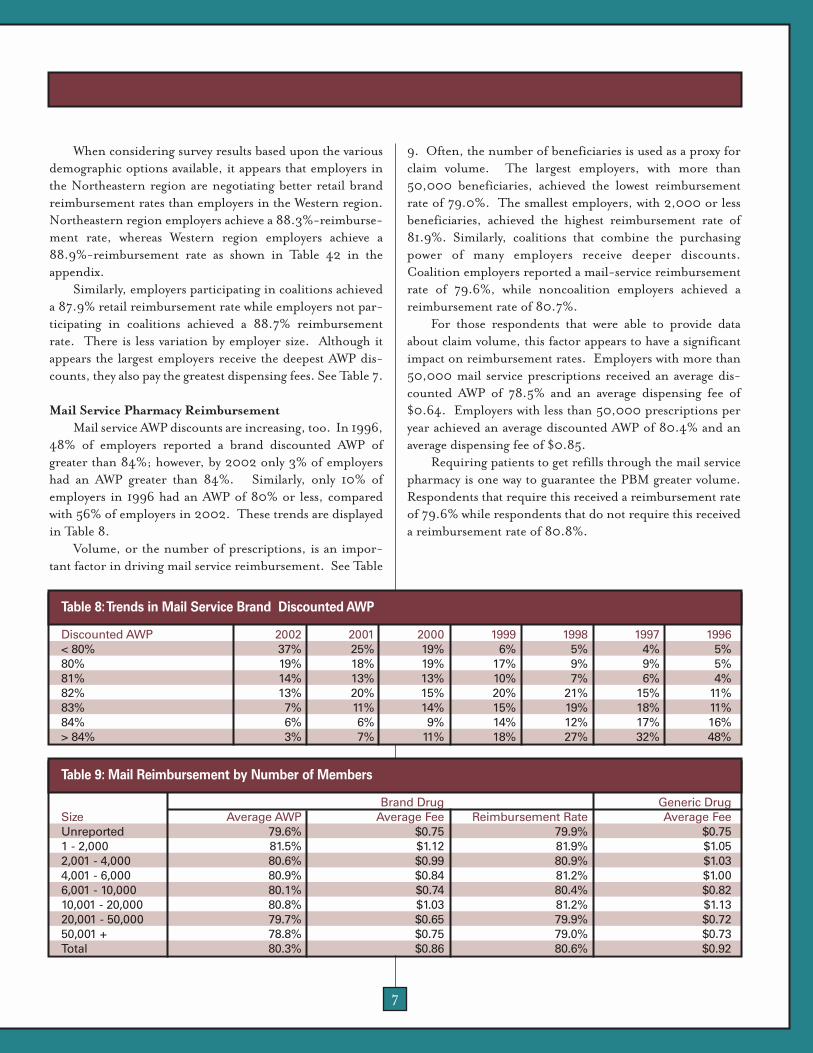
Mail Service Pharmacy ReimbursementMail service AWP discounts are increasing, too. In 1996,
48% of employers reported a brand discounted AWP ofgreater than 84%; however, by 2002 only 3% of employershad an AWP greater than 84%. Similarly, only 10% ofemployers in 1996 had an AWP of 80% or less, comparedwith 56% of employers in 2002. These trends are displayedin Table 8.
Volume, or the number of prescriptions, is an impor-tant factor in driving mail service reimbursement. See Table
9. Often, the number of beneficiaries is used as a proxy forclaim volume. The largest employers, with more than50,000 beneficiaries, achieved the lowest reimbursementrate of 79.0%. The smallest employers, with 2,000 or lessbeneficiaries, achieved the highest reimbursement rate of81.9%. Similarly, coalitions that combine the purchasingpower of many employers receive deeper discounts.Coalition employers reported a mail-service reimbursementrate of 79.6%, while noncoalition employers achieved areimbursement rate of 80.7%.
For those respondents that were able to provide dataabout claim volume, this factor appears to have a significantimpact on reimbursement rates. Employers with more than50,000 mail service prescriptions received an average dis-counted AWP of 78.5% and an average dispensing fee of$0.64. Employers with less than 50,000 prescriptions peryear achieved an average discounted AWP of 80.4% and anaverage dispensing fee of $0.85.
Requiring patients to get refills through the mail servicepharmacy is one way to guarantee the PBM greater volume.Respondents that require this received a reimbursement rateof 79.6% while respondents that do not require this receiveda reimbursement rate of 80.8%.
Discounted AWP 2002 2001 2000 1999 1998 1997 1996< 80% 37% 25% 19% 6% 5% 4% 5%80% 19% 18% 19% 17% 9% 9% 5%81% 14% 13% 13% 10% 7% 6% 4%82% 13% 20% 15% 20% 21% 15% 11%83% 7% 11% 14% 15% 19% 18% 11%84% 6% 6% 9% 14% 12% 17% 16%> 84% 3% 7% 11% 18% 27% 32% 48%
Table 8:Trends in Mail Service Brand Discounted AWP
Brand Drug Generic DrugSize Average AWP Average Fee Reimbursement Rate Average FeeUnreported 79.6% $0.75 79.9% $0.751 - 2,000 81.5% $1.12 81.9% $1.052,001 - 4,000 80.6% $0.99 80.9% $1.034,001 - 6,000 80.9% $0.84 81.2% $1.006,001 - 10,000 80.1% $0.74 80.4% $0.8210,001 - 20,000 80.8% $1.03 81.2% $1.1320,001 - 50,000 79.7% $0.65 79.9% $0.7250,001 + 78.8% $0.75 79.0% $0.73Total 80.3% $0.86 80.6% $0.92
Table 9: Mail Reimbursement by Number of Members

8
ADMINISTRATIVE FEESPBM administrative fees are commonly paid on a per-
claim basis. In 2001, the average administrative fee paid foreach retail prescription was $0.38. As shown in Table 10, in2002, the average administrative fee paid for each retail pre-scription decreased to $0.28. The average administrative feepaid per mail service pharmacy claim in 2002 was $0.16,reflecting a $0.07 decrease from 2001
As administrative fees have become less importantsources of revenue for PBMs , these fees have decreased dra-matically. As the industry evolves, it will be interesting to seewhat role these fees play in the future.
Western employers reported paying the highest mailservice administrative fee of $0.28, whereas Midwesternemployers paid the lowest fee of $0.14 as demonstrated inTable 12. In retail, large employers (50,001+) paid the low-est fees while smaller employers paid the highest fees ($0.42versus $0.21) in retail. The administrative fees tend to followthe same rules as mail service AWP discounts, with employerswith the greatest number of beneficiaries paying lower fees asshown in Table 11.
Coalition members pay lower administrative fees forretail and mail claims than non-coalition members as shownin Table 13.
FORMULARIES AND REBATESFormulary
The use of formularies continues to increase over time.In 1995, only 54% of respondents reported using a formu-
lary; however, that percentage increased to 89% in 2002.See Table 14.
For analysis purposes, formularies are grouped intothree categories: closed, open, and incented formularies.The use of closed formularies has become nearly extinctwithin the employer-managed arena. In 2002, 2% of therespondents reported using a closed formulary as shown inFigure 4. A closed formulary excludes selected drugs withina category of otherwise covered drugs. This forces patients touse the preferred drugs within the category or incur theentire cost of the prescription.
The creation of the incented (or multi-tier formulary)provides plan members with a financial incentive to use thepreferred drugs while preserving access to the nonpreferreddrugs. Although, the patients may not be required to pay theentire cost of a non-preferred drug, they are usually requiredto pay a higher copayment for non-preferred products.
One of the interesting aspects of 2002 survey results isthe continued decline in the percentage of employers whoreport the use of an open formulary. This percentage has
Year Retail Mail2002 $0.28 $0.162001 0.38 0.23
Table 10: Average Administrative Fees Paid per Prescription
Size of Employer Retail MailUnreported $0.06 $0.051 - 2,000 $0.42 $0.192,001 - 4,000 $0.31 $0.304,001 - 6,000 $0.31 $0.176,001 - 10,000 $0.24 $0.1210,001 - 20,000 $0.28 $0.1620,001 - 50,000 $0.27 $0.1450,001 + $0.21 $0.10Total $0.28 $0.16
Table 11: Average Administrative Fees by Number of Members
Region Retail MailUnknown $0.20 $0.00Northeast $0.32 $0.16South $0.29 $0.17Midwest $0.25 $0.14West $0.32 $0.28Total $0.28 $0.16
Table 12: Average Administrative Fees by Geographic Region
Coalition Status Retail MailNon-Coalition Member $0.32 $0.20Coalition Member $0.23 $0.14
Table 13: Average Administrative Fees by Coalition Member Status
Year Percentage of Employers Using Any Type of Formulary
2002 89%2001 83%2000 85%1999 74%1998 74%1997 76%1996 58%1995 54%
Table 14: Percentage of Employers Using a Formulary

9
decreased from 67% of employers in 1999 to 35% of employ-ers today.
The traditional open formulary is being replaced by theincented formulary concept, which has grown from just 25%of employers in 1999 to almost two-thirds (63%) of employ-ers in 2002. During this time, the percentage of employerswho offered closed formularies decreased from 8% in 1999to 2% in 2002.
The migration from open to incented formularies is theculmination of several factors. As the costs of prescriptiondrugs continue to increase, employers are looking for cre-ative ways to increase patient cost sharing. An effective strat-egy is the introduction of an incented formulary in which alist of nonpreferred drugs (e.g., high-cost, brand-nameproducts, lifestyle drugs, "me-too" drugs) is created. Byinstituting higher copayments for these nonpreferred drugs,employers collect a greater share of the drug cost from itsbeneficiaries.
Additionally, the use of an incented for-mulary has been shown to increase the marketshare of preferred drug products. As such, ifthe formulary is designed properly, theemployers can achieve lower costs through theincreased use of lower cost drug products and,in some cases, higher rebate collections.
Employer Initiated Formulary ChangesPBMI added a survey question this year
asking the respondents to indicate whetherthey had requested their PBM change the formulary status ofa drug (e.g., from a preferred status to nonpreferred status).Surprisingly, 19% of the respondents indicated they hadrequested a change.
PBMI called some of these respondents to gather moreinformation about the changes requested. PBMI learnedthat some of the requested changes were for simple issuessuch as making sure that the brand version of drugs that hadbecome available generically was moved to nonpreferred sta-tus. Other changes were related to employer requests toinclude a step-therapy edit or a prior-authorization require-ment on a preferred product. Finally, some employers askedtheir PBMs to change the drugs included on the preferredproduct list.
In the case of brand drugs becoming available generical-ly, the motivation was primarily related to performing duediligence and monitoring PBM activities. Moving brandname versions of drugs available generically to the third-tiershould result in increased generic drug use. In the case ofaccess limitation, the employer simply was trying to limitaccess or to encourage generic drug use. In the case of pre-
ferred product selection, two distinct motiva-tions were apparent. The first being to miti-gate the impact of a PBM’s frequent formula-ry changes on the beneficiaries. Each time thepreferred product changes patients must visittheir prescribers to get new prescriptions.Secondly, much less frequently, the employeris disagreeing with the PBM’s preferred prod-uct selection.
The circumstances in which employers getinvolved in preferred product selection arefairly limited. These employers believe a
review of the medical literature for certain drugs does notjustify the PBMs’ preferred placement. The drugs mostcommonly mentioned are drugs (e.g., Clarinex® orNexium®) with perceived limited improvement over the pre-vious generation drugs they are replacing (e.g., Claritin® orPrilosec®).
Most employers believe it is the responsibility of thePBM to manage the formulary. The employer pays the PBMto provide this service. Although a very small number ofemployers have contracted with or are evaluating third-partyorganizations for formulary management, the vast majorityof employers seem content to let their PBMs handle formu-lary decisions. One employer who had been very active inthis process recently decided to end this activity after reach-ing the conclusion that the expense and time involved out-weighed any savings achieved.
Incented
Open
Closed
63%
35%
2%
Figure 4:Type of Formulary Design Used by Employers
Most employersbelieve it is the
responsibility ofthe PBM to manage
the formulary.
10
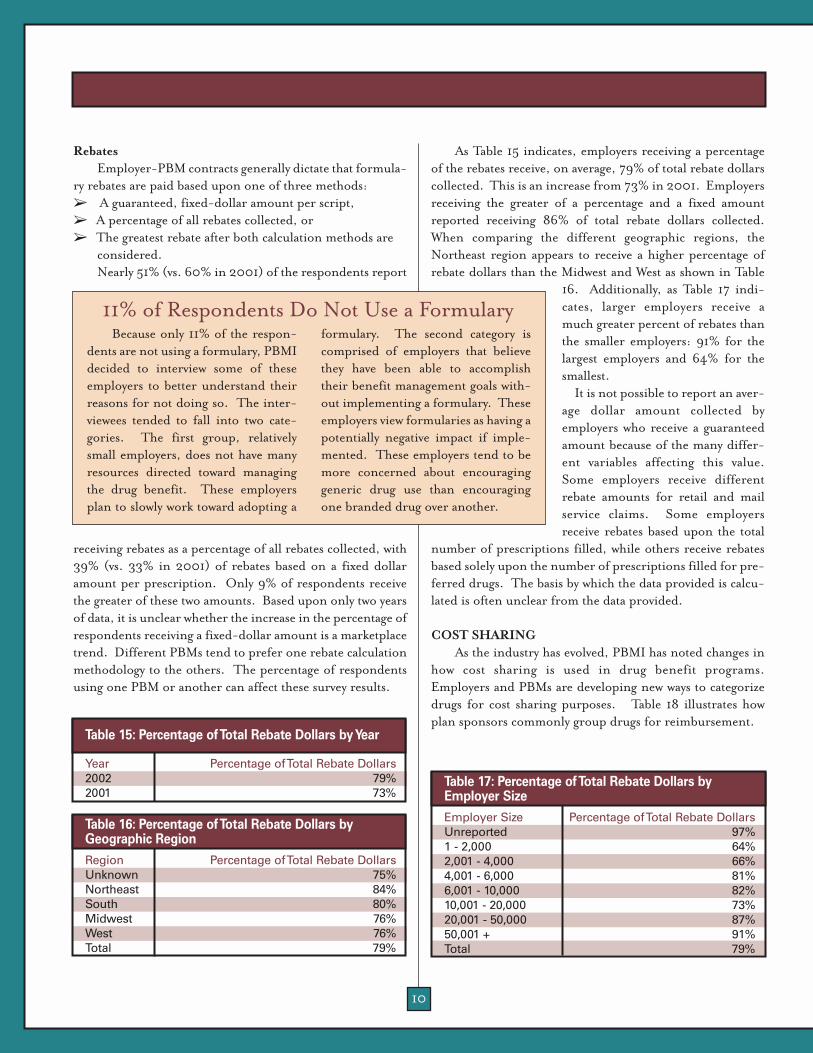
RebatesEmployer-PBM contracts generally dictate that formula-
ry rebates are paid based upon one of three methods:➢ A guaranteed, fixed-dollar amount per script, ➢ A percentage of all rebates collected, or ➢ The greatest rebate after both calculation methods are
considered. Nearly 51% (vs. 60% in 2001) of the respondents report
receiving rebates as a percentage of all rebates collected, with39% (vs. 33% in 2001) of rebates based on a fixed dollaramount per prescription. Only 9% of respondents receivethe greater of these two amounts. Based upon only two yearsof data, it is unclear whether the increase in the percentage ofrespondents receiving a fixed-dollar amount is a marketplacetrend. Different PBMs tend to prefer one rebate calculationmethodology to the others. The percentage of respondentsusing one PBM or another can affect these survey results.
As Table 15 indicates, employers receiving a percentageof the rebates receive, on average, 79% of total rebate dollarscollected. This is an increase from 73% in 2001. Employersreceiving the greater of a percentage and a fixed amountreported receiving 86% of total rebate dollars collected.When comparing the different geographic regions, theNortheast region appears to receive a higher percentage ofrebate dollars than the Midwest and West as shown in Table
16. Additionally, as Table 17 indi-cates, larger employers receive amuch greater percent of rebates thanthe smaller employers: 91% for thelargest employers and 64% for thesmallest.
It is not possible to report an aver-age dollar amount collected byemployers who receive a guaranteedamount because of the many differ-ent variables affecting this value.Some employers receive differentrebate amounts for retail and mailservice claims. Some employersreceive rebates based upon the total
number of prescriptions filled, while others receive rebatesbased solely upon the number of prescriptions filled for pre-ferred drugs. The basis by which the data provided is calcu-lated is often unclear from the data provided.
COST SHARINGAs the industry has evolved, PBMI has noted changes in
how cost sharing is used in drug benefit programs.Employers and PBMs are developing new ways to categorizedrugs for cost sharing purposes. Table 18 illustrates howplan sponsors commonly group drugs for reimbursement.
Because only 11% of the respon-dents are not using a formulary, PBMIdecided to interview some of theseemployers to better understand theirreasons for not doing so. The inter-viewees tended to fall into two cate-gories. The first group, relativelysmall employers, does not have manyresources directed toward managingthe drug benefit. These employersplan to slowly work toward adopting a
formulary. The second category iscomprised of employers that believethey have been able to accomplishtheir benefit management goals with-out implementing a formulary. Theseemployers view formularies as having apotentially negative impact if imple-mented. These employers tend to bemore concerned about encouraginggeneric drug use than encouragingone branded drug over another.
Region Percentage of Total Rebate DollarsUnknown 75%Northeast 84%South 80%Midwest 76%West 76%Total 79%
Table 16: Percentage of Total Rebate Dollars by Geographic Region
Employer Size Percentage of Total Rebate DollarsUnreported 97%1 - 2,000 64%2,001 - 4,000 66%4,001 - 6,000 81%6,001 - 10,000 82%10,001 - 20,000 73%20,001 - 50,000 87%50,001 + 91%Total 79%
Table 17: Percentage of Total Rebate Dollars by Employer Size
11% of Respondents Do Not Use a Formulary
Year Percentage of Total Rebate Dollars2002 79%2001 73%
Table 15: Percentage of Total Rebate Dollars by Year

11
Retail copayments increased by approximately 10% forall tiers from 2001 to 2002. Average retail copayments aredisplayed in Table 19. These increases are more pronouncedin mail as shown in Table 20. From 2001 to 2002, averagefirst-tier mail service copayments increased by 16%, second-tier increased by 20%, and third-tier by 10% as shown inTable 20.
To provide the reader with some perspective about thescope of change over the past four years, PBMI has providedthe distribution of second-tier copayments for both retail(Table 21) and mail (Table 22). The use of retail second-tiercopayments of more than $20 is now 17%. For mail service,the percentage of copayments $40 or more is 39%.
Employers understand that cost sharing is a valuable toolto encourage patients to behave in certain ways. For example,one of the purposes of having multiple copayment tiers is toencourage generic drug use. Today, the retail third-tiercopayment (where most plans categorize multi-source branddrugs) is almost four times as high as the first-tier copay-
ment. This is compared to 1998 when the third-tier copay-ment was less than three times the first-tier copayment.
In the past, mail service copayments were kept low rela-tive to retail copayments to encourage mail service use. Thebelief was that mail service was a lower cost distribution pointfor prescriptions. However, employers have learned thatmail service will not produce savings unless copayments arestructured appropriately. Many employers discovered thatsetting mail copayments too low compared to retail copay-ments may result in mail service prescriptions costing moreto the employers after the cost-sharing amount is collectedthan retail prescriptions.
Because mail service copayments have increased morequickly than retail copayments for the last few years, this isnot as much an issue as in the past. The mail service second-tier copayment is now 1.8 times the retail second-tier copay-ment. This is as compared to 1.6 times in 2001.
Many experts believe, as a rule of thumb, mail servicecopayments should be at least twice the retail copayment.
Survey Average Copayment AmountsYear 1st Tier 2nd Tier 3rd Tier2002 $8.33 $17.57 $33.232001 $7.68 $16.06 $30.512000 $7.17 $14.14 $27.351999 $7.05 $12.82 $23.40
Table 19: Average Retail Copayment Amounts for All Respondents
Survey Average Copayment AmountsYear 1st Tier 2nd Tier 3rd Tier2002 $14.58 $31.18 $60.682001 $12.60 $26.01 $55.232000 $10.78 $21.29 $45.731999 $9.74 $17.96 $37.67
Table 20: Average Mail Service Copayment Amounts for All Respondents
Copayment by Dollar Amount 2002 2001 2000 1999 1998 1997< $10 7% 10% 13% 19% 26% 30%$10-$11 11% 12% 22% 30% 36% 37%$12-$13 4% 8% 8% 8% 8% 13%$14-$15 24% 27% 28% 26% 20% 18%$16-$20 38% 34% 25% 16% 10% 4%> $20 17% 10% 4% NC NC NCNC: Not Calculated indicates that value is previously included in other categories.
Table 21: Distribution of Employer Retail Second-Tier Copayments by Dollar Amount
Tier Two-Tier Design Three-Tier Design Three-Tier Design Four-Tier DesignFirst Tier Generic Generic Generic GenericSecond Tier Brand Single Source Brand Preferred Brand Preferred BrandThird Tier NA Multiple Source Brand Non-Preferred Brand Non-Preferred BrandFourth Tier NA NA NA Biotech drugs, lifestyle,
nonformulary, or other high cost drugs
NA=Not Applicable
Table 18: Common Plan Designs for Multi-Tier Copayments

12
However, PBMI believes this will change. PBMI noted manycopayments are now more than $25. If the 90-day mail serv-ice copayment is set as the equivalent of two 30-day retailcopayments, then the average mail service claim must savemore than $25 before the plan sponsor receives any savings.
Three-Tier CopaymentsThe use of a three-tier plan design, in which the tiers are
based on formulary status, continues to gain favor amongemployers. In 1998, only 6% of employers reported the useof this three-tier plan design. This number has increasedfrom 46% in 2001 to 63% in 2002. Likewise, the percent-age of employers who offer two-tier cost sharing schemesdeclined from 47% in 2001 to 30% in 2002. It is expectedthat the industry will continue to see growth in the percent-age of employers offering three-tier plan designs.Interestingly, the use of a three-tier plan based on the type ofdrug (e.g., generic, single-source brands, and multi-sourcebrands) has remained constant at 7% for the third year in arow. These percentages are based upon respondents who usecopayments rather than coinsurance percentages.
Four-Tier CopaymentsThis year, 19 respondents reported a fourth tier for cost
sharing. This copayment amount is in many instances equalto the entire cost of the drug. In some cases, this category isused for lifestyle drugs; in other cases the category representsnonformulary drugs. New this year, three respondents iden-tified biotech drugs as a specific copayment category.
CoinsuranceThe percentage of employers using coinsurance for sec-
ond-tier, retail cost sharing increased from 22% in 2001 to26% in 2002. Although most employers who use coinsur-ance generally use coinsurance for all drug categories, someemployers use coinsurance only for second- or third-tierdrug prescriptions, but not for first-tier drug prescriptions.This approach for the second- and third-tiers allows plansmore flexibility ensuring patients pay a consistent portion ofthe benefit cost, while providing an additional incentive touse generic drugs.
Coinsurance often is used in combination with a mini-mum and/or maximum copayment amount. Some respon-
0%10%20%30%40%50%60%70%80%90%
100%
Third Tier
Second Tier
First Tier
MinimumAverageMaximum
50% 50%
100%
18%23%
41%
0% 0%
15%
Figure 6: Range of Mail Service Coinsurance Percentages for Each Tier
Copayment by Dollar Amount 2002 2001 2000 1999 1998<$15 11% 18% 28% 34% 47%$15-$19 7% 10% 15% 21% 18%$20-$24 15% 18% 21% 21% 19%$25-$29 7% 9% 7% 6% 16%$30-$34 18% 19% 16% 13% NC$35-$39 3% 27% 14% 5% NC$40-$44 24% NC NC NC NC> $44 15% NC NC NC NCNC: Not Calculated indicates that value is previously included in other categories.
Table 22: Distribution of Mail Service Second-Tier Copayments by Dollar Amount
0%10%20%30%40%50%60%70%80%90%
100%
Third Tier
Second Tier
First Tier
MinimumAverageMaximum
50% 50%
100%
19%23%
37%
0%10%
15%
Figure 5: Range of Retail Coinsurance Percentagesfor Each Tier
13
dents use one or the other and some use both. The averageminimum copayment is slightly less than the overall averagefor all respondents ($16.43 vs. $17.57). Although used lessfrequently, the average maximum copayment ($41.91) isalmost three times the average minimum copayment.
On average, beneficiaries pay about 19% of the cost oftheir retail prescription for drugs in the first tier, 23% fordrugs in the second tier, and 37% for drugs in the third tieras shown in Figure 5. The use of the three-tier copaymentstructure has encouraged employers to differentiate the coin-surance percentage among the three categories. Using ahigher percentage coinsurance for the third tier increases theincentive to use lower cost drugs in the first tier.
Coinsurance is used much less frequently for mail serv-ice. Only 12% of the respondents have a coinsurance com-ponent for second-tier mail service prescriptions. Althoughthe barriers related to using coinsurance in mail service havebeen eliminated at most mail service pharmacies, manyemployers are reluctant to require their patients to pay acopayment that may vary by prescription and over time. SeeFigure 6 for more information about the coinsurance per-centages reported.
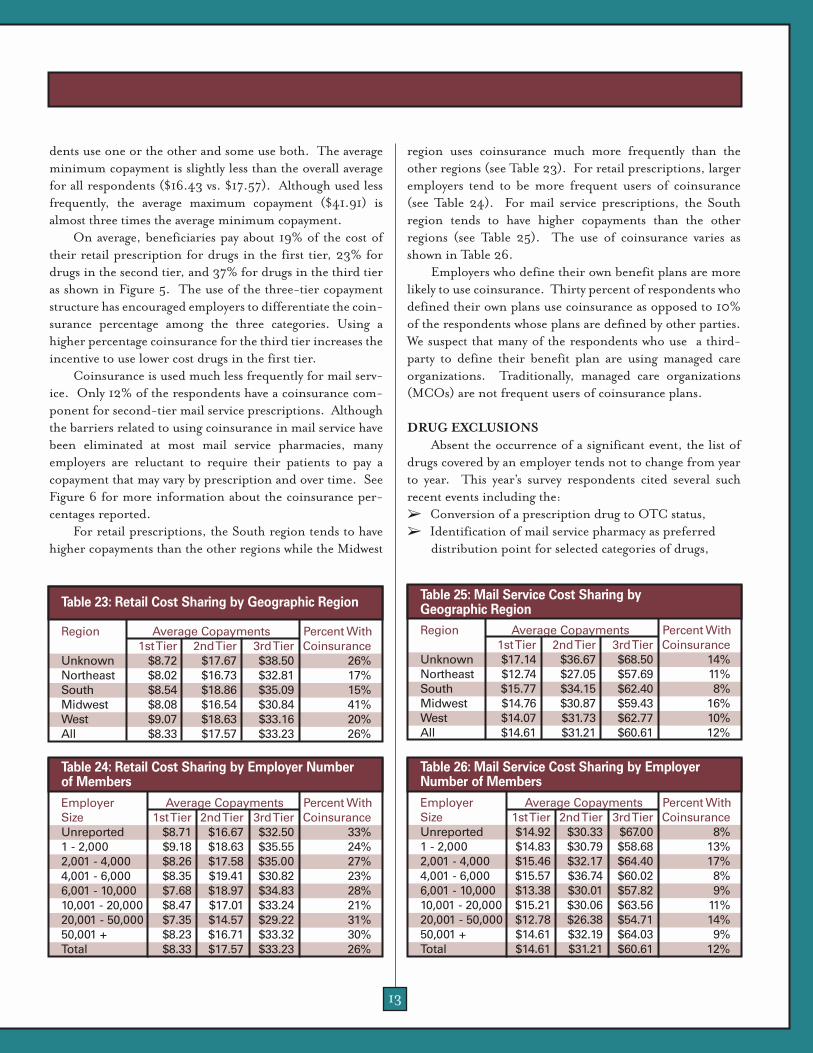
For retail prescriptions, the South region tends to havehigher copayments than the other regions while the Midwest
region uses coinsurance much more frequently than theother regions (see Table 23). For retail prescriptions, largeremployers tend to be more frequent users of coinsurance(see Table 24). For mail service prescriptions, the Southregion tends to have higher copayments than the otherregions (see Table 25). The use of coinsurance varies asshown in Table 26.
Employers who define their own benefit plans are morelikely to use coinsurance. Thirty percent of respondents whodefined their own plans use coinsurance as opposed to 10%of the respondents whose plans are defined by other parties.We suspect that many of the respondents who use a third-party to define their benefit plan are using managed careorganizations. Traditionally, managed care organizations(MCOs) are not frequent users of coinsurance plans.
DRUG EXCLUSIONSAbsent the occurrence of a significant event, the list of
drugs covered by an employer tends not to change from yearto year. This year’s survey respondents cited several suchrecent events including the: ➢ Conversion of a prescription drug to OTC status, ➢ Identification of mail service pharmacy as preferred
distribution point for selected categories of drugs,
Employer Average Copayments Percent WithSize 1st Tier 2nd Tier 3rd Tier CoinsuranceUnreported $8.71 $16.67 $32.50 33%1 - 2,000 $9.18 $18.63 $35.55 24%2,001 - 4,000 $8.26 $17.58 $35.00 27%4,001 - 6,000 $8.35 $19.41 $30.82 23%6,001 - 10,000 $7.68 $18.97 $34.83 28%10,001 - 20,000 $8.47 $17.01 $33.24 21%20,001 - 50,000 $7.35 $14.57 $29.22 31%50,001 + $8.23 $16.71 $33.32 30%Total $8.33 $17.57 $33.23 26%
Table 24: Retail Cost Sharing by Employer Number of Members
Employer Average Copayments Percent WithSize 1st Tier 2nd Tier 3rd Tier CoinsuranceUnreported $14.92 $30.33 $67.00 8%1 - 2,000 $14.83 $30.79 $58.68 13%2,001 - 4,000 $15.46 $32.17 $64.40 17%4,001 - 6,000 $15.57 $36.74 $60.02 8%6,001 - 10,000 $13.38 $30.01 $57.82 9%10,001 - 20,000 $15.21 $30.06 $63.56 11%20,001 - 50,000 $12.78 $26.38 $54.71 14%50,001 + $14.61 $32.19 $64.03 9%Total $14.61 $31.21 $60.61 12%
Table 26: Mail Service Cost Sharing by Employer Number of Members
Region Average Copayments Percent With1st Tier 2nd Tier 3rd Tier Coinsurance
Unknown $8.72 $17.67 $38.50 26%Northeast $8.02 $16.73 $32.81 17%South $8.54 $18.86 $35.09 15%Midwest $8.08 $16.54 $30.84 41%West $9.07 $18.63 $33.16 20%All $8.33 $17.57 $33.23 26%
Table 23: Retail Cost Sharing by Geographic Region
Region Average Copayments Percent With1st Tier 2nd Tier 3rd Tier Coinsurance
Unknown $17.14 $36.67 $68.50 14%Northeast $12.74 $27.05 $57.69 11%South $15.77 $34.15 $62.40 8%Midwest $14.76 $30.87 $59.43 16%West $14.07 $31.73 $62.77 10%All $14.61 $31.21 $60.61 12%
Table 25: Mail Service Cost Sharing by Geographic Region
14
➢ Mandated coverage of selected drugs, and ➢ Ongoing attempts to manage benefit costs.
OTC Conversions Most employers automatically exclude all OTC drugs
from coverage. The exception being the overwhelmingmajority of employers cover diabetic supplies and insulinneedles and syringes. The OTC category is excluded formany reasons including issues related to old methods ofclaim processing, benefit design consistency, benefit eligibil-ity, and cost, among others. Historically, although it doesnot happen often, if a drug becomes available OTC, the pre-scription counterpart, if one still exists, is excluded alongwith the OTC product.
Before the advent of online claim processing, there wereoperational and administrative issues that made it difficult tocover OTC drugs. With the controls available throughonline claim processing, some plan sponsorsare beginning to cover selected OTC prod-ucts. For example, one employer made thedecision that it was better financially to coverOTC smoking cessation products withoutlimitation to encourage employees to stopsmoking. With certain high-cost, high-usedrugs now available as OTC (e.g., Claritin®and Prilosec®), PBMI anticipates that moreemployers will begin covering these drugs.
OTC coverage is definitely the exceptionto the rule, because only 5% of the respon-dents provide coverage for OTC products. As stated above,the number of employers covering OTC products is expect-ed to increase since the cost of some OTC products is lessthan that of their prescription counterparts. There also is asignificant financial incentive for patients to use these OTCdrugs. Given the high copayment amounts for brand-nameproducts adopted by some employers, the patient may savemoney by using the OTC product even if required to pay theentire cost of the drug.
Mandatory Mail Service The mandated use of mail service pharmacy for the refill
of all or selected maintenance drugs continues to be a viablealternative. Mail service pharmacies are able to providedeeper discounts than retail pharmacy and can reduce theemployer’s costs if the patient cost sharing component isproperly designed.
Although PBMI is not seeing increases in the mandato-
ry use of mail service pharmacy (only 12% of the respondentsin 2002), it is seeing more use of mail service for specificdrugs (e.g., oral contraceptives).
Governmental Requirements On occasion, governmental organizations may require
coverage of specific drugs, such as oral contraceptives.Coverage of oral contraceptives has increased every year andhas reached 89% among survey respondents.
PBMI interviewed several respondents to determinewhether there were any common themes related to the exclu-sion of oral contraceptives. At one time, some employersexcluded oral contraceptives because they were not consid-ered a medical necessity under the guidelines for their healthcare packages. Additionally, depending upon the employer’sdemographics, they could potentially add a significant cost tothe drug budget. As pressure to cover these drugs increases,
some employers (where coverage of oral con-traceptives is not required by rule or law)believe that excluding oral contraceptives issimply a stopgap measure to temporarily avoidincreased drug benefit costs. In many of thesecases, employers plan to continue excludingoral contraceptives until other employers intheir area begin to cover these drugs, andemployees demand coverage or competitionamong employers for employees makes this anecessary concession.
Drug Access Controls Employers are using a variety of techniques to manage
benefit costs including drug-specific quantity limitations,prior authorization, and step therapy.
Survey respondents expressed several motivations forlimiting the quantity that can be dispensed for certain drugs.In the case of limiting OxyContin® quantities, one motiva-tion is to reduce the potential for the abuse of this narcoticanalgesic. In the case of limiting nonsedating antihistaminequantities, one motivation is to encourage the use of lessexpensive, OTC products when the sedative qualities are nota concern (e.g., at bedtime). In the case of infertility druglimitations, one motivation is to limit the potentially highcosts of multiple courses of infertility treatments.
In the year 2002, respondents reported slight increasesin the use of prior authorization and step therapy programsfor selected categories of high-cost drugs. These programsare directed at drugs such as growth hormones, antifungals,
Coverage of oralcontraceptives by respondents has increased, reaching 89%.
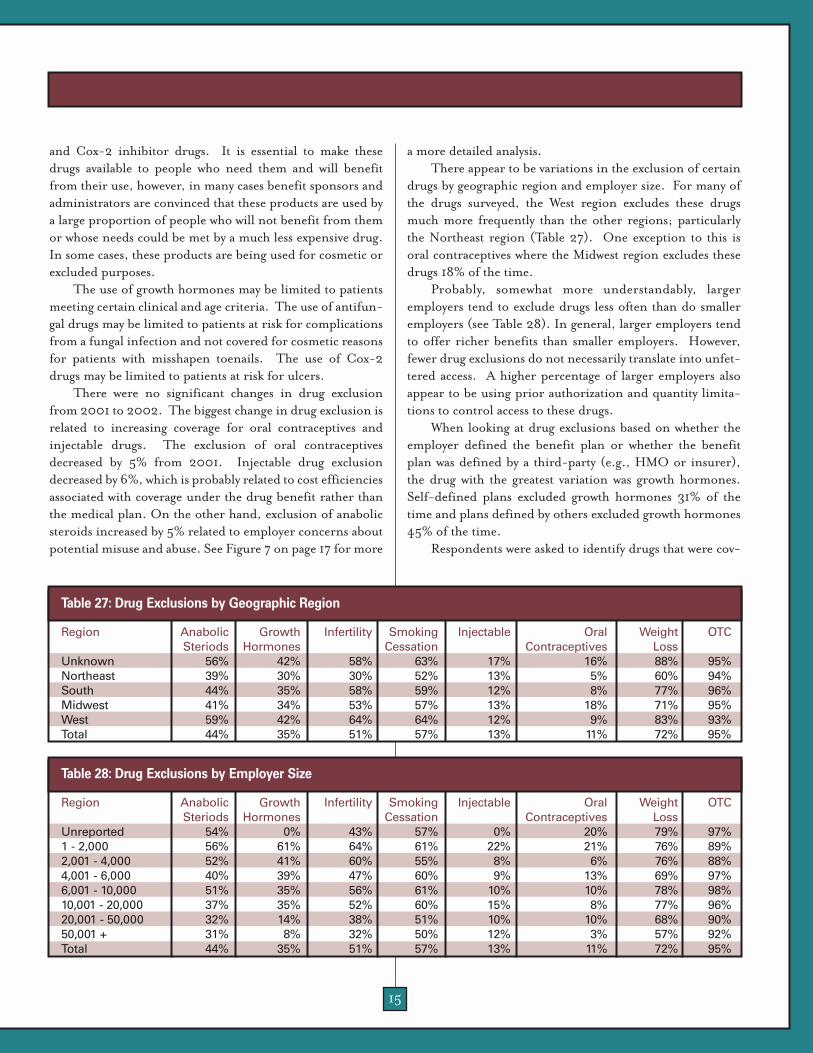
15
and Cox-2 inhibitor drugs. It is essential to make thesedrugs available to people who need them and will benefitfrom their use, however, in many cases benefit sponsors andadministrators are convinced that these products are used bya large proportion of people who will not benefit from themor whose needs could be met by a much less expensive drug.In some cases, these products are being used for cosmetic orexcluded purposes.
The use of growth hormones may be limited to patientsmeeting certain clinical and age criteria. The use of antifun-gal drugs may be limited to patients at risk for complicationsfrom a fungal infection and not covered for cosmetic reasonsfor patients with misshapen toenails. The use of Cox-2drugs may be limited to patients at risk for ulcers.
There were no significant changes in drug exclusionfrom 2001 to 2002. The biggest change in drug exclusion isrelated to increasing coverage for oral contraceptives andinjectable drugs. The exclusion of oral contraceptivesdecreased by 5% from 2001. Injectable drug exclusiondecreased by 6%, which is probably related to cost efficienciesassociated with coverage under the drug benefit rather thanthe medical plan. On the other hand, exclusion of anabolicsteroids increased by 5% related to employer concerns aboutpotential misuse and abuse. See Figure 7 on page 17 for more
a more detailed analysis.There appear to be variations in the exclusion of certain
drugs by geographic region and employer size. For many ofthe drugs surveyed, the West region excludes these drugsmuch more frequently than the other regions; particularlythe Northeast region (Table 27). One exception to this isoral contraceptives where the Midwest region excludes thesedrugs 18% of the time.
Probably, somewhat more understandably, largeremployers tend to exclude drugs less often than do smalleremployers (see Table 28). In general, larger employers tendto offer richer benefits than smaller employers. However,fewer drug exclusions do not necessarily translate into unfet-tered access. A higher percentage of larger employers alsoappear to be using prior authorization and quantity limita-tions to control access to these drugs.
When looking at drug exclusions based on whether theemployer defined the benefit plan or whether the benefitplan was defined by a third-party (e.g., HMO or insurer),the drug with the greatest variation was growth hormones.Self-defined plans excluded growth hormones 31% of thetime and plans defined by others excluded growth hormones45% of the time.
Respondents were asked to identify drugs that were cov-
Region Anabolic Growth Infertility Smoking Injectable Oral Weight OTCSteriods Hormones Cessation Contraceptives Loss
Unknown 56% 42% 58% 63% 17% 16% 88% 95%Northeast 39% 30% 30% 52% 13% 5% 60% 94%South 44% 35% 58% 59% 12% 8% 77% 96%Midwest 41% 34% 53% 57% 13% 18% 71% 95%West 59% 42% 64% 64% 12% 9% 83% 93%Total 44% 35% 51% 57% 13% 11% 72% 95%
Table 27: Drug Exclusions by Geographic Region
Region Anabolic Growth Infertility Smoking Injectable Oral Weight OTCSteriods Hormones Cessation Contraceptives Loss
Unreported 54% 0% 43% 57% 0% 20% 79% 97%1 - 2,000 56% 61% 64% 61% 22% 21% 76% 89%2,001 - 4,000 52% 41% 60% 55% 8% 6% 76% 88%4,001 - 6,000 40% 39% 47% 60% 9% 13% 69% 97%6,001 - 10,000 51% 35% 56% 61% 10% 10% 78% 98%10,001 - 20,000 37% 35% 52% 60% 15% 8% 77% 96%20,001 - 50,000 32% 14% 38% 51% 10% 10% 68% 90%50,001 + 31% 8% 32% 50% 12% 3% 57% 92%Total 44% 35% 51% 57% 13% 11% 72% 95%
Table 28: Drug Exclusions by Employer Size
16
ered without limitations (other than standard quantity anddays’ supply limitations) or to note whether a particular drugwas covered with drug-specific quantity limitations or priorauthorization requirements, or simply excluded from cover-age. Figure 8 reveals how employers are approaching thisissue.
UTILIZATION MANAGEMENT TOOLSTo help manage the cost of their prescription drug ben-
efit plans, many employers rely on PBM utilization manage-ment tools. These tools have become increasingly sophisti-cated over time.
Employers were asked to identify the types of utilizationmanagement services used. While the terminology for manyof these programs is similar, the actual scope of these pro-grams varies significantly. As such, this report does not dis-cuss the scope of the programs, but rather identifies the per-centage of respondents using these programs. This sectionof the survey was modified from previous years. Rather than
ask employers to identify the programs used by generic pro-gram terms, the employers were asked to identify the types ofinterventions performed. For example, they were asked toidentify interventions such as drug-drug interactions ratherthan the more general term concurrent DUR. However, forpurposes of survey continuity, the responses for these ques-tions were linked to the categories they represented forreporting purposes.
Figure 9 identifies the percentage of respondents whoreport using various drug utilization programs from 2000through 2002. Overall, the use of drug utilization programshas increased slightly, with one exception: the patient profilecategory. For purposes of this year’s survey, this category wasbroken into two intervention types: patient profiles andphysician profiles. For the patient profile category, the 2000and 2001 data reported was previously reported under theheading of Retrospective DUR.
Although many of the SIC industry segment categoriesrepresent small numbers of respondents, the public admin-
Managing OxyContin® UseUnder the right circumstances,
any drug can be abused. Controlledsubstances are frequently abused.This abuse can be triggered byunnecessary use or an addiction ofthe patient, or it can be driven byprescriptions purchased for the pur-pose of illegally selling the drugs toothers.
OxyContin® is an expensive,powerful prescription narcotic that isused extensively and successfully inthe treatment of severe pain.However, it also is a drug that is verypopular on the black market. Whencrushed and inhaled, OxyContin®
pills generate a high more powerfulthan cocaine. Individual OxyContin®
tablets sell on the street for illegal usefor 10 to 12 times the average whole-sale price of the drug. Recognizingthe potential for OxyContin® misuse,one area which plan sponsors maylook for significant savings is by
reducing inappropriate OxyContin®
use.Conveniently, OxyContin® has
very clear clinical indications for use.Regardless of a patient’s diagnosis,the patient should not be filling pre-scriptions for more than two pills perday because OxyContin® should onlybe taken every 12 hours, regardless ofdosage strength prescribed, accord-ing to the manufacturer’s dosinginstructions on the package insert.
One East Coast based companywith approximately 2,000 benefici-aries experienced an unusual case offraud and abuse. As a result, it devel-oped a plan design that limitsOxyContin® prescriptions to nomore than 60 pills for the first pre-scription. This edit is designed toprevent patients from receiving inap-propriate dosages. Second and sub-sequent prescriptions are subject toprior authorization.
Prescribers are encouraged touse OxyContin® for oncologypatients, while selecting less addic-tive—and frequently less costly—painmedications for those with back andor other types of chronic pain. Thisapproach ensures oncology patientshave access to OxyContin® as needed,while managing access to a progres-sively addictive medication.
Although only .10% of thisemployer’s population had filledOxyContin® scripts in 2002, theexcessive utilization of OxyContin®
caused a 40% or $680,000 spike inthis employer’s annual drug budget.The quantity limit and prior author-ization intervention reducedOxyContin® scripts by 80%. Theemployer anticipates a 2003 drugexpenditure of about $1 million,down from last year’s total of $1.7million.
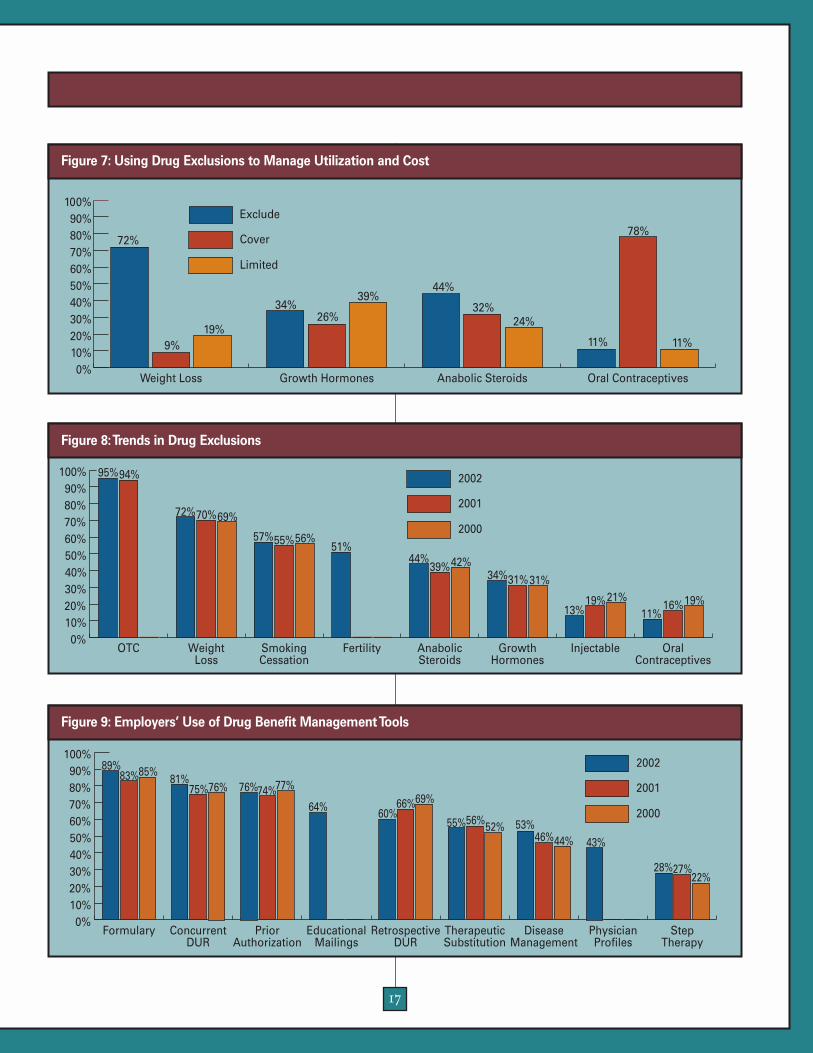
17
0%10%20%30%40%50%60%70%80%90%
100%
Limited
Cover
Exclude
Oral ContraceptivesAnabolic SteroidsGrowth HormonesWeight Loss
72%
9%19%
34%26%
39%44%
32%24%
11%
78%
11%
Figure 7: Using Drug Exclusions to Manage Utilization and Cost
0%10%20%30%40%50%60%70%80%90%
100%
2000
2001
2002
OralContraceptives
InjectableGrowthHormones
AnabolicSteroids
FertilitySmokingCessation
WeightLoss
OTC
57%55%56%
69%70%72%
51%44%
39%42%34%31%31%
13%19%21%
11%16%19%
95%94%
Figure 8:Trends in Drug Exclusions
0%10%20%30%40%50%60%70%80%90%
100%
2000
2001
2002
StepTherapy
PhysicianProfiles
DiseaseManagement
TherapeuticSubstitution
RetrospectiveDUR
EducationalMailings
PriorAuthorization
ConcurrentDUR
Formulary
76%74%77%76%75%81%
64% 60%66%69%
55%56%52% 53%46%44% 43%
28%27%22%
89%83%85%
Figure 9: Employers’ Use of Drug Benefit Management Tools
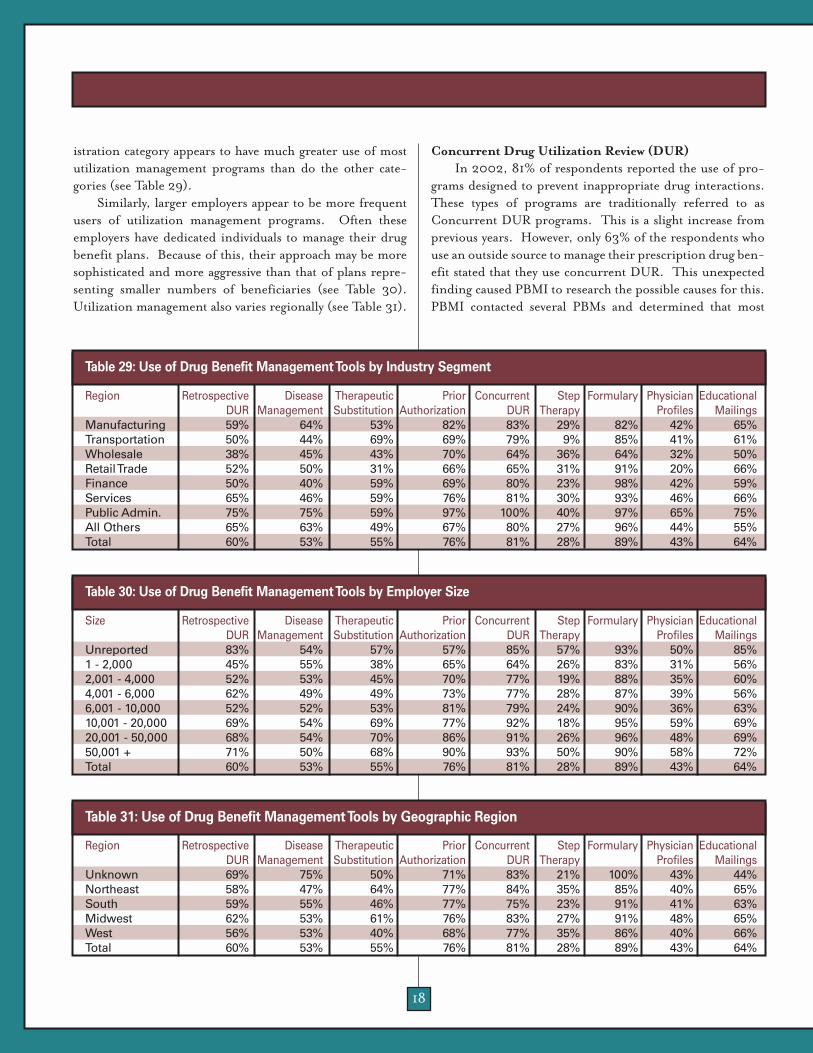
18
istration category appears to have much greater use of mostutilization management programs than do the other cate-gories (see Table 29).
Similarly, larger employers appear to be more frequentusers of utilization management programs. Often theseemployers have dedicated individuals to manage their drugbenefit plans. Because of this, their approach may be moresophisticated and more aggressive than that of plans repre-senting smaller numbers of beneficiaries (see Table 30).Utilization management also varies regionally (see Table 31).
Concurrent Drug Utilization Review (DUR)In 2002, 81% of respondents reported the use of pro-
grams designed to prevent inappropriate drug interactions.These types of programs are traditionally referred to asConcurrent DUR programs. This is a slight increase fromprevious years. However, only 63% of the respondents whouse an outside source to manage their prescription drug ben-efit stated that they use concurrent DUR. This unexpectedfinding caused PBMI to research the possible causes for this.PBMI contacted several PBMs and determined that most
Region Retrospective Disease Therapeutic Prior Concurrent Step Formulary Physician Educational DUR Management Substitution Authorization DUR Therapy Profiles Mailings
Manufacturing 59% 64% 53% 82% 83% 29% 82% 42% 65%Transportation 50% 44% 69% 69% 79% 9% 85% 41% 61%Wholesale 38% 45% 43% 70% 64% 36% 64% 32% 50%Retail Trade 52% 50% 31% 66% 65% 31% 91% 20% 66%Finance 50% 40% 59% 69% 80% 23% 98% 42% 59%Services 65% 46% 59% 76% 81% 30% 93% 46% 66%Public Admin. 75% 75% 59% 97% 100% 40% 97% 65% 75%All Others 65% 63% 49% 67% 80% 27% 96% 44% 55%Total 60% 53% 55% 76% 81% 28% 89% 43% 64%
Table 29: Use of Drug Benefit Management Tools by Industry Segment
Size Retrospective Disease Therapeutic Prior Concurrent Step Formulary Physician Educational DUR Management Substitution Authorization DUR Therapy Profiles Mailings
Unreported 83% 54% 57% 57% 85% 57% 93% 50% 85%1 - 2,000 45% 55% 38% 65% 64% 26% 83% 31% 56%2,001 - 4,000 52% 53% 45% 70% 77% 19% 88% 35% 60%4,001 - 6,000 62% 49% 49% 73% 77% 28% 87% 39% 56%6,001 - 10,000 52% 52% 53% 81% 79% 24% 90% 36% 63%10,001 - 20,000 69% 54% 69% 77% 92% 18% 95% 59% 69%20,001 - 50,000 68% 54% 70% 86% 91% 26% 96% 48% 69%50,001 + 71% 50% 68% 90% 93% 50% 90% 58% 72%Total 60% 53% 55% 76% 81% 28% 89% 43% 64%
Table 30: Use of Drug Benefit Management Tools by Employer Size
Region Retrospective Disease Therapeutic Prior Concurrent Step Formulary Physician Educational DUR Management Substitution Authorization DUR Therapy Profiles Mailings
Unknown 69% 75% 50% 71% 83% 21% 100% 43% 44%Northeast 58% 47% 64% 77% 84% 35% 85% 40% 65%South 59% 55% 46% 77% 75% 23% 91% 41% 63%Midwest 62% 53% 61% 76% 83% 27% 91% 48% 65%West 56% 53% 40% 68% 77% 35% 86% 40% 66%Total 60% 53% 55% 76% 81% 28% 89% 43% 64%
Table 31: Use of Drug Benefit Management Tools by Geographic Region

19
PBMs, if not every PBM, offer concurrent DUR as part oftheir basic prescription drug benefit management package.The misperception by employers that concurrent DUR is notoffered is possibly related to the fact that because concurrentDUR is such a basic element of electronic claims processing,it is transparent to the purchaser and may not be highlightedas a value-added benefit by the vendor.
Retrospective Drug Utilization Review (DUR)Retrospective DUR programs are designed to generate
profiles of patients and physicians with suboptimal usage pat-terns. These profiles can be used to enhance formulary com-pliance, generic substitution, therapeutic substitution, andto detect suspected cases of fraud and abuse. Only 60% of therespondents use patient profiles and only 43% of therespondents use physician profiles of their benefit plans.
Step TherapyStep therapy restricts access to certain
drugs to those patients who are most likely tobenefit from those products. A good exampleof a category of drugs that is commonly man-aged through step-therapy is Cox-2 inhibitors(Cox-2s). Many frequently prescribed painmedications, particularly non-steroidal anti-inflammatory drugs (NSAIDs), may causeadverse gastrointestinal (GI) events or ulcersin some patients. Cox-2s are relatively newanti-inflammatory drugs that are less likely tocause ulcers than the NSAIDs. It is important that patientswho are at high risk for ulcers have access to the Cox-2s.Patients that are not at risk for ulcers may have their painproblems satisfied by the older, less expensive NSAIDs.
For Cox-2s, there are two step therapy protocols that canbe used. The first is to automatically authorize the use of Cox-2 inhibitors by patients who are age 65 or older, take an anti-coagulant, and or have a history of ulcers or other adverse GIevents. The second protocol is to require patients to try usingseveral different NSAIDs before approving the use of Cox-2s.
Prior AuthorizationThe percentage of employers using prior authorization
programs to control costs and manage access to certain drugshas increased from 43% in 1996 to 76% in 2002. Theseprograms are similar to step therapy programs in that accessto selected drugs is restricted to those individuals who canmost benefit from their use. The difference is that the
approval process is manual rather than automatic. In general, drugs that are included in prior authoriza-
tion programs tend to be expensive drugs for which clearclinical criteria exist that identify patients who are most like-ly to benefit from the use of these drugs. For a patient toreceive one of these drugs, the prescriber must provide therequired clinical information to the PBM for approval.Growth hormones are an example of a drug commonlyincluded in prior authorization programs.
Therapeutic SubstitutionThe use of therapeutic substitution programs, some-
times called drug-switching programs, has not changed since1997. These programs are designed to switch prescriptionsfrom one brand-name drug to a preferred product.Therapeutic substitution is best suited for the mail serviceenvironment because the pharmacist has time to contact the
physician to obtain permission to switch thedrug, if medically appropriate, before the pre-scription is dispensed.
One reason that the use of therapeutic sub-stitution programs may not be growing is theintroduction of three-tier copayment plans.These plans provide financial incentives topatients to encourage the use of preferreddrugs. These incentives may be more effectivein causing these switches to be made thanmany PBM-sponsored programs.
Disease ManagementPBMI noted an increase in the number of employers
offering some type of disease management program from46% in 2001 to 53% in 2002. Although little data exist doc-umenting the impact of PBM-managed disease managementprograms, this lack of hard data has not dissuaded manyemployers from embracing the concept of disease manage-ment.
The growing trend of incorporating disease manage-ment programs as part of the drug benefit reflects a soften-ing of previous concerns about higher initial expenses relat-ed to increased prescription drug utilization in exchange forpotential savings. These concerns seem to have been tem-pered by industry-wide acceptance of disease managementprograms as a good starting point for managing many ill-nesses, including asthma, heart disease, acid reflux disor-ders, depression, and other prevalent ailments.
In 200276% of employersreported using
prior authorization
programs.

20
UTILIZATION PATTERNSPBMI collects a limited amount of utilization data in an
effort to quantify the impact of various benefit plan designelements on utilization. Survey respondents reported a 16%increase in costs from 2001 to 2002. The reported changein cost is based on total plan costs after cost sharing. It is notbased upon a per-member-per-month (or per year) cost. Asa result, this change is affected by changes in the number ofbeneficiaries and changes in cost sharing.
Mail Service UtilizationEmployers experience a broad range of percentages of
total prescriptions that are dispensed through the mail serv-ice pharmacy as illustrated in Table 32.
Mail service use can be encouraged through the use ofcost sharing incentives or by requiring refills for mainte-nance drugs to be dispensed through the mail service phar-macy. A few employers identified changes totheir benefit plans in 2002 that required ben-eficiaries to refill specific drugs (e.g., oralcontraceptives) through mail.
Table 33 illustrates the impact of manda-tory mail service use on refilling maintenanceprescriptions. Mail service utilization almosttriples when mail service is required for main-tenance prescriptions.
The data on the impact of cost sharing onmail service use is not as clear because mailservice utilization is, in part, dependent uponpopulation demographics such as age and gender, data thatPBMI currently does not capture in its survey.
Generic UtilizationOne of the most effective strategies to reduce drug ben-
efit costs is to increase generic drug utilization. Genericdrugs, as defined by the U.S. Food and Drug Administration(FDA), are the chemical equivalents of their brand-namecounterparts and therefore identical in terms of safety andeffectiveness. Generic drugs are much less expensive thanbrand-name products. Initially, because of concerns aboutsafety and efficacy, patients and some physicians were slow toaccept a generic drug in lieu of the brand-name drug. Ascosts sharing incentives and generic drug options haveincreased and patients have become more familiar with theuse of generic drugs, patients are more willing to accept thegeneric product in lieu of the brand-name alternative.
Average retail generic utilization increased from 40.4%in 2001 to 41.5% in 2002. Average mail service generic uti-lization increased from 30.4% in 2001 to 31.8% in 2002.
These rates are expected to continue toincrease as more drugs become availablegenerically, cost sharing incentives increase,and more and different utilization manage-ment programs are implemented.
As shown in Table 34, there is a broadrange of generic dispensing rates for both mailservice and retail. For those employers withthe highest rates of generic utilization, theremay be unique features that allowed them toreach these levels of generic dispensing. Mailservice generally achieves lower rates of gener-
ic drug use because the drugs most commonly dispensedthrough mail are not available generically.
Employers can encourage generic utilization in severalways. This includes cost sharing design, demographics,generic detailing of prescriber network, and beneficiary edu-cation among others. Although PBMI examines generic uti-lization by some of these factors individually, it is their com-bined impact that determines the outcome.
For example, simply setting the generic copayment lowerthan the brand-name drug copayment can encourage gener-
Point in Range Percentage of Total Prescriptions Dispensed By
Mail Service PharmacyLowest Use Percentage Less than 1%Average Use Percentage 13%Highest Use Percentage 57%
Table 32: Range of Mail Service Utilization
Mail Service Status Percentage of Total Prescriptions Dispensed By
Mail Service PharmacyVoluntary Mail Service 11%Mandatory Mail 34%
Table 33: Impact of Mandatory Mail Service on Mail Service Utilization Point in Range Percentage of Percentage of
Retail Pharmacy Mail ServicePrescriptions Prescriptions
Lowest Percent Generic 19.0% 10.7%Average Percent Generic 41.5% 31.8%Highest Percent Generic 57.3% 60.3%
Table 34: Range of Generic Dispensing Rate in Retail and Mail Service Pharmacies
Mail serviceutilization
almost tripleswhen
mail service ismandatory.

21
ic drug utilization. However, if the difference between thebrand and generic copayment is minimal, the incentive isminimal. In a three-tier copayment structure, generic drugscommonly are assigned to the first-tier with the lowest copay-ment, while multiple-source, brand-name drugs areassigned to the third-tier with the highest copayment.
As the absolute difference in first- and third-tier retailcopayments increases, the percent of generic prescriptionsincreases as shown in Table 35. This trend is also seen inmail service (see Table 36). Because of increased prescrip-tion volume and the resulting impact on retail and mail serv-ice drug mix experienced by plans with mandatory mail serv-ice use requirements, these employers have been excludedfrom this analysis.
Coinsurance appears to be a tool that can be used toincrease generic drug use. Plans that have a coinsurancecomponent achieved a 41.6% generic drug use while planswithout a coinsurance component achieved 40.4% genericdrug use.
Before the introduction of three-tier copaymentschemes, the primary strategy to encourage generic utiliza-tion was to assess a financial penalty to beneficiaries thatchoose to accept a multi-source brand drug when a generic isavailable. Traditionally, this penalty was the difference in
cost between the generic and brand drug. The intent was tokeep the employer’s cost the same whether the generic orbrand was dispensed. With the introduction of a third copay-ment tier and the assignment of multi-source brand drugs tothat tier, many employers have chosen to eliminate the generic penalty. Financially, the third-tier copaymentapproximates the amount that the patient would have paidwith the penalty.
Requiring members to pay the difference in cost betweenthe brand and generic drug appears to result in greatergeneric drug use than simply charging a higher copaymentfor both retail (Table 37) and mail (Table 38).
PBMI’s data indicate that the percentage of employerswho impose some kind of penalty on patients for dispensinga multi-source drug when a generic equivalent is available hasincreased each year. This study groups penalties into threecategories: paying the total cost of brand-name drug, pay-ment of the difference in price between brand-name drugand generic or the payment of higher copayment for brand-name drug.
In 1999, 89% of employers imposed some kind of apenalty for the dispensing of a multi-source brand-namedrug. In 2002, this reached 98% of employers. This is illus-trated in Table 39. Likewise, the percentage of employers
Difference Between Tier 1 Percentage of Retailand Tier 3 Copayments Prescriptions
Dispensed as Generics$0 - $24 40.2%$25 + 41.6%
Table 35: Impact of Copayment Difference on Retail Pharmacy Generic Dispensing
Generic Penalty Average Percent of Description Retail Prescriptions
Dispensed as GenericsPay Difference in Cost 42.0%Pay Higher Copayment 40.1%
Table 37: Impact of Generic Penalties on Retail Pharmacy Generic Dispensing
Difference Between Tier 1 Percentage of Mail and Tier 3 Copayments Prescriptions
Dispensed as Generics$0 - $29 29.9%$30 - $59 30.7%$60 + 32.1%
Table 36: Impact of Copayment Difference on Mail Service Pharmacy Generic Dispensing
Generic Penalty Average Percent of Description Mail Prescriptions
Dispensed as GenericsPay Difference in Cost 33.1%Pay Higher Copayment 30.7%
Table 38: Impact of Generic Penalty on Mail Service Pharmacy Generic Dispensing
2002 2001 2000 1999None 2% 4% 6% 11%Pay Total Cost 1% 3% NA NAPay Difference in Cost 38% 34% 44% 47%Pay Higher Copayment 60% 59% 50% 42%NA=Not Applicable
Table 39:Trends in Employers’ Use of Generic Penalties
22
who charge a higher copayment for multi-source brand-name drugs has steadily increased. In 1999, only 42% ofrespondents charged a higher copayment for multi-sourcebrand-name drugs, whereas 60% imposed a higher copay-ment in 2002.
In 1999, 47% of survey respondents required patients topay the difference in cost to receive a brand-name product.This decreased to 34% in 2001 but has increased slightly to38% in 2002.
As shown in Table 39, the primary strategy is to simplyrequire a higher copayment. This coincides with the wide-spread adoption of the three-tier copayment strategies. Inthis case, the copayment for the third tier, in which multiple-
source brand-name drugs are typically categorized, must beset high enough so that it is roughly equivalent to the gener-ic copayment plus the difference in cost between the genericand brand drugs. This strategy helps to eliminate patientconfusion about the required copayment.
Many believe providing incentives for the pharmacist todispense generic drugs can be effective in increasing genericdrug use. When the dispensing fee paid to the pharmacist isthe same for both brand and generic prescriptions, genericprescriptions are dispensed 40.7% of the time. However,when pharmacists are paid a higher dispensing fee for gener-ic drugs, the generic dispensing rate increases to only 40.9%.

2323
EMPLOYERS EMBRACESOPHISTICATED COSTSHARING DESIGNS
With drug benefit costsharing amounts increasingso rapidly, PBMI contacted
some survey respondents to get more information about thefuture direction of cost sharing. The key points identifiedinclude:➢ Plan sponsors will continue to make incremental cost
share increases. ➢ There appears to be little concern about the impact of
increased benefit cost sharing on employee retentionrates.
➢ Most employers are willing to tolerate the "noise" associ-ated with changes in benefit plan design until employeesget used to the changes.
➢ Multi-tiered copayments linked to formu-laries continue to make varying copay-ments and coinsurance levels easy for activeemployees and retirees to understand.One of PBMI’s motivations for asking
follow-up questions about cost sharing was toget a sense whether employers felt they wereapproaching a ceiling where additionalincreases would be impractical and the drugbenefit would be discontinued. None havereached this point nor felt this was a concernfor the near future.
Based on survey data such as the increased use of coin-surance, multiple tier designs, and new models such asdefined contribution, it is clear that plan sponsors are will-ing to explore alternative cost sharing mechanisms. One ofthe benefits of these newer models is that they allow the plansponsors to increase cost sharing in some areas while keepingother areas affordable.
For example, one national, self-funded employer has 20percent coinsurance for generics and 50 percent coinsur-ance for brand-name drugs. The coinsurance for mail-orderprescriptions is capped at $75 per prescription with an out-of-pocket maximum of $1500 per year. This plan designprovides a significant incentive to use generic drugs andcauses patients to pay a consistent proportion for branddrugs as costs increase over time, while capping payments toensure affordability. This employer believes this plan design,in place since 1990, has kept the company’s prescription drugexpenditures to a rational level.
One positive aspect of the current economic climate isthat employers now have greater leverage to increase orchange cost sharing than they may have had in the past. A fewyears ago, when employers were aggressively competing for ashrinking labor pool, employers were afraid that increases incost sharing might result in higher employee attrition.Today, with fewer employment alternatives, employers areless concerned about employee reactions.
One employer recently switched from copaymentamounts to coinsurance for mail order and did not experi-ence a lot of push back from members. The lack of negativereaction was probably more due to the company’s proactiveapproach in educating actives and retirees about the newcoinsurance rather than simply concerns about continuedemployment. To improve member acceptance, the company1) requested its PBM create 30-day locks on drug prices, 2)absorbed any price differential that may exist on day of dis-
pensing, and 3) raised the maximum memberaccount balance from $100 to $300 to ensureclaims would not be denied if there was anoutstanding balance on a member’s account.
Plan sponsors view multiple tier cost shar-ing arrangements as an effective tool to man-age costs and also an effective form to struc-ture benefit designs so their employeesunderstand them. There are significant dif-ferences in the copay amounts among tiers.These differences, in many cases, more thancompensate the plan sponsor for the higher
drug costs associated with the patient choosing drugs fromhigher tiers. Now that the three-tier scheme has become rel-atively standard throughout the country, plan sponsors arelooking at four and more tiers to place additional categoriesof drugs at higher copayment amounts. These tiers allow theplan sponsors to selectively collect higher copaymentamounts, reducing plan sponsor costs where the plan spon-sor believes it is appropriate.
For example, plan sponsors are particularly concernedabout controlling utilization of the "15 most advertised"driving increases in drug expenditures. One organizationhas created a fourth tier copayment for drugs heavily pro-moted through direct-to-consumer advertising. Others usethe fourth tier to cover lifestyle drugs at a 100% coinsurance.The drugs commonly included include Viagra®, hair growthdrugs, human growth hormones, fertility drugs, anti-fungalsfor foot care, and Botox® with cosmetic diagnoses.
EMERGING COST CONTAINMENT STRATEGIES
Current economicclimate gives
employers greaterleverage to change cost
sharing.

OIG COMPLIANCE GUIDELINES FOR PRESCRIPTION DRUG INDUSTRY MAY BE BOON TO EMPLOYERSNew Guidelines Predicted to Impact the PBM Industry
On April 23, 2003, the Office of the Inspector General(OIG) of the Department of Health and Human Servicesissued the OIG Compliance Program Guidance forPharmaceutical Manufacturers. This guidance is intended tohelp manufacturers reduce or eliminate their risk of com-mitting unlawful acts.
Although this guidance pertains to pharmaceutical man-ufacturers, it may influence how manufacturers do businesswith PBMs. This may also affect the business relationshipbetween the PBMs and their customers. Specifically, it mayalter the types of contracts that pharmaceutical manufactur-ers are willing to negotiate with PBMs. Rather than discussingthe entire guidance, this discussion is limited to its perceivedimpact on PBMs and their customers.
Although this guidance pertains only tofederal health care programs (Medicaid andMedicare), this guidance may have an impactin the non-federal health care arena. It is dif-ficult for manufacturers and PBMs to estab-lish different business practices for federalprograms versus non-federal programs. Atleast one PBM has already publicly announcedchanges to its core business practices becauseof this guidance. To the extent that manufac-turers and PBMs change their business prac-tices to accommodate federal programs, they may find it nec-essary or advantageous to alter their business practices fornon-federal programs as well.
According to Anthony L. Farino, Assurance andBusiness Advisory Services Partner atPricewaterhouseCoopers, "The new model guidance placesmuch more scrutiny on PBM/Manufacturer relationships,particularly with respect to payments whether in the form ofrebates or other support. In recent years, drug manufactur-ers have scrutinized PBM relationships much more closely asthey have developed a more sophisticated understanding ofPBM operations. The new OIG guidance may create furtherincentive to evaluate those relationships and the related pay-ments which could certainly impact employer/payor arrange-ments with PBMs."
This guidance does not create any new law or legal obli-gation. It is a starting point for the legal review of pharma-ceutical manufacturer marketing practices. Compliance with
the guidance does not eliminate all liability; it is, however, away to minimize risk.
Traditionally, PBMs were hired to manage employer orhealth plan prescription drug benefits and were paid by thesecustomers for this service. However, PBMs now also enterinto agreements with pharmaceutical manufacturers thatcould affect an employer’s benefit cost and utilization. Formany of their employer customers, the PBM’s profitabilitynow depends as much or more upon revenue from thesemanufacturer contracts than they do on revenue from theemployer.
The guidance identifies several activities that couldpotentially violate federal fraud abuse statutes and regula-tions. According to the guideline:
"The identification of a given practice or activity as "sus-pect" or as an area of "risk" does not mean it is necessarilyillegal or unlawful, or that it cannot be properly structured to
fit in a safe harbor. Nor does it mean that thepractice or activity is not beneficial from aclinical, cost, or other perspective. Rather, theareas identified below are those areas of activ-ity that have a potential for abuse based on his-torical law enforcement experience and thatshould receive close scrutiny from manufac-turers."
Some of the risky activities identified by theOIG include:➢ Formularies and formulary placement
payments➢ Rebate payments➢ Drug-switching arrangements
To reiterate, simply characterizing an activity as poten-tially risky does not mean it is illegal. For example, the OIGidentified formularies as having a positive potential impacton cost and utilization. The issue that concerns the OIG isthe process used to determine how and why certain drugs areincluded in a particular formulary. For employers, this couldtranslate into increased scrutiny of the formulary develop-ment process, resulting in improved quality.
Additionally, it is not illegal to pay or collect rebates.Rather, it is the manner in which these rebate payments aremade and received that determines suspect activity. In thecase of rebates, the OIG recommends that the PBM fully dis-close rebate payments received in writing at least annually.Nothing in the guidance specifically requires PBMs to dis-close these payments to employers. However, it is the hope ofemployers that this will lead to greater disclosure about
Compliance withthe guidance doesnot eliminate all
liability; it is,however, a way to
minimize risk.
24
2325
rebates and other undisclosed financial arrangementsbetween PBMs and manufacturers.
An area of particular concern to the OIG is drug switch-ing. The primary concern regarding the practice of drugswitching relates to the payment of a fee to a PBM for switch-ing a patient’s prescription from one drug to another drug.The use of this type of program for a federal health care pro-gram creates clear risks.
The guidance states that the best way for pharmaceuticalmanufacturers to protect themselves from prosecution is todisclosure their financial relationships to purchasers. AsAttorney Joseph Metro of Reed Smith, a top 20-law firm,states, "The Guidance on PBMs has a "pro-transparency"
theme. The OIG favors the disclosure of information aboutfinancial relationships between PBMs and manufacturers tothe ultimate federal payors (i.e., health plans)."
If the OIG guidance is implemented for all of a PBM’scustomers, it should help to address many of the concernsthat customers may have about the actions of their PBMs.Disclosing their relationships with manufacturers and asso-ciated payments will help create a better working relationshipbetween the PBM and its customers. Disclosure of this infor-mation will allow employers to decide whether they are will-ing to accept these third-party arrangements. Information iskey, and employers are likely to benefit from full disclosurein future contract negotiations with PBMs.

26
APPENDIX: SUPPLEMENTAL DATA
The PBMI survey organizes respondent organizations by major Standard IndustrialClassification Codes. These codes are based on the first two digits of the employer’s primarystandard industrial classification code.
Industry Segment First Two Digits of SIC CodeAgricultural, Forestry, and Fishing 01-09 Mining 10-14Construction 15-17Manufacturing 20-39Transport, Communications, and Utilities 40-49Wholesale Trade 50-51Retail Trade 52-59Finance, Insurance, and Real Estate 60-67Services 70-89Public Administration 91-97
Table 40: Industry Segments Created from Respondents’ SIC Codes
SIC Retail MailManufacturing $0.29 $0.16Transportation $0.32 $0.21Wholesale $0.34 $0.03Retail Trade $0.15 $0.09Finance $0.34 $0.29Services $0.29 $0.17Public Admin. $0.19 $0.06All Others $0.20 $0.08Total $0.28 $0.16
Table 41: Average Administrative Fees by Industry Segment
Brand Drug Generic DrugRegion Average AWP Average Fee Reimbursement Rate Average FeeNortheast 85.8% $2.03 88.3% $2.15South 85.8% $2.13 88.5% $2.19Midwest 85.9% $2.16 88.6% $2.25West 86.1% $2.21 88.9% $2.34All 85.8% $2.13 88.5% $2.22
Table 42: Retail Reimbursement by Geographic Location
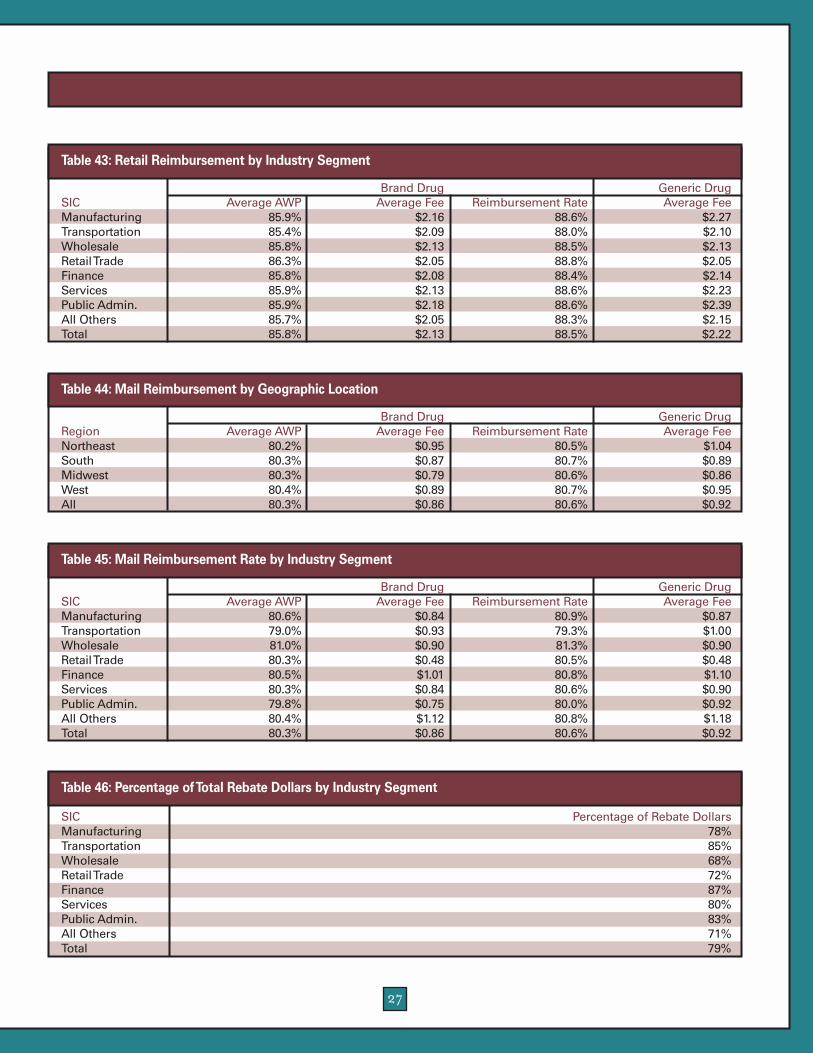
27
Brand Drug Generic DrugRegion Average AWP Average Fee Reimbursement Rate Average FeeNortheast 80.2% $0.95 80.5% $1.04South 80.3% $0.87 80.7% $0.89Midwest 80.3% $0.79 80.6% $0.86West 80.4% $0.89 80.7% $0.95All 80.3% $0.86 80.6% $0.92
Table 44: Mail Reimbursement by Geographic Location
Brand Drug Generic DrugSIC Average AWP Average Fee Reimbursement Rate Average FeeManufacturing 80.6% $0.84 80.9% $0.87Transportation 79.0% $0.93 79.3% $1.00Wholesale 81.0% $0.90 81.3% $0.90Retail Trade 80.3% $0.48 80.5% $0.48Finance 80.5% $1.01 80.8% $1.10Services 80.3% $0.84 80.6% $0.90Public Admin. 79.8% $0.75 80.0% $0.92All Others 80.4% $1.12 80.8% $1.18Total 80.3% $0.86 80.6% $0.92
Table 45: Mail Reimbursement Rate by Industry Segment
SIC Percentage of Rebate DollarsManufacturing 78%Transportation 85%Wholesale 68%Retail Trade 72%Finance 87%Services 80%Public Admin. 83%All Others 71%Total 79%
Table 46: Percentage of Total Rebate Dollars by Industry Segment
Brand Drug Generic DrugSIC Average AWP Average Fee Reimbursement Rate Average FeeManufacturing 85.9% $2.16 88.6% $2.27Transportation 85.4% $2.09 88.0% $2.10Wholesale 85.8% $2.13 88.5% $2.13Retail Trade 86.3% $2.05 88.8% $2.05Finance 85.8% $2.08 88.4% $2.14Services 85.9% $2.13 88.6% $2.23Public Admin. 85.9% $2.18 88.6% $2.39All Others 85.7% $2.05 88.3% $2.15Total 85.8% $2.13 88.5% $2.22
Table 43: Retail Reimbursement by Industry Segment

28
SIC Average Copayments Percent withFirst Tier Second Tier Third Tier Coinsurance
Manufacturing $13.89 $30.13 $56.65 20%Transportation $12.34 $24.77 $55.60 12%Wholesale $12.95 $29.63 $53.21 10%Retail Trade $16.20 $34.96 $63.06 8%Finance $15.09 $33.39 $60.90 4%Services $14.93 $31.61 $60.21 11%Public Admin. $14.00 $30.96 $63.21 8%All Others $16.50 $33.18 $73.57 10%Total $14.61 $31.21 $60.61 12%
Table 47: Retail Cost Sharing by Industry Segment
SIC Average Copayments Percent withFirst Tier Second Tier Third Tier Coinsurance
Manufacturing $13.89 $30.13 $56.65 20%Transportation $12.34 $24.77 $55.60 12%Wholesale $12.95 $29.63 $53.21 10%Retail Trade $16.20 $34.96 $63.06 8%Finance $15.09 $33.39 $60.90 4%Services $14.93 $31.61 $60.21 11%Public Admin. $14.00 $30.96 $63.21 8%All Others $16.50 $33.18 $73.57 10%Total $14.61 $31.21 $60.61 12%
Table 48: Mail Service Cost Sharing by Industry Segment
SIC Anabolic Growth Infertility Smoking Injectable Oral Weight OTCSteriods Hormones Cessation Contraceptives Loss
Manufacturing 42% 35% 53% 55% 12% 18% 78% 100%Transportation 45% 38% 44% 59% 19% 9% 65% 94%Wholesale Trade 41% 42% 58% 63% 9% 13% 83% 96%Retail Trade 47% 55% 75% 73% 21% 12% 76% 97%Finance 44% 15% 27% 58% 10% 2% 59% 96%Services 44% 31% 48% 54% 12% 11% 70% 97%Public Admin. 30% 37% 48% 60% 14% 3% 79% 96%All Others 53% 47% 69% 56% 9% 10% 72% 88%Total 44% 35% 51% 57% 13% 11% 72% 95%
Table 49: Drug Exclusions by Drug Exclusions by Industry Segment
Region Total Cost Higher Copayment Difference in Cost None/UnknownUnknown 0% 68% 32% 0%Northeast 0% 63% 33% 4%South 2% 55% 41% 2%Midwest 1% 59% 40% 0%West 2% 69% 27% 2%Total 1% 60% 38% 2%
Table 50:Type of Generic Penalty by Geographic Region
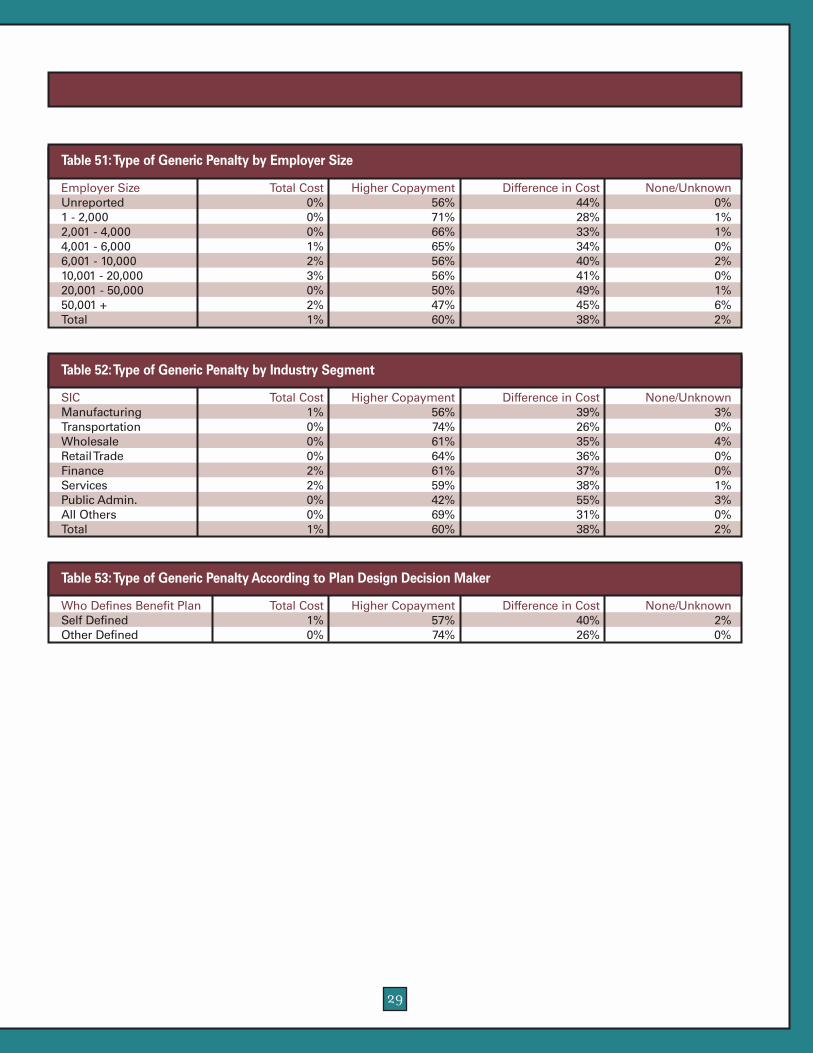
29
Employer Size Total Cost Higher Copayment Difference in Cost None/UnknownUnreported 0% 56% 44% 0%1 - 2,000 0% 71% 28% 1%2,001 - 4,000 0% 66% 33% 1%4,001 - 6,000 1% 65% 34% 0%6,001 - 10,000 2% 56% 40% 2%10,001 - 20,000 3% 56% 41% 0%20,001 - 50,000 0% 50% 49% 1%50,001 + 2% 47% 45% 6%Total 1% 60% 38% 2%
Table 51:Type of Generic Penalty by Employer Size
SIC Total Cost Higher Copayment Difference in Cost None/UnknownManufacturing 1% 56% 39% 3%Transportation 0% 74% 26% 0%Wholesale 0% 61% 35% 4%Retail Trade 0% 64% 36% 0%Finance 2% 61% 37% 0%Services 2% 59% 38% 1%Public Admin. 0% 42% 55% 3%All Others 0% 69% 31% 0%Total 1% 60% 38% 2%
Table 52:Type of Generic Penalty by Industry Segment
Who Defines Benefit Plan Total Cost Higher Copayment Difference in Cost None/UnknownSelf Defined 1% 57% 40% 2%Other Defined 0% 74% 26% 0%
Table 53:Type of Generic Penalty According to Plan Design Decision Maker

30
NOTES

31

32


Creating Opportunities With Healthcare Solutions
© 2003 Takeda Pharmaceuticals North America, Inc.MC01-0049-3 8/03