the price of correlation risk evidence from equity options
TRANSCRIPT

7/27/2019 The Price of Correlation Risk Evidence From Equity Options
http://slidepdf.com/reader/full/the-price-of-correlation-risk-evidence-from-equity-options 1/30
THE JOURNAL OF FINANCE • VOL. LXIV, NO. 3 • JUNE 2009
The Price of Correlation Risk: Evidence
from Equity Options
JOOST DRIESSEN, PASCAL J. MAENHOUT, and GRIGORY VILKOV ∗
ABSTRACT
We study whether exposure to marketwide correlation shocks affects expected option
returns, using data on S&P100 index options, options on all components, and stock
returns. We find evidence of priced correlation risk based on prices of index and indi-
vidual variance risk. A trading strategy exploiting priced correlation risk generates
a high alpha and is attractive for CRRA investors without frictions. Correlation risk
exposure explains the cross-section of index and individual option returns well. Thecorrelation risk premium cannot be exploited with realistic trading frictions, provid-
ing a limits-to-arbitrage interpretation of our finding of a high price of correlation
risk.
CORRELATIONS PLAY A CENTRAL ROLE in financial markets. There is considerable ev-idence that correlations between asset returns change over time1 and that stockreturn correlations increase when returns are low.2 A marketwide increase incorrelations negatively affects investor welfare by lowering diversification ben-efits and by increasing market volatility, so that states of nature with unusually
high correlations may be expensive. It is therefore natural to ask whether mar-ketwide correlation risk is priced in the sense that assets that pay off wellwhen marketwide correlations are higher than expected (thereby providing a
∗Driessen is at the University of Amsterdam. Maenhout and Vilkov are at INSEAD. We would
like to thank Yacine A ıt-Sahalia, David Bates, Jonathan Berk, Oleg Bondarenko, Michael Brandt,
Menachem Brenner, John Campbell, Mike Chernov, Greg Duffee, Darrell Duffie, Rob Engle,
Jan Ericsson, Gerard Gennotte, Jens Jackwerth, Chris Jones, Frank de Jong, Hayne Leland,
Toby Moskowitz, Anthony Neuberger, Josh Rosenberg, Mark Rubinstein, Pedro Santa-Clara, Ken
Singleton, Otto van Hemert, Robert Whitelaw, Zhipeng Zhang, and especially Bernard Dumas
for comments and stimulating discussions. We are particularly grateful for the detailed and con-
structive comments of an anonymous referee and the Editor. We received helpful comments fromseminar participants at Berkeley Haas School of Business, BI Oslo, Cornell Johnson School, HEC
Lausanne, INSEAD, LBS-LSE-Oxford Asset Pricing Workshop, MIT Sloan, NY Fed, NYU Stern,
Stanford GSB, Tilburg, University of Amsterdam, University of Bonn, University of Frankfurt, Uni-
versity of Rotterdam, Warwick Business School, Yale SOM, CEPR Summer Symposium Gerzensee,
EFA 2005, Duke-UNC Asset Pricing Conference, and WFA 2006. We gratefully acknowledge the
financial support of INSEAD R&D.1 See Bollerslev, Engle, and Woolridge (1988) and Moskowitz (2003), among others. Brandt and
Diebold (2006), and Engle and Sheppard (2005) present recent innovations in the estimation of
dynamic correlations.2 Financial crises are often viewed as episodes of unusually high correlations. Roll (1988) ana-
lyzes the 1987 crash and Jorion (2000) studies the Russia/LTCM crisis. Longin and Solnik (2001)
use extreme value theory to study whether international equity correlations increase in volatiletimes.
1377
7/27/2019 The Price of Correlation Risk Evidence From Equity Options
http://slidepdf.com/reader/full/the-price-of-correlation-risk-evidence-from-equity-options 2/30
1378 The Journal of Finance R
hedge against correlation risk) earn lower returns than can be justified by theirexposure to other priced risk factors. Index options are an obvious example of such assets, as they will appear expensive when correlation risk is priced.
This is the first paper to analyze whether cross-sectional differences in expo-
sure to marketwide correlation risk can account for cross-sectional differencesin expected returns. Our first contribution is to provide evidence of a largecorrelation risk premium. We show that the differential pricing of index andindividual stock options contains unique information on the price of correlationrisk. In particular, our analysis of the cross-section of index and individual op-tion returns, as well as the study of variance risk premia in index and individualoptions, highlights an important tension between index and individual optionprices. Demonstrating this tension and offering a risk-based explanation for itforms the second contribution of this paper.
The bulk of recent work on empirical option pricing studies index options.
Although there is growing evidence that individual option prices and returnsbehave differently empirically, most work focuses on Black and Scholes (1973)and Merton (1973a) implied volatility functions.3 We add formal evidence thatindividual options, unlike index options, do not embed a negative variance riskpremium, nor earn economically significant returns in excess of a one-factormodel. By considering individual options on all index components, our analysisemphasizes that a challenge in option pricing concerns explaining the differ-ence between expected index and individual option returns. This is challenging since the index process is the weighted average of the individual processes. A risk-based explanation for the contrast between index and individual options
requires that aggregated individual processes be exposed to a risk factor thatis lacking from the individual processes. Priced correlation risk makes thispossible. Intuitively, index options are expensive and earn low returns, unlikeindividual options, because they offer a valuable hedge against correlation in-creases and insure against the risk of a loss in diversification benefits.4, 5 Ourresults thereby also offer a novel view on the source of the large volatility riskpremium that recent work on index options has disclosed.
We use data on S&P100 index options and on individual options on all theS&P100 index components, combined with prices of the underlying stocks fromJanuary 1996 until the end of December 2003. We provide evidence for a corre-
lation risk premium in three different ways.3 See, for instance, Bakshi and Kapadia (2003b), Bakshi, Kapadia, and Madan (2003), Bollen
and Whaley (2004), Branger and Schlag (2004), Dennis and Mayhew (2002), and Dennis, Mayhew,and Stivers (2006).
4 Rubinstein (2000) revisits the 1987 crash and lists correlation risk as a potential reason whystock market declines and increases in volatility coincide, noting that “Correlation increases inmarket declines, which increases volatility and reduces opportunities for diversification.”
5 Garleanu, Pedersen, and Poteshman (2005) develop a model where risk-averse market makerscannot perfectly hedge a book of options, so that demand pressure increases the price of options.The authors document empirically that end-users are net long index options, which could explaintheir high prices, but the model is agnostic about the source of the exogenous demand by end-users.
Our findings suggest that the demand for index options may well be driven by investors ’ desire tohedge against correlation risk.

7/27/2019 The Price of Correlation Risk Evidence From Equity Options
http://slidepdf.com/reader/full/the-price-of-correlation-risk-evidence-from-equity-options 3/30
The Price of Correlation Risk 1379
First, we present a general decomposition of index variance risk. Index vari-ance changes are due to changes in individual variances and changes in cor-relations, so that index variance risk is priced to the extent that individual
variance risk and correlation risk are priced. We find a large negative index
variance risk premium, in line with results in the recent literature.6 Unlikerecent work, we also estimate variance risk premia in all individual optionson all S&P100 components and find no evidence of a negative risk premiumon individual variance risk.7 As the decomposition shows, these two findingsare only consistent with each other in a risk-based model if exposure to cor-relation shocks is priced. Therefore, the stylized facts about index and indi-
vidual variance risk provide model-free indirect evidence for priced correlationrisk.
Second, we derive a simple option-based trading strategy aimed at exploit-ing priced correlation risk. The strategy sells index straddles and buys individ-
ual straddles and stocks in order to hedge individual variance risk and stockmarket risk, respectively. This trading strategy offers an attractive risk-returntrade-off. Its Sharpe ratio is 77% higher than the one for bearing stock marketrisk in our sample. Correcting for standard risk factors, we find a large excessreturn of more than 10% per month. This is direct evidence of a large corre-lation risk premium. We demonstrate that this strategy has more attractiverisk-return properties than the option-based trading strategies that have beensuggested in the literature (like selling index puts or selling market variance),especially when considering higher moments of the return distributions. In aportfolio choice setting we find that the correlation strategy generates a utility
gain for a CRRA investor that is substantially larger than what can be ob-tained with existing option-based strategies (selling market variance or selling index puts).
Finally, we estimate the correlation risk premium from the cross-section of in-dex and individual option returns. Because of the large dispersion in their sensi-tivities to marketwide correlation shocks, these assets constitute a particularlywell-chosen cross-section. Furthermore, recent work has shown that expectedindex option returns are very large in absolute value and extremely challenging to explain (e.g., Bondarenko (2003a, 2003b), Buraschi and Jackwerth (2001),Coval and Shumway (2001), and Jones (2006)). We show that differences in
exposure to the correlation risk factor account for 70% of the cross-sectional variation in CAPM residuals of index and individual option returns. The es-timated correlation risk premium is large and highly significant. Exposure toindividual variance risk is not priced in this cross-section, in line with our otherresults.
6 The relevant literature includes A ıt-Sahalia and Kimmel (2005), Andersen, Benzoni, and Lund(2002), Bakshi and Kapadia (2003a), Bollerslev, Gibson, and Zhou (2004), Bondarenko (2004),Broadie, Chernov, and Johannes (2007), Buraschi and Jackwerth (2001), Carr and Wu (2004),Coval and Shumway (2001), Eraker, Johannes, and Polson (2003), Eraker (2004), Jones (2006),and Pan (2002). Bates (2003) surveys earlier work.
7
In fact, we obtain weak evidence of a positive variance risk premium in individual options,which strengthens the evidence of a correlation risk premium.

7/27/2019 The Price of Correlation Risk Evidence From Equity Options
http://slidepdf.com/reader/full/the-price-of-correlation-risk-evidence-from-equity-options 4/30
1380 The Journal of Finance R
In sum, our findings strongly suggest that correlation risk is priced.Merton’s ICAPM (1973b) may provide a theoretical explanation for this finding to the extent that marketwide correlation levels have predictive power for mar-ket variance. As an alternative hypothesis, the large correlation risk premium
we document may be interpreted as reflecting mispricing of index options dueto investor irrationality and lack of arbitrage. For example, some investors maybe overly cautious about correlation risk and this may lead to an irrationallyhigh correlation risk premium. Simultaneously, rational arbitrageurs may facemarket frictions, which prevent them from exploiting the high correlation riskpremium. To explore this limits-to-arbitrage hypothesis, we analyze the impacton the profitability and feasibility of our correlation trading strategy of marketfrictions in the form of transaction costs and margin requirements as in Santa-Clara and Saretto (2007). We show that transaction costs have an importantimpact on the profitability of the trading strategy. Its Sharpe ratio no longer
exceeds the equity Sharpe ratio and the optimal portfolio weight for the cor-relation strategy becomes statistically insignificant. The impact of transactioncosts on the correlation strategy is large because of the high bid-ask spreadsfor individual options. Furthermore, margin requirements make the correla-tion trading strategy infeasible for risk-tolerant investors, who stand to gainmost from the strategy. Thus, if the large correlation risk premium reflectsmispricing of index options, rational investors facing realistic market frictionscannot arbitrage the mispricing away and cannot exploit the correlation riskpremium.
Very few papers have studied trading strategies based on individual options.
A notable exception is Goyal and Saretto (2007), who analyze trading strate-gies using the cross-section of individual options and obtain very high Sharperatios. Their paper is complementary to ours, since they study in detail thecross-sectional predictability of individual option returns, while we focus onthe difference between index and individual option returns (without modeling the cross-sectional differences of individual stock options).
Our paper is also related to work on option-implied correlations. Severalarticles investigate the correlation structure of interest rates of different ma-turities. Longstaff, Santa-Clara, and Schwartz (2001), De Jong, Driessen, andPelsser (2004), and Han (2007) provide evidence that interest rate correlations
implied by cap and swaption prices differ from realized correlations. Collin-Dufresne and Goldstein (2001) propose a term structure model where bond re-turn correlations are stochastic. Campa and Chang (1998) and Lopez and Walter(2000) study the predictive content of implied correlations obtained from for-eign exchange options for future realized correlations between exchange rates.Skintzi and Refenes (2003) describe how index and individual stock options canbe used to find implied equity correlations for the Dow Jones Industrial Aver-age index. They study the statistical properties and dynamics of the impliedcorrelation measure with 1 year of data, but do not analyze the key implicationsfor index option pricing. In fact, none of these articles investigates or estimates
a risk premium on correlation risk. The negative correlation risk premium wefind implies higher expected correlation paths under the risk-neutral measure

7/27/2019 The Price of Correlation Risk Evidence From Equity Options
http://slidepdf.com/reader/full/the-price-of-correlation-risk-evidence-from-equity-options 5/30
The Price of Correlation Risk 1381
than under the actual measure. This divergence in expected correlations underthe two measures can explain why option-implied correlations exceed averagerealized correlations.
Finally, it is interesting to note that practitioners have recognized the possi-
bility of trading priced correlation risk, by implementing a strategy known as“dispersion trading.” This strategy typically involves short positions in indexoptions and long positions in individual options. Very recently, a new contractaimed at directly exploiting the correlation risk premium has been introduced,namely, the correlation swap.
The paper is organized as follows. Section I presents the general decom-position of index variance risk. The data are described in Section II. Sec-tion III provides empirical evidence on variance and correlation risk premia,based on the framework of Section I. Section IV develops and empiricallyimplements a correlation trading strategy. In Section V, we study whether
priced correlation risk can explain the empirical cross-section of option returns.Section VI discusses the impact of transaction costs and margin require-ments on the feasibility and profitability of the correlation trading strategy.Section VII concludes.
I. Understanding Market Variance Risk
We show in a general framework how market variance risk can be decom-posed into individual variance risk and correlation risk. The risk premium forbearing market variance risk can be similarly decomposed. This section also
briefly discusses the model-free implied variance estimator used in our empir-ical analysis in Section III.
A. The Determinants of Market Variance Risk
We study (priced) market variance risk from a new perspective by explicitlyacknowledging that market variance risk can be decomposed into individual
variance risk and correlation risk. Existing work does not entertain the possi-bility of priced correlation risk.
The stock market consists of N stocks. The price of stock i, Si, follows an Ito
process with instantaneous varianceφ2
i , which itself also follows an Ito process.8
The instantaneous correlation between Wiener processes Bi and B j that drivestocks i and j is
Et [dBi dB j ] = ρi j (t) d t, i = j . (1)
While we impose more structure on the dynamics of ρij(t) in Section IV, for nowwe only assume that ρij(t) follows an Ito process and that the conditions on φi(t)and ρij(t) for the resulting variance–covariance matrix to be positive-definiteare satisfied for all t.
8
We omit time as an argument for notational convenience throughout, except when placing particular emphasis.

7/27/2019 The Price of Correlation Risk Evidence From Equity Options
http://slidepdf.com/reader/full/the-price-of-correlation-risk-evidence-from-equity-options 6/30
1382 The Journal of Finance R
Given a set of index weights {wi}, the instantaneous index variance φ2 I
(t) attime t is
φ2 I (t)
=
N
i=1
w2i φ
2i (t)
+
N
i=1
j=i
wiw jφi(t)φ j (t)ρi j (t). (2)
It is clear from (2) that index variance changes are driven by shocks to bothindividual variancesφ2
i(t) and correlations ρij(t). We are interested in the extent
to which exposure to these shocks is priced. If the price of correlation risk isnegative (because states with higher-than-expected correlation are associatedwith a deterioration in investment opportunities and investor welfare), assetswith payoffs that covary positively with correlation provide a hedge againstunexpected correlation increases and earn negative excess returns relative towhat is justified by their exposure to standard risk factors. An index option
has by construction a large positive exposure to index-wide correlation riskand thus constitutes a prime example of such an asset. Formally, a negativecorrelation risk premium manifests itself in a higher drift for the instanta-neous correlation under the risk-neutral measure Q than under the physicalmeasure P, thus driving a wedge between expected correlations under the twodistributions. Intuitively, an index option will then seem expensive relative toa benchmark without priced correlation risk like Black–Scholes. The conceptof priced variance risk follows the same reasoning.
The total index variance risk premium is EQt [dφ2
I ]− E P
t [dφ2 I
].9 Given constant
index weights {wi} and defining ιi ≡ w2i + j=i wiw j
φ j
φiρi j , applying Ito’s lemma
to (2) shows that
EQt
dφ2
I
− E Pt
dφ2
I
= N i=1
ιi
E
Qt
dφ2
i
− E Pt
dφ2
i
+ N
i=1
j=i
wiw jφiφ j
E
Qt [dρi j ]− E P
t [dρi j ]. (3)
In words, the index variance risk premium reflects all individual variance
risk premia EQt [dφ2
i] − E P
t [dφ2i
], as well as correlation risk premia EQt [dρij]−
E Pt [dρij].10 The factor ιi multiplying the individual variance risk premium rep-
resents the contribution of stock i’s return variance to the index variance, scaledby its own variance. This is intuitive since the ιi’s are used as weights whensumming the individual variance risk premia to obtain their importance for theindex variance risk premium.
Below, we first present a detailed study of index and individual variance riskpremia, that is, the left-hand side and the first sum on the right-hand side of equation (3). This analysis provides indirect evidence on the importance of the
9 This definition represents the total variance risk premium, that is, including compensationfor market risk if variance shocks are correlated with market risk (the “leverage effect”). In the
empirical analysis, we correct for this in order to obtain the risk premium for “pure” variance risk.10 The simplifying assumption of constant index weights is innocuous. Simulations show that
allowing for stochastic index weights has a negligible impact on the empirical results with N = 100.

7/27/2019 The Price of Correlation Risk Evidence From Equity Options
http://slidepdf.com/reader/full/the-price-of-correlation-risk-evidence-from-equity-options 7/30
The Price of Correlation Risk 1383
final sum in equation (3), that is, on correlation risk premia. In particular, sincethe time-series average of ιi is empirically positive for all stocks that make upthe S&P100 index over our 8-year sample, any evidence of a negative index
variance risk premium and of nonnegative individual variance risk premia
implies a negative correlation risk premium. Subsequently, we test directly fora correlation risk premium by analyzing a correlation trading strategy andwe investigate empirically whether a common correlation risk factor and acommon individual variance risk factor can account for cross-sectional variationin option returns.
Before turning to the data description and the empirical results, we presentthe model-free methodology used to estimate variance risk premia.
B. Model-Free Implied Variances and Variance Risk Premia
Consider the risk-neutral expected integrated variance of the return on asseta ∈ { I , 1, . . . , i, . . . , N } over a discrete interval of length τ starting at time t:
σ 2a (t) = EQt
t+τ
t
φ2a (s) ds
. (4)
We follow the methodology of Britten-Jones and Neuberger (2000), Carr andMadan (1998), and Dumas (1995), who build on the work of Breeden and Litzen-berger (1978), to estimate the risk-neutral expected integrated variance σ 2a (t)defined in (4) from index options for a = I and from individual options for a = i.
As derived in Britten-Jones and Neuberger, their procedure gives the correctestimate of the option-implied (i.e., risk-neutral) integrated variance over thelife of the option contract when prices are continuous but volatility is stochastic,in contrast to the widely used, but incorrect, Black–Scholes implied volatility.Furthermore, Jiang and Tian (2005) show that the method also yields an ac-curate measure of the (total) risk-neutral expected integrated variance in a
jump-diffusion setting. The measure is therefore considered “model-free,” andcan be labeled the model-free implied variance ( MFIV ).
We denote the price of a τ -maturity call option on asset a with strike price K
at time t by Ca( K , t). The main result of Britten-Jones and Neuberger is thatthe risk-neutral expected integrated variance σ 2a (t) defined in (4) equals the
model-free implied variance, which is defined as
σ 2 M F ,a(t) ≡ 2
∞0
Ca( K , t)− max( S(t) − K , 0)
K 2dK . (5)
Jiang and Tian show that the integral over a continuum of strikes in (5)can be approximated accurately by a sum over a finite number of strikes. Fi-nally, Bollerslev et al. (2004), Bondarenko (2004), and Carr and Wu (2004)establish that the difference between the model-free implied variance andthe realized variance can be used to estimate the variance risk premium.
In particular, the null of a zero total variance risk premium implies azero difference between average realized and average model-free implied variance.

7/27/2019 The Price of Correlation Risk Evidence From Equity Options
http://slidepdf.com/reader/full/the-price-of-correlation-risk-evidence-from-equity-options 8/30
1384 The Journal of Finance R
Finally, it is noteworthy that MFIV equals the no-arbitrage variance swaprate. Equation (5) can therefore be used to synthetically create variance swapsfrom options across strikes K . This interpretation will prove useful in the sub-sequent tests in Section III.B.
II. Data Description
We use daily data from OptionMetrics for S&P100 index options and forindividual options on all the stocks included in the S&P100 index from January1996 until December 2003.11
The S&P100 is a value-weighted index with quarterly rebalancing. During our sample period, the new index shares for the quarter are fixed (unless thenumber of floating shares changes during the quarter by more than 5%) basedon the market values at the closing prices of the third Friday of the last month inthe previous quarter. In addition, 47 changes in the list of constituent companiestook place in our sample. These also occur on the rebalance dates. At eachrebalance date, we construct index component weights using market valuesbased on stock prices from CRSP. We keep these weights fixed until the nextrebalance date. This introduces a small discrepancy between actual S&P100daily weights and our fixed weights because the (actual) value-based weightsfluctuate daily due to price changes. As we have 100 companies in the index,any such discrepancy due to changes in prices is small and can be neglected forour purposes (see also footnote 10).
From the OptionMetrics database, we select all put and call options onthe index and on the index components. We work with best bid and askclosing quotes rather than the interpolated volatility surfaces constructed byOptionMetrics. In Sections III to V, we use the midquotes for these optiondata (average of bid and ask), and we assess the effect of bid-ask spreads inSection VI. We discard options with zero open interest, with zero bid prices,and with missing implied volatility or delta (which occurs for options with non-standard settlement or for options with intrinsic value above the current midprice). We focus on short-maturity options, which are known to trade most liq-uidly and consider all options with remaining maturity between 14 and 60days. When multiple maturities are available within this interval, we selectthe maturity that generates the largest average number of call and put op-
tions with matching strike prices (to enable us to construct straddles). We alsoeliminate options of extreme moneyness (Black–Scholes delta below 0.15 forcalls and above −0.05 for puts) as outliers, which filters out options with ex-tremely high implied volatilities. From Section III onwards, when constructing straddle returns and a cross-section of option returns, we eliminate calls andputs without a matching option of the other type for the straddle construction.The options are American-style. However, for short-maturity options, the earlyexercise premium is typically negligible. Using a binomial tree, we find that,
11 Interestingly, Standard and Poor’s mentions on its website that a requirement for companies
to be included in the S&P100 index is that they have listed options. This makes the S&P100 anatural index to consider for our study.
7/27/2019 The Price of Correlation Risk Evidence From Equity Options
http://slidepdf.com/reader/full/the-price-of-correlation-risk-evidence-from-equity-options 9/30
The Price of Correlation Risk 1385
indeed, this premium is between 0.3% and 1.1% of the 1-month option price forputs (depending on volatility and moneyness), and thus has a small impact onoption returns. For call options, the early exercise premium is zero with a con-tinuous dividend yield (which is an appropriate assumption for index options).
Santa-Clara and Saretto (2007) find that returns on American and Europeanindex options are very similar. Any early exercise premium in individual calloptions (due to discrete dividends) will actually bias against finding evidencefor a correlation risk premium, since our correlation strategy buys individualoptions (see Section IV) and because MFIV would be too high in this case forindividual options.
To construct the model-free implied variances, we require observations overtime and across strikes of prices of S&P100 index options and individual stockoptions. Across the strike dimension, we use out-of-the-money (OTM) options,namely, calls with Black–Scholes delta below 0.5 and puts with delta above
−0.5. We implement the model-free implied variance measure of Section I.Bfollowing the procedure in Jiang and Tian (2005), suitably adjusted for putoptions when needed.12 We calculate model-free implied variance on each dayfor each underlying that has at least three available options outstanding, withthe restriction that at least one put and call be included.
We use daily returns from CRSP for individual stocks and from OptionMetricsfor the S&P100 to estimate the realized variance. For each day, we calculate therealized variance over the same period as the one over which implied varianceis calculated for that day, that is, ranging from 14 to 60 days, requiring that nomore than 10 returns be missing from the sample. Since the window spans on
average 1 month, this means that we require on average at least 12 observationsout of 22 trading days.
We annualize both model-free and realized variance using 252 trading daysin a calendar year. We use the T-bill rate of appropriate maturity (interpolatedwhen necessary) from OptionMetrics as the risk-free rate.
III. Evidence on Variance and Correlation Risk Premia
Based on the general framework of Section I, we test for the presence of vari-ance risk premia in index options, in individual options on all constituent stocks,
and in the cross-section of individual variance swap returns. These tests areconducted using the model-free implied variance of Section I.B. In light of thegeneral decomposition of index variance risk in equation (3), this analysis pro-
vides indirect evidence on the importance of priced correlation risk. Section IV presents direct evidence of a risk premium on correlation risk by developing
12 One subtlety regarding the index weights emerges. If the expiration of the index option occursafter the next rebalance date, the index variance will reflect both the “old” and the “new” indexweights. We calculate the projected weights of the index components using current market values.Moreover, in the period between rebalance dates there may be announcements of deletions fromand additions to the index, which take effect at the next rebalance. We incorporate this migration
in the projected weights. We weight the old fixed weights and the new projected weights using therelative time to maturity of the index option before the rebalance date and after the rebalance date.

7/27/2019 The Price of Correlation Risk Evidence From Equity Options
http://slidepdf.com/reader/full/the-price-of-correlation-risk-evidence-from-equity-options 10/30
1386 The Journal of Finance R
and implementing a simple option-based trading strategy that exploits pricedcorrelation risk. Finally, in Section V we test whether correlation and individ-ual variance risk is priced in a well-chosen cross-section of assets (individualand index options).
A. Implied versus Realized Variances
The recent empirical literature on equity options primarily studies indexoptions. Individual options have attracted much less attention. The major-ity of the recent work on individual options focuses on Black–Scholes implied
volatility functions (Bakshi and Kapadia (2003b), Bakshi et al. (2003), Bollenand Whaley (2004), Branger and Schlag (2004), Dennis and Mayhew (2002),Dennis et al. (2006), and Garleanu et al. (2005)). A common finding is thatimplied volatility functions are flatter for individual options than for index op-
tions. While implied volatility functions provide very interesting information,they do not permit a formal test of the presence of variance risk premia. Thissection presents such a formal test, based on the model-free methodology de-scribed in Section I.B. Moreover, our OptionMetrics sample is more recent andspans 8 years (January 1996 up until December 2003) and includes optionson all stocks that were included in the S&P100 over that period. Carr andWu (2004) also use OptionMetrics and a related methodology, but focus on asubsample of 35 individual options.
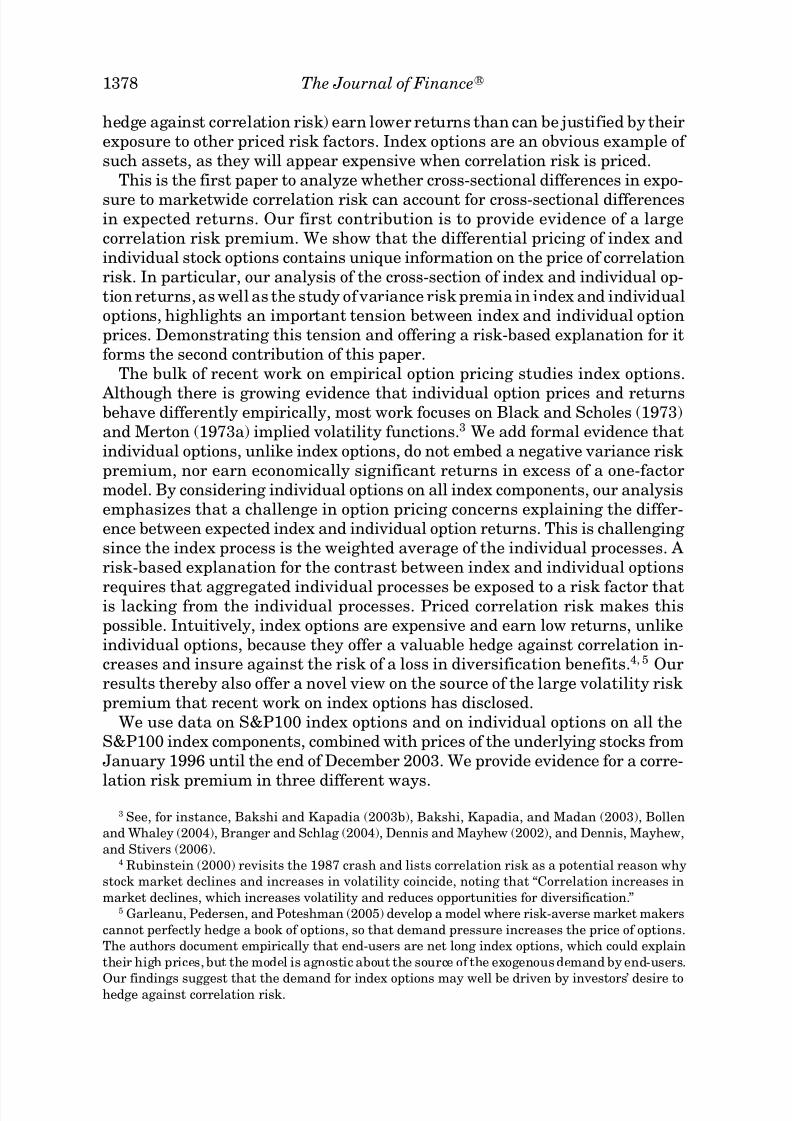
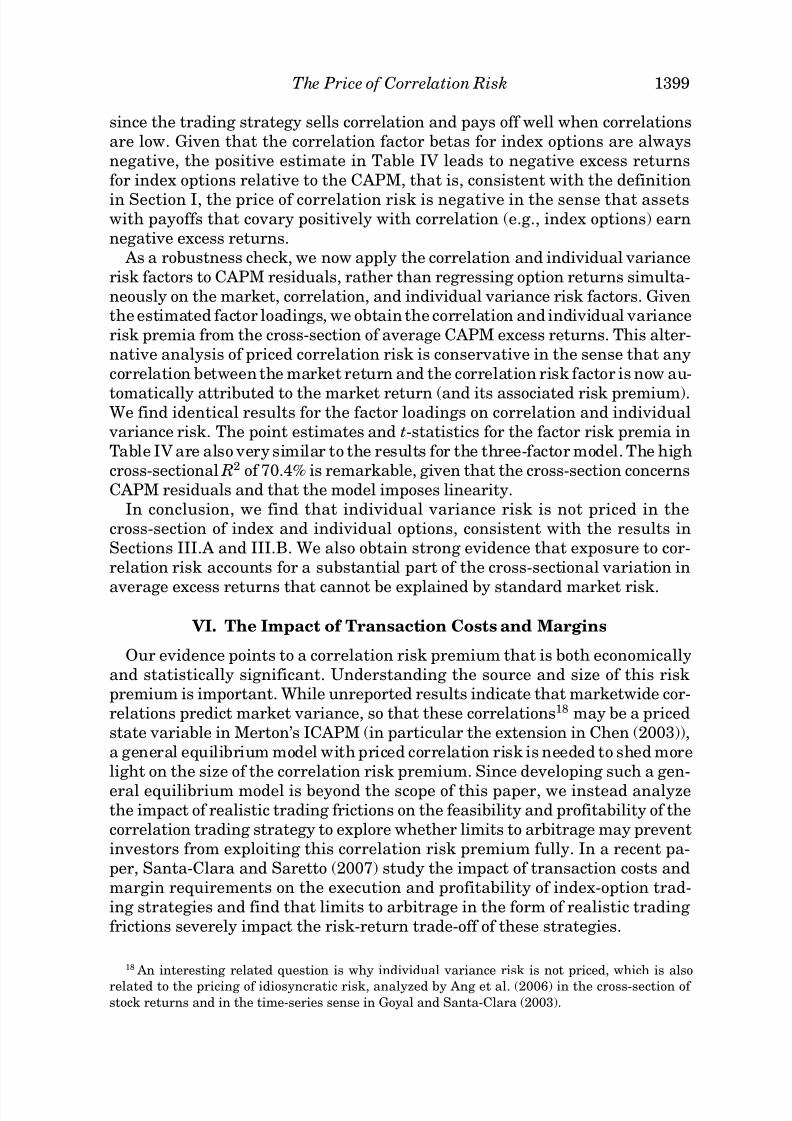
We start with the index variance. Figure 1 plots the time series of (the squareroot of) the implied index variance and of (the square root of) the realized histor-
ical variance. The well-established finding that option-implied index varianceis higher than realized index variance also holds for our recent sample. Whileall calculations are done for variances, we take square roots of the computed
variances for interpretation purposes. Table I reports an average (annualized)realized index volatility of 20.80%, while the MFIV average is 24.69%. The nullhypothesis that implied and realized index variance are on average equal is verystrongly rejected, based on a t-test with Newey and West (1987) autocorrelationconsistent standard errors for 22 lags (t-statistic of 6.81).
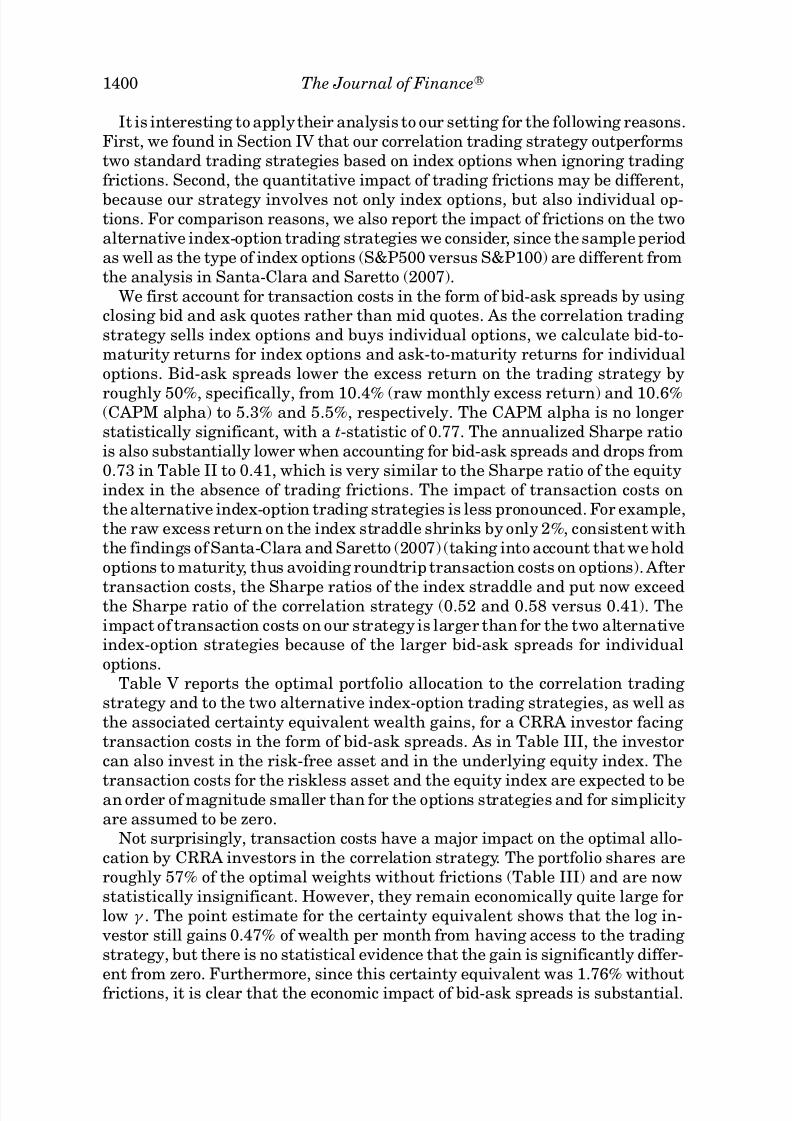
Turning to the equally weighted average of the individual variances inFigure 2, there is, quite remarkably, less systematic difference between the two
volatility proxies. On average, the square root of realized variance (41.44%) ac-tually exceeds the square root of implied variance (38.97%). The null hypothesisthat, on average across all stocks in the index, the implied and realized varianceare equal is rejected (t-statistic of 3.2), which suggests a significantly positive
variance risk premium in individual options. However, when conducting thetest in ratio form the null that R V
M F I V = 1 is only marginally rejected at the 5%
confidence level. More importantly, carrying out the test for all stocks individ-ually, the null of a zero variance risk premium ( RV = MFIV ) is not rejected atthe 5% confidence level for 98 stocks out of the 127 stocks that are included inthe sample for this analysis. Of the remaining 29 stocks, only seven exhibit a
significant positive difference between implied and realized variance. We there-fore find no evidence for the presence of a negative variance risk premium in
7/27/2019 The Price of Correlation Risk Evidence From Equity Options
http://slidepdf.com/reader/full/the-price-of-correlation-risk-evidence-from-equity-options 11/30
The Price of Correlation Risk 1387
Jan96 Jan97 Jan98 Jan99 Jan00 Jan01 Jan02 Jan03 Jan040.05
0.1
0.15
0.2
0.25
0.3
0.35
0.4
0.45
0.5
V o l a t i l i t y
Implied Volatility
Realized Volatility
Figure 1. Implied versus realized volatility for index options. The figure presents the timeseries of the square root of the model-free implied index variance and of the square root of therealized variance over our 1/1996 to 12/2003 OptionMetrics sample. The model-free implied index variance is calculated from a cross-section (across strikes) of 1-month options on the S&P100,using the methodology of Britten-Jones and Neuberger (2000) and Jiang and Tian (2005) describedin Section I.B. Realized variance is calculated from daily index returns over a 1-month window. Variances are expressed in annual terms.
individual stock options. If anything, there is weak evidence of a positive riskpremium for variance risk in individual options.
This is quite surprising, given the well-known empirical regularity for indexoptions. Bakshi and Kapadia (2003b) find a difference of 1% to 1.5% (depending on the treatment of dividends) between the average implied and the averagehistorical volatility in their 1991 to 1995 sample of 25 individual stock options.They also stress that the difference is smaller than for index options. The dis-crepancy between our results and theirs may not only reflect the difference insample, but also the difference in methodology to calculate the option-implied
variance. Bollen and Whaley (2004) also report that the average deviationbetween (Black–Scholes) implied volatility and realized volatility is approxi-mately zero for the 20 individual stocks in their sample. Finally, Carr and Wu(2004) use a similar methodology to ours and also report much smaller average
variance risk premia for individual stocks than for S&P indices. The mean vari-ance risk premia are insignificant for 32 out of the 35 individual stocks theystudy.13
13 Carr and Wu (2004) also report that estimates of mean log variance risk premia are signif-icantly negative for 21 out of 35 individual stocks. However, mean log variance risk premia are
expected to be negative (because of Jensen ’s inequality), even under the null of a zero variance riskpremium, and thus lead to a biased test.

7/27/2019 The Price of Correlation Risk Evidence From Equity Options
http://slidepdf.com/reader/full/the-price-of-correlation-risk-evidence-from-equity-options 12/30
1388 The Journal of Finance R
Table I
Variance Risk Premia in Index and Individual Options
The table reports the time-series averages of realized and model-free implied variances, for S&P100options and for individual options on the stocks in the S&P100 index over the 1/1996 to 12/2003
sample period. For individual options the variances are equally weighted cross-sectional averagesacross all constituent stocks. Realized variance RV is calculated from daily returns over a 1-monthwindow. The model-free implied variance MFIV is calculated from a cross-section (across strikes) of 1-month options, using the methodology of Britten-Jones and Neuberger (2000) and Jiang and Tian(2005) described in Section I.B. The data on option prices are from OptionMetrics and variancesare expressed in annual terms. The p-values, based on Newey and West (1987) autocorrelationconsistent standard errors with 22 lags, are for the null hypothesis that implied and realized variance are on average equal ( RV = MFIV and RV / MFIV = 1).
Index Options Individual Options
Mean Realized Variance 0.20802 0.41442
Mean Model-Free Implied Variance 0.24692 0.38972
Difference √ RV −√ MFIV −0.0389 0.0247 p value for H 0 : RV − MFIV = 0 0.0000 0.0014
p value for H 0 : RV MFIV
− 1 = 0 0.0000 0.0485
Individual Tests of Variance Risk Premia # Stocks
H 0 : RV − MFIV = 0 not rejected 98 H 0 : RV − MFIV ≤ 0 rejected 22 H 0 : RV − MFIV ≥ 0 rejected 7
These findings provide indirect evidence of a negative correlation risk pre-
mium. As can be seen from equation (3), when individual variance risk is notpriced (or carries a positive risk premium), index variance risk only carries anegative risk premium to the extent that the price of correlation risk is negative.Our results strongly suggest that this is the case.
B. The Cross-section of Individual Variance Swap Returns
We find that the total individual variance risk premium in individual optionsis not significantly negative for almost all index components. To gain further
insight into this important result, we study cross-sectional pricing of individual variance risk in stock options. This analysis complements the approach aboveand investigates explicitly whether exposure of individual variances to marketrisk or to a common variance factor is priced in individual options.
We consider the cross-section of returns on synthetic individual varianceswaps, which are natural assets to consider for a study of priced variance risk.Each variance swap can be synthetically created from a cross-section of optionson the underlying stock.
Denoting the realized return variance of asset a from t to t + τ by RV a(t) ≡
t+τ
tφ2
a (s) d s and using the model-free implied variance MFIV a(t) ≡ σ 2 MF ,a(t) de-fined in Section I.B, the return on a variance swap from t to t
+τ is r
a(t)≡ RV a(t)
MFIV a(t) − 1 (Bondarenko (2004) and Carr and Wu (2004)). The variance swap

7/27/2019 The Price of Correlation Risk Evidence From Equity Options
http://slidepdf.com/reader/full/the-price-of-correlation-risk-evidence-from-equity-options 13/30
The Price of Correlation Risk 1389
Jan96 Jan97 Jan98 Jan99 Jan00 Jan01 Jan02 Jan03 Jan040.2
0.3
0.4
0.5
0.6
0.7
0.8
0.9
1
V o l a t i l i t y
Implied Volatility
Realized Volatility
Figure 2. Cross-sectional average of implied versus realized volatility for individual
options. The figure presents the time series of the (equally weighted) cross-sectional average of the square root of the model-free implied individual stock variance and of the square root of therealized individual stock variance over our 1/1996 to 12/2003 OptionMetrics sample. For each stockin the S&P100 index, the model-free implied variance is calculated from 1-month options, using the methodology of Britten-Jones and Neuberger (2000) and Jiang and Tian (2005) described inSection I.B. Realized variance is calculated from daily CRSP stock returns over a 1-month window.
Variances are expressed in annual terms. Because of migrations, a total of 135 individual stocksare considered over the entire 8-year sample period.
return is driven by unexpected variance shocks and on average reflects the variance risk premium. We construct the time series of 1-month variance swapreturns for all stocks with at least 18 monthly observations during the sampleperiod, approximating RV a(t) ≡ t+τ
tφ2
a (s) d s using daily return observations.To enhance the practical feasibility of the variance swap as a (synthetically)tradable instrument, we focus on monthly observations, selecting options that
have 1 month to maturity, and construct a time series of non-overlapping re-turns. As factors to explain the cross-section we consider the excess return on the
market (proxied by S&P100) and a common individual variance component.The latter is calculated as the cross-sectional weighted average (using indexweights) of the returns on individual variance swaps
N i=1 wiri(t). We follow
the standard two-step procedure, estimating first the factor loadings and thenregressing average returns on factor loadings to estimate factor risk premia.
We find that exposure to market risk does not explain the cross-section of individual variance swap returns, as almost all of the first-step betas are sta-
tistically insignificant. The common individual variance risk factor N
i=1 wiri(t)is also not priced in individual options; the individual variance risk premium

7/27/2019 The Price of Correlation Risk Evidence From Equity Options
http://slidepdf.com/reader/full/the-price-of-correlation-risk-evidence-from-equity-options 14/30
1390 The Journal of Finance R
is found to be insignificant. The point estimate is actually positive (0.077 witha t-statistic of 1.74), which is in line with the finding above that realized indi-
vidual variance exceeds option-implied variance. Including both factors simul-taneously leads to the same finding.
In sum, covariance of individual variance shocks with either market riskor with a systematic individual variance risk factor does not command a riskpremium in individual options, consistent with the results in the previous sub-section. Combined with the finding of priced market variance risk in indexoptions, this provides more indirect evidence of priced correlation risk.
IV. Risk and Return of a Correlation Trading Strategy
Motivated by the results of a significantly negative risk premium for index variance risk, but not for individual variance risk, we now explicitly examine
whether exposure to correlation risk is priced. We do this by constructing atrading strategy that only loads on correlation risk. Examining the risk-returnproperties of this trading strategy provides direct evidence on the extent towhich correlation risk carries a risk premium that cannot be explained by ex-posure to standard risk factors.
A. Trading Correlation Risk
We derive a correlation trading strategy based on the general framework of Section I and make some additional simplifying assumptions allowing us to
implement the trading strategy empirically.First, we assume that a single state variable ρ(t) drives all pairwise correla-
tions in (1):
ρi j (t) = ρi jρ(t). (6)
This is a natural assumption, given our interest in priced correlation risk. If therisk of correlation changes carries a risk premium, we expect this to be compen-sation for the risk of marketwide correlation changes. The specific process for ρ
can be left unspecified, except that dρ − E[dρ] = σ (ρ) dBρ , where the Brownianmotion dBρ may be correlated with other risk factors, and suitable conditions
on σ (ρ) and the drift of ρ such that the resulting variance–covariance matrixbe positive-definite are assumed to be satisfied. As a second simplification, weassume an equally weighted stock market index, that is, I = 1
N
N i=1 Si, when
initiating the trading strategy.Each stock’s instantaneous variance φ2
i(t) follows an Ito process, with diffu-
sion term ς i(φi) dBφi:
dφ2i − E
dφ2
i
= ς i(φi) dBφi. (7)
Denoting the price of an at-the-money (ATM) straddle on asset a ∈
{ I , 1, . . . , i, . . . , N } by Oa (i.e., the sum of the put price and call price), we focuson unexpected straddle returns:
7/27/2019 The Price of Correlation Risk Evidence From Equity Options
http://slidepdf.com/reader/full/the-price-of-correlation-risk-evidence-from-equity-options 15/30
The Price of Correlation Risk 1391
dOi
Oi
− E
dO
Oi
= Si
Oi
∂Oi
∂ Si
φidBi +1
Oi
∂Oi
∂φ2i
ς i(φi) dBφi(8)
and
dO I
O I
− E
dO I
O I
=
N i=1
Si
O I
∂O I
∂ Si
φi dBi + N
i=1
1
O I
∂O I
∂φ2i
ς i(φi) dBφi+ 1
O I
∂O I
∂ρσ (ρ) dBρ .
(9)
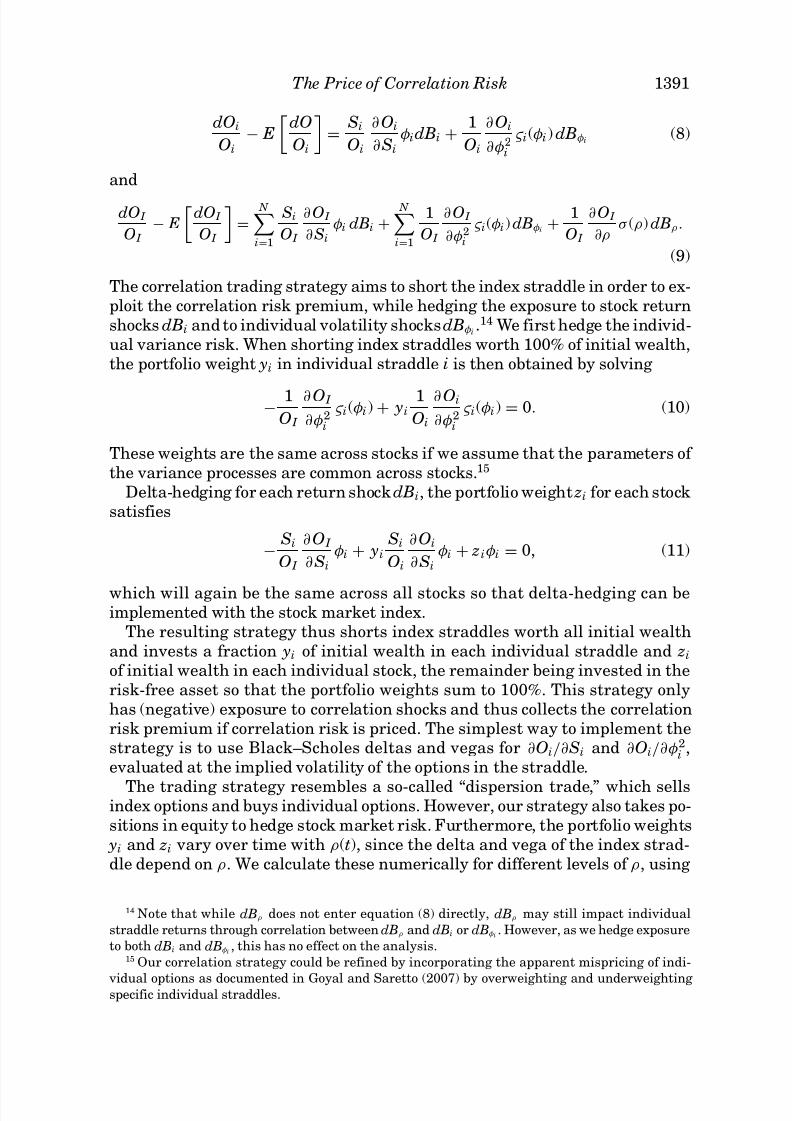
The correlation trading strategy aims to short the index straddle in order to ex-ploit the correlation risk premium, while hedging the exposure to stock returnshocks dBi and to individual volatility shocks dBφi
.14 We first hedge the individ-ual variance risk. When shorting index straddles worth 100% of initial wealth,the portfolio weight yi in individual straddle i is then obtained by solving
− 1O I
∂O I
∂φ2i
ς i(φi)+ yi1
Oi
∂Oi
∂φ2i
ς i(φi) = 0. (10)
These weights are the same across stocks if we assume that the parameters of the variance processes are common across stocks.15
Delta-hedging for each return shock dBi, the portfolio weight zi for each stocksatisfies
− Si
O I
∂O I
∂ Si
φi + yi
Si
Oi
∂Oi
∂ Si
φi + ziφi = 0, (11)
which will again be the same across all stocks so that delta-hedging can beimplemented with the stock market index.
The resulting strategy thus shorts index straddles worth all initial wealthand invests a fraction yi of initial wealth in each individual straddle and zi
of initial wealth in each individual stock, the remainder being invested in therisk-free asset so that the portfolio weights sum to 100%. This strategy onlyhas (negative) exposure to correlation shocks and thus collects the correlationrisk premium if correlation risk is priced. The simplest way to implement thestrategy is to use Black–Scholes deltas and vegas for ∂Oi/∂ Si and ∂Oi/∂φ
2i
,evaluated at the implied volatility of the options in the straddle.
The trading strategy resembles a so-called “dispersion trade,” which sellsindex options and buys individual options. However, our strategy also takes po-sitions in equity to hedge stock market risk. Furthermore, the portfolio weights
yi and zi vary over time with ρ(t), since the delta and vega of the index strad-dle depend on ρ. We calculate these numerically for different levels of ρ, using
14 Note that while dBρ does not enter equation (8) directly, dBρ may still impact individualstraddle returns through correlation between dBρ and dBi or dBφi
. However, as we hedge exposureto both dBi and dBφi
, this has no effect on the analysis.15 Our correlation strategy could be refined by incorporating the apparent mispricing of indi-
vidual options as documented in Goyal and Saretto (2007) by overweighting and underweighting specific individual straddles.

7/27/2019 The Price of Correlation Risk Evidence From Equity Options
http://slidepdf.com/reader/full/the-price-of-correlation-risk-evidence-from-equity-options 16/30
1392 The Journal of Finance R
Table II
Summary Statistics for the Correlation Trading Strategy, Underlying
S&P100 Index and Other Option-Based Trading Strategies
The table reports summary statistics for the correlation trading strategy analyzed in Section IV.B.
All results are based on non-overlapping monthly returns on options and the equity index for our1/1996 to 12/2003 sample period. The correlation trading strategy is constructed using the equityindex, index straddles, and individual straddles. The underlying index is the S&P100. The indexput is an equally weighted portfolio of 1-month index put options with Black–Scholes deltas ranging from −0.8 to −0.2. All statistics are monthly, except the Sharpe ratios, which are annualized.
Strategy Corr. Strategy S&P100 Index Short Index Straddle Short Index Put
Excess Return 0.1037 0.0068 0.1187 0.3178Standard Dev. 0.4904 0.0574 0.6397 1.7419Skewness −0.2784 −0.0581 −1.0837 −3.2627Kurtosis 3.1529 4.0644 4.4110 16.6672 Ann. Sharpe 0.7325 0.4134 0.6429 0.6371CAPM α 0.1059 0.1107 0.1630t-stat (1.96) (1.47) (1.79)CAPM β 0.0282 0.0557 15.8347t-stat (0.02) (0.03) (5.46)
1-month average lagged historical correlations as an estimate for ρ at eachpoint in time. For each pair of stocks, we calculate the historical correlationat time t over a 1-month window, imposing the same requirements as for thecalculation of realized variances. The historical pairwise correlations can then
be aggregated into a cross-sectional weighted average across all pairs of stocks,using the appropriate weights from the S&P100 index.
B. Empirical Results
Implementing the correlation trading strategy empirically, we find that itsportfolio weight in individual straddles according to equation (10), aggregatedacross all index components, equals on average 101.12% of initial wealth.By construction the strategy also sells 100% of initial wealth worth of indexstraddles, while the fraction invested in the stock index (from equation (11))
is −32.54% of initial wealth. The remaining 131.42% is invested in the risk-less asset. Shorting 100% of index straddles and buying 101.12% of individualstraddles corresponds on average to buying 0.58 individual straddles (aggre-gated across all stocks) per shorted index straddle, when normalizing the initial
value of all underlying assets (the index as well as its components) to one.Table II reports the first four moments for the trading strategy return in
excess of the risk-free rate, estimated from monthly non-overlapping returns of holding options to their maturity date. The excess return is 10.37% per monthand the annualized Sharpe ratio is 0.73. Compared to the annualized Sharperatio for the S&P100 index itself (0.41 over the sample period), the Sharpe
ratio on the trading strategy is 77% higher. Although theoretically speaking the trading strategy is hedged against return and volatility shocks and only

7/27/2019 The Price of Correlation Risk Evidence From Equity Options
http://slidepdf.com/reader/full/the-price-of-correlation-risk-evidence-from-equity-options 17/30

7/27/2019 The Price of Correlation Risk Evidence From Equity Options
http://slidepdf.com/reader/full/the-price-of-correlation-risk-evidence-from-equity-options 18/30
1394 The Journal of Finance R
correlation trading strategy return has less kurtosis in our sample than theunderlying index return itself.
The risk-adjusted excess returns for the alternative strategies are also inter-esting. While the CAPM alpha for the index straddle is similar in magnitude
to the alpha for the correlation trading strategy and is somewhat higher forthe index put, the estimates are noisier and the alphas are insignificant witha t-statistic of 1.47 for the straddle and 1.79 for the index put. This finding isrobust to correcting for additional risk factors (size, value, momentum, and/orliquidity risk). Intuitively, it is straightforward to understand the difference be-tween the results for the index straddle and the correlation strategy. By adding individual straddles to the index straddle the correlation strategy hedges outthe individual variance risk. Since individual variance risk has a negligible riskpremium, both strategies have similar alphas, but the correlation strategy haslower risk leading to a higher t-statistic for its alpha. Further, by shorting in-
dex straddles and buying individual straddles, part of the gamma of the optionposition is neutralized, which explains why the correlation strategy has lowerskewness and kurtosis than the short index straddle.
The analysis of alphas and Sharpe ratios above neglects the considerable de-gree of skewness and kurtosis often exhibited by option strategies. We thereforeconsider the portfolio choice problem of a CRRA investor, because CRRA pref-erences penalize for negative skewness and high kurtosis (in contrast to mean-
variance preferences). Specifically, we estimate the optimal portfolio weightsin the derivatives-based trading strategies for a CRRA investor with a 1-monthhorizon, who can also invest in the underlying equity index and in the risk-free
asset. Based on these portfolio weights, we also report the certainty equiv-alent wealth that this investor, when already investing in the market indexand the riskless asset, is willing to pay in order to gain access to the correlationtrading strategy. Table III reports the results, starting with the certainty equiv-alents for the two alternative strategies, namely, the short index straddle andthe short index put. The alternative strategies generate certainty equivalentwealth gains of 1.29% and 0.77% per month, respectively, for an investor withγ = 1, illustrating the attractiveness of these strategies. For this coefficient of risk aversion, the certainty equivalent for the correlation trading strategy is36% higher than for the index straddle and 129% higher than for the index
put. For any level of risk aversion considered in Table III, we find certaintyequivalents for the correlation strategy that exceed the certainty equivalentsfor the short index straddle by at least 26% and for the short index put by atleast 49%. While the derivatives weights are statistically insignificant for bothalternative strategies (t-statistics between 1.28 and 1.68), the portfolio weightsfor the correlation strategy are substantially larger and (marginally) statis-tically significant, with t-statistics between 1.88 and 1.99 (depending on riskaversion). For example, an investor with γ = 2 invests 18.85% of his wealth inthe correlation strategy. Given that the S&P 100 index options are defined on$100 times the index value, an investor with $100,000 of financial wealth would
sell 5.89 index straddles to implement the correlation strategy (on average overthe 1996 to 2003 sample period).

7/27/2019 The Price of Correlation Risk Evidence From Equity Options
http://slidepdf.com/reader/full/the-price-of-correlation-risk-evidence-from-equity-options 19/30
The Price of Correlation Risk 1395
Table III
Correlation Trading Strategy: Portfolio Weights and Certainty
Equivalents for a CRRA Investor
The table reports the optimal empirical portfolio weights (and t-statistics) of a CRRA investor in
derivatives-based trading strategies obtained by maximizing in-sample expected utility. The in- vestor also invests in the underlying equity index and in the risk-free asset (these weights are notreported in the table). The monthly certainty equivalent is the percentage of initial wealth that aCRRA investor demands as compensation for not being able to invest in a particular derivatives-based strategy and instead only investing in the equity index and the risk-free asset. Three deriva-tive strategies are considered: a short position in the index straddle, a short position in the indexput, and the correlation trading strategy. The certainty equivalents are estimated using the op-timal CRRA portfolio weights over the 1/1996 to 12/2003 sample period, for different levels of risk aversion γ . The value of γ = 1.8 generates (approximately) a 100% equity index weight whenderivatives are not available.
Risk Aversion γ 1 2 5 10 20 1.8
Short Index StraddlePortfolio weight 0.2113 0.1182 0.0502 0.0255 0.0129 0.1298t-stat (1.68) (1.62) (1.58) (1.55) (1.55) (1.63)Cert. Equiv. 1.2910% 0.7240% 0.3079% 0.1569% 0.0792% 0.7948%
Short Index PutPortfolio weight 0.1208 0.0772 0.0353 0.0184 0.0094 0.0836t-stat (1.28) (1.31) (1.29) (1.29) (1.29) (1.31)Cert. Equiv. 0.7659% 0.5249% 0.2483% 0.1308% 0.0671% 0.5644%
Correlation StrategyPortfolio weight 0.3475 0.1885 0.0782 0.0395 0.0199 0.2078t-stat (1.99) (1.92) (1.89) (1.88) (1.88) (1.93)
Cert. Equiv. 1.7558% 0.9477% 0.3934% 0.1988% 0.0999% 1.0451%
The final column (γ = 1.8) of Table III is of particular interest. It considers theinvestor who optimally holds the market (equity weight of approximately 100%)when derivatives are not available. This investor’s optimal portfolio weight inthe correlation strategy and the corresponding gain in certainty equivalentwealth provide quantitative measures of the extent to which the observed risk-return trade-off of the strategy could arise in an equilibrium with a CRRA representative investor (if the optimal weight is zero), or instead, of whether
the correlation risk premium represents a “good deal” (Santa-Clara and Saretto(2007)). The investor stands to gain 1.05% of initial wealth per month from thecorrelation strategy (31% and 85% higher than for the index straddle and put,respectively), based on an optimal correlation-strategy weight of 21% of initialwealth (t-statistic of 1.93) and a positive (but insignificant) equity weight. It isclear that the risk-return trade-off of the correlation trading strategy is a gooddeal for a γ = 1.8 investor and could not arise in a simple no-trade equilibriumwith this CRRA investor as representative agent.
Overall, the results for the correlation trading strategy indicate that the com-pensation for bearing correlation risk is substantial. The risk-return trade-off
is considerably more generous than what can be obtained with short positionsin index puts or in market variance.

7/27/2019 The Price of Correlation Risk Evidence From Equity Options
http://slidepdf.com/reader/full/the-price-of-correlation-risk-evidence-from-equity-options 20/30
1396 The Journal of Finance R
V. The Cross-section of Individual and Index Option Returns
We now examine whether a correlation risk factor can account for cross-sectional variation in index and individual option returns. A cross-section of
index and individual options is an ideal testing ground for this hypothesis,since returns on index options are driven by index variance shocks and thus bycorrelation shocks, while individual option returns are likely to be much lessdependent on correlation shocks. We use the return on the trading strategydeveloped above as a correlation risk factor to explain the cross-section of ex-pected index and individual option returns. Our test procedure is identical tostandard procedures used in asset pricing to test for the presence of priced riskfactors, and avoids the need for specific parametric modeling assumptions thatare otherwise needed when testing option pricing models. Rather than devel-oping a specific model of priced correlation risk, we test a generic predictionshared by all option pricing models with priced correlation risk, namely, thatdifferences in exposure to correlation risk justify differences in expected re-turns. Simultaneously, we also test whether individual variance risk is priced,complementing earlier analyses in the paper.
Our cross-section contains 24 short-maturity options and is constructed asfollows. We include both calls and puts and consider three different moneynessranges, with deltas ranging from −0.8 to −0.2 for puts and from 0.2 to 0.8for calls.16 This results in six index options and six (portfolios of ) individualoptions. To obtain a larger cross-section, we further divide each individual op-tion portfolio into three volatility categories by sorting options on the implied
volatility of their underlying asset, resulting in 18 portfolios of stock options.Sorting individual options on volatility to construct a cross-section of optionreturns is natural since the volatility risk premium is in many option-pricing models a function of the volatility level. We calculate non-overlapping monthlyoption returns as holding-period returns, that is, the return at time t + τ onan option written at t is given by the option payoff at maturity (t + τ ) dividedby the option price at t. Within each delta-volatility portfolio, we average theindividual option returns cross-sectionally using the index weights for each day.
We use the standard two-step procedure for cross-sectional asset pricing,estimating first the factor loadings for all assets and then regressing aver-age returns cross-sectionally on these loadings to obtain factor risk premia.
The standard errors for the cross-sectional regression are calculated with themethodology of Shanken (1992) to correct for the estimation error in the first-step betas. We start by testing the CAPM, with the excess return on the market(proxied by the S&P100) as a factor. The S&P100 is arguably a narrow defini-tion of the market, but natural for our setting as it is the underlying asset forthe index options we study.
16 We categorize options according to Black–Scholes deltas rather than strike-to-spot ratios toensure that the individual and index options are comparable in terms of economic moneyness. The
strike-to-spot ratio of an index option cannot easily be compared with the one of individual options,as the underlying assets obviously have very different volatilities, for example.

7/27/2019 The Price of Correlation Risk Evidence From Equity Options
http://slidepdf.com/reader/full/the-price-of-correlation-risk-evidence-from-equity-options 21/30
The Price of Correlation Risk 1397
A. CAPM Results
For index options, the CAPM betas range from −17 to 22 and are all highlysignificant. The betas for individual options are somewhat smaller (ranging
from −16 to 15), but also very significant. Consistent with existing empiricalwork, a one-factor pricing model like the CAPM generates very large mispricing for index options, with time-series alphas of up to −31% per month and cross-sectional alphas of up to −30% per month. All alphas are negative for indexoptions and average −17% per month. While the alphas are all economicallysignificant, options returns are quite noisy resulting in only two significanttime-series alphas (out of six) and three significant cross-sectional alphas.
For individual options, the results are quite different. No time-series or cross-sectional alpha is significant, even though the formation of portfolios (withaveraging of individual option returns across more than 30 stocks) would beexpected to lead to more precise estimates for individual options than for in-dex options. Economically speaking, the contrast between index and individualoptions is clear: While the average index-option alpha is −17% per month, theaverage individual-option alpha is much smaller (−3.55%).
In summary, unlike for index options, the CAPM does quite well for individualoptions and we find no statistical evidence against it. This is consistent withour earlier findings of an insignificant difference between average realized andaverage risk-neutral variance for 98 out of the 127 stocks (Section III.A) andof an insignificant variance risk premium in the cross-section of individual
variance swap returns (Section III.B).17
B. Results for Correlation and Individual Variance Risk Factors
We now add the correlation and individual variance risk factors to the CAPMand estimate a three-factor model. The return on the correlation trading strat-egy is taken as the correlation risk factor. For the individual variance risk factor,we use the return on the index-weighted portfolio of individual straddles.
In the first-step time-series regressions of option returns, we find very sim-ilar market betas as for the CAPM. All index option returns exhibit large andsignificantly negative loadings on the correlation risk factor. The correlationbetas range from
−0.36 (ITM index call) to
−1.61 (OTM index call), with an av-
erage of −0.96. All index options have correlation betas with t-statistics above5.35 in absolute value. Individual options have smaller correlation loadings,with an average of −0.24. Only 6 out of 18 individual-option portfolio returnshave significant correlation betas. In contrast, index and individual optionsexhibit similar sensitivities to individual variance risk, with loadings between0.42 and 1.89 (average of 1.07) for index options and between 0.07 and 1.63 forindividual options (average of 0.73). All but three are statistically significant.
17 Bollen and Whaley (2004) present simulated returns of a delta-hedged trading strategy thatshorts options (on the S&P500 and on 20 individual stocks). Unlike for index options, they find
small abnormal returns for stock options, in line with our results for a larger sample (all stocks inthe index) and using a different methodology.

7/27/2019 The Price of Correlation Risk Evidence From Equity Options
http://slidepdf.com/reader/full/the-price-of-correlation-risk-evidence-from-equity-options 22/30
1398 The Journal of Finance R
Table IV
The Cross-section of Index and Individual Option Returns
The top panel (Three-Factor Model) of the table reports estimates for the risk premia on marketrisk, correlation risk, and individual variance risk, obtained from a cross-sectional regression of the
average monthly excess returns on 24 index and individual options on their exposures to marketrisk, correlation risk, and individual variance risk. The exposures are estimated in a first step,regressing the time series of each excess option return on the market (S&P100) excess return, onthe correlation trading strategy excess return (Table II), and on the excess return on a portfolioof individual straddles (mimicking individual variance risk). The bottom panel (Two-Factor Model Applied to CAPM Residuals) of the table reports estimates for the risk premia on correlation riskand individual variance risk, obtained from a cross-sectional regression of the average monthlyexcess returns on 24 index and individual options on their exposures to correlation risk and indi- vidual variance risk. The exposures are estimated in a first step, regressing the time series of eachexcess option return on the excess return on the correlation trading strategy and on the excessreturn on a portfolio of individual straddles. The option returns in the Two-Factor Model are all inexcess of the CAPM-predicted return, using the S&P100 index return as market factor. The tablereports t-statistics as in Shanken (1992) and the cross-sectional R2.
Three-Factor Model
Market Risk Premium 0.0120(t-stat) (1.87)Correlation Risk Premium 0.1751(t-stat) (2.56)Individual Variance Risk Premium 0.0078(t-stat) (0.16)
Cross-sectional R2 89.2%
Two-Factor Model Applied to CAPM Residuals
Correlation Risk Premium 0.1726(t-stat) (2.56)Individual Variance Risk Premium 0.0072(t-stat) (0.15)
Cross-sectional R2 70.4%
For index options, the three-factor model generates time-series alphas thatare all statistically insignificant and that have a mean of −1.78% and a meanabsolute value of 4.43%. The CAPM generates negative alphas for all indexoptions with an average of
−17.15%. Accounting for exposure to correlation
risk and individual variance risk leads to a notable reduction in mispricing andindex options no longer seem significantly “overpriced.” The improvement forindividual options is small, as the CAPM already performs quite well (the meanabsolute alpha goes from 5.97% to 5.03%).
Table IV presents the results for the cross-sectional regression of averageindex and individual option returns on their factor loadings. The risk premiumfor the correlation factor is estimated to be 17.5% per month (t-statistic of 2.56).While this is higher than the average return on the trading strategy (10.37%),the difference between the two estimates of the correlation risk premium isnot statistically significant. In contrast, the price of individual variance risk
is small and statistically insignificant. Note that the positive risk premiumfor the correlation factor corresponds to a negative price of correlation risk,
7/27/2019 The Price of Correlation Risk Evidence From Equity Options
http://slidepdf.com/reader/full/the-price-of-correlation-risk-evidence-from-equity-options 23/30
The Price of Correlation Risk 1399
since the trading strategy sells correlation and pays off well when correlationsare low. Given that the correlation factor betas for index options are alwaysnegative, the positive estimate in Table IV leads to negative excess returnsfor index options relative to the CAPM, that is, consistent with the definition
in Section I, the price of correlation risk is negative in the sense that assetswith payoffs that covary positively with correlation (e.g., index options) earnnegative excess returns.
As a robustness check, we now apply the correlation and individual variancerisk factors to CAPM residuals, rather than regressing option returns simulta-neously on the market, correlation, and individual variance risk factors. Giventhe estimated factor loadings, we obtain the correlation and individual variancerisk premia from the cross-section of average CAPM excess returns. This alter-native analysis of priced correlation risk is conservative in the sense that anycorrelation between the market return and the correlation risk factor is now au-
tomatically attributed to the market return (and its associated risk premium).We find identical results for the factor loadings on correlation and individual
variance risk. The point estimates and t-statistics for the factor risk premia inTable IV are also very similar to the results for the three-factor model. The highcross-sectional R2 of 70.4% is remarkable, given that the cross-section concernsCAPM residuals and that the model imposes linearity.
In conclusion, we find that individual variance risk is not priced in thecross-section of index and individual options, consistent with the results inSections III.A and III.B. We also obtain strong evidence that exposure to cor-relation risk accounts for a substantial part of the cross-sectional variation in
average excess returns that cannot be explained by standard market risk.
VI. The Impact of Transaction Costs and Margins
Our evidence points to a correlation risk premium that is both economicallyand statistically significant. Understanding the source and size of this riskpremium is important. While unreported results indicate that marketwide cor-relations predict market variance, so that these correlations18 may be a pricedstate variable in Merton’s ICAPM (in particular the extension in Chen (2003)),a general equilibrium model with priced correlation risk is needed to shed morelight on the size of the correlation risk premium. Since developing such a gen-
eral equilibrium model is beyond the scope of this paper, we instead analyzethe impact of realistic trading frictions on the feasibility and profitability of thecorrelation trading strategy to explore whether limits to arbitrage may preventinvestors from exploiting this correlation risk premium fully. In a recent pa-per, Santa-Clara and Saretto (2007) study the impact of transaction costs andmargin requirements on the execution and profitability of index-option trad-ing strategies and find that limits to arbitrage in the form of realistic trading frictions severely impact the risk-return trade-off of these strategies.
18 An interesting related question is why individual variance risk is not priced, which is also
related to the pricing of idiosyncratic risk, analyzed by Ang et al. (2006) in the cross-section of stock returns and in the time-series sense in Goyal and Santa-Clara (2003).
7/27/2019 The Price of Correlation Risk Evidence From Equity Options
http://slidepdf.com/reader/full/the-price-of-correlation-risk-evidence-from-equity-options 24/30
1400 The Journal of Finance R
It is interesting to apply their analysis to our setting for the following reasons.First, we found in Section IV that our correlation trading strategy outperformstwo standard trading strategies based on index options when ignoring trading frictions. Second, the quantitative impact of trading frictions may be different,
because our strategy involves not only index options, but also individual op-tions. For comparison reasons, we also report the impact of frictions on the twoalternative index-option trading strategies we consider, since the sample periodas well as the type of index options (S&P500 versus S&P100) are different fromthe analysis in Santa-Clara and Saretto (2007).
We first account for transaction costs in the form of bid-ask spreads by using closing bid and ask quotes rather than mid quotes. As the correlation trading strategy sells index options and buys individual options, we calculate bid-to-maturity returns for index options and ask-to-maturity returns for individualoptions. Bid-ask spreads lower the excess return on the trading strategy by
roughly 50%, specifically, from 10.4% (raw monthly excess return) and 10.6%(CAPM alpha) to 5.3% and 5.5%, respectively. The CAPM alpha is no longerstatistically significant, with a t-statistic of 0.77. The annualized Sharpe ratiois also substantially lower when accounting for bid-ask spreads and drops from0.73 in Table II to 0.41, which is very similar to the Sharpe ratio of the equityindex in the absence of trading frictions. The impact of transaction costs onthe alternative index-option trading strategies is less pronounced. For example,the raw excess return on the index straddle shrinks by only 2%, consistent withthe findings of Santa-Clara and Saretto (2007) (taking into account that we holdoptions to maturity, thus avoiding roundtrip transaction costs on options). After
transaction costs, the Sharpe ratios of the index straddle and put now exceedthe Sharpe ratio of the correlation strategy (0.52 and 0.58 versus 0.41). Theimpact of transaction costs on our strategy is larger than for the two alternativeindex-option strategies because of the larger bid-ask spreads for individualoptions.
Table V reports the optimal portfolio allocation to the correlation trading strategy and to the two alternative index-option trading strategies, as well asthe associated certainty equivalent wealth gains, for a CRRA investor facing transaction costs in the form of bid-ask spreads. As in Table III, the investorcan also invest in the risk-free asset and in the underlying equity index. The
transaction costs for the riskless asset and the equity index are expected to bean order of magnitude smaller than for the options strategies and for simplicityare assumed to be zero.
Not surprisingly, transaction costs have a major impact on the optimal allo-cation by CRRA investors in the correlation strategy. The portfolio shares areroughly 57% of the optimal weights without frictions (Table III) and are nowstatistically insignificant. However, they remain economically quite large forlow γ . The point estimate for the certainty equivalent shows that the log in-
vestor still gains 0.47% of wealth per month from having access to the trading strategy, but there is no statistical evidence that the gain is significantly differ-
ent from zero. Furthermore, since this certainty equivalent was 1.76% withoutfrictions, it is clear that the economic impact of bid-ask spreads is substantial.

7/27/2019 The Price of Correlation Risk Evidence From Equity Options
http://slidepdf.com/reader/full/the-price-of-correlation-risk-evidence-from-equity-options 25/30
The Price of Correlation Risk 1401
Table V
Correlation Trading Strategy with Transaction Costs: Portfolio
Weights and Certainty Equivalents for a CRRA Investor
The table reports the optimal empirical portfolio weights (and t-statistics) of a CRRA investor
in derivatives-based trading strategies, accounting for transaction costs in the form of bid-askspreads and obtained by maximizing in-sample expected utility. The investment opportunity setalso includes the underlying equity index and the risk-free asset (these weights are not reportedin the table). The monthly certainty equivalent is the percentage of initial wealth that a CRRA investor demands as compensation for not being able to invest in a particular derivatives-basedstrategy and instead only investing in the equity index and the risk-free asset. Three derivativestrategies are considered: a short position in the index straddle,a short position in the index put, andthe correlation trading strategy. The certainty equivalents are estimated using the optimal CRRA portfolio weights over the 1/1996 to 12/2003 sample period, for different levels of risk aversionγ . The value of γ = 1.8 generates (approximately) a 100% equity index weight when derivativesare not available. To account for transaction costs, we use closing bid and ask quotes rather thanmid quotes. For the short index straddle and short index put, we use bid-to-maturity returns. For
the correlation trading strategy, which sells index options and buys individual options, we usebid-to-maturity returns for index options and ask-to-maturity returns for individual options.
Risk Aversion γ 1 2 5 10 20 1.8
Short Index StraddlePortfolio weight 0.1612 0.0901 0.0383 0.0195 0.0098 0.0990t-stat (1.26) (1.24) (1.22) (1.21) (1.21) (1.24)Cert. Equiv. 0.7545% 0.4281% 0.1834% 0.0937% 0.0473% 0.4694%
Short Index PutPortfolio weight 0.0896 0.0581 0.0267 0.0139 0.0071 0.0628t-stat (0.92) (0.99) (1.00) (1.00) (1.00) (0.99)
Cert. Equiv. 0.4115% 0.2971% 0.1441% 0.0765% 0.0394% 0.3178%Correlation Strategy
Portfolio weight 0.1976 0.1068 0.0445 0.0225 0.0113 0.1178t-stat (0.97) (0.98) (0.98) (0.98) (0.98) (0.98)Cert. Equiv. 0.4698% 0.2597% 0.1096% 0.0557% 0.0281% 0.2856%
As discussed above, the impact of transaction costs on the alternative index-option strategies is smaller. The optimal portfolio weights are only 25% smallerand the certainty equivalents are reduced by roughly 40% for index straddles
and by approximately 60% for the index put portfolio. The certainty equivalentfor the index straddle is now larger than for the correlation trade. However,for the index straddle and put strategies the associated portfolio weights arestatistically insignificant (as before).
Another potentially important trading friction for options concerns marginrequirements, as shown by Santa-Clara and Saretto (2007) for strategies basedon index options. Our trading strategy shorts index options as well, but is si-multaneously long individual options and also has a large component investedin the riskless asset, justifying an additional analysis of the effect of margins onthe strategy’s feasibility. We first calculate the required initial margin for the
strategy based on its short position in index options and using the (stringent)CBOE margin rules for options described in Santa-Clara and Saretto (2007,
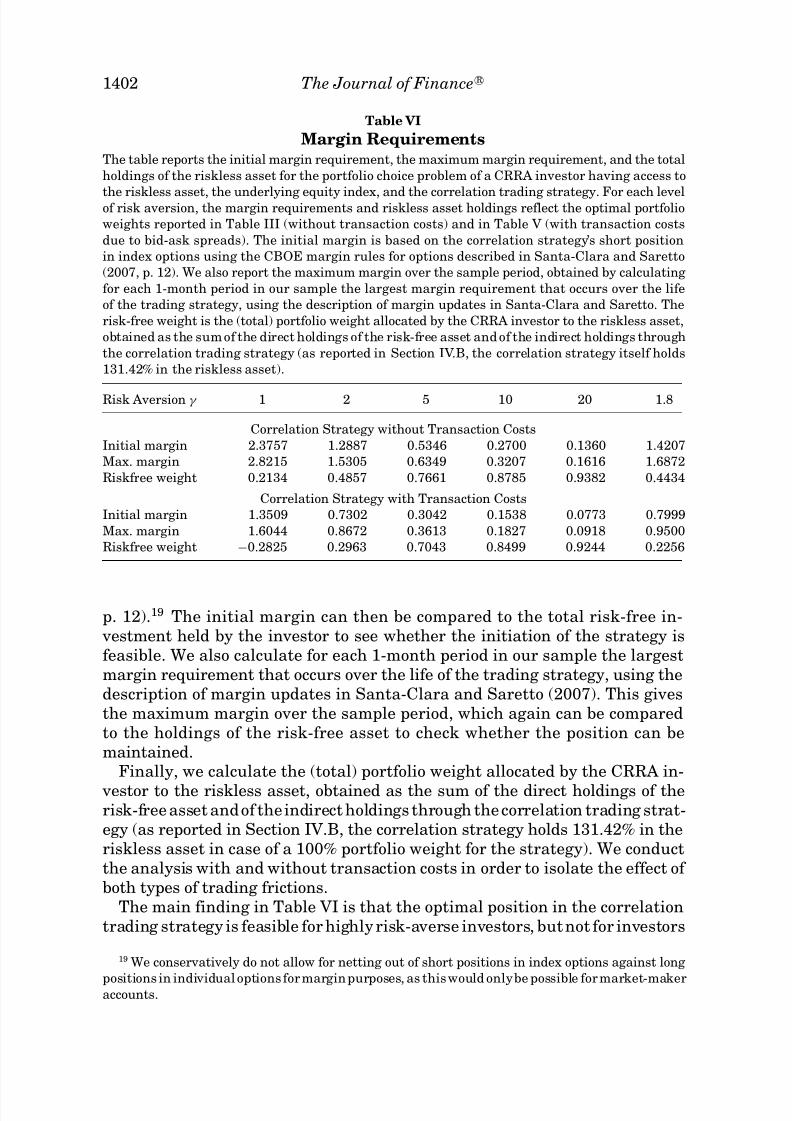
7/27/2019 The Price of Correlation Risk Evidence From Equity Options
http://slidepdf.com/reader/full/the-price-of-correlation-risk-evidence-from-equity-options 26/30
1402 The Journal of Finance R
Table VI
Margin Requirements
The table reports the initial margin requirement, the maximum margin requirement, and the totalholdings of the riskless asset for the portfolio choice problem of a CRRA investor having access to
the riskless asset, the underlying equity index, and the correlation trading strategy. For each levelof risk aversion, the margin requirements and riskless asset holdings reflect the optimal portfolioweights reported in Table III (without transaction costs) and in Table V (with transaction costsdue to bid-ask spreads). The initial margin is based on the correlation strategy’s short positionin index options using the CBOE margin rules for options described in Santa-Clara and Saretto(2007, p. 12). We also report the maximum margin over the sample period, obtained by calculating for each 1-month period in our sample the largest margin requirement that occurs over the lifeof the trading strategy, using the description of margin updates in Santa-Clara and Saretto. Therisk-free weight is the (total) portfolio weight allocated by the CRRA investor to the riskless asset,obtained as the sum of the direct holdings of the risk-free asset and of the indirect holdings throughthe correlation trading strategy (as reported in Section IV.B, the correlation strategy itself holds131.42% in the riskless asset).
Risk Aversion γ 1 2 5 10 20 1.8
Correlation Strategy without Transaction CostsInitial margin 2.3757 1.2887 0.5346 0.2700 0.1360 1.4207Max. margin 2.8215 1.5305 0.6349 0.3207 0.1616 1.6872Riskfree weight 0.2134 0.4857 0.7661 0.8785 0.9382 0.4434
Correlation Strategy with Transaction CostsInitial margin 1.3509 0.7302 0.3042 0.1538 0.0773 0.7999Max. margin 1.6044 0.8672 0.3613 0.1827 0.0918 0.9500Riskfree weight −0.2825 0.2963 0.7043 0.8499 0.9244 0.2256
p. 12).19 The initial margin can then be compared to the total risk-free in- vestment held by the investor to see whether the initiation of the strategy isfeasible. We also calculate for each 1-month period in our sample the largestmargin requirement that occurs over the life of the trading strategy, using thedescription of margin updates in Santa-Clara and Saretto (2007). This givesthe maximum margin over the sample period, which again can be comparedto the holdings of the risk-free asset to check whether the position can bemaintained.
Finally, we calculate the (total) portfolio weight allocated by the CRRA in-
vestor to the riskless asset, obtained as the sum of the direct holdings of therisk-free asset and of the indirect holdings through the correlation trading strat-egy (as reported in Section IV.B, the correlation strategy holds 131.42% in theriskless asset in case of a 100% portfolio weight for the strategy). We conductthe analysis with and without transaction costs in order to isolate the effect of both types of trading frictions.
The main finding in Table VI is that the optimal position in the correlationtrading strategy is feasible for highly risk-averse investors, but not for investors
19 We conservatively do not allow for netting out of short positions in index options against long
positions in individual options for margin purposes, as this would only be possible for market-makeraccounts.

7/27/2019 The Price of Correlation Risk Evidence From Equity Options
http://slidepdf.com/reader/full/the-price-of-correlation-risk-evidence-from-equity-options 27/30
The Price of Correlation Risk 1403
with γ ≤ 2. Importantly, it is precisely this relatively risk-tolerant investorwho stands to gain most from the strategy and for whom the optimal portfolioweight is economically significant when ignoring margin requirements. Thisconclusion obtains whether we incorporate transaction costs or not, indicating
the relevance of margin requirements. The trading strategy is feasible for theγ = 5 investor precisely because her optimal weight in the strategy is small.
In summary, the analysis of trading frictions reveals that the correlation riskpremium cannot be captured by investors who are subject to realistic trans-action costs and margin requirements. Limits to arbitrage could therefore ex-plain the economic presence of a correlation risk premium that may otherwise,that is, when ignoring frictions, seem very large. While studying the equilib-rium price of correlation risk in a general equilibrium model is an interesting topic for future research, the results in this section suggest that our finding of a large correlation risk premium may also be consistent with a hypothesis
of index-option mispricing. According to this hypothesis, the correlation riskpremium need not (only) be the equilibrium compensation for correlation risk,but may also reflect inefficiencies in the market for index options leading to“overpriced” index options, which cannot be arbitraged away in the presence of realistic market frictions.
VII. Conclusion
We show empirically that correlation risk is priced in the sense that as-sets that pay off well when marketwide correlations are higher than expected
earn negative excess returns. This result is consistent with increases in mar-ketwide correlations leading to a deterioration of investment opportunitiesin the form of smaller diversification benefits. The negative excess returnon correlation-sensitive assets can therefore be interpreted as an insurancepremium.
We provide evidence of a large correlation risk premium in a number of dif-ferent ways. First, while index options reflect a large negative variance riskpremium, we find no significant negative premium on variance risk in indi-
vidual options on all index components. Second, a trading strategy that sellscorrelation risk by selling index options and buying individual options earns
excess returns of 10% per month and has a large Sharpe ratio. This strategy hasmore attractive risk-return properties (especially higher moments) than otheroption-based strategies. Third, the return on this correlation trading strategyexplains 70% of the cross-sectional variation in index and individual optionreturns that is not accounted for by market risk.
As a second contribution, we demonstrate that priced correlation risk con-stitutes the missing link between unpriced individual variance risk and pricedmarket variance risk, and enables us to offer a risk-based explanation for thediscrepancy between index and individual option returns. Index options areexpensive, unlike individual options, because they allow investors to hedge
against positive marketwide correlation shocks and the ensuing loss in diver-sification benefits.

7/27/2019 The Price of Correlation Risk Evidence From Equity Options
http://slidepdf.com/reader/full/the-price-of-correlation-risk-evidence-from-equity-options 28/30
1404 The Journal of Finance R
When introducing realistic market frictions in the form of transaction costsand margin requirements, we find that the correlation trading strategy can-not be exploited by investors facing these frictions. This provides a poten-tial limits-to-arbitrage interpretation for our finding of a large correlation
risk premium. Simultaneously, it should be noted that the market makerswho are active in markets for both index and individual options can be ex-pected to earn the correlation risk premium, since end-users of options havebeen shown to be net long index options and net short individual options(Garleanu et al. (2005)) and since market-makers are only margined on their netpositions.
Correlation risk is relevant in many areas of financial economics. Subsequentto our work, Buraschi, Porchia, and Trojani (2006) study the effect of correlationrisk on dynamic portfolio choice and Krishnan, Petkova, and Ritchken (2006)show that correlation risk is priced in the cross-section of stock returns. Another
interesting application concerns the pricing of basket credit derivatives, suchas collateralized debt obligations.
REFERENCES
A ıt-Sahalia, Yacine, and Robert L. Kimmel, 2005, Maximum likelihood estimation of stochastic volatility models, Working paper, Princeton University.
Andersen, Torben, Luca Benzoni, and Jesper Lund, 2002, An empirical investigation of continuous-time models for equity returns, Journal of Finance 57, 1239–1284.
Ang, Andrew, Robert J. Hodrick, Yuhang Xing, and Xiaoyan Zhang, 2006, The cross-section of volatility and expected returns, Journal of Finance 61, 259–299.
Bakshi, Gurdip S., and Nikunj Kapadia, 2003a, Delta-hedged gains and the negative market volatil-ity risk premium, Review of Financial Studies 16, 527–566.
Bakshi, Gurdip S., and Nikunj Kapadia, 2003b, Volatility risk premiums embedded in individualequity options: Some new insights, Journal of Derivatives 11, 45–54.
Bakshi, Gurdip S., Nikunj Kapadia, and Dilip B. Madan, 2003, Stock return characteristics, skewlaws, and differential pricing of individual equity options, Review of Financial Studies 16,101–143.
Bates, David S., 2003, Empirical option pricing: A retrospection, Journal of Econometrics 116,387–404.
Black, Fischer S., and Myron S. Scholes, 1973, The pricing of options and corporate liabilities, Journal of Political Economy 81, 637–654.
Bollen, Nicolas P. B., and Robert E. Whaley, 2004, Does net buying pressure affect the shape of
implied volatility functions? Journal of Finance 59, 711–754.Bollerslev, Tim P., Robert F. Engle, and Jeffrey M. Woolridge, 1988, A capital asset pricing model
with time-varying covariances, Journal of Political Economy 96, 116–131.Bollerslev, Tim P., Michael Gibson, and Hao Zhou, 2004, Dynamic estimation of volatility risk
premia and investor risk aversion from option-implied and realized volatilities, Working paper,Duke University.
Bondarenko, Oleg, 2003a, Statistical arbitrage and securities prices, Review of Financial Studies
16, 875–919.Bondarenko, Oleg, 2003b, Why are puts so expensive? Working paper, University of Illinois,
Chicago.Bondarenko, Oleg, 2004, Market price of variance risk and performance of hedge funds, Working
paper, University of Illinois, Chicago.
Brandt, Michael W., and Francis X. Diebold, 2006, A no-arbitrage approach to range-based estima-tion of return covariances and correlations, Journal of Business 79, 61–73.

7/27/2019 The Price of Correlation Risk Evidence From Equity Options
http://slidepdf.com/reader/full/the-price-of-correlation-risk-evidence-from-equity-options 29/30

7/27/2019 The Price of Correlation Risk Evidence From Equity Options
http://slidepdf.com/reader/full/the-price-of-correlation-risk-evidence-from-equity-options 30/30
1406 The Journal of Finance R
Jones, Christopher S., 2006, A nonlinear factor analysis of S&P 500 index option returns, Journal
of Finance 61, 2325–2363.de Jong, Frank, Joost Driessen, and Antoon Pelsser, 2004, On the information in the interest rate
term structure and option prices, Review of Derivatives Research 7, 99–127.Jorion, Philippe, 2000, Risk management lessons from long-term capital management, European
Financial Management 6, 277–300.Krishnan, CNV, Ralitsa Petkova, and Peter Ritchken, 2006, The price of correlation risk, Working
paper, Case Western Reserve University.Longin, Francois, and Bruno Solnik, 2001, Extreme correlation of international equity markets,
Journal of Finance 56, 651–678.Longstaff, Francis A., Pedro Santa-Clara, and Eduardo S. Schwartz, 2001, The relative valuation
of caps and swaptions: Theory and empirical evidence, Journal of Finance 56, 2067–2109.Lopez, Jose A., and Christian Walter, 2000, Is implied correlation worth calculating? Evidence from
foreign exchange options and historical data, Journal of Derivatives 7, 65–82.Merton, Robert C., 1973a, Theory of rational option pricing, Bell Journal of Economics 4, 141–183.Merton, Robert C., 1973b, An intertemporal capital asset pricing model, Econometrica 41, 867–887.Moskowitz, Tobias J., 2003, An analysis of covariance risk and pricing anomalies, Review of Finan-
cial Studies 16, 417–457.Newey, Whitney K., and Kenneth D. West, 1987, A simple, positive-semidefinite, heteroskedasticity
and autocorrelation consistent covariance matrix, Econometrica 55, 703–708.Pan, Jun, 2002, The jump-risk premia implicit in options: Evidence from an integrated time-series
study, Journal of Financial Economics 63, 3–50.Pastor, Lubos, and Robert F. Stambaugh, 2003, Liquidity risk and expected stock returns, Journal
of Political Economy 111, 642–685.Roll, Richard, 1988, The international crash of October 1987, Financial Analysts Journal 44, 19–35.Rubinstein, Mark, 2000, Comments on the 1987 stock market crash: 11 years later, in Symposium
Proceedings of the Actuarial Foundation (Actuarial Foundation, Schaumburg, IL).Santa-Clara, Pedro, and Alessio Saretto, 2007, Option strategies: Good deals and margin calls,
Working paper, UCLA.
Shanken, Jay A., 1992, On the estimation of beta pricing models, Review of Financial Studies 5,1–34.
Skintzi, Vasiliki D., and Apostolos N. Refenes, 2003, Implied correlation index: A new measure of diversification, Working paper, Athens University.