the price of sin: the effects of social norms on stock markets
TRANSCRIPT
Electronic copy of this paper is available at: http://ssrn.com/abstract=766465
The Price of Sin: The Effects of Social Norms on Markets
Harrison Hong Princeton University
Marcin Kacperczyk
University of British Columbia
First Draft: June 2005 This Draft: March 2007
Abstract: We provide evidence for the effects of social norms on markets by studying “sin” stocks—publicly traded companies involved in producing alcohol, tobacco, and gaming. We hypothesize that there is a societal norm against funding operations that promote vice and that some investors, particularly institutions subject to norms, pay a financial cost in abstaining from these stocks. Consistent with this hypothesis, we find that sin stocks are less held by norm-constrained institutions such as pension plans as compared to mutual or hedge funds that are natural arbitrageurs, and they receive less coverage from analysts than stocks of otherwise comparable characteristics. Sin stocks also have higher expected returns than otherwise comparable stocks, consistent with them being neglected by norm-constrained investors and facing greater litigation risk heightened by social norms. Evidence from corporate financing decisions and time variation in norms for tobacco also suggests that norms affect stock prices and returns. _____________________ We thank Murray Carlson, Douglas Diamond, Lorenzo Garlappi, Rob Heinkel, Narasimhan Jegadeesh, Lisa Kramer, Alan Kraus, Arvind Krishnamurthy, Jeffrey Kubik, Owen Lamont, Kai Li, Jose Scheinkman, Anna Scherbina, Jeremy Stein, Andrei Ukhov, Rossen Valkanov, Sunil Wahal, Jialin Yu, and seminar participants at Emory, McGill, Rutgers, Simon Fraser, Society of Quantitative Analysts, Swedish Institute for Financial Research, the European Finance Association Conference, the Financial Economics and Accounting Annual Conference, the NBER Behavioral Finance Conference, the Pacific Northwest Finance Conference, and the UBC Summer Conference for a number of helpful comments. Kacperczyk acknowledges research support from the Social Sciences and Humanities Research Council of Canada. Please address inquiries to [email protected] and [email protected].

Electronic copy of this paper is available at: http://ssrn.com/abstract=766465
I. Introduction
Many social scientists believe that social norms are important in shaping economic
behavior and market outcomes, overriding at times even the profit motive.1 An early articulation
of this viewpoint in economics is Becker’s (1957) model of discrimination. In his model, agents
(e.g., employers) with discriminatory tastes arising from community norms pay for those tastes by
bearing financial costs from their decisions to not interact with particular types of people. Arrow
(1972) points out that a complete theory of discrimination also must explain why entrepreneurs
without discriminatory tastes cannot make profits by hiring labor cheaply from the groups
discriminated against by other employers. Subsequent theories of social norms (e.g., Akerlof
(1980), Romer (1984)) provide sufficient conditions under which social customs that are
disadvantageous to the individual nevertheless may persist if individuals are sanctioned by loss of
reputation for disobedience of the custom.2 Empirical work on the effects of social norms on
markets has traditionally focused upon measuring the extent of discrimination in the labor
market.3 A related literature points out that social interactions (or peer effects) more generally are
important for a variety of economic outcomes (see, e.g., Glaeser and Scheinkman (2002)).4
In this paper, we provide new evidence on the market effects of social norms in the novel
setting of the stock market. Specifically, we study the investing environment of “sin” stocks, i.e.
publicly traded companies involved in the production of alcohol, tobacco, and gaming. This is an
ideal setting in which to study the effects of social norms on markets for several reasons. First,
there is clearly a societal norm against funding operations that promote human vice, and 1 There are various definitions of the concept of a social norm or custom. Following Akerlof (1980), we define a social norm or custom as an act whose utility to the agent performing it depends in some way on the beliefs or actions of other members of the community. 2 See Elster (1989) for a review of social norms and economic theory. 3 For a survey of this literature, see Altonji and Blank (1999); and for a recent summary of this work, see Levitt (2004). Many papers have developed clever empirical approaches to identifying the extent of racial discrimination in the labor market. However, the evidence to date supporting taste-based discrimination (as opposed to rational information-based theories) has been mixed. 4 A growing body of empirical research speaks to the importance of peer-effects in a variety of contexts (see, e.g., Case and Katz (1991) and Glaeser, Sacerdote and Scheinkman (1996)). Recent work on social interaction and financial markets focuses primarily on investor behavior (see, e.g., Hong, Kubik and Stein (2004)). There are few papers on whether peer effects have price implications.
1

consequently many investors may not want themselves or others to support these companies by
investing in their stocks. Recent anecdotal evidence supporting this premise can be found in the
rise of socially responsible investment (SRI) as a mutual fund asset class in which managers
screen their investments to rule out sinful stocks such as alcohol, tobacco, and gaming companies.
The Social Investment Forum estimates that this asset class contained about $2.34 trillion dollars
in 2001 or roughly 12% of the total assets under management in that year (see Geczy, Stambaugh,
and Levin (2003)), which suggests a potentially sizeable effect of socially responsible investing
on the prices of sin stocks. Second, the stock market provides us with a rich set of data on
investor behavior, stock pricing, and firm behavior, which allows us to discriminate more finely
among alternative hypotheses than do existing empirical studies of social norms.
A third reason why the stock market is ideally suited for an investigation of market
effects from social norms is that there can be significant financial costs associated with norm-
constrained investing, i.e. investors pay for their discriminatory tastes à la Becker. To begin with,
there is the cost of being unable to diversify into publicly traded sin companies, although this cost
is small since there are few of these firms relative to the universe of stocks. More importantly, as
we show below, sin stocks tend to be relatively cheap (i.e., with low price-to-book or price-to-
earnings ratios) when benchmarked against comparables. Finally, Geczy, Stambaugh, and Levin
(2003) find that from the perspective of an investor who seeks to create an optimal portfolio from
mutual funds, limiting oneself to funds that include social objectives in their investment policies
can be very costly. For instance, an investor who believes that returns are generated by a
multifactor pricing model can incur a certainty-equivalent cost of 30 basis points per month,
while an investor who believes in managerial skill can incur a cost of more than 100 basis points
per month. Importantly, these calculations take as given that there are few publicly traded sin
stocks in the marketplace. In reality, the number of sin stocks is likely to be endogenous,
depending on the degree to which investors shun them because of social norms.
2

We begin our investigation of social norm effects on investments in sin stocks by looking
at who owns these stocks. First, we hypothesize that the shares of sin stocks should be held in
smaller proportions by institutions subject to social norm pressures. These include institutions
whose positions in stocks are public information, institutions with diverse constituents, and
institutions that can be readily exposed to public scrutiny (e.g., picketing by an unhappy
minority). Examples include pension funds, universities, religious organizations, banks, and
insurance companies. This hypothesis further implies that sin stocks should be less followed by
sell-side analysts who produce financial reports and analyses on companies, since these analysts
tend to cater to institutional investors. In contrast to institutional investors, individual investors
can keep their stock positions out of the view of enforcers of societal norms, and therefore we
expect individual investors to be more willing than institutional investors to hold sin stocks.
Mutual funds and hedge funds represent another class of investors whom we expect to be willing
to invest in sin stocks, since they are natural arbitrageurs in the marketplace. While even mutual
and hedge funds may be increasingly subject to social norm pressures as witnessed by the recent
growth of the socially responsible investment class, we expect some of them to flout social
conventions and buy sin stocks if those stocks are neglected by other investors and priced
cheaply.5
Consistent with these predictions, we find that sin stocks have less institutional
ownership, as compared to stocks of otherwise comparable characteristics during the period of
1980-2003 for which data are available. Our identification strategy throughout comes from
judging sin stock outcomes (e.g., institutional ownership, stock returns, etc.) relative to carefully
chosen industry comparables and controls of stock characteristics, i.e. our effects are coming
from sin status as opposed to unobserved heterogeneity related to industry or other stock
characteristics. Using our most conservative estimates, the sin stock comparables (defined as
5 An example of such a fund is the VICE mutual fund, which openly promotes holding vice stocks; however, these examples are rare and typically small in size.
3

those with similar Fama-French (1997) industry groupings as our sin stocks) have on average
about 22% of their shares held by institutions. In contrast, sin stocks have about 19% of their
shares held by institutions, which is approximately a 14 percent lower institutional ownership
ratio than their comparables. In addition, sin stocks receive less analyst coverage during the
period of 1976-2003 for which data are available. The typical sin stock comparable in our sample
receives coverage from about 2.5 analysts. Sin stocks on average are followed by 2.1 analysts,
representing a 16 percent decline in coverage relative to the mean.
When we break down this analysis by types of institutions (banks, insurance companies,
mutual funds, independent investment advisors, and others, such as pension plans and
universities), we find that shares of sin stocks are not held in smaller proportions by mutual funds
and independent investment advisors, who are the natural arbitrageurs among these institutions.6
This set of disaggregated results suggests that the low institutional ownership of sin stocks cannot
be explained by a story in which institutions are smarter than individuals, since the result does not
hold for the mutual funds and hedge funds that are likely to be the smartest investors among these
institutions.
Next, we formulate our predictions about the effects of social norms on the returns to
investing in sin stocks. From the work of Merton (1987) on neglected stocks and segmented
markets, there are at least two reasons why sin stocks should be cheaper than other stocks and
hence outperform comparables, even after accounting for well-known predictors of stock returns.
First, the neglect of sin stocks by an important set of investors, such as institutions, means that the
prices of those stocks will be depressed relative to their fundamental values because of limited
risk sharing and hence sin stocks should have higher expected returns than comparables. Second,
because of neglect or limited risk sharing, Merton shows that the CAPM no longer holds and
idiosyncratic risk and not just beta matters for pricing. As a result, the increased litigation risk
6 The category of independent investment advisor is a hodge-podge of different institutions that includes hedge funds. Accordingly, it makes sense for us to include them with mutual funds as natural arbitrageurs.
4

associated with the products of sin companies, which is further heightened by social norms,
should further increase the expected returns of sin stocks. For example, tobacco companies
faced substantial litigation risk until their settlement with state governments in 1997. Moreover,
many practitioners believe that investors may simply under-estimate the value of sin stocks. For
instance, David Berman (2002) writes that “…sin stocks come with other advantages besides
stability. Most of these stocks have lower valuations than the overall market. Some of them also
offer excellent dividends.…Finally, sin stocks tend to benefit from very conservative accounting
because their industries fall under considerable scrutiny from regulators.”7 Implicit in the neglect
effect hypothesis is an assumption of limited arbitrage, i.e. not enough arbitrage capital is brought
to bear on sin stocks because of a set of constraints and risks articulated by Shleifer and Vishny
(1997) and others.8
We test our predictions of sin stocks outperforming comparables by analyzing both prices
and returns. First and most conventionally, using time-series regressions during the period of
1926-2004, we find that a portfolio long sin stocks and short their comparables has a return of 45
basis points per month after adjusting for the CAPM and 39 basis points per month after adjusting
for a four-factor model comprising of the three Fama-French factors and the momentum (returns)
factor. Second, using cross-sectional regressions controlling for firm characteristics (data only
available from 1965-2004), we find that sin stocks outperform their comparables by 30 basis
points a month—again statistically and economically sizeable magnitude—even after accounting
for well-known determinants of expected returns in cross-sectional regressions such as market
size, past return, and market-to-book ratio. Third, we compare the market-to-book ratios of sin
stocks to those of other stocks. The market-to-book ratios of sin stocks are on average about 15
percent lower than those of other companies after controlling for differences in other stock
7 See http://www.moneysense.ca/shared/print.jsp?content=20021127_154845_3424 to retrieve the article. 8 In other words, Arrow (1972) is right to point out the opportunity for entrepreneurial investors to exploit the discriminatory tastes of other investors, but there are not enough entrepreneurial investors to completely eliminate the impact of discriminatory tastes on stock prices.
5

characteristics, an economically and statistically significant effect during the period of 1965-
2004. Our analysis of sin stock prices using market-to-book ratios is more conservative than our
analysis of returns, since the realized returns of certain sin stocks (tobacco) may be influenced by
unexpectedly good cash flow news over our sample period.
We then consider a number of robustness checks and relate our empirical findings to
calibrations done by Heinkel, Kraus, and Zechner (2001), henceforth HKZ, who develop a model
to consider the price implications of ethical investing that excludes companies that pollute. In our
context, it is companies that produce sin. HKZ develop a model in the spirit of Merton that looks
at the price implications of limited risk sharing due to neglect induced by social norms or ethical
investing. Their price implications are precisely the ones tested here. Our empirical findings
match well with their calibration results, which we describe in more detail below.
We further validate our characterization of the prices of sin stocks as being influenced by
social norms by taking advantage of time variation in the social norms governing tobacco
consumption. The major source of time variation in social norms in our analysis stems from the
changing public perception of smoking, which was not considered a vice until the sixties.
Accordingly, we expect tobacco stocks to be cheaper and hence to outperform comparables after
the sixties, and this is indeed what we find. And as a consequence of stock underpricing due to
social norms, we predict that sin companies should finance their operations using relatively more
debt than equity, since debt markets tend to be less transparent than equity markets as we argue
below. Using data from 1962-2003, we confirm that sin companies have significantly higher
leverage after accounting for the usual predictors of capital structure.
Our findings on the effects of social norms in the context of the stock market strongly
support the viewpoint that social norms can have important consequences for markets. Indeed,
our results most likely represent lower bounds on the effects of social norms in the stock market,
since many companies operating in sin industries may not become public precisely because they
are shunned by many investors.
6

Our paper is related to the work of Teoh, Welch, and Wazzan (1999), who examine the
effect of the shareholder boycott of South Africa’s apartheid regime. They find that for all the
visibility associated with the boycott, there was little discernible effect either on the valuations of
banks and corporations with South African operations or on the South African financial markets,
because corporate involvement in South Africa was small in the first place. However, they do
find some weak evidence that institutional shareholdings in corporations with South African
investments increased when those corporations divested.
The rest of our paper proceeds as follows. In Section II, we provide a background history
of sin stocks and describe how we identify these stocks in our analysis. In Section III, we
complete the description of our data set and specify the variables for our regression models. In
Section IV, we report the empirical results from our regression analyses. We conclude in Section
V. And details on our calibration exercises are in the Appendix.
II. Background on and Selection of Sin Stocks
Our analysis of social norm effects on the stock market focuses on the industries
collectively known as the “Triumvirate of Sin,” namely alcohol, tobacco and gaming. Today, all
three of these consumer product groups are viewed as sinful by many individuals and social
groups in the United States and other countries, due to their addictive properties and undesirable
social consequences when consumed excessively. While the sinful aspects of alcohol and gaming
have long been recognized by societies into which they have been introduced, tobacco has been
the subject of negative social norms only as recently as the past four decades. Our analysis will
exploit the time variation in the social norms governing tobacco consumption to test various
predictions of social norm effects in financial markets.
7

Tobacco consumption has been viewed as sinful for only a relatively short period since
its introduction to Europe in the mid-sixteenth century.9 This is because the adverse individual
and public health consequences of smoking tobacco were not widely known until the mid-1960’s.
Indeed, most early European physicians subscribed to the Native American belief that tobacco
might be an effective medicine. As cigarette smoking grew in prevalence during the early
twentieth century, however, articles addressing the adverse health effects of smoking began to
appear in scientific and medical journals. Studies beginning in 1930 led the American Cancer
Society to warn by 1944 about the ill effects of smoking, though most of the public remained
unaware of the statistical correlation between smoking and cancer. This changed, however, in
1952 when Reader’s Digest published an article entitled “Cancer by the Carton,” which detailed
the dangers of smoking.
Although the tobacco industry responded with marketing and studies of their own, thus
managing to stave off negative public opinion for another decade, this battle came to an end in the
early 1960’s with the formation of the Surgeon General’s Advisory Committee on Smoking and
Health. Convened in response to political pressures and a growing body of scientific evidence,
the committee released a 387-page report in 1964 unequivocally concluding that cigarette
smoking is causally related to lung cancer. In 1965, Congress passed the Federal Cigarette
Labeling and Advertising Act requiring surgeon general’s warnings on all packages, and in 1971,
all broadcast advertising of tobacco products was banned.
Like alcohol, gambling has long been considered a vice and a sinful activity that corrupts
society. In most societies, gambling is heavily regulated because of concerns about criminal
involvement. Since the mid-to-late 1990’s, however, a number of states in the United States have
deregulated casino gaming to legalize its production outside of Native American casinos, under
pressure from both political referendums and budget concerns. According to a report from the
9 The following material on tobacco is drawn from a CNN website profiling the tobacco industry, http://edition.cnn.com/US/9705/tobacco/history.
8

National Gambling Commission, by 1999, twenty-six states had joined Nevada and Atlantic City
(New Jersey) in legalizing casino-style gaming.10 Hence, one could argue that gaming has
become more socially acceptable in recent years, though many surveys of individuals across
many states indicate that public opinion still regards gambling as sinful behavior.11
Based upon the Triumvirate of Sin described above, we identify sin stocks from the
universe of stocks in the following manner. We start with the Fama and French (1997)
classification of stocks based upon their SIC codes into 48 industries. Stocks in Fama-French
industry group 4 (beer or alcohol) and industry group 5 (smoke or tobacco) are classified as sin
stocks. Stocks with SIC codes 2100-2199 belong to the beer group, and those with SIC codes of
2080-2085 are in the smoke group. Unfortunately, the Fama-French classification scheme does
not separate gaming stocks from hotel stocks or other entertainment stocks. To this end, we need
to use the NAICS classification, which identifies gaming stocks as those bearing the following
NAICS codes: 7132, 71312, 713210, 71329, 713290, 72112, and 721120. In sum, sin stocks in
our analysis comprise the union of the Fama and French (1997) industry groups 4 and 5 along
with the NAICS group for gaming. We will work with this expanded 49-industry group
throughout our analysis.
We then augment this list by searching across companies at the segment level, as follows.
We utilize the COMPUSTAT Segments Data, available from 1985-2004, which contains
information on the SIC and NAICS codes of the different segments of a company. We identify a
company as a sin stock if any of its segments has a SIC code in either the beer or the smoke group
or an NAICS code in the gaming group, as defined above. Accordingly, our final list of sin
stocks is the union of two screening procedures—one applying the Fama and French (1997) and
NAICS classifications at the company level and the second applying the same classifications at
10 For more information regarding this report and discussion of legislative changes in gaming, see Chen and Bin (2001). 11 See for instance surveys reported in a Congressional report on gaming that may be found online at http://www.library.ca.gov/CRB/97/03/.
9

the segment level using COMPUSTAT segments data. The latter screen on company segment
information is essential for obtaining an accurate list of sin stocks, since many companies such as
Philip Morris, now known as Altria, have diversified operations. We are unable to implement the
augmented search for stocks no longer in existence by 1985, since the segments data is available
only after 1985. For stocks listed before 1985 and still in existence after 1985, we back-fill this
augmentation procedure—i.e., a stock identified as sinful using the segments data will be
characterized as sinful throughout its history.
A list of the sin stocks identified through the above screening procedure, containing
Center for Research in Security Prices (CRSP) permno, company name, and the time period of
coverage in our data set, can be obtained from the authors’ websites. The list contains many
well-known names such as Altria, Anheuser Busch Co., Bacardi, Bally, Caesars, Loews,
Mandalay, and Trump Hotels. We also performed some cross-checks of this list with searches of
popular books on sin investing (e.g., Ahrens (2004) and Waxler (2004)) and various online
sources, to confirm the accuracy of this list. By and large, our screening procedure appears to
yield an accurate and comprehensive list of stocks in the alcohol, tobacco, and gaming industries.
Table 1 provides a more systematic year-by-year look at our data set of sin stocks
beginning in 1926 and ending in 2004.12 There are a total of 193 distinct names, comprised of 36
distinct tobacco companies, 62 distinct alcohol companies, and 95 distinct gaming companies.
There are not a lot of sin stocks—only 63 even in 2004—relative to the thousands of stocks in the
universe. While the numbers of tobacco and alcohol stocks have stayed relatively constant
through the years, the number of gaming stocks increased significantly in the 1990’s with the
ongoing deregulation of the gaming industry. As we mentioned earlier, this recent trend suggests
that gaming may be gaining more widespread social acceptance. As we also have indicated,
however, there are a number of other factors underlying this trend.
12 Importantly, in our time-series tests that span a longer horizon, tobacco stocks are considered sinful only in the post-1965 period.
10

We further characterize these sin stocks in Panel B of Table 1 by calculating the market
betas for the period of 1962-2003 of the different industry portfolios, using data from Fama and
French (1997). The market betas are calculated using the time-series of monthly returns on the
49 (value-weighted) industry portfolios (the original 48 Fama and French (1997) industries plus
gaming).13 The three portfolios of interest (beer, smoke, and gaming) have betas of 0.76, 0.74,
and 1.15, respectively. As suggested by practitioners, beer and smoke appear to have somewhat
lower betas during the period of 1962-2003—the only industries with comparably small numbers
are utilities, food, gold, and oil—whereas gaming stocks have betas comparable to those of many
other industries.
While we focus on the so-called Triumvirate of Sin (alcohol, tobacco, and gaming), two
other classes of stocks are sometimes thought of as sinful. The first is the sex industry. However,
there are very few publicly traded companies with heavy operations in sex.14 Therefore, omitting
these companies will not affect our results in any significant way. The second is the defense
industry. We have decided against including defense as a sin industry in our main analysis
because it is not clear that defense is considered a sin by many Americans. As a robustness
exercise, however, we later broaden our definition of sin stocks to include stocks in Fama and
French (1997) industry grouping 26 (guns).
III. Data
Having described our procedure for identifying sin stocks, we now characterize our data
collection on the universe of stocks. Our data on U.S. firms come from the Center for Research
in Security Prices (CRSP) and COMPUSTAT. From CRSP, we obtain daily closing stock prices,
daily shares outstanding, and daily dollar trading volumes for NYSE, AMEX, and NASDAQ
13 Note that in calculating these betas, we have not excluded the gaming stocks from the Fama and French portfolios. This is unlikely to bias the estimates of beta for the different industries by a significant amount, since there are so few gaming stocks. 14 Two public companies with large sex operations, according to practitioners, are Playboy Enterprises and the Barcelona-based Private Media Group. However, many other large entertainment conglomerates profit off sex on cable through holdings in various subsidiaries that are difficult to track down.
11

stocks over the period of 1962-2003.15 From COMPUSTAT, we obtain annual information on a
variety of accounting variables during the same period. To be included in our sample, a firm
must have the requisite financial data from both CRSP and COMPUSTAT. We follow other
studies in focusing on companies with CRSP share codes of 10 or 11 and excluding firms with
one-digit SIC codes of 6, which belong to the financial services industry.16
Our data on ownership structures comes from the CDA Spectrum Database of 13-F
filings by institutional investors, defined as those managing at least $100 million dollars in assets.
This database reports holdings of a particular stock in terms of shares held by various classes of
institutional investors. The five institution types are banks, insurance companies, mutual funds,
independent investment advisors (which includes hedge funds), and others (including universities,
pension plans, and employee ownership plans). While the 13-F filing is available quarterly, most
companies only file timely reports on a semi-annual basis, at the end of June and at the end of
December. Our analysis will focus on the end-of-year filings. Our data on analyst coverage
come from the Institutional Brokers Estimates System (IBES) database, which reports the number
of analyst estimates of earnings issued on a stock at various points in time (typically quarterly).
A. Variables in Ownership Regressions
Institutional ownership (IOit) is the fraction of the shares of company i held by
institutions in the CDA Spectrum Database at the end of year t. IO is calculated by aggregating
the shares held by all five types of institutions at the end of the year and then dividing this amount
by shares outstanding at the end of the year (Item 25 in COMPUSTAT). LOGSIZEit is the natural
logarithm of firm i’s market capitalization (price times shares outstanding) at the end of year t.
LOGMBit is the natural logarithm of firm i’s market cap divided by its book value at the end of
15 A notable exception is the series of monthly returns that we use for the time-series regressions, which spans the period 1926-2004. 16 Another screen sometimes used in empirical analyses over the universe of stocks is to drop firms with book values of less than 10 million dollars. We have replicated our analyses below using this additional screen and found similar results.
12

year t. VARit is the variance of daily (simple, raw) returns during year t. BETAit is the beta of firm
i’s industry, among the 49 industries listed in Table 1, in year t. PRINVit is the inverse of firm i’s
share price at the end of year t. RETit is the average monthly return on stock i during year t.
The summary statistics for these variables are provided in Panel A of Table 2. The time-
series average of the cross-sectional means of IO is 0.27, and the time-series average of the cross-
sectional standard deviations of IO is 0.22. In other words, in a typical year, a typical firm has
about 27% of its shares held by institutions, and the standard deviation of institutional ownership
in a typical cross-section is 22%. The other variables are standard and do not merit discussion,
except to report that their summary statistics are similar to those found in earlier studies.
B. Variables in Analyst Coverage Regressions
Our measure of analyst coverage is LOGCOVit, defined as the natural logarithm of one
plus the number of analysts covering firm i at the end of year t. As in earlier studies, stocks that
do not appear in IBES are assumed to have no analyst estimates.17 The other variables used in
these regressions are constructed in the same way as those in the ownership regressions. The
summary statistics for these variables over the period of 1976-2003 are reported in Panel B of
Table 2. Note that the time-series average of the cross-sectional means of LOGCOV is 0.91, and
the time-series average of the cross-sectional standard deviations is 0.99. Thus in a typical year, a
typical firm has about 2.5 analysts with a standard deviation of about 2.7 analysts. The summary
statistics for the other variables in Panel B differ slightly from those in Panel A because of their
different sample periods.
C. Variables in Time-Series Return Regressions
17 If a stock does not have an analyst estimate at the end of the year, we look backwards through the year to find the most recent estimate and use this as the measure of analyst coverage for the firm during the year. Alternatively, we also have experimented with using October 1 as a cut-off date. In other words, if a stock does not have any analyst estimates in the last quarter, then it is recorded as having zero analyst estimates for the year.
13

In our time-series return regressions, the dependent variable SINPt−COMPt is the monthly
return of an equal-weighted portfolio of sin stocks in month t, net of the monthly return of an
equal-weighted portfolio of comparable stocks that belong to the Fama and French (1997)
industry groups 2 (food), 3 (soda), 7 (fun), and 43 (meals and hotels). MKTPREMt is the monthly
return of the CRSP value-weighted portfolio in month t, net of the risk-free rate. SMBt, HMLt,
and MOMt are well-known portfolio return series downloaded from Ken French’s website. SMB
is the monthly return of a portfolio that is long on small stocks and short on large stocks. HML is
the monthly return of a portfolio that is long on high book-to-market stocks and short on low
book-to-market stocks. MOM is the monthly return of a portfolio that is long on past one-year
return winners and short on past one-year return losers. The summary statistics for the various
portfolio returns are presented in Panel C of Table 2.
D. Variables in Cross-Sectional Return Regressions
Our empirical analyses of sin stock returns will employ monthly measures of returns as
dependent variables. In our cross-sectional return regressions, the dependent variable EXMRETit
is the monthly return of an individual stock i in month t net of the risk-free rate. LOGSIZEit is
defined as in Panel A, except that we now calculate LOGSIZEit on a monthly as opposed to
annual basis. BETAit is the time-varying beta of the industry to which firm i belongs, calculated
over the most recent three years of monthly data leading up to and including month t. TURNit is
the average of daily share turnover in stock i—defined as shares traded divided by shares
outstanding—during month t. LOGMBit is the natural logarithm of the market-to-book ratio of
stock i at the end of month t. RETit is the average of the most recent twelve months of returns on
stock i leading up to and including month t. Finally, LOGAGE is the natural logarithm of the
firm’s age, measured by the number of years available in the CRSP/Compustat data. The
summary statistics of these variables are reported in Panel D of Table 2.
E. Variables in Price-to-Book Regressions
14

LOGMBit is the natural logarithm of firm i’s market-to-book ratio measured at the end of
year t. ROEit is firm i’s return on equity in year t. ROE is calculated as the ratio of earnings
during year t over the book value of equity at the end of year t. Earnings are calculated as income
before extraordinary items available to common stockholders (Item 237), plus deferred taxes
from the income statement (Item 50), plus investment tax credit (Item 51). RDSALESit is the
fraction of firm i’s research and development expenditures (Item 46) to firm sales (Item 12) in
year t. We also introduce RDMISSit, which is a dummy variable that equals one if firm i’s R&D
expenditures observation in year t is missing. SP500it is a dummy variable equal to one if
company i is part of the S&P 500 Index in year t. The time-series average of the cross-sectional
means of LOGMB is 0.37, and the time-series average of the cross-sectional standard deviations
is 0.76. Thus in a typical year, a typical firm in our sample has a market-to-book ratio of 1.45
with a standard deviation of about 2.14. The summary statistics for these variables are reported in
Panel E of Table 2.
F. Variables in Corporate Financing Decision Regressions
The book leverage of firm i in year t, denoted by BLEVit, is total debt divided by the sum
of total debt and book equity ((Item 9+Item 34)/(Item 9+Item 34+Item 216)), measured at fiscal
year-end. We also use market leverage, denoted by MLEVit, which is the same as BLEV except
that we replace Item 216 with the firm’s market capitalization (the average of firm i’s market
capitalization over calendar year t). CASHit is firm i’s cash balances (Item 1) divided by book
assets at the start of year t (Item 6). For firm i in year t, PAYOUTit is calculated as COMPUSTAT
Item 115 minus preferred stock reduction plus Item 21, all divided by net income (Item 172),
where the preferred stock reduction is the maximum between zero and the difference between the
previous year’s Item 10 and the current year’s Item 10. We then break down this payout variable
into its constituent parts. DIVPAYit is firm i’s dividend payout ratio in year t, namely Item 21
15

divided by Item 172. REPit is firm i’s repurchases divided by net income in year t (Item 115
minus preferred stock reduction, all divided by Item 172).
Tobin’s Q, TOBQit, is the market value of equity (price times shares outstanding from
CRSP) plus assets minus the book value of equity (Item 60+Item 74), all divided by assets,
measured at the end of year t. Asset tangibility, TANGit, is defined as firm i’s net plant, property,
and equipment (Item 8) divided by total assets at the end of year t (Item 6) and expressed in
percentage terms. Profitability, PROFITit, is defined as earnings before interest, taxes, and
depreciation (Item 13) divided by total assets at the end of year t and expressed in percentage
terms. Finally, LOGSALESit is the natural logarithm of net sales of firm i in year t (Item 12).
IV. Results
A. Institutional Ownership
In this section, we test whether the shares of sin stocks are less held by institutions that
are subject to social norm pressures, while controlling for a host of other firm characteristics such
as firm size and stock beta. We hypothesize that institutions such as pension funds, universities,
religious organizations, banks, and insurance companies are less willing than other types of
investors to hold sin stocks due to the public nature of their investments, their diverse
constituencies, and their exposure to public scrutiny (e.g., picketing by an unhappy minority).
Our empirical objective is to determine whether sin stocks have a different institutional
investor following than do other stocks. Our task is complicated by the fact that sin stocks will
differ from other stocks along a number of other dimensions such as firm size and firm beta.
Indeed, earlier research has identified some key firm characteristics that are correlated with
institutional ownership.18 For example, one reason why firm size is correlated with ownership by
institutions is that institutions tend to avoid small stocks because of liquidity issues. In this paper,
we remain agnostic about why certain firm characteristics tend to be correlated with ownership by
18 For evidence related to predictors of institutional ownership, see Del Guercio (1996) and Gompers and Metrick (2001).
16

institutions. Our strategy is to soak up as much of the cross-sectional variation as possible so that
we can better identify the differential effect of sin stocks compared to non-sin stocks.
To this end, we estimate the following regression specification:
IOit = a0 + a1 SINDUMit + a2 Xit + εit i=1,…, N, (1)
where SINDUM equals one if the stock is a sin stock and zero otherwise, Xit is a vector of firm
characteristics and εit is measurement error. Xit includes various permutations of the following
variables defined earlier: LOGSIZE, BETA, LOGMB, PRINV, VAR, and RET. Also included in
the set of control variables are NASD, a dummy that equals one if the stock is listed on NASDAQ
and zero otherwise; and SP500, a dummy variable that equals one if the stock is part of the S&P
500 index and zero otherwise. The coefficient of interest is a1, which measures whether sin
stocks have a different ownership structure than other stocks, controlling for the other firm
characteristics contained in Xit. The null hypothesis is that a1 equals zero, whereas our prediction
is that it will be significantly less than zero.
In order to interpret the coefficient on the sin stock dummy variable SINDUM as a test of
social norm effects, we must address the possibility that it might pick up other effects associated
with the industries in which our sin stocks reside. In particular, our sin stocks tend to be
consumer goods, and it is possible that consumer goods differ from other industries in terms of
attracting institutional ownership. To eliminate this potentially confounding interpretation, we
create two new control variables. The first and more straightforward one is ONEDIGDUM,
which equals one if a stock resides in the same one-digit SIC code industry as any of our sin
stocks and zero otherwise. With the inclusion of ONEDIGDUM, our SINDUM effect cannot be
interpreted in terms of institutions favoring certain one-digit SIC code industries over others.
17

A more subtle and potentially more conservative way to address the issue of related
industry effects on institutional ownership is to find comparables for our sin stocks.
Conveniently, the Fama and French (1997) industry groups 2 (food), 3 (soda), 7 (fun), and 43
(meals and hotels) provide natural comparables to our sin stocks. Indeed, in some other industry
classification schemes, beer is often lumped together with soda, as is tobacco or smoke with food
and gaming with fun and meals. Accordingly, we create the dummy variable GDUM, which
equals one if a stock resides in the set of Fama and French (1997) industry classifications 2
(food), 3 (soda), 4 (beer), 5 (smoke), 7 (fun), 43 (meals), and our 49th industry (gaming), and zero
otherwise. With GDUM as a control variable, our sin stock effect cannot be interpreted in terms
of institutions favoring other industries over the consumer industries included in the definition of
GDUM. This careful matching of sin stocks to industry comparables and other stock
characteristics is the core of our identification strategy.
We estimate our regression model using the ultra-conservative method of running a
pooled (panel) regression and calculating standard errors by clustering at the industry level (using
our 49 industry groupings). This approach addresses the concern that the errors, conditional on
the independent variables, are correlated within industry groupings (e.g., Moulton (1986)). One
reason why this may occur is that if an institution decides to invest in a stock in a particular
industry, it also may invest in comparables in the same industry for reasons of liquidity or
diversification. We also have estimated our model using the Fama and MacBeth (1973)
methodology with Newey and West (1987) standard errors, and we obtain similar results. We
report our findings from the estimation with industry-clustered standard errors because this
method makes fewer assumptions about how the errors are correlated over time, and thus it is
likely to give us more conservative standard errors.19
19 Where appropriate, we also have performed tobit regressions. The results of the tests remain qualitatively similar.
18

Our results from estimating various specifications of equation (1) are reported in Panel A
of Table 3. In column (1), we report our estimates of a model that includes as independent
variables SINDUM, ONEDIGDUM, LOGSIZE, BETA, NASD, and SP500. We find that the
coefficient in front of SINDUM is -0.0519 and is statistically significant at the 1% level of
significance. The coefficient in front of ONEDIGDUM is positive but tiny and statistically
insignificant. The mean institutional ownership in our sample is 24%. There is no difference in
institutional ownership between sin stock comparables in the same one-digit SIC code and the
rest of the sample. In contrast, sin stocks on average have about 19% of their shares held by
institutions, which represents about a 21 percent shortfall relative to the mean. Both LOGSIZE
and BETA attract positive and statistically significant coefficients, suggesting that institutions
seem to favor big firms and firms from industries with high market betas. Finally, NASDAQ
stocks and stocks in the S&P 500 Index have less institutional ownership as compared to other
stocks.20
In column (2), we replace ONEDIGDUM with GDUM. The estimated coefficient on
GDUM bears a negative sign (-0.0167), suggesting that institutions may shy away from consumer
goods relative to other industries, but it is statistically insignificant. However, including GDUM
rather than ONEDIGDUM reduces the economic effect of our SINDUM variable. The coefficient
in front of SINDUM is now -0.0355, but it remains statistically significant at the 10% level of
significance. Despite its reduction in magnitude in this version of our model, the economic effect
of sin stocks on institutional ownership is still sizeable. The sin stock comparables (defined as
those with similar Fama-French (1997) industry groupings as our sin stocks) have on average
about 22% of their shares held by institutions. In contrast, sin stocks have about 19% of their
shares held by institutions, which is approximately a 14 percent lower institutional ownership
ratio than their comparables.
20 Falkenstein (1996) documents similar findings for a sample of mutual funds.
19

In columns (3)-(6), we successively experiment with different permutations of control
variables to illustrate the robustness of our finding. In column (3), we include LOGMB as an
additional control; in column (4), we substitute PRICEINV for LOGMB since these two variables
are highly correlated, as both are scaled by price. PRICEINV appears to reduce our sin stock
effect by more than LOGMB does, so we will continue to use PRICEINV instead of LOGMB in
the remaining specifications. In column (5), we add in STD (standard deviation of stock return)
and find that it attracts a negative coefficient and is statistically significant, indicating that
institutions tend to favor low variance stocks. Finally in column (6), we add in the average
monthly return over the past twelve months (RET). RET attracts a negative coefficient and also is
statistically significant. The key observation to make across all of these alternative specifications
is that the coefficient in front of SINDUM remains statistically significant throughout at the 10%
level of significance, with economic effects that are similar to that reported in column (2). For
instance, in column (6), sin stocks are still estimated to have a 14 percent lower institutional
ownership ratio than their comparables.21
Next, we respecify the ownership regression to disaggregate the effects of sin stocks on
holdings by different classes of institutions. Note that for these regressions the data run only
from 1980 to 1997.22 As described earlier, our data set disaggregates ownership information into
five types of institutions: type 1 representing banks, type 2 insurance companies, type 3 mutual
funds, type 4 independent investment advisors, and type 5 all other institutions, including
universities, employee stock ownership plans, etc. We expect type 3 and type 4 institutions to be
less constrained by social norms as compared to the other three types of institutions, since types 3
and 4 are the natural arbitrageurs in the market. Accordingly, we divide the institutions in our
21 The cross-sectional relationships between ownership and the various firm characteristics examined in this section also are very stable across years. (A table that reports this cross-sectional regression year by year is available on request.) 22 The truncation of our sample is necessitated by vendor-distributor compatibility issues in the data on institution types after 1997. After 1997, many institutions in the data are erroneously labeled as type 5 institutions. For completeness, we also have run a pooled regression that includes data after 1997 and found similar results.
20

data set into two sub-groups, placing type 1, type 2, and type 5 in one group and type 3 and type 4
in another group. We then create two new dependent variables for the regression specification
reported in column (6) of Panel A, Table 3. The first of these is the fraction of shares of a
company held by type 3 and 4 institutions, and the second is the fraction of shares held by type 1,
2, and 5 institutions.
Our findings from estimating the column (6) regression specification on the new
disaggregated measures of institutional ownership are reported in Panel B of Table 3. Consistent
with our earlier findings for all institutions, for the type 1, 2, and 5 institutions the coefficient in
front of SINDUM is negative (-0.0270) and statistically significant at the 5% level of significance.
In contrast, the coefficient in front of SINDUM for the type 3 and 4 institutions is smaller in
absolute magnitude (-0.0111) and statistically insignificant. Indeed, a t-test of the difference in
the magnitudes between these two coefficients (-0.0159) is statistically significant at the 1% level
of significance. In other words, sin stocks are not less held by mutual funds and independent
investment advisors. This fits well with our hypothesis that mutual funds and hedge funds are the
most likely types of institutions to play the role of arbitrageurs and buy sin stocks if they are
ignored and priced cheaply.
B. Analyst Coverage
In light of our finding that sin stocks have lower institutional ownership as compared to
other stocks, logic suggests that sin stocks also should be less followed by sell-side analysts who
produce financial reports and analyses on companies. To test this prediction, we utilize the same
methodology as developed above for our analysis of institutional ownership. This methodology
also may be viewed as an extension of earlier studies on the determinants of analyst coverage,
such as Hong, Lim, and Stein (2000).
In this section, we estimate the following cross-sectional regression specification:
21

LOGCOVit = b0 + b1 SINDUMit + b2 Xit + εit i=1,…, N, (2)
where SINDUM equals one if the stock is a sin stock and zero otherwise; Xit is a vector of firm
characteristics and εit is measurement error. The components of Xit and the estimation
methodology are the same as described above for regression specification (1).
The results are presented in Panel C of Table 3, whose layout parallels that of Panel A
above. Accordingly, we are able to quickly summarize our key findings. Notice that the
coefficient in front of SINDUM is negative and statistically significant across five out of the six
columns representing alternative specifications of our model. The coefficient in front of GDUM
is tiny and statistically insignificant. In column (6), again our most conservative specification,
the coefficient in front of SINDUM is -0.1477 and is statistically significant at the 10% level of
significance.23 In terms of the absolute number of analysts, the typical firm has about 2.57
analysts covering it, whereas a sin stock has about 2.19 (about one-half fewer analysts or a 15
percent decline relative to the mean). As for the other variables, they attract coefficients that are
similar to what already has been documented in Hong, Lim, and Stein (2000).
One potential alternative explanation for these findings is that sin stocks are mature
companies that do little equity issuance and hence attract little analyst coverage. To disentangle
this effect, we construct from the SDC Equity Issuance Database the annual amount of equity
issuances done by companies and include this as a control variable. Adding this variable does not
change our results, and therefore we omit the results from this augmented specification for
brevity.
In sum, we have obtained compelling evidence that sin stocks are less held or followed
by certain institutions and analysts who discriminate against sin stocks for social norm rationales; 23 In column (3), using LOGMB as a control rather than PRICEINV yields a much larger point estimate on SINDUM (-0.1704), but weakens its statistical significance. The convention in the literature is to use PRICEINV which we follow here for comparability. When we include the other controls as in the later columns, then we still get a statistically significant estimate on SINDUM even when using LOGMB rather than PRICEINV as a control.
22

and in their absence, arbitrageurs comprised of mutual funds and hedge funds (and individuals)
are willing to buy these stocks. These findings are consistent with both Becker’s theory of racial
discrimination by employers and Arrow’s subsequent remark on arbitrage by employers who are
willing to flout social convention to take advantage of unemployed, talented labor. In our
investigation of social norms in the stock market, the question that remains is whether social
norms affect the prices of sin stocks, i.e. is there enough arbitrage capital to completely eliminate
any norm-induced price effects?
C. Implications for Stock Prices
To address this question, we examine the return performance of sin stocks. If sin stocks
are neglected and faced litigation risk heightened by social norms, as we claim, and there are
limits to arbitrage, then we ought to find that sin stocks outperform comparables.
We employ a number of methodologies to study the potential price effects of social
norms on sin stocks. First and most conventionally, we employ the methodology of analyzing the
time series of the returns of a sin stock portfolio, net of comparables, for evidence of any excess
returns, after adjusting for various well-known predictors of stock returns such as the market
portfolio. One huge benefit of the time-series methodology is that we have a large sample period
from 1926-2004. The first model we estimate is the CAPM:
Rt = α + β VWRFt + εt t=1,…, T, (3)
where Rt is the return on SIN-COMP, an equal-weighted portfolio long sin stocks and short their
comparables; VWRF is the value-weighted market portfolio; and εt represents a generic error
term that is uncorrelated with all other independent variables. The coefficient of interest is α,
representing the excess return of the sin stock portfolio. We also consider three additional
performance models by adding the portfolio returns SMB, HML, and MOM as independent
23

variables in specification (3). Our most conservative specification thus is given by the following
four-factor model:
Rt = α + β1 VWRFt + β2 SMBt + β3 HMLt + β4 MOMt + εt t=1,…, T, (4)
where Rt again denotes the return on the portfolio long sin stocks and short comparables, α is the
excess return of that portfolio, βi’s are loadings on the other portfolios that are used to predict Rt,
and εt is a generic error term that is uncorrelated with all other independent variables.
The results for the various specifications are presented in Panel A of Table 4. The
CAPM yields an alpha of 0.0045 (or 45 basis points per month), which is statistically significant
at the 5% level. For the two-factor model (market and SMB), the alpha is slightly higher at 47
basis points a month and is now statistically significant at the 1% level. When we subsequently
include HML to generate the next row of results, we find that the alpha increases to 57 basis
points per month and is still highly statistically significant. Finally, we add in MOM and the
alpha is cut down to 39 basis points per month in our most conservative specification, but it is
still significant at the 5% level of significance.
Our focus on a portfolio long sin stocks and short comparables yields the most
conservative estimates. Just looking at a portfolio long sin stocks would yield even more
significant out-performance of sin stocks relative to these benchmarks. (Results are available
from the authors and excluded for brevity). However, the time-series analysis of looking at a
long sin portfolio leaves wanting whether the out-performance is simply due to their comparables
having also done well.
We next use cross-sectional variation to investigate whether sin stocks outperform other
comparable stocks. We estimate the following return forecasting specification:
EXMRETit = c0 + c1 SINDUMit-1 + c2 Xit-1 + εit i=1,…, N, (5)
24

where EXMRET is the return of stock i net of the risk-free rate; SINDUM equals one if the stock
is a sin stock and zero otherwise; Xit-1 is a vector of firm characteristics and εit is measurement
error. Xit-1 includes various permutations of variables that have been defined earlier, including
LOGSIZE, RET, and LOGMB. Since we now are running forecasting regressions, BETA
represents the time-varying industry beta estimated using the past three years of monthly returns.
Data on firm characteristics only begins in 1962. Accordingly, the sample for our estimation of
equation (5) starts in 1965.
The coefficient of interest is c1, which measures whether sin stocks have an abnormal
return performance controlling for a host of other firm characteristics. The null hypothesis is that
it is zero, whereas our prediction is that it will be significantly greater than zero. c2 is the vector
of loadings on the control variables. We then take the estimates from these monthly regressions
(weighted by market capitalizations) and follow Fama and MacBeth (1973) in taking their time-
series means and standard deviations (using Newey and West (1987) standard errors) to form our
overall estimates of the effects of being a sin stock on return performance.
The results are presented in Panel B of Table 4. While we present various permutations
of the regression specification (5), the main one to focus on is the specification described in
column (6) that includes beta, size, past returns, past turnover, market-to-book, GDUM and the
log of the age of the firm (LOGAGE) as controls. GDUM picks up the effect due to comparables
and LOGAGE has been shown to forecast firm profitability. In this specification, the coefficient
in front of SINDUM is 0.0030 and is statistically significant at the 10% level of significance. In
other words, sin stocks outperform other comparable stocks by about 30 basis points per month or
about 3.6 percent per year. As earlier papers also have found, BETA is statistically insignificant
in these cross-sectional regressions. LOGSIZE has a negative effect (big stocks underperform
small stocks), past returns positively predict future returns (i.e., there is momentum over short
25

horizons but not over long horizons), turnover positively forecasts returns and market-to-book
negatively forecasts returns.
Finally, we compare the market-to-book ratios of sin stocks to their counterparts using
the following specification adapted from Hong, Kubik, and Stein (2005):
LOGMBit = d0 + d1 SINDUMit + d2 Xit + εit i=1,…, N, (6)
where SINDUM equals one if the stock is a sin stock and zero otherwise; Xit is a vector of firm
characteristics including return-on-equity (ROE), research and development expenditures as a
fraction of sales (RDSALES), a dummy variable if the firm is missing R&D data (RDMISS), an
S&P500 dummy (SPDUM) and our GDUM dummy capturing sin stocks and sin stock
comparables (food, soda, fun, meals, and hotels); εit is measurement error; and the estimation
methodology is the same as described earlier for regression specification (1).
The results are presented in Panel C of Table 4. In column (1), we run the cross-sectional
regression year by year. The coefficients are subsequently aggregated using the methodology of
Fama and MacBeth (1973), in which standard errors are adjusted for possible autocorrelation.
The coefficient on SINDUM is -0.1664 and is significant at the 1% level of significance. We thus
find sin stocks’ market-to-book ratios are smaller relative to comparables by nearly 17%. The
coefficients on ROE, RDSALES, and SPDUM are positive and significant, while the coefficient
on the dummy variable for missing R&D data is negative and significant as expected. These
latter findings are consistent with the results reported by Hong, Kubik, and Stein (2005).
Interestingly, the coefficient on GDUM is positive, suggesting that the prices of sin stock
comparables actually are richer than those of other stocks, but it is not statistically significant. In
column (2), we estimate the same model, this time using the pooling regression with standard
errors clustered within 49-industry groupings. The coefficient in front of SINDUM drops slightly
26

to -0.1505, but it is still significant at the 10% level of significance. The other coefficients remain
qualitatively similar.
In summary, all three methodologies that we have used to investigate the price effects of
social norms on sin stocks yield economically interesting effects. We view the magnitude of the
effect implied by the price-to-book regressions, namely that sin stocks are underpriced by about
15% on average, as the most conservative but this methodology is the least conventional. The
economic effects implied by the returns regressions (both time-series and cross-sectional) are
about 2-4% per year in expected return differential. These results are less conservative but the
methodologies are much more conventional.
D. Robustness Checks and Calibrations
We have explored a number of robustness checks to the findings reported in this paper,
which we will briefly describe in this section but omit their full reporting for brevity. We have
checked that our sin stock portfolio performance is not driven only by tobacco stocks. While
including tobacco does make the results stronger, the four-factor alpha for sin stock net of
tobacco is 36 basis points per month in the time-series test, only slightly smaller than with
tobacco. As we mentioned earlier in Section II, defense stocks are considered by some to be
sinful. We have redone all of our analyses with defense stocks included in the sin category. Our
results remain qualitatively similar. We nevertheless focus on the so-called Triumvirate of Sin
(alcohol, tobacco, and gaming) since there is much stronger consensus on the characterization of
these industries.
In sum, our results indicate that a portfolio of sin stocks attracts a significant return
premium even when we benchmark the stocks against their closest competitors. In the time-series
tests, depending on the specification, the abnormal return on the sin portfolio, net of comparables,
equals around 40 basis points (or 4.8% annual excess return). In the cross-sectional tests, the
27

results are somewhat more conservative: the premium on sin stocks equals approximately 30
basis points per month (or about 3.6% annual excess return).
The question one can raise then is whether these magnitudes can be roughly reconciled
within a Merton style segmented market model. To answer this question, we relate our empirical
findings to calibrations done by Heinkel, Kraus, and Zechner (2001), henceforth HKZ, who
develop a model to consider the price implications of ethical investing that excludes companies
that pollute. 24 In our context, it is companies that produce sin. HKZ develops a model in the
spirit of Merton that looks at the price implications of limited risk sharing due to neglect induced
by social norms or ethical investing. Their price implications are precisely the ones tested here.
Our empirical findings match well with their calibration results, which we describe in
more detail in the Appendix. They choose parameters to obtain reasonable expected rates of
return and standard deviations. One key parameter is the fraction of investors that shun a stock
for social norm reasons. Since it is estimated that one out of every nine dollars under professional
management in the United States today is involved in SRI, a value for this parameter of between
10-15% is reasonable. Because of neglect or limited risk sharing, the CAPM no longer holds and
idiosyncratic risk and not just beta matters for pricing. As a result, the increased litigation risk
associated with the products of sin companies, which is further heightened by social norms,
should further increase the expected returns of sin stocks. So another key parameter is the cash-
flow risk of sin stocks compared to other stocks. Interestingly, their calibration exercises show
that (assuming an equity premium of around 8%) only slightly higher annual cash-flow risk, of a
couple of percent per year, between sin stocks engendered by social norms gives us differences in
abnormal returns of 3-5% per year, which is similar to what we find in the data.
E. Further Tests
24 We are indebted to Rob Heinkel and Alan Kraus for very insightful discussions on the calibration of their model.
28

We now seek to further validate our estimated price effects of social norms on sin stocks
by exploiting time variation in the social norms governing tobacco. As we described earlier in
Section II, tobacco was not widely considered to be sinful until the mid-sixties. Accordingly, our
hypothesis suggests that before that time, tobacco stocks should have been held by institutions
and covered by analysts as frequently as other stocks, and they should not have earned excess
returns. Unfortunately, due to data limitations, we can only test the implications regarding
returns, since the returns data date back to the 1920’s whereas data on ownership and coverage
are only available since the 1980’s.
In Table 5, we implement the most conservative (four-factor) time-series return
regression, whose results for all sin stocks were reported in Panel A of Table 4, for tobacco stocks
only over the distinct time periods of 1926-1964 and 1965-2004. Since tobacco was not
considered to be sinful until the latter period, we expect the equal-weighted portfolio of long
tobacco stocks and short comparables (TOB-FOOD) to behave more like a growth/glamour stock
(i.e. load negatively on HML) and perform less well during the earlier period as compared to the
latter period. This is in fact what we find. Notice that the loading on HML is -0.1882 during
1926-1964 and 0.0488 during 1965-2004. Also, the return of this portfolio in the latter period has
a monthly alpha of 0.0053, as compared to a value of 0.0005 during the earlier period. This
difference is significant at the 10% level of significance and is economically sizeable.
Accordingly, we conclude that the behavior of tobacco stock returns over time is consistent with
that of a regime change in social norms toward tobacco companies.
Finally, we investigate the implications of the price effects of social norms for the
financing decisions of sin companies. If the equity of sin stocks is undervalued because of
limited risk sharing or investors misestimating the risk of these companies as we have argued in
this paper, and hence it is more expensive for sin companies to finance operations using equity,
then we should expect them to use private debt to finance their operations. Debt markets offer the
additional advantage of being less transparent than equity markets. Whereas mutual funds and
29

institutions are required to disclose their positions in equities on a semi-annual basis, no such
requirements exist for investments in corporate bonds. Accordingly, it is difficult to figure out
for a given company who its financiers are on the debt side. While it is possible to track down
large public issuances of corporate bonds, large amounts of bank debt are difficult to trace.
Former SEC chairman Arthur Levitt, who pushed to increase transparency in the bond market
during his tenure, once remarked, “The sad truth is that investors in the corporate bond market do
not enjoy the same access to information as a car buyer or a home buyer or, dare I say, a fruit
buyer. And that’s unacceptable.”25
To determine if sin companies indeed use the debt market more than the equity market,
we implement a standard cross-sectional regression specification used in the corporate finance
literature to explain capital structure, i.e. leverage (see for example Baker and Wurgler (2002)).
We estimate the following cross-sectional regression specification:
FinancingDecisionit = e0 + e1 SINDUMit + e2 Xit + εit i=1,…, N, (7)
where SINDUM equals one if the stock is a sin stock and zero otherwise; Xit is a vector of firm
characteristics and εit is measurement error. Xit includes the variables GDUM, TOBQ, TANG,
PROFIT, and LOGSALES. The coefficient of interest is e1, which measures whether sin firms
have a different capital structure as compared to other companies. The null hypothesis is that it
is zero, whereas our prediction is that it will be significantly greater than zero when a measure of
leverage is used as the dependent variable in the regression. e2 is the vector of loadings on the
control variables. We then take the estimates from a pooled regression and cluster standard errors
by the 49 Fama and French (plus gaming) industries.
The results are presented in Table 6. In column (1), the dependent variable is market
leverage, MLEV. The coefficient in front of SINDUM is positive (0.0454) and statistically
25 The full text of Arthur Levitt’s speech from which this quote has been excerpted can be downloaded from http://www.sec.gov/news/speech/speecharchive/1998/spch218.htm.
30

significant at the 5% level of significance. The typical company has a market leverage of 0.28,
and thus we find that a sin company has a 13.9% higher leverage ratio than the typical company.
The coefficient on GDUM is basically zero. The coefficients in front of the other variables (other
than GDUM) are significant, as found in earlier work. In the regression that uses book leverage
(BLEV) as the dependent variable, the coefficient on SINDUM again comes in with the right sign,
but it is not as statistically significant as its counterpart in the regression analysis of MLEV. For
completeness, we also look to see whether there are differences in other financing decision
variables (CASH, PAYOUT, DIVPAY, REP) between sin stocks and other companies. The sin
stock effects are not statistically significant in these other regressions. In sum, it appears that sin
companies rely more on the debt market for financing than do other firms, consistent with the
hypothesis that they face a disadvantage in the equity market, but they do not differ markedly in
their other financing decisions.26
We also have attempted to test indirect implications of our hypotheses. Since sin stocks
are followed less by analysts and institutions, they may have higher illiquidity or bid-ask spreads.
However, we find only negligible differences in bid-ask spreads between sin stocks and other
stocks. There are a few reasons that may explain this negative finding. First, most sin companies
are highly regulated and have much better disclosure than do other companies. Accordingly,
there may be less information asymmetry for these stocks, leading to potentially lower spreads.
Second, the lack of institutional ownership actually has an ambiguous effect on spreads
depending on assumptions about the trading process. Therefore, indirect implications regarding
liquidity or other market micro-structure aspects of these companies are difficult to measure
unless we have more direct measures of the informational environments of companies.
V. Conclusion
26 We omit the detailed year-by-year regressions for brevity. Like earlier results, the coefficients are fairly stable from year-to-year. These results can be obtained from the authors.
31

In this paper, we provide evidence of significant effects of social norms on markets by
studying the investing environment of “sin” stocks—publicly traded companies involved in the
production of alcohol, tobacco, and gambling. Our main hypothesis is that there is a societal
norm against funding operations that promote human vice and that some investors, particularly
institutions subject to public scrutiny and social norms, pay a financial price for not holding these
stocks.
We provide a number of findings in support of this hypothesis. Sin stocks have less
institutional ownership and less analyst coverage than otherwise comparable stocks. However,
mutual fund companies and hedge funds play the role of the arbitrageur to some degree, as we
find that these investor types are equally willing to hold sin stocks as compared to other stocks.
Notwithstanding this arbitrage effect, our analysis associates social norms with significant price
effects: Sin stocks outperform comparables even after controlling for well-known return
predictors. Our return findings are in line with calibration results of models of ethical investing.
Additional tests involving time-varying norms and corporate decisions also confirm our
hypothesis. Taken together, our findings indicate that social norms can have important
consequences in the stock market and in markets more generally.
Our paper contributes to several literatures. The first is the literature on social norms and
markets. There is little empirical evidence on the effects of social norms on markets, and our
paper provides a rich context and data with which to measure these effects. The second is the
literature on institutional ownership and the factors that drive institutional holdings. We know
relatively little about what drives institutional ownership beyond simple correlations, and this
paper provides evidence that social norms can significantly influence institutional holdings. The
third is the literature on the value-glamour effect. Our paper provides an example of a set of
value stocks, the source of whose value comes from them being neglected for social norm
reasons. Much more work remains to be done on the empirics of social norms, and we are
32

hopeful that the stock market will continue to provide fertile ground for this important area of
research.
33

References
Ahrens, Dan, 2004, Investing in Vice, New York: St. Martin’s Press. Akerlof, George A., 1980, A theory of social custom, of which unemployment may be
one consequence, Quarterly Journal of Economics 94, 749-775. Altonji, Joseph and Rebecca Blank, 1999, “Race and Gender in the Labor Market,” in:
Handbook of Labor Economics, Vol. 3c, edited by David Card and Orley Ashenfelter.
Arrow, Kenneth J., 1972, Models of job discrimination, in: A.H. Pascal, ed., Racial Discrimination in Economic Life, Lexington, Mass: D.C. Heath, 83-102. Baker, Malcolm and Jeffrey Wurgler, 2002, Market timing and capital structure, Journal of Finance 57, 1-32.
Becker, Gary, 1957, The Economics of Discrimination, Chicago: University of Chicago Press.
Bulow, Jeremy and Paul Klemperer, 1998, The tobacco deal, Brookings Papers on
Economic Activity, 323-394. Case, Anne and Larry Katz, 1991, The company you keep: The effect of family and neighborhood on disadvantaged youths, NBER Working Paper.
Chen, Dar-Hsin and Feng-Shun Bin, 2001, Effects of legislation events on US gaming stock returns and market turnings, Tourism Management 22, 539-549.
Del Guercio, Diane, 1996, The Distorting Effect of the Prudent Man Law on Institutional Equity Investments, Journal of Financial Economics 40, 31-62.
Elster, Jon, 1989, Social norms and economic theory, Journal of Economic Perspectives 3, 99-117.
Falkenstein, Eric G., 1996, Preferences for stock characteristics as revealed by mutual
fund portfolio holdings, Journal of Finance 51, 111-135. Fama, Eugene and Kenneth R. French, 1997, Industry costs of equity, Journal of
Financial Economics 43, 153-193.
Fama, Eugene F. and James D. MacBeth, 1973, Risk, return, and equilibrium: empirical test, Journal of Political Economy 81, 607-636.
Geczy, Christopher C., Robert F. Stambaugh, and David Levin, 2003, Investing in socially responsible mutual funds, unpublished working paper.
Glaeser, Edward L., Bruce Sacerdote and Jose Scheinkman, 1996, Crime and social
interactions, Quarterly Journal of Economics 111, 502-548.
34

Glaeser, Edward and Jose Scheinkman, 2002, Non-market interactions, in Advances in Economics and Econometrics: Theory and Applications, Eight World Congress, M. Dewatripont, L.P. Hansen, and S. Turnovsky (eds.), Cambridge University Press.
Gompers Paul and Andrew Metrick, 2001, Institutional investors and equity prices, The
Quarterly Journal of Economics 116, 229-259. Greene, W.H., 2000, Econometric Analysis, Macmillan, New York. Guiso, Luigi, Paola Sapienza, and Luigi Zingales, 2003, People’s opium? Religion and
economic attitudes, Journal of Monetary Economics 50, 225-282. Heinkel, Robert, Alan Kraus, and Josef Zechner, 2001, The effect of green investment on
corporate behavior, Journal of Financial and Quantitative Analysis 35, 431-449. Hong, Harrison, Jeffrey D. Kubik, and Jeremy C. Stein, 2004, Social interaction and stock market participation, Journal of Finance 59, 137-163.
Hong, Harrison, Jeffrey D. Kubik, and Jeremy C. Stein, 2005, The only game in town: The stock price consequences of local bias, Princeton University Working Paper. Hong Harrison, Terrence Lim, and Jeremy C. Stein, 2000, Bad news travels slowly: size, analyst coverage and the profitability of momentum strategies, Journal of Finance 55, 265-295.
Levitt, Steven, 2004, Testing theories of discrimination: Evidence from weakest link, Journal of Law and Economics 47, 431-452.
Merton, Robert C., 1987, A simple model of capital market equilibrium with incomplete
information, Journal of Finance 42, 483-510. Moulton, Brent, 1986, Random group effects and the precision of regression estimates, Journal of Econometrics 32, 385-397.
Newey, Whitney K. and Kenneth D. West, 1987, A simple positive-definite heteroskedasticity and autocorrelation consistent covariance matrix, Econometrica 55, 703-708.
Romer, David, 1984, The theory of social custom: A modification and some extensions, Quarterly Journal of Economics 99, 717-727.
Shleifer, Andrei and Robert W. Vishny, 1997, The limits of arbitrage, Journal of Finance
52, 35-55.
Teoh Siew Hong, Ivo Welch, and Paul C. Wazzan, 1999, The effect of socially activist investment policies on the financial markets: Evidence from the South African Boycott, Journal of Business 72, 35-89.
Waxler, Caroline, 2004, Stocking Up on Sin, New Jersey: John Wiley & Sons, Inc.
35

Appendix This appendix provides details on the calibration of HKZ. In brief, HKZ consider a one-period model with
N firms of the following three types: NA acceptable (A) firms that satisfy the investing criteria of the green
investors, NU unacceptable (U) firms that do not satisfy such criteria, and NR reformed (R) firms that have
achieved acceptability after incurring a certain cost, K. Each A firm uses the clean technology and generates
a normally distributed cash flow with mean µC and variance σ2C. Firms U and R use the polluting
technology and generate normally distributed cash flow with mean µP and variance σ2P. The cash flows of
firms A are perfectly correlated as are the cash flows of firms U and R; the covariance between C and P
technology is σCP. In addition, a riskless asset with a rate of return normalized to zero is available in
perfectly elastic supply. Borrowing is allowed, but short selling is prohibited.
In this economy, there are two types of investors, g and n, who differ in terms of their attitude to
environmental damage. The former group abstains from holding shares in unacceptable firms, while the
latter group does not internalize this fact in their preferences. In the context of our paper, the g investors are
the ones who are subject to social norms and do not invest in sin stocks, while the n investors do not
consider sin to be unacceptable. The total number of investors in the economy is I with Ig of green and In of
neutral investors. Each investor exhibits CARA preferences with risk tolerance τ.
Equations (14)-(16) in HKZ provide equilibrium prices for each of the three types of companies,
A, U, and R, but, since our focus is on price of unethical investing, we restrict our analysis to the one
related to the price of company U (eq. (15)).
PU = µP – 1/(Iτ) [NCσCP + NUσ2P + NU(Ig/In)(φ/σ2
C)+ NR(σ2CP/σ2
C)], (A.1)
where φ = σ2C σ2
P – σ2CP.
Our goal is to verify whether prices observed for sin stocks could be obtained within the modeling
framework outlined above. Absent these social norms, the assumptions of HKZ would yield the CAPM.
However, CAPM is not valid with substantial ethical investors in the economy and idiosyncratic (or
cashflow) risk is priced. To calibrate our results we focus on the sensitivity of the expected returns of
unacceptable (sin) firms to changes in the number of green (ethical) investors. Empirical evidence suggests
that the proportion of green investors in the investing world approximately equals 10-15%. Therefore, with
this number in mind we should expect the abnormal returns we obtain for sin stocks be comparable to those
calibrated to the model.
We begin our calibration with the original numbers proposed by HKZ. HKZ argue that the
parameters they choose produce reasonable expected rates of returns. In addition, the variance-covariance
matrix of cash flows produces reasonable results for the standard deviation of rate of return (p. 439). In
particular, they use the following set of parameters (p. 439):
Mean Cash Flows: µP = µC =10
Standard Deviation of Cash Flows: σP = σC = 10
Covariance of cash flows: σCP = 50
Reforming Cost: K = 0.5
36

Total Number of Investors: I = 1
Total Number of Firms: N = 1
Number of Firms with Each Technology: NP = NC = 0.5
Aggregate Risk Tolerance: τ = 100
Market premium: µM = 8%
The quantity of our interest is abnormal return, which in the context of their model is equal to
(µP/PU)–1. HKZ assume that the cash-flow risk of all firms in the economy is the same and equal to 10.
However, in our context, sin stocks may have higher cash-flow risk than comparable firms because of the
litigation risk that affects their operations. Since firm-specific risk is a priced risk in this framework, our
calibration attempts to illustrate the sensitivity of the sin stock premium also conditioning on changing
cash-flow risk. We consider five different values of the risk: 10 (base case), 11, 12, 12.5, and 13. Figure 1
illustrates the relation between the abnormal return on unacceptable (sin) stocks as a function of the
proportion of green investors for the different levels of cash-flow risk of the unacceptable firms.
0.000
0.020
0.040
0.060
0.080
0.100
0.120
0.000 0.0
5 0.1 0.15 0.2 0.2
5 0.3 0.35 0.4 0.4
5 0.5 0.55 0.6 0.6
5 0.7 0.75 0.8 0.8
5 0.9 0.95
CF = 10 CF = 11 CF = 12 CF = 12.5 CF = 13 T-S Estimation C-S Estimation
We can see that the return premium on unacceptable firms goes up as we increase the proportion
of green investors in the economy. Also, conditional on the proportion of green investors, this premium
goes up as we increase the level of the cash-flow risk of the unacceptable firms. To get an impression of
how closely our empirical results match those from the calibration exercise we superimpose two bounds
that reflect the range of values of sin premium obtained from our estimation in Table 4. The lower bound
corresponds to the cross-sectional test, while the upper bound corresponds to the time-series test. Notice
that assuming the fraction of ethical investors is between 10-15%, values of cash-flow risk between 12 to
13 (a couple of percent higher than other stocks) would generate expected returns consistent with our
37

findings. Hence, we conclude that the estimation results we obtain for sin portfolio can be reconciled
within a standard model with some heterogeneity in cash-flow risk among firms.
Note that in our calibration we focused solely on the effect generated by changes in relative cash-
flow risks. It is actually interesting that better calibration results could be also obtained by increasing the
covariance parameter between the two technologies, by changing the values of cost of reform (K), or by
decreasing the risk tolerance of investors.
38

Table 1: Profile of Sin Stocks This table reports summary statistics about the sin stocks. In Panel A, we report year-by-year the number of sin stocks that fall into the three sub-groups of tobacco, alcohol, and gaming. In Panel B, we report market betas calculated using value-weighted monthly returns on 48 Fama and French (1997) industry portfolios along with our 49th gaming portfolio. The data span the period of 1926-2004. Panel A: Distribution by Year
Year All Tobacco Alcohol Gaming 1926 18 15 3 0 1927 21 18 3 0 1928 20 17 3 0 1929 21 17 4 0 1930 21 17 4 0 1931 21 17 4 0 1932 21 17 4 0 1933 22 16 6 0 1934 22 16 6 0 1935 23 16 7 0 1936 25 16 9 0 1937 25 16 9 0 1938 25 16 9 0 1939 25 16 9 0 1940 25 16 9 0 1941 23 14 9 0 1942 23 14 9 0 1943 23 14 9 0 1944 23 14 9 0 1945 24 14 10 0 1946 26 14 12 0 1947 27 14 12 1 1948 27 13 13 1 1949 26 12 13 1 1950 25 11 13 1 1951 25 11 13 1 1952 24 11 12 1 1953 25 11 13 1 1954 25 11 13 1 1955 25 11 13 1 1956 25 11 13 1 1957 24 10 13 1 1958 23 9 13 1 1959 23 10 12 1 1960 23 10 12 1 1961 23 10 12 1 1962 23 10 12 1 1963 25 10 13 2 1964 26 11 13 2 1965 26 11 13 2 1966 26 11 13 2 1967 27 11 14 2 1968 27 11 14 2 1969 30 11 16 3 1970 32 12 16 4 1971 32 12 16 4 1972 38 12 20 6 1973 41 12 22 7
39

1974 41 12 22 7 1975 42 12 23 7 1976 42 12 23 7 1977 42 12 23 7 1978 45 12 23 10 1979 48 12 23 13 1980 50 12 24 14 1981 55 12 24 19 1982 56 12 25 19 1983 58 11 26 21 1984 62 12 27 23 1985 62 11 27 24 1986 60 9 26 25 1987 59 9 24 26 1988 60 9 24 27 1989 61 9 25 27 1990 64 9 23 32 1991 67 10 23 34 1992 70 11 21 38 1993 90 11 23 56 1994 98 11 22 65 1995 106 13 25 68 1996 110 15 30 65 1997 116 16 32 68 1998 107 13 31 63 1999 98 13 32 53 2000 82 11 29 42 2001 73 9 26 38 2002 69 7 25 37 2003 65 7 23 35 2004 63 8 21 34 Total 193 36 62 95
40

Panel B: Industry Market Betas Industry Beta Industry Beta Agriculture 0.97 Guns 0.92 Food 0.73 Gold 0.74 Soda 0.82 Mines 1.00 Beer 0.76 Coal 1.00 Smoke 0.74 Oil 0.78 Toys 1.45 Utilities 0.55 Fun 1.28 Telecommunication 0.80 Books 1.06 Personal Services 1.18 Household 0.95 Business Services 1.36 Clothes 1.11 Computers 1.18 Healthcare 1.28 Chips 1.44 Medical Equipment 0.90 Laboratory Equipment 1.43 Drugs 0.87 Paper 1.00 Chemicals 0.98 Boxes 0.87 Rubber 1.11 Transport 1.10 Textiles 0.98 Wholesalers 1.12 Building Materials 1.09 Retailers 1.04 Construction 1.30 Meals 1.16 Steel 1.12 Banks 1.03 Fabricated Products 1.04 Insurance 0.90 Machinery 1.17 Real Estate 1.13 Electrical Equipment 1.23 Financials 1.06 Autos 1.00 Other 1.15 Aero 1.12 Gaming 1.15 Ships 0.97
41

Table 2: Summary Statistics This table reports summary statistics for the variables used for the six sets of regressions. Panel A reports the summary statistics (time-series averages of cross-sectional means and standard deviations) for the institutional ownership regressions. Institutional ownership (IO) is the fraction of shares of a firm held by institutions. LOGSIZE is the logarithm of the market capitalization of the company. LOGMB is the logarithm of the market to book variable. STD is the daily stock return standard deviation during the past year. BETA is the firm’s industry market beta. PRINV is the inverse of the stock price. RET is the arithmetic average of the last year’s monthly returns. These variables are calculated at the end of the year. Panel B reports the similar summary statistics for the analyst coverage regressions. LOGCOV is the log of one plus the number of analyst estimates issued on a company at the end of the year. The other variables in Panel B are constructed in the same way as in Panel A except over a different time period. Panel C reports the summary statistics for the time-series return regressions. EXSINP (EXCOMP) is the excess monthly return net of the risk-free for an equal-weighted portfolio of sin stocks (comparable stocks). MKTPREM is the excess monthly return of the value-weighted CRSP index. SMB is the return of a portfolio long small stocks and short large stocks. HML is the return of a portfolio long high book-to-market stocks and short low book-to-market stocks. MOM is the return of a portfolio long past twelve-month return winners and short past twelve-month return losers. Panel D reports the summary statistics for the cross-sectional return regressions. EXMRET is the monthly return of a stock net of the risk-free rate. LOGSIZE, LOGMB, and RET are now calculated at the end of each month. BETA is just the firm’s industry beta, which is now calculated at the end of each month using the past 36-months of data. TURN, calculated at the end of month, is the daily share turnover during the past 12-months. LOGAGE is the natural logarithm of the firm’s age, measured by the number of years available in the CRSP/Compustat data. Panel E reports the summary statistics for the price-to-book regressions. ROE is return on equity. RDSALES is the fraction of research and development expenditures to firm sales. Panel F reports the statistics for the financing decision regressions. MLEV is market leverage. BLEV is book leverage. CASH is cash balances. DIVPAY is the dividend payout ratio. REP is share repurchases. PAYOUT is the overall firm payout ratio. TOBQ is Tobin’s Q, which is market value of equity plus assets minus book value of equity over assets. TANG is firm tangibility defined as net plant, property and equipment divided by total assets. PROFIT is earnings before interest, taxes, and depreciation divided by total assets. LOGSALES is the log of net sales. Panel A: Institutional Ownership Regressions (1980-2003)
Variable Time-Series Average of Means Time-Series Average of Standard Deviations IO 0.27 0.22 LOGSIZE (‘000) 11.16 2.06 LOGMB 0.65 0.91 STD (%) 4.13 2.45 BETA 1.10 0.23 PRINV 0.50 1.28 RET (%) 1.23 5.79
Panel B: Analyst Coverage Regressions (1976-2003)
Variable Time-Series Average of Means Time-Series Average of Standard Deviations LOGCOV 0.91 0.99 LOGSIZE (‘000) 11.03 2.04 LOGMB 0.56 0.89 STD (%) 3.92 2.30 BETA 1.09 0.23 PRINV 0.45 1.15 RET (%) 1.43 5.54
42

Panel C: Time-Series Return Regressions (1926-2004) Variable Mean Standard Deviation
EXSINP (%) 1.19 7.10 EXCOMP (%) 0.91 7.73 MKTPREM (%) 0.65 5.49 SMB (%) 0.25 3.38 HML (%) 0.40 3.61 MOM (%) 0.75 4.73
Panel D: Cross-Sectional Return Regressions (1965-2004)
Variable Time-Series Average of Means Time-Series Average of Standard Deviations EXMRET (%) 0.83 16.45 LOGSIZE (‘000) 10.90 1.92 BETA 1.11 0.30 TURN (%) 0.30 0.62 LOGMB 0.30 0.83 RET (%) 1.30 4.35 LOGAGE 2.13 0.98
Panel E: Price-to-Book Regressions (1965-2004)
Variable Time-Series Average of Means Time-Series Average of Standard Deviations LOGMB 0.37 0.76 ROE (%) 13.79 7.37 RDSALES (%) 29.55 8.10
Panel F: Corporate Financing Decisions Regressions (1962-2003)
Variable Time-Series Average of Means Time-Series Average of Standard Deviations BLEV 0.35 0.27 MLEV 0.28 0.23 CASH 0.15 0.20 PAYOUT 0.27 1.08 DIVPAY 0.20 0.40 REP 0.10 0.71 TOBQ 1.78 1.63 TANG 0.34 0.23 PROFIT 0.09 0.19 LOGSALES -0.00 0.87
43

Table 3: Institutional Ownership and Analyst Coverage of Sin Stocks In Panel A, the dependent variable is institutional ownership (IO), which is calculated at the end of each year. SINDUM equals one if a stock is a sin stock and zero otherwise. GDUM equals one if a stock is a sin stock or comes from the Fama and French (1997) industry groupings: 2 (food), 3 (soda), 7 (fun), and 43 (meals) and zero otherwise. LOGSIZE is the logarithm of the market capitalization of the company. LOGMB is the logarithm of the market-to-book variable. STD is the daily stock return standard deviation during the past year. BETA is the firm’s industry market beta. PRINV is the inverse of the stock price. RET is the average monthly return during the past year. NASD equals one if the stock is listed on NASDAQ and zero otherwise. SP500 equals one if the stock is in the S&P 500 index and zero otherwise. These variables are calculated at the end of the year. Panel A reports the results of a pooled regression with Moulton’s (1986) standard errors clustered at the 49-industry groupings. The ownership data cover the period 1980-2003. Panel B reports the results, in which the dependent variable is ownership by two sub-groups. In the first column, dependent variable is fraction of shares held by type 1 (banks), type 2 (insurance companies), and type 5 (others including pension plans, endowments, and employee-ownership plans) institutions. In the second column, the dependent variable is shares held by type 3 (mutual funds) and type 4 (independent investment advisors) institutions. T-test of the difference of the coefficients in front of SINDUM across these two regressions is provided (Greene, 2000). The data for Panel B runs only from 1980-1997. In Panel C, the dependent variable is analyst coverage, calculated as a log of one plus the number of analyst estimates issued on a stock at the end of the year (LOGCOV). The analyst data is from the period 1976-2003. *** 1% significance; ** 5% significance; * 10% significance. Panel A: Institutional Ownership
Variable (1) (2) (3) (4) (5) (6) SINDUM -0.0519***
(0.0094) -0.0355* (0.0197)
-0.0378** (0.0179)
-0.0356* (0.0201)
-0.0337* (0.0192)
-0.0333* (0.0191)
ONEDIGDUM 0.0016 (0.0113)
GDUM -0.0167 (0.0209)
-0.0180 (0.0197)
-0.0167 (0.0211)
-0.0184 (0.0205)
-0.0192 (0.0205)
LOGSIZE 0.0828*** (0.0023)
0.0828*** (0.0023)
0.0912*** (0.0032)
0.0845*** (0.0024)
0.0825*** (0.0023)
0.0841*** (0.0024)
BETA 0.1286*** (0.0386)
0.1275*** (0.0401)
0.1407*** (0.0436)
0.1295*** (0.0398)
0.1379*** (0.0394)
0.1390*** (0.0396)
LOGMB -0.0373*** (0.0040)
PRICEINV 0.0072*** (0.0013)
0.0123*** (0.0015)
0.0102*** (0.0014)
STD -0.6794*** (0.1680)
-0.6175*** (0.1674)
RET -0.2230*** (0.0173)
NASD -0.0122** (0.0048)
-0.0120** (0.0051)
0.0094* (0.0052)
-0.0120** (0.0051)
-0.0043 (0.0043)
-0.0021 (0.0043)
SP500 -0.0292*** (0.0099)
-0.0291*** (0.0097)
-0.0367*** (0.0095)
-0.0328*** (0.0097)
-0.0324*** (0.0093)
-0.0359*** (0.0093)
44

Panel B: Pooled Regressions by Different Types of Institutions
Variable (Type 1+2+5) (Type 3+4) SINDUM -0.0270**
(0.0124) -0.0111 (0.0134)
GDUM -0.0035 (0.0101)
-0.0177 (0.0142)
LOGSIZE 0.0270*** (0.0010)
0.0465*** (0.0023)
BETA 0.0237 (0.0152)
0.1213*** (0.0270)
PRICEINV 0.0064*** (0.0006)
0.0026* (0.0013)
STD -0.4492*** (0.0563)
-0.3164*** (0.0907)
RET -0.1432*** (0.0094)
0.0019 (0.0186)
NASD -0.0202*** (0.0023)
0.0187*** (0.0032)
SP500 0.0388*** (0.0050)
-0.0441** (0.0066)
t-test of difference of coefficients in front of SINDUM
-0.0159*** (0.0064)
Panel C: Analyst Coverage
Variable (1) (2) (3) (4) (5) (6) SINDUM -0.1702**
(0.0762) -0.1477* (0.0872)
-0.1704 (0.1155)
-0.1507* (0.0816)
-0.1504* (0.0820)
-0.1477* (0.0807)
ONEDIGDUM 0.0076 (0.0234)
GDUM -0.0203 (0.0485)
-0.0221 (0.0447)
-0.0201 (0.0488)
-0.0203 (0.0488)
-0.0261 (0.0466)
LOGSIZE 0.3516*** (0.0073)
0.3516*** (0.0071)
0.3933*** (0.0072)
0.3700*** (0.0075)
0.3696*** (0.0073)
0.3825*** (0.0072)
BETA 0.0788 (0.0646)
0.0776 (0.0641)
0.1245** (0.0491)
0.1044 (0.0691)
0.1068 (0.0687)
0.1174* (0.0668)
LOGMB -0.1385*** (0.0109)
PRICEINV 0.0709*** (0.0048)
0.0721*** (0.0052)
0.0527*** (0.0038)
STD -0.1999 (0.2629)
0.2748 (0.2439)
RET -2.1788*** (0.0540)
NASD -0.0777*** (0.0270)
-0.0773*** (0.0272)
0.0309 (0.0266)
-0.0831*** (0.0275)
-0.0808*** (0.0279)
-0.0623** (0.0276)
SP500 0.3796*** (0.0325)
0.3800*** (0.0326)
0.3179*** (0.0315)
0.3382*** (0.0315)
0.3376*** (0.0316)
0.3055*** (0.0309)
45

Table 4: Price and Return Performance of Sin Stocks Panel A reports the results for the time-series regressions of a portfolio (SIN-COMP) that is long SIN (the monthly return for an equal-weighted portfolio of sin stocks) and short COMP (the monthly return for an equal-weighted portfolio of comparable stocks) on a host of well-known factors for the period of 1926-2004. MKTPREM is the excess monthly return of the value-weighted CRSP index. SMB is the return of a portfolio long small stocks and short large stocks. HML is the return of a portfolio long high book-to-market stocks and short low book-to-market stocks. MOM is the return of a portfolio long past twelve-month return winners and short past twelve-month return losers. Panel B reports the results of Fama and MacBeth (1973) cross-sectional regressions (weighted by firm market capitalization) for the period of 1965-2004 of EXMRET, the monthly return of a stock net of the risk-free rate on the lagged (previous month) values of a set of well-known predictors of stock returns. SINDUM equals one if a stock is a sin stock and zero otherwise. LOGSIZE, LOGMB, and RET are now calculated at the end of each month. BETA is just the firm’s industry beta, which is now calculated at the end of each month using the past 36-months of data. TURN, calculated at the end of month, is the daily share turnover during the past 12-months. EXMRET at month t is regressed on the previous month values of LOGSIZE, LOGMB, RET, BETA, TURN, which are denoted by LOGSIZE1, LOGMB1, RET1, BETA1, and TURN1. LOGAGE1 is the log of the age of the company. Panel C reports the results for a regression of the log of a stock’s market-to-book ratio (LOGMB) on a host of explanatory variables for the period 1965-2004. SINDUM equals one if a stock is a sin stock and zero otherwise. ROE is firm’s return-on-equity, RDSALES is the ratio of a firm’s research and development expenditures to firm sales, RDMISS equals one if a firm is missing R&D expenditure data and zero otherwise. SP500 equals one if the stock is in the S&P 500 index and zero otherwise. GDUM equals one if a stock is a sin stock or comes from the Fama and French (1997) industry groupings: 2 (food), 3 (soda), 7 (fun), and 43 (meals) and zero otherwise. Column (1) of Panel A is estimated using the cross-sectional regression with standard errors calculated as in Fama and MacBeth (1973). Column (2), in turn, estimates the same model using a pooled regression. Standard errors are clustered at the 49-industry groupings. *** 1%; ** 5%; * 10% significance. Panel A: Time-Series Return Regressions (Net of Comparables): 1926-2004
Variable ALPHA MKTPREM SMB HML MOM SIN- COMP 0.0045**
(0.0018) -0.2641***
(0.0874)
SIN- COMP 0.0047*** (0.0018)
-0.2384*** (0.0896)
-0.1288 (0.1242)
SIN- COMP 0.0057*** (0.0017)
-0.1944*** (0.0591)
-0.1192 (0.1327)
-0.3218*** (0.1092)
SIN- COMP 0.0039** (0.0016)
-0.1585*** (0.0467)
-0.1066 (0.1343)
-0.2610*** (0.0832)
0.1666** (0.0713)
Panel B: Cross-Section Regressions: 1965-2004 Variable (1) (2) (3) (4) (5) (6) SINDUM 0.0022
(0.0017) 0.0017
(0.0017) 0.0027* (0.0017)
0.0027* (0.0016)
0.0033** (0.0016)
0.0030* (0.0017)
BETA1 0.0076** (0.0033)
0.0049 (0.0033)
0.0018 (0.0026)
0.0009 (0.0023)
0.0028 (0.0023)
0.0029 (0.0023)
LOGSIZE1
-0.0028*** (0.0004)
-0.0025*** (0.0004)
-0.0024*** (0.0004)
-0.0018*** (0.0004)
-0.0015*** (0.0004)
RET1 0.1105*** (0.0322)
0.1031*** (0.0310)
0.1196*** (0.0298)
0.1154*** (0.0293)
TURN1 0.1923 (0.2374)
0.2517 (0.2337)
0.2466 (0.2281)
LOGMB1 -0.0031*** (0.0009)
-0.0035*** (0.0009)
GDUM 0.0006 (0.0011)
LOGAGE1
-0.0009** (0.0004)
46

Panel C: M/B Regressions: 1965-2004 Variable (1) (2) SINDUM -0.1664***
(0.0306) -0.1505* (0.0904)
ROE/100 0.3774* (0.1981)
0.0124*** (0.0031)
RDSALES 0.0007*** (0.0002)
0.0007*** (0.0002)
RDMISS -0.1410** (0.0610)
-0.2463*** (0.0669)
SP500
0.2982*** (0.0560)
0.3368*** (0.0811)
GDUM 0.0463 (0.0297)
0.0305 (0.0693)
47
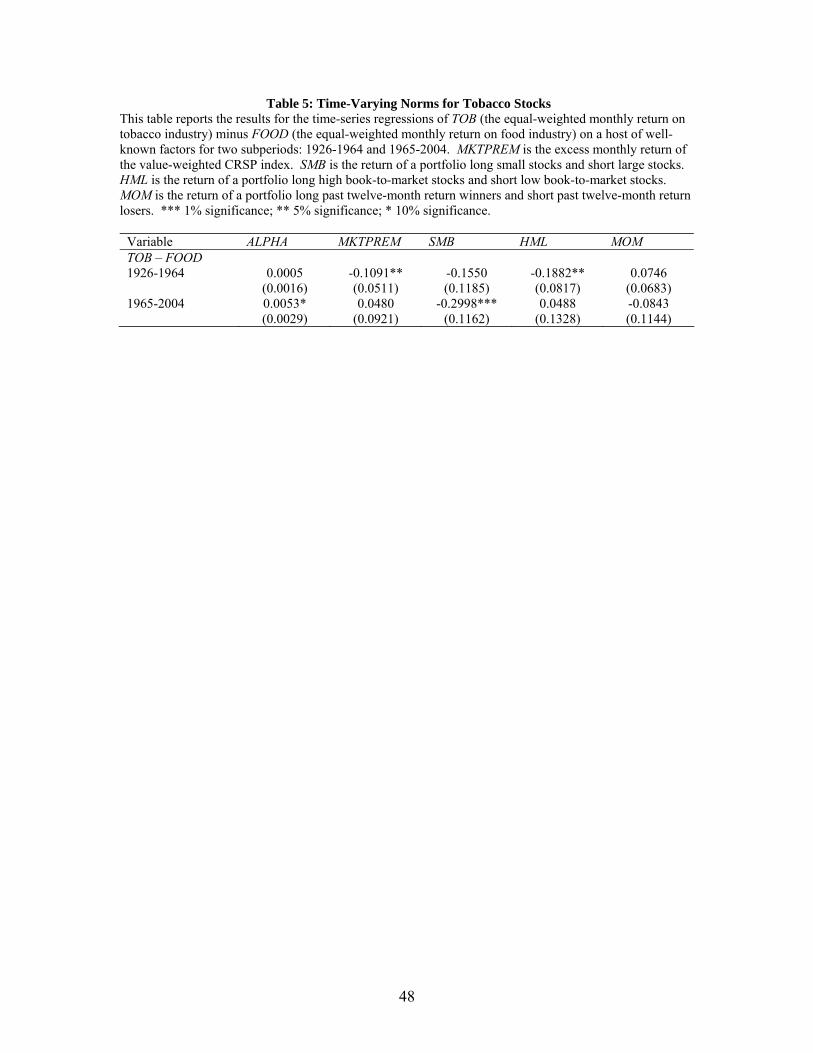
Table 5: Time-Varying Norms for Tobacco Stocks This table reports the results for the time-series regressions of TOB (the equal-weighted monthly return on tobacco industry) minus FOOD (the equal-weighted monthly return on food industry) on a host of well-known factors for two subperiods: 1926-1964 and 1965-2004. MKTPREM is the excess monthly return of the value-weighted CRSP index. SMB is the return of a portfolio long small stocks and short large stocks. HML is the return of a portfolio long high book-to-market stocks and short low book-to-market stocks. MOM is the return of a portfolio long past twelve-month return winners and short past twelve-month return losers. *** 1% significance; ** 5% significance; * 10% significance.
Variable ALPHA MKTPREM SMB HML MOM TOB – FOOD 1926-1964 0.0005
(0.0016) -0.1091** (0.0511)
-0.1550 (0.1185)
-0.1882** (0.0817)
0.0746 (0.0683)
1965-2004 0.0053* (0.0029)
0.0480 (0.0921)
-0.2998*** (0.1162)
0.0488 (0.1328)
-0.0843 (0.1144)
48

Table 6: Corporate Financing Decisions of Sin Companies This table reports estimates from the pooled regression of sin companies’ corporate financing decisions on well-known predictors of capital structure for the period of 1962-2003. The dependent variables are market leverage (MLEV), book leverage (BLEV), cash balances (CASH), overall firm payout ratio (PAYOUT), dividend payout ratio (DIVPAY), and share repurchases (REP). SINDUM equals one if a stock is a sin stock and zero otherwise. GDUM equals one if a stock is a sin stock or comes from the Fama and French (1997) industry groupings: 2 (food), 3 (soda), 7 (fun), and 43 (meals) and zero otherwise. TOBQ is Tobin’s Q, which is market value of equity plus assets minus book value of equity over assets. TANG is firm tangibility defined as net plant, property and equipment divided by total assets. PROFIT is earnings before interest, taxes, and depreciation divided by total assets. LOGSALES is the log of net sales. All variables have been winsorized at the 1% level. *** 1% significance; ** 5% significance; * 10% significance.
Variable MLEV BLEV CASH PAYOUT DIVPAY REP SINDUM
0.0454** (0.0219)
0.0621 (0.0444)
-0.0153 (0.0283)
-0.0122 (0.1000)
0.0241 (0.1037)
-0.0079 (0.0189)
GDUM
-0.0076 (0.0128)
0.0032 (0.0094)
0.0204 (0.0123)
0.0030 (0.0663)
-0.0405 (0.0682)
0.0413** (0.0187)
TOBQ -0.0447*** (0.0055)
-0.0206*** (0.0021)
0.0416*** (0.0021)
-0.0074*** (0.0027)
-0.0082*** (0.0022)
0.0029** (0.0012)
TANG 0.2795*** (0.0453)
0.3202*** (0.0350)
-0.2803*** (0.0337)
0.1911** (0.0896)
0.2864** (0.1242)
-0.0742** (0.0329)
PROFIT -0.1470*** (0.0395)
-0.2178*** (0.0324)
-0.0199 (0.0299)
0.2798*** (0.0366)
0.1814*** (0.0272)
0.1061*** (0.0190)
LOGSALES 0.0187** (0.0086)
0.0192* (0.0101)
-0.0558*** (0.0097)
0.0145 (0.0141)
0.0099 (0.0135)
0.0019 (0.0039)
49