the prilif sourcebook the dss/psi social security research …
TRANSCRIPT
THE PRILIF SOURCEBOOK
T H E DSS/PSI SOCIAL SECURITY RESEARCH TEAM
POLICY STUDIES INSTITUTE
VOLUME I

PRILIF DIAGRAM
SOURCEBOOK DIAGRAM
INTRODUCTION
POSTAL SURVEYS
HOUSEHOLD SURVEYS
Household Composition and Family History
Maintenance
Health
Children's health and caring ,
Education and Training 5 Housing
! Work . .
Wages -
I Childcare
Savings
! Benefits
Income Support
Derived variables - relative material hardship
Family Welfare'
/ Family Credit 1
Job Search and Work Incentives
I Self-completion I APPENDIX 1 - SAMPLING PROCEDURES & SAMPLING DESIGN
~PPENDIX I1 - PUBLICATIONS

(PRILIF) Diagram The DSS / PSI Programme of ~ e s e a r c h into Low-Income Families A
1 - Postal
survey of all GB parents (1 4,400) n Qualitative interview follow-up
with eligible non-claimants ~OIIOW-UP: (ENCS) (40)
low-income couples (1,400)
low~income lone parents
(800)
'-up with ENCs low-lncome couples 8
3 Postal
Higher follow-up of income lone parents
lone
+ parents (900) - (1 00) -
lnterview with families leaving Family Credit
(1,002)
Interview follow-up Second with lone interview
parents follow-up (840)
14
interview interview follow-up follow-up
Fifth interview follow-up (c.680)


THE PRILIF SOURCEBOOK
A data dictionary for the DSS/PSI Programme of Research Into Low Income Families.
The'DSSIPSI Programme of Research Into Low Income Families (PRILIF) is a continuing study of Britain's low-income families with dependent children. The national surveys that make up the programme are carried out by the Social Security Research Team at the Policy Studies Institute and the work is funded by the Department of Social Security.
The PRILIF study series began in 1991 with a nationally-representative survey of low- income families undertaken, primarily, to study the effects of Family Credit on their labour market opportunities. Subsequently work has concentrated on five main policy questions highlighted by the 1991 survey:
HOW can lone parents improve their incomes, combining paid work, benefits and maintenance payments?
What is the effectiveness of child support?
Why do some families fail to claim their benefit entitlement?
Why do some families, especially the lowest paid couples, find it persistently difficult to maintain themselves in paid jobs?
What are the wider effects of the use of income-tested in-work benefits on incentives to work?
In content, the main focus of the research bears on families on the margins of work and concerns the influence of different sources of income - benefits, maintenance and earnings - on their labour market participation and on their family welfare.
The Surveys
Since 1991, the project has generated a large volume of primary research data, mostly in the form of large nationally-representative surveys. The surveys are illustrated in Diagram One in a way that depicts the sequential relationship between them. Essentially the programme consists of a 1991 'Baseline' survey of all Britain's low-income families and

' continues in subsequent years in a series of follow-up studies. Some of these follow-up studies are longitudinal or 'cohort' studies, re-interviewing 1991 respondents. Others are repeat cross-section 'studies, asking similar questions of new nationally-representative samples. These data are described briefly in the following sections. Surveys are referenced -
by the numbers given in Diagram A. I
1. The 1991 'Baseline Survey.' of Low-income Families
An initial 'stock' sample of all low-income families in 1991. A nationally .representative sample survey of low-income families was carried out in 1991, oversampling families receiving Family Credit (n=2,200) (Survey 2). 'Low-income' was defined as families whose FC-assessable income was less than 25 per cent above the point at which their entitlement to Family Credit was extinguished. This definition approximates quite closely to the broader 'half-average income' used elsewhere but take account of family size. The aim was to be able to evaluate the
- likely impact of Family Credit upon all its actual and potential customers while retaining detailed analysis of its effects on claimants (Marsh and McKay, 1993).
Surveys 1 and 2 were focused on the evaluation of the impact of Family Credit on low income families. (Families, Work and Benefits, Marsh and McKay 1993).
The sampling method used allowed us to identify the whole potential 'customer population' for Family Credit: Britain's low income families, including a hitherto elusive group of eligible non-claimants of Family Credit and 'moderate income' families just 25 . per cent above the point where their entitlement to Family Credit ehds. This sample was obtained from:
An initial postal sift survey of'14,SOO Child Benefit Recipients (Survey 1) clustered into 70 primary sampling units
Interview follow-up survey of 1,400 low-income families k
A top-up interview survey of 800 families receiving Family Credit living in the same primary sampling units.
" The interviews were usually carried out with the female member of couples since women in couples are recognised by the system as the claimant. A shorter version of the questionnaire, however, was used to interview all partners.
I
2. The 1991 Lone Parent Survey
An initial 'stock' sample of lone parents in 1991. Survey 212a examined more closely the relationship between lone parents' labour market behaviour and their access to benefits and maintenance payments. The definition of low-income for the baseline survey included in its range about 22 per cent of couples with children in the initial postal sift survey. It included nine out of ten of the lone parents. By sampling just 100 better-off lone parents above the
v .
i v

low-income definition, a nationally representative field sample of 980 lone parents was obtained, again including larger numbers of working lone parents receiving - .
Family Credit (Lone Parettt and Work: The Effects of Mninteltance arrd Betrefits' McKay and Marsh, 1994). ,
3. The 1993 and 1994 Cross-section Surveys of Lone Parents.
Repeated stock samples of lone parents in 1993 and 1994.
New cross-section surveys were carried out in 1993 and 1994 sampling only lone parents and using the same methods as in 1991, including a top-up sample of lone parents claiming Family Credit. These surveys looked in particular at the effects of subsequent benefit rule changes and the first effects of the introduction of the Child Support Agency.
Surveys 41619 examined the effects on lone parents of the changes in benefit eligibility rules introduced in April 1992. Survey 9 was a postal follow-up of the 1993 respondents carried out six months later. ( Changes in Lone Parenthood, Ford, Marsh and McKay 1995; NOTE: this report
compared the two PRILIF surveys with a re-analysis of Bradshaw and Millar's 1989 survey of lone parents.)
Surveys 11/12 examined the impact of the CSA and provided the basis for evaluating the start of the childcare disregard (Lone parents and the CSA: the First Year, Marsh, Ford and ~ i n l a ~ s o n , 1996).
4. The Lone Parent Cohort Survey
Longitudinal follow-up surveys in 1993, 1994 and 1995. Survey 3 was a postal survey in 1992 of the lone parents interviewed in 1991; Surveys 5, 10 and 14 re- interviewed the 1991 sample in 1993, 1994 and 1995 respectively. to study the ways they enter or leave both work and lone parenthood itself. (What happens t o lone parents. Ford, Marsh and Finlayson, 1996)
5. The 1993 Follow-up Survey of the Lowest-income couples.
A longitudinal follow-up survey of couples interviewed in 1991 who at that time had had experience of claiming both Family Credit and Income Support. The main of this survey was to examine why some of the lowest income families found life on Family Credit difficult and appeared to prefer to remain on Income Support rather than take work at low wages, supplemented by Family Credit.
Survey 8 reinterviewed 500 lowest-paid families; (Parenb O n T h e Margins Of Work, Ford and Marsh, 1995).
I
6. The 1994 survey of families who ceased claiming Family Credit in 1993.

This survey looked at some of the questions that the stock samples could not : what happens to a large sample of Family Credit claimants in the first few months of ceasing a claim?
A 'flow' sample of families leaving Family Credit in 1993. Survey 13 interviewed 1002 families who left Family Credit and had not renewed their claim six months later. (Leaving Family Credit, Bryson and Marsh, 1996).
7. The Childcare s;rveys.
There was considerable policy interest in working families' use of childcare and its cost.
, . Surveys 1 ,4 and 11 sent postal questionnaires to identify low income families and lone parents to 14,500, in 1991, and 9000 child benefit recipients, in 1993 and 1994. (Families, Work and the Use of Childcare; Paying More for Childcare)
I
These data add up to a considerable investment of the Department's research resources: 20,000 postal questionnaires and 7,000 high quality interviews, reflecting response rates of 7017.5 per cent and 81/87 per cent respectively, calculated on ONS-standard 'least favourable' basis.
Sampling procedures
The three cross-section surveys in 1991, 1993 and 1994 were derived from a complex sampling method based on benefit records, each identical in method. A four-stage procedure was carried out, in summary:
1. Post Office records of Child Benefit encashments were used to sample - postcode areas with a probability proportionate to the numbers of encashments made in November 1990. Since take-up of Child Benefit is nearly 100 per cent, this was taken to equate to the numbers of families I
with children living in each.
2. Child Benefit records were used to sample a constant number of recipients in each sampled postcode area.
a 3. Postal surveys of sampled Child Benefit recipients were carried out to .
identify low-income families in 1991 and lone parents only in 1993 and 1994.
4. Family Credit records were used to provide additional cases of FC-recipients proportionately to the numbers found by the postal surveys. For each recipient found and sampled by the postal survey, two were added from the Family Credit current caseload file. The 1994 survey confined the top-up

sample to relatively new or recently renewed claims to avoid claims which might expire by the time the interview was carried out.
!
I
The three cross section surveys in 1991, 1993 and 1994 were based on three postal surveys that were carried out respectively in May-June 1991, November-December 1992, and August-September 1994. there is little reason to suppose that these differing times in the year affected results. Each provided a nationally-representative sample of families with dependent children in Great Britain but not Northern Ireland.
The population base for each survey was to be the Child Benefit Record File held by the ~ e ~ a r k e n t of Social Security and the sampling procedure was the same for each. Use was made of the Post Office records because insufficient address data made it necessary to find another method of selecting clustered Primary Sampling Units proportionately to their population of families with children. This would allow a constant number of respondents in each and, hence, cost efficient fieldwork allocations. ,,
Selecting Primary Sampling Units (PSUs)
The selection of primary sampling units (PSUs) proportionate to the numbers of Child Benefit recipient families in each was accomplished through an analysis of the encashment of Child Benefit Order Books at each of the 24,000 post offices in Great Britain held by Post Office Counters PLC at their computer centre in Chesterfield. Post Offices were ordered by postcode and a cumulative count made of all encashments in November of each survey year from the first to last. This record was used to select 70,50 and 49 post offices respectively at a constant sampling interval (n encashments divided by 70,50 and 49 successively) from a random starting point in the file. The postcode of the.post office of each selection selected the other post offices sharing the same postcode area - ie the first part of the postcode. This provided the DSS with the appropriate PSUs in which to select a constant number of recipients in each postcode group from their own records using not the postcode themselves but the post offices' unique sorting codes common to both the encashment record and the benefit record.
The Post OfficeDSS link was needed because in 1991 the Child Benefit Record contained only about 60 per cent valid postcodes. Older records lacked postcodes, introducing systematic bias in the ages of families. The link was accomplished through the identification number of the Post Office where encashment was elected for each record. The differential proportions of Account Credit Transfer records to Order Books, averaging just over a fifth, and the differing ratio of four-weekly to one-weekly order books, were each allowed to vary within each PSU.
Finding the Eligible Families
Table 1' below summarises the sample design and response rates for each survey:
vii

The sample design.
Table 1 The Three National Samples
The main design problem, as it is discussed in more detail in the text of this report, was to identify a population of families who were 'within range' of family credit. By 'family'
, was meant: a coresidential household of one or more adults and one or more dependent children aged 16 or younger, or aged 17 or 18 and remaining in full time education or equivalent. By 'within range of Family Credit ' was meant four groups of families:
1. PRESENT RECIPIENTS: families who were currently receiving claiming family credit,
-
' 2. ELIGIBLE NON-CLAIMANTS: families who should be claiming but were not.
L
3. NON-WORKING FAMILIES: families who, though without full time work, might well be expected to claim family credit within the foreseeable future, as they entered fulltime work.
1994
49
8,738
6,204
71 %
Postcodes selected as primary sampling units
Questionnaires mailed to valid addresses
Usea ble responses
Response rate
4. HIGHER INCOME FAMILIES: families who earn a little more than the level that would entitle them to claim family credit but for whom a change of circumstances, a new child, or the loss of regular overtime payments, for examples, would bring them within scope of eligibility. The cut-off point chosen in the income range was 25 per cent above the point a t which the families' entitlement to Family Credit extinguished.
These four groups were the main target cells for the sample design. Useable numbers were required for each. In 1991, these were required separately for couples and lone parents.
I Differential sampling fractions were introduced to under-sample out-of-work lone parents, who are a very large fraction among low income families.
1991
70
14,210
9,095
-- 64 p- %
In 1991, these were the achieved interviews in each of the eight target cells of the sample design:
1992
50
8,402
6,302
75 %

Eligible FC Moderate o u t 'of Non Clmnts Clmnts income FT work
Lone parents 57 322 72 432
.Couples 157 496 416 239
Rather more familiesended up in the moderate income group than expected. Since the take-up rate among eligible families turned out to be higher than the design assumption of 50 per cent. A few more transferred to the moderate income group because they had substantial savings which disqualified them from Family Credit. When the numbers above are re-weighted to reflect their true position, relative to one another, this is how the eight groups appeared in the population of low income families.
ENC FC recipient Moderate income Not in FT work
Lone parents I 2% t 5% 3% 38%
Couples 6 % 8% 20% 18%
The 1994 Sample of Lone Parents.
As for the earlier PRILIF surveys, the first stage was a postal screening survey carried out in August-September 1994 of a nationally-representative sample of families with dependent children in Great Britain but not Northern Ireland.
The population base for each survey was the Child Benefit Record File held by the Department of Social Security. The selection of 49 primary sampling units (PSUs) proportionate to the numbers of Child Benefit recipient families in each was accomplished through an analysis of the encashment of Child Benefit Order Books at each of the 24,000 post offices in Great Britain held by Post Office Counters PLC.
A representative sample of 8,738 valid addresses was mailed a questionnaire to identify lone parents and their circumstances. 6024 useable responses were received (71 per cent), 1302 of them (21 per cent) came from respondents answering 'No' to the question:
'Do you have a partner who normally lives with you? (We use partner to mean someone you are married to or live with as a couple)
If Haskey's estimate of Britain's lone parent population is correct at about 1.42 million out of a total of 6.67 families then this sample proportion of 21 per cent is also correct.
From the sample of 1302 lone parents obtained from the postal sift, it is worth noting the numbers interviewed (Table 2)
ix

Table 2 The 1994 sample of Lone Parents. Unweighted numbers interviewed and weighted cell sizes by work and benefit status
WORKING ...... . .. . ... ... ' 24 HRS 16-23 A WEEK A WEEK
UNWEIGHTED NUMBERS \
fc recipients ..... ,
eligible ineligible uncertain
eligible for fc 31 12 ineligible 89 5 uncertain 8 5
OUT 1-15 OF A WEEK WORK
WEIGHTED CELL SIZES I
fc recipiehts ..... eligible 52 59 ineligible 2 , 2 3 - 12 uncertain 2 2
Non-recipients eligible for fc 25 9 ineligible 82 5 89 525 uncertain- 7 6
,
X

A random sample of 851 lone parents would find about 130 Family Credit recipients. Though properly re-weighted in all these analyses, having 395 of them in the sample gave considerable scope to examine in great detail some of the connections between benefits, earnings and maintenance that were of greatest interest.
The Lone Parent Cohort
The 941 respondents to the 1991 survey of lone parents were approached for new interviews in 1993,194 and 1995. These follow-up surveys successfully interviewed 85 %, 73% and then 63% of the 1991 respondents, respectively (Table 3)
Table 3 The Lone Parent Cohort: first, second, third and fourth wave respondents
1991 1993 1994 1995
weighted n= 988 842 728 623
unweighted n= 941 803 684 596
response rate 85% 73% 63%
1 The 1994 %flowt sample of families leaving Family Credit.
Family Credit Branch in DSS North Fylde constructed a file of all families whose Family Credit award terminated between, and including, 30th August 1993 and 1st October 1993, and who had not successfully renewed that claim by 3rd January 1994.
All cases were grouped by District Office, then District Offices with fewer than 80 leavers were discarded to avoid 'problem areas' liable to yield inefficiently small numbers of cases
a for interview. We discarded 25 out of 500. They contained fewer than 3 per cent of Family Credit recipients.
1 District Offices were stratified according to one of five area codes (South East, Scotland, WalesINorth EastIMidlands, the North and the South). 40 PSUs were randomly selected
: with a constant sampling interval of the total number of leavers divided by 40. Each PSU's probability of selection then became proportionate to their size in terms of the numbers of leavers they contained, enabling the same number of cases to be sampled within each:
The District Offices were re-grouped according to their area code. Then the order of cases within each PSU was randomised and the first 80 (not 40) cases in each PSU selected. This produced an average of 10 self-employed per PSU - 400 throughout the 40 PSUs, which was sufficient. However, it yielded 2,800 employees when we actually needed about 1,200. Therefore a random sample of employees were selected using the appropriate

I
sampling fraction (0.43). In this way we expected to obtain a random sample of 1,600 leavers containing twice as many self-employed families as would normally be encountered. However, hidden shortfalls in the numbers of leavers in some areas resulted in a lowered total yield of 1,372 families, despite our precaution of eliminating areas formerly identified as small.
This sampling strategy resulted in 1,372 addresses being issued to NOP's interviewers in Spring 1994. At this point we obtained our first finding. Rather larger numbers than we expected had returned to Family Credit since January 1994: 6 per cent of them. A similar number (88 families) had moved home, were unavailable or opted out (Table 1.3.1)
Table 1.3.1: Addresses issued,reasons for dropping,and final response rate
Number of addresses issued 1,372.00 \
Addresses disposed of: .
Moved 58 No trace of address 7 Opted out to DSS 1 6 Back on Family Credit 75 Away/ill 7
Base for response rate 1,372-163=1,209 .
Total number of respondents 1,002.00
Refusals
'Other'
Response rate
The initial letter requesting those sampled to participate in the survey and offering them the opportunity to 'opt out' if they so wished went out at the end of January 1994,,and was followed by two reminder letters. The interviews were conducted between late March and June 1994. We achieved a response rate of 82.9 per cent (Table 1.3.1), exceeding our original expectations. Table 1.3.2 provides basic information on the number of lone parents, couples, self-employed and employed Family Credit job holders before and after weighting. .

Table 1.3.2: Achieved sample
SE in FC job Emp.in'FC job LP at interview Couple at int.
weighted N 136 866 302 700
unwted N 240 - 762 289 713 Note: lone parents include 40 families headed by a single person who no longer has dependent children.
Interviewers were briefed to treat the Family Credit recipient as the main respondent. This is virtually always the woman in a couple, almost all of the male main respondents being lone parents. Interviewers were briefed to interview any current partner but, if the Family Credit job had been undertaken by a previous partner, they were asked to get information on this job from the main respondent. In the event, 695 partner interviews were
1 completed, of which 232 were proxy interviews with the main respondent. Thirty-three of the proxy interviews were for e ~ - ~ a r t n e r s who had held the Family Credit job.
' The Data
1 The topics covered in the postal sifts are: I *
1. Children; ages, number, health
2. Work; hours, income
3. Childcare; usage, cost
4. Partnerships; partner, work, hours, pay
5. Benefits; Family credit, Income Suppport
6. Maintenance; receipt, amount
The main topics covered in the face-to-face surveys are:
1. Household composition, family formation and change
2. Housing: type, cost and quality
3. Education, qualifications, skills and training
4. Income: earnings, maintenance payments, benefits, savings and investments, rents, all other sources. 5. Benefit status, experience of claiming, especially Family Credit and Income Support.
6. Employment: present employment/self employment and/or last employment, recent job history including spells without paid work, job seeking behaviour.

. 7. Childcare: preferences, usage and cost.
8. Attitudes to work, personal efficacy and self-esteem.
9 . Health: self-reported ill-health its and effects on work; smoking and drinking.
10. Family welfare: SO-item Index of Relative Material Well-being and Hardship including debt, ability to afford key items of food, clothes, social participation and consumer durables, additional unmet family needs, self-assessed hardship.
THE PRILIF SOURCEBOOK
All the foregoing data are summarised in this sourcebook, where we provide the marginal distributions and unweighted bases of all the questions in commom asked in each major PRILIF survey in each year, separately for lone parents and couples (see Diagram B). Details of partners, where applicable, were available either from a separate partner questionnaire or from proxy data. These data have been used to construct some derived variables but are not reported separately here. Some additional sections only asked in the
I
'Leaving Family Credit' survey (EXITS) are omitted in the tables. A 'Future' questionnaire was also conducted for the 1991 baseline survey, in addition to the main questionaire.
The following notation has been used throughout: '
NOTATION
[ ] Denotes filter instruction
(756) Unweighted base
Nonelempty cell
b Cell less than 0.5%
nla Not applicablelquestion not asked in that year. A space indicates that the question was asked in that year.
Weighted column marginal distribution
23% Multiple response (sum to greater than 100% of reported cases). Percentage of valid cases reported.


DERIVED VARIABLES - HOUSEHOLD COMPOSITION AND FAMILY HISTORY
I
Mean duration of partnership (current spell) months ...
Proportion in receipt of maintenance
Mean amount of maintenance received
J
r)
COHORT
1991 LPB
- ( - 1
28% (941)
f 27.80 (275)
1993 LPD
25 (79)
26% (804)
f 25.20 (209)
1994 LPG
20 (1 12)
25% (686)
f 3 1.60 (176)
1995 LPH
26 (120)
21% (595)
£34.90 (132)
1996 LPJ
34 (163)
22% (673)
£32.80 - (157)
1998 LP K
41 ' (197)
19% (672)
£ 30.78 (139)


HOUSEHOLD COMPOSITION
[IF 1991 CHILDREN NO LONGER IN HOUSEHOLD] Where does (name) live now? (first person)
With other parent ..... With other relatives .....
In Local Authority care ..... In a hostel .:...
In own home ..... Dead ....
At collegelUniversity. .... Don't know ....:
Other ..... /'
[ALL LIVING CHILD(REN)] And what is (name) doing nowadays? (first person)
Working full-time (16+ hrslweek) ..... Working part-time (1 5- hrslweek) .....
1 Unemployed, looking for work ..... Long term sick, disabled .....
In full-time education :.... In part-time education .....
On govt. training scheme ..... Looking after home, family .....
Other .....
1991 LP B
%
(nla)
%
(nla)
1993 LP D
%
(nla)
%
(nla)
1994 LPG
%
(nla)
%
(nla)
COHORT
1995 LP H
% 6 9 4 2
73 1 2 2 2
(107)
% 44
1 17 -
, 23 - -
14 1
(105)
1996 LP J
% 9
10 1 -
71 1 6 3 1
(161)
% 51 2 7 -
28 1 *
9 3
(160)
1998 LP K
% 8 3 1 1
80 1 2 3 1
(200)
% 51 2
19
13
*
12 3
(199)


HOUSEHOLD COMPOSITION
I [ALL LIVING 'MISSING' CHILD(REN)] And what is (name) doing nowadays?
Working full-time (16+ hrslweek) ..... i
I Working part-time (1 5- hrslweek) .....
Unemployed, looking for work ..... Long term sick, disabled .....
In full-time education ..... In part-time education .....
On govt. training scheme ..... Looking after home, family .....
Don't know ..... I Other .....
[IF HAS PARTNER WHO HAS NOT YET BEEN OR NOT WILLING TO BE INTERVIEWED] We hope to be able to carry out a short interview with your husbandlpartner. Just for the moment, may I just check a couple of things with you? Is your partner.. . ?
Working 16+ hours a week? ..... Working 15- hours a week or out of work ..... 19 18 24
(nla) (nla) (nla) (44) (71) (89)
1991 LP B
%
(nla)
%
COHORT
1993 LP D
%
(nla)
%
1994 LPG
%
(nla)
%
1995 LP H
% 47 5 2 5
17 3 - .
8 - I 14
(62)
% 81
1996 LP J
% 48 10 4 3
12 3 1 4
1 (61)
Yo 82
1998 LP K
% 59 I I 6 2 7 - - 8 4 3
(78)
% 76

HOUSEHOLD COMPOSITION
[IF PARTNER WORKING 16 HOURS OR MORE] What kind of work does your husband/wife/partner do in hidher present job?
How much does he/she usually receive each week, that is atter all 'deductions for tax, national insurance, pension contributions, union dues and so on, but including overtime, bonuses, commission, tips, etc.
[IF PARTNER WORKING LESS THAN 16 HOURS OR OUT OF WORK] When did your partner last have a paid job working 16 hours a week or more? (RECORD MONTH AND YEAR)
What kind of work did your husband/wife/partner do in this last job?
COHORT
1991 LPB
(nla)
(nla)
(nla)
(nla)
1993 LPD
(nla)
(nla)
(nla)
(nla)
1994 LPG
(nla)
(nla)
(nla)
(nla)
1995 LPH
,
1996 LPJ
1998 LPK


11 CHECK: Is this the same couple as 1994? Is this a reconciled couple? -1 [ALL COUPLES] .How long have you been living together as a couple? (this time) (IN YEARS OR IF LESS THAN A YEAR, IN MONTHS)
FAMILY HISTORY
II When did you start living together (again) I And had you lived together as a couple at any time BEFORE we first met you in 1991?
Yes, before 1991 ..... No, after 1991 .....
II When you started to live together, were you legally married or not? I II Yes, legally married .....
No, not legally married .....
II [IF NOT MARRIED WHEN STARTED LIVING TOGETHER] When you started to live together, were you .... ? 1
single, never-married ..... separated .....
divorced ..... widowed .....
COHORT I
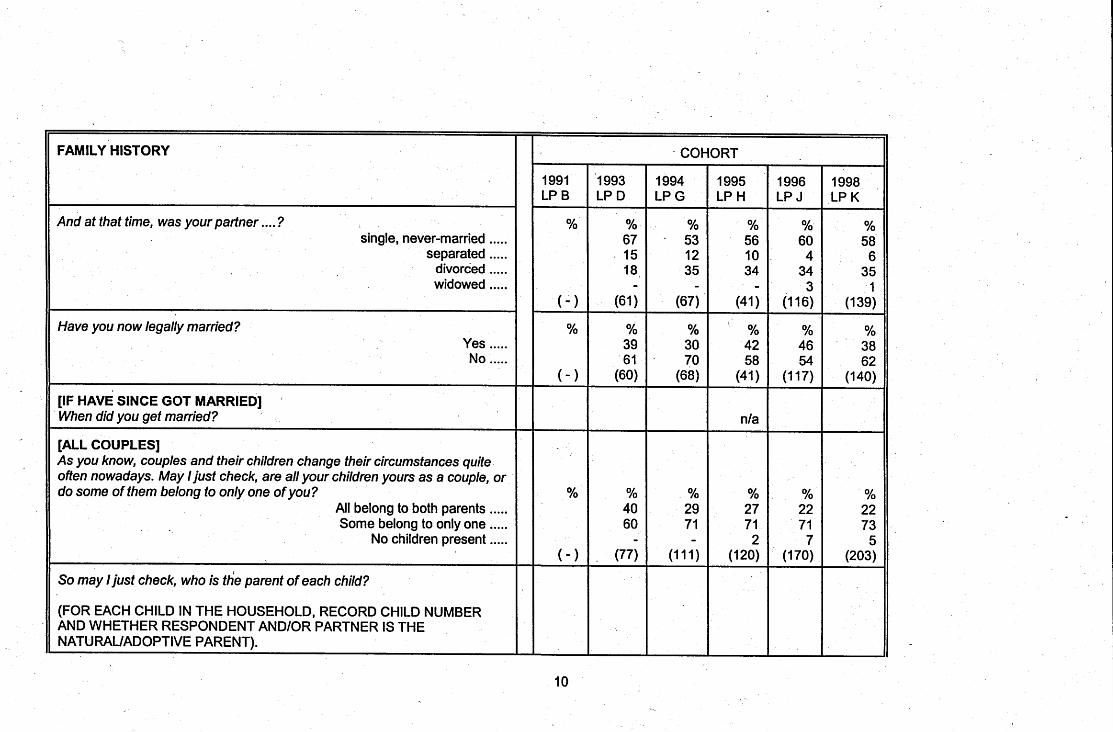
FAMILY HISTORY
And at that time, was your partner . . . . ? I - single, never-married .....
separated ..... divorced 1 .. . .. widowed ..... I
II Have you now legally married? Yes ..... I
II [IF HAVE SINCE GOT MARRIED] When did you get married?
[ALL COUPLES] As you know, couples and their children change their circumstances quite often nowadays. May 1 just check, are all your children yours as a couple, or do some of them belong to only one of you?
All belong to both parents ..... Some belong to only one .....
No children present .....
So may 1 just check, who is the parent of each child?
II (FOR EACH CHILD IN THE HOUSEHOLD, RECORD CHILD NUMBER AND WHETHER RESPONDENT AND/OR PARTNER IS THE NATURAUADOPTIVE PARENT).
COHORT 11

FAMILY HISTORY
'.
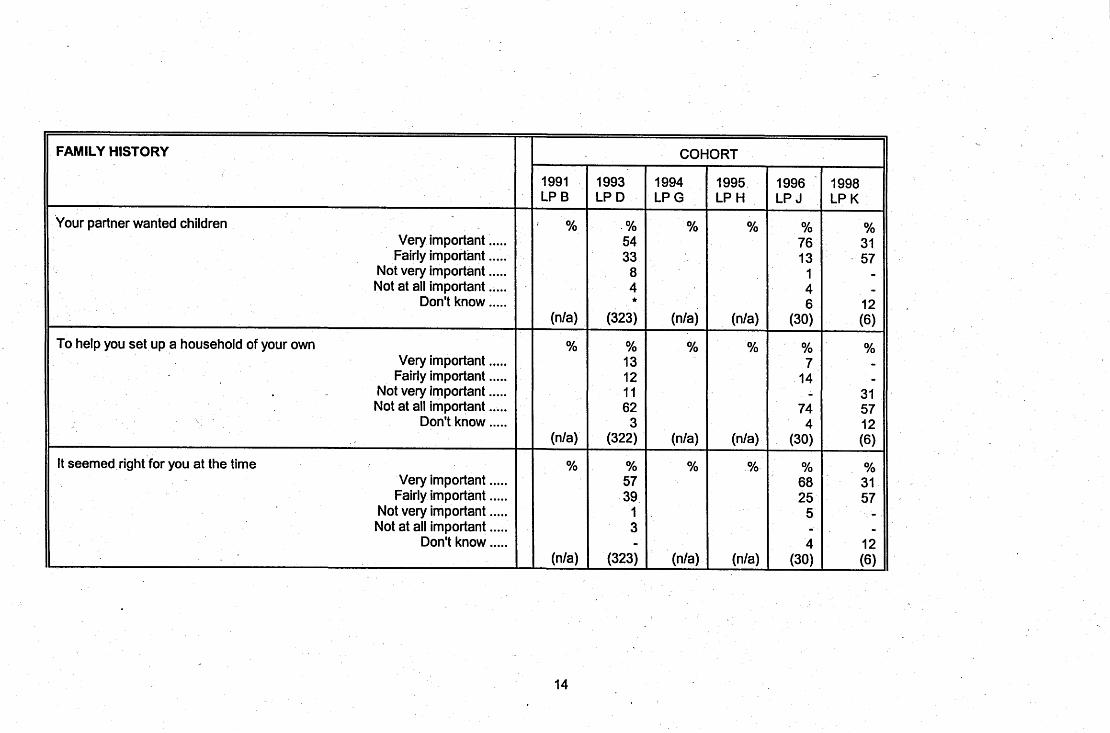
[ALL'] QUESTIONS ABOUT HOW YOU ESTABLISHED YOUR FAMILY
your (first) child was [NAME OF ELDEST CHIL D]. When you had E.......], were you planning to have a child at that time, or was he/she an unexpected pregnancy?
Planning to have child ..... Unexpected pregnancy .....
[ALL PLANNING TO HAVE CHILD AT THAT TIME] People have children at a particular time in their lives for many different reasons. For each of the following statements, can you say how important it was to you at the time you had your first child.
You always planned to start a family at that time Very important .....
Fairly important ..... Not very important ..... Not at all important .....
Don't know .....
COHORT
'1996,1998 only asked of those whose last interview was in 1991
11


FAMILY HISTORY
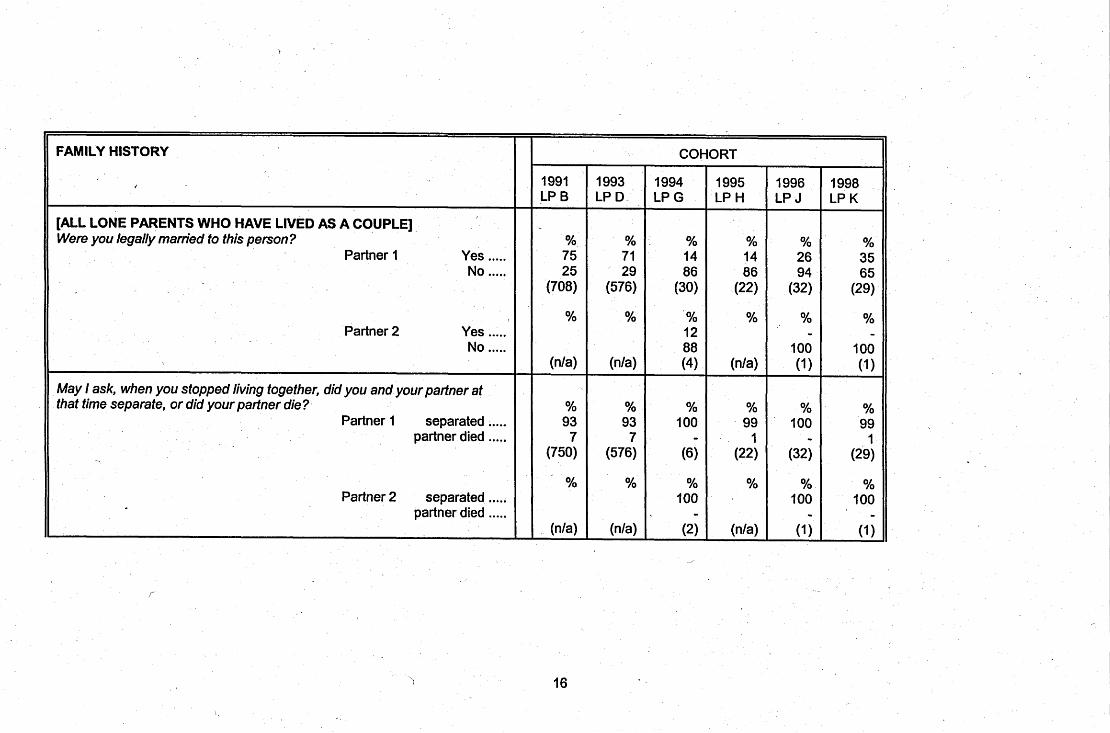
Was this person, whom you lived with as a couple, the other parent of (either/any 09 your child(ren)? (Did you and your partner at the time have any children together?)
Partner 1 Yes ..... No .....
Partner 2 Yes ..... No .....
Was this person, whom you last lived with as a couple, the other parent of (any of) your child(ren)?
Yes - all ..... Yes - some.... .
No .....
COHORT
1991 LPB
% 91 9
(755)
%
(nla)
%
(nla) - -
1993 LPD
%
(nla)
%
(nla)
% 72 17 10
(577)
1994 LPG
% 18 82
(30)
% 41 59 (4)
%
(nla)
1995 LPH
% 25 75
(22)
%
@/a)
%
(nla)
1996 LPJ
% 39 61
(32)
% -
100 (1)
%
(nla)
1998 LPK
% 30 70
(29)
% 100
- (1)
%
(nla)

FAMILY HISTORY
[ASK FOR EACH EX-PARTNER EXCEPT IF WIDOWED] Since you stopped living together with this person, have you lived together with anyone else? (Have there been any other times since 1991 when you have lived as a couple with anyone else, say for a month or more?)
Partner after partner I Yes .....
Partner after partner 2 Yes ..... I
cot


FAMILY HISTORY
If in Britain, approximately how many miles away is this?
Is he/she now ... Partner 1 Married to a new partner .....
Living with a new partner ..... Living with parents .....
. Living with friends or other relatives ..... or Living alone .....
(Don't know) .....
Partner 2 Married to a new partner ..... Living with a new bartner .....
Living with parents ..... Living with friends or other relatives ..,.. -
or Living alone ..... (Don't know) .....

FAMILY HISTORY
And is he/she ... ,
Partner 1 Employed in full-time paid work ..... Employed part time ..... or Not in paid work .....
(Don't know) .....
Partner 2 Employed in full-time paid work ..... Employed part time ..... or Not in paid work .....
(Don't know) ....
And does he/she have any children living in hidher household? Partner 1 Yes .....
No ..... Don't know ....
Partner2 Yes ..... No .....
Don't know ...; A
COHORT


I
FAMILY HISTORY
How would you describe your relationship with him/her nowadays? Is it. .. Partner 1 Very friendly .....
More friendly than unfriendly ..... An equal mixture of friendly and unfriendly .....
More unfriendly than friendly ..... Very unfriendly .....
Can't say .....
Pa'rtner 2 Very friendly ..... More friendly than unfriendly .....
An equal mixture of friendly and unfriendly ..... More unfriendly than friendly .....
Very unfriendly ..... Can't say . . . . .


'In 1994 reconciled couples excluded
FAMILY HISTORY
[ALL WHO EVER LIVED WITH PARTNER] Just before you separated (At the time your partner died) was your partner working full time?
Partner 1 Yes ..... No .....
Partner 2 Yes ..... No .....
~ALLI~ I'd just like you to think now about the time before 7997 when we fist saw you. Can I just check one or two things: Had you ever lived together as a couple with someone?
Yes ..... No .....
COHORT
1991 LPB
%
67 33
(743) %
(nfa)
%
(nla)
1993 LPD
%
69 31
' (566) %
(nla)
%
(nfa)
1994 LPG
%
(-1 %
( - 1
% 72 28
(662)
1995 LPH
%
(nfa) %
(nfa)
% 74 26
(591)
1996 LPJ
%
47 53
(32) %
100 - (1)
% 73 27
(672)
1998- LPK
%
89 11
(29) % -
100 (1)
% 77 23
(670)

- -
FAMILY HISTORY
[ALL WHO LIVED AS A COUPLE BEFORE 19911 When did you last live together as a couple with someone before 1991 1 ?
Was this person (whom you last lived with as a couple), the other parent of (any of) your child(ren) ?
Yes, all ..... Yes, some... ..
No, none.....
May I ask, did you and your partner at the time separate, or did your partner die?
~ ~'
Separated ..... Partner died .....
[IF LIVING PRE-I 991 PARTNER] , Where does he/she live now?
--
this neighbourhood ..... this town .....
this county ..... this region .....
elsewhere in Britain ..... abroad ..... refused .....
don't know.. . . . reunited with ex-partner ....
ex-partner has since died ....
I COHORT 11
FAMILY HISTORY
[IF IN BRITAIN] Approximately how many miles away is that?
Is she/he now. ... ? Married to a new partner ..... . Living with a new partner .....
Loving with hislher parent(s) ..... . , Living with a friend or other relatives .....
Living alone ..... (Don't know) .....
And does he/she have any children living in his/her household? Yes ..... No .....
Don't know .....
[IF HAS CHILDREN IN HOUSEHOLD] And are they hidher children or the children of hidher partner's former relationship?
Hislher own children ..... Parnter's children .....
Both ..... Not sureldon't know .....
31
1991 LP B
(nla)'
%
(nla)
%
(nla)
%
(nla)
1993 LP D ,
(nla)
%
(nla)
%
(nla)
%
(nla)
1994 LPG
32.30 (367)
% 25 24 4 4
21 20
(466)
% 30 53' 16
(466)
% L 47
29 16 7
(149)
COHORT
1995 LP H
30.8 (328)
% 28 27 4 2
20 19
(410)
% 33 49 17
(410)
% 49 21 24 6
(132)
1996 LP J
28 (350)
% 30 23 2 2
22 21
(455)
% 31 48 22
(454)
% 36 28 34 2
(146)
1998 LP K
32.55 (387)
Yo 30 24 3 2
20 21
(463)
% 35 45 21
(473)
% 46 25 24 5
(168)
FAMILY HISTORY
[ALL LIVING PRE-I 991 PARTNERS] And is he/she ... ?
In full time paid work ..... Working part-time .....
Not in paid work ..... Don't know ....
COHORT
4 998 LPK +


FAMILY HISTORY COHORT
1991 1993 1994 1995 1996 1998 LPB LPD LPG LPH LPJ LPK
How would you describe your relationshrj, with him/her nowadays? % % % % % % Very friendly ..... 11 11 10 9
More friendly than unfriendly ..... 23 24 23 24 An equal mixture of unfriendly and friendly ..... 23 21 18 20
More unfriendly than friendly ..... 8 6 8 8 Very unfriendly ..... 17 16 17 14
Can't say ..... 18 22 14 25 (nla) (nla) (466) (410) (455) (463)
In the last year before your separation, how offen did you and your partner argue? - % % % % % %
Many times a day ..... 18 12 24 At least every day ..... 14 14 16
.2 Several times a week ..... 19 27 13 Once a week or less ..... 30 19 19
Never ..... 15 24 19 Don't know ..... 3 4 9
(nla) (nla) (469) (nla) (91) (65)
[IF EVER ARGUED] % % % % % Did these arguements ever end up in physical violence? %
- Yes ..... 41 41 44 No ..... 59 59 55
(nla) (nla) (381) (nla) (67) (45) b
34


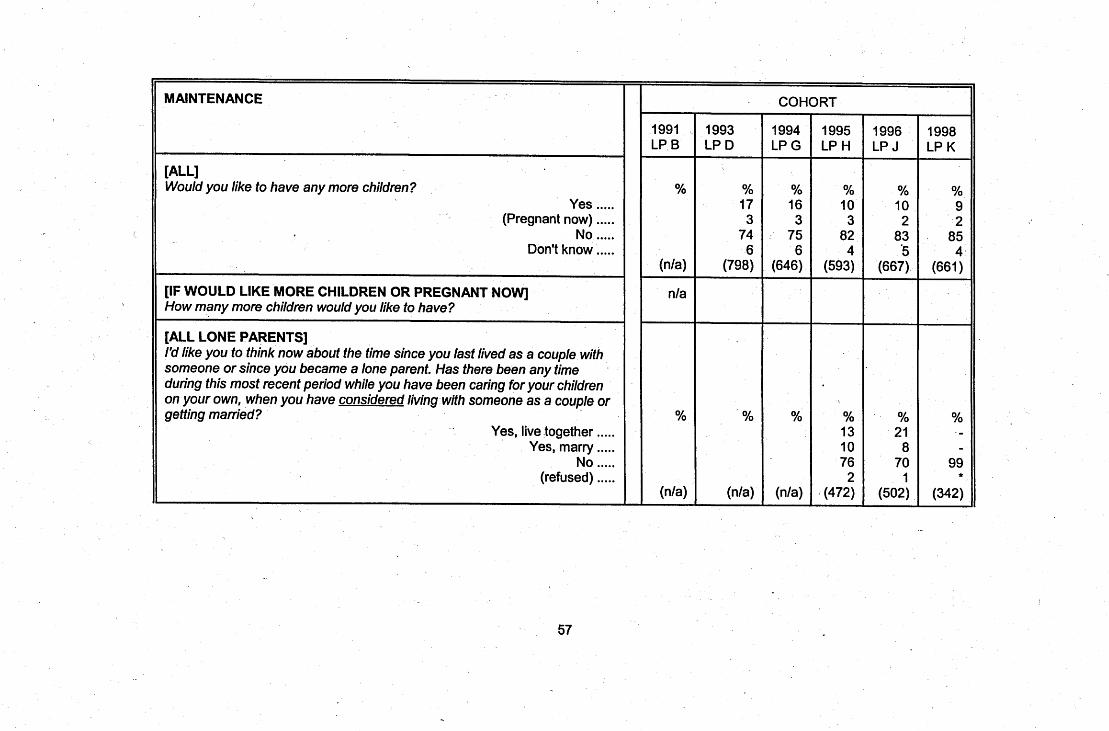
DERIVED VARIABLES - MAINTENANCE
~ropoftion in receipt of maintenance
--
Mean amount of maintenance received f 27.80 f25.20 f 31.60 f 34.90 f 32.80 f 30.78 (275) (209) (1 76) (1 40) (1 57) (1 39)
COHORT
1991 LP B
28% (941) ---
1993 LP D
26% (804)
1994 LPG
25% (686)
1995 LP H
21% (595)
1996 LP J
22% (673)
1998 LP K
19% (672)

\
MAINTENANCE
I
[ALL WITH A LIVING EX-PARTNER WHO IS THE PARENT OF A CHILD IN THE HOUSEHOLD]' I'D LIKE TO ASK YOU NOW ABOUT MAINTENANCE PAYMENTS (MORTGAGE PAYMENTS ARE NOT INCLUDED AS MAINTENANCE). ................................................................................................ Maintenance payments are sometimes made by one parent to the other, to support her (him) and their children.
II Regular maintenance is usually arranged in two ways: I II - regular payments to be made voluntarily, not involving courts or the new
Child Support Agency.
II - or regular payments to be made under a court order, or following an assessment by the Child Support Agency
Some parents do not arrange to make regular payments, but help out from time to time by paying for things (NOT MORTGAGE) giving things or occasional sums of money.
11 May I first ask, I
'In 1991,1994 and 1995 [ALL] asked question
1991 LPB
1993 LPD
1994 LPG
,
COHORT
1995 LPH
1996 LPJ
1998 LPK

I>
39
MAINTENANCE
Is there any Court Order in force (not a CSA assessment) that says that you, or any of the children, should receive regular maintenance payments from this partnerbhe other parent of [CHILD]?
Yes ..... No ....,
[IF COURT ORDER] Who is it that should be receiving these Maintenance Payments?
Respondent ....-. Partner ......
Children ..... Both .....
[ALL WITH A LIVING EX-PARTNER WHO IS THE PARENT OF'A CHILD IN THE HOUSEHOLD] Sometimes these payments are made, not through a Court Order but through an agreement between the parents. These are called voluntary payments. Do you have a voluntary agreement which says that you, or the child(ren), should receive regular voluntary payments from this person?
Yes ..... No .....
1
1991 LP B
% 24 76
(939)
23% 1%
85% -
(260)
% 15 85
(918)
COHORT
1993 LP D ,
% 27 73
(727)
% 6
nla 83 11
- (232)
% 15 85
(724)
1994 LP G
. % : . 23 77
(683)
J. % 12 n/a 80 8
(174)
% 13 87
(680)
1995 LP H
% 19 81
(595)
% 12
n/a 81 7
(133)
% 12 88
(595)
1996 LP J
% 17 83
(605)
% 18
nla 71 11
(125)
YO 12 88
(604)
1998 LP K
% 14 86
(630)
% 16
n/a 78 6
(96)
% 10 90
(629)
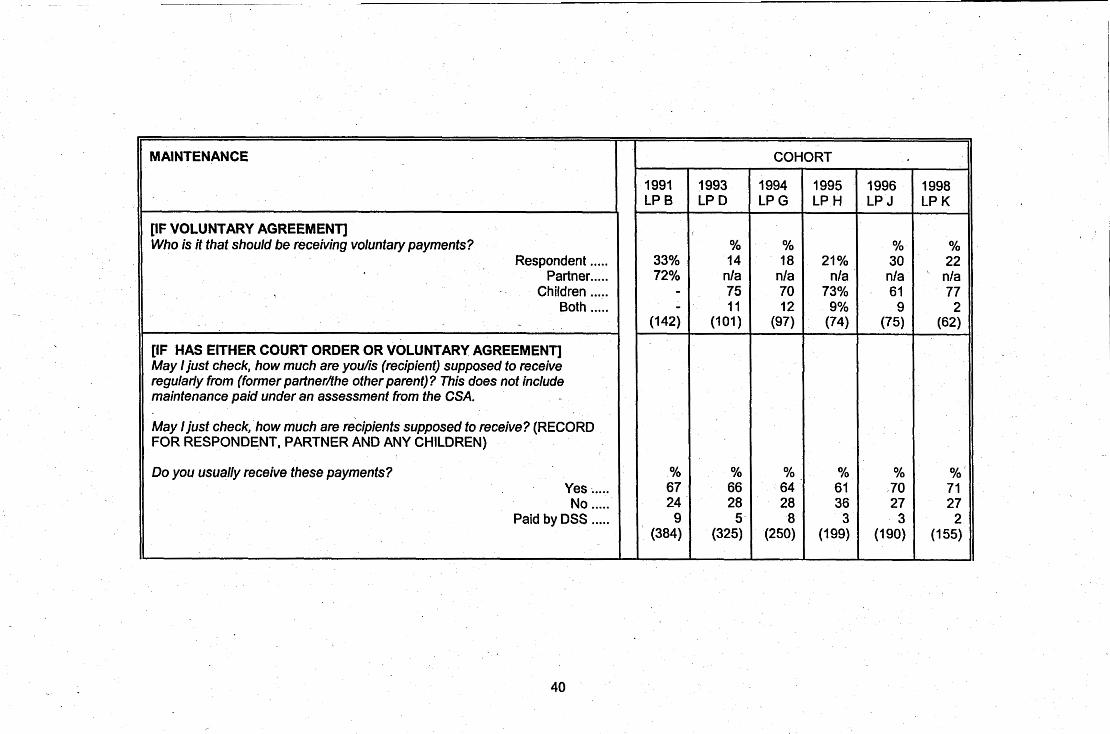
I I
MAINTENANCE
I I
COHORT
[IF VOLUNTARY AGREEMENT] Who is it that should be receiving voluntary payments?
(142) (101) (97) (74) (75) (62)
[IF HAS EITHER COURT ORDER OR VOLUNTARY AGREEMENT] May I just check, how much are youhs (recipient) supposed to receive regularly from (former partnerhhe other parent)? This does not include maintenance paid under an assessment from the CSA.
May I just check, how much are recipients supposed to receive? (RECORD FOR RESPONDENT, PARTNER AND ANY CHILDREN)
Do you usually receive these payments?
1991 LPB
1993 LPD
c
%
1994 LPG
%
1995 LPH
1996 LPJ
%
1998 LPK
%

MAINTENANCE
[IF NOT USUALLY IN RECEIPT OF PAYMENTS] Are these payments in arrears now?
Yes ..... No .....
Don't know .....
II Can 1 just check, have you ever received any of this maintenance due to you or to the children?
Partner 1 Yes - respondent ..... Yes - children .....
Yes - both .....
[IF EVER RECEIVED MAINTENANCE] How many weeks or months are you owed in overdue maintenance payments?
[IF NO-ONE SHOULD BE RECEIVING MAINTENANCE] Have you ever tried to get maintenance from a former partner?
Yes ..... No .....
COHORT
21n 1996 and 1998 Base: [all not usually in receipt of payments] . .


MAINTENANCE . r
[ALL WHOSE EX-PARTNER IS THE OTHER PARENT] QUESTIONS ABOUT THE NEW CHILD SUPPORT AGENCY
Has the Child Support Agency, or CSA, made an assessment, instructing this former partner/other parent to pay maintenance to you and your child(ren)?
Yes ..... No .....
A waiting outcome . . . . . Don't know .....
[IF CSA HAS MADE AN ASSESSMENT] Is there a court order in force made by the new Child Support Agency that says that you, (or your current partner), or any any of the children should receive regular maintenance payments?
Yes ..... No .....
No, but CSA have made enquiries .....
-
COHORT


MAINTENANCE
[IF EX-PARTNER HAS ANY CONTACT WITH RESPONDENT OR CHILDREN] Could you tell me whether, during the past month, your former partner has helped you or your children in any of the ways shown on this card. .. [multi- coded]
looking after your children while you work ..... looking after your children at other times .....
providing clothes for your children ..... providing toyslgameslbooks for your children .....
preparing meals for your children ..... taking your children on tripslholidays .....
offering lifts elsewhere ..... Occasional financial help .....
none of these .....
[IF SUPPOSED TO RECENE MAINTENANCE] Apart from the question of whether or not you receive regular maintenance payments, how do you feel about the total amount of maintenance that your/each former partner is supposed to pay. Would you say it is .... ?
More than enough ..... About right .....
A bit less than it should be ..... or much less than it should be .....
(Don't know) .....

MAINTENANCE
[ALL WITH LIVING EX-PARTNERS WHO IS THE PARENT OF A CHILD IN THE HOUSEHOLD] - What, if anything, would you say would be the right amount of maintenance that your former partner should be asked to pay?
[ALL EX-PARTNERS] Sometimes, separating or divorcing partners receive property or capital from a former partner (or non-resident parent) over and above that to which they had personally contributed. This if often called a 'clean break' settlement.
Have you ever received any of the following from your former partner (other parent).. ..
.... any of hidher share of the value of a house or flat? Partner 1 Yes .....
No .....
Did you receive any of hidher share of any other property? Yes ..... No .....
47
1991 LP B
- nla
%
(nla)
%
(nla)
1993 LP D
nla
% 10 90
(758)
%
99 (757)
1994 LPG
%
(nla)
%
(nla)
COHORT
1995 LP H
%
(nla)
%
(nla)
1996 LP J -
%
(nla)
%
(nla)
1998 LP K
%
(nla)
%
(nla)

MAINTENANCE
Did you receive any of his/her share of any savings or investments? Yes ..... No .....
1 [IF RECEIVED ANY PROPERTY, CAPITAL OR SAVINGS]
I Did you accept this exchange for lower maintenance, or instead of any maintenance at all, or did this not affect any maintenance?
I
Exchange for lower maintenance ..... Instead of maintenance ..... Not affect maintenance .....
[ALL WITH A LIVING EX-PARTNER WHO IS THE PARENT OF A CHILD IN THE HOUSEHOLD] Have you had any contact at all with the new Child Support Agency?
Yes .....
[IF NO CONTACT WITH CSA] Have you ever thought about contacting the Child Support Agency yourself?
Yes ..... No .....

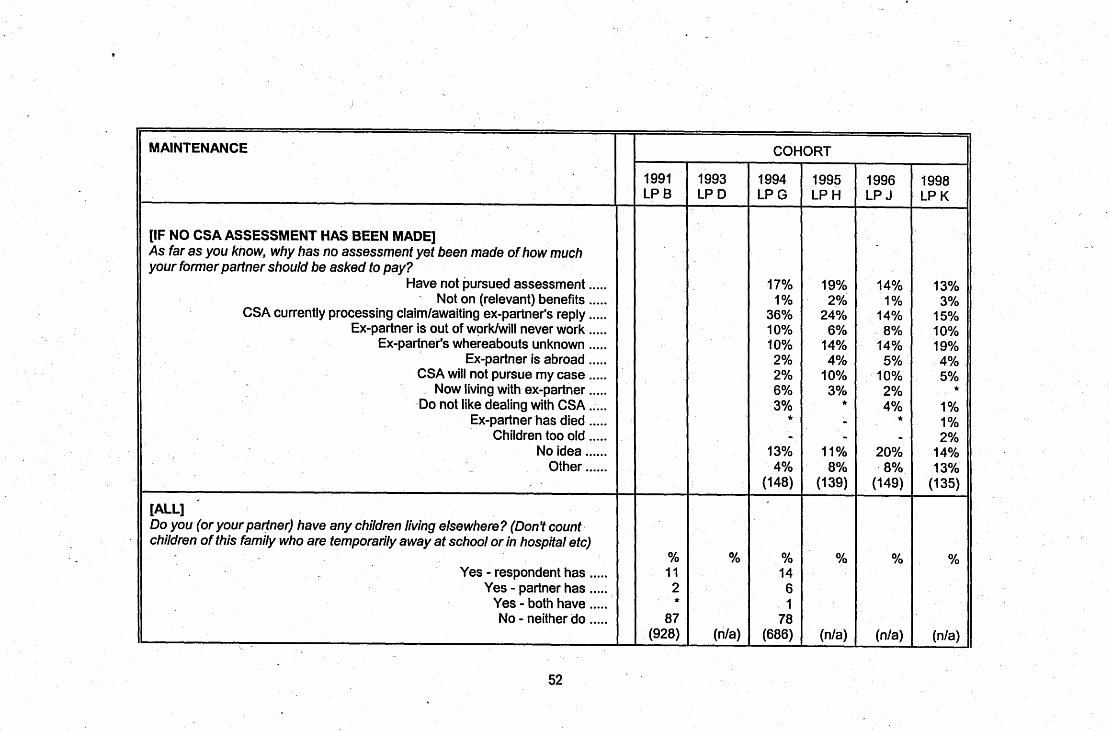
MAINTENANCE
Is there any special reason why you have not contacted the Child Supporf Agency so far?
..... Do not want or need more maintenance Effect on benefits .....
..... Will cause problems in relationship between ex-partner and family
..... Ex-partner is out of worklwill never work
..... Ex-partner's whereabouts unknown Ex-partner is abroad .....
CSA will make contact first ..... Not currently eligible for CSA child support .....
Not thought about it ..... Ex-partner could become violent .....
Ex-partner would stop worklno point ..... ..... Ex-partner died
Kids too old ..... NOW-living with ex partner .....
..... Object to CSA
..... Difficulty geting in touch Don't want ex penalised .....
..... Other
I
49
1991 LPB
(nla)'
1993 LPD
(nla)
1994 LPG
24% 3% 6%
10% 7% 2% 3% 5%
18% 2% 3% 6%
12% 5% 3% 1% 3% 1%
(412)
COHORT
1995 LPH
26% 2%
10% 10% 6% 1% 1% 3%
10% 1% 4% 7%
17% 6% 3% .
4% 4%
(354)
1996 LPJ
J
(nla)
1998 LPK
I
(nla)

MAINTENANCE rr- [IF HAD ANY CONTACT WITH CSA] '
Did you yourself approach the Child Support Agency for help in getting maintenance from a former parfner, or did the Agency get in touch with you first?
Respondent approached first ..... Agency contacted respondent first .....
When was your first contact with the CSA? I I . nla
At the time of your first contact with the CSA, how did you feel about them taking up your case?
Very happy about it ..... Quite happy about it .....
Not very happy about it ..... Not at all happy about it .....
(Don't know) .....
And how do you feel about if now? '
Very happy about it ..... Quite happy about it .....
Not very happy about it ..... Not at all happy about it .....
(Don't know) .....
nla
%
(nla)
COHORT

1996 1998 LPJ LPK
% % 29 26 71 74
(176) (213)
(nla) (nla)


''ln 1995-1 998 only based on if maintenance paid to other parent ,
' MAINTENANCE I
[IF MAINTENANCE PAID TO OTHER PARENV d
I How much do you (or your partner) pay to the other parent?
I [IF MAINTENANCE PAlD TO (EITHER OTHER CHILD OR) PARENT] Are these payments made under a court order? .
Yes ..... No .....
[IF PAYMENTS MADE UNDER COURT ORDER] Have you/your partner usually been able to make these payments? -
Yes ..... I No ..... I
I re youhs your partner in arrears with these payments now? Yes ..... No .....
' [IF IN ARREARS WITH MAINTENANCE PAYMENTS] How much do these arrears add up to now?,
1991 LP B
% 16 84
(15)
% 100 - (3)
% - 100 (3)
1993 LP D
nla
%
(nla)
%
(nla)
%
(nla)
nla
1994 LPG
% 25 75
(21)
% 100 - (8)
% - 100 (8)
COHORT
1995 LP H
% - 100 (3)'
%
- 1
%
- 1
1996 LP J
% 30 60
(2)'
% 96 4
(10)
% 10 90
(12)
1998 LP K
% - 100 (2)'*
% 100
- (8)
% 4
' 96 (8)

",
I
MAINTENANCE
r
COHORT
People have different reasons for not living as a couple with someone . A number of reasons are listed on this card .
May I ask which of these reasons applies to you? ..... Generally. relationships are not worth the effort ..... I prefer'to live independently. not as part of a couple
I have not met anyone I liked enough to live with ..... It would not be good for the children ..... It would not have worked out/lasted ..... Men don't earn enough these days .....$
..... My ex-partner would stop payinglpay less maintenance
..... I would lose social security benefits i ..... It is against my religion or beliefs
..... My parents would not approve My ex-partner would not approve .....
..... The houselflat is not big enough
..... Other
1991 LP B
(nla)
1993 LP D
(nla)
1994 LPG
(nla)
1995 LPH
52% 58% 19% 7% .
1% 11% 3% 1% 1% 5% 6%
(448)
1996 LPJ
1998 LPK
8% 51% 52% 18% 12% 5% 1%
12% 2% 1% 2% 6% 4%
(494)
6% 54% 54% 19% 10% 3% 1% 8% 2% 1% 1% 6% 5%
(465)

MAINTENANCE
If more than one reason given, could you look at the card again and say which reason has been the most important for you?
Generally, relationships are not worth the effort ..... I prefer to live independently, not as part of a couple .....
I have not met anyone I liked enough to live with ..... It would not be good for the children ..... It would not have worked outllasted .....
My ex-partner would stop payinglpay less maintenance ..... - Men don't earn enough these days ..... I would lose social security benefits .....
It is against my religion or beliefs ..... My parents would not approve .....
My ex-partner would not approve ..... The houselflat is not big enough .....
Other .....
COHORT
1991 LP 6
%
(nla)
1993 LP D
%
(nla)
1994 LPG
%
(nla)
1995 LP H
1996 LP J
1998 LP K
% 3
36 37 8 5 - 1 2 1
*
1 4
(465)
% -
36 39 10 2
- - 4
2 -
1 5
(460)
% 4
37 33 8 4
3 4 1 - 1 2 3
(493)


MAINTENANCE
Did anyone at the DSS or the Child Support Unit ever ask you for the name and address of your last partner so they could try and get maintenance from them?
Yes ..... No .....
Don't know .....
COHORT
1991 LP B
%
(nla)
1993 LP D
% 48 50 2
(757)
1994 LPG
%
(nla)
1995 LP H
%
(nla)
1996 LP J
%
(nla)
1998 LP K
%
(nla)

11 "" I would now like to ask you a few questions about your health. Over the last 72 months would you say your health has on the whde been good, fairly good or not good?
good ..... fairly good .....
not good ..... --
Do you have any long-standing illness, disability or infirmity? By long-standing I mean anything that has troubled you over a period of time or that is likely to affect you over a period of time.
Yes .....
[IF HAS ILLNESS, DISABILITY OR INFIRMITYI What is the name of this condition? What does the doctor call it? Any other conditions? /'
Does this health problem limit your daily activities in any way compared to people of your own age? (first problem)
Yes .....
I cot 1995 1996 1998 LPH LPJ LPK
% % % 52 50 49

HEALTH
How old were you when this health problem started? (first problem)
Are you registered as a disabled person with any organisation such as the Local Authority or the Job Centre?
Local Authority ..... Job Centre .....
Other ..... ' No .....
Compared with other people in this area with the same skills and experience as yours, does your health problem make it harder to get and keep a paid job?
. Yes ..... No .....
Don't know ....
Does this problem affect the kind of work you can do or where you can do it? Yes ..... No .....
- Don't know .....
CHECK..ls respondent in paid work at present? Yes .....
- No .....
r l
1 63
1991 LP B
(nla)
%
(nla)
% 44 56 -
(122)
% 44 56
- (122)
% 28 72
(122)
1993 LP D
(nla)
%
(nla)
% 42 54 4
(1 54)
YO 58 38 4
(1 53)
YO 31 69
(160)
COHORT
1994 LP G
(nla)
%
(n./a)
% 38
. 51 11
(1 58)
% 56 41 3
(158)
% 39 61
(159)
1995 LPH
30 ' (1 56)
% 8 2 -
90 (1 59)
% 28 58 14
(1 59)
% 48 44 8
(1 59)
% 37 63
(129)
1996 LPJ
32
% 8 - -
92 (21 8)
% 33 59 8
(21 5)
% 57 37 6
- (21 5)
% 39 61
(180)
1998 LPK
33 (208)
10% 4% -
87% (207)
% 39 48 13
(207)
% 52 39 8
(207)
% 40
(197)


HEALTH
Industrial Injuries Disablement benefit ..... mean .....
Some other benefit for people with disabilities ..... mean ....
[1F RECEIVES IVB, SDA OR DLA]
Had you heard of Disability Working Allowance before today? Yes ..... No .....
[IF RECEIVES ATTENDANCE ALLOWANCE] Do you receive the aftendance allowance at the ...
higher rate of £41.65 a week ..... lower rate of £27.80 a week .....
Don't know .....
[ALL1 May 1 just check, do you ever get short of breath walking with people of your own age on level ground?
Yes ..... No .....
COHORT .

HEALTH
[IF GETS SHORT OF BREATH] Does that happen frequently or only occasionally?
Frequently ..... - Occasionally .....
F
COHORT
1991 LP B
%
(nla )
1993 LP D
%
(nla)
1994 LP G
%
(nla)
1995 LPH
% 46 54 (80)
1996 LPJ
% 54 46
(98)
1998 LP K
% 46 54
(1 02)
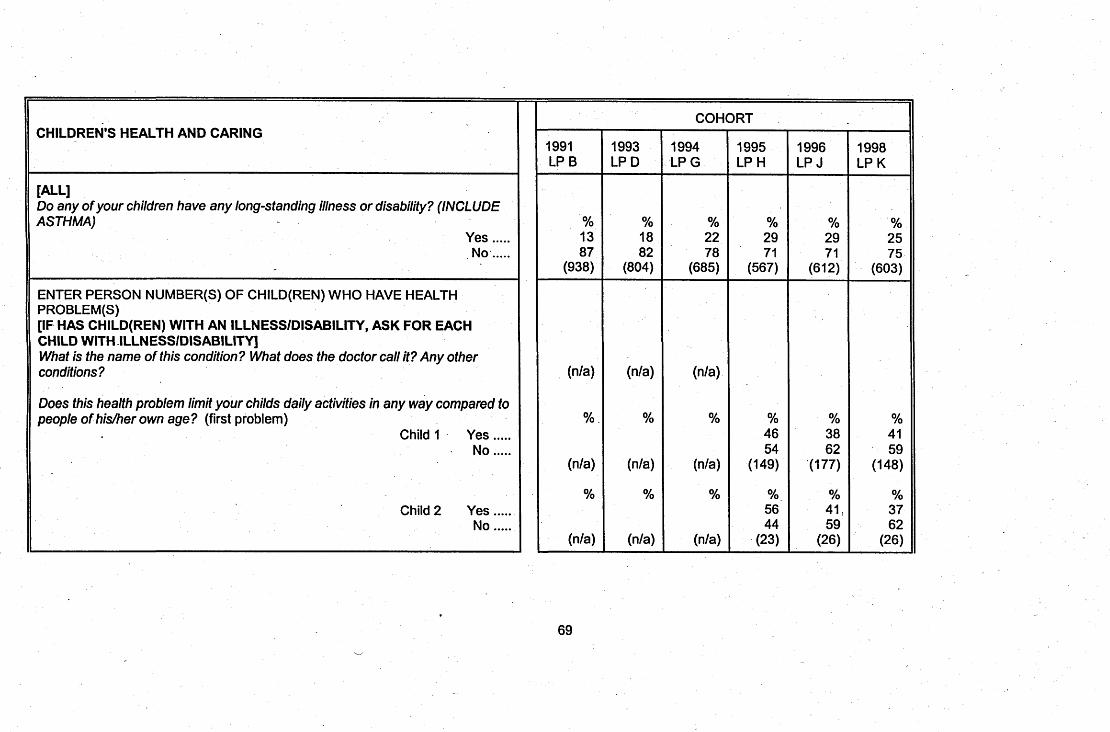
[ALL1 Do any of your children have any long-standing illness or disability? (INCLUDE ASTHMA)
Yes ..... No. ..... I
ENTER PERSON NUMBER(S) OF CHILD(REN) WHO HAVE HEALTH PROBLEM(S) [IF HAS CHILD(REN) WlTH AN ILLNESSIDISABILITY, ASK FOR EACH CHILD WlTH -ILLNESSIDISABILITY] What is the name of this condition? What does the doctor call it? Any other conditions?
Does this health problem liml your childs daily activities in any way compared to people of hisher own age? (first problem)
Child 1 Yes ..... . No .....
Child 2 Yes ..... No .....

CHILDREN'S HEALTH AND CARING
[IF SPENDS MORE TIME CARING FOR CHILD(REN)] Do you do all of the work of looking affer this child, or does someone else help with it?
Child 1 Respondent does most of work ..... Someone else helps .....
Child 2 Respondent does most of work ..... Someone else helps .....
[IF COUPLE] How do you share this extra work looking aiter (..name..s) ?
Child 1 I do most of it ..... My partner does most of it .....
We share it more or less equally ..... Someone else does most of it .....
Child 2 I do most of it ..... My partner does most of it .....
We share it more or less equally ..... Someone else does most of it .....
71
1991 LP B
% 88 12
(87)
% 100
, - (10)
% 89 -
- 11 (6) % - - - -
1993 LP D
% 90
. 10 (73)
% 100 - (9)
%
(nla) %
COHORT
1994 LPG
% - 85
15 (79)
% 97 3
(8)
%
(nla) %
(nla)
1995 LPH
YO 88 12
(65)
% 63 37
(11)
%
(nla) %
(nla)
1996 LPJ
% 79 21
(74)
% 88 12
(1 0)
%
(nla) %
(nla)
1998 LPK
% 73 27
(59)
% 90 10
(13)
yo
(nla) %
(nla)


I.
,
CHILDREN'S HEALTH AND CARING
[IF RECEIVES ATTENDANCE ALLOWANCE] Do you receive attendance allowance at the ...
higher rate of £41.75 a week ..... lower rate of f 27.80 a week .....
(not sure) .....
[ALL] Is there anyone else you care for, because they have a longstanding illness, disability or infirmity of any kind?
Yes ..... No .....
ENTER PERSON NUMBER OF EACH PERSON HELPED [IF OTHER CARING DUTIES] Does this person live in your household?
Yes ..... No .....
Does this person's illness or disability cause you (or your partner) to spend time caring for himher?
Yes ..... No .....
1991 LP B
% 41 59 -
(11)
% 2
98 (939)
% 2
98 (25)
% 77 23
(25)
1993 LP D
-%
(nla)
% 5 95
(804)
% 9
91 (42)
% 86 14
(40)
COHORT
1994 LPG
%
(nla)
% 4
96 . (686)
Yo 13 87
(33)
% 99
1 (32)
1995 LP H
%
' (nla)
% 7
93 (594)
% 19 81
(39)
% 89 11
(38)
1996 LP J
%
(nla)
% 8
92 (672)
% 25 75
(56)
%
(nla)
1998 LP K
%
, (nla)
% 9
91 (668)
% 25 75
(63)
%
(nla)


Does this person receive the attendance allowance, or disability living allowance care component?
Yes ..... No .....
11 Do you get Invalid Care Allowance for looking after this person?
Yes ..... No .....
Do you (or your partner) get lnvalid Care Allowance for looking aRer thls person?
Yes - respondent ..... Yes - partner .....
Yes - both ..... No .....
COHORT .

DERIVED VARIABLES - EDUCATION AND TRAINING
Highest qualification
None ..... Lower School .....
Vocational ..... Advanced School .....
Post-secondary advanced . . ... y University .....
i
9
COHORT
1991 LP B
% 43 28 15 4 ' 5 5
(941 )
1993 LPD
% 37 22 19 6 8 6
(804)
1994 LPG
% 35 22 21 7 8 7
(686)
1995 LPH
% 34 21 22 6 9 8
(595)
1996 LPJ
% 35 21 20 7 9 8
- (673)
1998 LPK
% 33 22 21 7 8 9
(672)


EDUCATION AND TRAINING
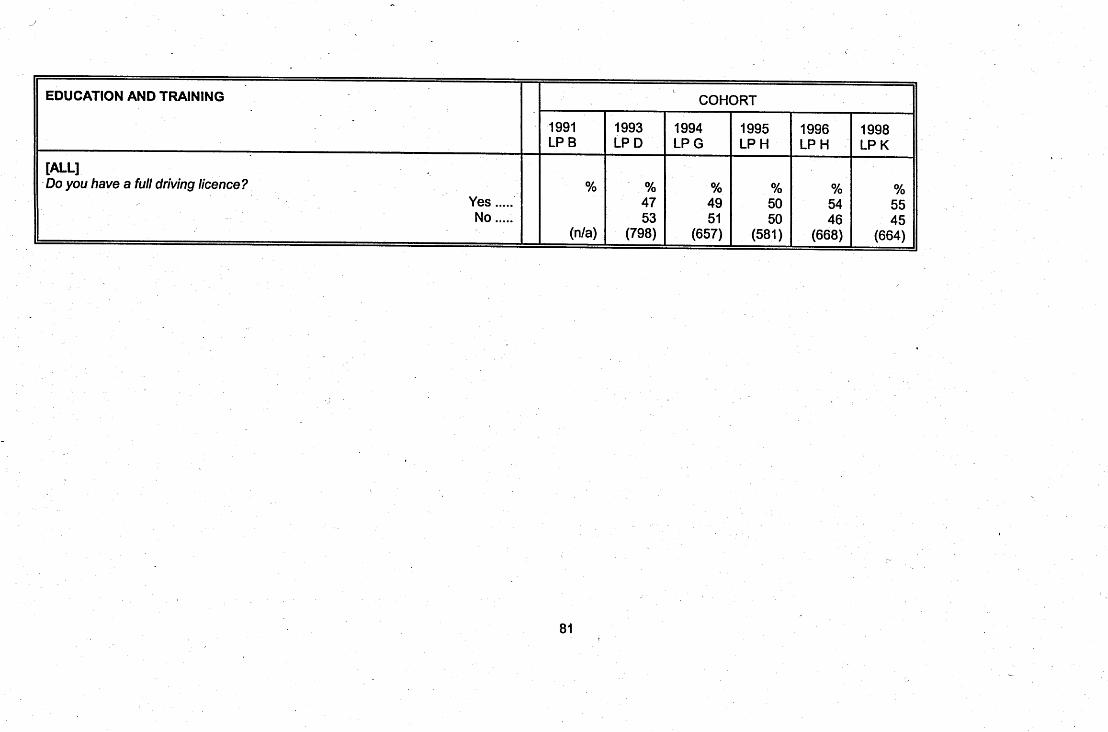
(Aparf from the one we have just mentioned) Are you now or have you been on any training courses (since we last saw you) designed to help you develop skills you might use in a job?
Yes ..... No .....
(Apart from the one we have just mentioned) Have you been on any training courses sincewe last saw you that were devised to help you develop skills that you might use in a job?
Yes ..... No .....
[IF BEEN ON TRAINING COURSE] What course was this?
managerial course ..... computer skills (word processing, data etc.) .....
clerical skills (typing, telephonist etc) ..... business studies .....
health care course (nursing, first aid etc.) ..... childcare skills (playgroup, care, teaching) .....
further education (degree, A levels) ..... MSIEmployment trairiing .....
Counselling courses ..... Other employment skills .....
Other .....
80
1991 LP B
%
(nla)
%
(nla)
%
(nla)
1993 LP D
% 35 65
(800)
%
(nla)
% 6
13 8 6
. 14 9 2
nla nla
8 33
( 268)
COHORT
1994 LPG .
%
(nla)
% .19 81
(686)
8% 15% 4%
11% 16% 6%
12% nla 4%
32% 7%
( 162)
1995 LP H
%
(nla)
% 21 79
(595)
11% 19% 2% 3%
26% 5% 9% nla nla
32% 5%
(151)
1996 LP H
%
(nla)
% 32 68
(671)
7% 80% 7% 7%
24% 9% 8%
- 6%
24% - (241)
1998 LP K
%
(nla)
Yo 33 67
(671)
3% 26% 4% 6%
20% 9%
10% -
3% 29% 6%
(232)


HOUSING
[IF BEEN IN TEMPORARY ACCOMMODATION] When did you last leave such accommodation?
How long had you lived there?
[ALL IN PRIVATE ACCOMMODATION]
When did you start living here? I What kind of accommodation do you occupy here?
Detached houselbungalow ..... Semi-det. house/bungalow ..... terrace houselend terrace . . .. .
purpose built flatlmaisonette ..... self contained flatlmaisonette in converted building .....
Rooms(s) not self contained ..... Caravanlmobile hornelhouseboat .....
Other (specify) .....
COHORT
1998 , LPK


-
i
I
85
HOUSING
[IF OWNED OR BEING BOUGHT ON A MORTGAGE] Was this home purchased from the council under the Right to Buy scheme?
Yes ..... No .....
I
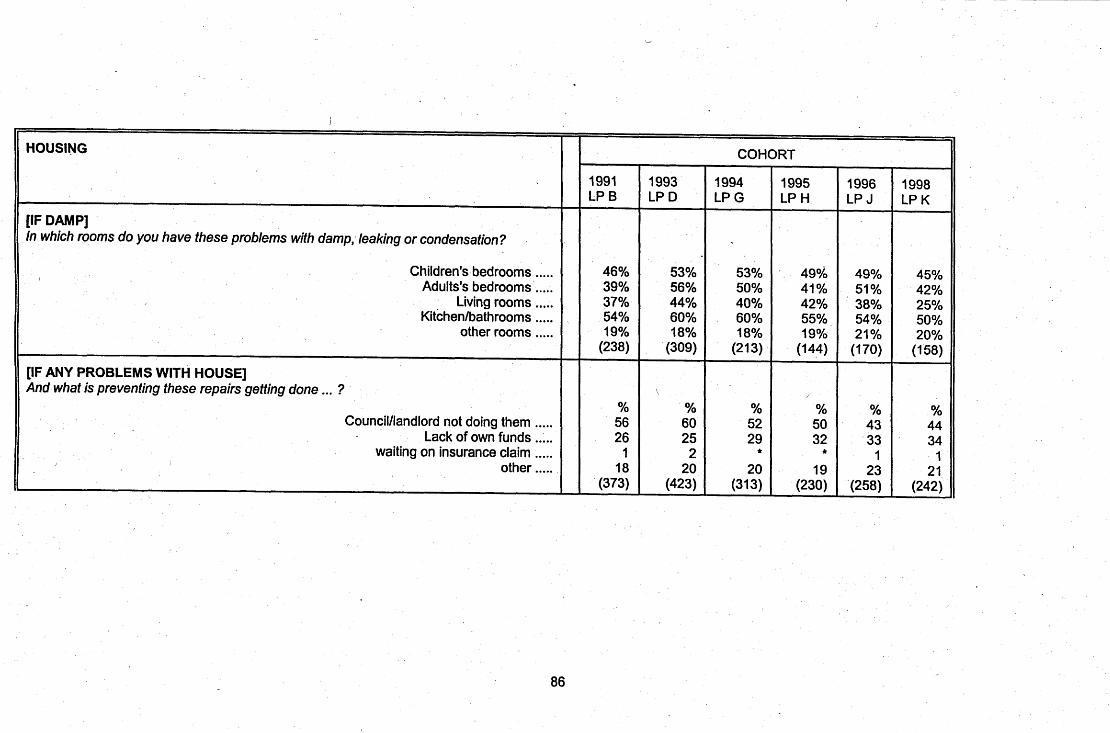
tNL1 Are there any repairs that need to be done to your home such as the problems listed on this card? [MULTI-CODED]
Rising damp in floor & walls ..... Water getting in from roof,gutters or windows .....
i Bad condensation problems ..... Electrical wiring .....
Plumbing ..... General rot and decay ..... Problems with insects .....
Problems with mice or rats ..... Other repairs .....
' None of these .....
1991 LP B
' %
(nla)'
13% 13% 11% 8% 6% 9% 9% 1%
12% 56%
(941)
1993 LP D
% 9
91 (318)
18% 17% 24% 9% 9%
10% 7% 3% 8%
46% (804).
COHORT
1994 LP G
% 10 90
(292)
13% 14% 19% 8% 7% 9% 7% 3%
11% 49% (686)
1995 LP H
% 10 90
(261)
11% 11% 12% 7% 9% 8% 7% 2%
17% 56%
(595)
1996 LP J
3
% 16 84
(332)
9% 12% 13% 5% 7% 9% 5% 2%
11% 61%
(673)
1998 LP K
% 17 83
(346)
11% 13% 11% 5% 9% 6% 6% 1%
12% 60%
(672)

HOUSING
[ALL RENTERS] How much do you actually pay in rent affer you have received any rent rebate, but not including any charges for water, heating, service charges and so on? And what period of time does that cover?
And how much are your water charges?
Do you receive any Housing-BeneM or rent rebate? Yes ..... No .....
Applied and waiting to hear ..... [IF RECEIVES HOUSING BENEFlTlRENT REBATE] How much rent rebate do you receive? And what period of time does that cover?
[ALL RENTERS] So what is the total amount of rent for this accommodation. That is, the amount charged before any rebates or deductions but'NOT including charges for water, heating, service charges and so on? (So how much would the total rent be, if you didn't get your rent rebate, but again not including affer charges?)
And what period of time, does that cover?
'
1991 LP B
n .la
% 85 15
(531)
1993 LP D
nla
% . 83 17
(462)
COHORT
1994 LP G
nla
% 81 19
(378)
1995 LP H
% 83 17
(322)
1996 LPJ
,
Yo 77 23
(344)
1998 LPK
% 72 27
1 (325)

HOUSING COHORT
1 1991 1993 1994 1995 1996 1998 LP B LP D LP G LPH , LPJ LPK
[ALL RENTERS] In April 1996, the government changed the Housing Benefit rules. Now. people who have been claiming Income Support for at least 6 months, can still get.their rent paid for 4 weeks if they move into work of 16 hours a week or more. Have you heard of this change before today? fl % %
Yes, already claimed ..... 3 6 Yes, but not claimed ..... 22 25
No ..... 76 69 (nla) (nla) (nla) (nla) (346) (329)
[ALL RENTERS] A s far as you are aware, do people who work 16 hours or more each week have any entitlement to housing benefit (rent rebate) ? YO % % % % %
Yes ..... 53 33 . 42 Sometimeslit depends ..... 5 9 10
No ..... 8 14 10 No idea ..... 33 44 39
(nla) (nla) (nla) (323) (345) (328)'
[IF PAID ANY RENT] Is your rent paid up to date at the moment, or do you have some rent arrears that will have to be paid?
% % % % % % up to date .... 76 70 72 82 69 73
some arrears .... . 22 27 28 18 30 , ,26 don't know .... 2 2 1 2 * -
(392) (261) (196) (153) (210) (201) 1

HOUSING
[IF HAS RENT ARREARS] How much are your rent arrears at the moment? (weeks, months or amount)
[ALL PAYING A MORTGAGE] Is your mortgage an endowment or repayment mortgage?
Endowment .... Repayment.. . .
DK ....
i
COHORT
1991 LP B
---
% 66 34 nla
(285)
1993 LP D
% 64 33 3
(255)
1994 LP G
% 66 30 4
(241)
1995 LP H
% 62 35 2
(21 1)
1996 LPJ
1998 LPK
% 60 35 4
(265)
% 62 35 2
(253)


HOUSING
How much do you receive towards your mortgage interest?
[ALL THOSE WITH A MORTGAGE AND NOT LIVING IN SCOTLAND] How much are your water charges?
COHORT
1991 LP B
(nla)
(nla)
1993 LP D
1994 LP G
(nla)
1995 LP H
1996 LPJ
1998 LPK
r
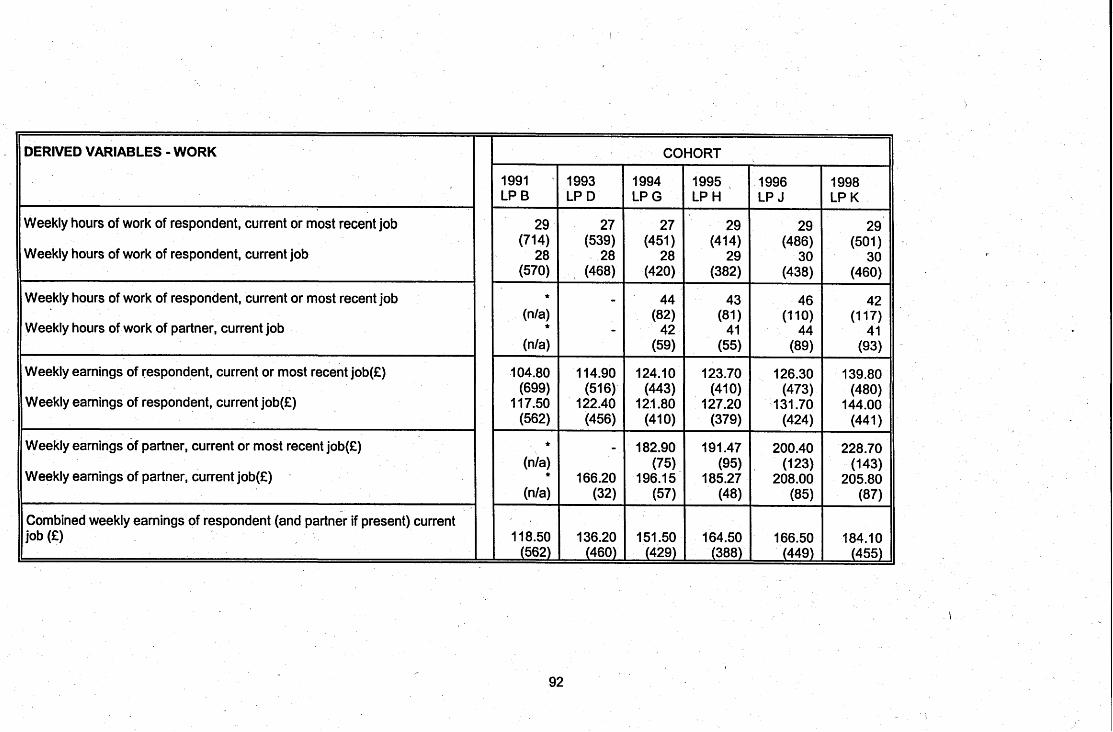
DERIVED VARIABLES -WORK
Weekly hours of work of respondent, current or most recent job
Weekly hours of work of respondent, current job
Weekly hours of work of respondent, current or most recent job
Weekly hours of work of partner, current job
Weekly earnings of respondent, current or most recent job(£)
Weekly earnings of respondent, current job(£)
Weekly earnings of partner, current or most recent job(£)
Weekly earnings of partner, current job(£) -
Combined weekly earnings of respondent (and partner if present) current job (f
1991 LP B
29 (714)
28 (570)
(nla)
(nla)
104.80 (699)
1 17.50 (562)
(nla) *
(nla)
1 18.50 (562)
1993 LP D
27 (539)
28 (468)
- -
114.90 (516)
122.40 (456)
-
166.20 (32)
136.20 (460)
1994 LPG
27 (451)
28 (420)
44 (82)
42 (59)
124.10 (443)
12.1.80 (410)
182.90 (75).
196.15 (57)
151.50 (429)
COHORT
1995 , LP H
29 (414)
29 (382)
43 (81
41 (55)
123.70 (410)
127.20 (379)
191.47 (95)
185.27 (48)
164.50 (388)
1996 LP J
29 (486)
30 (438)
46 (1 10)
44 (89)
126.30 (473)
131.70 (424
200.40 . (123)
208.00 (85)
166.50 (449)
1998 LP K
29. (501 )
30 (460)
42 (1 17)
41 (93)
139.80 (480)
144.00 (441
228.70 (143)
205.80 (87)
184.1 0 (455)

I.
WORK
[ALL1 1 would now like to ask some questions about paid work. Which of these best describes your situation?
- In paid work, 16 hrs. a week or more ,.... In paid work, less than 16 hrs a week .....
Unemployed and seeking work ..... On a training scheme ..... In full-time education .....
Temporarily sick or disabled (up to 6 months) ..... Permanently sicwdisabled (6 months or longer) .....
Looking after the home & family ..... Other .....
Which of these best describes your situation?
In paid work, 24 hrs. a week or more ..... . - In paid work, less than 24 hrs a week .....
Unemployed and seeking work ..... In full-time education .....
Temporarily sick or disabled (up to 6 months) ..... Permanently sickldisabled (6 months or longer) .....
Looking after the home & family ..... Other .....
I
1991 LP B
%
(nla)
% 26 11 7- 1 * 1
52 I
(935)
1993 LP D
% 31 9 7 1 1
3 47
1 (804)
%
(nla)
1994 LPG
% 34 I 1 5 *
2 1 3
43 I
(685)
%
(nla)
COHORT
1995 LP H
% 40 9 5 1 - 1 3
41 1
(595)
%
(nla)
1996 LP J
% 43
9 6 1 1
4 36
*
(673)
%
(nla)
1998 LP K
% 50 7 5 1
*
5 30
1 (671
%
(nla)


WORK COHORT
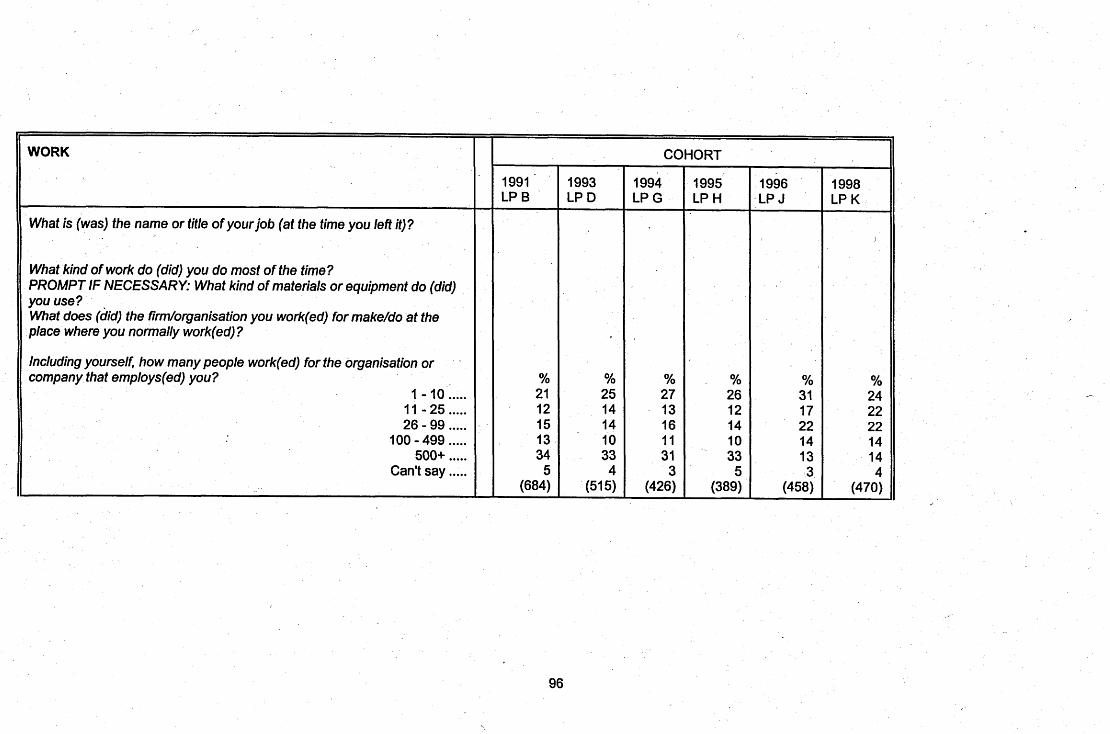
What is (was) the name or title of your job (at the time you leR if)?
What kind of work do (did) you do most of the time? PROMPT IF NECESSARY: What kind of materials or equipment do (did) you use? What does (did) the firm/organisation you work(ed) for make/do at the place where you normally work(ed) ?
Including yourself, how many people work(ed) for the organisation or -
company that employs(ed) you? I - I 0 .....
11 - 25 ..... 26 - 99 .....
100 - 499 ..... 500+ .....
Can't say .....


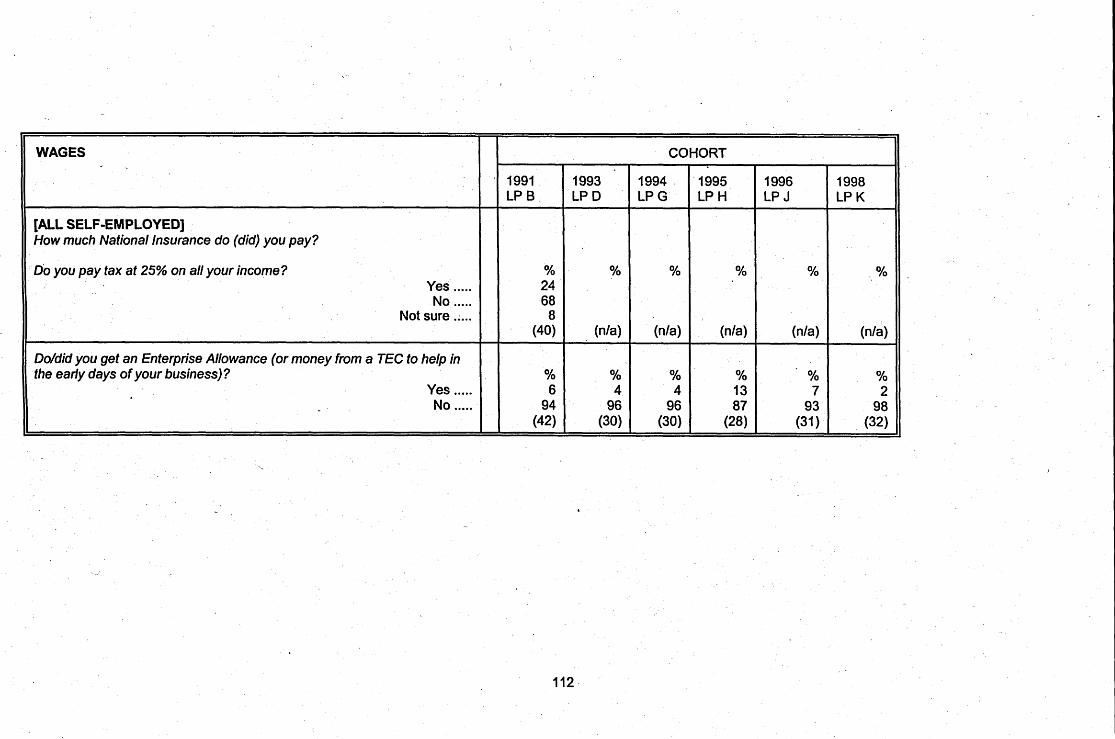
WAGES
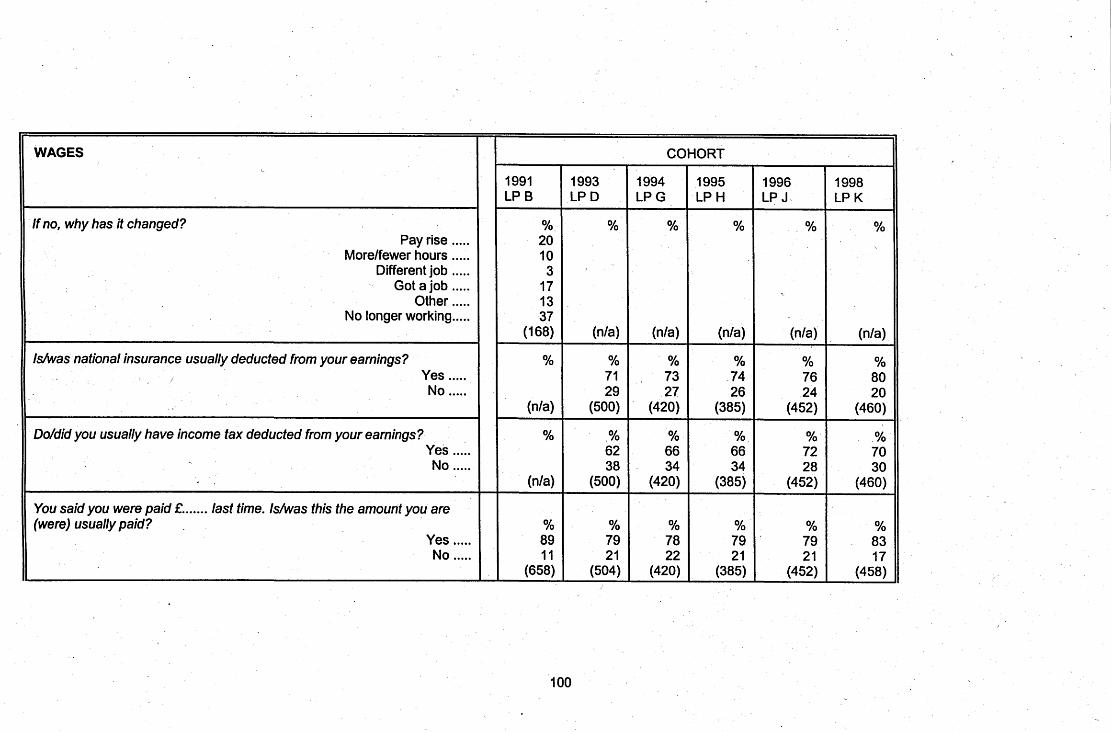
When you are (were) paid more, about how much more, afier deductions, do (did) you get paid? (if varies alot, ask for average amount)
And how often were you paid less than your usual pay? every other week .....
every 3 weeks ..... every 4 weeks .....
every 5 - 6 weeks ..... every 7 - 8 weeks .....
every 9 - 10 weeks ..... less often .....
never .....
When you are (were) paid less, about how much less, afier deductions, do (did) you get paid? (think you might get paid?)
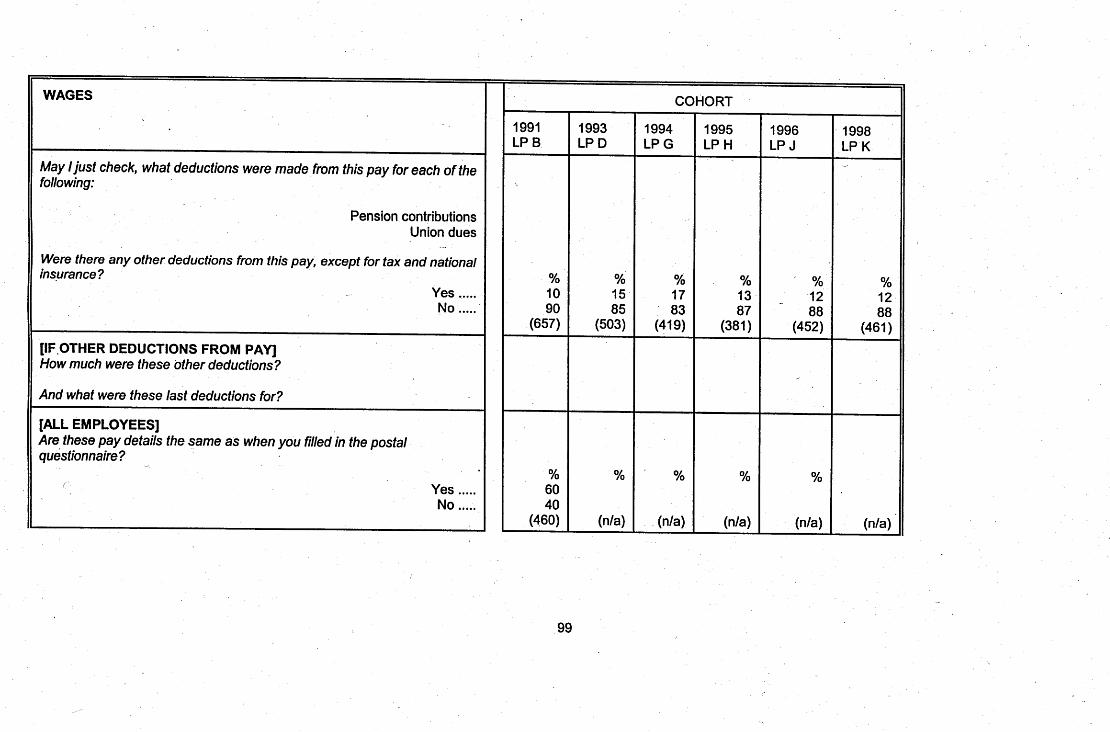
[ALL EMPLOYEES] Do (did) you receive any of these from your employer in this job? (% yes)
subsidised meals .... : luncheon vouchers .....
subsidised accommodation ..... childcare facilities .....
a company car or van for your private use ..... Any other payment in kind, such as discount staff vouchers and so on .....
. - 103
-
1991 LP B
% . 4 3 7 1 2 2
15 65
(246) -
9% 2% 1% 1% 4%
13% (678)
1993 LP D
(nla)
%
(nla)
(nla)
17% nla
*
nla 3%
12% (515)
1994 LPG
(nla)
%
(nla)
(nla)
16% nla 1% nla 3%
11% (426)
COHORT
1995 LP H
@/a)
%
(nla)
(nla)
15% nla
*
1% 3%
10% (389)
1996 ' LP J
(nla)
%
(nla)
(nla)
18% nla
1% 3%
12% (458)
1998 LP K
%
(nla)
(nla)
15% nla
*
1% 3% 9%
(470)
WAGES
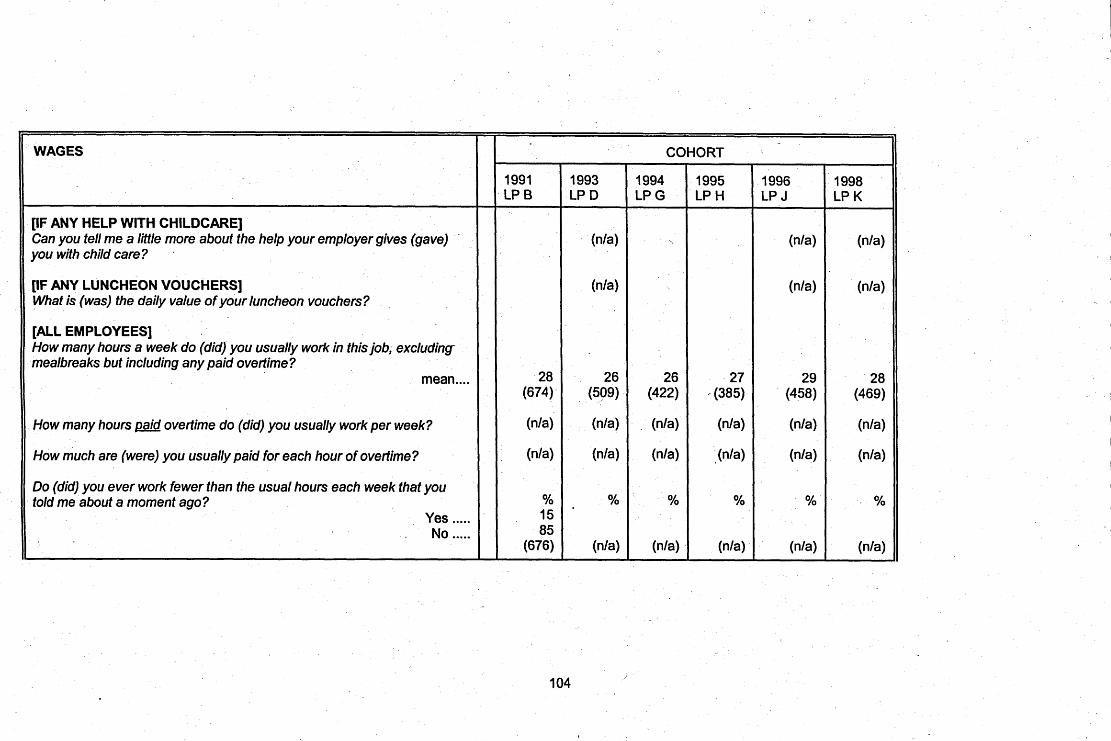
[IF ANY HELP WITH CHILDCARE] Can you tell me a little more about the help your employer gives (gave) you with child care? .
[IF ANY LUNCHEON VOUCHERS] What is (was) the daily value of your luncheon vouchers?
[ALL EMPLOYEES] How many hours a week do (did) you usually work in this job, excluding mealbreaks but including any paid overtime?
mean.. ..
How many hours w d overtime do (did) you usually work per week?
How much are (were) you usually paid for each hour of overtime?
Do (did) you ever work fewer than the usual hours each week that you told me about a moment ago?
Yes ..... . No ..... ,
1991 LP B
28 (674)
(nla)
(nla)
% 15 85
(676)
1993 LP D
@la)
26 (509)
(nla)
(nla)
%
(nla)
1994 LPG
26 (422)
(nla)
(nla)
%
(nla)
COHORT
1995 LP H
27 - (385)
(nla)
(nla)
%
(nla)
1996 LP J
(nla)
(n/a)
29 (458)
(nla)
(nla)
%
(nla)
1998 LP K
(nla)
@/a)
28 (469)
@/a)
(nla)
%
(nla)

WAGES
[IF EVER WORKED FEWER HOURS] Thinking back over the last 6 months, what is the least number of hours in a week that you have worked, apatt from paid holiday or sick leave?
mean .... [ALL1
I And during these last 6 months, about how often have you worked only 1 these sorts of hours?
, every second week ..... every third week .....
every fourth week ..... less often than this .....
Do (did) you ever work more than the usual hours each week that you told me about before?
Yes ..... No .....
COHORT
1991 1993 1994 1995 1996 1998 LP B LP D LPG LP H LP J LP K
18 (94) (nla) (nla) (nla) (nla) (n/a)
% % % % % % 12 4
15 ,
70 (72) (nla) (nla) (nla) (nla) (n/a)
% % %, % % % 38 62 ,
(659) (nla) (nla) (nla) (nla) (nla)


WAGES
[ALL EMPLOYEES] How much do (did) you spend per week on travel to and from work?
mean. ...
And how long does (did) it take you to travel fo your main job? (MINUTES)
Are there any other things you have to pay for to work in your job, apart from childcare?
Yes ..... No .....
If yes, what other things do you have to pay for in order to do your job?
Tools ..... Clothes .....
Make up ..... Books ..... Other .....
1991 LP B
J
£4.79 (633)
(nla)
%
(nla)
%
(nla)
1993 LP D
£4.97 (507)
%
(nla)
%
(nla)
1994 LPG
£5.09 (419)
(nla)
% 13 87
(426)
4% 64% 2%
10% 42% (50)
COHORT
1995 LPH
£5.90 (382)
(nla)
% 16 84
(388)
6% 78%
1% 7%
24% (57)
1996 LP J
£6.70 , (446)
(nla)
% 12 88
(459)
10% 73% 8%
14% 28% (54)
1998 LP K
£6.45 (470)
(nla)
% 10 90
(471)
13% 71% 8% 8%
18% (54)

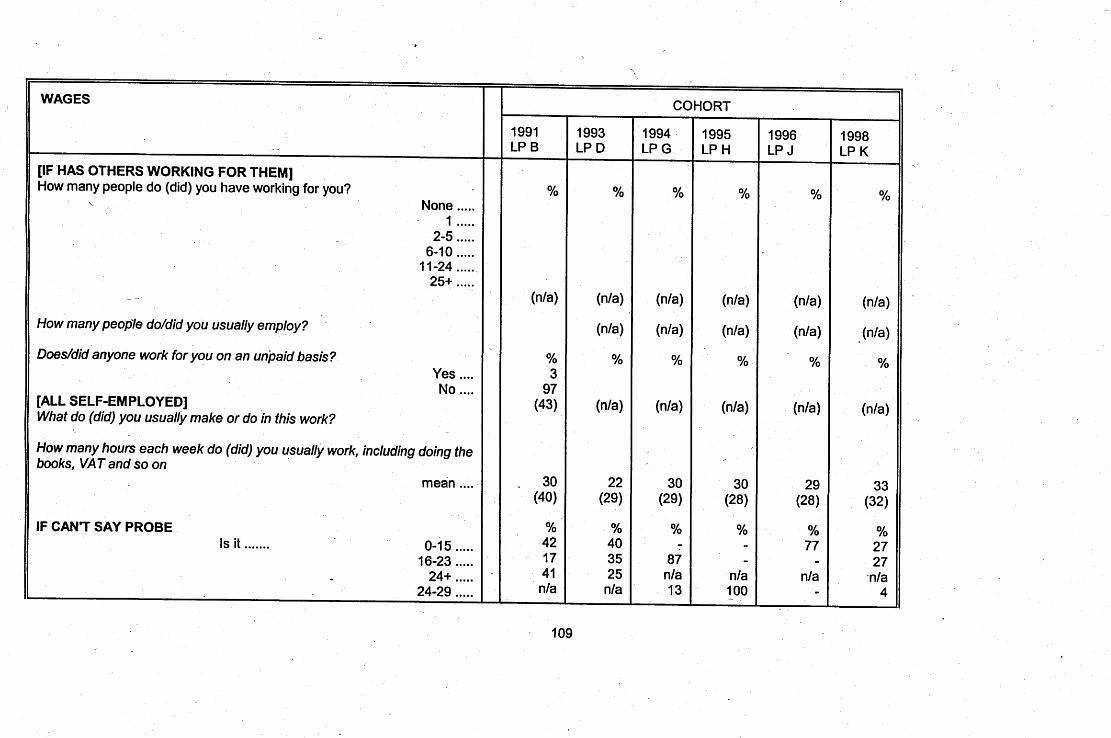


WAGES
What do you think your income from the business will be over the next six months?
On average, how much money do (did) you take out of your business each week for your own and your family's use?
Is (was) this amount &I the cash profit you make (made) from your business or do (did) you make an additional proM when you add(ed) up your income and expenses, which you take (took) as extra income or a bonus?
Weekly allowance is only profit ..... Make additional profit .....
Makes a loss .....
[ALL SELF-EMPLOYED] So what do you estimate is (was) your total income from the business aRer all expenses, taxes etc?
What is the most recent year for which you have full accounts?
Do (did) you pay for a personal pension? Yes ..... No .....
[IF HAS A PERSONAL PENSION] How much do (did) you pay for your personal pension?
111
/
1991 LP B
% 37 59 4
(31
% 18 82
(43)
1993 LP D
% 92 3 6
(5)
% 17 83
(32)
1994 LPG
% 83 6
I 1 (23)
% 23 77
(30)
COHORT
1995 LP H
% 75 19 6
(1 8)
% 24 76
(28)
1996 LP J
% 69 21 I 0
(23)
% 29 71
(31
1998 LP K
% 72 27
1 (24
% 22 78
(32)
WORK I
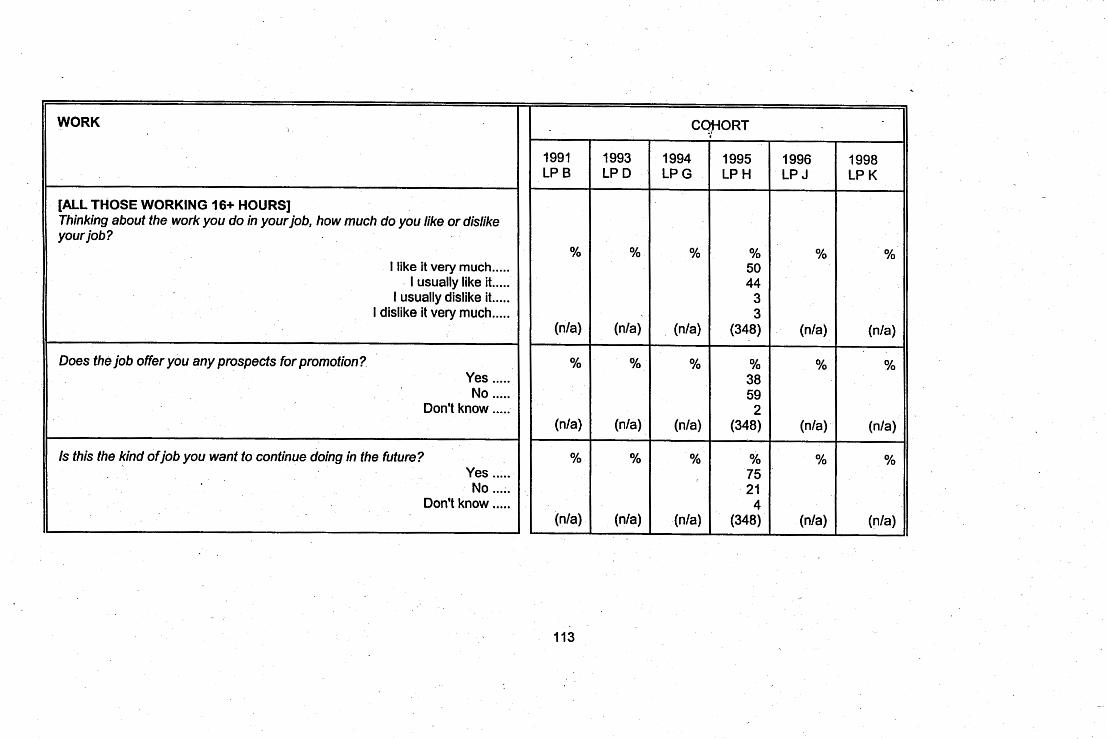
[ALL THOSE WORKING 16+ HOURS] Thinking about the work you do in yourjob, how much do you like or dislike your job?
I like it very much ..... - I usually like it .....
I usually dislike it ..... I dislike it very much .....
Does the job offer you any prospects for promotion? Yes ..... No .....
Don't know .....
Is this the kind ofjob you want to continue doing in the future? Yes ..... No .....
Don't know .....
CqttORT
1991 LP B
%
(nla)
%
(nla)
%
(nla)
1993 LP D
%
(nla)
%
(nla)
%
(nla)
1994 LPG
%
(nla)
%
(nla)
%
(nla)
6
1995 LP H
% 50 44
3 3
(348)
% 38 59 2
(348)
% 75 21 4
(348)
1996 LP J
%
(nla)
%
(n/a)
%
(nla)
1998 LP K
%
(nla)
Yo
(n/a)
%
(nla)


i
WORK
How easy or difficult do you think it will be for you to get that kind of job in the future?
Very easy ..... Quite easy .....
Quite difficult ..... Very difficult . . . . . Don't know .....
Do you think you will need any new education or training to be able to get that kind of work in the future?
Yes ..... No .....
[IF WILL NEED NEW TRAININGIEDUCATION] How easy or difficult do you think it will be for you to get the education or training you feel you will need in the future?
Very easy ..... Quite easy .....
Quite difficult ..... Very difficult ..... Don't know .....
I
1991 LP B
%
(nla)
%
(nla)
%
(nla)
1993 LP D
%
(nla)
%
(nla)
%
(nla)
COHORT
1994 LPG
%
(nla)
%
(nla)
%'
-
(nla)
1995 LP H
% 3
23 26 31 16
(96)
% 73 27
(95)
,
% 15 30 21 29 5
(71)
1996 LP J
%
@la)
%
.@/a)
%
- (nla)
1998 LP K
%
(n/a)
%
(nla)
%
(nfa)

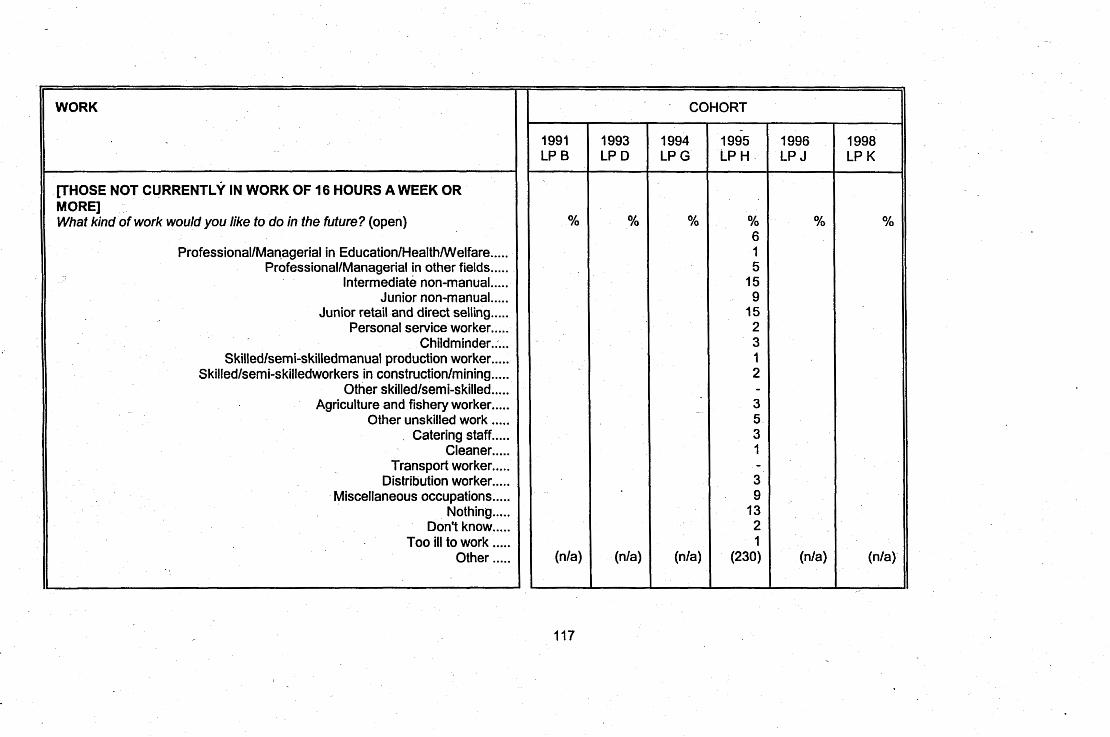
FHOSE NOT CURRENTLY IN WORK OF 16 HOURS A WEEK OR MORE] What kind of work would you like to do in the future? (open)
Professional/Man~agerial in EducationlHealthNVelfare..... ProfessionallManagerial in other fields.. . . .
Intermediate non-manual ..... Junior non-manual .....
Junior retail and direct selling ..... Personal service worker.. .. .
Childminder.; ... Skilledlsemi-skilledmanual production worker .....
Skilledlsemi-skilledworkers in constructionlmining ..... Other skilledlsemi-skilled .....
Agriculture and fishery worker ..... Other unskilled work .....
. Catering staff ..... Cleaner .....
Transport worker ..... Distribution worker .....
Miscellaneous occupations ..... Nothing .....
Don't know ..... Too ill to work .....
Other .....
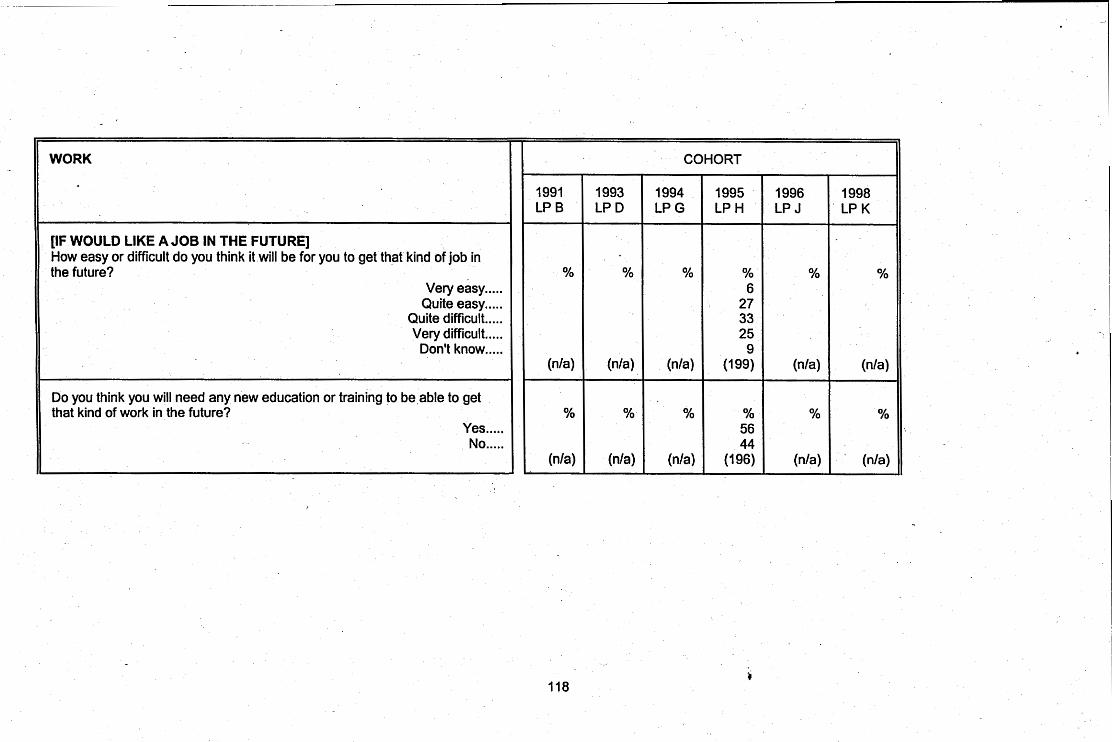
WORK
[IF WOULD LIKE A JOB IN THE FUTURE] How easy or difficult do you think it will be for you to get that kind of job in the future?
very easy.. .. . Quite easy .....
Quite difficult ..... Very difficult ..... Don't know .....
Do you think you will need any new education or training to be,able to get that kind of work in the future?
Yes ..... No .....
\
COHORT
1991 LPB
%
(nla)
%
(nla)
1993 LPD
%
(nla)
%
(nla)
1994 LPG
%
(nla)
%
(nla)
1995 LPH
% 6
27 33 25 9
(199)
% 56 44
(196)
1996 LPJ
%
(nla)
%
(nla)
1998 LP K
%
(nla)
%
' (nla)


.
L
WORK
What (else). do you think, might make if easier to get the kind of work you want to do in the future? (open) . --,
Previous experience ..... Qualifications .....
More skills ..... Childcare facilities .....
..... Financial help More time .....
To be fit and healthy ..... More jobs available .....
Be able to drive ..... Don't know .....
Nothing ..... ..... Other
COHORT
1991 LP B
(nla)
1993 LP D
(nla)
1994 LPG
(nla)
1995 LP H
11% 14% 5%
31% 12% 12% 4%
12% 3%
38% 18% 20% ( I l o )
1996 LP J
.
(n/a) - --
1998 LP K
. @la)
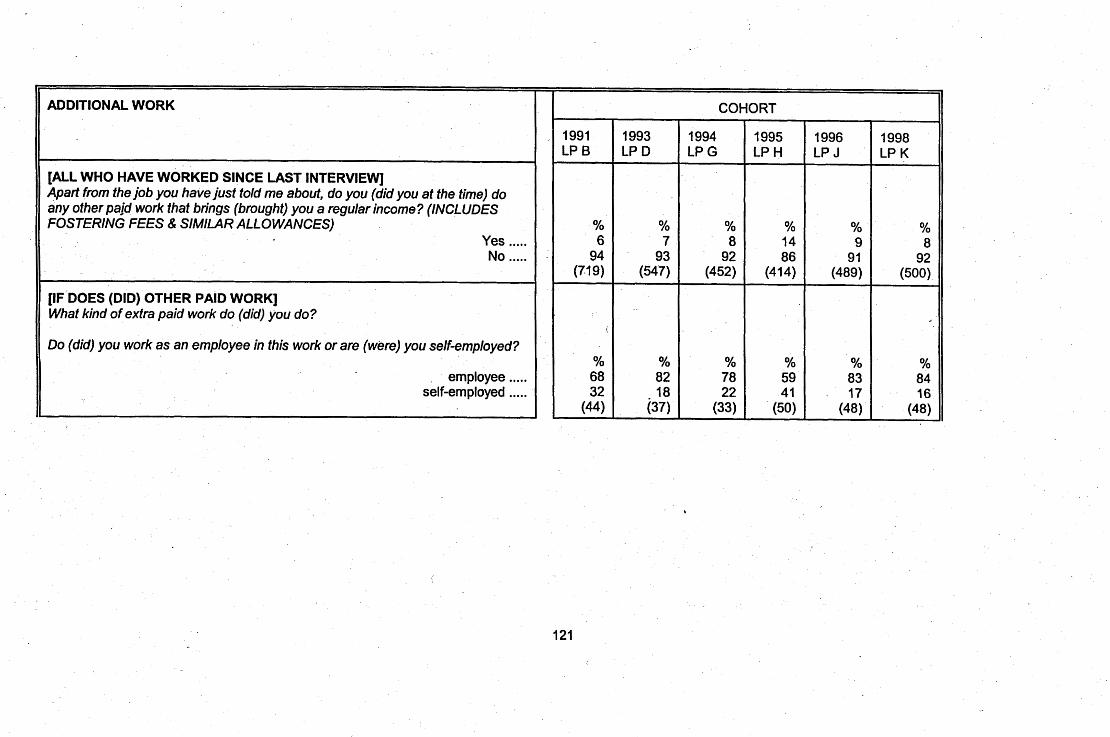
ADDITIONAL WORK
[ALL WHO HAVE WORKED SINCE LAST INTERVIEW] Apart from the job you have just told me about, do you (did you at the time) do any other pajd work that brings (brought) you a regular income? (INCLUDES FOSTERING FEES & SIMILAR ALLOWANCES)
Yes ..... No .....
[IF DOES (DID) OTHER PAID WORK] What kind of extra paid work do (did) you do?
Do (did) you work as an employee in this work or are (were) you self-employed?
employee ..... self-employed .....
.
COHORT
1991 LP 6
% 6
94 (719)
(
% 68 32
(44)
1993 LP D
% 7
93 (547)
% 82 18
(37)
1994 LP G
% 8
92 (452)
% 78 22
(33)
1995 LP H
% 14 86
(414)
% 59 41
(50)
1996 LP J
Yo 9
91 (489)
% 83
. 17 (48)
1998 LP K
% 8
92 (500)
% 84 16
(48)

ADDITIONAL WORK
How much do (did) you receive for this extra paid work, after taxes and any other deductions and what period of time does (did) that amount cover?
And how many hours each week do (did) you work for this extra money? mean .....
How often do (did) you do this extra paid work? f
every week ..... 3
L- every second week ..... every third week .....
every fourth week ..... less often than this .....
Other .....
WORK AND BENEFIT HISTORY [ALL WHO HAVE WORKED SINCE 1991lLAST INTERVIEWED] I'd like you to think now about the last few years or so. Have you had any (other) paid job since (last time we saw you?)
COHORT
1996 LPJ ,

I
ADDITIONAL WORK
[IF HAD (OTHER) JOB RECENTLY] How many (other) paid jobs or periods of employment have you had during this time?
b
MARK & JOBS (INCLUDING PRESENTILAST JOB) ON CALENDAR AND RECORD STOPISTART DATES.
CHECK CALENDAR. IDENTIFY GAPS OF ONE WEEK OR MORE WHEN NO PAID WORK WAS DONE AT ALL. MARK GAPS ON CALENDAR AND RECORD STOP AND START DATES.
Ask for each gap: What were you doing during this time between jobs?
- Unemployed and seeking work ..... Government Training Scheme .....
In fulltime education ..... sick or disabled .....
Looking after the home ..... 1
Other .....
[IF ANY UNEMPLOYED DURING ANY GAP] Can 1 just check, were you receiving Income Support at this time?
Were you signing on during this time?
\
1991 LP B
1993 LP D
1994 LP G
COHORT
1995 LPH
1996 LPJ
1998 LP K

- -
ADDITIONAL WORK
IF THERE WERE ANY PERIODS OF OVERLAP JOBS RECORD DETAILS OF ANY SECOND AND THIRD STRING JOBS.
IDENTIFY EACH JOB EXCEPT PRESENT (OR IF NOT IN PAID WORK NOW, MOST RECENT) JOB, THEN ASK THE FOLLOWING QUESTIONS FOR EACH PREVIO~JS JOB AND RECORD IN GRID: SKIP IF NO PREVIOUS JOB. ASK OF OVERLAP JOBS TOO
Were you working as an employee or were you self employed?
About how many hours a week did you usually work in this job?
And what was your usual take home pay in this job?
And what period of time did that pay cover? .
COHORT
1991 LP B
1993 LP D
1994 LP G
i
1995 LPH
1996 LPJ
1998 LP K
*

L
ADDITIONAL WORK
[ALL1 Lots of children do things like paper rounds, and lots of older children have jobs, so can I just check do any of your children have any kind of job, I mean paid work that brings him/her a regular wage or income.
[IF CHILD HAS JOB] RECORD PERSON NUMBER AND NAME OF EACH CHILD WORKING
What kind of paid work does (..name..) do?
About how much money does (..name..) receive per week for this work, atler any deductions for tax and National Insurance?
COHORT
1991 LP B
1993 LP D
(n/a)
(nla)
1994 LP G
I
(nla)
(nla)
1995 LPH
(nla)
(nla)
1996 LPJ
(nla)
(nla)
1998 LP K


*
DERIVED VARIABLES - CHILDCARE
[BASE: ALL CURRENTLY WORKING] Proportion currently using childcare while working
Term ... Holiday ...
Proportion who pay for childcare while working Term ...
Holiday ...
Weekly spending on childcare (f mean).. Term ...
Holiday ...
COHORT
1991 LP
% 44 44
(574)
% 48
(258) 43
(260)
f 25 (129) f28 (1 12)
1993 LP
% 47 48
(474)
% 33
(214) 28
(232)
f23 (78) f 37 -
(73)
1994 LP
% 46 43
(422)
% 27
(181) 26
(232)
f 25 (59) f 34 (59)
1995 LP
% 36 43
(386)
% 29
(127) - 23 (145)
£ 27 (42) £43 (45)
1996 LP J
% 37 43
(438)
% 30
(145) 28
(162)
f 24 (43) £31
' (45)
1998 LP K
% 35 38
(461)
% 21
(135) 21
(147)
f 27 (29) f 37 (30)
-

[ALL WHO ARE CURRENTLY WORKING OR WHO HAVE HAD A PAID JOB RECENTLY OR SINCE HAVING CHILDREN. ASK SEPARATELY FOR TERM TIME AND HOLIDAYS. IF ONLY HAS PRE-SCHOOL CHILDREN ASK ONLY ABOUT 'TERM-TIME']
When you are (were) working, what are (were) your usual arrangements for looking affer the children
Children are (were) cared for by ... in term time former partne? .....
(current) partner ..... C parentslin law ..... older brother or sister .....
( other relativeslfriends . .. .. Nurserylcreche .....
Nursery schoollplaygroup ..... Child minder .....
~ e ~ i s t e r e d child minder ..... Unregistered child minder .....
live in nannylAu Pair ..... other daily or shared nanny .....
After school or holiday playscheme .....
I only work during school hours ..... old enough to look after themselves .....
I take them to work with me ..... I work at home .....
1
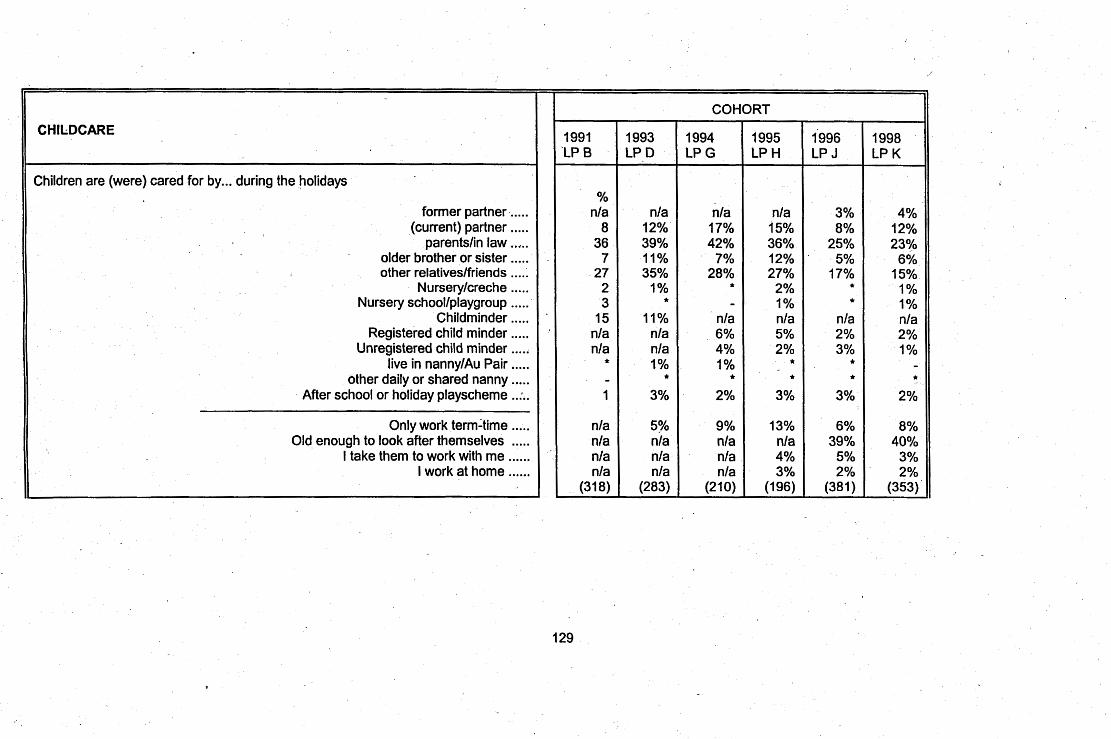
CHILDCARE
Children are (were) cared for by ... during the holidays
former partner ..... ..... (current) partner ..... parentslin law ..... older brother or sister ..... other relativeslfriends
Nurserylcreche ..... ..... Nursery schoollplaygroup
Childminder ..... Registered child minder .....
Unregistered child minder ..... ..... live in nanny1Au Pair
other daily or shared nanny ..... After school or holiday playscheme ..:..
..... Only work termltime Old enough to look after themselves .....
...... I take them to work with me
...... I work at home

[ALL THOSE WHO USE CHILD CARE (above the line)] Do (did) you usually have to pay for any of this childcare .... during term-time
Yes ..... No .....
Don't know .....
Do (did) you usually have to pay for any of this childcare ..:..during the holidays Yes ..... No .....
[IF PAY FOR CHILDCARE] How much do you pay in an average week? ' I' Term .....
Holidays .....
You usually pay(paid) ... (f's per week) for childcare. How much of this money goes(went) to pay the person or people who look(ed) after your child, and how much goes (went) to pay for other things like food, treats, fares and things like that?
[IF OTHER THINGS] What exactly does this (f's per week) pay for?
COHORT
1991 1 1993 1 1994 LP B LP D LPG
1995 1 1996 LPH LPJ

COHORT
[ALL USING CHILDCARE] Can (could) you rely on these arrangements ... term
every day ..... nearly every day .....
on most days, but sometimes not ..... only on some days, often not .....
Don't know .....
I Can (could) you rely on these arrangements ... holiday every day .....
nearly every day ..... on most days, but sometimes not .....
only on some days, often not .....
1991 1993 1994 LP B LP D LPG
% % % 87 90 87 6 5 9 6 4 3 1 I I - - -
(362) (263) (194)
1 How long has (did this last) arrangement gone (go) on for? (term and holiday).
Since you have been doing (during the time you did) this job, how offen have you (did you) changed your childcare arrangements? ... term
Not at all ..... once ..... twice .....
three times ..... ~ four times .....
five + times .....
I Don't know .....

CHILDCARE
Since you have been doing (during the time you did) this j o i how otten have you (did you) changed your childcare arrangements? ... holiday
Not at all ..... t
once ..... twice .....
three times ..... four times .....
five + times ..... Don't know . . . . .
If your arrangements break (broke) down at short notice, say when .... (minder) .... was ill, do(did) you have an alternative you know (knew) would be able to have the child(ren) at short notice?
Term Yes ..... No .....
Don't know .....
Holiday Yes ..... No ..... . 35 28 26 21 24
(343) (276) (198) (165) (188) (170)
.
1991 LP B
% 80 5 5 3 1 6 -
(351) -
% 64 36
- ' (365)
% 65
1993 LP D
% 80 8 4 2 2 3 -
(274)
% 73 27
- (262)
% 72
COHORT
1994 LPG
% 83 8 3 3
2 1 1
(202)
% 75
a 25 - (193)
% 74
-
1995 LP H
% 84 9 2 2 1 1 -
(163)
% 82 18 -
145)
% 79
1996 LP J
% 87 7 2 1 1 2 1
(189)
% 77 23
- (172)
% 76
1998 LP K
Yo 84 8 3 1 1 3 -
(171)
% 80 20 -
(160)
940

[IF HAS ALTERNATIVE ARRANGEMENTS] Who then would look after the child(ren)?
. Children would be cared for by .... term former partner .....
(current) partner ... .. parentslin law .....
older brother or sister. ..... other relativeslfriends .....
Nurserylcreche ..... Nursery schoollplaygroup .....
Childminder ..... Registered child minder .....
Unregistered child minder ..... I
I live in nannylAu Pair ..... other daily or shared nanny .....
Afler school or holiday playscheme ..... I would only work during school hours .....
I would take I them to work with me ..... I would work at home .....
Don't know ..... I \.
I --
COHORT
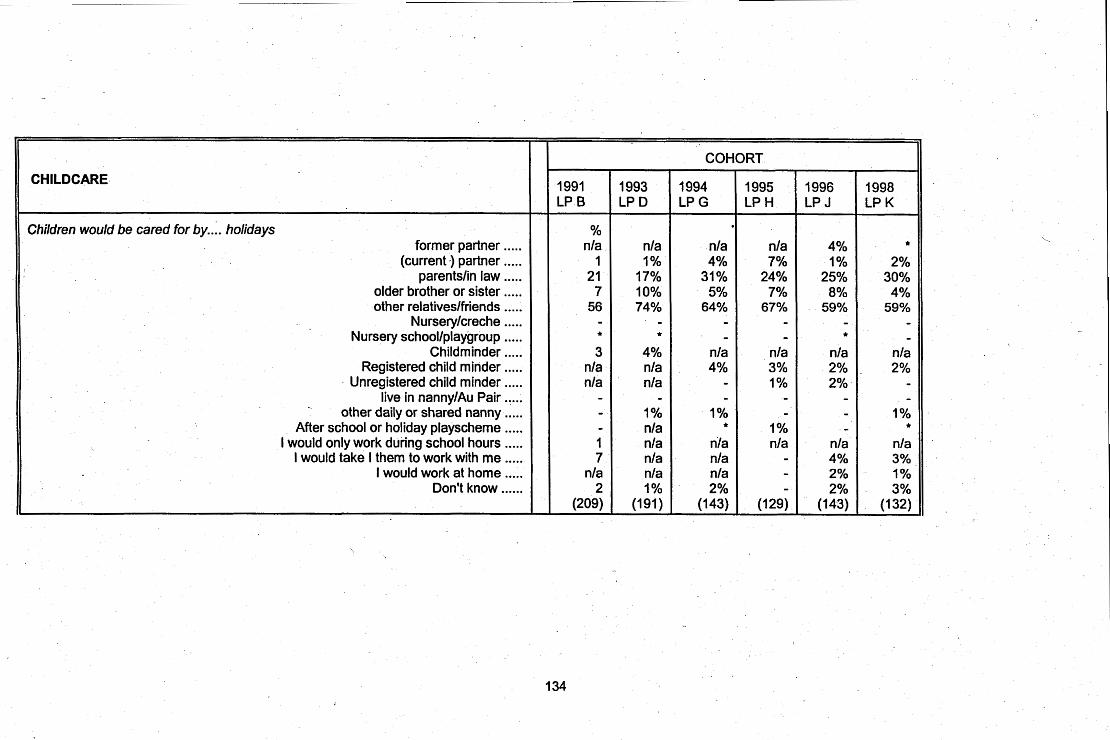
COHORT
CHILDCARE 1991 1993 1994 1995 1996 1998 LP B LP D LPG LP H LP J LP K
Children would be cared for by.. . . holidays % q
former partner ..... nla nla nla nla 4% (current a) partner .....
1 1 1% 4% 7% 1% 2% parentslin law ..... 21 17% 31% 24% 25% 30%
older brother or sister ..... 7 10% 5% 7% 8% 4% other relativeslfriends ..... 56 74% 64% 67% 59% 59%
Nurserylcreche ..... - - - - - - Nursery schoollplaygroup ..... * - - * -
Childminder ..... 3 4% nla nla nla nla Registered child minder ..... nla nla 4% 3% 2% . 2%
Unregistered child minder ..... nla nla - 1% 2% - live in nannylAu Pair ..... - - - - - -
other daily or shared nanny ..... - 1% 1% - - 1% After school or holiday playscheme ..... - nla 1% -
I would only work during school hours ..... 1 nla nla nla nla nla I would take I them to work with me ..... 7 nla nla - 4% 3%
I would work at home ..... nla nla nla - 2% 1% Don't know ...... 2 1% 2% - 2% 3%
(209) (191) (143) (129) (143) (132)
\
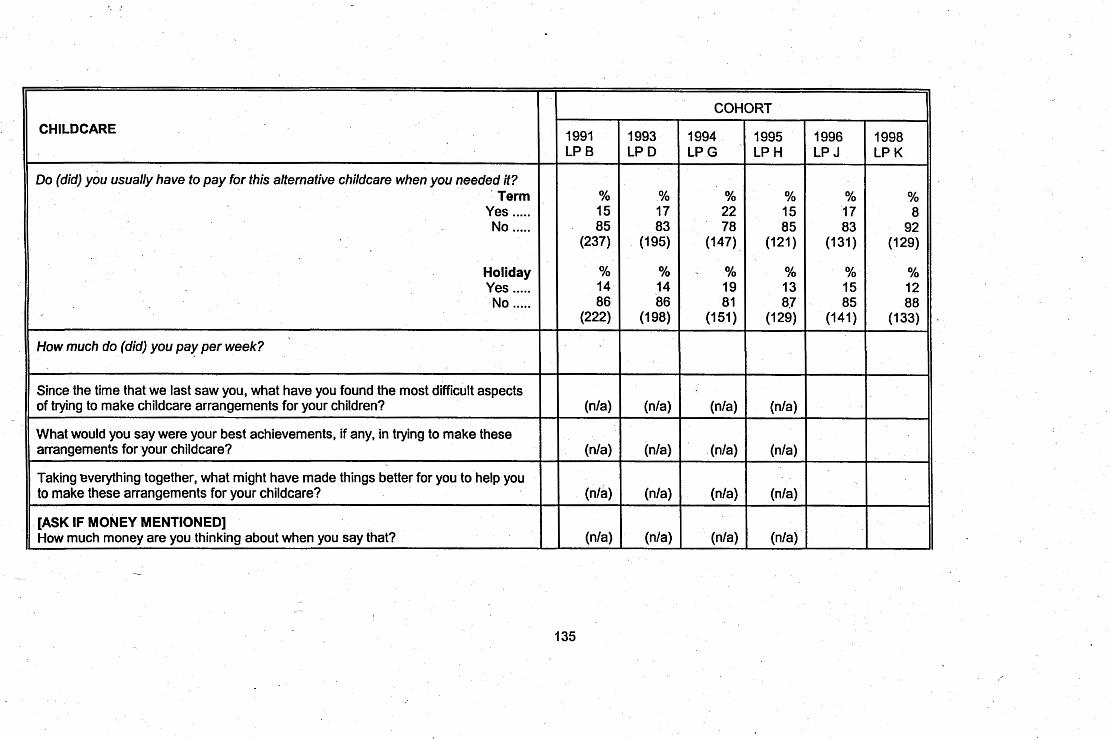
I
-
1
135
I
CHILDCARE
Do (did) you usually have to pay for this alternative childcare when you needed it? Term
Yes ..... No .....
Holiday Yes ..... No .....
How much do (did) you pay per week?
Since the time that we last saw you, what have you found the most difficult aspects of trying to make childcare arrangements for your children?
What would you say were your best achievements, if any, in trying to make these arrangements for your childcare?
Taking everything together, what might have made things better for you to help you to make these arrangements for your childcare?
[ASK IF MONEY MENTIONED] How much money are you thinking about when you say that?
1991 LP B
% 15 85
(237)
% 14 86
(222)
(nla)
(nla)
(nla)
(nla)
1993 LP D
% 17 83
(195)
14 86
(198)
(nla)
(nla)
(nla)
(nla)
COHORT
1994 LPG
% 22 78
(147)
% % 19 81
(1 51)
(nla)
(nla)
(nla)
(nla)
1995 LPH
% 15 85
(121)
% 13 8.7
(129)
(nla)
(nla)
(nla)
(nla)
1996 LPJ
% 17 83
(131)
% 15 85
(141)
1998 LP K
% 8
92 (129)
% 12 88
(133)


FUTURE CHILDCARE
[IF NOT CURRENTLY WORKING 16+ HOURS BUT WILL LOOK FOR (MORE) WORK ONE DAY] If you were to take up working (16 or more hours a week) (again) what would be your usual arrangements for looking affer the children? *
I Children would be cared for by .... partner .....
parentstin law ..... older brother or sister ..... other relativestfriends .....
Nurserytcreche ..... Nursery schooltplaygroup .....
Childminder ..... Registered child minder .....
Unregistered child minder ..... live in nannylAu Pair .....
- other daily or shared nanny ..... After school or holiday playscheme ....
I would only work during school hours ..... I would take them to work .....
I would work at home ..... Old enough to look after themselves .....
Don't know .....
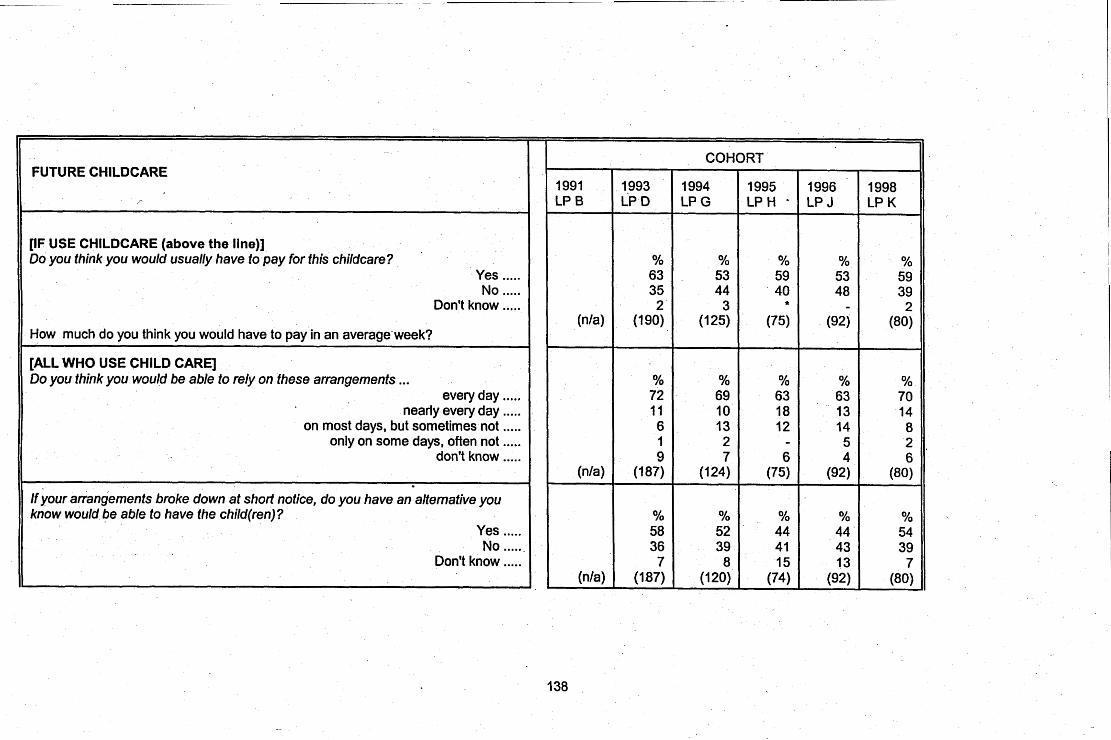
FUTURE CHILDCARE
,-
[IF USE CHILDCARE (above the line)] Do you think you would usually have to pay for this childcare?
Yes ..... No .....
Don't know ..... How much do you think you would have to pay in an average-week?
[ALL WHO USE CHILD CARE] Do you think you would be able to rely on these arrangements ...
every day ..... nearly every day .....
on most days, but sometimes not ..... only on some days, often not .....
don't know .... .
If your arrangements broke down at short notice, do you have an alternative you know would be able to have the child(ren)?
Yes ..... No ....a-
Don't know .....
I
,
1991 LP B
(nla)
(nla)
(nla)
1993 + D
% 63 35 2
(190)
% 72 11 6 1 9
(187)
% 58 36 7
(187)
COHORT
1994 LPG
Yo 53 44
3 (125)
% 69 I 0 13 2 7
(124)
yo 52 39 8
(120)
1995 L P H -
Yo 59 40
*
(75)
% 63 18 12
- 6
(75)
% 44 41 15
(74)
1996 LPJ
Yo 53 48
(92)
% 63 13 14 5 4
(92)
% 44 -
43 13
(92)
1998 LPK
% 59 39 2
(80)
% 70 14 8
6 2 ,
(80)
yo 54 39 7
(80)

FUTURE CHILDCARE
[IF HAS ALTERNATIVE ARRANGEMENTS] Who would then look afier the children?
Children would be cared for by .... partner . .. . .
parentslin law ..... older brother or sister ..... other relativeslfriends .....
Nurserylcreche ..... Nursery schoollplaygroup .. ...
Childminder ..... Registered child minder .....
Unregistered child minder ..... live in nannylAu Pair .....
other daily or shared nanny ..... After school or holiday playscheme .....
I would only work during school hours ..... I would take them to work .....
' I would work at home ..... - Old enough to look after themselves .....
Don't know .....
1' I
1991 LP B
i
(nla)
1993 - LP D
3% 19% nla
77% - -
3% nla nla -
- 2% 1% nla nla -
- (108)
COHORT
1994 LPG
12% 32% 11% 52% -
- nla 4% -
- - -
4% 4% nla - 2%
(66)
1995 LPH
9% 19% 1%
71% 4%
- nla
- 2% 2%
- - - -
n .la - -
(36)
1996 LPJ
4y0, 24% 7%
65% - -
nla 3% 3%
- - -
3% - - -
(41)
1998 LP K
3% 16% 7%
79% - -
nla -
3% - - -
3% - - - -
(42)

DERIVED VARIABLES - SAVINGS COHORT
1991 1993 1994 1995 - 1996 1998 i LP B LP D LP G LP H LPJ LPK
Total Savings (f) mean...... 1037 1024 21 54 2308 2814 3125
(268) (252) (244) (230) (254) (296) Proportion with savings (giving an amount) 28% 28% 31% 35% 33% 38%


SAVINGS
[IF HAS INVESTMENTS] How much money, do you think, are these ..... worth at the present time?
mean .....
tNL1 Has the total amount you have saved or invested changed during the past six months. Has it decreased, has it increased, or has the total amount not changed?
Decreased ..... Increased .....
Stayed more or less the same .....
COI
[IF SAVINGSIINVESTMENTS HAVE CHANGED] About how much money would you say you had saved or invested six months ago?
. -
[ N L I Some families have savings, trust funds or investments held in the children's names. Does your family have any savings, trust funds or other investments which are in your child(rens)'s name(s) or held on their behalf?
Yes ...... No ......
(36) (36)
% % %
(nla) (nla)
(nla)
% % % -
(nla) (n/a)

- - -
BENEFITS
w-I ' Which, if any, of fhese benefits other than child bendfit are you (or your parfner) receiving at the moment?
For each beneM received, how much do you receive ech week?
Who is it that receives this benefit?
And are there any benet%s listed on this card that you have applied for and are still waiting to hear about? Which ones
Income Support
Job Seeker's Allowance
I One Parent Benefit
% Receiving ... :. Amount per week .....
Applied for .....
% Receiving ..... Amount per week .....
Applied for .....
Receiving ..... Amount per week .....
Applied for .....

BENEFITS COHORT
1991 1993 1994 1995 1996 1998 LP B LP D LP G LP H LP J LP K
Council tax benefit Receiving . . . . . 42% 49% 38% 47% 42%
£42 35%
Amount received per week ..... £ 33 £ 53 £13 £17 f 14 or Net council tax paid each week ..... nla nla nla f 7 £1 £2
Applied for ..... 4% 3% 2% 2% 2% (941
1%
Family Credit (804) (686) (595) (673) (672)
Receiving . . . . . 10% 15% 14% 16% 17% 15% Amount per week ..... £ 35 £48 f 50 £53 £61 £60
Applied for ..... *% 1% 1% 1% ?
Maternity Allowance (941 ) (804) (686) (595) (673) (672)
Receiving ..... - - - - * - Amount per week ..... - - - - - -
Applied for ..... - - - t - - Statutory Maternity pay
(941 (804) (686) (592) (673) (672)
Receiving ..... - * * * - - Amount per week ..... - £45 - f 52 f 55 -
Applied for ..... - - - - - - Widows Benefit
(941 (804) (804) (595) (673) (672)
Receiving ..... 3% 3% 3% 3% 4% 2% Amount per week ..... £71 £74 - £72 £70 £74
Applied for ..... - - - (94 1 (804) (686) (595) (673) (672)


INCOME SUPPORT
[ALL ON INCOME SUPPORT NOW] When did you start this present spell on lncome Support? (INCLUDE TIME ON SUPPLEMENTARY BENEFIT)
Can I just check, are the DSS collecting any maintenance from a former partner for you or your children and including it with your income support?
Yes ..... No .....
Don't know ..... 5
[IF DSS ARE COLLECTING MAINTENANCE] Is this maintenance collected following a court order or CSA assessment?
/ )
Court Order ..... CSA assessment .....
- Other .....
And so how much of how much you receive each week is lncome Support and how much is maintenance?
lncome Support ..... Maintenance .....

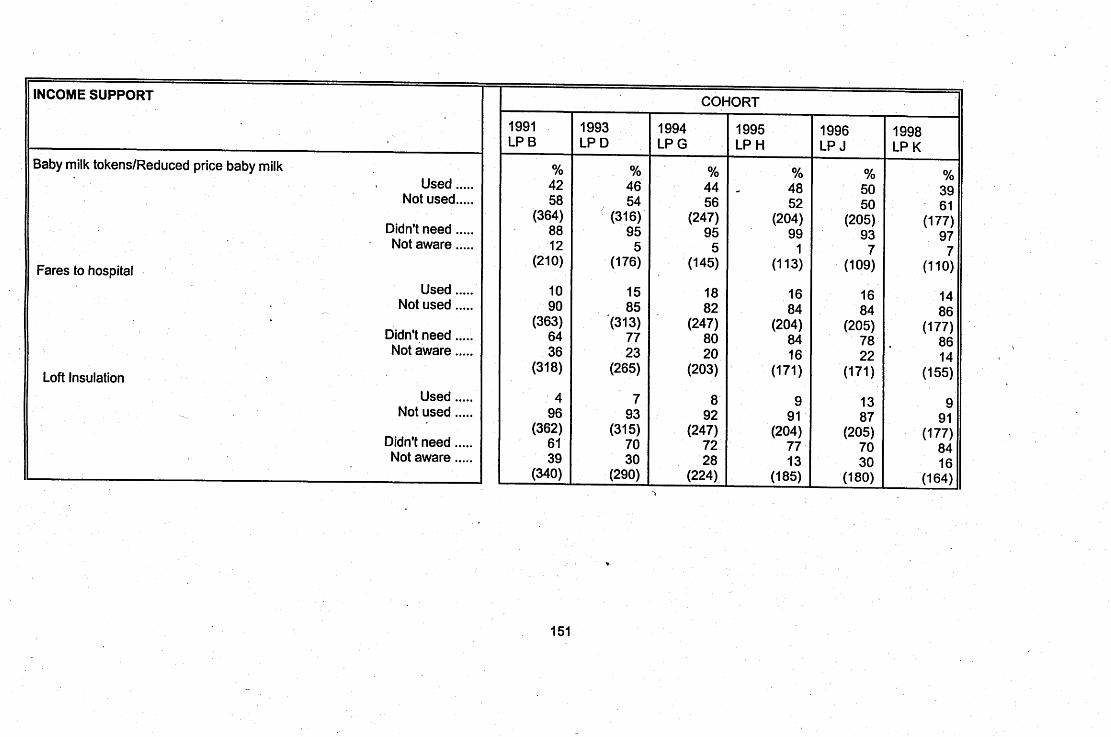
INCOME SUPPORT
Baby milk tokenslReduced price baby milk Used .....
Not used .....
Didn't need ..... Not aware .....
Fares to hospital .
Used ..... Not used .....
Didn't need ..... Not aware .....
Loft Insulation Used .....
Not used ..... Didn't need ..... Not aware .....
1991 LP B
% 42 58
(364) 88 12
(210)
10 90
(363) 64 36
(31 8)
4 96
(362) 61 39
(340)
1993 LP D
% 46 54
(316) 95 5
(1 76)
15 85
'(31 3) 77 23
(265)
7 93
(31 5) 70 30
(290)
COHORT
1994 LP G
% 44 56
(247 95 5
(145)
18 . 82
(247) 80 20
(203)
8 92
(247 72 28
(224)
1995 LP H
% d 48
52 (204)
99 1
(1 1 3)
16 84
(204) 84 16
(171)
9 91
(204) 77 13
(1 85)
1996 LP J
% 50 50
' (205)
93 7
(1 09)
16 84
(205) 78 22
(1 71
13 87
(205) 70 30
(1 80)
1998 LP K
% 39 61
(1 77) 97 7
(110)
14 86
(1 77) . 86
14 (1 55)
9 91
(1 77) 84 16
(1 64)


INCOME SUPPORT
During the past 18 months, have you applied to the DSS for a grant of money (not a loan) to pay for something you needed?
Yes ..... No .....
[IF APPLIED FOR GRANT] What was this for? (multi-response)
Bed ..... Other furniture .....
Cooker ..... Fridge .....
Washing machine ..... Other appliance .....
Other ..... Clothes .....
Baby Equipment ..... Bed linen .....
Carpetlcurtains ..... Decorating .....
Moving costs .....
,
1991 LP B
% 25 75
(362)
r
1993 LP D
% 20
. 80 (319)
34% 19% 22% 10% 14% 6%
57% nla nla nla nla nla nla
1994 LP G
% 21 79
(248
26% 13% 14% 6%
15% 2%
11% 14%
/ 4% 6% nla nla nla
COHORT
1995 LP H
% 14 86
(205)
30% 5%
12% 1% 4% 9% 1%
16% 6%'
12% 17% 8% 9%
1996 LP J
% 13 87
(206)
' 17% 18% 34% 12% 6%
- 14% - 6% 6%
- - -
1998 LP K
% 14 86
(1 78)
53% 6% 6%
12% 11% 6% - 6% 6%
17% 23%
- -

INCOME SUPPORT
Was your request granted? Yes ..... No .....
Don't know .....
[ALL ON INCOME SUPPORT] During the past 18 months. 'have you applied to the DSS for a loan (not a grant) to pay for something you needed?
Yes ..... No .....
[IF APPLIED FOR LOAN] What was this for? (multi-response)
Bed ..... Other furniture .....
Cooker ..... Fridge .....
Washing machine ..... Other appliance .....
Other .....' Clothes .....
Baby equipment ..... Bed linen .....
Carpetslcurtains ..... Decorating .....
154
1991 LP B
YO 57 43 -
(89)
%
(nla)
I
(nla)
1993 LP D
% 16
' 84 -
(66)
% 37 63
, (316)
41% 22% 16% 9%
1 4Y0 6%
43% nla nla nla nla nla
(1 15)
COI
1994 LP G
% 46 54 -
- (52)
YO 34 66
(248)
46% 21% 30% 7%
19% -_ -
8% 12% 1% 8% nla nla
(87)

11 INCOME SUPPORT
Was your request granted? Yes .....
[ALL ON INCOME SUPPORT] Are any deductions made from your weekly benetit payments for things like social fund loans, electric bills, and things like that?
Yes .....
[IF DEDUCTIONS FROM BENEFITS] ,What are these deductions for? (multi-response)
I
L Electric bills ..... Gas bills .....
Social fund loans ..... Overpayments .....
Community ChargelCouncil tax arrears ..... Other .....
How much is deducted each week from your social security payments?
COHORT
9% 25% 61 % 3% nla 39% (73)

I INCOME SUPPORT
w - I Can 1 just check, have you ever received Income Support, since becoming a parent?
Yes .....
And have you ever received Family Credit? Yes ..... No .....
[IF EVER RECEIVED BOTH IS AND FC] Taking everything into consideration what do you think was best for you and your family: living on Income Support, or working and getting Family Credit?
Income Support ..... Family Credit .....
Can't say .....
1991 LPB
- -
1993 1 LPD
COHORT
1994 LP G
% 81 19
(686)
% ' 32
68 (684)
% 22 70 8
(253)
1995 LP H
% 81 19
(594)
% 36 64
' (592)
% 20 72 8
(233)
1996 LP J
% 82 18
(673)
, % 42 58
(673)
% 21 74 5
(289)
1998 LP K
Yo 80 20
(669)
% 47 52
(666)
Oh
19 72 8
(308)

I
DERIVED VARIABLES . RELATIVE MATERIAL HARDSHIP
Number of food items unable to afford 0 ..... 1 ..... 2 ..... 3 ..... 4 ..... 5 ..... 6 .....
..... Mean
Number of clothing/social participation items unable to afford 0 ..... 1 ..... 2 .....
..... 3 4 ..... 5 ..... 6 .....
..... 7
..... 8 / 9 .....
..... Mean 1
1991 LP B
% 61 15 10 6 5 2 0
0.86 (941)
% 37 13 11 11
. 8 7 5 4 3 1
2.21 (941)
1993 LP D
% 58 15
, 12 8 6 2 I
0.98 (804)
% 33 11 13 12 11 I 0 5 4 1 I
2.34' (804)
COHORT
1994 LP G
% 62
. 14 I 1 6 4 2 1
0.84 (686)
% 37 15 12 11 8 8 4 3 1 1
2.07 (686)
1995 LP H
. % 67 12 12 5 2 1 1
0.73 (595)
% 41 15 12 9 9 6 4 3 2 1
I . 92 (595)
1996 LP H
% 71 12 8 4 3 I I
0.63 (673)
% 45 13 11 I 1 6 6 3 3 1 *
1.73 (673)
1998 LP K
% 78 9 5 4 2 1 1 '
0.51 (672)
% 54 12 10 11 6 3 2 1 1
( I . 30) (672)

DERIVED VARIABLES - RELATIVE MATERIAL HARDSHIP
umber of consumer durables unable to afford 0 ..... 1 ..... 2 ..... 3 ..... 4 ..... 5 ..... 6 ..... 7 ..... 8 ..... 9 .....
10 ..... -1 1 .....
Mean .....
Mean number of problem debts Proportion with any problem debts (%)
Mean amount of debt (f)
, 1991 LP B
% 21 15 18 14 11 8 6 5 3 1 0 0
2.73 (941)
0.75 41%
477.70 (334)
1993 LP D
% 23 13 12 13 14 9 6 7 3 0 0 0
2.85 (804)
0.79 41%
401 .OO (432)
COHORT
1994 LP G
% 27 20 18 13 8 6 3 3 I 1 0 0
2.10 (686)
0.71 40%
31 6.60 (308)
1995 LP H
% 33 23 19 12 6
- 4 2 2 0 0 0 0
1.69 (595)
0.73 36%
449.1 0 (226)
1996 LP H
% 39 23 15 12 4 4 1 1 1 0 0 0
1.46 (673)
0.66 38%
587.40 (244)
1998 LP K
% 47 24 14 - . 8 4 1 1
0 0 0
1.09 (672)
0.54 30%
342.20 (194)
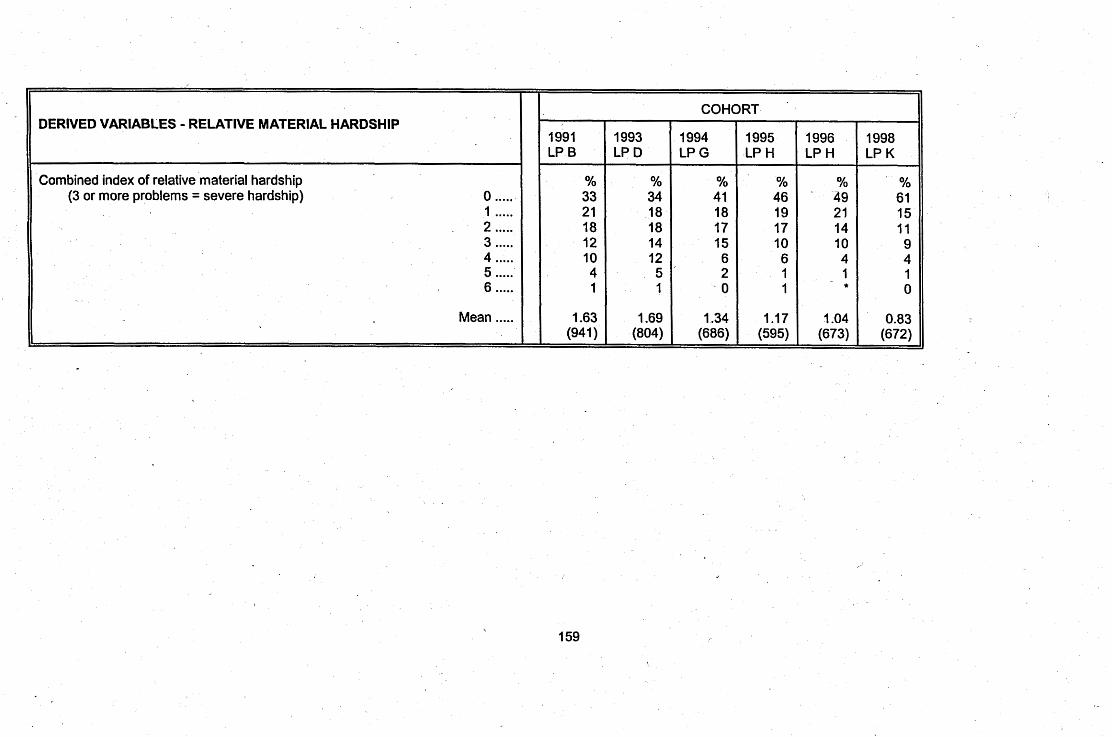
DERIVED VARIABLES . RELATIVE MATERIAL HARDSHIP
Combined index of relative material hardship (3 or more problems = severe hardship) 0 .....
1 ..... . 2 .....
..... 3
..... 4 5 ..... 6 .....
..... Mean
COHORT
1991 LP B
% 33 21 18 12 10 4 1
1.63 (941)
1993 LP D
% 34 18 18 14 12 5 ' 1
1.69 (804)
1994 LP G
% 41 18 17 15 6 2 0
1.34 (686)
1995 LP H
% 46 19 17 10 6 1 1
1 . 17 (595)
1996 LP H
% 49 21 14 10 4 1
1.04 (673)
1998 LP K
% 61 15 11 9 4 1 0
0.83 (672)

FAMILY WELFARE
[ALL1 Please look at this list and tell me which you and your family has, and which you do not have? For each item you do you not have is it because you don't want it or because you cannot afford it at the moment?
1 .A cooked main meal every day YO % % % % Oh
Has ..... 90 90 91 89 91 91 Does not want ..... 6 5 4 7 6 6 Cannot afford ..... 4 5 5 4 3 3
(934) (804) (685) (575) (673) (672) - 2.Meat or fish every other day % % . % % % %
Has ..... 73 73 70 72 74 75 Does not want ..... 10 8 9 12 13 , 14 Cannot afford ..... 16 18 21 16 13 1 I
(934) (802) (682) (595) (673) (672)
3.A roast meat joint (or something similar) once a week % % % % % % Has ..... 64 71 71 71 76 77
Does not want ..... 15 9 11 I I 12 14 Cannot afford ..... 21 20 18 19 12 9
(934) (801) (685) (595) (673) (672)
COHORT
1991 LP B
1993 , LP D
1994 LP G
1995 LP H
1996 LP J
1996 LP K
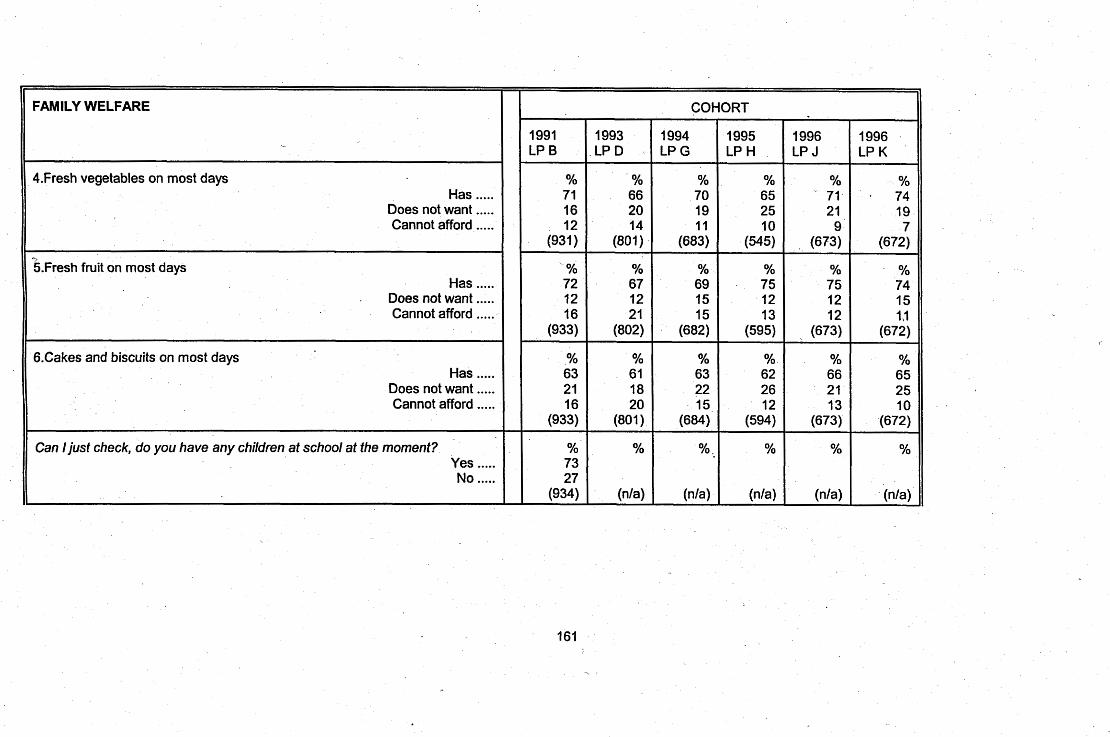
FAMILY WELFARE
-
4.Fresh vegetables on most days Has .....
Does not want ..... Cannot afford .....
k ~ r e s h fruit on most days Has .....
. Does not want ..... Cannot afford .....
6.Cakes and biscuits on most days Has .....
Does not want ..... Cannot afford .....
Can I just check, do you have any children at school at the moment? Yes ..... No .....
161
\
1991 LPB
% 71 16 12
(931)
% 72 12 16
(933)
% 63 21 16
(933)
% 73 27
(934)
1993 .LPD \
% 66 20 14
(801)
% 67 12 21
(802)
% 61 18 20
(801)
%
(nla)
1994 LPG
% 70 19 11
(683)
% 69 15 15
(682)
% 63 22 15
(684)
%.
(nla)
COHORT
1995 LP H
% 65 25 10
(545)
% 75 12 13
(595)
% 62 26 12
(594)
%
(nla)
1996 LP J
% ' 7 1
21 9
(673)
% 75 12 12
, (673)
% 66 21 13
(673)
%
(nla)
1996 LP K
% * 74
19 7
(672)
% 74 15 1,1
(672)
% 65 25 10
(672)
%
(n/a)


FAMILY WELFARE
[ALL1 Please look at this list and tell me which you and your family has,and which you do not have? For each item you do you not have is it because you don't want it or because you cannot afford it at the moment?
1. A weatherproof coat for each adult. Has .....
Does not want ..... Cannot afford .....
2. A weatherproof coat for each child. Has .....
Does not want ..... Cannot afford .....
3. Two pairs of all-weather shoes for each adult Has .....
Does not want ..... Cannot afford .....
4. Two pairs of all-weather shoes for each child has .....
Does not want ..... Cannot afford .....
1991 LP B
% 70 5
25 (930)
Yo 82 2
16 (932)
% 63 3
34 (935)
% 65 7
28 . (933)
'1993 LP D
% 77
1 22
(803)
% 91 1 8
(793)
% 65 3
32 (800)
% 66 4
30 (789)
1994 LP G
% 81 2
17 (682)
% 88 2
10 (656)
% 67
1 32
(684)
% 71 3
26 (655)
COHORT
1995 LP H
% 80 3
17 (595)
% 88 3 9
(539)
% 71 3
26 (594)
% 71 3
26 (539)
1996 LP J
. % 83 2
15 (673)
% 93
1 6
(586)
% 69 3
28 (673)
% 72 3
25 (585)
1996 LP K
Yo 88 4 8
(672)
% 95 2 3
(541)
% 79 2
19 (672)
% 78 3
19 (543)

.
,
FAMILY WELFARE
5. New, not second hand clothes when you all need them. Has .....
Does not want ..... Cannot afford .....
6. A best outfit for the children. Has .....
Does not want ..... Cannot afford .....
7. A celebration with presents for friends and family at special occasions like birthdays.
Has ..... Does not want ..... Cannot afford ..... ,
8. Toys and sports gear for the children. Has .,...
Does not want ..... Cannot afford .....
/
1991 LP B
% 64
1 35
(934)
YO 68 14 18
(926)
% 77 3
20 (934)
% 82 2
16 (931)
1993 LP D
% 60 2
39 (803)
% 67 12 21
(788)
% 72 2
26 (804)
% 86 2
11 (793)
1994 L P G .
% 60 2
38 (684)
YO 64 16 20
(641)
% 77 3
20 (685)
YO 83 4
13 (643)
COHORT
1995 LPH - - '
% 61 3
35 (595)
% 63 15 22
(519)
% 80 3
17 (595)
% 82 4
14 (526)
1996 LPJ
% 66 2
32 (673)
YO 68 15 16
(580)
% 83
1 16
(673)
% 83 5
12 (573)
1996 LP K
% 71 2
26 (672)
YO 71 15 14
(51 1 )
YO 85 2
13 (672)
% 88 4 8
(505)

r
FAMILY WELFARE
9. Money for trips, holidays or outings, or going with gifts to parties. Has .....
I Does not want ..... Cannot afford .....
Please look at this list and tell me which you and your family have the use of. and which you do not have? DO NOT INCLUDE IF BROKEN. MUST BE IN RESPONDENT'S OWN HOME. For each item do you not have is it because you don't want it or because you cannot afford it at the moment?
1. A colour T.V. set Has .....
Does not want ..... Cannot afford .....
i
2. A refrigerator (INC FRIDGE FREEZER) - - Has .....
Does not want ..... Cannot afford .....
3. A separate deep freeze Has .....
Does not want ..... Cannot afford .... :
1991 LP B
% 66 2
31 (934)
% 92
* ,
8 (934)
% 98
2 (934)
% 34 39 27
(922)
1993 LP D
% 54
46 (798)
% 96 - 4
(800)
% 98
*
2 ' (801)
% 33 38 30
(792)
1994 LP G
% 64
- 1 36
(684)
96 - 4
(684)
% 99 -
1 (684)
Yo 38 40 22
(678)
COHORT
1995 LP H
% 67 2
32 (595)
% . % 97
*
3 (593)
% 100 -
*
(592)
% 39 44 17
(591)
1996 LP J
5x0 68
2 30
(673)
% 98
*
2 (673)
% 100
*
(673)
Yo 40 44 15
(665)
1996 LP K
Yo -70
1 29
(672)
Yo 99 -
1 (671)
% 99 -
'
1 (671
% 45 42 13
(659)

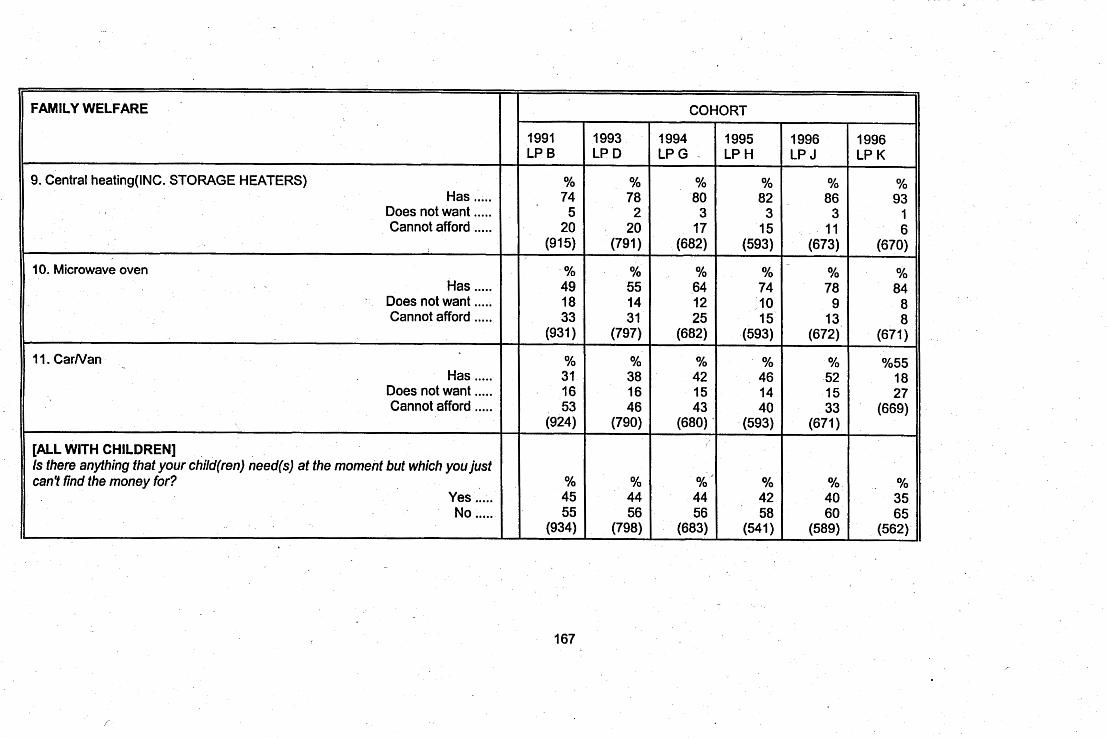
FAMILY WELFARE
9. Central heating(lNC. STORAGE HEATERS) Has .....
Does not want ..... Cannot afford .....
10. Microwave oven . . Has .....
Does not want ..... Cannot afford .....
1 1. CarNan Has .....
Does not want ..... Cannot afford .....
[ALL WITH CHILDREN] Is there anything that your child(ren) need(s) at the moment but which you just can't find the money for?
Yes ..... No .....
167
,
,
1991 LP B
% 74 5
20 (915)
% 49 18 33
(931)
% 31 16 53
(924)
% 45 55
(934)
1993 LP D
% 78 2
20 (791)
% 55 14 31
(797)
% 38 16 46
(790)
% 44 56
(798)
1994 LPG -
% 80 3
17 (682)
% 64 12 25
(682)
% 42 15 43
(680)' I
% I
44 56
(683)
COHORT
1995 LP H
% 82 3
15 (593)
% 74 , lo 15
(593)
% 46 14 40
(593)
Yo 42 58
(541)
1996 LP J
% 86 3
11 (673)
% 78 9
13 (672)
% 52 15 33
(671)
% 40 60
(589)
1996 LP K
% 93
1 6
(670)
% 84 8 8
(671)
%55 18 27
(669)
yo 35 65
(562)
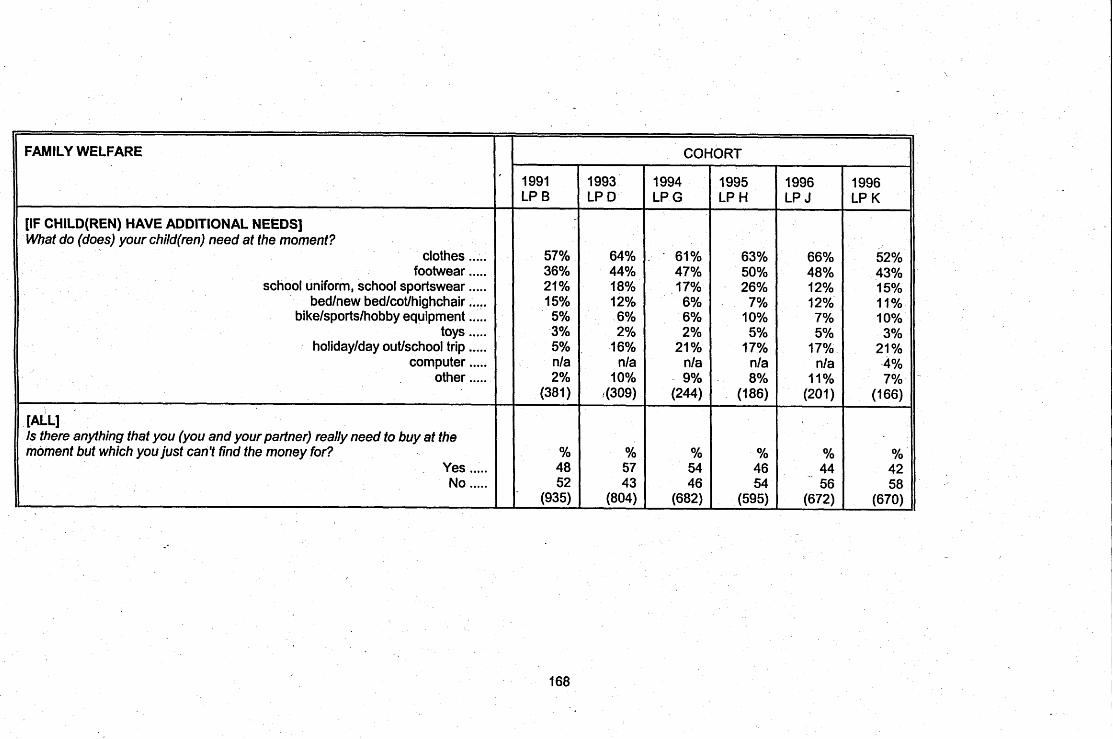
-
FAMILY WELFARE
[IF CHILD(REN) HAVE ADDITIONAL NEEDS] What do (does) your child(ren) need at the moment?
clothes ..... footwear .....
school uniform, school sportswear ..... bedlnew bedlcotlhighchair .....
bikelsportslhobby equipment ..... toys .....
holidaylday outlschool trip ..... computer .....
other .....
~LLI '
Is there anything that you (you and your partner) really need to buy at the moment but which you just can't find the money for?
. Yes ..... No .....
'
COHORT
1991 LP B
57% 36% 21% 15% 5% 3% 5% nla 2%
(381)
% 48 52
(935)
1993 LP D
64% 44% 18% 12% 6% 2%
, 16% nla
10% !(309)
% 57 43
(804)
1994 LP G
. - 61% 47% 17% 6% 6% 2%
21 % nla 9%
(244)
% 54 46
(682)
1995 LP H
63% 50% 26% 7%
10% 5%
17% nla
. 8% (186)
% 46 54
(595)
1996 LP J
66% 48% 12% 12% 7% 5%
17% nla
11% (201)
YO 44 56
(672)
1996 LP K
52% 43% 15% 11% 10% 3%
21 % 4% 7%
(166)
% 42 58
(670)

FAMILY WELFARE
[IF RESPONDENT HAS ADDITIONAL NEEDS] What do you (you and your partner) really need money for at the moment?
..... clothes
..... footwear
..... car bedlbedding .....
furniture ..... ..... carpetslcurtains ..... holiday
electrical equipmentlfepairs ..... home improvements .....
other ..... ..... don't know
COHORT
1991 LP B
49% 26% 4% 6% 7% 9% 8%
17% 9% .
6% (401)
1993 LP D
52% 24% 6%
17% 10% 15% 12% 17% 14% 9% .
(416)
1994 LP G
30% 7%
10% 10% 15% 22% 23% 18% 5% . .
(327)
1995 LP H
50% 25% 7%
11% 14% 21% 15% 16% 15% 8% .
(249)
1996 LP J
52% 32% . 5% 9%
11% 13% 11% 16% 13% 4% .
(266)
1996 LP K
44% 25% 5%
10% 11% 17% 22% 12% 19% 4% .
(252)

FAMILY WELFARE
[ALL1 Sometimes families are not able to pay every bill when it falls due. May I ask, are you up-to-date with the bills on this card, or are you behind with any of them? If falling behind with any, how much do you owe for each debt?
1 The electricity bill - , - Up to date .....
Not applicable ..... Behind .....
Amount of debt .....
'2 The gas bill Up to date .....
Not applicable ..... Behind .....
Amount of debt .....
\
1991 LP B
I
% 89 nla 11
(909)
£ 137 (79)
--
% 84 nla 16
(794)
f 140 (103)
1993 LP D
% 88 4 8
(801)
f 96 (51
% 69 17 14
(802)
f 153 (100)
1994 LP G
% 91 2 7 '
(685)
£81 (32)
% 69 16 15
(684)
f 130 . (68)
COHORT
1995 LP H
% 93 I 5
(595)
f 78 (21 )
% 74 12 13
(595)
f 155 (53)
1996 LP J
% 90 5 5
(673)
f 116 (28)
% 75 12 13
(673)
f 179 (61 )
1996 LP K
% 91 5 4
(670)
£71 (1 6)
% 80 10 9
(6701,
f 148 (43)


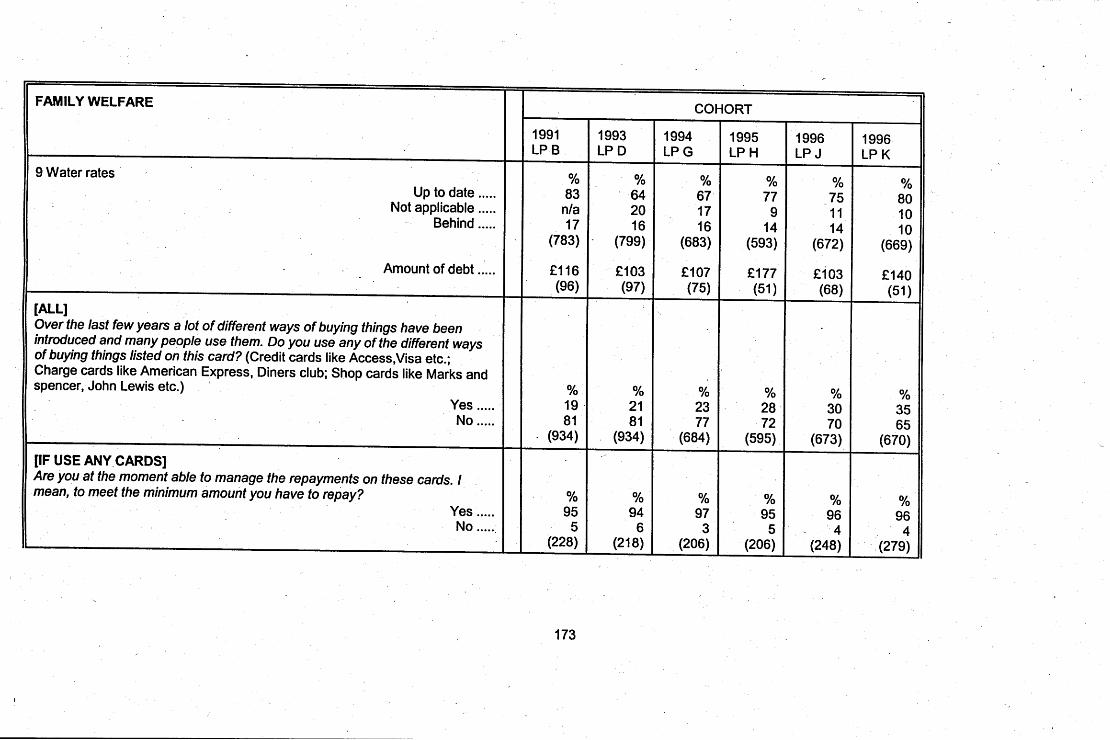

/
FAMILY WELFARE
[IF NOT ABLE TO MEET REPAYMENTS] How much are you unable to repay at the moment?
mean
[ALL1 Have you ever had a card like one of these and given it up or had it taken away?
Yes ..... No .....
[IF GAVE UP CREDIT CARDICARD WITHDRAWN] Did this happen to you during the last six months?
i Yes ..... No .....
COHORT
1991 LP B
£416 (7)
% 15 85
(936)
% 21 79
(144)
1993 LP D
£ 348 (12)
%
(nla)
%
(nla)
1994 LP G
f 309 (5)
YO
(nla)
YO
1995 LP H
£402 (7)
%
(nla)
%
(nla)
1996 LP J
£172 (6)
%
(nla)
YO
(nla)
1996 LP K
£138 (3)
%
(n/a
%
(n/a)
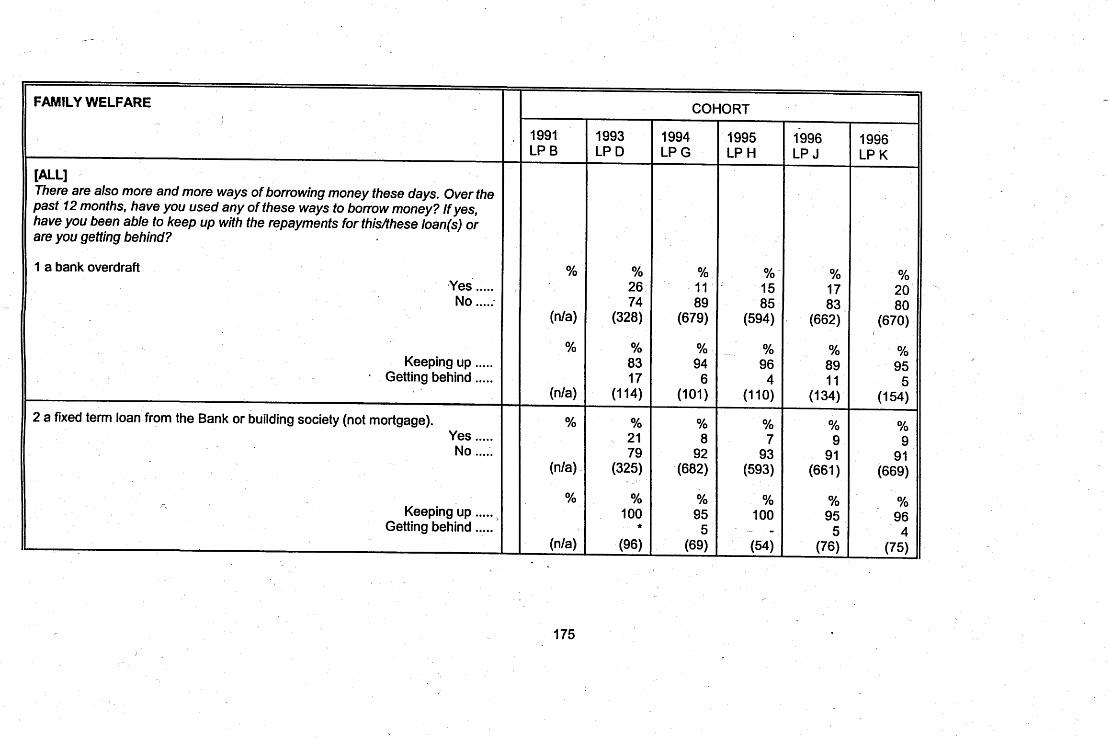


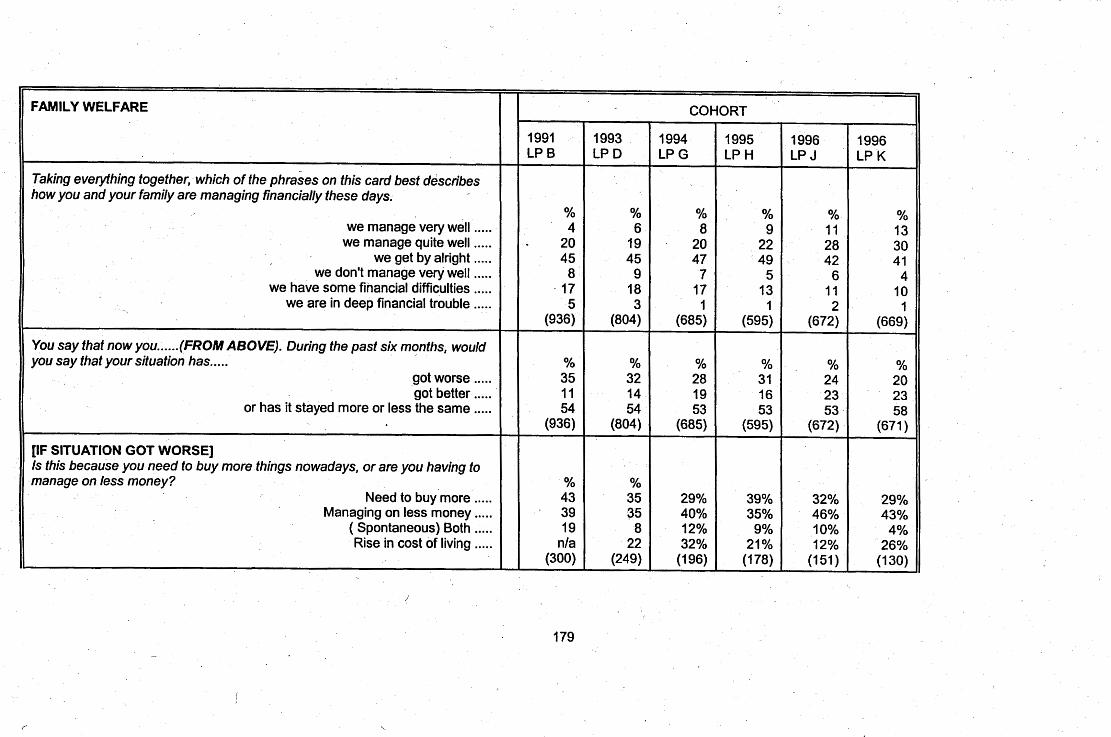
I
FAMILY WELFARE
Taking everything together, which of the phrases on this card best describes how you and your family are managing financially these days.
we manage very well ..... we manage quite well .....
we get by alright ..... we don't manage very well .....
we have some financial difficulties ..... we are in deep financial trouble .....
r
COHORT
You say that now you ......(F ROM ABOVE). During the past six months, would you say that your situation has .....
got worse ..... got better .....
or has it stayed more or less the same .....
[IF SITUATION GOT WORSE] Is this because you need to buy more things nowadays, or are you having to manage on less money?
Need to buy more ..... Managing on less money .....
( Spontaneous) Both ..... Rise in cost of living .....
1991 LP B
% 4
. 20 45 8
17 5
(936) (804) (685) (595) (672) --
1993 LP D
% 6
19 45 9
18 3
% 35 11 54
(936)
% 43 39 19
nla (300)
1994 LP G
% 8
20 47 7
17 1
% 32 14 54
(804)
% 35 35 8
22 (249)
1995 LP H
% 9
22 49 5
13 1
% 28 19 53
(685)
29% 40% 12% 32%
(196)
1996 LP J
% 11 28 42 6
11 2
% 31 16 53
(595)
39% 35% 9%
21% (178)
1996 LP K
% 13 30 41 4
10 1
% 24 23 53
(672)
32% 46% 10% 12%
(151)
% 20 23 58
(671 )
29% 43%
26% (1 30) I
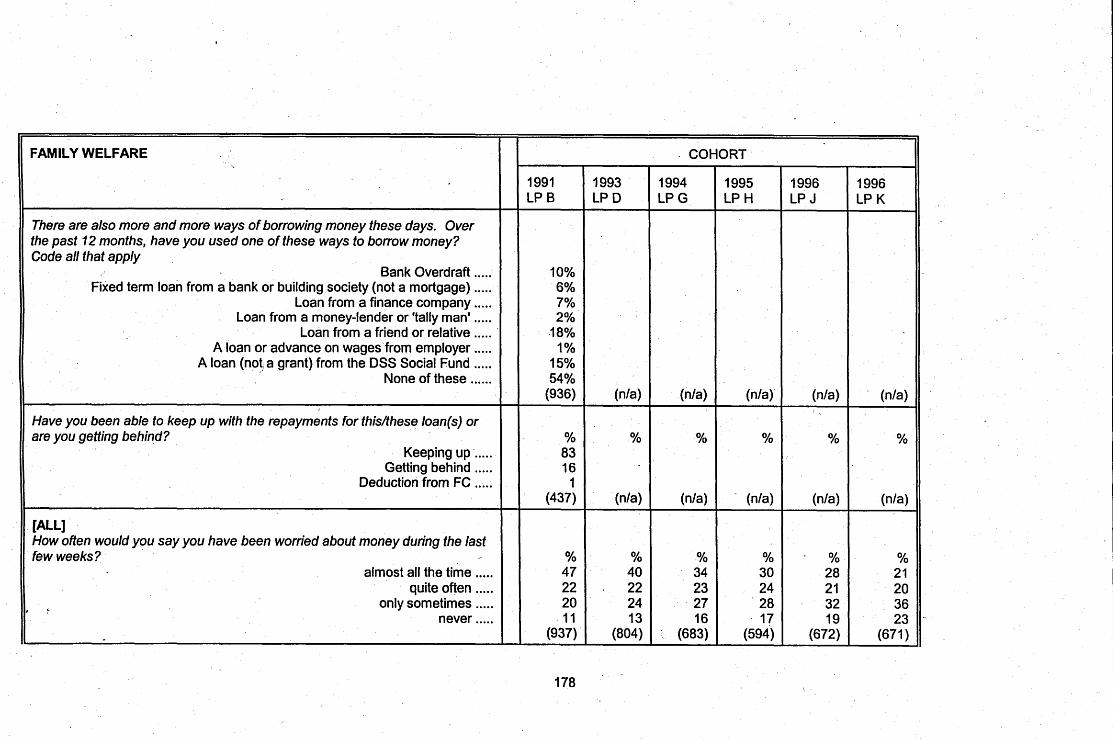
FAMILY WELFARE COHORT
1991 1993 1994 1995 1996 1996 LP B LP D LP G LP H LP J LP K
There are also more and more ways of borrowing money these days. Over the past 12 months, have you used one of these ways to borrow money? Code all that apply
,' Bank Overdraft ..... 10% Fixed term loan from a bank or building society (not a mortgage) ..... 6%
Loan from a finance company ..... 7% Loan from a money-lender or 'tally man' ..... 2%
Loan from a friend or relative ..... 18% A loan or advance on wages from employer ..... 1%
A loan (not, a grant) from the DSS Social Fund ..... 15% None of these ...... 54%
(936) --- --
@la) @/a) (n/a) (n/a) . (n/a)
Have you been able to keep up with the repayments for thisbhese loan@) or are you getting behind?
Keeping up- ..... Getting behind .....
Deduction from FC .....
[ALL1 How often would you say you have been worried about money during the last few weeks?
almost all the time ..... quite often .....
r ? only sometimes .....
never ..... i
178 i
% 83 16 1
(437)
% 47 22 20 11
(937)
%
% 40
. 22 24 13
(804)
%
(nla)
% 34 23 27 16
' (683)
%
' (nla)
% 30 24 28 17
(594)
%
(n/a)
% 28 21 32 19
(672)
%
(nla)
Yo 21 20 36 23
(671
-

I
I
FAMILY WELFARE
[IF SITUATION GOT BETTER] b this because you need to buy fewer things nowadays or do you have more money to spend?
Need fewer things ..... More money .....
(Spontaneous) both ..... \
, Other .....
[ALL1 And do you expect things to go on like this for the foreseeable future or do you expect things to get better for you, or to get worse?
things will go on like this ..... things will get better ..... things will get worse .....
don't know .....
Thinking back over the past two years, how often would you say you have had trouble with debts that you found hard to repay?
almost all the time ..... quite often .....
- only sometimes ..... never .....
1991 LP B
% 23 65 12
nla (120)
% 42 40 18
nla (927)
%
(nla)
1993 LP D
% 20 60 6
13 (1 19)
f
% 47 33 20 nla
(799)
% 14 19 35 32
(801)
1994 LP G
% 17% 68% 2%
13% (126)
Yo 43 41 16
- (681)
YO 1 I 20 37 32
(683)
-
COHORT
1995 LP H
% 23 59 5
14 (106)
% 50 39 11
- (594)
% 10 14 40 35
(594)
1996 LP J
% 15 64 7
14 (154)
% 48 42
9
(672)
% 8
16 38 38
(672)
1996 LP K
YO 12 73 7 8
(1 49)
Yo 47
- 42 9 1
(671
% 6
11 36 47

FAMILY WELFARE c
Some people bringing up children receive financial help from their families, offen from their parents. Thinking first about your family, do they help you with 9
1 paying towards bills Yes .....
/
2 buying clothes for your children Yes .....
3 buying clothes for you Yes .....
4 paying for tripslholidays Yes .....
5 buying new items (PLEASE SPECIFY) Yes .....
1991 LP B
(nla)
(nla)
(nla)
(nla)
(nla)
1993 LP D
14% (801)
40% (798)
14% (800)
16% (800)
17% (797)
1994 LP G
12% (681)
34% (681
13% (682)
17% (681)
- ( - 1
COHORT
1995 LP H
11% (591)
32% (591)
12% (592)
16% (594)
- ( - )
1996 LP J
13% (664)
31% (667)
14% (665)
18% (665)
8% (636)
1996 LP K
I OYo (669)
30% (670)
10% (669)
16% (670)
4% (666)

b
FAMILY WELFARE
(Apart from Christmas and birthday presents), does your family ever give or lend you money3
regularly-give money ..... sometimes give money .....
, lend money ..... none of these .....
COHORT
1991 1993 1994 1995 1996 LP 6 LP D LP G LP H LP J
19% 18% 17% 20% 22% 32% 26% 25%_. 54% 55% 61% 59%
(nla ) (798) (685) (594) (672)
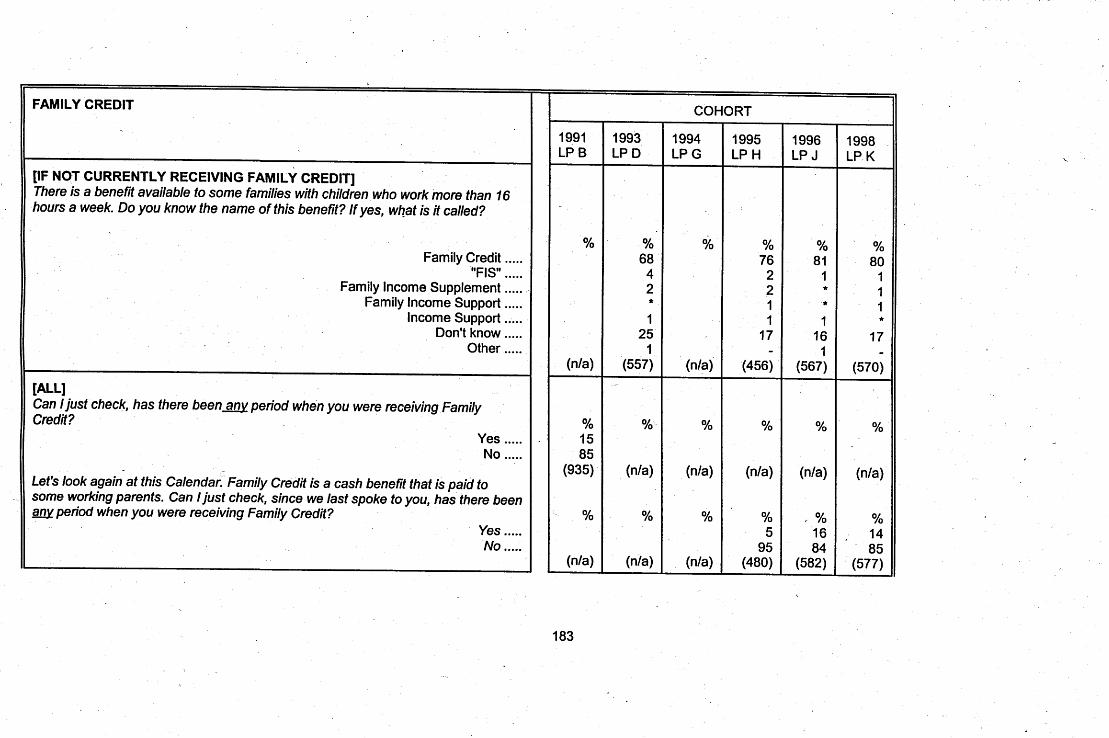

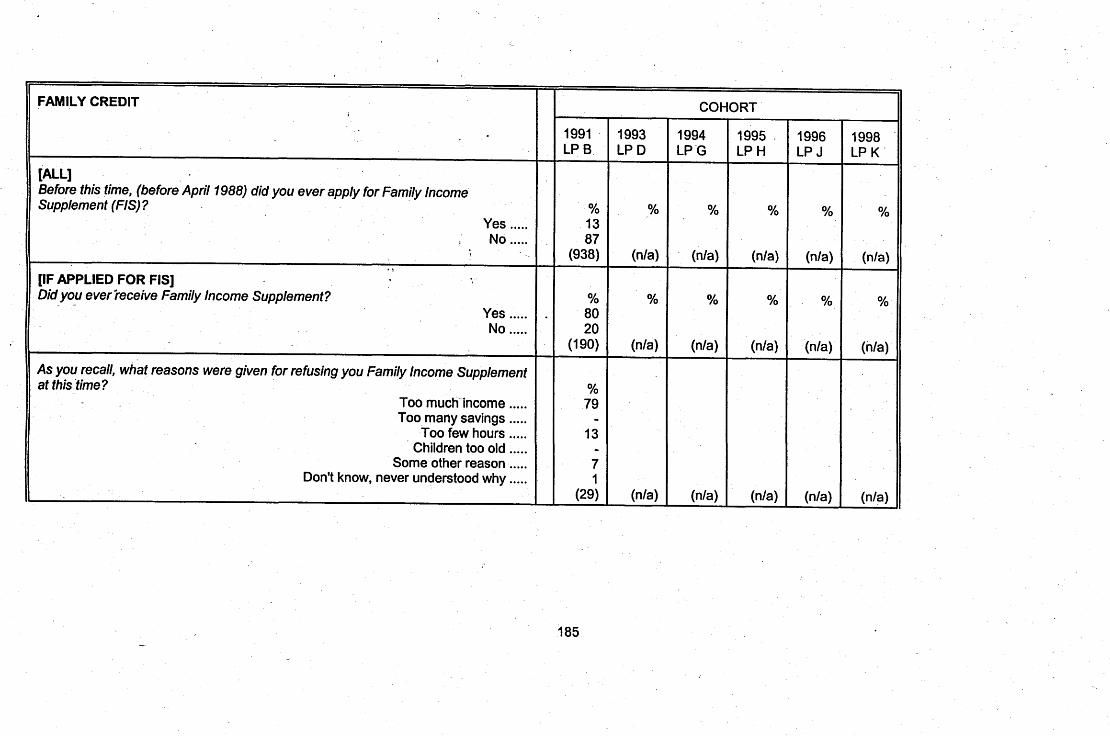

FAMILY CREDIT
[ALL1 Check has respondent made any claim for Family Credit, including those turned down?
Yes ..... No .....
@F HAS CLAIMED FAMILY CREDIT] Thinking of the job on which the (most recent) claim for Family Credit was based, for how long had you (or your parfner) worked in that job before applying for Family Credit? (RECORD YEARS AND MONTHS)
Did you put in your claim as soon as you first thought you might be able to get Family Credit, or did you let some time go by before puffing in a claim?
Put in as soon as aware of FC ..... i Allowed time to pass .....
[IF ALLOWED TIME TO PASS] About how much time did you let go by before applying for Family Credit? (RECORD WEEKS OR MONTHS)
COHORT

FAMILY CREDIT
- -
Why did you delay your claim? not sure we were entitled to it .....
not sure where to get form ..... not sure if worth it .....
waiting for newlbetter rates ..... wasn't aware of it .....
just to think about it ..... no particular reason .....
other ..... Don't know .....
I
COHORT
1994 ( 1995 LPG LP H


I
,
FAMILY CREDIT
[IF COULD NOT ANSWER SOME QUESTIONS] Which questions were you unable to answer?
Details of other income ..... Details of savings .....
Hours worked ..... Details of children .....
other ..... Can't remember .....
Did you ever manage to supply the information needed? Yes .....
+ No .....
If yes, how did you manage to do this?
[ALL WHO HAVE EVER CLAIMED FAMILY CREDIT] Has respondent (not partner) received Family Credit (since last interview)?
Yes - currently ..... Yes - in pasvsince last interview .....
No ..... 1
1991 LPB
48% - 2% - 2%
50% (16)
% 60 40
(15)
% 41 36 23
(412)
1993 LPD
% 45
- 8 3
17 27
(12)
% 80 20
(11)
% 62 27 10
(325)
1994 LPG
96% - 23% -
- . 4%
(8)
% 30 70 (8)
% 63 21 15
(236)
COHORT
1995 LPH
% 38
- - -
57 5
(12)
% 59 41
(12)
% 82
- 16 2
(147)
1996 .LPJ
(nla)
(nla)
(nla)
% 60 25 I 5
(205)
1998 LPK
(nla)
(nla)
(nla)
% 54 30 16
(186)


FAMILY CREDIT G)
[IF CURRENTLY RECEIVING FAMILY CREDIT] If you were not receiving Family Credit at the moment, which of these phrases would best describe your position.. .
you would manage without cutting down ..... you would manage if you cut down a little .....
you would manage if you cut down a lot ..... Or you couldn't manage at all .....
[IF RECEIVED FAMILY CREDIT IN PAST BUT NOT NOW] How much difference did it make.to you to receive Family Credit? I mean, how well would you have managed if you had ~t been getting Family Credit. Which of these phrases best describes your position at that time:
you would have managed without cutting down ..... ' you would have managed if you had cut down a little .....
you would have managed if you had cut down a lot ..... you couldn't have managed at all .....
I COHORT

I
FAMILY CREDIT
And did anyone else say they thought it a bad idea you were claiming . Family Credit or discouraged you from claiming?
Yes ..... No .....
[IF WORKING AND CURRENTLY GETTING FAMILY CREDIT] If for some reason you were unable to get Family Credit, would you continue in your present job, try to get another job,, stop working for a
I while, or what would you do? I continue in present job .....
try to get anotherladditionalldifferent job ..... stop work for a while .....
other ..... don't know .....
If you get more money each week in your wages, do you think it will have any effect now on the amount of Family Credit you get, or will the amount you get now just stay the same until the award runs out?
will affect present award ..... award will stay the same .....
don't know .....
If someone receives more money each week in their wages, could this affect the amount they would get each week in a new or renewed award of Family Credit?
Yes ....; No .....
Don't know .....
'
1991 LP B
%
95 (414)
%
(nla)
%
(nla)
%
(nla)
1993 LP D .-
% 5 5
95 (323)
% 42 30 22
1 5
(192)
% 17 78 5
(193)
% 90 7 3
(193)
COHORT
1994 LPG
%
(n/a)
% 35- 38 19 3 4
(147)
% 10 85 6
(147)
% 92
1 7
(147)
1995 LP J
%
(nla)
% 29
. 34 26 4 7
(1 1.1)
% 14 83 3
(111)
% 92 5 3
(1 11)
1996 LP H
%
(nla)
% 27 32 .34
*
7 (117)
%
(nla)
%
(nla)
1998 LP K
%
(nla)
37% 34% 20% 3% 9%
(100)
yo
(nJa)
%
(nla)

21n 1996 asked of all FC claimants .
FAMILY CREDIT
[IF FROM ADVERT OR OTHER PEOPLE] What, would you say, was your main reason for applying for Family Credit at that parficular time?
Renewed previous claim ....: Just got a new job .....
Just found out about Family Credit ....". Earning less money .....
I had just started a family ..... My partner had stopped working .....
Just separatedldivorced ..... Acquired ready-made family .....
Change in the rules ..... Some other reason .....
Change of hours .....
[ALL WHO HAVE EVER CLAIMED FAMILY CREDIT] When you filled in the application form for your last claim, were you able to give all the information asked for, or were there some questions you could not answer?
Answered all questions ..... Some that could not answer .....
- --
COHORT
'1 % 4% 4% nla 3% 4% 2%
(201 )2
1991 LP B
27% 32% 14% 2% -
19% 1% 9%
- - -
(318)
% 96 4
(409)
Yo 89 11
(144) (nla)
1993 LP D
% - 37 38 4 *
2 6
' I - 12 -
(271)
% 94 6
(325)
3 6
nla 2 9 3
(1 83)

FAMILY CREDIT
[IF CURRENTLY RECEIVING FAMILY CREDII] Thinking about your present award of Family Credit, was the amount you were awarded more than you had expected, less, or was this about the amount you expected to get?
More .:.. less .....
about the same .....
COHORT
1991 LPB
% 40 17 43
(285)
1993 LPD
% 28
. 24 47
(206)
1994 LPG
% 22 23 55
(152)
1995 LPH
% 20 15 66
(112)
1996 LPJ
940 29 15 56
(117)
1998 LPK
% 27 14 58
(101)

FAMILY CREDIT
free dental treatment used .....
not used .....
don't need ..... not aware .....
reduced price baby milk used .....
not used .....
don't need ..... not aware .....
COHORT
1991 1993 1994 1995 1996 1998 LPB LP D LP G LP J LP H LP K
% % % % % % 61 77 82 39 23 18
(nla) (nla) (nla) (144) (169) (1 57) 95 86 92 5 14 8
(nla) (n/a) (nla) (58) I321
8 3 3 6 9 6 92
' 97 97 94 91 - 94
(364) (303) (196) (144) (167) (157) 94 89 94 98 94 95 6 11 6 2 6 5
(345) (290) (190) (138) (151) (146)

I
195
FAMILY CREDIT
When you first got- Family Credit. were there other benefits you expected to get, but found you could no longer get or which you found were reduced because you were working and claiming Family Credit?
Yes ..... No .....
[IF EXPECTED BENEFITS WHICH WERE STOPPED OR REDUCED] What benefits were these, that you did not expect to lose?
- Housing BenefitlRent Rebate ..... Community Charge (Poll Tax)/Council tax rebate .....
Free school meals ..... Mortgage interest . . . . .
other benefit .....
[IF 'EXPECTED FREE SCHOOL MEALS'] Did you then .......
pay for school meals ..... give them money to buy meals out .....
or, send them to school with packed lunches? ..... Something else .....
,
1991 LP B
% 31 69
(365)
30% 27% 61 %
1% 14%
(134)
% 63 I
35 1
(87)
1993 LP D
% 35 65
(307)
29% 29% 58% 3%
19% (105)
% 60 7
33 -
(61
COHORT
1994 LP G
% 38 62
(198)
35% 16% 62% - 1 7 % . (71 )
- % 25
' 8 67
- (46)
1995 LP J
% 39 61
(144)
15% 18% 76%
1%. 7%
(53)
% 50
50 -
(36)
1996 LP H
% 34
. 66 (169)
32% 22% 54% 4%
18% (57)
%
\
1998 LP K
% 32 68
(157)
22% 28% 65%
1% 11% (46)
Yo
(nla)

FAMILY CREDIT
I
[IF CURRENTLY RECEIVING FAMILY CREDIT OR RECEIVED IN PASTJ So, what things would you say you really use(d) your Family credit hr? What is (was) it spent on or put by for? . .
Nothing in particular ..... Clothes - adult .....
Clothes - children ..... Foodlextra food . . . . .
Bills ..... Rentlmortgage .....
Petrollrunning car ..... On children - pocket money, school dinners etc .....
Basic, part of general spending ..... Don't know .....
Other .....
Is (was) your Family Credit paid into your own bank account, or a joint account, or is (was) it paid by an order book?
Sole account ..... , Joint account .....
Order book .....
[ALL WHO HAVE EVER APPLIED FOR FAMILY CREDIT] Has anyone among your family or friends said to you that they thought it a good idea that you were applying for Family Credit, or encouraged you to claim ?
Yes ..... No .....
197 .
.
1991 LP B
27% 23% 38% 30% 7% 0% 9% -
- 4% 4%'
(353)
% 19
- 81
(363)
% 64
I 36 (414).
1993 LP D
6% 8%
22% 43% 42% 17% 1%
11% 26% - 7%
(303)
. % 26
*
74 (303)
57 43
(321)
COHORT
1994 LP G
(nla)
%
(nla)
% . %
(nla)
1995 ' LP J
(nla)
%
(nla)
Yo
(nla)
1996 LP H
(nla)
%
- (nla)
%
(nla)
1998 LP K
(n/a)
%
Yo
@/a)


FAMILY CREDIT
If yes, where would you look?
[ALL1 Do you know the minimum number of hours a week you have to work to be able to get Family Credit?
Yes ..... , No .....
If yes, how many hours a week is this? mean .....
[IF ANSWER NOT 16 HOURS OR DOES NOT KNOW MINIMUM '
HOURS] h fact, you have to be working at least 76 hours each week to qualiij~ for Family Credit. This was reduced from 24 hours two years ago. May I ask first, had you heard about this change?
' - Yes ..... No .....
Not sure .....
[IF NOT HEARD ABOUT THE HOURS CHANGE] .
Would this affect the hours you want to work each week? Yes ..... No .....
,
200 \
1991 LP B
(nla)
%
(nla)
(nla)
%
(nla)
%
(nla)
1993 LP D
- % 57 43
(803)
17 (537)
% '8 78 4
(352)
% 15 85
(359)
,
COHORT
1994 LP G
% 53 47
(686)
16 (434)
% . 27
67 6
(386)
% 6
94 (24)
I
1995 LP J
(nla)
% t 76
24 (590)
16 (471)
%
%
(nla)
1996 LP H
(nla)
% 75 25
(673)
16 (520)
%
(nla)
% I
(nla)
1998 LP K
(nla)
% 75 25
(670)
16 (532)
%
(nIa)
%
(nla)

FAMILY CREDIT
[IF HEARD ABOUT THE CHANGE AND CURRENTLY WORKING 16 HOURS OR MORE] Have you increased or reduced your hours as a result of this chanue?
Increased ..... started work at these hours .....
. Reduced ..... (None of these) .....
Would you still be working if Family Credit was only paid to those working 24 or more hours each week?
Yes ..... No .....
Don't know .....
COHORT
1991 LP B
%
(nla)
%
(nla)
1993 LP D
% 32 56 12
nla (69)
% 68 32
- (75)
1994 LP G
% 4
29 1
65 (252)
% 86 8 5
(247)
1995 LP J
%
(nla)
%
-
(nla)
1996 LP H
%
(nta)
%
(nla)
1998 LP K
%
(nla)
%
(nla)

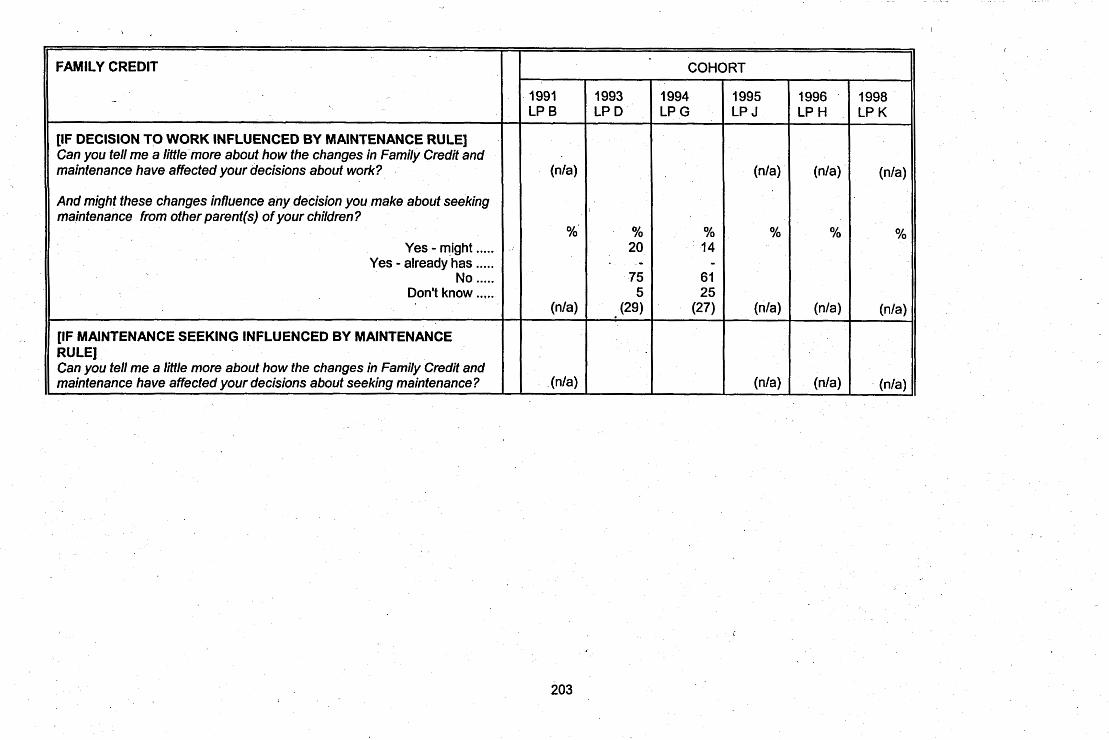
FAMILY CREDIT
[IF DECISION TO WORK INFLUENCED BY MAINTENANCE RULE] Can you tell me a little more about how the changes in Family Credit and maintenance have affected your decisions about work?
And might these changes influence any decision you make about seeking maintenance from other parent(s) of your children?
Yes - might ..... Yes - already has .....
No ..... ~ Don't know ..,..
[IF MAINTENANCE SEEKING INFLUENCED BY MAINTENANCE RULE] Can you tell me a little more about how the changes in Family Credit and maintenance have affected your decisions about seeking maintenance?
COHORT

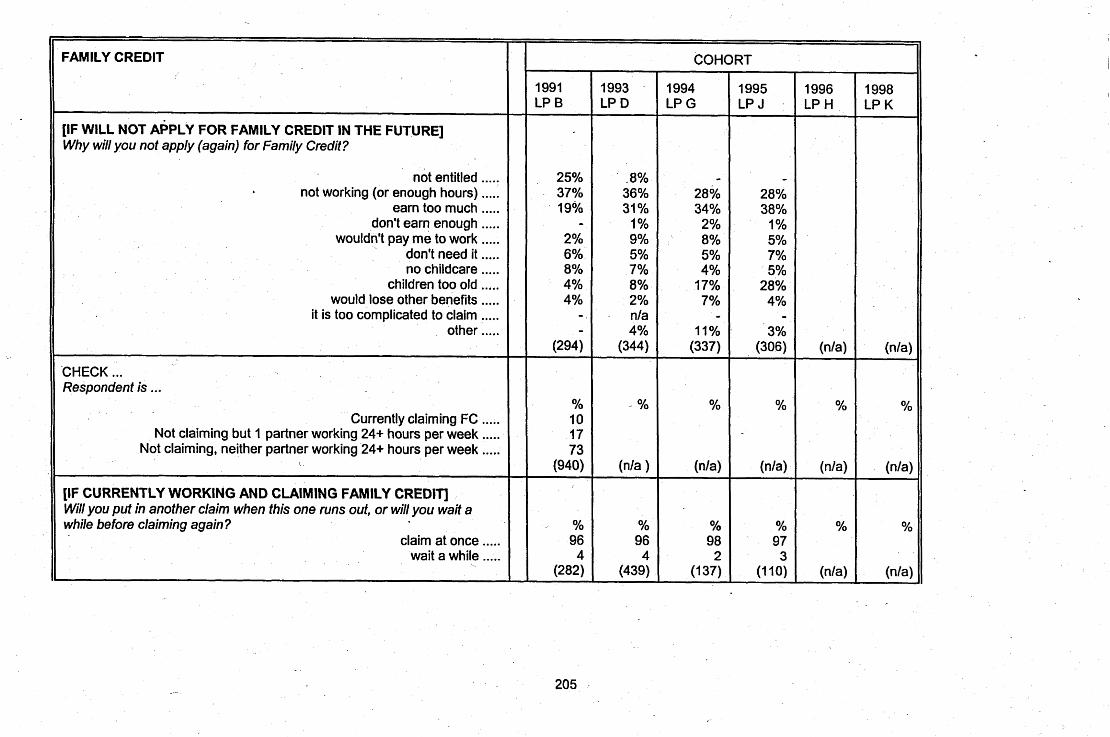
FAMILY CREDIT
[IF WILL NOT APPLY FOR FAMILY CREDIT IN THE FUTURE] Why will you not apply (again) for Family Credit?
not entitled ..... not working (or enough hours) .....
earn too much ..... don't earn enough .....
wouldn't pay me to work ..... don't need it ..... no childcare .....
children too old ..... would lose other benefits .....
it is too complicated to claim ..... other .....
'CHECK ... Respondent is . . .
Currently claiming FC ..... Not claiming but 1 partner working 24+ hours per week .....
Not claiming, neither partner working 24+ hours per week ..... C
[IF CURRENTLY WORKING AND CLAIMING FAMILY CREDIT] Will you put in another claim when this one runs out, or will you wait a while before claiming again ?
claim at once ..... wait a while .....
I
1991 LP B
25% 37% 19% - 2% 6% 8% 4% 4%
- _ -
(294)
% 10 17 73
(940)
% 96 4
(282)
1993 LP D
.8% 36% 31 %
1% 9% 5% 7% 8% 2% nla 4%
(344)
- %
(nla )
% 96 4
(439)
COHORT
1994 LP G
- 28% 34% 2% 8% 5% 4%
17% 7% -
11% (337)
%
(n/a)
% 98 2
(137)
1995 LP J
- 28% 38%
1% 5% 7% 5%
28% 4%
- 3%
(306)
Yo
(nla)
% 97 3
(1 10)
1996 LP H
(nla)
%
(nla)
%
(nla)
1998 LP K
(nla)
Yo
(n/a)
yo
(nla)

I
- 206
FAMILY CREDIT -
If will wait a while, why will you wait before claiming again?
not working ..... earnings increased .....
wait till claim runs out ... :. disappointed when turned down .....
waiting for introduction of childcare allowance ..... it is too complicated to claimlproblems with form .....
other .....
If you get a new or renewed award of Family Credit, do you expect to get as much each week as you get now, more than you get now, or will you get less each week?
Same ..... Z More .....
Less .....
[IF EXPECT MOREILESS THAN NOW] About how much moredess do you think you will get each week? ,
mean ..... Why do you think you will get about f ... a week moreless each week? .
Income changed ..... Change in children's ages .....
Change in savings ..... Other .....
Don't know .....
1991 LP B
( - 1
% 64 15 21
(278)
£12.56 (51
- 60% 19% _ 23% - (94)
1993 LP D
% 21 28 2 - - -
49 (17
% 61 12 27
(204)
£7.78 (56)
% . -73 . 12 'I -
7 7
(85)
COHORT
1994 LP G
( * I
% 71 7
21 (133)
£19.74 (36)
56% - 3 7 % -
7% - (53)
1995 LP J
( *
% 58 10
‘ 32 (1 10)
£ 13.58 (25)
83% 6% 1%
11% - (41)
1996 LP H
(nla)
%
(nla)
(nla)
(nla)
1998 LP K
(nla)
%
(n/a)
(nla)
(n/a)


'In 1998 this question asked for all respondents not just those who had heard of change as in previous cohorts
.209 '.
FAMILY CREDIT
How did you first hear of this change awarding an extra f 10 a week to Family Credit claimants who work 30 hours a week or more?
ADVERT T.V. Adverts .....
~ k w s ~ a ~ e r magazine ..... other advert ... ..
Notice in Child Benefit Book .....
OTHER PEOPLE DSS leaflet .....
leaflet in Post office ..... DSS officelofficial .....
Citizen's Advice Bureau ..... Welfare Rights Worker .....
Employer ..... Workmates .....
Relatives ..... Friends, neighbours .....
Other (specify) .... Leaflet with FC ....
Might this change influence your choice of the number of hours you might work in a job or would it make no difference to the hours you might work?
Yes, might influence hours ..... No, make no difference .....
Don't know .....
1991 LP B
(nla)
(nla)
%
(nla)
1993 LP D
(nla)
(nla)
O/o
(nla)
COHORT
1994 LP G
(nla)
(nla)
yo
(nla)
1995 LP J
% 65 17 1 -
nla - 8
- 6 3 - - -
nla (24)
% 8
85 7
(36)
1996 LP H
9% 4%
12%
40% 11% 10%
- -
2% 4% 4% 6% 4% nla .
(150)
% 18 81
1 (150)
1998 LP K
10% 4%
24%
23% 3% 9%
- 2% 5% 4%
12% 5% 6%
(188)
% 8
89 3
(670)'


FAMILY CREDIT
[IF CURRENTLY RECEIVING FAMILY CREDII] Thinking about your present award of Family Credit, was the amount you were awarded more than you had expected, less, or was this about the amount you expected to get?
More .:.. less .....
about the same .....
COHORT
1991 LPB
% 40 17 43
(285)
1993 LPD
% 28
. 24 47
(206)
1994 LPG
% 22 23 55
(152)
1995 LPH
% 20 15 66
(112)
1996 LPJ
940 29 15 56
(117)
1998 LPK
% 27 14 58
(101)

FAMILY CREDIT
free dental treatment used .....
not used .....
don't need ..... not aware .....
reduced price baby milk used .....
not used .....
don't need ..... not aware .....
COHORT
1991 1993 1994 1995 1996 1998 LPB LP D LP G LP J LP H LP K
% % % % % % 61 77 82 39 23 18
(nla) (nla) (nla) (144) (169) (1 57) 95 86 92 5 14 8
(nla) (n/a) (nla) (58) I321
8 3 3 6 9 6 92
' 97 97 94 91 - 94
(364) (303) (196) (144) (167) (157) 94 89 94 98 94 95 6 11 6 2 6 5
(345) (290) (190) (138) (151) (146)

I
195
FAMILY CREDIT
When you first got- Family Credit. were there other benefits you expected to get, but found you could no longer get or which you found were reduced because you were working and claiming Family Credit?
Yes ..... No .....
[IF EXPECTED BENEFITS WHICH WERE STOPPED OR REDUCED] What benefits were these, that you did not expect to lose?
- Housing BenefitlRent Rebate ..... Community Charge (Poll Tax)/Council tax rebate .....
Free school meals ..... Mortgage interest . . . . .
other benefit .....
[IF 'EXPECTED FREE SCHOOL MEALS'] Did you then .......
pay for school meals ..... give them money to buy meals out .....
or, send them to school with packed lunches? ..... Something else .....
,
1991 LP B
% 31 69
(365)
30% 27% 61 %
1% 14%
(134)
% 63 I
35 1
(87)
1993 LP D
% 35 65
(307)
29% 29% 58% 3%
19% (105)
% 60 7
33 -
(61
COHORT
1994 LP G
% 38 62
(198)
35% 16% 62% - 1 7 % . (71 )
- % 25
' 8 67
- (46)
1995 LP J
% 39 61
(144)
15% 18% 76%
1%. 7%
(53)
% 50
50 -
(36)
1996 LP H
% 34
. 66 (169)
32% 22% 54% 4%
18% (57)
%
\
1998 LP K
% 32 68
(157)
22% 28% 65%
1% 11% (46)
Yo
(nla)
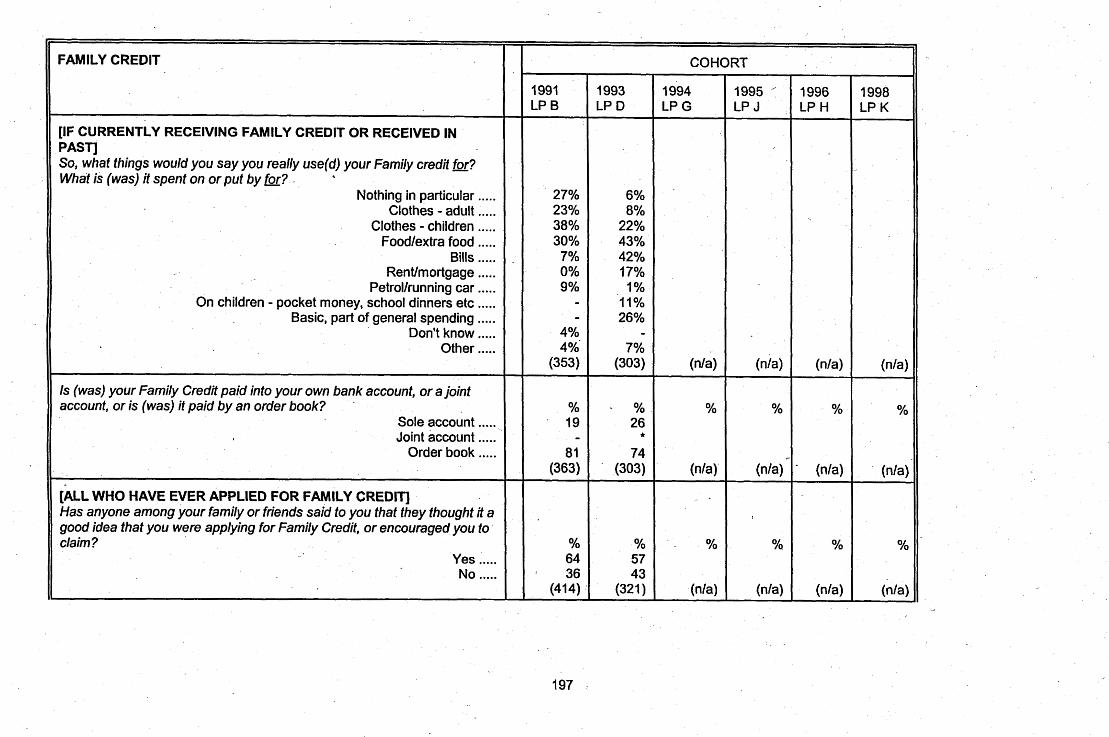
FAMILY CREDIT
I
[IF CURRENTLY RECEIVING FAMILY CREDIT OR RECEIVED IN PASTJ So, what things would you say you really use(d) your Family credit hr? What is (was) it spent on or put by for? . .
Nothing in particular ..... Clothes - adult .....
Clothes - children ..... Foodlextra food . . . . .
Bills ..... Rentlmortgage .....
Petrollrunning car ..... On children - pocket money, school dinners etc .....
Basic, part of general spending ..... Don't know .....
Other .....
Is (was) your Family Credit paid into your own bank account, or a joint account, or is (was) it paid by an order book?
Sole account ..... , Joint account .....
Order book .....
[ALL WHO HAVE EVER APPLIED FOR FAMILY CREDIT] Has anyone among your family or friends said to you that they thought it a good idea that you were applying for Family Credit, or encouraged you to claim ?
Yes ..... No .....
197 .
.
1991 LP B
27% 23% 38% 30% 7% 0% 9% -
- 4% 4%'
(353)
% 19
- 81
(363)
% 64
I 36 (414).
1993 LP D
6% 8%
22% 43% 42% 17% 1%
11% 26% - 7%
(303)
. % 26
*
74 (303)
57 43
(321)
COHORT
1994 LP G
(nla)
%
(nla)
% . %
(nla)
1995 ' LP J
(nla)
%
(nla)
Yo
(nla)
1996 LP H
(nla)
%
- (nla)
%
(nla)
1998 LP K
(n/a)
%
Yo
@/a)
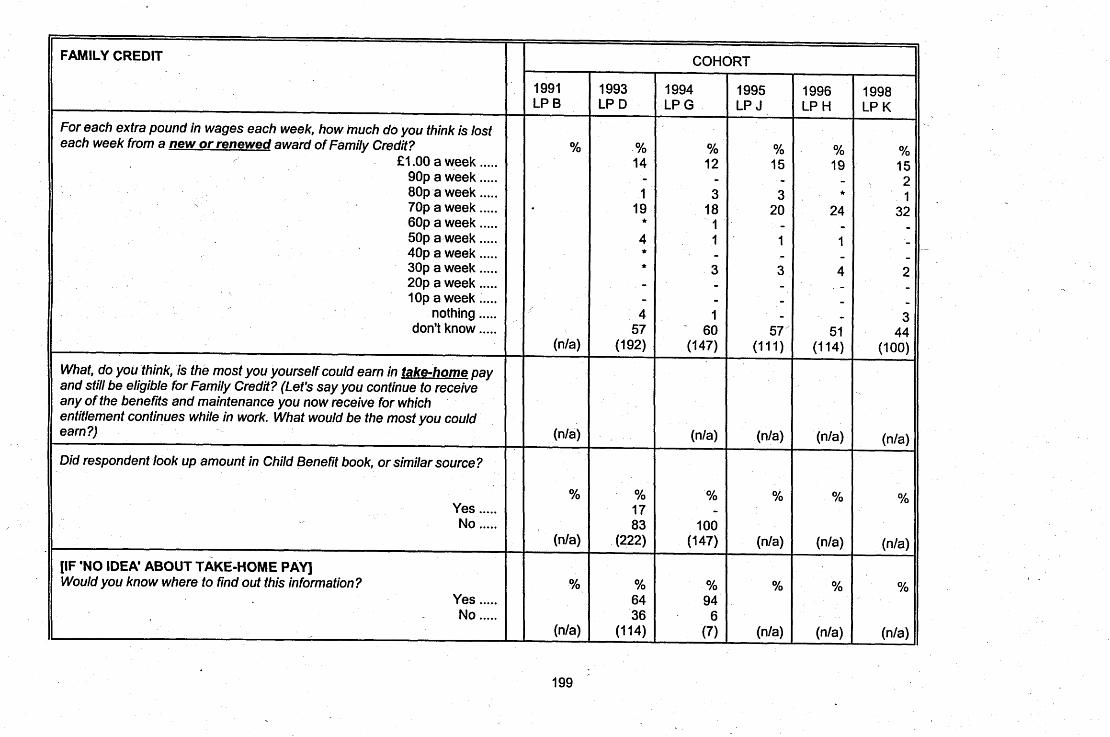
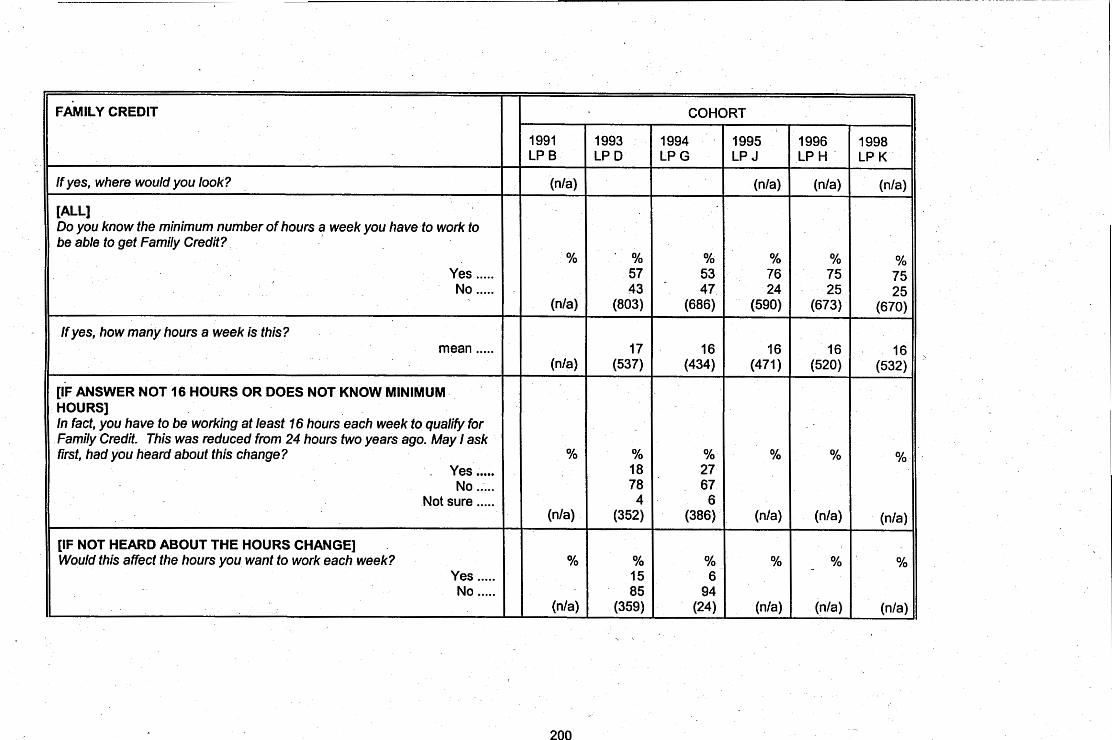
FAMILY CREDIT
If yes, where would you look?
[ALL1 Do you know the minimum number of hours a week you have to work to be able to get Family Credit?
Yes ..... , No .....
If yes, how many hours a week is this? mean .....
[IF ANSWER NOT 16 HOURS OR DOES NOT KNOW MINIMUM '
HOURS] h fact, you have to be working at least 76 hours each week to qualiij~ for Family Credit. This was reduced from 24 hours two years ago. May I ask first, had you heard about this change?
' - Yes ..... No .....
Not sure .....
[IF NOT HEARD ABOUT THE HOURS CHANGE] .
Would this affect the hours you want to work each week? Yes ..... No .....
,
200 \
1991 LP B
(nla)
%
(nla)
(nla)
%
(nla)
%
(nla)
1993 LP D
- % 57 43
(803)
17 (537)
% '8 78 4
(352)
% 15 85
(359)
,
COHORT
1994 LP G
% 53 47
(686)
16 (434)
% . 27
67 6
(386)
% 6
94 (24)
I
1995 LP J
(nla)
% t 76
24 (590)
16 (471)
%
%
(nla)
1996 LP H
(nla)
% 75 25
(673)
16 (520)
%
(nla)
% I
(nla)
1998 LP K
(nla)
% 75 25
(670)
16 (532)
%
(nIa)
%
(nla)
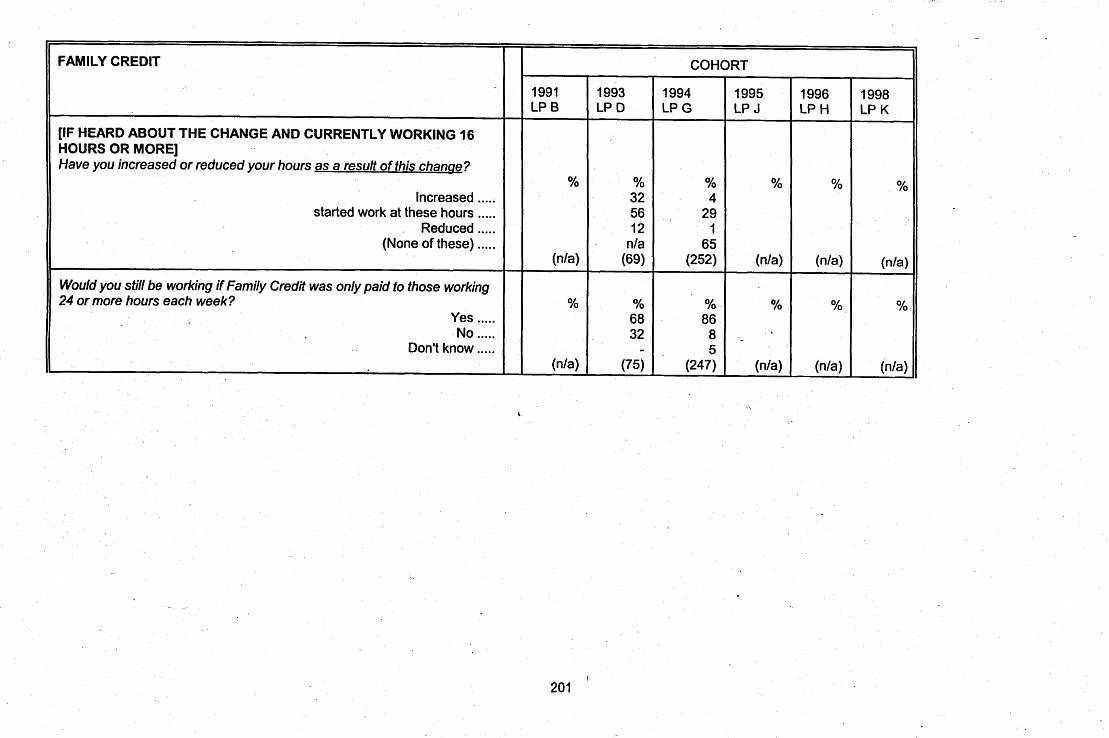
FAMILY CREDIT
[IF HEARD ABOUT THE CHANGE AND CURRENTLY WORKING 16 HOURS OR MORE] Have you increased or reduced your hours as a result of this chanue?
Increased ..... started work at these hours .....
. Reduced ..... (None of these) .....
Would you still be working if Family Credit was only paid to those working 24 or more hours each week?
Yes ..... No .....
Don't know .....
COHORT
1991 LP B
%
(nla)
%
(nla)
1993 LP D
% 32 56 12
nla (69)
% 68 32
- (75)
1994 LP G
% 4
29 1
65 (252)
% 86 8 5
(247)
1995 LP J
%
(nla)
%
-
(nla)
1996 LP H
%
(nta)
%
(nla)
1998 LP K
%
(nla)
%
(nla)
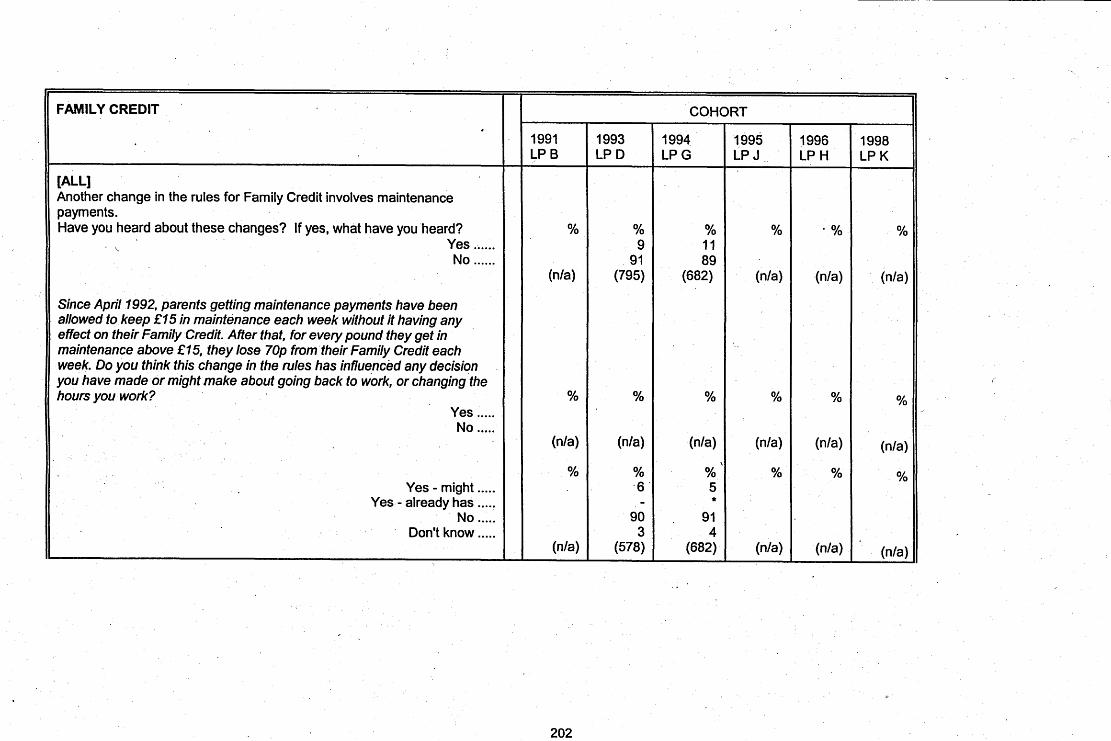

FAMILY CREDIT
[IF DECISION TO WORK INFLUENCED BY MAINTENANCE RULE] Can you tell me a little more about how the changes in Family Credit and maintenance have affected your decisions about work?
And might these changes influence any decision you make about seeking maintenance from other parent(s) of your children?
Yes - might ..... Yes - already has .....
No ..... ~ Don't know ..,..
[IF MAINTENANCE SEEKING INFLUENCED BY MAINTENANCE RULE] Can you tell me a little more about how the changes in Family Credit and maintenance have affected your decisions about seeking maintenance?
COHORT


FAMILY CREDIT
[IF WILL NOT APPLY FOR FAMILY CREDIT IN THE FUTURE] Why will you not apply (again) for Family Credit?
not entitled ..... not working (or enough hours) .....
earn too much ..... don't earn enough .....
wouldn't pay me to work ..... don't need it ..... no childcare .....
children too old ..... would lose other benefits .....
it is too complicated to claim ..... other .....
'CHECK ... Respondent is . . .
Currently claiming FC ..... Not claiming but 1 partner working 24+ hours per week .....
Not claiming, neither partner working 24+ hours per week ..... C
[IF CURRENTLY WORKING AND CLAIMING FAMILY CREDIT] Will you put in another claim when this one runs out, or will you wait a while before claiming again ?
claim at once ..... wait a while .....
I
1991 LP B
25% 37% 19% - 2% 6% 8% 4% 4%
- _ -
(294)
% 10 17 73
(940)
% 96 4
(282)
1993 LP D
.8% 36% 31 %
1% 9% 5% 7% 8% 2% nla 4%
(344)
- %
(nla )
% 96 4
(439)
COHORT
1994 LP G
- 28% 34% 2% 8% 5% 4%
17% 7% -
11% (337)
%
(n/a)
% 98 2
(137)
1995 LP J
- 28% 38%
1% 5% 7% 5%
28% 4%
- 3%
(306)
Yo
(nla)
% 97 3
(1 10)
1996 LP H
(nla)
%
(nla)
%
(nla)
1998 LP K
(nla)
Yo
(n/a)
yo
(nla)

I
- 206
FAMILY CREDIT -
If will wait a while, why will you wait before claiming again?
not working ..... earnings increased .....
wait till claim runs out ... :. disappointed when turned down .....
waiting for introduction of childcare allowance ..... it is too complicated to claimlproblems with form .....
other .....
If you get a new or renewed award of Family Credit, do you expect to get as much each week as you get now, more than you get now, or will you get less each week?
Same ..... Z More .....
Less .....
[IF EXPECT MOREILESS THAN NOW] About how much moredess do you think you will get each week? ,
mean ..... Why do you think you will get about f ... a week moreless each week? .
Income changed ..... Change in children's ages .....
Change in savings ..... Other .....
Don't know .....
1991 LP B
( - 1
% 64 15 21
(278)
£12.56 (51
- 60% 19% _ 23% - (94)
1993 LP D
% 21 28 2 - - -
49 (17
% 61 12 27
(204)
£7.78 (56)
% . -73 . 12 'I -
7 7
(85)
COHORT
1994 LP G
( * I
% 71 7
21 (133)
£19.74 (36)
56% - 3 7 % -
7% - (53)
1995 LP J
( *
% 58 10
‘ 32 (1 10)
£ 13.58 (25)
83% 6% 1%
11% - (41)
1996 LP H
(nla)
%
(nla)
(nla)
(nla)
1998 LP K
(nla)
%
(n/a)
(nla)
(n/a)
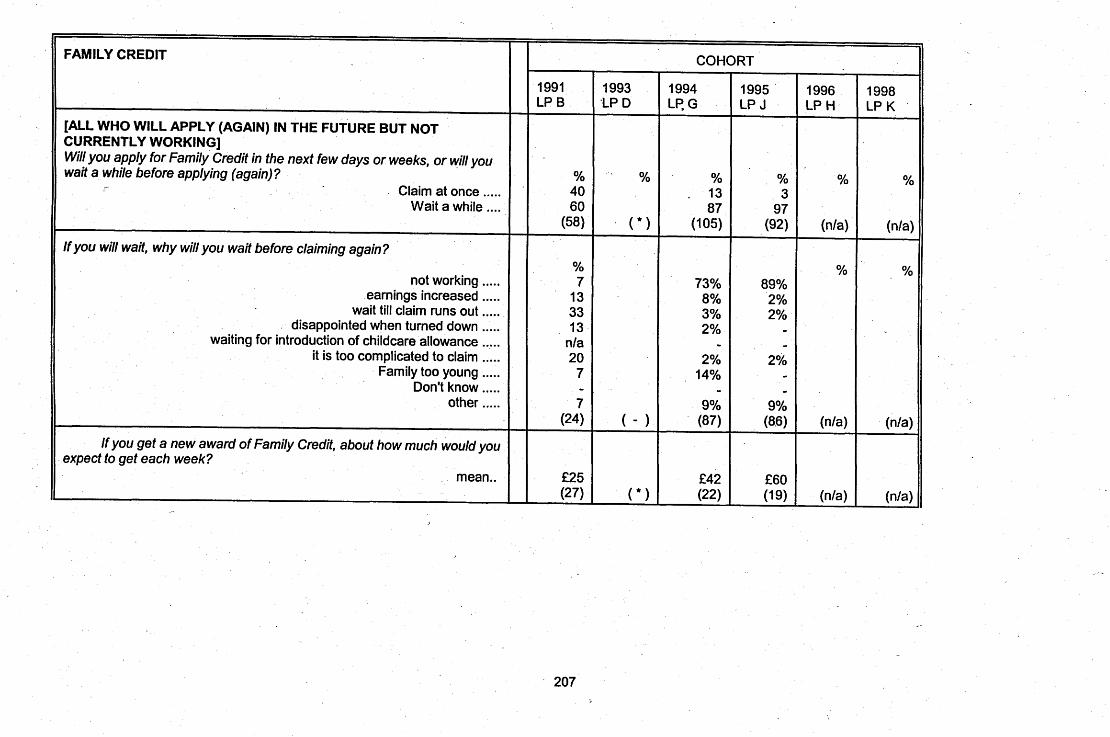
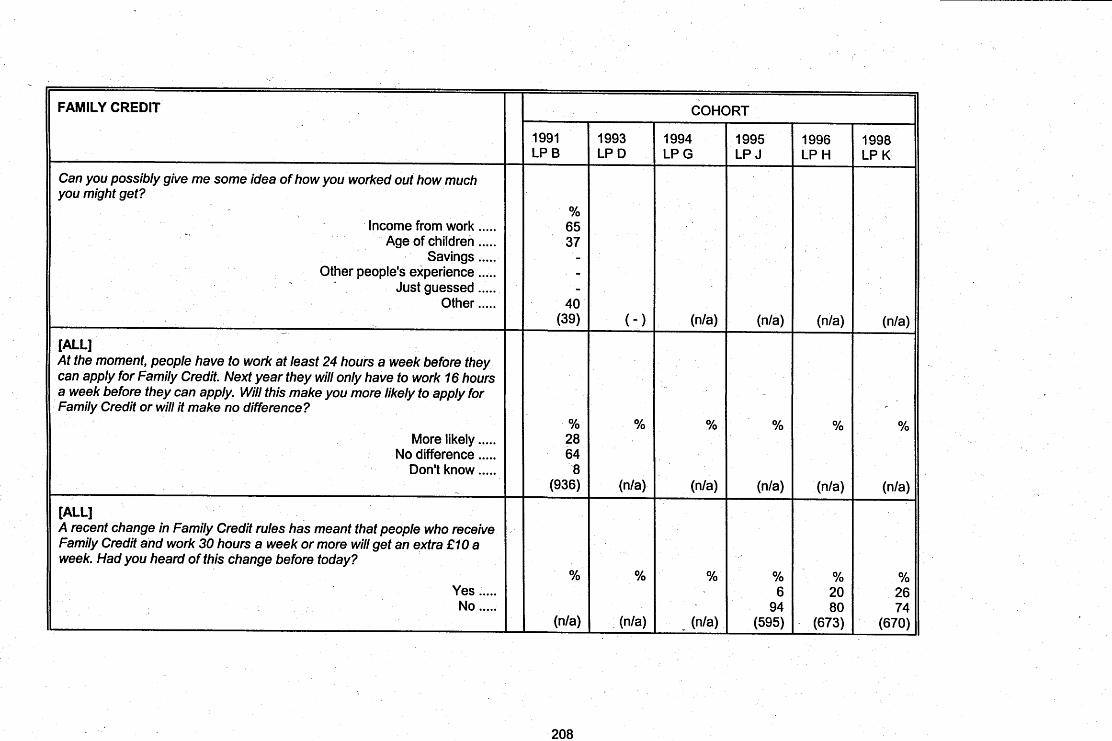

'In 1998 this question asked for all respondents not just those who had heard of change as in previous cohorts
.209 '.
FAMILY CREDIT
How did you first hear of this change awarding an extra f 10 a week to Family Credit claimants who work 30 hours a week or more?
ADVERT T.V. Adverts .....
~ k w s ~ a ~ e r magazine ..... other advert ... ..
Notice in Child Benefit Book .....
OTHER PEOPLE DSS leaflet .....
leaflet in Post office ..... DSS officelofficial .....
Citizen's Advice Bureau ..... Welfare Rights Worker .....
Employer ..... Workmates .....
Relatives ..... Friends, neighbours .....
Other (specify) .... Leaflet with FC ....
Might this change influence your choice of the number of hours you might work in a job or would it make no difference to the hours you might work?
Yes, might influence hours ..... No, make no difference .....
Don't know .....
1991 LP B
(nla)
(nla)
%
(nla)
1993 LP D
(nla)
(nla)
O/o
(nla)
COHORT
1994 LP G
(nla)
(nla)
yo
(nla)
1995 LP J
% 65 17 1 -
nla - 8
- 6 3 - - -
nla (24)
% 8
85 7
(36)
1996 LP H
9% 4%
12%
40% 11% 10%
- -
2% 4% 4% 6% 4% nla .
(150)
% 18 81
1 (150)
1998 LP K
10% 4%
24%
23% 3% 9%
- 2% 5% 4%
12% 5% 6%
(188)
% 8
89 3
(670)'


JOB SEARCH
[IF APPLIED FOR JOB] How many did you apply for?
Mean ..... And have you received any job offers from employers in the past 12 months
(including any offers you accepted)?
Yes ..... No .....
[IF RECENED JOB OFFER] How many? .....
And how many were you not able to accept? .....
' COHORT
1991 LP B
(nla)
%
@/a)
(nla)
(nla)
1993 LP D
(nla)
%
(n/a)
(nla)
(nla)
1994 LP G
(nla)
%
(nla)
(nla)
(nla)
1995 LP H
3.7 (100)
% 53 47
(138)
1.4 (72) 0.5
(71)
1996 LP J
3.7 (1 15)
%' 47 - 53
(173)
1.8 (83) 0.8
(82)
1998 LP K
2.6 (98)
% 53 47
(156)
1.5 (81 ) 0.7
(80)
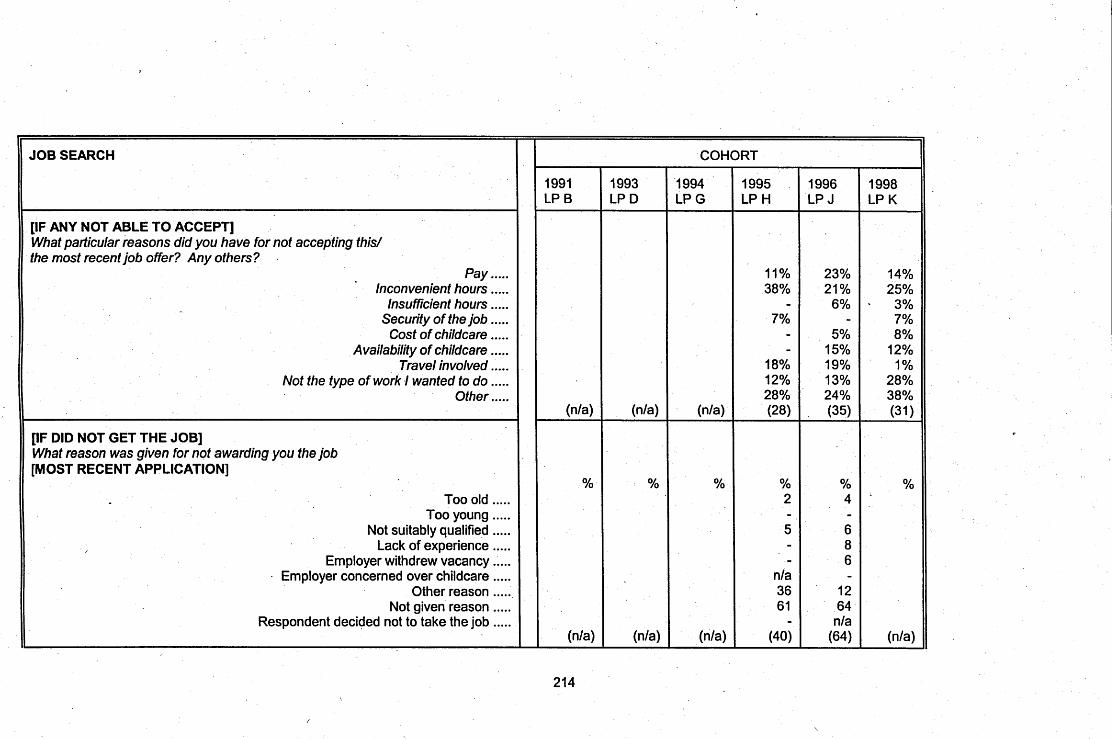

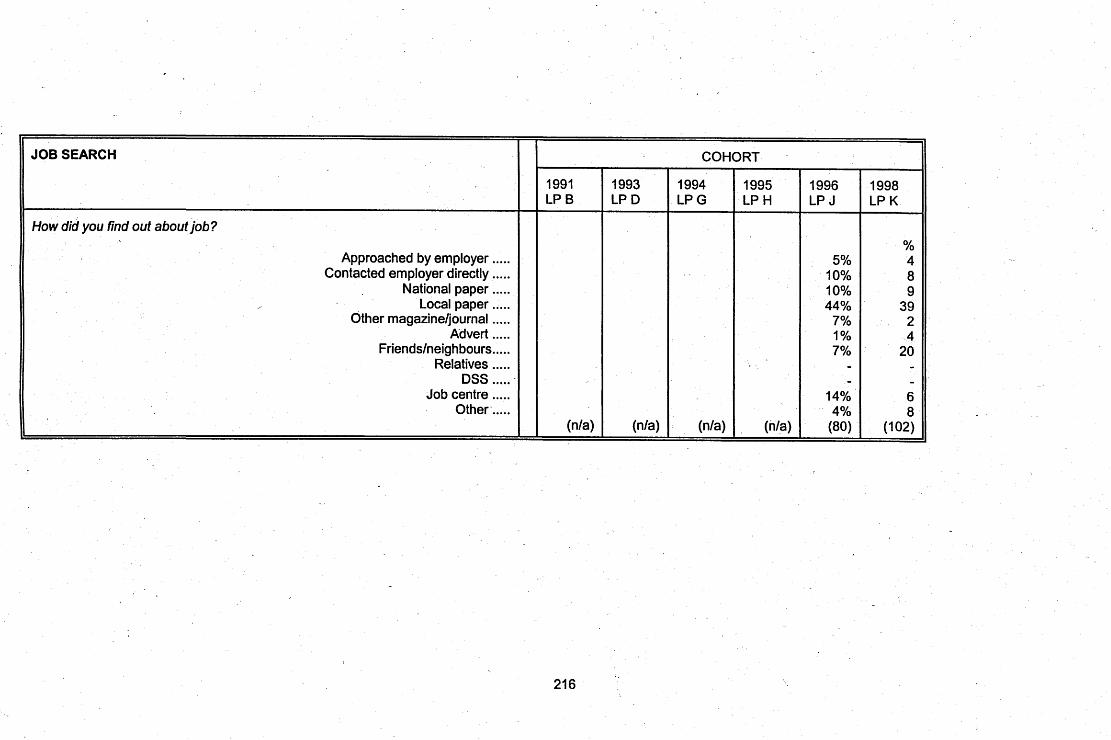

INCENTIVES
[ALL WORKING LESS THAN 16 HOURS OR NOT WORKING AT ALL, WHO MAY LOOK FOR PAlD WORK ONE DAY] How much would you need to be offered in a new job before you felt it worth taking?
How easy or difficult do you think it would be to get a job around here paying that amount a week?
very easy ..... quite easy .....
quite difficult ..... very difficult ..... don't know .....
Do you think in the end you would have to take a job paying less than this? yes ..... no .....
don't know .....
How much do you think you would have to end up accepting?
How many hours each week do you think you would like to work? mean .....
1991 LP B
(n/a)
%
I
(nla)
Yo
(nla)
(n/a)
(nla)
1993 LP D
% , I
7 30. 59 2
(273)
% 65 28 8
(273)
(nla)
COHORT
1994 LPG
% 1 6
26 65 2
(202)
Yo 63 28 9
(202)
28 (259)
1995 LPH
% 2 6
29 55 7
(138)
% 57 29 13
(138)
27 (167)
1996 LPJ
% *
12 36 47
5 (187)
Yo 51 37 I 1
(187)
27 (210)
1998 LPK
% *
9 43 42
5 (144)
Yo 56 30 14
(144)
26 (179)

-
INCENTIVES
(Thinking about the amount you first said would be worthwhile) what kind of security would you be looking for in a new job (paying ...[w orthwhile amount])?
secure for as long as I wanted ..... secure for at least a year .....
-_ secure for at lest six months ..... it could be just a casual job .....
don't know ..... I
And how easy or difficult do you think it would be to get that kind of security in a job paying that much around here?
very easy ..... quite easy .....
quite difficult ..... very difficult ..... don't know .....
COHORT
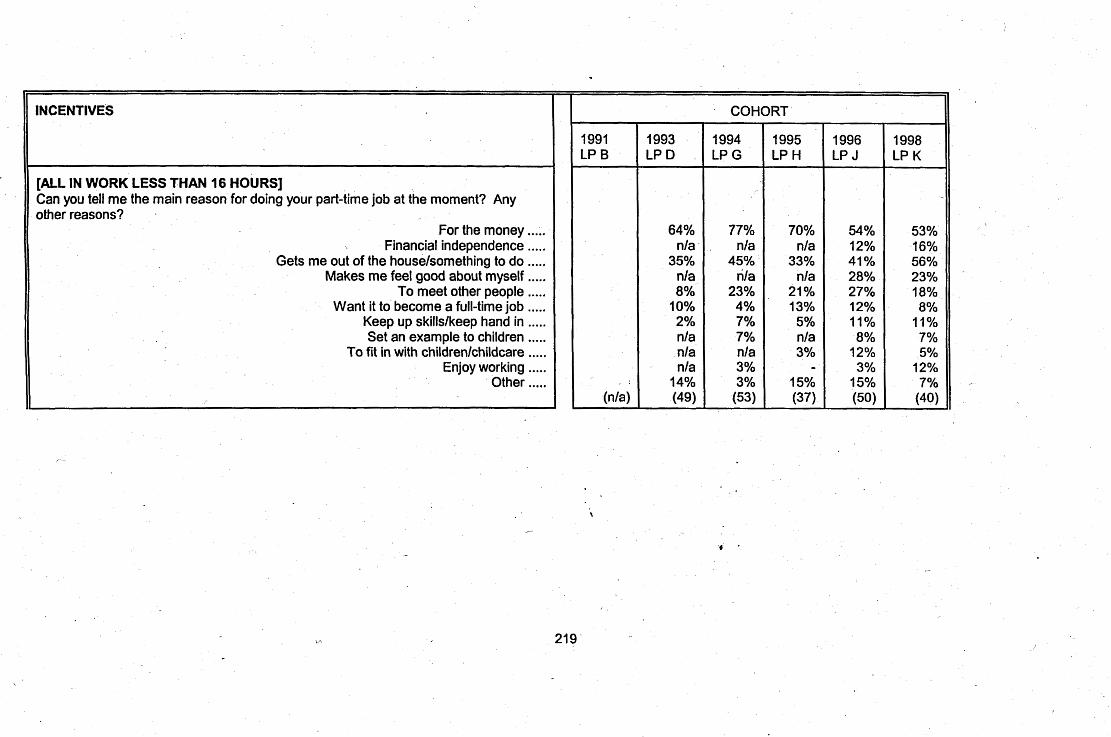
- -
INCENTIVES
[ALL IN WORK LESS THAN 16 HOURS] Can you tell me the main reason for doing your part-time job at the moment? Any other reasons?
For the money ..... Financial independence .....
Gets me out of the house/sornething to do ..... Makes me feel good about myself .....
To meet other people ..... Want it to become a full-time job .....
Keep up skillslkeep hand in ..... Set an example to children .....
To fit in with childrenlchildcare ..... Enjoy working .....
Other .....

INCENTIVES
Is there anything in particular that is stopping you looking for a full-time job at the moment?
Already looking ... .. Cannot afford childcare .....
No childcare available ..... Illness/disability .....
No work available ..... Don't have skills/qualifications .....
Better off not working ..... Don't want to spend time away from children .....
Don't need to ..... To look after kidsltoo young .....
NO reason :.... Other .....
Thinking about the next few months, do you think you will continue your part-time job, get a job working 16+ hours a week, or will you stop working? ,
Continue part-time job ..... Get a job working 16+ hours a week .....
Stop working .....
COHORT 11

INCENTIVES
[NOT WORKING AT ALL] Is there anything in particular which is stopping you looking for a job at the moment?
Already looking ..... Cannot afford childcare .....
No childcare available ..... . lllnessldisability .....
No work available ..... Don't have skills/qualifications ... ..
Better off not working ..... Don't want to leave hornelchildren .....
Don't need to ..... No reason .....
Other .....
Prefer to be at home with the children ..... Partner objects .....
To look after children/childrlen too young ..... To care for sickldisabled child .....
Looking after relative ..... Pregnancy .....
Studying ..... Too old (for some jobs) ..... ,
Don't know .....

INCENTIVES
Do you think you might look for. a job one day? Yes ..... No ... ;.
Don't know .... :
When do you think you might look for a paid job? Looking now ......
In a few weeks ..... In a few months ..... In a year or two .....
Sometime in the future ..... Don't know . . . . .
How many hours a week would you like to work? mean .....
Would you like to get a job as an employee or to work self-employed? Employee .....
Self-employed ..... Either .....
-
1991 LP B
%
(nla)
%
(nla)
(nla)
YO
(nla)
1993 LP D
% 90 8 2
(329)
% 19 2 5
22 50 2
(300)
28 (286)
% 90 10
- (297)
COHORT
1994 LPG
% 80 13 7
(257)
% 14 1 8
24 46 6
(224)
(nla)
% 79 8
13 (224)
1995 LPH
% 76 16 8
(180)
% 5 2 5
29 52 8
(152)
(nla)
% 77 10 13
(152)
1996 LPJ
% 75 21 3
(199)
% 4 *
9 26 55 5
(155)
(nla)
% 72 10 18
(187)
1998 LP K
% 69 27 5
(182)
% 10 3
13 27 43 4
(132)
(nla)
% 84 6
10 (157)


INCENTIVES
Reliable childcare Essential .....
Very important ..... Quite important .....
Not very important .....
Affordable childcare ~ssential .....
Very important ..... Quite important .....
Not very important ..... Children able to care for themselves
Essential ..... Very important .....
Quite important ..... Not very important .....
COHORT
1991 LP B
%
(nla) %
(nla) %
(nla)
1993 LP D
% 48 26 5
21 (793)
% 33 27
9 31
(784) % 14 26 20 40
(784)
1994 LP G
%
(n/a) %
(nla) %
(nla)
1995 LP H
%
(nla) %
(nla) %
(nla)
1996 LP J
%
(nla) %
(nla) %
(nla)
1998 LP K
%
(nla) 740
(nla) 740


I
INCENTIVES
i
Convenient location Essential .....
Very important ..... Quite important .....
Not very important .....
Maintenance Essential .....
Very important ..... Quite important .....
Not very important .....
Qualifications and experience Essential .....
Very important ..... Quite important ..... - Not very important .....
.I
5
226
'
COHORT
1991 LP B
%
(nla) %
(nla) %
(nla)
1993 LP D
% 25 31 28 16
(789) Yo 9
13 12 66
(792) % 17 28 27 28
(793)
1994 LP G
(nla) %
@/a %
(nla)
1995 LP H
% - % -
(nla) %
\
(nla)
(nla)
1996 LP J
%
(nla) %
(nla) % %
(nla)
1998 LP K
%
(nla) %
(nla) '340
(n/a)


I1 INCENTIVES
[ALL]' There is a benefit called Family Credit, which used to be called Family Income Supplement. It is available to families with children, if one adult works more than 16 hours, to top up wages. [I 995, JOB I ONLY] Let's say you found a job, paying f 130 per week, in take-home money, for a 30 hour week, and that you continued to receive maintenance and all the benems you now receive for which entitlement continues while in work.
I [I 996198 JOB I ] Unskilled job at f 1 12h 17 per week for a 30 hour week. [I996198 JOB 21 Skilled job with training offered at £220/230 ,while training, £250/260 after training, for a 30 hour week. Do you think that .... you would have to pay for childcare in order to take the job? [JOB I ]
I Yes ..... No .....
Don't know ..... [JOB 21
Yes ..... No .....
Don't know .....
COHORT
'Only asked of respondents not working 16+ hours, who would apply for job described, with children in 1996, 1998
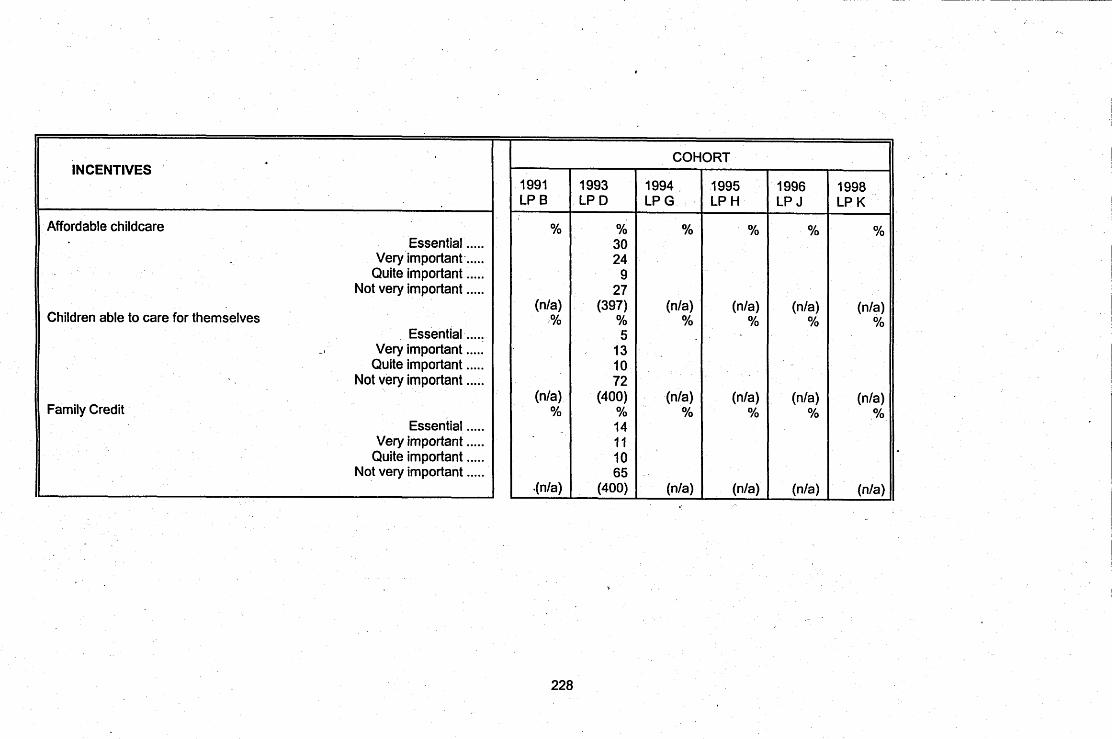

INCENTIVES
Maintenance Essential .....
Very important ..... Quite important .....
Not very important ..... Qualifications and experience
Essential ..... Very important :....
Quite important ..... Not very important .....
[ALL WORKING 16 OR MORE HOURS A WEEK (OR WHO WILL ONE DAY LOOK FOR A JOB)] Suppose you were looking for a (different) job of 16 or more hours a week. How much money would you need to be offered in a new job before you felt it worth taking?
How easy or difficult do you think it would be to get a job around here paying that amount?
very easy ..... quite easy .....
quite difficult ..... very difficult ..... (don't know) .....
,
230
1991 LP B
%
(nla) %
(nla)
(nla)
%
(nla)
1993 LP D
% 9 9 8
75 (397)
% 14 27 23 35
(401)
% 1 8
31 59 1
(393)
COHORT
1994 LP G
%
(nla) %
. (nla)
% I
12 34 49 4
(323)
1995 LP H
%
(nla) %
(nla)
% *
14 37 47 2
(306)
1996 LP J
%
(nla) %
(nla)
% 2
13 41 43 2
(339)

INCENTIVES
And if looking for a secure job, how easy or difficult do you think it would be to get that kind of security in a job paying that much, around here?
very easy ..... quite easy .....
. ' quite difficult ..... very difficult .....
(Don't know) .....
So, may ljust check, are you actively looking for a newjob at the moment, or are you more or less settled as you are?
actively looking'for new job ..... settled .....
C
COHORT
1991 LP B
%
(nla)
%
(nla)
1993 LP D
YO I
12 33 54
(406)
% 18 82
(425)
1994 LP G
YO 1
14 32 46 7
(353)
% 12 88
(370)
1995 LP H
YO 1
16 35 45 4
(336)
% 14 86
(348)
1996 LP J
?40 2
16 34 46 2
. (369)
% 10 90
(392)
1998 LP K
% 2
19 37 34 6
(407)
% 10 90
(424)

I
INCENTIVES
and if yes, how much would you have to pay e a ~ h ~ w e e k for childcare?
[JOB I] mean .....
[JOB 21 . - mean .....
Do you think that .... [JOB I ]
you would definitely be entitled to Family Credit ..... you would definitely NOT be entitled to Family Credit .....
not sure ..... [JOB 21
you would definitely be entitled to Family Credit ..... you would definitely NOT be entitled to Family Credit .....
not sure .....
you would definitelv be entitled to Family credit ..... you might be entitled to Family Credtit but might not .....
you would definitely NOT be entitled to Family Credit ..... not sure .....
'
I
1991 LP B
(n/a)
(nla)
%
(nla) %
. ,
(n/a) %
(nla)
1993 LP D
(nla)
(nla)
%
(nla) yo
(nla) % 29 25 22 24
(769)
1994 LP G
(nla)
(nla)
%
(nla) %
(n/a) % 34 23 20 23
(670)
COHORT
1995 LP H
f 51 (128)
(nla)
% 36 27 37
(591) %
(nla) %
(nla)
1996 LP J
f 54 (9)
, £47 (27)
% 47 22 31
(54) % 17 53 30
(104) - %
(nla)
1998 ,
LP K
£58 (12)
£ 40 (23)
% 44 23 34
. (38) Yo 21 46
'
32 (77)
%
(nla)

,--
INCENTIVES
Taking everything together, what do you think is the most likely thing to happen to you over the next couple of years?
working 16 or more hours ..... working less than 16 hours .....
not working ..... don't know .....
AND claiming Family Credit .....
not claiming Family Credit ..... don't know .....
COHORT
1991 LP B
Yo
(nla)
%
(nla)
1993 LP D
Yo 42 25 27 6
(789)
% 35 53 12
( 7 5 1 )
1994 LP G
Yo 59 9
24 8
(682)
% - 31 57 12
(612)
1995 LP H
Yo 58 9 27 6
(591)
% 25 63 12
(
1996 LP J
Yo 64 7
24 5
(672)
% 31 60
9
1998 LP K
Yo 69 7
20 5
(668)
% 26 64
- 10


FAMILY HISTORY
.... Did you grow up mainly in a home that your parents ? ..... Owned or were buying
Rented from the council or housing association ..... Rented privately .....
..... Other
COHORT
1991 LP 6
%
(nla)
1993 LP D
% 41 51 8
nla (769)
1994 LP G
%
(nla)
. 1995 LP H
(nla)
1996 LPJ
% / % 37 58 5
nla (63)
1998 LPK
yo 27 66
1 6
(32)

WHAT DO YOU THINK
All things considered, how happy are you? Very happy .... .
Fairly happy ..... Not very happy ..... Not at all happy .....
Which of these two statements is most true of you? I
I never really seem to get what I want out of life ..... I usually get what I want out of life .....
Which of these two statements is most true of you?
I usually have free choice and control over my life ..... Whatever I do has no real effect on what happens to me .....
Which of these two statements is most true of you?
Usually I can run my life more or less as I want to ..... I usually find life's problems just too much for me .....
1991 LP B
%
(nla)
%
(nla)
%
(nla)
-. %
(nla)
1993 LP D
%
(nla)
%
(nla)
%
(nla)
%
(nla)
1994 LPG
% 23 62 13 I
(654)
% 56 44
(644)
% 74 26
(651)
% 84 16
(649)
COHORT
1995 LPH
% 28 64 7 2
(585)
% 47 53
(578)
% 78 22
(582)
% 87 13
(582)
1996 LPJ
% 25 63 10 2
(644)
% 42 58
(641)
% 81 19
(640)
% 85 15
(638)
1998 LP K
% 26 62 10 2
(642)
% 39 61
(637).
% 79 . 21
(638)
% 83 17
(634)

WHAT DO YOU THINK
Below are a number of statements which people sometimes make about themselves. Please read each statement and tick the box which indicates how much you agree or disagree with what is said.
On the whole I am satisfied with myself Strongly agree .....
Agree ..... Disagree .....
Strongly disagree .....
At times I think I am no good at all Strongly agree .....
Agree ..... Disagree .....
Strongly disagree .....
I feel that I have a number of good qualities Strongly agree .....
Agree ..... Disagree .....
Strongly disagree ..... t
1991 LP B
%
(nla)
%
(nla)
%
(nla)
1993 LP D
%
(nla)
%
(nla)
%
(nla)
COHORT
1994 LPG
% 11 70 18 1
(646)
YO 4
3 1 45 20
(641)
% 19 73 8 1
(645)
1995 LPH
% 13 73 13 1
(581)
O/O
6 27 45 23
(579)
% 24 71 5 1
(581)
1996 LPJ
% 12 70 18 1
(642)
O h
4 28 45 22
(635)
% 21 75 3 1
(640)
1998 LP K
% 13 72 13 2
(639)
O h
3 26 49 22
(635)
% 22 72 5 1
(636)


WHAT DO YOU THINK
I I wish I could have more respect for myself I Strongly agree .....
Agree ..... Disagree .....
Strongly disagree .....
All in all, I am inclined to feel that I am a failure Strongly agree .....
Agree ..... Disagree . . . . .
Strongly disagree .....
I take a positive attitude to myself Strongly agree .....
Agree ..... Disagree .....
Strongly disagree .....
COHORT
' (nla)
1995 1996 L P H . LPJ
% % 8 5
23 27 49 48 20 20
(583) (642)
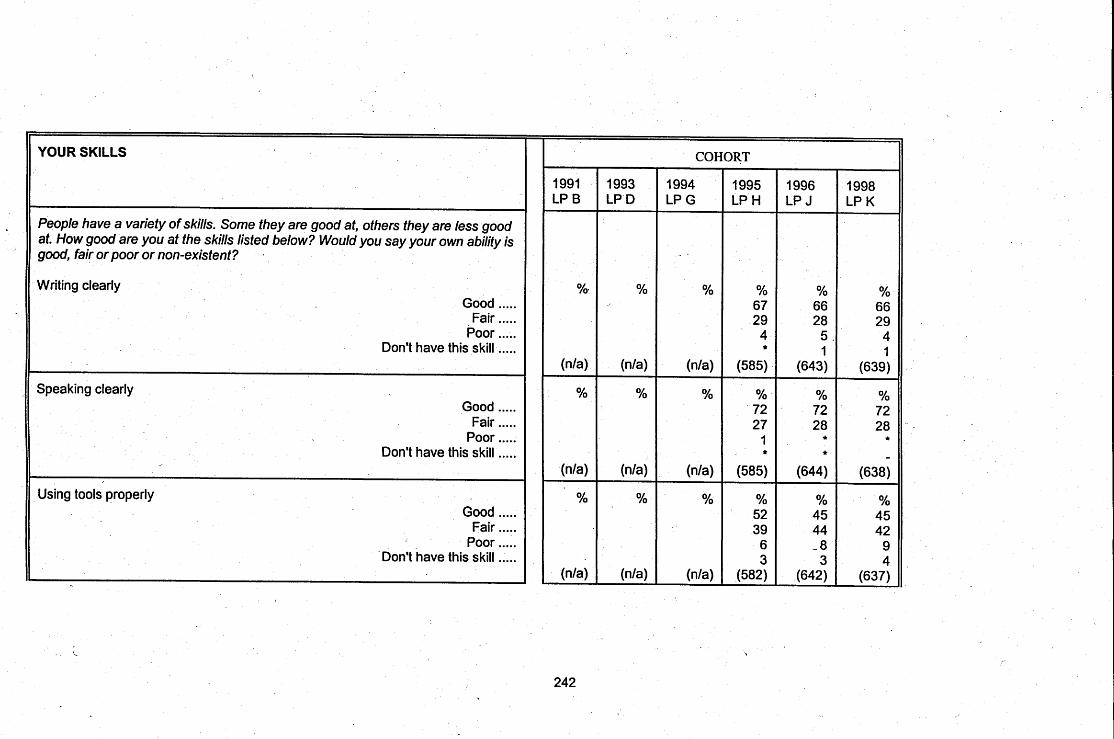


.
245 .
YOUR SKILLS ' .
Supervising other people's work or activities Good .....
Fair ..... Poor .....
Don't have this skill .....
Filing papers, telephoning or other clerical skills Good .....
Fair ..... , Poor .....
Don't have this skill .....
Carrying out mathematical calculations Good .....
Fair ..... Poor .....
Don't have this skill .....
1991 LP B
%
(nla)
YO
(n1a)-
%
(nla)
1993 LP D
%
(nla)
%
(nla)
%
(nla)
COHORT
1994 LPG
%
(nla)
%
(nla)
%
(nla)
1995 LPH
% 29 41 I 0 20
(582)
%
(nla)
% 24 42 23 11
(582)
1996 LPJ
% 32 41 10 19
(640)
% 41 24 12 23
(642)
% 26 40 25 10
(643)
1998 LPK
% 34 37 9
21 (640)
% 41 25 9
24 (639)
Yo 25 43 19 12
(639)


SELF-COMPLETION - YOUR VIEWS
Social security benefits should take into account what you have to pay out Strongly agree
Agree Uncertain Disagree
Strongly disagree
I'd do almost anything to avoid getting into debt Strongly agree
Agree Uncertain Disagree
Strongly disagree
If their child is ill, and both parents work, the mother should take time off work Strongly agree
Agree Uncertain
' - Disagree strongly disagree
248
1991 LP B
%> 39 48 6 4 2
(928)
% 40 41
9 8 2
(931
% 23 40
8 21 7
(930)
1993 LP D
%
. .
(nla)
%
(nla)
%
(nla)
COHORT
1994 LP G
%
(nla)
%*
(nla)
, % i
(nla)
1995 LPH
%
(nla)
yo
(nla) .
%
(nla)
1996 LPJ
% 40 47
8 4 2
(641 )
% 35 43 10 10 2
(643)
% 17 31 15 30 7
(644)
1998 LP K
% 35 49
7 6 2
(637)
yo .. 28
46 11 14 1
(640)
Yo 17 29 16 30 8
(638)

r
249
.
.
SELF-COMPLETION - YOUR VIEWS
My job is to look after the home and family Strongly agree
Agree Uncertain Disagree
Strongly disagree
Every family, in or out of work, should be guaranteed a decent standard of living Strongly agree
Agree Uncertain Disagree
Strongly disagree
Having almost any job is better than being unemployed Strongly agree
Agree Uncertain Disagree
Strongly disagree
--
1991 LP B
%
(nla)
YO 47 42 7 2 1
(941 )
% 16 38 19 22 4
(94 1
1993 LP D
Yo
(nla)
%
(nla)
%
nla
COHORT
1994 LP G
%
(nla)
%
(nla)
%
nla
1995 LPH
%
(nla)
%
(nla)
%
nla
1996 LPJ
% 16 40 13 23 - 9
(640)
, % 50 44 4 2 1
. (642
Yo 11 35
0 . - 644
1998 LP K
Yo 13 43 10 30 4
(635)
Yo 45 46 6 2 1
(689)
Yo 9
35
638

\
SELF-COMPLETION - YOUR VIEWS
It is less important for a woman to go out to work than it is for a man Strongly agree
Agree Uncertain Disagree
-Strongly disagree
If i didn't like a job, I'd pack it in, even if there was no other job to go to Strongly agree
Agree Uncertain Disagree
Strongly disagree ) . '
No-one should ever feel badly about claimimg Social Security benefits 5 . Strongly agree
. . .. Agree . Uncertain
Disagree Strongly disagree
/
250
,
.
1991 LP B
% 5
17 14 42 22
(926)
% 4
10 23 47 16
(926)
% 33 58 5 3 1
(925)
1
1993 - LP D
%
(n/a)
%
(n/a)
% .
(nla)
COHORT
1994 LP G
%
(nla)
%
(nla)
%
(nla)
1995 LPH
%
(nla)
%
(nla)
%
(nla)
1996 LPJ
% 5
16 11 47 21
(641)
% 4
12 23 48 13
(643)
% 37 55 4 4 t
(644)
1998 LP K
% 5
14 13 49 19
(639)
% 3
14 24 45 13
(637)
Oh 31 58 6 4 *
(639)

SELF-COMPLETION - YOUR VIEWS
I cannot do a full-time job without damaging my family life Strongly agree
Agree Uncertain Disagree
Strongly disagree
People living on Social Security benefits are not really part of society Strongly agree
Agree Uncertain Disagree
Strongly disagree
Women with school-aged children should never work full-time Strongly agree
Agree Uncertain Disagree
Strongly disagree
1991 LP B
%
(nla)
% 2 5 7
49 36
(925)
% 6
15 14 48 17
(918)
'3993 LP D
%
(nla)
%
(nla)
%
(nla)
COHORT
1994 LP G
Yo
(nla)
%
(nla)
%
(nla)
1995 LPH
%
/
(nla)
%
(nla)
%
(nla)
1996 LPJ
% 15 27 19 29 10
(639)
% 3 3 6
48 40
(645)
Oh 5
14 16 45 20
(641)
1998 LPK
Yo 14 29 15 34 8
(636)
% 3 3 5
55 35
(639)
Yo
6 14 20 48 11
(638)

SELF-COMPLETION - YOUR VIEWS
11 There is never any point in worrying about debts -. Strongly agree
Agree Uncertain Disagree
Strongly disagree
Working for pay is more fulfililng than looking after the home Strongly agree
Agree Uncertain Disagree
Strongly disagree


(
. . SELF-COMPLETION - YOUR VIEWS
Once you've got a job, it's important to hang onto it, even if you don't really like it . I l Strongly agree -
Agree Uncertain Disagree
Strongly disagree
If you live on social security benefits, everyone looks down on you Strongly agree
Agree Uncertain Disagree
Strongly disagree
People with mortgages should not get social security benefits Strongly agree
Agree Uncertain Disagree
Strongly disagree
253
.
1991 LP B
% 10 39 25 23 3
(941
%- 6
21 22 42 9
(941
% 3 8
23 52 14
(91 8)
1993 LP D -
%
(nla)
%
(n/a)
%
(nla)
COHORT
1994 LP G
%
(nla)
%
(nla)
%
(nla)
1995 LPH
%
(nla)
%
(nla)
yo
(nla)
1996 LPJ
% 6
38 24 30 3
(643)
% 8
32 16 39 5
(644)
% 4 5
26 50 15
(644)
1998 LPK
Yo 5
37 22 33 3
- (639)
% 6
28 17 42 6
(639)
yo 3 6
26 50 15
(637)

-
SELF-COMPLETION - YOUR VIEWS
A job is alright but I really want to be with my children at home Strongly agree
Agiee Uncertain Disagree
Strongly disagree
Women have a right to choose to be supported by the state at home with their children, even if they have no husband or partner
Strongly agree Agree
Uncertain Disagree
Strongly disagree
If you live on social security, you have to try to hide it from the rest of the family Strongly agree
Agree Uncedain Disagree
Strongly disagree
3
254
I
1991 LP B
%
(nla)
% 19 52 21
6 2
(941 )
% 2 2 4 63 27
(923
1993 LP D
%
(n/a)
%
(nla)
%
-
(nla)
COHORT
1994 LP G
%
(nla)
94
(nla)
%
(nla)
1995 LP H
%
(nla)
%
(nla)
%
(nla)
1996 LP J
% 9
32 24 32 3
(636)
% 16 44 25 12 3
(643)
% 2 2 5
64 27
(641)
1998 LP K
% 9
32 22 33 4
(634)
yo 16 44 20 16 3
(637)
% 1
2 4
70 22
(635)

SELF-COMPLETION 0 YOUR VIEWS
Having a job is the best way for me to be an independent person Strongly agree
- Agree Uncertain Disagree
Strongly disagree
COHC
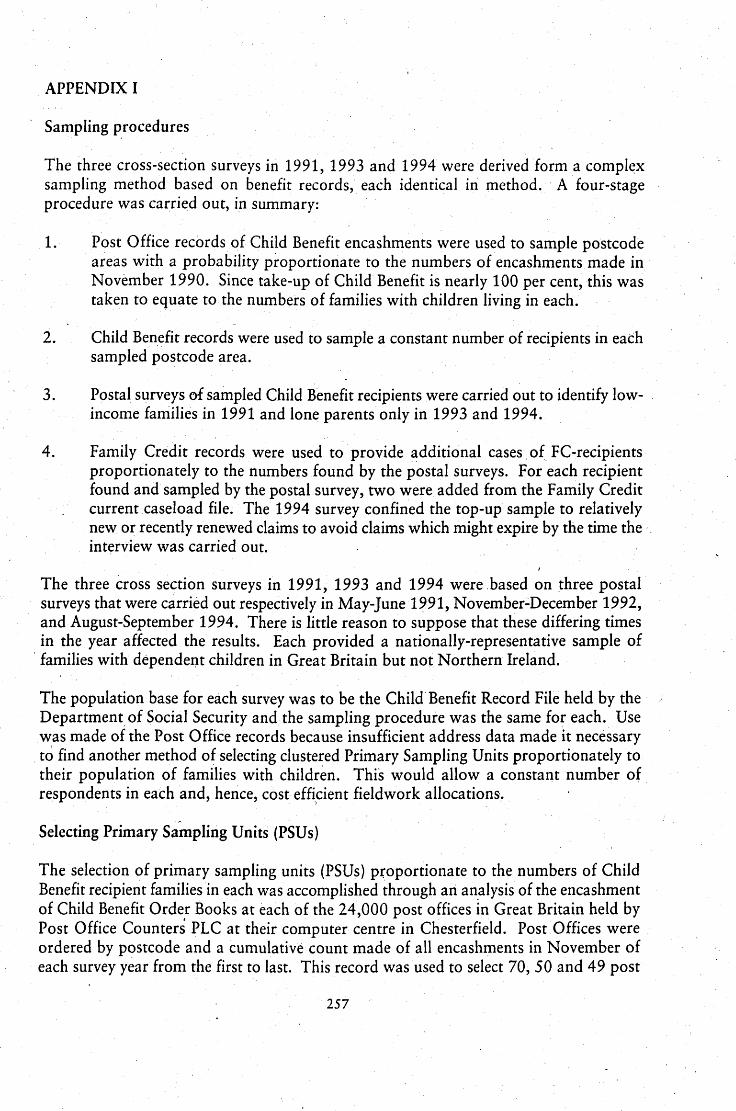
APPENDIX I
Sampling procedures
The three cross-section surveys in 1991, 1993 and 1994 were derived form a complex sampling method based on benefit records, each identical in method. A four-stage procedure was carried out, in summary:
1. Post Office records of Child Benefit encashments were used to sample postcode areas with a probability proportionate to the numbers of encashments made in November 1990. Since take-up of Child Benefit is nearly 100 per cent, this was taken to equate to the numbers of families with children living in each.
2 . Child Benefit records were used to sample a constant number of recipients in each sampled postcode area.
3. Postal surveys of sampled Child Benefit recipients were carried out to identify low- income families in 1991 and lone parents only in 1993 and 1994.
4. Family Credit records were used to provide additional cases of FC-recipients proportionately to the numbers found by the postal surveys. For each recipient found and sampled by the postal survey, two were added from the Family Credit current caseload file. The 1994 survey confined the top-up sample to relatively new or recently renewed claims to avoid claims which might expire by the time the , interview was carried out.
The three cross section surveys in 1991, 1993 and 1994 were based on three postal surveys that were carried out respectively in May-June 1991, November-December 1992, and August-September 1994. There is little reason to suppose that these differing times in the year affected the results. Each provided a nationally-representative sample of
' families with dependent children in Great Britain but not Northern Ireland.
The population base for each survey was to be the Child Benefit Record File held by the Department, of Social Security and the sampling procedure was the same for each. Use was made of the Post Office records because insufficient address data made it necessary to find another method of selecting clustered Primary Sampling Units proportionately to their population of families with children. This would allow a constant number of respondents in each and, hence, cost efficient fieldwork allocations.
Selecting Primary Sampling Units (PSUs)
The selection of primary sampling units (PSUs) proportionate to the numbers of Child Benefit recipient families in each was accomplished through an analysis of the encashment of Child Benefit Order Books at each of the 24,000 post offices in Great Britain held by Post Office counter; PLC at their computer centre in Chesterfield. Post Offices were ordered by postcode and a cumulative count made of all encashments in November of each survey year from the first to last. This record was used to select 70, 50 and 49 post
257

offices respectively at a constant sampling interval (n encashments divided by 70, 50 and 49 successively) from a random starting point in the file. The postcode of the post office' of each selection selected the other post offices sharing the same postcode area - ie the first part of the postcode. This provided the DSS with the appropriate PSUs in whcih to select a constant number of recipients in each postcode group from their own records using not the postcode themselves but the post offices' unique sorting codes common to both the encashment record and the benefit record.
The Post Office/DSS link was needed because in 1991 the Child Benefit Record contained only about 60 per cent valid postcodes. Older records lacked postcodes, introducing systematic bias in the ages of families. The link was accomplished through the identification number of the Post Office where encashment was elected for each record. The differential proportions of Account Credit Transfer records to Order Books, averaging just over a fifth, and the differing ratio of four-weekly to one-weekly order books, were each allowed to vary within each PSU.
Finding the Eligible Families
Table 1 below summarises the sample design and response rates for each survey:
Table 1 The Three National Samples
Postcodes selected as primary sampling + 70 50 49 units
Questionnaires mailed to valid addresses
Usea ble responses ' 9,095 6,302 6,204
Response rate 64 % 75 % 7 1 %
The sample design
The main design problem was to identify a population of families who were 'within range' of family credit. By 'family' was meant: a coresidential household of one or more adults and one or more dependent children aged 16 or younger, or aged 17 or 18 and remaining in full-time education or equivalent. By 'within range of Family Credit' was meant four groups of families:
1. PRESENT RECIPIENTS: families who were currently receivinglclaiming family credit.
2. ELIGIBLE NON-CLAIMANTS: families who should be claiming but were not.

3. NON-WORKING FAMILIES: families who, though without full-time work, might L well be expected to claim family credit within the foreseeable future, as they
entered full-time work.
4. HIGHER INCOME FAMILIES: families who earn a little more than the level that would entitle them to claim family credit but for whom a change of circumstances, a new child, or the loss of regular overtime payments, for examples, would bring them within scope of eligibility. The cut-off point chosen in the income range was 25 per cent above the point at which the families' entitlement to Family Credit extinguished.
These four groups were the main target cells for the sample design. Useable numbers were required for each. In 1991, these were required separately for couples and lone parents. Differential sampling fractions were introduced to under-sample out-of-work lone parents, who are a very large fraction among low income families.
In 1991, these were the achieved interviews in each of the eight target cells of the sample design:
Eligible Non FC Moderate Out of FT Claimants , Claimants income work
Lone parents
Couples 157 496 416 239
Rather more families ended up in the moderate income group than expected. Since the ' take-up rate among eligible families turned out to be higher than the design assumption of 50 per cent. A few moe transferred to themoderate income group became they had substantial savings $which disqualified them from Family Credit. When the numbers above are re-weighted to reflect their true position, relative to one another, this is how the eight groups appeared in the population of low income families.
\
Eligible Non FC Claimants Reci~ients
Moderate Out of FT income work
Lone parents 2% 5 % 3% 38% I Couples 6% 8% 20% 18%
The 1994 Sample of Lone Parents .
As for the earlier PRILIF surveys, the first stage was a postal screening survey carried out in August-September 1994 of a nationally-representative sample of families with dependent children in Great Britain but not Northern Ireland.
The population base for eacb survey was the Child Benefit Record File held by the Department of Social Security. The selection of 49 primary sampling units (PSUs) proportionate to the numbers-of Child Benefit recipient families in each was accomplished through an analysis of the encashmrnt of Child Benefit Order Books at each of the 24,000 post offices in Great Britain held by Post Office Counters PLC.
j
A representative sample of 8,738 valid addresses was mailed a questionnaire to identify lone parents and their circumstances. 6024 useable responses were received (71 per cent), 1302 of them (21 per cent) came from respondents answering 'No' to the question:
'Do you have a partner who normally lives with you?' (We use partner to mean someone you are married to or live with as a couple)
If Haskey's estimate of Britain's lone parent population is correct at about 1.42 million out of a total of 6.67 families then this sample of 21 per cent is also correct. , -)
From the sample of 1302 lone parents obtained from the postal sift, it is worth noting the numbers interviewed (Table 2).
A random sample of 851 lone parents would find about 130 Family Credit recipients. Though properly re-weighted in all these analyses, having 395 of them in the sample gave considerable scope to examine in great detail some of the connections between benefits, earnings and maintenance that were of greatest interest.
,'
The Lone Parent Cohort
The 941 respondents to the 1991 survey of lone parents were approached for new interviews in 1993, 1994 and 1995. These follow-up surveys successfully interviewed 85%, 73 % and then 63 % of the 1991 respondents, respectively (Table 3).
e
8

<
Table 2 The 1794 sample of Lone Parents. ~ n w e i ~ h t e d numbers.intervicwed and weighted cell sizes by work and benefit status
I WORKING ......................................................... OUT
OF 24 HRS 16-23 HRS 1-15 HRS WORK A WEEK A WEEK A WEEK
UNWEIGHTED NUMBERS
FC recipients .... eligible for FC 164 176
ineligible for FC 5 3 9 24
uncertain
eligible for FC 31
ineligible for FC
8 5 uncertain \
WEIGHTED CELL SIZES
FC recipients ... eligible )for FC 52 59
ineligible for FC 2 2 3 - 12
uncertain 2 . Z Non-recipients
eligible for FC 25 9
ineligible for FC
uncertain
Table 3 The Lone Parent Cohort: first, second, third and fourth wave 'respondents
1991 1993 1994 1995
weighted n= 988 842 72 8 623
unweighted n= 94 1 803 684 596
response rate 85% 73 % 63%

The 1994 'flow' sample of families leaving Family Credit
Family Credit Branch in DSS North Fyle constructed a file of all families whose Family Credit award terminated between, and including, 30th August 1993 and 1st October 1993, and who had not successfully renewed that claim by 3rd January 1994.
All cases were grouped by District Office, then District Offices with fewer than 80 leavers were discarded to avoid 'problem areas' liable to yield inefficiently small numbers of cases for interview. We discarded 25 out of 500. They contained fewer than 3 per cent of Family Credit recipients.
i
District Offices were stratified according to one of five area codes (south East, Scotland, Wales/North EastIMidlands, the North and the South). 40 PSUs were randomly selected with a constant sampling interval of the total number of leavers divided by 40. Each PSU's probability of selectionthen became proportionate to their size in terms of the numbers of leavers they contained, enabling the same number of cases to be sampled within each: 40. I
The District Offices were re-grouped according to their area code. Then the order of cases within each PSU was randomised and the first 80 (not 40) cases in each PSU selected. This produced an average of 10 self-employed per PSU - 400 throughout the 40 PSUs, which was sufficient. However, it yielded 2,800 employees when we actually needed about 1,200. Therefore a random sample of employees were selected using the appropriate sampling fraction (0.43). In this way we expected to obtain a random sample of 1,600 leavers containing twice as many self-employed families as would normally be encountered. However, hidden shortfalls in the numbers of leavers in some areas resulted in a lowered total yield of 1,372 families, despite our precaution of eliminating areas formerly identified as small.
This sampling strategy resulted in 1,372 addresses being issued to NOP's interviewers in Spring 1994. At this point we obtained our first finding. Rather larger numbers than we expected had returned to Family Credit since January 1994: 6 per cent of them. A smilar number (88 families) had moved. home, were unavailable or opted out (Table 4)
The initial letter requesting those sampled to participate in the survey and offering them the opportunity to 'opt out' if they so wished went out a t the end of January 1994, and was followed by two reminder letters. The interviews were conducted between late March and June 1994. We achieved a response rate of 82.9.per cent (Table 4), exceeding our original expectations. Table 5 provides basic information on the number of lone parents, couplei, self-employed and employed Family Credit job holders before and after weighting.

Table 4: Addresses issued, reasons for dropping, and final response rate
Number of addresses issued
Addresses disposed of:
Moved
No trace of address
Opted out to DSS
Back on Family Credit
Awa ylill
Base for response rate
Total number of respondents
Refusals
'Other' 28 I
Response rate 82.9%
1
Table 5: Achieved sample
SE in FC job Emp. In FC job LP at interview Couple a t int.
Weighted N 136 866 302 700
Unw'ted N 240 762 289 713
Interviewers were briefed to treat the FamilyCredit recipient as the main respondent. This is virtually always the woman in a couple, almost all of the male main respondents being lone parents. Interviewers were briefed to interview any current partner but, if the Family Credit job had been undertaken by a previous partner, they were asked to get information on this job from the main respondent. In the event, 695 partner interviews were completed, of which 232 were proxy interviews with the main respondent. Thirty-three of the proxy interviews were for ex-partners who had held the Family Credit job.

APPENDIX I1 I J
Technical note for dataset users - Location of data, weightings used and weightedhnweighted bases, (see diagram A).
diagram
1. Postal sift, 1991 (A) cd /home2/LONE/sifts File: A.der no weight
couples lone parents nu=7048 n,=2117
Interview follow-up of low income families, 1991 (B) cd /home2/LONE/B File: DSSFWB.EXP1 Weighted by Weight4
couples lone parents i
nw=1099 n,=1003 n,=1250 nu=852
'2a. Addition of 105 higher income lone parents to 2, 1991 (B') cd /home2/LONE/H File: BDGHl .comp Weighted by @alt-wtl Selected if RESP ge 0
nw=988 n,=941
3. Postal follow-up of 2a's lone parents, 1992 (C) cd /home2/LONE/H File: BDGH 1 .comp no weight
nu=676
4. Postal sift, 1992 (2) cd Ihome2/LONElsifts File: Z.der no weight
264 - I

couples lone parents n,=4959 n,=1402
' 5 . Interview follow-up to 2a's lone parents, 1993 (D) cd /home2/LONE/H File: BDGHl .comp Weighted by @ah-wt 1 Selected if RESP ge 1
n,,,=844 n,=804
6 . Interview follow-up to 4's lone parents, 1993 (Y) cd /home2/LONE/X File: Y.save weighted by weight1
[7. Qualitative interview follow-up of 2's ENCis, 1993 (E)]
8. Interview follow-up of 2's very low income couples 1993 (F) cd /home2/LONE/F i
File: BFTEMP4 .save no weight
[8a. Interview follow-up of 2's ENC's, 1993 (F)] .
9. Postal fbllow-up of 6's lone parents, 1993 (X) cd /home2/LONE/X File: X.save no weight
I
'10. Interview follow-up of 2a's lone parents, 1994 (G) cd /home2/LONE/H File: BDGHl .comp
' Weighted by @ah-wtl Selected if RESP ge 2
nw=73 1 n,=686

11. Postal sift, 1994 (U) cd /home2/LONE/sifts File: Unew.der no weight
couples lone parents n,=4932 n,=1310
12. Interview follow-up of 11's lone parents, 1994 (T) cd /home2/LONE/T
-1 Unweighted file: T.comp Weighted file: T.wt,
nw=927 n,=888
13. Exits from Family Credit (EXITS) cd /home2/.LONE/EXITS File: all.sps
\ Weighted by WEIGHT
couples lone parents nw=700 .nw=302
14. Interview follow-up of 2a's lone parents, 1995 (H) cd lhome21LONEIH File: BDGH 1 .comp . Weighted by @alt-wtl Selected if RESP eq 4
* One respondent is not a cohort member and has been removed. Select 'if not missing . EMPl.
-

NOTATION
[ ] Denotes filter
% 56 144 Column weighted marginal distribution
(765) Unweighted base.
23 % 49% Percentage of weighted cases (multiple response)
(822) Unweighted base
- nonelemp ty cell
* cell less than 0.5 %
n/a not applicable/question not asked I