the private equity 3q 2012 breakdown -...
TRANSCRIPT

PitchBookThe Private Equity 3Q 2012 Breakdown
Bet ter Data. Bet ter Decisions.PitchBook
Presented by
3

The Private Equity 3Q 2012 Breakdown [email protected]
[ 1 ]
The PitchBook AdvantageBetter Data. Better Decisions.
Private Equity Deal Flow ..................................................... 3
Transactions by Region and Industry .................................... 4
Investment by Deal Size ................................................... 5
Add-on Activity ............................................................... 6
Fundraising and Largest Funds Closed ............................ 8
Exits by Industry and Strategy ......................................... 9
League Tables ................................................................ 11
PitchBook Methodology ................................................ 13
About PitchBook ........................................................... 15
COPYRIGHT © 2012 by PitchBook Data, Inc. All rights reserved. No part of this publication may be reproduced in any form or by any means – graphic,
electronic, or mechanical, including photocopying, recording, taping, and information storage and retrieval systems – without the express written permission
of PitchBook Data, Inc. Contents are based on information from sources believed to be reliable, but accuracy and completeness cannot be guaranteed.
Nothing herein should be construed as any past, current or future recommendation to buy or sell any security or an offer to sell, or a solicitation of an offer to
buy any security. This material does not purport to contain all of the information that a prospective investor may wish to consider and is not to be relied upon
as such or used in substitution for the exercise of independent judgment.
Table of Contents

The Private Equity 3Q 2012 Breakdown [email protected]
[ 2 ]
The PitchBook AdvantageBetter Data. Better Decisions.
Merrill DataSite is a secure virtual data room (VDR) solution that optimizes the due diligence process by providing a highly efficient and secure method for sharing key business information between multiple parties. Merrill DataSite provides unlimited access for users worldwide, real-time activity reports, site-wide search, enhanced communications through Q&A and superior project management service - all of which reduce transaction time and expense. Merrill DataSite’s multilingual support staff is available around the world, 24/7, and can have your VDR up and running with thousands of pages loaded within 24 hours or less.
With deep roots in transaction and compliance services, Merrill Corporation has a cultural, organization-wide discipline in the management and processing of confidential content. Merrill DataSite is the first VDR provider to understand customer and industry needs by earning an ISO/IEC 27001:2005 certificate of registration – the highest standard for information security – and is currently the world’s only VDR certified for operations in the United States, Europe and Asia.
As the leading provider of VDR solutions, Merrill DataSite has empowered nearly 2 million unique visitors to perform electronic due diligence on thousands of transactions totaling trillions of dollars in asset value. Learn more by visiting www.datasite.com today.
Private Equity ActivityDespite the lackluster numbers posted in 1Q, many private equity (PE) professionals maintained an air of optimism for the PE landscape through the rest of 2012. It had appeared the U.S. may finally be primed for a full-fledged recovery and the predicament in Europe may have passed the breaking point. That rosy reality has failed to materialize, however, and all of a sudden the outlook seems much more gloomy. High levels of uncertainty pertaining to taxation, regulation, and the impending presidential election continue to hold back investing activity in the United States. The Supreme Court’s ruling on the Affordable Care Act clears up the picture for some industries, but the battle is far from over on that front as well. In addition, the euro zone crisis continues to send shockwaves through markets around the world, especially the debt markets that are so integral to PE investing.
“For all of the headwinds facing PE and the economy at large, two irrefutable forces will continue to compel PE firms to action: the more than $430 billion in dry powder reserves and the more than 6,300 companies currently in portfolios,” says Richard A. Martin, Jr., Senior Director at Merrill DataSite. “Regardless of the macroeconomic environment, PE firms will have to act in order to exit longstanding investments and deploy capital before their investing window closes.”
Inside this report, PitchBook examines PE activity in 2Q and throughout the first half of 2012, analyzing deal flow, exit activity, and fundraising. Here are some of the highlights from the analysis:
→ Deal volume fell by 17% in 2Q 2012 compared to the previous quarter and has been in a
steady downward trend for more than a year. → The $51 billion invested during 2Q was the lowest for any individual quarter since 2009. → PE firms have demonstrated an increased focus on B2B, IT, and Healthcare investing. → Both exit volume and capital exited plummeted in 2Q 2012, declining by 16% and 42%,
respectively, compared to the previous quarter. → PE firms closed 33 funds with total commitments of $35 billion in 2Q 2012, the best
quarter for fundraising since 1Q 2011.
These are just a few of the highlights from the report. We hope the above information and the in-depth analysis in the rest of this report prove to be useful tools in your private equity endeavors.

The Private Equity 3Q 2012 Breakdown [email protected]
[ 3 ]
The PitchBook AdvantageBetter Data. Better Decisions.
Private Equity Deal Flow
In recent months, pundits, analysts, and experts have been increasingly warning of an impending economic slowdown both domestically and abroad. While the health of the overall economy is up for debate, PitchBook’s data show that PE investment is going through an undeniable slowdown.
The amount of capital invested in 2Q decreased by 8% from the previous quarter but the more drastic decline came in deal volume, which fell 17%. When comparing 2Q 2012 to the same period in 2011, the results are even worse: a decline of 39% in deal volume and 37% in capital invested. In fact, the $51 billion invested during 2Q was the lowest level for any individual quarter since the post-bubble year of 2009, and with just 303 deals, it was the worst quarter by volume since before 2006.
Deal-making was fairly consistent throughout 2011, but levels have slipped through the first half of 2012. Compared to 4Q 2010, deal flow was down 48% and capital invested declined 58% in 2Q 2012. Halfway through the year, PE firms are on track to close just 1,332 deals in 2012, which would be the lowest level since 2003.
As mentioned in the introduction, this trend will have
Private Equity Deal Flow by Quarter
Private Equity Deal Flow by Year
to change. The capital overhang has been declining moderately, but PE firms will have to make a concerted effort to prudently invest their more than $430 billion of dry powder.
With a significant inventory of PE-backed companies sitting in portfolios and tax cuts set to expire on January 1, the secondary market should see strong activity through the rest of 2012 and into 2013.
$92 $100 $122 $177 $171 $187 $202 $256 $118 $73 $115 $40 $50 $22 $28 $51 $65 $82 $69 $120 $87 $80 $84 $93 $55 $51
654607
654 630
749796
757 733719
519
595
396354 334 320
403446 426 419
579
481 497456 459
363303
0
100
200
300
400
500
600
700
800
900
$0
$50
$100
$150
$200
$250
$300
1Q 2Q 3Q 4Q 1Q 2Q 3Q 4Q 1Q 2Q 3Q 4Q 1Q 2Q 3Q 4Q 1Q 2Q 3Q 4Q 1Q 2Q 3Q 4Q 1Q 2Q
2006 2007 2008 2009 2010 2011 2012
Capital Invested ($B) # of Deals Closed Source: PitchBook
$98 $65 $76 $147 $219 $300 $491 $817 $345 $151 $336 $344 $106
926681 858
1,227
1,694
2,029
2,545
3,035
2,229
1,411
1,870 1,893
666
0
500
1,000
1,500
2,000
2,500
3,000
3,500
$0
$100
$200
$300
$400
$500
$600
$700
$800
$900
2000 2001 2002 2003 2004 2005 2006 2007 2008 2009 2010 2011 2012
Capital Invested ($B) # of Deals ClosedSource: PitchBook
*
* as of 06/30/12
The Private Equity 3Q 2012 Breakdown [email protected]
[ 4 ]
The PitchBook AdvantageBetter Data. Better Decisions.
Transactions by Industry
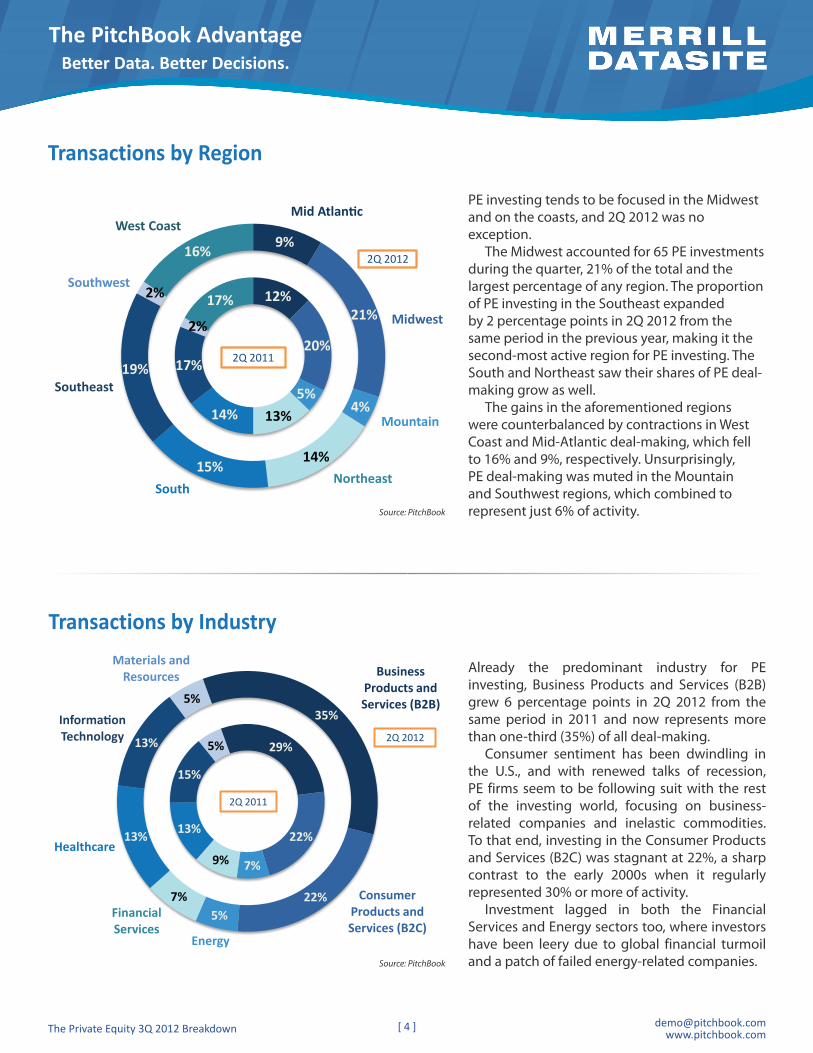
Already the predominant industry for PE investing, Business Products and Services (B2B) grew 6 percentage points in 2Q 2012 from the same period in 2011 and now represents more than one-third (35%) of all deal-making.
Consumer sentiment has been dwindling in the U.S., and with renewed talks of recession, PE firms seem to be following suit with the rest of the investing world, focusing on business-related companies and inelastic commodities. To that end, investing in the Consumer Products and Services (B2C) was stagnant at 22%, a sharp contrast to the early 2000s when it regularly represented 30% or more of activity.
Investment lagged in both the Financial Services and Energy sectors too, where investors have been leery due to global financial turmoil and a patch of failed energy-related companies.
Transactions by Region
PE investing tends to be focused in the Midwest and on the coasts, and 2Q 2012 was no exception.
The Midwest accounted for 65 PE investments during the quarter, 21% of the total and the largest percentage of any region. The proportion of PE investing in the Southeast expanded by 2 percentage points in 2Q 2012 from the same period in the previous year, making it the second-most active region for PE investing. The South and Northeast saw their shares of PE deal-making grow as well.
The gains in the aforementioned regions were counterbalanced by contractions in West Coast and Mid-Atlantic deal-making, which fell to 16% and 9%, respectively. Unsurprisingly, PE deal-making was muted in the Mountain and Southwest regions, which combined to represent just 6% of activity. Source: PitchBook
Source: PitchBook
12%
20%
5%13%14%
17%
2%
17%
Mid Atlantic
Midwest
Mountain
NortheastSouth
Southeast
Southwest
West Coast9%
21%
4%
14%15%
19%
2%
16% 2Q 2012
2Q 2011
29%
22%
7%9%
13%
15%
5%
Business Products and Services (B2B)
Consumer Products and Services (B2C)
Energy
Financial Services
Healthcare
Information Technology
Materials and Resources
35%
22%5%
7%
13%
13%
5%
2Q 2012
2Q 2011

The Private Equity 3Q 2012 Breakdown [email protected]
[ 5 ]
The PitchBook AdvantageBetter Data. Better Decisions.
Investment (Count) by Deal Size
Investment (Amount) by Deal SizeAs the adjacent graph portrays, the middle market, broadly defined as deals from $50 million to $1 billion, is the bedrock of PE investment. Following several years of heavily focused investment on deals of $500 million or more, PE investors have recalibrated and placed increased attention on smaller transactions.
Deals from $50 million to $500 million now account for 56% of capital invested, compared to just 43% in 2011. On the other end of the spectrum, mega-deals of $1 billion or more now represent just 17% of capital invested, the lowest level since before 2004. Even the upper-end of the middle market has shrunk significantly, with deals of $500 million to $1 billion accounting for 20% of the capital invested so far in 2012, compared to 31% in 2011.
The breakdown of deal volume by investment size has held exceptionally consistent over the last three years. One area that has seen some moderate expansion is middle-market deals of $50 million to $250 million, which have grown from 33% of deal volume in 2010 to 36% in 2012.
As can be seen in the adjacent chart, the percentages of deals under $50 million and over $1 billion have remained virtually unchanged since 2009.
It is important to keep in mind, however, that while deals under $50 million represent nearly half of all PE activity, they only account for 6% of capital invested. Conversely, deals of more than $1 billion are just 1% of volume but 17% of capital invested.
0%
10%
20%
30%
40%
50%
60%
70%
80%
90%
100%
2004 2005 2006 2007 2008 2009 2010 2011 2012
Under $50M $50M-$250M $250M-$500M $500M-$1B $1B-$2.5B $2.5B+
*
* as of 06/30/12 Source: PitchBook
0%
10%
20%
30%
40%
50%
60%
70%
80%
90%
100%
2004 2005 2006 2007 2008 2009 2010 2011 2012
Under $50M $50M-$250M $250M-$500M $500M-$1B $1B-$2.5B $2.5B+
Source: PitchBook
*
* as of 06/30/12
The Private Equity 3Q 2012 Breakdown [email protected]
[ 6 ]
The PitchBook AdvantageBetter Data. Better Decisions.
Private Equity Add-on Activity
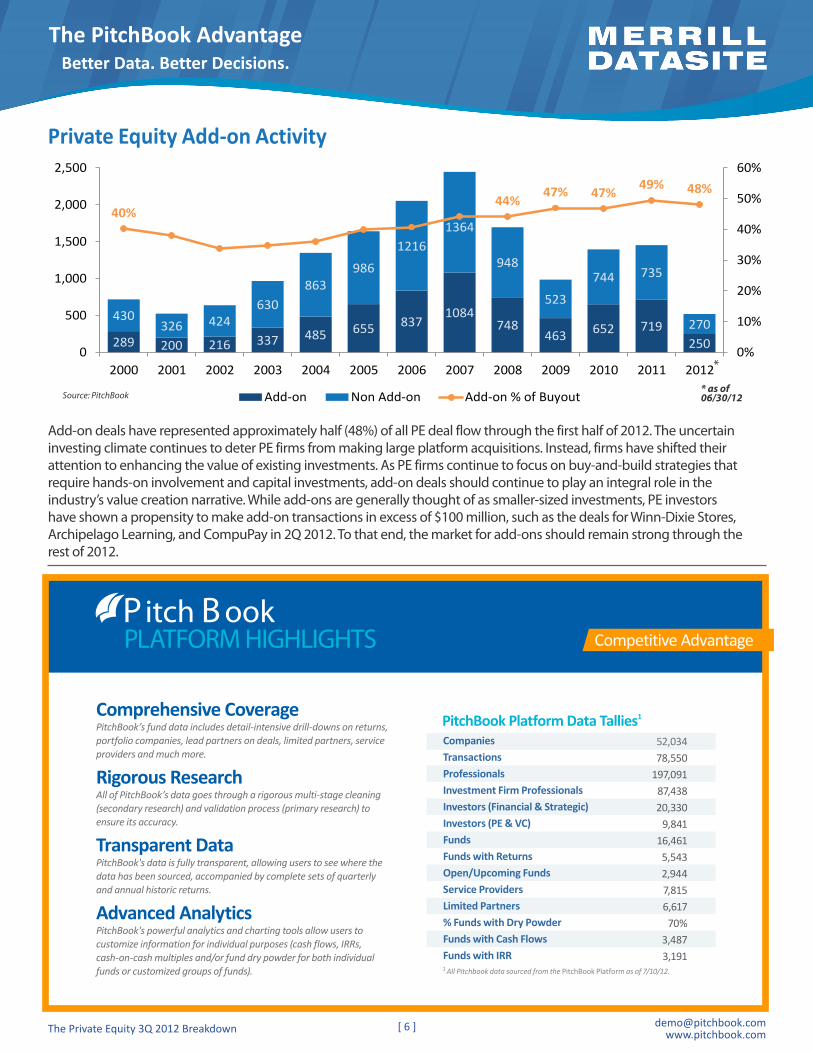
Add-on deals have represented approximately half (48%) of all PE deal flow through the first half of 2012. The uncertain investing climate continues to deter PE firms from making large platform acquisitions. Instead, firms have shifted their attention to enhancing the value of existing investments. As PE firms continue to focus on buy-and-build strategies that require hands-on involvement and capital investments, add-on deals should continue to play an integral role in the industry’s value creation narrative. While add-ons are generally thought of as smaller-sized investments, PE investors have shown a propensity to make add-on transactions in excess of $100 million, such as the deals for Winn-Dixie Stores, Archipelago Learning, and CompuPay in 2Q 2012. To that end, the market for add-ons should remain strong through the rest of 2012.
289 200 216 337 485 655 8371084
748463 652 719
250
430326 424
630863
986
12161364
948
523
744 735
270
40%44%
47% 47% 49% 48%
0%
10%
20%
30%
40%
50%
60%
0
500
1,000
1,500
2,000
2,500
2000 2001 2002 2003 2004 2005 2006 2007 2008 2009 2010 2011 2012
Add-on Non Add-on Add-on % of Buyout* as of 06/30/12Source: PitchBook
*
1 All Pitchbook data sourced from the PitchBook Platform as of 7/10/12.
CompaniesTransactionsProfessionalsInvestment Firm ProfessionalsInvestors (Financial & Strategic)Investors (PE & VC)FundsFunds with ReturnsOpen/Upcoming FundsService ProvidersLimited Partners% Funds with Dry PowderFunds with Cash FlowsFunds with IRR
52,03478,550
197,09187,43820,330
9,84116,4615,5432,9447,8156,61770%
3,4873,191
PitchBook Platform Data Tallies1PitchBook’s fund data includes detail-intensive drill-downs on returns, portfolio companies, lead partners on deals, limited partners, service providers and much more.
All of PitchBook’s data goes through a rigorous multi-stage cleaning (secondary research) and validation process (primary research) to ensure its accuracy.
PitchBook's data is fully transparent, allowing users to see where the data has been sourced, accompanied by complete sets of quarterly and annual historic returns.
PitchBook's powerful analytics and charting tools allow users to customize information for individual purposes (cash flows, IRRs, cash-on-cash multiples and/or fund dry powder for both individual funds or customized groups of funds).
Comprehensive Coverage
Rigorous Research
Transparent Data
Advanced Analytics
PLATFORM HIGHLIGHTS Competitive AdvantagePitch B ook

The Private Equity 3Q 2012 Breakdown [email protected]
[ 8 ]
The PitchBook AdvantageBetter Data. Better Decisions.
Private Equity Fundraising
$99 $94 $74 $41 $75 $36 $12 $30 $30 $22 $25 $11 $50 $29 $22 $22 $20 $35
126
63
47
42
62
31
13
34
51
35 31 31
54
3730
3728
33
0
20
40
60
80
100
120
140
$0
$20
$40
$60
$80
$100
$120
1Q 2Q 3Q 4Q 1Q 2Q 3Q 4Q 1Q 2Q 3Q 4Q 1Q 2Q 3Q 4Q 1Q 2Q
2008 2009 2010 2011 2012
Capital Raised ($B) # of Funds Closed
Fundraising Activity
Source: PitchBook
PE firms may not have much to cheer about on the deal-making side of things in 2Q 2012, but they can find some solace in the quarter’s fundraising numbers.
Thirty-three funds closed during the quarter with a total of $35 billion in capital commitments, marked improvements over 1Q 2012. In terms of capital raised, 2Q 2012 represented a 75% increase from 1Q and was the second-best quarter since 2Q 2009. Following the investment boom, PE firms demonstrated a heightened focus on smaller funds, particularly in 2010 when not a single fund closed with $5 billion or more in commitments.
Now that investors are a few years displaced from the bubble and the capital overhang has begun to recede, larger funds are beginning to return to the scene. The percentage of funds greater than $1 billion has increased from 18% in 2010 to 25% through the first half of 2012. Furthermore, the proportion of funds with less than $100 million has fallen from 26% to 13% during the same period.
After whipsawing to opposite ends of the spectrum in recent years, fundraising seems to be finally reaching its equilibrium as the PE industry continues to find its footing in the post-bubble world.
Fund Count by Fund Size Capital Raised by Fund Size
Source: PitchBook* as of 06/30/12
0%
10%
20%
30%
40%
50%
60%
70%
80%
90%
100%
2007 2008 2009 2010 2011 2012
Under $100M $100M-$250M $250M-$500M $500M-$1B $1B-$5B $5B+
*0%
10%
20%
30%
40%
50%
60%
70%
80%
90%
100%
2007 2008 2009 2010 2011 2012
Under $100M $100M-$250M $250M-$500M $500M-$1B $1B-$5B $5B+
Source: PitchBook
*
* as of 06/30/12

The Private Equity 3Q 2012 Breakdown [email protected]
[ 9 ]
The PitchBook AdvantageBetter Data. Better Decisions.
Exits (Amount) by Industry
After posting strong numbers in 1Q 2012, PE firms were looking forward to strong exit activity throughout the year. While the 114 exits completed in 2Q 2012 was short of recent quarters, activity remained solid.
Capital exited was disappointing though, falling a precipitous 42% from the stellar mark posted in 1Q. The saving grace for the industry was a handful of exits worth more
than $1 billion, including deals for SonicWALL, Burger King Worldwide, and Solo Cup.
Corporate acquisitions continued to dominate the exit landscape, representing 54% of activity, but secondary buyouts grew from 32% of exits in 1Q 2012 to 39% in 2Q. This trend should continue through the rest of the year, as high levels of dry powder and a surfeit of PE-
backed portfolio companies prime the pumps for PE deal-making. The percentage of IPOs dropped from first quarter levels but still accounted for 8% of exits during the second quarter, in line with historical norms. Exit activity should accelerate through the end of the year as business owners look to cash in before the scheduled tax hikes go into effect on January 1.
In terms of capital, exit activity has been a mixed bag so far in 2012. The Energy industry has emerged as a definitive bright spot for PE exit activity. In the first half of 2012, PE firms sold 24 Energy investments for a total of $28.2 billion, which is already more than any year on record. Exit activity in Information Technology has been strong as well; firms have already realized more than $14 billion in exited investments in 2012, nearly surpassing the 2011 total. Furthermore, PE firms have already exited more Financial Services companies in 2012 than in all of 2011. On the other hand, 2012 is shaping up to be one of the slowest years in recent memory for both B2B and B2C. Halfway through the year, total exited capital in both of the industries is approximately one-quarter of the amount reached in 2011.
Private Equity Exit Activity
117
94 114
155
131 127 147
131
100 85
119
59
36 55 49
80 87
112 92
175
100
122 120 129 136
114
- 20 40 60 80
100 120 140 160 180 200
1Q 2Q 3Q 4Q 1Q 2Q 3Q 4Q 1Q 2Q 3Q 4Q 1Q 2Q 3Q 4Q 1Q 2Q 3Q 4Q 1Q 2Q 3Q 4Q 1Q 2Q
2006 2007 2008 2009 2010 2011 2012
Corporate Acquisition IPO Secondary Buyout
Exits by Type
Source: PitchBook
0%
10%
20%
30%
40%
50%
60%
70%
80%
90%
100%
2002 2003 2004 2005 2006 2007
Business Productsand Services (B2B)
Consumer Productsand Services (B2C)
Energy
Financial Services
Healthcare
InformationTechnology
Materials andResources
0%
10%
20%
30%
40%
50%
60%
70%
80%
90%
100%
2007 2008 2009 2010 2011 2012
Business Productsand Services (B2B)
Consumer Productsand Services (B2C)
Energy
Financial Services
Healthcare
InformationTechnology
Materials andResources
Source: PitchBook
** as of 06/30/12

[ 10 ]The Private Equity 3Q 2012 Breakdown [email protected]
The PitchBook AdvantageBetter Data. Better Decisions.
Exits (Count) by Industry
0%
10%
20%
30%
40%
50%
60%
70%
80%
90%
100%
2007 2008 2009 2010 2011 2012
Business Productsand Services (B2B)
Consumer Productsand Services (B2C)
Energy
Financial Services
Healthcare
InformationTechnology
Materials andResources
Source: PitchBook
** as of 06/30/12
As the cornerstones of PE investing for the last several years, the B2B and B2C industries have also served as the backbone for PE exits, consistently representing between 50% and 60% of exit volume. While exit activity remained fairly constant in these industries, the Financial Services industry is having one of its best years ever in terms of exit volume, already surpassing its total for all of 2011.
One industry where exit activity has lagged is Healthcare, which is on track for its worst year since 2009 with just 27 exits so far in 2012. Now that the Supreme Court has upheld the Affordable Care Act, much of the uncertainty surrounding the industry has dissipated and Healthcare-focused investors may be more willing to act in the coming months.
Largest Exits in 2Q 2012Company Exit Type Deal Size ($M)Cordillera Energy Partners III Corporate Acquisition 3,104Caiman Eastern Midstream Corporate Acquisition 2,500Deutsch Engineered Connecting Devices Corporate Acquisition 1,550Burger King Worldwide Reverse Merger/IPO 1,411Dollar General Secondary Public Offering 1,403AmWINS Group Secondary Buyout 1,300SonicWALL Corporate Acquisition 1,250Raymond James | Morgan Keegan Corporate Acquisition 1,200NextG Networks Corporate Acquisition 1,000Endurance International Group Secondary Buyout 1,000

[ 11 ]The Private Equity 3Q 2012 Breakdown [email protected]
The PitchBook AdvantageBetter Data. Better Decisions.
Most Active PE Investors
Most Active Lenders
Investor Name Deal CountThe Riverside Company 9GS Capital Partners 7GTCR Golder Rauner 7H.I.G. Capital 7Audax Group 5Babson Capital Management 5Catterton Partners 5Ridgemont Equity Partners 5Symphony Technology Group 5The Blackstone Group 5The Comvest Group 5Thomas H. Lee Partners 5Apollo Global Management 4Genstar Capital 4Harren Equity Partners 4Investcorp 4Marlin Equity Partners 4TPG Capital 4Vista Equity Partners 4Warburg Pincus 4American Securities 3Excellere Partners 3Fort Point Capital 3Great Hill Partners 3GSO Capital Partners 3Gum Branch Capital 3HarbourVest Partners 3Kinderhook Industries 3Kohlberg Kravis Roberts 3Levine Leichtman Capital Partners 3Liberty Lane Partners 3Milestone Partners 3Northstar Capital 3Norwest Equity Partners 3Prairie Capital 3Riverstone Holdings 3Sentinel Capital Partners 3Sterling Partners 3Sun Capital Partners 3The CapStreet Group 3Thoma Bravo 3Veritas Capital 3Versa Capital Management 3American Capital 2Arsenal Capital Partners 2Baird Capital Partners 2Bluff Point Associates 2Boathouse Capital 2Brazos Private Equity Partners 2Brockway Moran & Partners 2Bush O’Donnell 2BV Investment Partners 2Centerbridge Partners 2Charlesbank Capital Partners 2CHS Capital 2Clayton Dubilier & Rice 2Clearview Capital 2Court Square Capital Partners 2Energy Capital Partners 2
Most Active PE Investors, Cont’d
Lenders Credit SuissePNC Financial Services GroupNXT CapitalBofA Merrill LynchWells FargoU.S. BancorpMadison Capital FundingCIT GroupComerica BankGoldman SachsHarris BankBB&T Capital Partners
KeyBankGolub CapitalBabson Capital ManagementFifth Street FinanceRBC Capital MarketsTHL CreditThe Brookside GroupUBSCitigroupBNP ParibasGE CapitalKohlberg Kravis Roberts
2Q 2012 League TablesFirst Capital Partners 2First Reserve 2GCP Capital Partners 2Golub Capital 2Graham Partners 2Graycliff Partners 2Gryphon Investors 2Hudson Ferry Capital 2Incline Equity Partners 2Insight Venture Partners 2Kayne Anderson Capital Advisors 2KPS Capital Partners 2LLR Partners 2Lovell Minnick Partners 2Lubar & Co. 2Madison Dearborn Partners 2Moelis Capital Partners 2Monomoy Capital Partners 2Monroe Capital 2MSouth Equity Partners 2MTS Health Investors 2Odyssey Investment Partners 2Pegasus Capital Advisors 2Providence Equity Partners 2Quilvest Private Equity 2RFE Investment Partners 2Snow Phipps Group 2Spectrum Equity Investors 2Superior Capital Partners 2The Brookside Group 2The Edgewater Funds 2The Gores Group 2Thompson Street Capital Partners 2Triangle Capital 2Trilantic Capital Partners 2W.L. Ross & Co 2Weinberg & Bell Group 2Wynnchurch Capital Partners 2Yucaipa Companies 2

[ 12 ]The Private Equity 3Q 2012 Breakdown [email protected]
The PitchBook AdvantageBetter Data. Better Decisions.
Most Active Advisors Most Active Law FirmsAdvisors Harris Williams & Co.Goldman SachsLincoln InternationalWilliam Blair & CompanyJefferies & CompanyBB&T Capital MarketsHoulihan LokeyMcColl PartnersGreene Holcomb & FisherBarclays CapitalMorgan StanleySagent AdvisorsMesirow FinancialRaymond James & AssociatesCredit SuisseJP MorganLazard Middle MarketUBSBofA Merrill LynchPiper JaffrayDeutsche BankBMO Capital MarketsPaul Weiss Rifkind Wharton & GarrisonMorgan Joseph TriArtisan GroupAllen & CompanyKeefe Bruyette & WoodsRBC Capital MarketsMoelis & CompanyPetsky PrunierOppenheimer and CompanyFounders Investment BankingGrace MatthewsAlvarez & MarsalThe Braff GroupWestern Reserve PartnersHyde Park Capital PartnersSandler O’Neill & PartnersPeter J. Solomon CompanySawaya SegalasGulfStar GroupD.A. DavidsonFairmount Partners
Law Firms Kirkland & EllisJones DayLatham & WatkinsVinson & ElkinsMorgan Lewis & BockiusPaul Weiss Rifkind Wharton & GarrisonWeil Gotshal & MangesShearman & SterlingGoodwin ProcterSkadden Arps Slate Meagher & FlomGibson Dunn & CrutcherKing & SpaldingPaul HastingsK&L GatesSimpson Thacher & BartlettPatton BoggsPepper HamiltonHunton & WilliamsAkin Gump Strauss Hauer & FeldRopes & GrayDLA PiperChoate Hall & StewartO’Melveny & MyersMilbank Tweed Hadley & McCloyMorrison & Foerster
Largest Funds Closed in 2Q 2012Fund Investor Amount ($M)Green Equity Investors VI Leonard Green & Partners 6,250 Mount Kellett Capital Partners II Mount Kellett Capital Management 4,000 American Securities Partners VI American Securities 3,640Vista Equity Partners Fund IV Vista Equity Partners 3,500Denham Commodity Partners Fund VI Denham Capital Management 3,000Metalmark Capital Partners II Metalmark Capital 2,500Carlyle Partners VI The Carlyle Group 2,000KKR Natural Resources Fund Kohlberg Kravis Roberts 1,250KKR Infrastructure Investors Kohlberg Kravis Roberts 1,000

[ 13 ]The Private Equity 3Q 2012 Breakdown [email protected]
The PitchBook AdvantageBetter Data. Better Decisions.
PitchBook MethodologyPrivate Equity Deals
The report includes all private equity investments (buyout, growth, PIPE, recapitalization and add-on), excluding real estate investments, made into target companies headquartered in the United States. Only investments made directly by private equity firms and their portfolio companies are counted.
Buyout deals are defined as transactions where the private equity investor receives a controlling ownership stake in the target company. Growth deals are defined as minority investments in target companies. Add-on deals are defined as acquisitions by companies with private equity backing.
Total Capital Investment*Total amount of equity and debt used in the private equity investment
Ex. $10 million of equity and $20 million of debt = $30 million of total capital investment
*PitchBook has changed its methodology in calculating total capital invested to provide a more accurate accounting of investment totals. Previously the totals included only amounts directly reported to and gathered by PitchBook. The new total capital invested figures now also include deal amounts that were not collected by PitchBook but that have been estimated using a multi-dimensional substitution and estimation matrix, which takes into account year of investment, deal type, platform v. add-on, industry, and sector. Some data sets will include these extrapolated numbers while others will be compiled using only data collected directly by PitchBook; this explains any potential discrepancies that may be noticed.
FundraisingThe report only includes private equity funds that have held their final close. Fund of funds and LP secondary funds are also not included.
ExitsThe report includes both complete and partial exits via corporate acquisition, secondary private equity buyout, and initial public offering (IPO). Dividend recapitalizations are not taken into account in the report.

Smarter • Faster • EasierSecure • Precise • EfficientAward Winning • Global
Certified • Industry Leading24/7/365 Service • Solutions
Smarter • Faster • EasierSecure • Precise • EfficientAward Winning • Global
Certified • Industry Leading24/7/365 Service • Solutions
Confidential • CompliantBest Practices
Focusedon your business
We thought of that.
datasite.com
We’re focused on your business, not ours.
Dealmakers know they need to be aggressive, determined and experienced to get the best results for their deal. Being the best virtual data room (VDR) in the business, Merrill DataSite brings that same intense focus to our customers.
With true transparency in pricing, award winning customer service, and the highest standard in security certification, Merrill DataSite’s cutting-edge technology and 24-7 client support allows M&A dealmakers to move fast and play to win. Users can easily organize, review and share data for due diligence on a completely secure, simple-to-use datasite, accessible via the Internet globally. Merrill DataSite can have your VDR ready for loading in as little as two hours, with extensive content loaded and ready for review within 24 hours.
Merrill delivers unmatched customer service throughout the entire deal process so the only thing you need to focus on is your deal.
At Merrill DataSite, we believe in sharing ideas and best practices that assist companies in expanding and capturing new opportunities. Case Studies and White Papers are available based on Business Type (M&A, IPO, Bankruptcy, etc.) and for specific audiences: Legal Advisors – Investment Banking – Corporate Executive Level. To download our FREE industry survey reports please visit the Merrill DataSite Knowledge Center at www.datasite.com.
M E R R I L L D A T A S I T E

Contact PitchBook: www.pitchbook.com l main: (877) 267-5593 l email: [email protected]
Better Data. Better Decisions.
Competitive AdvantagePLATFORM HIGHLIGHTS
1 Data sourced from 4Q 2011 nearest competitor publication. All other competitor data sourced from nearest competitor site on 7/10/12.2 All PitchBook data sourced from the PitchBook Platform as of 7/10/12.
With its robust data, rigorous research & award-winning technology, PitchBook gives you the tools to make better decisions, faster.
3.1x
More Transactions
25,0001
78,5502
more
More Open/Upcoming Funds
1,7001
2,9442
1.7x more
9.2x more
More PE & VC Professionals
21,4091
197,0912
More Limited Partners
4,5001
1.5x
6,6172
more