the private premium in public bonds - federal reserve bank of
TRANSCRIPT

This paper presents preliminary findings and is being distributed to economists
and other interested readers solely to stimulate discussion and elicit comments.
The views expressed in this paper are those of the authors and are not necessarily
reflective of views at the Federal Reserve Bank of New York or the Federal
Reserve System. Any errors or omissions are the responsibility of the authors.
Federal Reserve Bank of New York
Staff Reports
The Private Premium in Public Bonds
Anna Kovner
Chenyang Wei
Staff Report No. 553
March 2012
Revised March 2014

The Private Premium in Public Bonds
Anna Kovner and Chenyang Wei
Federal Reserve Bank of New York Staff Reports, no. 553
March 2012; revised March 2014
JEL classification: G12, G32
Abstract
This paper is the first to document the presence of a private premium in public bonds. We
find that spreads are 30 basis points higher for public bonds of private companies than for
bonds of public companies, even after controlling for observable differences, including
rating, financial performance, industry, bond characteristics, and issuance timing. The
estimated private premium increases to 40-56 basis points when a propensity matching
methodology is used or when we control for fixed issuer effects. In contrast, in the same
sample, there is no difference in pricing in private debt (syndicated loans). Despite the
premium pricing, bonds of private companies are no more likely to decline in price, to
default, or to be downgraded than are public bonds. We conclude that the costs of
information may be different across segments of the debt market.
Key words: bond pricing, private equity, debt costs, information
_________________
Kovner: Federal Reserve Bank of New York (e-mail: [email protected]). Wei: AIG (e-mail:
[email protected]). The authors thank Eben Lazarus, Kevin Pan, and Phoebe White for
outstanding research assistance. The views expressed in this paper are those of the authors and do not
necessarily reflect the position of the American International Group, the Federal Reserve Bank of New
York, or the Federal Reserve System.

2
1. Introduction
How much does information cost? We exploit data on companies with private equity but
publicly traded bonds to estimate the price of being a privately held company. We find that
interest rate spreads on public bonds issued by companies with private equity are about 30 basis
points higher on average than bonds issued by companies with publicly traded equity, even after
controlling for risk and other factors. These differences are economically and statistically
significant, and persist in the secondary market. When we look at the private debt of the same
companies, we no longer find a statistically significant price difference.
Our results are important to financial intermediation because they suggest that public debt
securities, which by design should be less sensitive to information, can be affected by the
availability of information. They also point to the importance of market segmentation, as the
price of being private seems to be different in different markets. We show how the private
premium is allocated across distinct creditor groups (to whom the firm has to pay). Our findings
are consistent with the model of Duffie and Lando (2001), which predicts higher spreads
associated with imperfect information and observes that the price and term structure of debt
should be affected by the completeness of information available about the issuer’s assets even if
the underlying risk of the assets is identical.
These results hold after we control for many factors associated with debt pricing,
including risk, liquidity and covenants. These controls account for all of the absolute pricing
difference in the private loan market, but do not eliminate the price wedge between public and
private companies in the public debt markets. We conclude that in this case, pricing in private
debt markets may be more efficient than pricing in public debt markets.

3
Unlike other studies of private firms, since companies with public bonds are required to
file public financial statements in the U.S.,1 we are able to control for a full set of observable
borrower characteristics. Our empirical tests include controls for an array of proxies for credit
risk, including rating, industry, leverage and profitability. We also control for issuance quarter
and differences in bond characteristics, such as maturity and putability or callability. While
borrower and bond characteristics are associated with pricing, the average difference in bond
spreads persists, suggesting that the difference is not due to observable characteristics.
Although we cannot eliminate the possibility that there are differences in unobservable risk,
estimates of the difference in bond spreads are actually higher when we use propensity matching
techniques (45-56 bps). And of course, since we do not find evidence of a similar pricing
difference in the private debt issued by these same companies, the differences in unobservable
risk would have to be pertinent only to the pricing of bonds.
Another way to measure risk is to see if companies with private equity are more likely to
decline in price or default. We find no evidence that ex post outcomes for bonds of private
companies are worse than those of public companies. Private issuers are no more likely to file
for bankruptcy or to be downgraded than are their public peers. Among firms with traded credit
default swap (CDS) contracts, we do not observe any significant difference between the CDS
pricing of public and private firms. We also do not find evidence that private bonds perform
worse post issuance, although the wedge between the pricing of public and private bonds persists
in the secondary market. We also find no evidence that the private premium is related to
aftermarket liquidity, nor do we find that bonds of private issuers are less liquid. Private
1 Although the financials of companies with private equity are not aggregated by Compustat, filing requirements for companies with public bonds are similar to those of companies with private equity with the exception of the proxy statement (14A), a form filed in advance of equity shareholder meetings and when soliciting shareholder votes; this form is filed only by companies with public equity.

4
companies pay a higher spread than do public companies with similarly highly concentrated
equity ownership.
It is not clear that private companies with public debt should be riskier than public ones.
Pecking order theory suggests that in the presence of information asymmetry, higher quality
firms should use less information-sensitive securities such as risky bonds (e.g., Myers and Majluf
(1984), Myers (1984)). However, Fulghieri and Lukin (2001) show that this pecking order can
reverse if investors produce additional information on the issuing firm and if the cost of
becoming informed is low. Bolton and Freixas (2000) model the choice between equity, bank
debt and bonds and conclude that riskier firms issue equity and bonds, while the safest
companies issue only bonds.2
Our paper extends the work of Saunders and Steffen (2011) who explore the costs of
being private in the UK debt market. While they find that private firms pay higher prices for
syndicated loans, they do not find a significant price differential in the cost of private debt for
private companies with public bonds. We add to this the finding that when bond and loan
borrowings co-exist, firms pay an extra premium in the public bond market relative to similar
public companies. Therefore the availability of debt from alternative sources is not enough to
prevent the emergence of price differences for public and private firms. Our findings also
suggest another dimension to the trade-off between borrowing publicly and borrowing privately,
as the price might be different depending on the issuer’s equity ownership structure.
2 There is also a long literature about the choice between private and public debt built on Diamond (1984), who shows the value of banks as intermediaries that save on monitoring costs relative to direct financing from investors. Many subsequent models make predictions about firm characteristics such as age, assets and growth opportunities and the choice between bank debt and bonds (notably Hoshi, Kashyap and Scharfstein (1993), Chemmanur and Fulghieri (1994), Boot and Thakor (1997), Holmstrom and Tirole (1997) and Repullo and Suarez (2000)).

5
After controlling for risk, what remains to account for the economically sizable
differential pricing in bond markets, but not loan markets? Some of the spread differential is
explained by differences in the value of equity for private issuers. We calculate a “hypothetical”
equity value for all issuers based on earnings multiples of companies in the same industry. All
else equal, the first billion dollars of hypothetical equity value lowers spreads for public
companies by approximately 46 basis points but lowers spreads of private companies by only 42
basis points, almost 9% less. This may be because bond issuers do not value private equity as
much as public equity or because private companies are not as valuable per dollar of current cash
flow.
While we have no instrument for companies’ equity ownership3, any risk factor
associated with private companies would need to differentially affect private companies’ bonds
and not their bank loans, which seems unlikely. It is also worth noting that in Saunders and
Steffen’s (2011) study of the private premium in the UK, the instrumental variables methodology
increased rather than decreased the pricing differences. Similarly, propensity match techniques
increase the price wedge, suggesting that if anything unobservable differences would make
private companies bonds less expensive.
One key difference between public bond investors and banks is their propensity to collect
information about borrowers. For example, information produced by equity investors and
analysts about public companies may be of value to bond investors. This information may be
less important to banks which may already be engaged in information production about their
borrowers. However, we find that being public alone is not enough, since public companies that
3 In the US, private companies with public debt are no more likely to be located near to financial centers (neither New York City, nor a broader definition of financial centers that would include New York City, Chicago and Los Angeles or San Francisco). Therefore we cannot make use of an instrument such as geographic proximity to financial centers similar to that in Saunders and Steffen (2011)

6
are very small (equity value less than $1 billion) pay just as high spreads as do private
companies, relative to the largest public companies.4 If the amount of information produced is
proportional to the amount of public equity, our results are consistent with the hypothesis that
information produced by the equity market about public companies is valuable to bond investors.
We examine next how much of the premium in bond prices that remains can be attributed
to differences in costs of information. Proxies for opacity of the issuer’s assets such as first bond
offering, earnings variability, underwriter quality, split rating and existence of CDS contracts
reduce the private premium by approximately 7 bps (more than 25%). Results are inconclusive
as to whether the penalty for opacity is different for private companies.
Most similar to this study is the paper by Saunders and Steffen (2011), which examines
the relative costs of private debt for private and public firms in the UK. Similar to our results,
they document a 29-to-42-basis-point difference in loan spreads for private debt of private firms
without public bonds. In Italy, Pagano, Panetta and Zingales (1998) document that the cost of
bank credit falls after an initial public offering.5 Santos and Winton (2008) find that companies
with public debt pay lower bank loan spreads, but they argue that this effect is driven by
differences in bargaining power. This paper complements this empirical literature by providing
the first direct evidence in the U.S. market of price differences for public bonds with private
equity. However, unlike previous papers that look at private lending, this paper focuses on the
public bond market where monitoring differences should be less important. In the bond
4 Black and Scholes’ (1973) and Merton’s (1974) option pricing models imply a direct relationship between equity values and the risk of credit default. If investors rely on models that need stock prices, this would preclude them from investing in private companies (but not small public companies). 5 In the empirical literature on why firms go private (or public), Boehmer and Ljungqvist (2004), Helwege and Packer (2009) and Chemmanur, He and Nandi (2010) also consider the costs of borrowing.

7
literature, it is the only paper that we are aware of that explicitly account for the impact of issuer
financial characteristics in pricing bonds without public equity.
The rest of the paper is organized as follows. Section 2 describes the data and variables
used in the analysis. We begin in Section 3 by documenting that differences in bond pricing
persist after controlling for observable differences in the earnings, leverage, ownership and likely
payoffs of private and public issuers. We review similar analysis for loans, but find that
observable differences explain pricing differences. We then use a propensity matching
methodology to confirm the results and finally show that ex post outcomes are similar for public
and private companies in terms of bankruptcy, downgrades and pricing and liquidity in the
secondary market. In Section 4 we explore the role of public equity as a signal and as a security
subordinate to debt. We then look directly at measures of information opacity that may affect
pricing. Section 5 concludes.
2. Data
2.1 Sample composition
Since we are interested in a set of private companies for which we can have full financial
information, we focus on U.S. companies that raise publicly traded debt in the domestic
corporate bond market. Using Mergent’s Fixed Income Securities Database (FISD), we begin
with all U.S. corporate bonds issued by industrial (non-financial, non-utility) firms between 1993
and 2009. It has been used in other studies (e.g., Billet, King and Mauer (2007)) as a
comprehensive data source for the U.S. corporate bond market. For each bond issue, FISD
provides the offering yield, offering date, amount, coupon, security level, callability, putability

8
and industry (NAICS code). In addition, the database has the Moody’s rating at (or shortly after)
issuance. When the Moody’s rating is missing, we use the S&P rating when available.
From FISD, we keep all bonds with: i) a U.S.–domiciled industrial issuer, ii) complete
information on bond terms, current or historical ratings from at least one of Moody’s and S&P,
and total debt amount outstanding. We further require the bond to be a non-convertible, fixed-
rate bond categorized as a corporate debenture, median-term note, zero-coupon or median-term
zero-coupon bond. The result is 14,770 public bond issues that meet all the criteria, with a total
offering amount of 83% of the aggregate dollar-denominated bond offerings by industrial
borrowers from 1993-2009. While there is variation in the equity ownership of issuers, all bonds
in our analysis are publicly traded.
We next identify, for each bond, the issuer’s equity ownership status (public/private) as
of the offering date. Companies may change their equity ownership via “going public” or “going
private” transactions. As a result, bonds issued by the same company at different times may be
classified either as public or private. We begin by searching for the issuer’s six-digit CUSIP (at
issuance) through CRSP’s company name structure, which provides a history of the evolution of
a public company’s name and CUSIP.6 When there is a match between the bond offering date
and the effective period of the matched CRSP record, company i is classified as PUBLIC at time
t. This approach identifies 3,678 bonds as public-issuer offerings.
A review of issuers unmatched to CRSP revealed significant Type II errors. Many
unmatched issuers are actually subsidiaries of public companies. We use Capital IQ to research
by hand all issuers unmatched to CRSP. Capital IQ collects company descriptions, business
histories and financials for both public and private firms from SEC filings, although they indicate
6 Firms may have different CUSIP numbers over time if the firm makes material changes in its capital or legal structure.

9
only the company’s current ownership status as a data field. When Capital IQ does not provide
enough information, we search SEC filings, media coverage, company websites and other online
company descriptions (e.g., Google Finance, Wikipedia, etc.) for further verification. Through
this procedure, we are able to unambiguously classify 1,276 bond issues as offered by a
subsidiary of a publicly listed parent company (e.g., Bell Atlantic).7 In doing so, we also find 34
cases where issuers are subsidiaries of foreign public companies. Overall, we are able to confirm
the public/private issuer status for 9,034 bonds, with 7,287 issues offered by 1,384 public firms
and 1,747 issues by 1,023 private companies. We further research the private companies and
identify 28% of the private issues as being associated with leveraged buyouts. Panels A and B of
Table 1 summarizes the number of bond issues with information on equity ownership.
We supplement the Mergent data with quarterly company financial information on firm
size, leverage and profitability from Compustat and Capital IQ. While both Compustat and
Capital IQ collect data from SEC filings, Compustat collects data only for firms with public
equity above a certain size. Thus, Capital IQ has better coverage of the private firms in our
sample. For each bond, we collect three accounting numbers as of the end of the quarter prior to
bond issuance: total assets, total debt and earnings before interest, taxes, depreciation and
amortization (EBITDA). We define firm size as the log of total assets and profitability as the
ratio of the latest 12 months (LTM) EBITDA to total assets. We define leverage as the ratio of
total book debt divided by total book assets.8
In addition to issuing public bonds, the vast majority (96%) of bond issuers in our sample
for which we also have financial information from Compustat or Capital IQ have also borrowed
7 Our results are unaffected by dropping all subsidiaries of public companies. 8 We also measure leverage in the quarter ended immediately following the bond issuance, in case the capital structure of the company has changed with the bond issuance. Using this measure of leverage does not change the results significantly.

10
money in the syndicated loan market at some time. Since we hand research company ownership
at the date of bond issuance, and the risk of a company may not be fixed over time, we search for
syndicated loan packages underwritten within 15 months of the bond issuance. We match
approximately 70% of our bonds with financial data to loan packages arranged within 15 months
of the bond issuance date.
The result is a sample of 4,986 bonds (456 private) and 4,697 loan facilities (913 private)
for 1,857 issuers with financial information. Without restricting the sample to companies that
are also issuing private debt, we have a broader sample of 7,155 bonds (619 private) with
financial information. Bond pricing results are similar when estimated in the sample matched to
loans or in the full sample.
2.2 Financial Characteristics
Table 1 presents the distribution of issuances through time and across industries for
public bonds and syndicated loans for the broadest possible sample of companies. For this table,
we use our hand research to identify private companies issuing bonds and use the Dealscan
public/private indicator to identify private companies issuing syndicated loans. Between 1993
and 2009, U.S. public companies raised more than $2 ($26) trillion in fixed, rated, non-
convertible public debt (syndicated loans), as compared with less than $400 billion ($17 trillion)
borrowed by private companies. The average bond (loan facility) issuance size of public
companies is $287 ($278) million as compared to $224 ($156) million for the private firms. Over
the 17-year period, issuance numbers and volumes of the two borrower types followed generally
similar patterns, with a 57% (64%) correlation in number of bonds (loan facilities) issued and a
40% (91%) correlation in issuance volume.

11
[TABLE 1]
There are substantial differences in the observable risk of public and private companies.
As Figure 1 shows, public companies’ bond offerings are more likely to be rated investment-
grade, whereas private companies’ offerings are mainly rated speculative grade. Importantly,
there is ample overlap between the public- and private-firm sample in most rating classes, a
feature that is particularly important for controlling for the selection bias in our analysis.
[FIGURE 1]
While we have a larger sample if we do not limit our analysis to companies with
available financial information, the remainder of the analysis focuses on the subset of companies
for which financial information was available from Capital IQ. The contract features of the
bonds and loan facilities are summarized in the “Debt Characteristics” sections of Table 2, which
tabulates financial information for public and private companies separately.
First and foremost, the univariate comparison reveals that both bonds and loans offered
by private companies are priced at significantly higher yields than public-firm issues. The
average premium for private firms is 4 bps for investment-grade bonds and 124 bps for non-
investment-grade issues, and 38 bps for loans. Significant differences are also observed on other
characteristics. For example, debt of private companies is more likely to be secured. Consistent
with lower observed credit ratings, issuers with private equity are significantly smaller and more
leveraged, suggesting that it will be very important to include these controls in addition to the
bond rating to accurately estimate pricing differences.
[TABLE 2]

12
As well as observable differences in financial ratios, public and private companies are
also different in informational opacity. The “Opacity Measures” sections of Table 2 present
several measures of opacity calculated at issuance. Some offers are specific to the debt type and
we summarize those separately: First offer(bond) is a dummy variable equal to 1 if this issuance
is the company’s first public bond offering (measured since 1988) and First offer(loan) is a
dummy variable equal to 1 if this loan facility is the company’s first syndicated loan offering
(measured since 1996). SD ROA is the standard deviation of the 4 quarters of return on assets
(ROA) following bond issuance. 144A is a dummy variable equal to 1 if bonds were first issued
only to qualified institutional buyers under Rule 144A.9 Top underwriter is a dummy variable
equal to 1 if the company’s bond underwriter had a market share in the previous year of greater
than 1% (equivalent to a top 15 ranking).10 Finally, Split rating is a dummy variable equal to 1 if
the bond rating from S&P is different from Moody’s.11 Rating agencies provide arguably the
most important independent assessments of the credit quality of a bond issue/issuer. Therefore a
disagreement among them is likely associated with heightened uncertainty with respect to the
issue/issuer’s default risk. As shown in Table 2, bond issuances by private firms are generally
more opaque, are more likely to have split ratings and to be issued under Rule 144A, are less
likely to have a top underwriter and have more volatile accounting performance.
9 Livingston and Zhou (2002) find evidence of lower liquidity, information uncertainty and weaker protection of investors for securities issued under 144A. Of the companies in this sample, the 88% that were issued under Rule 144A also had registration rights that require a public registration within six months or an increase in the interest rate. 10 See Livingston and Miller (2000) for evidence that investment banker reputation acts to certify the value of a debt issue to investors and an estimation of the impact of underwriter prestige on offering yields. 11 Livingston and Zhou (2010) find that split-rated bonds average a 7-basis-point yield premium over non-split-rated bonds of similar credit risk and conclude that investors demand higher yields to compensate for the information opacity of such bonds.

13
Finally, to understand if borrower performance is different post-issuance, we collect
secondary-market bond and CDS pricing data for our sample firms. Bond prices and yields are
gathered from two data sources. Transaction-based data (volume and yield) between July 2002
and December 2010 come from the Transaction Reporting and Compliance Engine (TRACE).12
Since trading of corporate bonds is fairly infrequent, we also use Reuters’ DataScope to collect
end-of-day price and yield quotes.
CDS pricing data come from Markit CDS Pricing.13 In the period between 2001 and
2007, CDS pricing data are available for 412 firms in our sample from Markit CDS Pricing.
Thirty percent of these firms are private as of the pricing and issuance date. We use year-end
spread data for five-year, senior unsecured credit default swaps, the most common CDS
contracts traded in that period. We focus on spreads classified under the “modified restructuring”
document clause, a contract term that enumerates the contingencies under which settlement of a
CDS contract would be triggered.
3. Establishing the Private Premium
3.1 OLS Specifications
In order to understand if there are differences in debt pricing for public and private
companies, we estimate a pooled OLS regression, of the following form:
[1] jtittijtitji QUARTERCOMPANYISSUEPRIVATESPREAD .,.,,, )()()()(
12 TRACE was introduced in July 2002 with the aim of enhancing the transparency of the corporate bond market. For a detailed description of the TRACE initiation and a general background on corporate bond trading in the U.S., see Bessembinder and Maxwell (2008). Goldstein and Hotchkiss (2007) discuss a few exemptions in TRACE eligibility. 13 While CDS contracts may be traded on the other bonds in the sample, to our knowledge Markit maintains the most comprehensive available data source for CDS data.

14
where SPREADi,j,t is the difference between the yield at issuance of issue j of company i at
issuance date t and the yield of a Treasury bond with comparable maturity (or the all-in-drawn
spread to LIBOR in the case of loans). Our key variable, PRIVATEi,t, is a dummy indicator
equal to one if company i has no publicly traded equity at the bond/loan issuance date t. The
coefficient β thus measures the wedge between the pricing of public and private debt. ISSUEj is a
vector of characteristics of the debt issue such as rating, maturity, amount and covenants.
COMPANYi.t is a vector of characteristics of company i at the quarter ended immediately prior to
date t such as financial ratios and industrial sector. QUARTER.t is a dummy variable for the
issuance quarter. In some specifications, we also include a fixed effect for company i. Because
determinants of pricing are different for bonds and for loans, we estimate separate specifications
for syndicated loans and for bonds.
Since debt and borrower characteristics affect pricing, we attempt to control for
differences in characteristics of public and private issuers documented in the univariate analysis
in Table 2. Following the previous literature (see, e.g., Billet, King and Mauer (2007) ), we
control for: (i) offering amount, (ii) maturity, (iii) secured, and (iv) call and put provisions. In
addition, we include credit ratings fixed effects – a dummy variable equal to one for each
category of bond rating (i.e., a separate dummy for B rating). The ratings dummy is based on the
Moody’s rating if available, and the S&P rating otherwise. Similarly, for syndicated loans (see,
e.g., Ivashina (2009) ), we control for: (i) facility amount, (ii) maturity, (iii) secured, (iv)
syndicate size, (v) loan type and (vi) deal purpose. Estimated coefficients on all of the variables
are consistent with the previous literature.
While we control directly for the relationship between rating and yield, all information
about risk may not be contained in the rating (see Campbell and Taksler (2003)). Therefore, we

15
include additional controls for the financial condition of the borrower. We control for: (i) size
(log assets), (ii) profitability (EBITDA to assets), and (iii) leverage (total debt to assets). We add
industry controls, dummy variables equal to one for each of the manufacturing, media, retail,
railroad, service and telecommunications sectors. In addition to the financial variables shown,
we tried other financial ratios, such as interest coverage (EBITDA to interest) and other
definitions of profitability (EBITDA less capital expenditures), but do not include the results in
the final specifications, since the estimated coefficients were not statistically significant. The
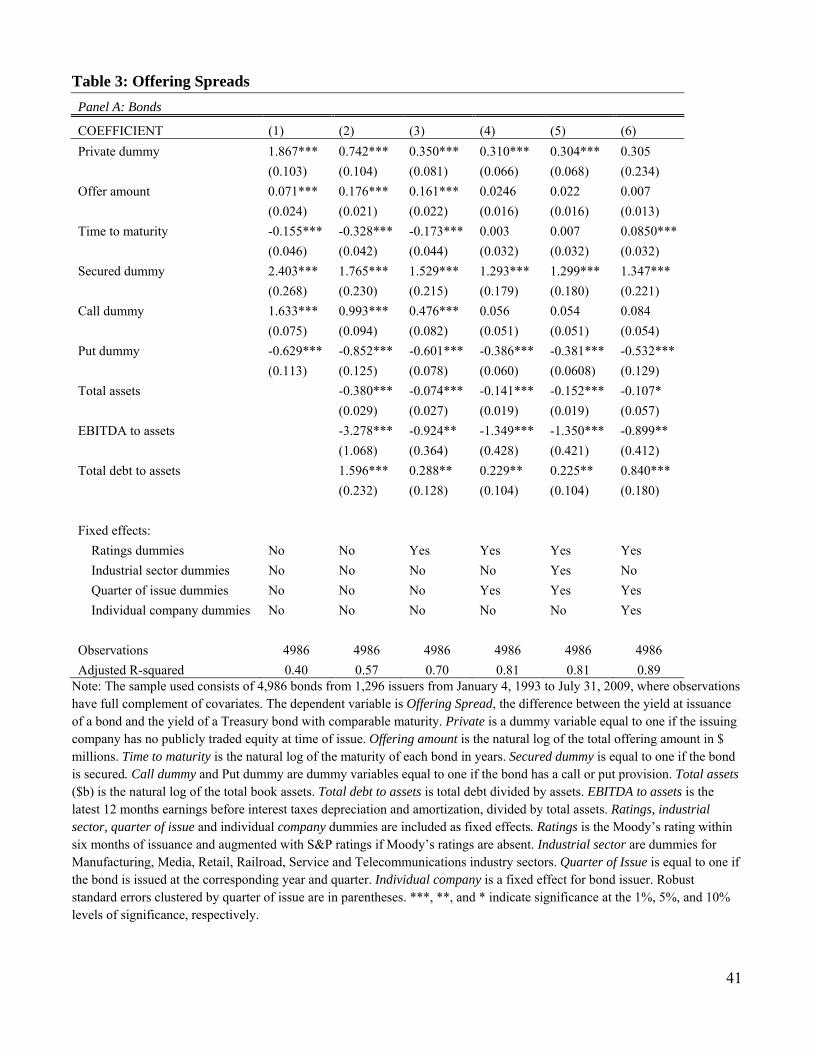
results are summarized in Table 3, Panel A for bonds and Panel B for loans. We begin by
controlling only for bond characteristics (excluding rating). As is suggested by the univariate
results, bonds (syndicated loans) of companies with private equity are issued at spreads that are
187 (30) bps higher than bonds of public companies.
[TABLE 3]
Of course, much of this is driven by differences in risk. After controlling for company
financials and ratings, the difference shrinks to 71 bps for bonds (Column (5) of Table 3). This
indicates that there are meaningful differences between private and public companies that
finance themselves in the bond markets, differences that account for a 106 basis point pricing
difference. These differences are not captured fully by ratings, since both the financial metrics
and ratings dummies are statistically significant. For loans, the estimated coefficient on private
companies falls to only 9 basis points, and the difference is no longer statistically significant
after controlling for observable differences between public and private borrowers.
While almost a third of the private companies are leveraged buyouts, the private spread
premium is not an LBO effect. In fact, Huang, Ritter and Zhang (2013) find that yield spreads
on private equity backed issues are actually lower, all else equal. After controlling for a fixed

16
price effect for bonds or loans issued as part of a leveraged buyout, the estimated coefficient on
the private dummy remains statistically significant and of the same magnitude.
In summary, after controlling for differences in observable bond and company
characteristics, we find that bonds are much more expensive for companies with private equity,
but there is no statistically significant difference in loan pricing between public and private
companies. On average, spreads are 30 bps higher for private companies (see specification (5) of
Table 3, Panel A). This is more than 6% of of mean bond spreads for private issuers (a present
value of $4 million in interest for a bond of mean size and maturity).14
In the final specification of Panels A and B of Table 3, we take advantage of the 443
companies in the sample that changed their ownership and estimate the same model controlling
for company fixed effects. Assuming that unobservable risk is constant over time for companies,
this specification should provide the best estimate of the private premium. There is still a
positive, statistically significant coefficient on the private dummy -- bonds of the same
companies are 58 bps more expensive when those companies have privately held equity.
3.2 Propensity Score Matching
In the previous analysis (Section 3.1), we control for differences between private and
public companies using observable characteristics and fixed company effects. To reduce the
potential selection bias in estimating a causal effect on spreads of being private, we apply a
propensity score matching methodology (Rosenbaum and Rubin (1983)). This methodology is
useful when observable differences in covariates (such as size and rating) are related to the
probability of being private. Furthermore, it uses only the matched subsample for estimation
14 Present value based on a spread premium of 30 basis points for a bond of mean size ($230M), an additional $69,000 annually for an average maturity of 9 years, discounted at 9.77% (mean spread of 463 bp plus mean yield on 10 year treasury of 5.14% from 1993-2009).

17
purposes and therefore is more robust to model misspecifications (Connife, Gash and O’Connell
(2000), Rubin and Thomas (2000)). This methodology is consistent with that used by Saunders
and Steffen (2012) in their similar study of the costs of private loans to public and private
companies in the UK.
We calculate propensity scores for the sample of bonds and loans and match on various
other company characteristics to confirm the robustness of the pricing difference for public and
private companies. We first estimate a propensity score to predict the probability of being
private, using a probit specification of the following form:
jtitijti COMPANYISSUEPRIVATE .,., )()(
where PRIVATEi,t is a dummy variable equal to one if company i has no publicly traded equity at
date t. ISSUEj is a vector of characteristics of the bond issue or loan package such as rating,
maturity, amount and some covenants. COMPANYi.t is a vector of characteristics for company i
as of date t such as financial ratios and industrial sector.
It is interesting to note that the signs and estimated coefficients are different between the sample
of bonds and the sample of loan facilities, even though the issuers are identical (each issuer has
at least one bond and one loan in the sample). This is because we are not looking at the
propensity of a given company to be private or public, but specifically at the association in this
sample between debt characteristics and the equity ownership of an issuer of each loan facility
and each bond issuance.
Table 4 shows that the probit estimation results are consistent with the differences we see
in the summary statistics. Bonds and loans of companies with private equity are more likely to
be of shorter maturity, secured and lower rated. All else equal, the private debt offering amounts

18
are actually higher. Among issuers, private companies are smaller, less profitable and more
highly levered.
[TABLE 4]
In order for the propensity matching method to work, we need to have an adequate
control group of bonds of companies with public equity and issue/issuer characteristics similar to
those of bonds with private equity. Because there are so many more issuances by companies
with public equity, there is a sufficient overlap. Figure 1 shows the scale of the overlap in terms
of ratings. Since industry is not significantly associated with the probability of being private
(except for telecommunications), but is likely to be associated with pricing, we run two sets of
matching variables, one that includes industry and one that does not.
Many different methodologies for propensity score matching are proposed in the
literature. We use two different matching methodologies, different variants of the matching
procedure as well as different weightings of the matching characteristics. Propensity score
matching is a trade-off between the quality of the match and the number of matches. Therefore,
we estimate matches for 2 and 5 nearest neighbors (the 2 and 5 closest matches). We also use
local linear matching, which can be a superior methodology when a large number of propensity
scores approach the boundary, and use the local linear estimator proposed by Heckman, Ichimura
and Todd (1997) with a Gaussian kernel. We also compare the standard errors to standard errors
bootstrapped with 50, 100 and 300 replications. The results of these specifications are shown in
Table 5.
[TABLE 5]
Matching bonds of private companies to similar public companies suggests that private
companies pay 30 to 45 bps more for public debt than their public peers. These estimates are

19
again higher than those of the OLS specifications, suggesting that if anything private companies
are paying much higher prices to access public debt markets. In contrast, we do not always find
a statistically significant difference between pricing of loans of public and private companies,
and never estimate a price difference greater than 12 basis points.
This result is consistent with empirical studies of going-private transactions, in that these
studies do not suggest that private companies are riskier than public companies. Mehran and
Peristiani (2009) find that a primary reason for companies to abandon their public listing was a
failure to attract significant visibility and interest from investors. They also find that firms with
low stock price volatility are twice as likely to be taken private. Opler and Titman (1993) argue
that firms with lower costs of financial distress (and thus possibly lower losses given default) are
more likely to conduct leveraged buyouts and Kaplan (1989) finds incentive improvements in
newly private LBOs.
3.3 Bonds vs. Loans
Of course, the estimated bond premium could arise from time-varying differences in the
unobservable riskiness of public and private companies. However, we find a large statistically
significant difference in pricing only for public bonds, which suggests that to the extent there are
differences in unobservable risk of private companies, they exist only for private companies’
bonds and not their loans.
Since one difference between bonds and loans may be seniority, we replicate the analysis
dropping subordinated bonds. This means we examine a sample of only senior bonds, which are
typically pari passu with loans. The estimated coefficient in specification (5) of Table 3 falls to

20
24 basis points, but remains statistically significant at the 5% level despite the reduced sample
size.
3.4 Ex Post Performance
Of course, propensity score matching still relies on the matching of observable
characteristics. And, while bonds and loans are secured by the same entity, the additional
unobservable risk may matter only for bonds which have fewer covenants and longer maturities.
And looking at the same companies under private and public ownership may be differentially
risky. Therefore, we examine ex post outcomes to understand if bonds of private companies are
actually riskier than bonds of public companies. If private companies are more likely to default
than are similarly rated, similarly profitable, similarly leveraged public companies, then we
should observe worse ex post performance of bonds issued by private companies.
We examine several ex post outcome measures: i) Bankrupt – a dummy variable equal to one if
the company defaulted on its bond, ii) Downgrade – a dummy variable equal to one if the
company was downgraded by either Moody’s or S&P within one year of issuance,15 iii) Upgrade
– a dummy variable equal to one if the company was upgraded by either Moody’s or S&P
within one year of issuance. In addition, we examine Called, a dummy variable equal to one if
the bond was called before its maturity date. The equation estimated is:
jtittijtiji QUARTERCOMPANYISSUEPRIVATEOUTCOME .,.,, )()()()(
where OUTCOMEi,j is any of the outcome measures for issue j of company i. As before,
PRIVATEi,t is a dummy variable equal to one if company i has no publicly traded equity at
issuance date t. ISSUEj is a vector of characteristics of the bond issue such as rating, maturity,
15 We also examined longer time horizons to upgrade/downgrade (2 and 3 years), with similar results.

21
amount and some covenants. COMPANYi.t is a vector of characteristics for company i at issuance
date t, such as financial ratios and industrial sector. QUARTER.t is a dummy variable for the
issuance quarter. If the coefficient β is positive in the first three specifications, it implies that the
private company is riskier.
In the first two specifications of Table 6, we examine bankruptcy rates for the bonds in
our sample, first for all bonds and then just for bonds issued before 2007, so that there is
adequate time for negative outcomes to occur. If anything, it appears that private companies are
less likely to go bankrupt, although the results are not statistically significant. The next two
specifications examine if private issuers are more likely to experience ratings changes. Again,
private companies are (not significantly) more likely to be upgraded and are less likely to be
downgraded within one year of issuance. We do see that private bonds are more likely to be
called, although it is hard to know if this should be associated with higher or lower yields, since
the lower duration is typically mitigated by the high call price. In summary, we do not find any
evidence that issuers with private equity have worse ex post performance.
[TABLE 6]
In addition to the post-issuance performance of the bonds in our sample, we use the CDS
market to directly assess whether significant differences in credit risk exist between private and
public firms in our sample. We collect 5-year CDS spread data for senior unsecured CDS
contracts on a subsample of 412 firms for which pricing quotes are available from Markit. We
run the following annual CDS spread regression:
tjittititi YEARCOMPANYPRIVATESpreadCDS ,,.,, )()()(_
where CDS_Spreadi,t is the five-year CDS spread of company i at the end of year t. As before,
PRIVATEi,t is a dummy variable equal to one if company i has no publicly traded equity as of

22
year t. COMPANYi.t is a vector of characteristics for company i as of the end of year t. YEARt is
a year dummy. A positive coefficient β indicates that private firms are perceived to have higher
credit risk. We examine this for each year-end after bond issuance for which the issuers’ bonds
remain outstanding and cluster the standard errors by issuer.
As shown in column (8) of Table 6, after controlling for firm characteristics, rating,
industry and year fixed effect, we do not observe any significant difference in CDS spreads as
associated with private companies.16
If bonds of private companies are less liquid, investors then would demand higher
premiums to compensate for the increased liquidity risk of private bonds (e.g., Amihud and
Mendelson (1986)). Chen, Lesmond and Wei (2007) find that liquidity is priced in corporate
yield spreads, even after controlling for bond and company characteristics. A preliminary
comparison of trading liquidity finds mixed evidence that private companies’ bonds have lower
liquidity. As the “TRACE” sections of Table 2 show, the average number of trades and the
average trading volume of bonds by private companies are generally lower than their public-firm
counterparts; however, the differences are seldom statistically significant. After including
controls for bond characteristics, it seems that liquidity as measured by TRACE trading volume
may actually be higher for private companies, although the results are not statistically significant
(see column (6) of Table 6).
3.5. Secondary Market Bond Price
Another type of ex post performance that may matter to bond investors is secondary-
market pricing. We examine a subsample data of our bond issuance data of private companies
16 Importantly, when we rerun the regression analysis as in Table 3 within this subsample of private and public firms, we continue to observe an average private premium of nearly 60 basis points.

23
with yield data from TRACE. We apply the propensity score methodology described in Section
3.1 and select offerings that traded on the same day, with identical credit ratings and issuer
industry sectors. To minimize the impact of non-independent observations, we randomly select
one trading day for each private-firm bond, from those days in which the control group has the
maximum size. The final sample includes 40 unique bonds by private firms with 431 public-firm
bonds as the control group for propensity score matching.
As Table 7 shows, matching secondary-market yields of bonds of private companies to
similar public companies’ bonds traded on the same day suggests that investors continue to
charge a premium of 24.7 to 48.8 bps in trading bonds by private companies relative to their
public peers. These estimates are similar to our estimates in the primary market analysis,
suggesting that the underlying drivers are not likely to be primary-market-specific, and instead
have a persistent pricing impact in the secondary market.
[TABLE 7]
3.6. Geography as an Instrumental Variable
Other studies of public and private companies have made use of geography as an
instrument for public ownership (e.g. Saunders and Steffen (2012)). The instrument of
geography (public companies are closer to New York) does not work for our sample. Perhaps
because these companies are public in some way (because they have public debt), they are no
more likely to be geographically close to New York, (or New York, Chicago and LA) than are
the private companies in our sample.
4 What Explains the Private Premium In Bonds?

24
4.1 Public Equity
Public equity may add value by providing signals about the value of the assets of the
underlying company or because it is equity subordinate to bondholders’ claims. In the latter
case, it should also affect loan pricing, however. Black and Sholes’ (1973) and Merton’s (1974)
option pricing models imply a direct relationship between equity values and the risk of credit
default. However, Altman, Fargher and Kalotay (2010) show that they can approximate the
likelihood of default inferred from equity prices using only accounting-based measures, firm
characteristics and industry-level expectations.
We revisit specification (5) of Table 3, including controls for financial ratios, ratings,
timing of issue and bond characteristics, to better understand the role of public equity. In order
to maximize power, we include the full sample of all bonds, regardless of if we have a matched
loan. We add a dummy variable equal to one indicating if the bond has a syndicated loan
issuance at the same time. In the first four specifications, instead of merely looking at a dummy
variable indicating if the company is public, we split issuers with public equity into four quartiles
based on equity market capitalization as of the issuance date. The quartiles are estimated each
year so that the largest quartile is not biased toward more recent offerings. We also examine
share volume traded the day prior to issuance. If the sole value of being public is the presence of
a signal of asset value, or the ability to invest across the capital structure, then the market
capitalization of the company should not matter. The mere fact of having the signal should be
enough.
However, we find that companies with very small market capitalizations also pay higher
spreads than do larger public companies. The relationship is non-linear. As shown in the first
column of Table 8, compared to companies with market capitalizations of more than $1 billion,

25
companies with market capitalizations below $1 billion pay 40 bps higher, and private
companies pay 58 bps more. There is no statistically significant difference between the 2nd and
3rd quartiles of market capitalization spreads of the largest issuers. There is also no statistically
significant relationship between bond prices and the volume of shares traded. This suggests that
the gap between the pricing of bonds of public and private issuers is unlikely to be driven by the
lack of a public signal for the value of a company’s assets.
[TABLE 8]
We then measure the importance of public equity value subordinate to the bondholders’
claim. While the book value of the assets and leverage is already included as a control in the
regression specifications, it is possible book value does not measure the market value of the
company’s assets. Since we do not have a publicly traded equity value for the private
companies, we calculate HYPOTHETICAL EQUITY VALUE (HEV) for all of the companies.
We first estimate total enterprise value as EBITDA times the median multiple of EBITDA for all
publicly traded companies in the CRSP/COMPUSTAT universe in the same 4-digit SIC code.17
The correlation between total enterprise value and the book value of assets is 0.62. We then
calculate HEV by subtracting the book value of the outstanding debt, including the issuance from
the total enterprise value. The correlation between HEV and the equity market capitalization for
companies with publicly traded equity is 0.62. Using HEV instead of the actual market
capitalization prevents any bias from the mismeasurement of the equity capitalization of private,
but not public companies.
17 If there are fewer than three companies having the same 4-digit SIC codes, we use the 3-digit SIC code. We drop companies with negative EBITDA from the calculation.

26
Bond investors appear to discount the value of private equity. The decline in spreads
associated with each additional dollar of hypothetical equity value is 10% smaller for companies
without public equity (see column (4) of Table 8). While this may represent differences in the
value that bond investors attribute to equity without a public market price, companies with
private equity may simply not be as valuable as their public peers. However, the private
premium remains at 30 bps even after controlling for differences in the value of equity
subordinate to the bonds.
4.2 Ownership
Another difference between public and private companies is the concentration of
ownership. Bagnani, Milonas, Saunders and Travlos (1994) examine bonds of companies with
public equity and find a non-linear relationship between managerial ownership concentration and
bond return premia. They argue that as management ownership increases, management becomes
more risk averse and more aligned with bond holders. However, above 25% ownership, they
find weak evidence for a non-positive relationship as managers increase risk taking at the
expense of bondholders.
We collect information on ownership of public issuers from Spectrum filings,
aggregating ownership of managers and equity blockholders. We separate the sample into three
groups - blockholding of 5-10% , 10-25% or above 25%. We assume that all private companies
have greater than 25% ownership concentration. Lacking linear ownership data for private
companies, we cannot replicate the Bagnani, Milonas, Saunders and Travlos (1994) results, but
instead look to see if the price premium is driven by the concentrated ownership of private
companies. In this sample, we do not estimate a statistically significant difference in the pricing

27
of bonds of issuers with concentrated ownership (see specification (7) of Table 9). The price
premium for private companies is unlikely to be related to higher ownership concentrations for
those companies.
[TABLE 9]
4.3 Information
The remaining factor separating private and public companies is information. There are
two ways in which information may affect the cost of private bonds. First, if private companies
are more opaque, their bonds should be more expensive. Livingston and Zhou (2010) find a 7-
basis-point premium for split-rated bonds over non-split-rated bonds of similar risk. Güntay and
Hackbarth (2010) find that a one-standard-deviation increase in the dispersion of equity analysts’
forecasts increases credit spreads by 19 bps. Second, for a given level of opacity, if it is more
costly to collect information about private companies, private bonds should also be more costly.
Since loans are expected to be a more information intensive security in which loan
holders are more actively monitoring borrowers, the information difference between companies
with public and private equity may be much smaller. This would explain why we find evidence
for a private premium in bonds and not in loans.
We collect several measures of the opacity of bond issues by private companies and test
to see if opacity measures can account for the private premium. Then we test to see if the
relationship between opacity and pricing is different for private companies by estimating the
coefficient of the interaction of the opacity measure and the PRIVATE dummy.

28
We begin with the canonical specification (5) from Table 3 and add to the explanatory
variables the measures of opacity defined in Section 2: i) first bond offering, ii) variability of
profitability (SD ROA), iii) 144A offering, iv) top bond underwriter, v) split rating, and vi)
existence of CDS market pricing. We also look at Previously public, a dummy variable equal to
1 if the private company previously had public equity.
The results are summarized in Table 9. Controlling for measures of information opacity
reduces the estimated coefficient on the private dummy variable from 30.7 bps (specification (5)
of Table 9) to approximately 25 bps. This suggests that as much as 17 percent of the premium
associated with bonds of private companies is related to information opacity.
While the signs of the interactions were consistent with the notion that information
opacity may be more costly for private companies, in no specification was the interaction
between the private dummy and the measure of opacity statistically significant. Therefore, we
conclude that while some of the differences in pricing likely reflect differences in opacity, there
is no difference between the marginal costs of opacity for private companies and public firms.
Larger companies are more likely to have institutional investors and analyst coverage and thus
more information production. The results are consistent with public equity as a source of
additional information for bond investors.
5. Conclusion
Companies with private equity pay higher rates for their public bonds, even after
controlling for rating, financial performance, industry, bond characteristics and issuance timing.
The private premium is both economically and statistically significant. We estimate that spreads
are more than 30 bps higher for public bonds of private companies than for bonds of public

29
companies. This is remarkable given that high-yield bond spreads in the sample average 431
bps. Despite these pricing differences, bonds of private companies have similar ex post
outcomes as do those of public companies. In contrast, we do not observe a pricing premium for
these same companies in their syndicated loans.
While a private premium has been documented in private debt, that premium is not found
for borrowers with access to the bond market (see Saunders and Steffen (2011)). What is
remarkable about this finding is that these bond issuers are not private companies. They file
regular financial disclosure statements with the SEC.
Our findings suggest a sizable additional cost of being private, especially for companies
that choose to be highly levered. These results have important implications for capital structure.
While many theories suggest that the highest quality companies should issue risky debt, we find
evidence that private issuers are generally riskier companies (see, e.g., Figure 1). Our results
also pose interesting questions for future research. Since the book value of debt offerings is
larger on average than the book value of equity offerings, do the higher costs of private debt
suggest an additional motivation for companies to go public? Are there differences in
information available for public companies that regulators should consider adding to disclosure
rules that would narrow this wedge?

30
References
Altman, E., Farger, N., and Kalotay, E., 2010, A Simple Model of Equity-Implied Probabilities of Default, Working Paper. Amihud, Y., Mendelson, H., 1986. Asset pricing and the bid–ask spread, Journal of Financial Economics 17: 223–249. Bagnani, E. S., Milonas, N. T., Saunders, A., and Travlos, N. G., 1994, Managers, Owners, and the Pricing of Risky Debt: An Empirical Analysis, Journal of Finance, 49: 453-477. Bessembinder, H., and Maxwell, W., 2008, Transparency and the Corporate Bond Market, Journal of Economic Perspectives 22(2): 217-234. Billett, M. T., T. H. D. King, and D. C. Mauer, 2007, Growth Opportunities and the Choice of Leverage, Debt Maturity, and Covenants, Journal of Finance 62: 697-730. Black, F., and Scholes, M., 1973, The Pricing of Options and Corporate Liabilities, Journal of Political Economy 81: 637-654. Boehmer, E., and Ljungqvist, A., 2004, On the Decision to Go Public: Evidence from Privately-Held Firms, Working Paper. Bolton, P., and Freixas, X., 2000, Equity, Bonds, and Bank Debt: Capital Structure and Financial Market Equilibrium under Asymmetric Information. Journal of Political Economy 108(2): 324-351. Boot, A. W. A., and Thakor, A. V., 1997, Financial System Architecture, Review of Financial Studies 10: 693–733. Campbell, J. Y., and Taksler, G. B., 2003, Equity Volatility and Corporate Bond Yields, Journal of Finance 58: 2321-2349.
Chen, L., Lesmond, D.A and Wei, J., 2007, Corporate Yield Spreads and Bond Liquidity, Journal of Finance 62: 117-149. Chemmanur, T. J., and Fulghieri, P. 1994, Reputation, Renegotiation, and the Choice Between Bank Loans and Publicly Traded Debt, Rev. Financial Studies 7: 475–506. Chemmanur, T.J., S. He, and D. Nandi, 2010, The Going Public Decision and the Product market, Rev. Financial Studies 23: 1855-1908. Connife, D., Gash, V., and O'Connell, P. J., 2000, Evaluating State Programmes: "Natural Experiments" and Propensity Scores, The Economic and Social Review 31: 283-308. Diamond, D. W., 1984. Financial Intermediation and Delegated Monitoring. Review of

31
Economic Studies 51: 393-414. Duffie, D. and D. Lando, 2001, Term Structures of Credit Spreads with Incomplete Accounting Information, Econometrica 69: 633-664. Fulghieri, P. and Lukin, D., 2001, Information Production, Dilution Costs, and Optimal Security Design, Journal of Financial Economics 61(1): 3–42. Goldstein, M., and Hotchkiss, E., 2007, Dealer Behavior and the Trading of Newly Issued Corporate Bonds, working paper, Boston College Güntay, L. and Hackbarth, D., 2010, Corporate Bond Spreads and Forecast Dispersion, Journal of Banking & Finance 34: 2328–2345 Hart, Oliver, and Moore, J., 1995, Debt and Seniority: An Analysis of the Role of Hard Claims in Constraining Management, American Economic Review 85: 567–85. Heckman, J. J., H. Ichimura, and P. E. Todd, 1997, Matching as an econometric evaluation
estimator: Evidence from evaluating a job training programme, Review of Economic Studies 64,
605-654.
Helwege, J., and Packer, F., 2009, Private Matters, Journal of Financial Intermediation 18: 362–383 Holmstrom, B., and Tirole, J., 1997, Financial Intermediation, Loanable Funds, and the Real Sector, Quarterly Journal of Economics 112: 663–91. Hoshi, T., Kashyap, A. K., and Scharfstein, D., 1993, The Choice between Public and Private Debt: An Examination of Post-Deregulation Corporate Financing in Japan, NBER Working Paper Series, No. 4421. Huang, R., Ritter, J. R. and Zhang, D., Private Equity Firms’ Reputational Concerns and the Costs of Debt Financing 2013, Available at SSRN: http://ssrn.com/abstract=2205720 or http://dx.doi.org/10.2139/ssrn.2205720 Kaplan, S. N., 1989, The Effects of Management Buyouts on Operating Performance and Value, Journal of Financial Economics 24(2): 217-254. Livingston, M., and Zhou, L., 2002, The Impact of Rule 144A Debt Offerings upon Bond Yields and Underwriter Fees, Financial Management 31: 5-27 Livingston, M. and Zhou, L., 2010, Split Bond Ratings and Information Opacity Premiums. Financial Management 39: 515–532

32
Livingston, M., and Miller, R. E., 2000, Investment Bank Reputation and the Underwriting of Nonconvertible Debt, Financial Management 29: 21-34
Massa, M., Yasuda, A., and Zhang, L., 2009, Investment Horizon of the Bond Investor Base and the Leverage of the Firm, working paper. Mehran, H., and Peristiani, S., 2010, Financial Visibility and the Decision to Go Private, Review of Financial Studies 23 (2): 519-547. Merton, R. C., 1974, On the Pricing of Corporate Debt: The Risk Structure of Interest Rates, Journal of Finance 29: 449-470. Myers, S.C., 1984, The Capital Structure Puzzle, Journal of Finance, 39(3): 575-592. Myers, S. C., and Majluf, N. S., 1984, Corporate Financing and Investment Decisions When Firms Have Information That Investors Do Not Have, Journal of Financial Economics 13: 187–221. Opler, T., and Titman, S., 1993. The Determinants of Leveraged Buyout Activities: Free Flow vs. Financial Distress Costs. Journal of Finance 48:1985–99. Marco, P., Panetta, F., and Zingales, L., 1998, Why Do Companies Go Public? An Empirical Analysis, Journal of Finance, 53(1): 27-64 Repullo, R., and Suarez, J., 2000, Entrepreneurial Moral Hazard and Bank Monitoring: A Model of the Credit Channel, European Economic Review vol. 44(10): 1931-1950 Rosenbaum, P. R., and Rubin, D. B., The Central Role of the Propensity Score in Observational Studies for Causal Effects, Biometrika, 70: pp. 41–55, 1983a. Rubin, D. B., and Thomas, N., 2000, Combining Propensity Score Matching with Additional Adjustments for Prognostic Covariates, Journal of the American Statistical Association 95, 573-585. Santos, João A.C. and Winton, A., 2008, Bank Loans, Bonds, and Information Monopolies Across the Business Cycle, Journal of Finance 63: 1315-1359. Saunders, A., and Steffen, S., 2011, The Costs of Being Private: Evidence from the Loan Market, Review of Financial Studies, forthcoming.

33
TABLE 1: Bond Issuance Patterns Amounts in billions of dollars Panel A: Distribution of Bond Issues by Year
Private Public Total Year N Total Amount N Total Amount N Total Amount 1993 118 21 724 81.1 842 102.1 1994 51 7.6 482 35.9 533 43.5 1995 73 11.2 750 64.5 823 75.7 1996 134 18.2 515 74 649 92.2 1997 212 30.4 613 102 825 132.4 1998 232 42.4 789 155.1 1021 197.5 1999 145 26.1 450 144.8 595 170.9 2000 31 10.9 230 85.8 261 96.7 2001 62 17.9 442 216.2 504 234.1 2002 69 18.6 335 133.5 404 152.1 2003 148 32.7 406 143.7 554 176.4 2004 142 30.7 305 111.1 447 141.8 2005 109 26 243 96.7 352 122.7 2006 88 33.7 245 139.6 333 173.3 2007 58 19.3 301 173.8 359 193.1 2008 35 21.3 198 151.8 233 173.1 2009 40 23 259 182.9 299 205.9 Total 1747 391 7287 2092.5 9034 2483.5
Panel B: Distribution of Bond Issues by Industry Private Public Total
Year N Total Amount N Total Amount N Total Amount Manufacturing 856 172.1 3461 996.4 4317 1168.5 Media 252 75.8 987 392.4 1239 468.2 Phone 11 3.1 89 58.8 100 61.9 Rail 12 2 38 9.2 50 11.2 Retail 141 31.1 838 213.3 979 244.4 Service 399 94.7 1588 359.3 1987 454 Transport 76 12.3 286 63.3 362 75.6 Total 1747 391.1 7287 2092.7 9034 2483.8
Panel C: Distribution of Loan Issues by Year Private Public Total
Year N Total Amount N Total Amount N Total Amount 1993 2,019 255.5 3,109 439.0 5,128 694.5 1994 2,833 338.4 3,688 675.0 6,521 1,013.4 1995 3,547 512.7 3,926 851.7 7,473 1,364.5 1996 4,719 630.2 5,289 979.2 10,008 1,609.4 1997 6,420 944.6 6,705 1,436.4 13,125 2,381.0 1998 5,236 800.8 5,731 1,139.8 10,967 1,940.6 1999 5,355 834.7 5,929 1,387.0 11,284 2,221.7 2000 6,197 990.5 6,055 1,689.5 12,252 2,680.0 2001 5,841 827.7 6,166 1,618.2 12,007 2,445.9 2002 5,505 771.3 6,175 1,405.1 11,680 2,176.4

34
2003 6,477 877.8 6,408 1,458.3 12,885 2,336.1 2004 8,186 1,118.9 6,978 1,976.1 15,164 3,095.0 2005 9,463 1,468.0 7,053 2,448.0 16,516 3,916.1 2006 11,169 1,746.0 6,821 2,714.3 17,990 4,460.3 2007 10,982 2,053.8 6,567 3,081.5 17,549 5,135.3 2008 8,432 1,566.4 4,587 1,801.7 13,019 3,368.1 2009 6,463 1,212.0 2,794 991.3 9,257 2,203.2 Total 108,844 16,949.5 93,981 26,092.0 202,825 43,041.5
Panel D: Distribution of Loan Issues by Industry Industry N Total Amount N Total Amount N Total Amount Construction 4,713 559.8 1,921 425.2 6,634 985.1
Fin., Ins. & Real Estate 23,605 4,236.3 21,551 5,181.9 45,156 9,418.1 Manufacturing 26,644 3,185.5 30,001 7,855.7 56,645 11,041.2 Mining 3,860 1,160.3 4,377 1,550.9 8,237 2,711.3 Public Admin. 2,601 859.6 62 8.0 2,663 867.5 Retail Trade 4,090 538.7 5,592 1,279.6 9,682 1,818.3 Services 12,063 1,395.8 11,265 2,445.5 23,328 3,841.4 Wholesale Trade 4,307 517.5 3,733 920.4 8,040 1,437.9 Other 15,413 3,191.0 13,988 6,216.1 29,401 9,407.1 Not Available 11,548 1,304.9 1,491 208.6 13,039 1,513.6 Total 108,844 16,949.5 93,981 26,092.0 202,825 43,041.5
Note: The sample consists of 9,034 new bond issuances from 2,288 issuers from January 4, 1993 to July 31, 2009, as well as 202,825 new syndicated loans from 56,213 issuers. Private companies have no publicly traded equity at the date of issuance. Amount is the offer amount in billions.

35
FIGURE 1: Public Bond Ratings at Issuance, by Issuer Equity Ownership

36
Table 2: Summary Statistics Panel A: Loan Characteristics
N Mean SD P25 P50 P75 Sig. Diff?
Loan Characteristics
All in Drawn spread Public
4,251 165.912 136.784 45.000 150.000 250.000
***
Private 2,246 274.757 119.733 225.000 250.000 300.000
Facility amount ($m) Public
5,312 644.302 1290.868 120.000 275.000 675.000
***
Private 2,837 200.402 355.328 50.000 100.000 200.000
Time to maturity (months) Public
5,133 54.754 36.453 18 60 72
***
Private 2,742 72.201 29.323 60 72 84
First loan dummy Public
5,312 0.288 0.453 0 0 1
***
Private 2,837 0.702 0.457 0 1 1
Secured dummy Public
3,062 0.650 0.477 0 1 1
***
Private 1,957 0.943 0.232 1 1 1
Number in syndicate Public
5,295 11.271 11.363 3 8 16
***
Private 2,835 7.471 9.775 2 4 9
Term Loan dummy Public
5,312 0.124 0.330 0 0 0
***
Private 2,837 0.253 0.435 0 0 1
Revolver dummy Public
5,312 0.597 0.491 0 1 1
***
Private 2,837 0.399 0.490 0 0 1
Business purposes dummy Public
5,312 0.587 0.492 0 1 1
***
Private 2,837 0.402 0.490 0 0 1
Deal purpose dummy Public
5,312 0.280 0.449 0 0 1
***
Private 2,837 0.564 0.496 0 1 1
Financials
Total assets Public
5,055 13.262 50.499 1.110 3.103 10.244
***
Private 1,565 1.667 3.613 0.286 0.602 1.219
Total debt assets Public
5,055 0.474 0.334 0.310 0.424 0.579
***
Private 1,565 0.760 0.687 0.564 0.682 0.836
EBITDA to assets Public 4,756 0.125 0.088 0.079 0.114 0.156 ***
Private 0.114 0.061 0.074 0.100 0.145

37
1,157 Panel A: Loan Characteristics (cont’d)
N Mean SD P25 P50 P75 Sig. Diff?
Opacity Measures
Split ratings Public
5,312 0.3771 0.4847 0 0 1
Private
2,837 0.3606 0.4803 0 0 1
SD ROA Public
4,300 0.0077 0.0094 0.003 0.005 0.009
***
Private 1,419 0.0095 0.0102 0.004 0.007 0.012 Equity Value and Ownership Measures
HEV ($b) Public
4,619 50.708 123.735 3.225 10.906 40.558
***
Private 1,122 6.179 17.344 0.728 1.772 4.700
Equity Value ($b) Public
5,032 11.411 30.048 0.571 1.953 8.252
Blockholder >25% Public
5,312 0.022 0.147 0 0 0
Note: The sample consists of 8,149 loans from 1,901 issuers from January 4, 1993 to July 31, 2009 for which financial information was available. Loan characteristics are calculated at issuance and financial characteristics are calculated as of the quarter preceding issuance. All-in Drawn Spread is the amount the borrower pays over LIBOR at issuance of the loan. Facility amount is the natural log of the total facility amount in $ millions. Time to maturity is the natural log of the maturity of each loan in months. First Loan dummy is a dummy variable equal to one if the syndicated loan is the first since 1981 issued by the issuer. Secured dummy is equal to one if the loan is secured. Number in syndicate is the numbers of lenders in the syndicate. Each of the next two dummy variables is equal to one if the type of loan facility falls in that category (bond or term loan). Business Purposes dummy is equal to one if the loan was issued for general corporate purposes, including capital expenditures and debt repayment. Deal purpose dummy is equal to one if the loan was issued in order to complete an LBO, SBO, Spinoff, Stock buyback, etc. Total assets ($b) is the natural log of the total book assets. Total debt to assets is total debt divided by assets. EBITDA to assets is the latest 12 months earnings before interest taxes depreciation and amortization, divided by total assets. Split rating is a dummy variable equal to 1 if the rating from S&P is different from Moody’s. 144A is a dummy variable equal to 1 if the bonds were first issued only to qualified institutional buyers under Rule 144A. Top underwriter is a dummy variable equal to 1 if the company’s bond underwriter had a market share in the previous year of greater than 1% (equivalent to a top 15 ranking). SD ROA is the standard deviation of the 4 quarters of ROA following bond issuance. HEV ($b) is the hypothetical equity value reported in billions. Equity Value ($b) is the market value of the equity of public firms in the sample (share price multiplied by shares outstanding) calculated at issuance. Blockholder >25% is a dummy variable equal to one if the company has a blockholder greater than 25% reported by Spectrum. % Ownership is the percent of maximum shares owned. # of trades is the number of trades reported on NASDs TRACE database from July 1, 2002 to December 22, 2009. Average Trade Volume is the ratio of volume traded to number of trades. ***, **, and * indicate significance at the 1%, 5%, and 10% levels of significance, respectively.

38
Panel B: Bond Characteristics
N Mean SD P25 P50 P75 Sig. Diff? Bond Characteristics
Offering spread (%) Public
4,993 1.9806 1.8182 0.6450 1.2226 2.9291
***
Private 1,131 4.6278 1.9673 3.4945 4.5398 5.9438
Offering amount ($m) Public
4,993 290.883 394.601 50 200 370
***
Private 1,131 229.832 201.938 115 165 260
Time to maturity (yr) Public
4,993 9.821 7.291 5 10 10
***
Private 1,131 9.056 2.941 8 10 10
First bond issue dummy Public
4,993 0.158 0.365 0 0 0
***
Private 1,131 0.623 0.485 0 1 1
Secured dummy Public
4,993 0.021 0.143 0 0 0
***
Private 1,131 0.103 0.304 0 0 0
Call dummy Public
4,993 0.661 0.473 0 1 1
***
Private 1,131 0.113 0.317 0 0 0
Investment Grade dummy Public
4,993 0.548 0.498 0 1 1
***
Private 1,131 0.911 0.285 1 1 1
Put dummy Public
4,993 0.010 0.099 0 0 0
***
Private 1,131 0.000 0.000 0 0 0
Financial Characteristics
Total assets ($b) Public
4,851 36.927 106.965 2.467 7.023 24.619
***
Private 605 2.368 5.136 0.254 0.593 1.501
Total debt to assets Public
4,851 0.412 0.245 0.262 0.365 0.509
***
Private 605 0.759 1.032 0.547 0.668 0.803
EBITDA to total assets Public
4,530 0.135 0.104 0.082 0.124 0.173
***
Private 456 0.116 0.059 0.077 0.102 0.149

39
Panel B: Bond Characteristics (cont’d)
N Mean SD P25 P50 P75 Sig. Diff? Information Characteristics
Split ratings dummy Public
4,993 0.3433 0.4749 0 0 1
**
Private 1,131 0.3767 0.4848 0 0 1
144a dummy Public
4,993 0.2762 0.4472 0 0 1
***
Private 1,131 0.8134 0.3897 1 1 1
Top underwriter dummy Public
4,401 0.9252 0.2630 1 1 1
***
Private 1,103 0.8314 0.3746 1 1 1
SD ROA Public
4,018 0.0067 0.0081 0.002 0.004 0.008
***
Private 559 0.0096 0.0116 0.003 0.007 0.011 Equity Value and Ownership Measures
HEV ($b) Public
4,437 85.634 152.272 8.941 28.846 89.725
***
Private 440 10.904 30.494 0.809 1.920 5.892
Equity Value ($b) Public
4,820 22.555 41.163 1.346 5.252 23.527
Blockholder >25% Public
4,993 0.012 0.107 0 0 0
% Ownership Public
4,993 5.045 6.148 0 3.74077 8.688
Liquidity
# of trades Public
688 398.201 525.612 95 235 509
Private 19 224.842 196.676 86 182 251
Average Trade Vol ($m) Public
688 1.699 0.869 1.027 1.642 2.327
Private 19 1.642 0.750 1.000 1.651 2.081
Note: The sample consists of 6,124 bonds from 1,857 issuers from January 4, 1993 to July 31, 2009 for which financial information was available. Bond characteristics are calculated at issuance and financial characteristics are calculated as of the quarter preceding issuance. Offering Spread is the difference between the yield at issuance of a bond and the yield of a Treasury bond with comparable maturity. Offering amount is the total offering amount in $ millions. Time to maturity is the maturity of each bond in years. First bond issue dummy is a dummy variable equal to one if the bond is the first since 1988 issued by the issuer. Secured dummy is equal to one if the bond is secured. Call dummy and Put dummy are dummy variables equal to one if the bond has a call or put provision. Total assets ($b) is total book assets. Total debt to assets is total debt divided by assets. EBITDA to assets is the latest 12 months earnings before interest taxes depreciation and amortization, divided by total assets. Split rating is a dummy variable equal to 1 if the rating from S&P is different from Moody’s. 144A is a dummy variable equal to 1 if the bonds were first issued only to qualified institutional buyers under Rule 144A. Top underwriter is a dummy variable equal to 1 if the company’s bond underwriter had a market share in the previous year of greater than 1% (equivalent to a top 15 ranking). SD ROA is the standard deviation of the 4 quarters of ROA following bond issuance. HEV ($b) is the hypothetical equity value reported in billions. Equity Value ($b) is the market value of the equity of public firms in the sample (share price multiplied by shares outstanding) calculated at issuance. Blockholder >25% is a

40
dummy variable equal to one if the company has a blockholder greater than 25% reported by Spectrum. % Ownership is the percent of maximum shares owned. # of trades is the number of trades reported on NASDs TRACE database from July 1, 2002 to December 22, 2009. Average Trade Volume is the ratio of volume traded to number of trades. ***, **, and * indicate significance at the 1%, 5%, and 10% levels of significance, respectively.
41
Table 3: Offering Spreads
Panel A: Bonds
COEFFICIENT (1) (2) (3) (4) (5) (6)
Private dummy 1.867*** 0.742*** 0.350*** 0.310*** 0.304*** 0.305
(0.103) (0.104) (0.081) (0.066) (0.068) (0.234)
Offer amount 0.071*** 0.176*** 0.161*** 0.0246 0.022 0.007
(0.024) (0.021) (0.022) (0.016) (0.016) (0.013)
Time to maturity -0.155*** -0.328*** -0.173*** 0.003 0.007 0.0850***
(0.046) (0.042) (0.044) (0.032) (0.032) (0.032)
Secured dummy 2.403*** 1.765*** 1.529*** 1.293*** 1.299*** 1.347***
(0.268) (0.230) (0.215) (0.179) (0.180) (0.221)
Call dummy 1.633*** 0.993*** 0.476*** 0.056 0.054 0.084
(0.075) (0.094) (0.082) (0.051) (0.051) (0.054)
Put dummy -0.629*** -0.852*** -0.601*** -0.386*** -0.381*** -0.532***
(0.113) (0.125) (0.078) (0.060) (0.0608) (0.129)
Total assets -0.380*** -0.074*** -0.141*** -0.152*** -0.107*
(0.029) (0.027) (0.019) (0.019) (0.057)
EBITDA to assets -3.278*** -0.924** -1.349*** -1.350*** -0.899**
(1.068) (0.364) (0.428) (0.421) (0.412)
Total debt to assets 1.596*** 0.288** 0.229** 0.225** 0.840***
(0.232) (0.128) (0.104) (0.104) (0.180)
Fixed effects:
Ratings dummies No No Yes Yes Yes Yes
Industrial sector dummies No No No No Yes No
Quarter of issue dummies No No No Yes Yes Yes
Individual company dummies No No No No No Yes
Observations 4986 4986 4986 4986 4986 4986
Adjusted R-squared 0.40 0.57 0.70 0.81 0.81 0.89 Note: The sample used consists of 4,986 bonds from 1,296 issuers from January 4, 1993 to July 31, 2009, where observations have full complement of covariates. The dependent variable is Offering Spread, the difference between the yield at issuance of a bond and the yield of a Treasury bond with comparable maturity. Private is a dummy variable equal to one if the issuing company has no publicly traded equity at time of issue. Offering amount is the natural log of the total offering amount in $ millions. Time to maturity is the natural log of the maturity of each bond in years. Secured dummy is equal to one if the bond is secured. Call dummy and Put dummy are dummy variables equal to one if the bond has a call or put provision. Total assets ($b) is the natural log of the total book assets. Total debt to assets is total debt divided by assets. EBITDA to assets is the latest 12 months earnings before interest taxes depreciation and amortization, divided by total assets. Ratings, industrial sector, quarter of issue and individual company dummies are included as fixed effects. Ratings is the Moody’s rating within six months of issuance and augmented with S&P ratings if Moody’s ratings are absent. Industrial sector are dummies for Manufacturing, Media, Retail, Railroad, Service and Telecommunications industry sectors. Quarter of Issue is equal to one if the bond is issued at the corresponding year and quarter. Individual company is a fixed effect for bond issuer. Robust standard errors clustered by quarter of issue are in parentheses. ***, **, and * indicate significance at the 1%, 5%, and 10% levels of significance, respectively.

42
Panel B: Loans
COEFFICIENT (1) (2) (3) (4) (5) (6)
Private dummy 29.91*** 19.62*** 14.56** 7.931 8.763 26.97
(5.83) (5.74) (5.84) (5.29) (5.30) (20.4)
Facility amount -17.89*** -12.60*** -9.529*** -8.188*** -8.273*** -3.676
(2.22) (2.43) (2.28) (2.11) (2.12) (2.59)
Time to maturity (months) 2.166 -0.0262 -7.093** -0.914 -1.285 0.909
(3.34) (3.35) (3.06) (2.88) (2.85) (2.61)
Secured dummy 99.02*** 84.61*** 36.19*** 35.39*** 36.52*** 17.07**
(5.66) (6.81) (7.71) (6.85) (7.01) (8.44)
Secured missing 15.20*** 12.35** 2.951 8.939** 9.840** 2.560
(4.77) (5.02) (4.57) (3.92) (3.92) (4.18)
Number of lenders -0.963*** -0.991*** -0.886*** -0.547*** -0.536*** -0.605***
(0.23) (0.23) (0.21) (0.17) (0.17) (0.17)
Bond dummy 130.7*** 117.9*** 120.0*** 145.0*** 145.2*** 181.1***
(19.2) (18.0) (16.3) (18.5) (19.2) (21.3)
TL dummy 1.934 0.860 -5.960 -6.592 -5.684 -19.52**
(10.8) (10.7) (10.5) (8.73) (8.85) (9.48)
Revolver Dummy -70.74*** -67.91*** -56.50*** -48.90*** -48.54*** -45.43***
(9.78) (9.49) (8.41) (6.65) (6.73) (6.71)
Term Loan C-G dummy 25.21** 25.96** 10.60 7.694 8.965 -7.830
(11.6) (11.6) (11.7) (11.0) (11.1) (11.7)
Business Purposes dummy 15.47* 13.46* -3.753 9.203 9.556 9.149
(7.92) (7.57) (6.95) (6.56) (6.44) (5.52)
Deal Purpose dummy 24.92*** 15.77* 2.741 26.17*** 27.11*** 28.15***
(9.03) (9.19) (8.62) (6.40) (6.32) (5.82)
Project Purpose dummy -48.01 -41.63 -23.98 5.570 1.626 26.96
(29.4) (26.6) (23.2) (18.4) (17.9) (19.4)
Total Assets -4.305 7.906*** 0.640 -0.235 -2.827
(2.72) (2.84) (2.58) (2.56) (4.40)
EBITDA to assets -229.1*** -81.77** -92.42** -93.81** -58.19
(81.7) (40.4) (43.3) (43.3) (39.1)
Total debt to assets 60.20*** 23.52** 26.37** 25.91** 51.50***
(16.3) (11.6) (11.4) (11.5) (14.8)
Fixed effects:
Ratings dummies No No Yes Yes Yes Yes
Industrial sector dummies No No No No Yes No
Quarter of issue dummies No No No Yes Yes Yes
Individual company dummies No No No No No Yes
Observations 4697 4697 4697 4697 4697 4697
Adjusted R-squared 0.45 0.48 0.55 0.66 0.66 0.75 Note: The sample used consists of 4,697 loans from 1,220 issuers from January 4, 1993 to July 31, 2009, where observations have full complement of covariates. The dependent variable is All-in Drawn Spread, the amount the borrower pays over LIBOR at issuance of the loan. Private is a dummy variable equal to one if the issuing company has no publicly traded equity

43
at time of issue. Facility amount is the natural log of the total facility amount in $ millions. Time to maturity is the natural log of the maturity of each loan in months. Secured dummy is equal to one if the loan is secured, and Secured missing is equal to one if data on the secured status is not available. Number of lenders is the numbers of lenders in the syndicate. Each of the next three dummy variables is equal to one if the type of loan facility falls in that category (bond, term loan or revolver). Business Purposes dummy is equal to one if the loan was issued for general corporate purposes, including capital expenditures and debt repayment. Deal purpose dummy is equal to one if the loan was issued in order to complete an LBO, SBO, Spinoff, Stock buyback, etc. Project dummy is equal to one if the loan was issued as part of a project financing (includes equipment purchases). Total assets ($b) is the natural log of the total book assets. Total debt to assets is total debt divided by assets. EBITDA to assets is the latest 12 months earnings before interest taxes depreciation and amortization, divided by total assets. Ratings, industrial sector, quarter of issue and individual company dummies are included as fixed effects. Ratings is the Moody’s rating within six months of issuance and augmented with S&P ratings if Moody’s ratings are absent. Industrial sector are dummies for Manufacturing, Media, Retail, Railroad, Service and Telecommunications industry sectors. Quarter of Issue is equal to one if the bond is issued at the corresponding year and quarter. Individual company is a fixed effect for bond issuer. Robust standard errors clustered by quarter of issue are in parentheses. ***, **, and * indicate significance at the 1%, 5%, and 10% levels of significance, respectively.

44
Table 4: Probit Model of Being Private
Panel A: Bonds
(1) (2) (3) (4)
Offer amount 0.094*** 0.240*** 0.249*** (0.033) (0.042) (0.046)
Time to Maturity (m) -0.018 -0.234*** -0.244*** (0.052) (0.081) (0.088)
Secured dummy 0.454*** 0.261* 0.260* (0.109) (0.140) (0.140)
Inv grade dummy -1.273*** -0.009 -3.682*** (0.051) (0.115) (0.242)
Call dummy 0.428*** 0.373*** 0.333** (0.102) (0.139) (0.149)
Total assets (log) -0.298*** -0.396*** -0.372*** (0.034) (0.041) (0.042)
EBITDA to total assets -4.379*** -4.285*** -3.565*** (0.835) (0.905) (0.830)
Total debt to total assets 1.403*** 1.365*** 1.228*** (0.170) (0.218) (0.216)
Manufct sector dummy 0.640* 0.730** (0.327) (0.358)
Media sector dummy 0.732** 0.821** (0.329) (0.356)
Rail sector dummy 1.533*** 1.974*** (0.517) (0.612)
Retail sector dummy 0.554* 0.768** (0.331) (0.359)
Service sector dummy 0.647** 0.754** (0.327) (0.356)
Transport sector dummy 0.854** 1.083*** (0.369) (0.396)
Ratings dummies No Yes No Yes
N 6124 4986 4986 4986 Pseudo R2 0.232 0.329 0.345 0.358 chi2 789.162*** 730.441*** 460.094*** 2954.938***
Note: Column (1) presents PROBIT estimation on the full sample consisting of 6,124 observations from 1,857 issuers from January 4, 1993 to July 31, 2009. Column (2) to (4) presents PROBIT estimations for the 4,986 observations from 1,296 issuers where observations have full complement of covariates. The dependent variable is Private, a dummy variable equal to one if the issuing company has no publicly traded equity at time of issue. Offering amount is the natural log of the total offering amount in $ millions. Time to maturity is the natural log of the maturity of each bond in years. First bond issue dummy is a dummy variable equal to one if the bond is the first since 1988 issued by the issuer. Secured dummy is equal to one if the bond is secured. Call dummy and Put dummy are dummy variables equal to one if the bond has a call or put provision. Total assets ($b) is the natural log of the total book assets. Total debt to assets is total debt divided by assets. EBITDA to assets is the latest 12 months earnings before interest taxes depreciation and amortization, divided by total assets. Dummy variables for each of the industrial sectors are presented: Manufacturing, Media, Rail, Retail, Service and telecommunications. Ratings dummies include fixed effects for each Moody’s letter rating or the S&P equivalent. Robust

45
standard errors clustered by quarter of issue are in parentheses. ***, **, and * indicate significance at the 1%, 5%, and 10% levels of significance, respectively.
Panel B: Loans (1) (2) (3) (4)
Facility amount -0.313*** -0.081** -0.072* (0.029) (0.037) (0.038)
Time to maturity (months) 0.170*** 0.099* 0.089 (0.033) (0.055) (0.054)
Secured dummy 0.681*** 0.448*** 0.352*** (0.081) (0.100) (0.115)
Secured missing 0.507*** 0.458*** 0.400*** (0.079) (0.100) (0.111)
No. of lenders -0.006** -0.006 -0.004 (0.003) (0.004) (0.004)
Bond dummy 0.404*** -0.083 -0.064 (0.088) (0.123) (0.127)
Term Loan dummy 0.398*** 0.356*** 0.329*** (0.069) (0.102) (0.099)
Revolver dummy 0.072 0.031 0.046 (0.054) (0.077) (0.075)
Term Loan C-G dummy 0.377** 0.31 0.276 (0.148) (0.201) (0.193)
Business Purposes dummy 0.213** 0.069 0.039 (0.089) (0.144) (0.148)
Deal purpose dummy 0.701*** 0.302* 0.23 (0.109) (0.162) (0.165)
Project dummy 0.144 0.03 0.094 (0.251) (0.347) (0.340)
Total assets (log) -0.254*** -0.271*** -0.230*** (0.043) (0.039) (0.048)
EBITDA to total assets -3.461*** -3.642*** -3.172*** (0.941) (0.998) (0.976)
Total debt to total assets 1.070*** 1.067*** 0.976*** (0.159) (0.161) (0.149)
Manufct sector dummy 0.563** 0.510* (0.285) (0.261)
Media sector dummy 0.253 0.258 (0.307) (0.296)
Rail sector dummy 1.517** 1.386** (0.651) (0.633)
Retail sector dummy 0.530* 0.495* (0.307) (0.282)
Service sector dummy 0.378 0.347 (0.286) (0.260)
Transport sector dummy 0.652* 0.678* (0.377) (0.359)
Ratings dummies No Yes No Yes
N 7859 5501 5501 5501

46
Pseudo R2 0.2 0.246 0.248 0.263 chi2 793.261*** 383.225*** 476.781*** 749.378***
Note: Column (1) presents PROBIT estimation on the full sample consisting of 7,859 observations from 1,892 issuers from January 4, 1993 to July 31, 2009. Column (2) to (4) presents PROBIT estimations for the 5,501 observations from 1,323 issuers where observations have full complement of covariates. The dependent variable is Private, a dummy variable equal to one if the issuing company has no publicly traded equity at time of issue. Facility amount is the natural log of the total facility amount in $ millions. Time to maturity is the natural log of the maturity of each loan in months. Secured dummy is equal to one if the loan is secured, and Secured missing is equal to one if data on the secured status is not available. Number of lenders is the numbers of lenders in the syndicate. Each of the next three dummy variables is equal to one if the type of loan facility falls in that category (bond, term loan or revolver). Business Purposes dummy is equal to one if the loan was issued for general corporate purposes, including capital expenditures and debt repayment. Deal purpose dummy is equal to one if the loan was issued in order to complete an LBO, SBO, Spinoff, Stock buyback, etc. Project dummy is equal to one if the loan was issued as part of a project financing (includes equipment purchases). Total assets ($b) is the natural log of the total book assets. Total debt to assets is total debt divided by assets. EBITDA to assets is the latest 12 months earnings before interest taxes depreciation and amortization, divided by total assets. Ratings, industrial sector, quarter of issue and individual company dummies are included as fixed effects. Ratings is the Moody’s rating within six months of issuance and augmented with S&P ratings if Moody’s ratings are absent. Industrial sector are dummies for Manufacturing, Media, Retail, Railroad, Service and Telecommunications industry sectors. Quarter of Issue is equal to one if the bond is issued at the corresponding year and quarter. Individual company is a fixed effect for bond issuer. Robust standard errors clustered by quarter of issue are in parentheses. ***, **, and * indicate significance at the 1%, 5%, and 10% levels of significance, respectively.

47
TABLE 5: Propensity Score Matching for Private Issuers
Panel A: Bonds
Procedure Coefficient Standard Error
Panel A: OLS Estimates
0.304*** (0.068)
Panel B: Nearest Neighbor Matching (Variable Set 1)
NN 2 BS 50 0.357*** (0.136)
BS 100 0.357*** (0.135)
BS 300 0.357*** (0.133)
w/o BS 0.357*** (0.134)
NN 5 BS 50 0.328*** (0.121)
BS 100 0.328*** (0.121)
BS 300 0.328*** (0.118)
w/o BS 0.328*** (0.123)
Panel C: Local Linear Matching (Variable Set 1)
Gaussian BS 50 0.439*** (0.082)
BS 100 0.439*** (0.096)
BS 300 0.439*** (0.099)
w/o BS 0.439*** (0.113)
Panel D: Nearest Neighbor Matching (Variable Set 2)
NN 2 BS 50 0.328** (0.141)
BS 100 0.328** (0.130)
BS 300 0.328*** (0.118)
w/o BS 0.328** (0.134)
NN 5 BS 50 0.411*** (0.106)
BS 100 0.411*** (0.115)
BS 300 0.411*** (0.116)
w/o BS 0.411*** (0.125)
Panel E: Local Linear Matching (Variable Set 2)
Gaussian BS 50 0.406*** (0.117)
BS 100 0.406*** (0.102)
BS 300 0.406*** (0.095)
w/o BS 0.406*** (0.115)
Note: The sample used consists of 4,887 bonds from 1,271 issuers from January 4, 1993 to July 31, 2009, where each observation has data for all variables. Propensity score matching uses two variable sets. The first set matches ratings, industry, assets, profitability and leverage (see Specification (2) of Table 4). The second set matches ratings, industry, offer amount, maturity, secure dummy, call dummy, put dummy, assets, profitability, and leverage (see Specification (4) of Table 4). The dependent variable is Offering Spread, the difference between the yield at issuance of a bond and the yield of a Treasury bond with comparable maturity. Offering amount is the natural log of the total offering amount in $ millions. Time

48
to maturity is the natural log of the maturity of each bond in years. First bond issue dummy is a dummy variable equal to one if the bond is the first since 1988 issued by the issuer. Secured dummy is equal to one if the bond is secured. Call dummy and Put dummy are dummy variables equal to one if the bond has a call or put provision. Total assets ($b) is the natural log of the total book assets. Leverage is total debt divided by assets. Profitability is the latest 12 months earnings before interest taxes depreciation and amortization, divided by total assets. Ratings and industry fixed effects are included in both variable sets. Panel A(I) presents OLS estimates of Private dummy coefficient using OLS regression. Panel A(II) uses nearest neighbor matching with Variable Set 1. Panel A(III) uses local linear matching with Variable Set 1. Panel A(IV) and A(V) are analogues of Panel A(II) and A(III) but use Variable Set 2. The procedure NN2 stands for match on 2 nearest neighbors; NN5 stands for match on 5 nearest neighbors. BS stands for standard error bootstrapped with the following number of replications. ***, **, and * indicate significance at the 1%, 5%, and 10% levels of significance, respectively.

49
Panel B: Loans
Procedure Coefficient Standard Error
I: OLS Estimates
8.763 (5.30)
II: Nearest Neighbor Matching (Variable Set 1)
NN 2 BS 50 9.171 (8.692)
BS 100 9.171 (7.900)
BS 300 9.171 (9.117)
w/o BS 9.171 (8.311)
NN 5 BS 50 11.920 (9.176)
BS 100 11.920 (7.902)
BS 300 11.920 (7.864)
w/o BS 11.920* (6.614)
III: Local Linear Matching (Variable Set 1)
Gaussian BS 50 8.115 (5.637)
BS 100 8.115* (4.690)
BS 300 8.115 (5.090)
w/o BS 8.115 (5.534)
IV: Nearest Neighbor Matching (Variable Set 2)
NN 2 BS 50 7.645 (4.654)
BS 100 7.645 (5.774)
BS 300 7.645 (6.269)
w/o BS 7.645 (6.311)
NN 5 BS 50 9.018 (5.661)
BS 100 9.018 (5.694)
BS 300 9.018 (5.314)
w/o BS 9.018 (5.783)
V: Local Linear Matching (Variable Set 2)
Gaussian BS 50 11.520*** (4.199)
BS 100 11.520** (5.030)
BS 300 9.018* (5.314)
w/o BS 9.018 (5.783)
VI: Nearest Neighbor Matching (Variable Set 3)
NN 2 BS 50 11.520*** (4.199)
BS 100 11.520** (5.030)
BS 300 9.018 (5.497)
w/o BS 9.018 (5.783)
NN 5 BS 50 11.520*** (3.762)
BS 100 9.018* (5.455)
BS 300 9.018 (5.520)
w/o BS 9.018 (5.783)

50
VII: Local Linear Matching (Variable Set 3)
Gaussian BS 50 11.520*** (3.762)
BS 100 11.520*** (4.256)
BS 300 11.520*** (4.363)
w/o BS 11.520** (5.440) Note: A propensity score matching exercise is performed on the sample of 4,690 observations from 1,205 issuers from January 4, 1993 to July 31, 2009 where each observation has data for all variables. Three variable sets for matching loans are used. The first set matches ratings, industry, assets, profitability and leverage (see Specification (2) of Table 4). The second set matches offer amount, maturity, secure dummy, number of lenders, loan type dummies, deal purpose dummies, assets, profitability, leverage, ratings, and industry (see Specification (4) of Table 4). The third set matches based on the same variables as the second set, but in the following order: loan type dummies, offer amount, maturity, secure dummy, number of lenders, deal purpose dummies, assets, profitability, leverage, ratings, and industry. The dependent variable is All-in Drawn Spread, the amount the borrower pays over LIBOR at issuance of the loan. Private is a dummy variable equal to one if the issuing company has no publicly traded equity at time of issue. Facility amount is the natural log of the total facility amount in $ millions. Time to maturity is the natural log of the maturity of each loan in months. Secured dummy is equal to one if the loan is secured, and Secured missing is equal to one if data on the secured status is not available. Number of lenders is the numbers of lenders in the syndicate. Each of the next three dummy variables is equal to one if the type of loan facility falls in that category (bond, term loan or revolver). Business Purposes dummy is equal to one if the loan was issued for general corporate purposes, including capital expenditures and debt repayment. Deal purpose dummy is equal to one if the loan was issued in order to complete an LBO, SBO, Spinoff, Stock buyback, etc. Project dummy is equal to one if the loan was issued as part of a project financing (includes equipment purchases). Total assets ($b) is the natural log of the total book assets. Total debt to assets is total debt divided by assets. Profitability is the latest 12 months earnings before interest taxes depreciation and amortization, divided by total assets. Ratings and industry fixed effects are included in all variable sets. Panel B(I) presents OLS estimates of Private dummy coefficient using OLS regression. Panel B(II) uses nearest neighbor matching with Variable Set 1. Panel B(III) uses local linear matching with Variable Set 1. Panel B(IV), B(V), B(VI), and B(VII) are analogues of Panel B(II) and B(III) but use Variable Sets 2 and 3. The procedure NN2 stands for match on 2 nearest neighbors; NN5 stands for match on 5 nearest neighbors. BS stands for standard error bootstrapped with the following number of replications. ***, **, and * indicate significance at the 1%, 5%, and 10% levels of significance, respectively.

51
TABLE 6: Ex Post Outcomes
(1) (2) (3) (4) (5) (6) (7) (8)
Dependent Variable Bankrupt Bankrupt Downgrade Upgrade
Called Aftermkt Aftermkt CDS
(<2007) w/in 1 yr w/in 1 yr Liquidity Pricing
Private dummy -0.091 -0.092 -0.205* 0.008 0.919*** 0.806 0.043 0.000
(0.079) (0.080) (0.107) (0.110) (0.276) (0.909) (0.172) (0.002)
Offer amount 0.157*** 0.155*** 0.100*** -0.013 -0.195** -2.73 0.007
(0.036) (0.036) (0.037) (0.038) (0.091) (2.704) (0.053)
Time to maturity -0.137* -0.141** 0.076* -0.074 1.728*** 0.126 -0.135*
(0.070) (0.071) (0.043) (0.048) (0.138) (0.099) (0.067)
Secured dummy 0.299** 0.305** 0.202 0.016 0.429 1.117 -0.005
(0.126) (0.129) (0.129) (0.145) (0.308) (1.063) (0.207)
Call dummy -0.084 -0.079 -0.082 -0.215** 1.158 -0.317**
(0.095) (0.095) (0.078) (0.089) (1.057) (0.152)
Put dummy 0.563** 0.562** 0.043 -0.131 -3.634*** 1.389 0.048
(0.232) (0.231) (0.233) (0.215) (0.739) (1.440) (0.090)
Total assets -0.022 -0.021 -0.088*** 0.238*** -0.272*** 1.149 -0.011 0.0000
(0.040) (0.041) (0.025) (0.035) (0.089) (0.888) (0.023) (0.000)
EBITDA to total assets -2.707*** -2.578*** -1.320*** 1.174** -0.784* 2.831 -1.219** -0.003
(0.778) (0.782) (0.347) (0.482) (0.436) (2.728) (0.500) (0.006)
Total debt to total assets 0.524*** 0.511*** 0.427*** -0.612** 0.228 0.415 0.546* 0.0000
(0.195) (0.197) (0.123) (0.240) (0.421) (0.617) (0.303) (0.001)
Loan dummy -0.171** -0.174** 0.071 -0.026 0.344** 0.655 -0.013 0.0000
(0.067) (0.068) (0.067) (0.061) (0.156) (0.612) (0.045) (0.002)
Fixed effects:
Ratings dummies Yes Yes Yes Yes Yes Yes Yes Yes
Quarter of issue dummies Yes Yes Yes Yes Yes Yes Yes Yes
Industrial sector dummies Yes Yes Yes Yes Yes Yes Yes Yes
Observations 6,256 5,882 6,957 6,888 7,110 1,353 1,348 1,271 Pseudo R-squared 0.258 0.251 0.128 0.133 0.633 - - R-squared - - - - - 0.054 0.174 0.534

52
Note: In Columns (1)-(5), the sample is drawn from the 7,155 observations from 1,720 issuers from January 4, 1993 to July 31, 2009 where each observation has financial data with the exception of specification (2) which includes only bonds issued before December 31, 2007 . Varying number of observations reflect the restrictions from the dependent variables. The sample for Columns (6) and (7) are the 7,155 bonds with trading information from NASD’s Trade Reporting and Compliance Engine (TRACE). Columns (1) - (5) use a probit regression model; Columns (6) and (7) use an OLS regression model. The dependent variable in the first two specifications is Bankrupt, a dummy variable equal to one if the issuer ever entered into bankruptcy. The dependent variable in specification (3) is Downgrade w/in 1 yr, a binary variable equal to one if the issued bond was downgraded within one year of issuance. The dependent variable in specification (4) is Upgrade w/in 1 yr is equal to one if the issued bond was upgraded within one year of issuance; The dependent variable in specification (5) is Called is equal to one if the bond was called. The dependent variable in specification (6) is Liquidity, defined as the total trading volume from TRACE for one year, a year after issuance divided by the offering amount. The dependent variable in specification (7) is Pricing, defined as the matched-maturity spread one year after issuance divided by the match-maturity spread at time of issue. The dependent variable in specification (8) is the market pricing of each firm’s 5-year CDS spread. Private is a dummy variable equal to one if the issuing company has no publicly traded equity at time of issue. Offering Spread is the difference between the yield at issuance of a bond and the yield of a treasury bond with comparable maturity. Offering amount is the natural log of the total offering amount in $ millions. Time to maturity is the natural log of the maturity of each bond in years. First bond issue dummy is a dummy variable equal to one if the bond is the first since 1988 issued by the issuer. Secured dummy is equal to one if the bond is secured. Call dummy and Put dummy are dummy variables equal to one if the bond has a call or put provision. Total assets is the natural log of the total book assets. Total debt to assets is total debt divided by assets. EBITDA to assets is the latest 12 months earnings before interest taxes depreciation and amortization divided by total assets. Loan dummy is equal to one if indicating if the bond has a syndicated loan issuance at the same time (or for column (8), if the firm has ever also issued a syndicated loan). Robust standard errors clustered by quarter of issue are in parentheses. ***, **, and * indicate significance at the 1%, 5%, and 10% levels of significance, respectively.

53
TABLE 7: Propensity Score Matching for Secondary Market Pricing
Procedure Coefficient Std. Error Panel A: One-to-One matching
0.488*** (0.159) Panel B: Nearest Neighbor Matching (Variable Set 1) NN 2 BS 50 0.247*** (0.090)
BS 100 0.247*** (0.070) BS 300 0.247*** (0.075)
w/o BS 0.247 (0.330) NN 5 BS 50 0.427*** (0.064)
BS 100 0.427*** (0.064) BS 300 0.427*** (0.064)
w/o BS 0.427** (0.204) Note: A propensity score matching exercise is performed on the sample of 1,880 observations of bonds traded on TRACE originally issued from January 4, 1993 to July 31, 2009. Propensity score matching uses the set of variables, including amount outstanding, time to maturity, secure dummy, call dummy, put dummy, assets, leverage, profitability, trade date, rating and industry. The dependent variable is Credit Spread, the spread of the bond on a randomly selected post-issuance date. The following factors are used in the matching procedure: Amount outstanding is the natural log of the amount outstanding. Time to maturity is the natural log of the remaining maturity of each bond in years. Secured dummy is a dummy is equal to one if the bond is secured. Call dummy and Put dummy are dummy variables equal to one if the bond has a call or put provision. Total assets ($b) is the natural log of the total book assets. Leverage is the ratio of total book debt over total book assets. Profitability is the EBITDA over total book assets. Both ratings and industries dummies are included in the matching variable set. Panel A presents estimates from a one-to-one matching. Panel B presents estimates from nearest neighbor matching for the 2 nearest neighbors and 5 nearest neighbors for a different number of bootstrap replications. The procedure NN2 stands for match on 2 nearest neighbors; NN5 stands for match on 5 nearest neighbors. BS stands for standard error bootstrapped followed by number of replications. ***, **, and * indicate significance at the 1%, 5%, and 10% levels of significance, respectively.

54
TABLE 8: Pricing and Equity Value
(1) (2) (3) (4) (5) Coefficient Log Public Log Share
Log Hypothetical Equity Value Market Cap Volume
Private dummy 0.583*** 0.329*** 0.306*** (0.136) (0.084) (0.063)
EV Measure -0.294*** -0.300*** (0.038) (0.039)
Private*EV Measure 0.032*** (0.007)
Q1 EV 0.402*** 0.000 0.356*** (0.125) (0.069) (0.110)
Q2 EV 0.090 0.081 0.121 (0.092) (0.069) (0.080)
Q3 EV 0.022 0.058 0.069 (0.070) (0.054) (0.063)
Total assets 0.017 0.015 0.035*** 0.0344*** 0.018 (0.012) (0.013) (0.012) (0.012) (0.013)
Loan dummy 0.025 0.026 0.019 0.020 0.031 (0.030) (0.029) (0.029) (0.029) (0.029)
Controls: Bond characteristic controls Yes Yes Yes Yes Yes Financial controls Yes Yes Yes Yes Yes
Fixed effects: Ratings FE Yes Yes Yes Yes Yes Quarter of issue FE Yes Yes Yes Yes Yes Industrial sector FE Yes Yes Yes Yes Yes Individual company FE No No No No No
Observations 6,747 6,747 6,747 6,747 6,747 Adjusted R-squared 0.812 0.810 0.816 0.815 0.811 rmse 0.822 0.825 0.813 0.814 0.823
Note: The sample is drawn from the 6,747 observations from January 4, 1993 to July 31, 2009 where market capitalization or share volume data are available. The dependent variable in specification (1) is Log Public Market Cap, the natural log of published market cap as of the day of bond issue. The dependent variable in specification (2) is Log Share Volume, the natural log of the average daily traded volume. The dependent variable in the last three specifications, (3)-(5), is Log Hypothetical Equity Value, the natural log of the hypothetical equity value computed using the median HEV of companies in the same NAICS 4-digit class. Private is a dummy variable equal to one if the issuing company has no publicly traded equity at time of issue. EV measure corresponds to each of the three measures: Market Cap, Share Volume, and Hypothetical Equity Value. Private*EV Measure is the interaction term of EV Measure and Private. The sample is divided into quartiles by each equity value measure: Q1 EV, Q2 EV, and Q3 EV. Total assets are the natural log of the total book assets. Loan dummy is equal to one if indicating if the bond has a syndicated loan issuance at the same time. All regressions include bond characteristic and financial controls. Ratings, quarter of issue, and industrial sector fixed effects are included. Robust standard errors clustered by quarter of issue are in parentheses. ***, **, and * indicate significance at the 1%, 5%, and 10% levels of significance, respectively.

55
TABLE 9: Offering Spread and Information
(1) (2) (3) (4) (5) (6) (7) (8) (9) Private dummy 0.286*** 0.289*** 0.252*** 0.258*** 0.270*** 0.288*** 0.272*** 0.369*** 0.313**
(0.065) (0.062) (0.058) (0.064) (0.060) (0.062) (0.060) (0.133) (0.127) Public to Private 0.020 0.074
(0.116) (0.126) First Offer 0.204*** 0.036
(0.056) (0.030) SD ROA 3.934** 0.164***
(1.728) (0.057) 144a 0.271*** 4.002**
(0.062) (1.641) Top Underwriter -0.129*** 0.278***
(0.048) (0.056) Split Rating 0.100*** -0.105**
(0.032) (0.050) CDS Dummy -0.094*** 0.108***
(0.033) (0.038) Blockholder (5%-10%) -0.101*** -0.073**
(0.034) (0.035) Blockholder (10%-25%) 0.0450 -0.110***
(0.041) (0.037) Blockholder (>25%) -0.087 0.028
(0.118) (0.043) Loan dummy 0.045 0.045 0.052 0.038 0.044 0.044 0.042 0.056** -0.181
(0.028) (0.028) (0.032) (0.028) (0.028) (0.028) (0.028) (0.028) (0.119)
Controls: Bond characteristic controls Yes Yes Yes Yes Yes Yes Yes Yes Yes Financial controls Yes Yes Yes Yes Yes Yes Yes Yes Yes Fixed effects: Ratings FE Yes Yes Yes Yes Yes Yes Yes Yes Yes Quarter of issue FE Yes Yes Yes Yes Yes Yes Yes Yes Yes Industrial sector FE Yes Yes Yes Yes Yes Yes Yes Yes Yes Individual company FE No No No No No No No No No
Observations 7,155 7,155 6,146 7,155 6,526 7,155 7,155 7,155 5,612 Adjusted R-squared 0.812 0.812 0.816 0.814 0.810 0.812 0.812 0.811 0.818
Note: The sample is drawn from the 7,155 observations from 1,720 issuers from January 4, 1993 to July 31, 2009. In cases where the dependent variable limits the sample, the subset of the 7,155 observations is reported. The dependent variable is Offering Spread, the difference between the yield at issuance of a bond and the yield of a Treasury bond

56
with comparable maturity. Private is a dummy variable equal to one if the issuing company has no publicly traded equity at time of issue. Info Measure corresponds to each of the appropriate information dummy variables: Public to Private is equal to one if the company changed from a public company to a private company; First offer is a dummy variable equal to 1 if this issuance is the company’s first bond offering since 1993; SD ROA is the standard deviation of the 4 quarters of ROA following bond issuance; 144A is a dummy variable equal to 1 if the bonds were first issued only to qualified institutional buyers under Rule 144A; Top underwriter is a dummy variable equal to 1 if the company’s bond underwriter had a market share in the previous year of greater than 1% (equivalent to a top 15 ranking); Split rating is a dummy variable equal to 1 if the rating from S&P is not the same as the rating from Moody’s. Ownership is the maximum blockholder from Spectrum. The dummies Blockholder (5%-10%) is equal to one if the blockholder is between 5% and 10%, Blockholder (10%-25%) is equal to one if the blockholder is between 10% and 25%, and Blockholder (>25%) is equal to one if the blockholder is greater than 25%. Blockholder (<5%) is the omitted ownership choice. CDS Mkt is a dummy equal to 1 if the company has a CDS contract written on the firm. Loan dummy is equal to one if indicating if the bond has a syndicated loan issuance at the same time. All regressions include bond characteristics and financial controls. Ratings, quarter of issue, and industrial sector fixed effects are included. Robust standard errors clustered by quarter of issue are in parentheses. ***, **, and * indicate significance at the 1%, 5%, and 10% levels of significance, respectively.