the problem of hurricanes and climate kerry emanuel program in atmospheres, oceans and climate the...
TRANSCRIPT

The Problem of Hurricanes and Climate
The Problem of Hurricanes and Climate
Kerry EmanuelProgram in Atmospheres, Oceans and ClimateThe Lorenz CenterMassachusetts Institute of Technology

Program
How should we assess hurricane risk?
What have hurricanes been like in the past, and how will they be affected by global warming?

Hurricane Risks:
Wind
Storm Surge
Rain


Windstorms Account for Bulk of Insured Losses Worldwide

Limitations of a strictly statistical approach
>50% of all normalized U.S. hurricane damage caused by top 8 events, all category 3, 4 and 5>90% of all damage caused by storms of category 3 and greaterCategory 3,4 and 5 events are only 13% of total landfalling events; only 30 since 1870 Landfalling storm statistics are inadequate for assessing hurricane risk

Additional Problem:Nonstationarity of climate
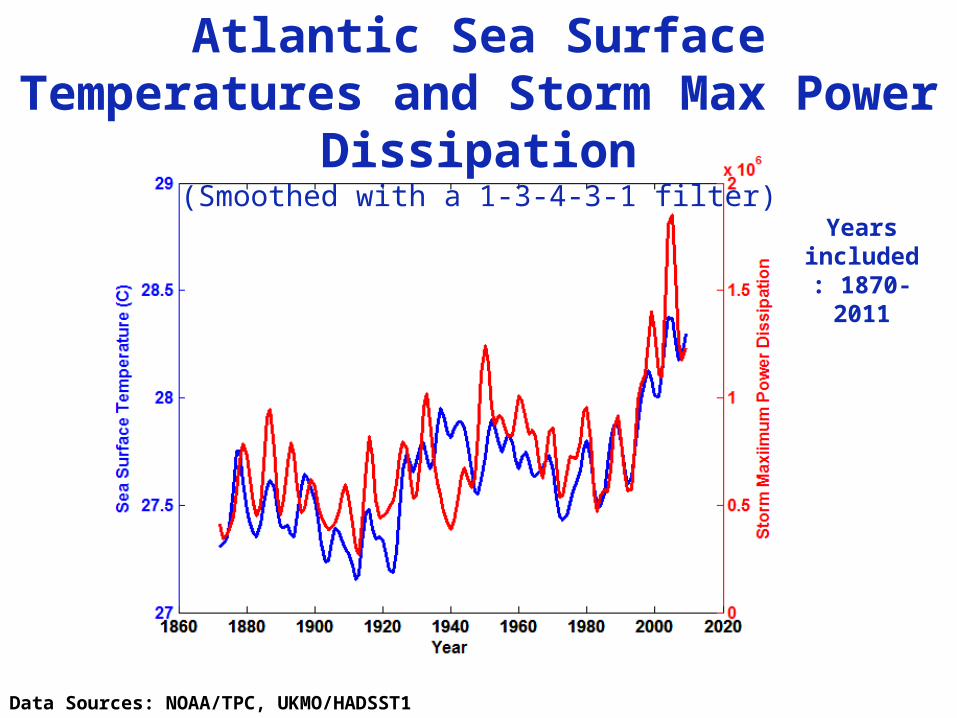
Atlantic Sea Surface Temperatures and Storm Max Power Dissipation
(Smoothed with a 1-3-4-3-1 filter)
Years included:
1870-2011
Data Sources: NOAA/TPC, UKMO/HADSST1

Analysis of satellite-derived tropical cyclonelifetime-maximum wind speeds
Box plots by year. Trend lines are shownfor the median, 0.75 quantile, and 1.5
times the interquartile range
Trends in global satellite-derived tropical cyclone maximum wind
speeds by quantile, from 0.1 to 0.9 in increments of 0.1.
Elsner, Kossin, and Jagger, Nature, 2008
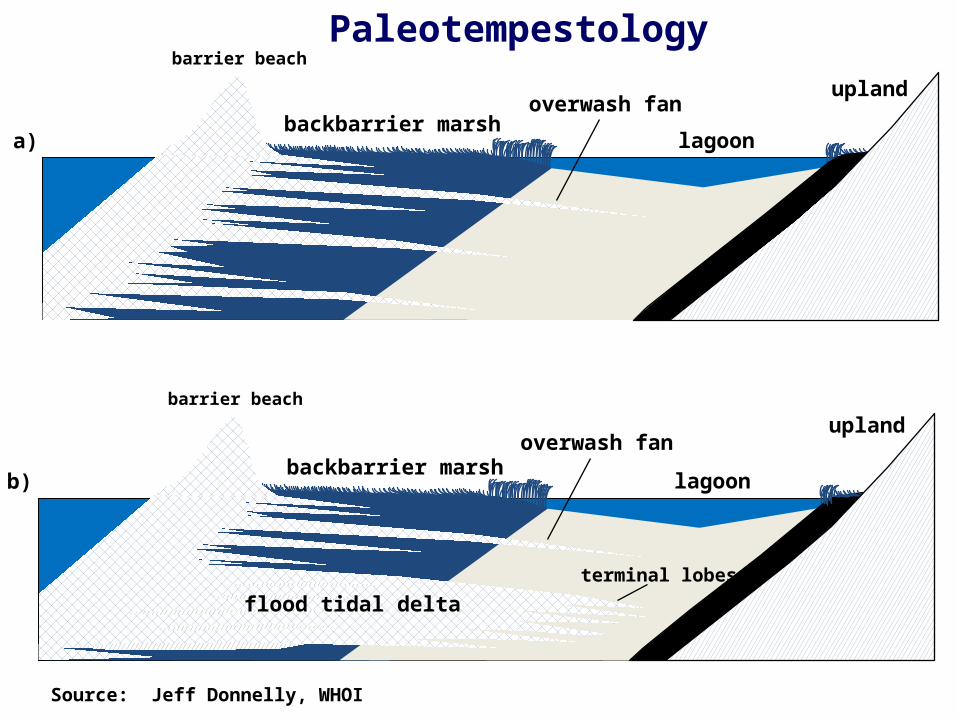
barrier beach
backbarrier marshlagoon
barrier beach
backbarrier marshlagoon
a)
b)
Source: Jeff Donnelly, WHOI
upland
upland
flood tidal delta
terminal lobes
overwash fan
overwash fan
Paleotempestology

Jeffrey P. Donnelly and Jonathan D. Woodruff, Nature, 2007

Risk Assessment by Direct Numerical Simulation of Hurricanes:
The Problem
The hurricane eyewall is a front, attaining scales of ~ 1 km or less
At the same time, the storm’s circulation extends to ~1000 km and is embedded in much larger scale flows
The computational nodes of global models are typically spaced 100 km apart

Histograms of Tropical Cyclone Intensity as
Simulated by a Global Model with 50 km grid
point spacing. (Courtesy Isaac Held, GFDL)
Category 3
Global models do not simulate the storms that
cause destruction
ObservedModeled

Numerical convergence in an axisymmetric, nonhydrostatic model (Rotunno and Emanuel, 1987)

How to deal with this?
Option 1: Brute force and obstinacy

How to deal with this?Option 1: Brute force and obstinacy
Option 2: Applied math and modest resources
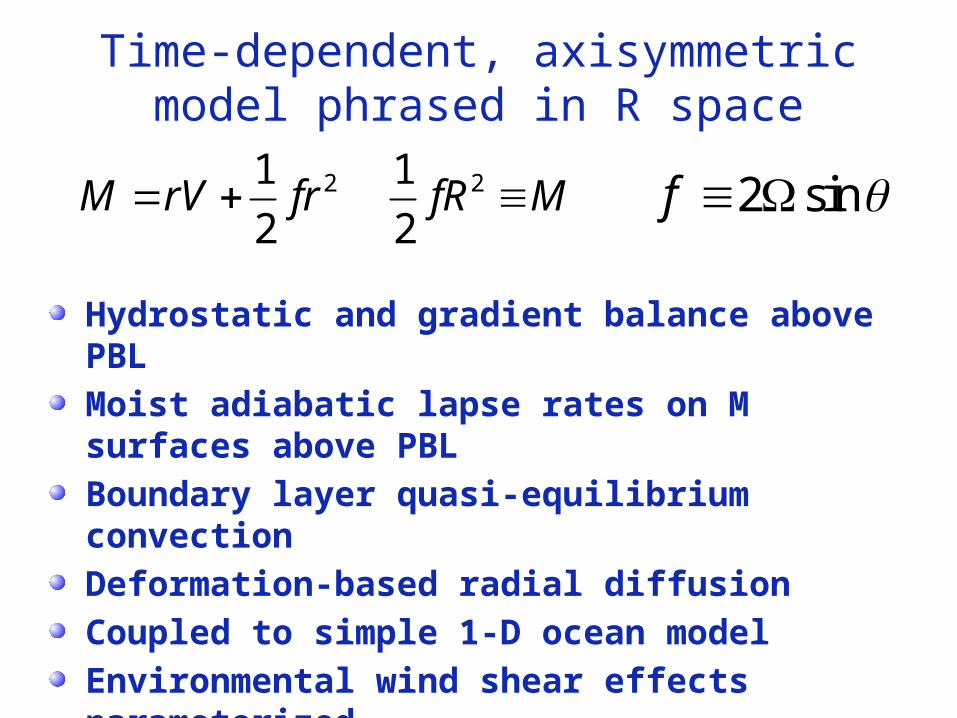
Time-dependent, axisymmetric model phrased in R space
Hydrostatic and gradient balance above PBL
Moist adiabatic lapse rates on M surfaces above PBL
Boundary layer quasi-equilibrium convection
Deformation-based radial diffusion
Coupled to simple 1-D ocean model
Environmental wind shear effects parameterized
21
2M rV fr 21
2fR M 2 sinf

Angular Momentum Distribution

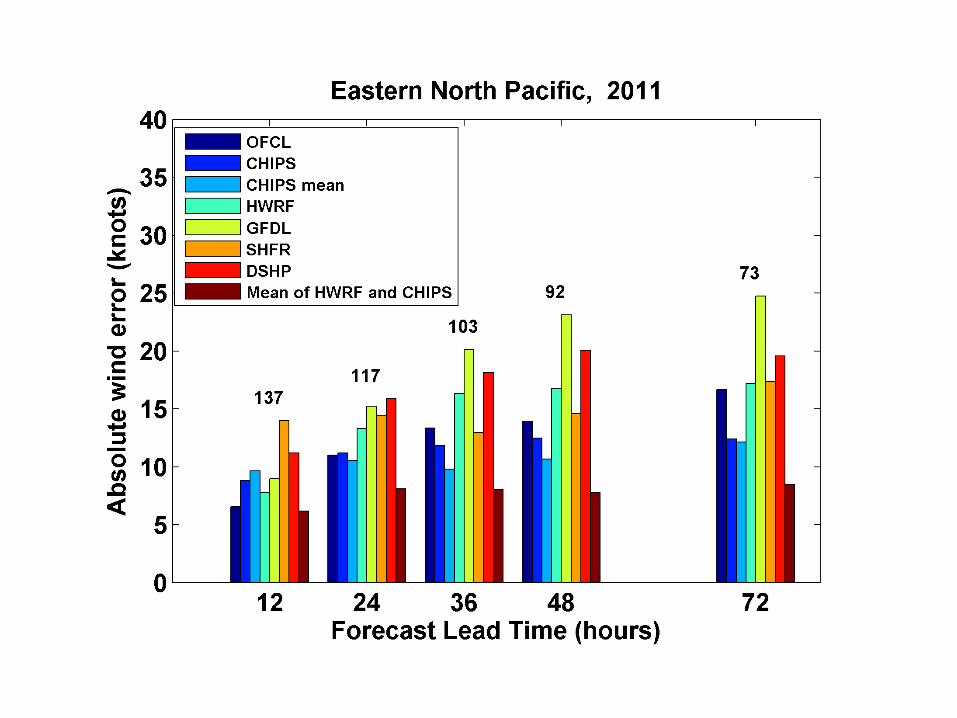
Application to Real-Time Hurricane Intensity Forecasting
Must add ocean model
Must account for atmospheric wind shear
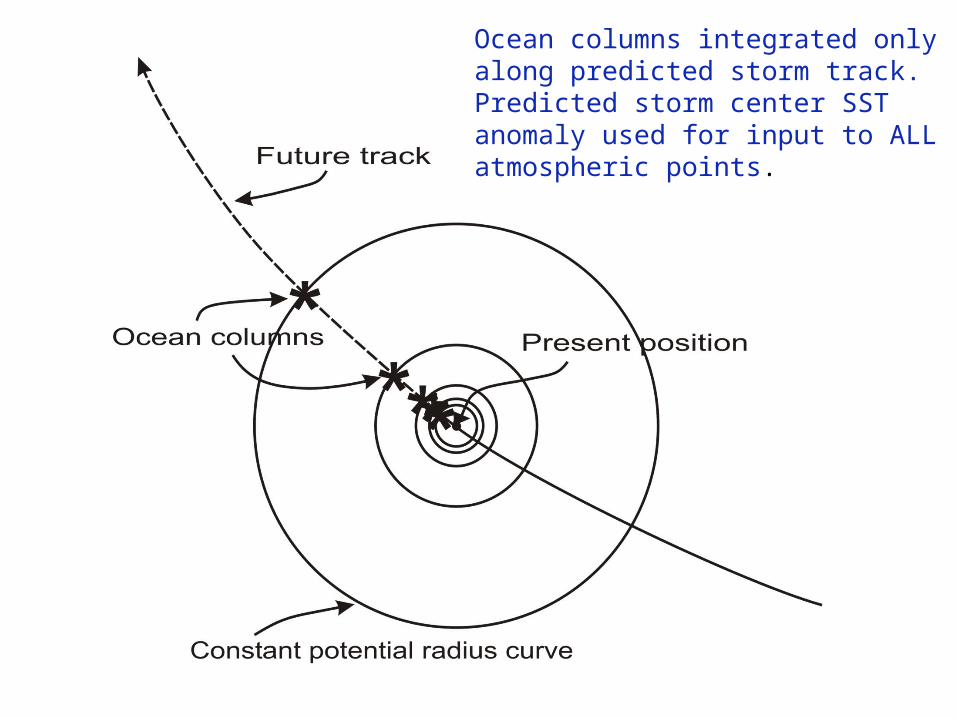
Ocean columns integrated only along predicted storm track.Predicted storm center SST anomaly used for input to ALLatmospheric points.

Comparing Fixed to Interactive SST:
Model with Fixed Ocean Temperature
Model including Ocean Interaction
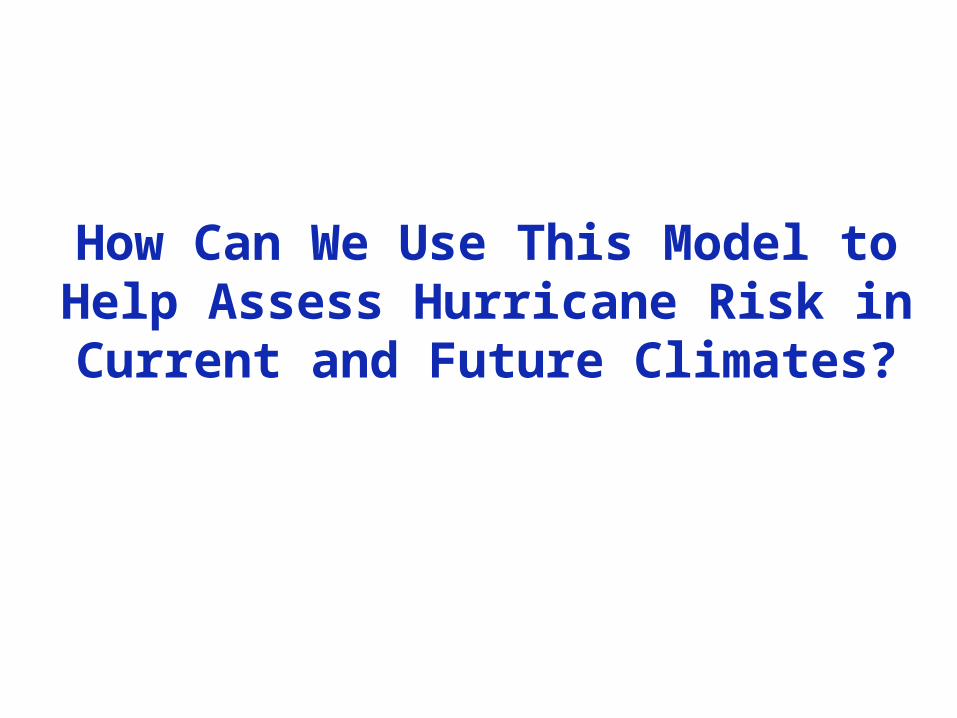
How Can We Use This Model to Help Assess Hurricane Risk in Current and Future Climates?

Risk Assessment Approach:
Step 1: Seed each ocean basin with a very large number of weak, randomly located cyclones
Step 2: Cyclones are assumed to move with the large scale atmospheric flow in which they are embedded, plus a correction for beta drift
Step 3: Run the CHIPS model for each cyclone, and note how many achieve at least tropical storm strength
Step 4: Using the small fraction of surviving events, determine storm statistics
Details: Emanuel et al., Bull. Amer. Meteor. Soc, 2008

Synthetic Track Generation:Generation of Synthetic Wind Time Series
Extract winds from climatological or global climate model output
Postulate that TCs move with vertically averaged environmental flow plus a “beta drift” correction
Approximate “vertically averaged” by weighted mean of 850 and 250 hPa flow

Comparison of Random Seeding Genesis Locations with Observations

Calibration
Absolute genesis frequency calibrated to globe during the period 1980-2005

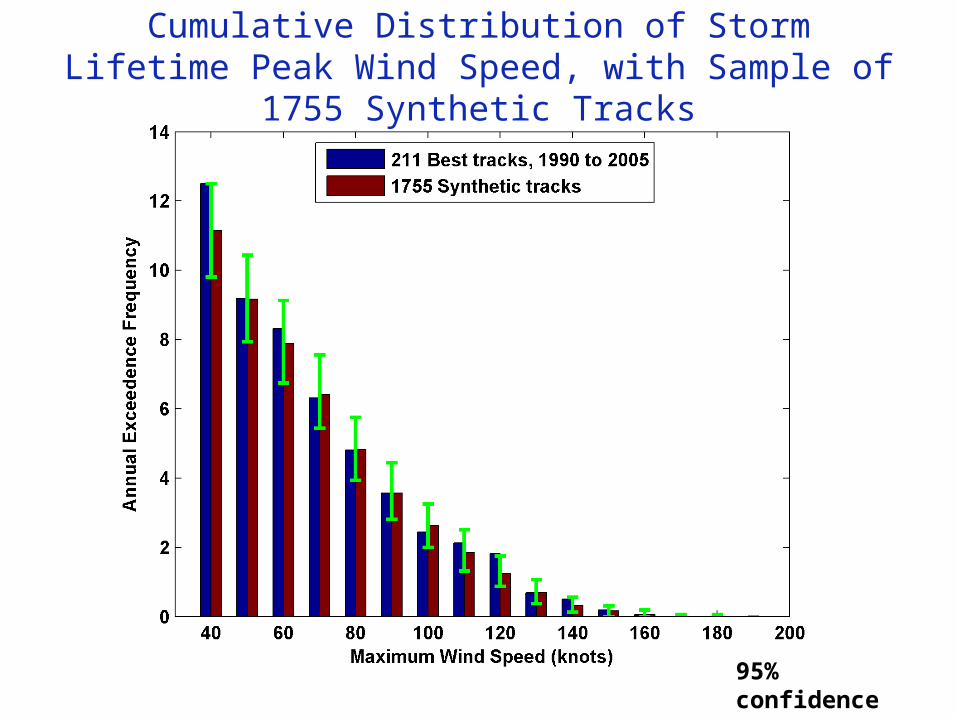
Cumulative Distribution of Storm Lifetime Peak Wind Speed, with Sample of 1755 Synthetic Tracks
95% confidence bounds

Captures effects of regional climate phenomena (e.g. ENSO, AMM)
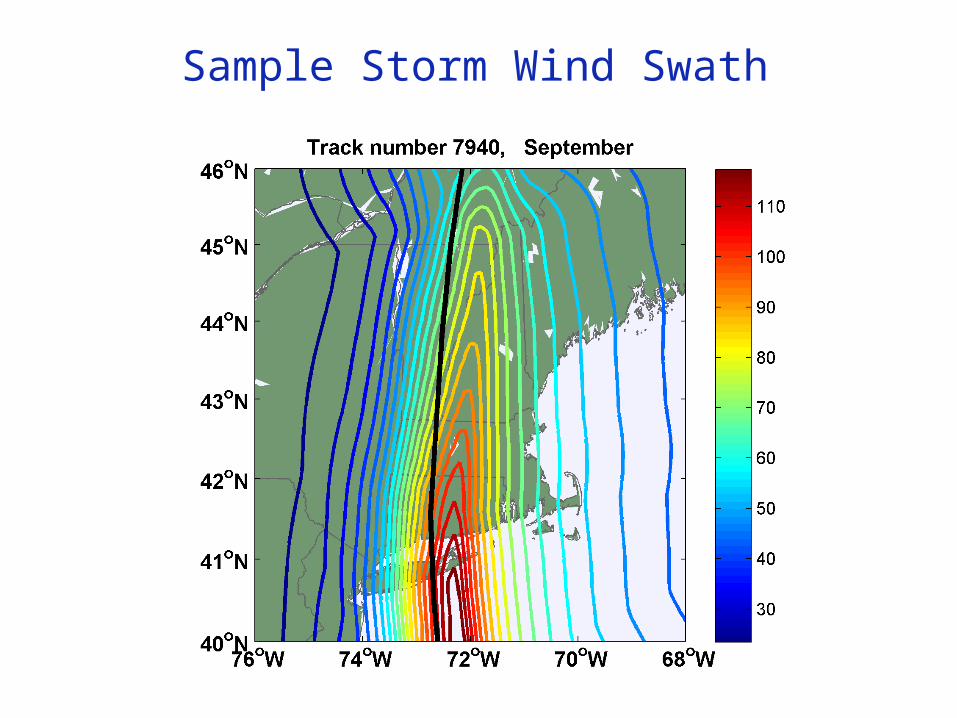
Sample Storm Wind Swath

Return Periods

Accumulated Rainfall (mm)

Storm Surge Simulation
SLOSH mesh~ 103 m
ADCIRC mesh~ 102 m
Battery
ADCIRC model(Luettich et al. 1992)
SLOSH model(Jelesnianski et al. 1992)
ADCIRC mesh~ 10 m
(Colle et al. 2008)

5000 synthetic storm tracks under current climate. (Red portion of eachtrack is used in surge analysis.)


Woodruff et al., Geochemistry, Geophysics, and Geosystems, 2008
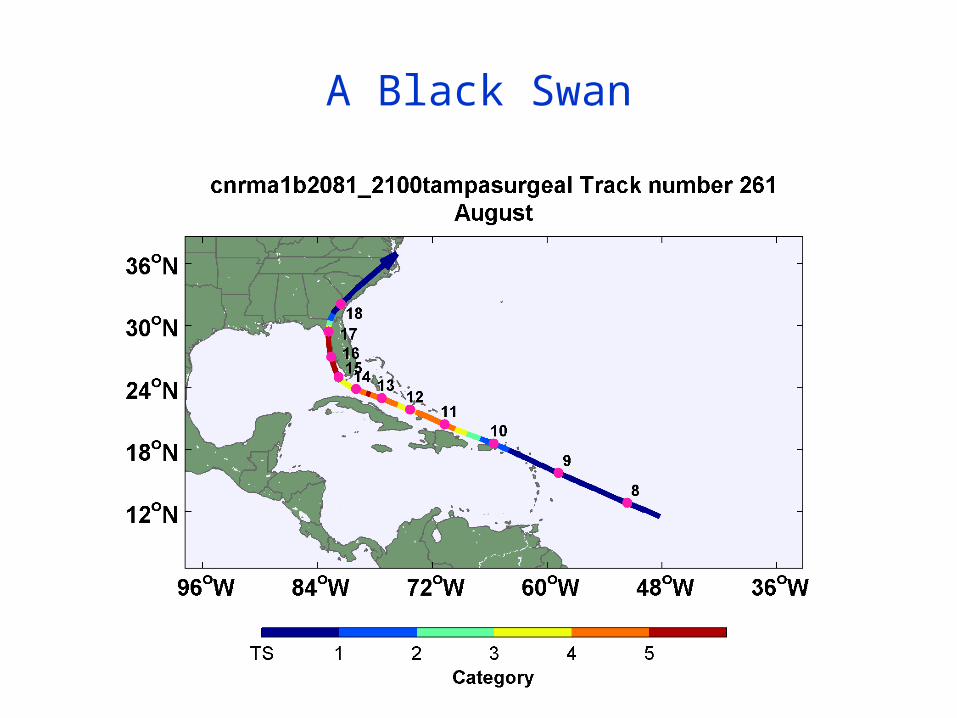
A Black Swan


ADCIRC Mesh

Peak Surge at each point
along Florida west coast

Dubai
Taking Climate Change Into Account

Potential Intensity:Theoretical Upper Bound on Hurricane
Maximum Wind Speed:
*2| |0
C T Tk s oV k kpot TC
oD
Air-sea enthalpy disequilibrium
Surface temperature
Outflow temperature
Ratio of exchange coefficients of enthalpy and momentum

0o 60oE 120oE 180oW 120oW 60oW
60oS
30oS
0o
30oN
60oN
0 10 20 30 40 50 60 70 80
Annual Maximum Potential Intensity (m/s)

Trends in Thermodynamic Potential for Hurricanes, 1980-2010

Hindcasts of Haiyan: Actual Thermal Conditions vs. 1982-1995 Average Conditions

Units: Nautical miles per hour, per century
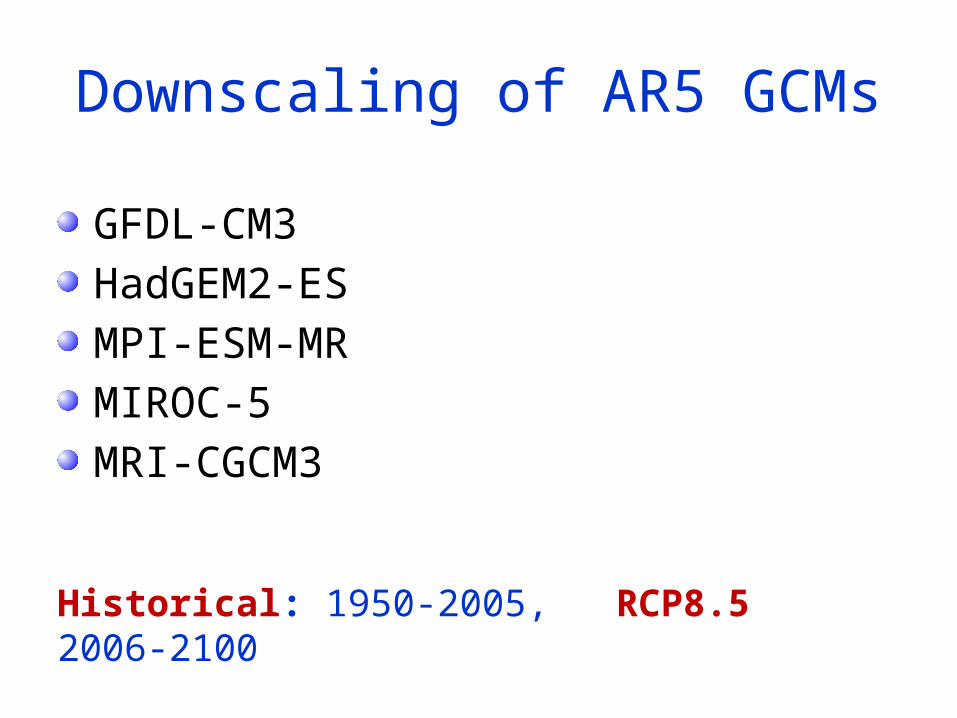
Downscaling of AR5 GCMs
GFDL-CM3
HadGEM2-ES
MPI-ESM-MR
MIROC-5
MRI-CGCM3
Historical: 1950-2005, RCP8.5 2006-2100

Global annual frequency of tropical cyclones averaged in 10-year blocks for the period 1950-2100, using historical simulations for the period 1950-2005 and the RCP 8.5 scenario for the period 2006-2100. In each box, the red line represents the median among the 5 models, and the bottom and tops of the boxes represent the 25th and 75th percentiles, respectively. The whiskers extent to the most extreme points not considered outliers, which are represented by the red + signs. Points are considered outliers if they lie more than 1.5 times the box height above or below the box.

Change in track density, measured in number of events per 4o X 4o square per year, averaged over the five models. The change is simply the average over the period 2006-2100 minus the average over 1950-2005. The white regions are where fewer than 4 of the 5 models agree on the sign of the change.

Global Tropical Cyclone Power Dissipation
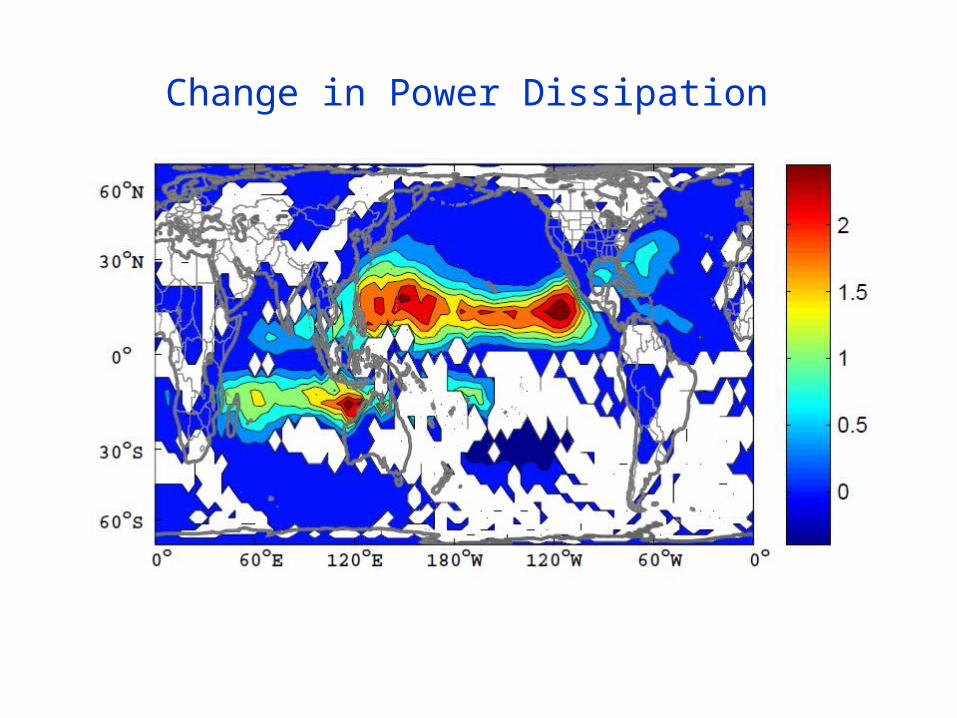
Change in Power Dissipation

Return period (horizontal axis, in years) of medicanes according to the maximum wind induced at the surface (vertical axis, in knots). Continuous lines refer to the current climate and dashed lines to the future climate (SRES A2, 2081-2100), following the color coding indicated in the legend.Romero, R., and K. Emanuel (2013), Medicane risk in a changing climate, J. Geophys. Res. Atmos., 118, doi:10.1002/jgrd.50475.

Return Periods based on GFDL Model

Return Periods of Storm Total Rainfall at New HavenGFDL Model

GCM flood height return level(assuming SLR of 1 m for the future climate )
Black: Current climate (1981-2000)Blue: A1B future climate (2081-2100)Red: A1B future climate (2081-2100) with R0 increased by 10% and Rm increased by 21%
Lin et al. (2012)

Integrated Assessments
with Robert Mendelsohn, Yale
The impact of climate change on global tropical cyclone damage
Robert Mendelsohn, Kerry Emanuel, Shun Chonabayashi & Laura Bakkensen, 2012
Nature Climate Change, 2, 205-209

Probability Density of TC Damage, U.S.
East Coast
Damage Multiplied by Probability Density of
TC Damage, U.S. East Coast
Summary
History is too short and imperfect to estimate hurricane risk
Better estimates can be made from paleotempestology and downscaling hurricane activity from climatological or global model output
Hurricanes clearly vary with climate and there is a risk that hurricane threats will increase over this century
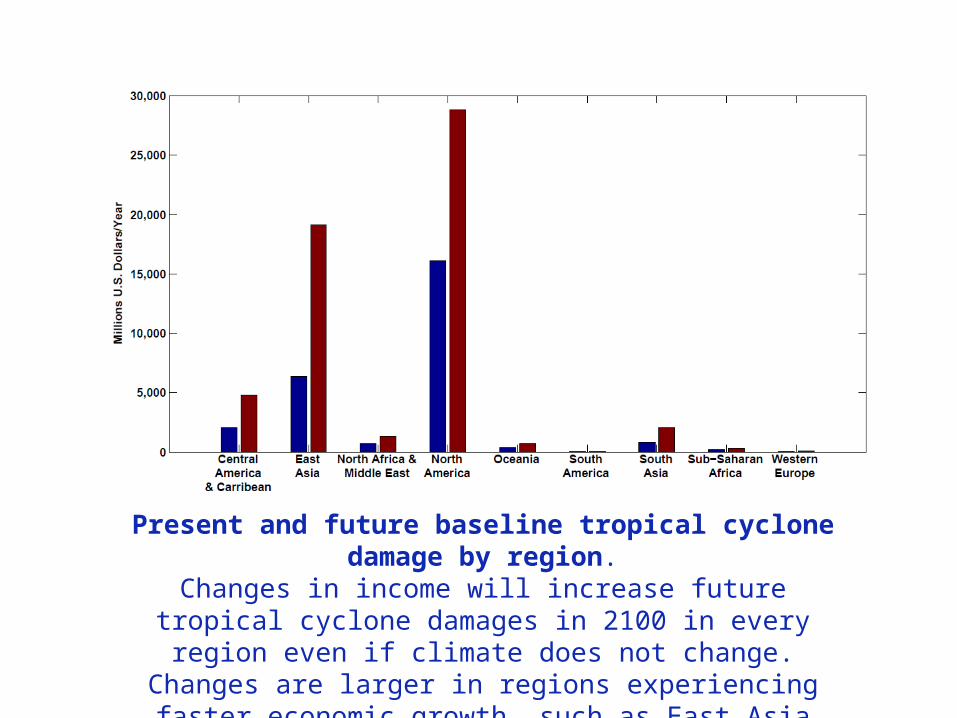
Present and future baseline tropical cyclone damage by region.Changes in income will increase future tropical cyclone damages in 2100 in every region even if climate does not change. Changes are larger in regions experiencing faster economic growth, such
as East Asia and the Central America–Caribbean region.

Climate change impacts on tropical cyclone damage by region in 2100. Damage is concentrated in North America, East Asia and Central America–
Caribbean. Damage is generally higher in the CNRM and GFDL climate scenarios.

Climate change impacts on tropical cyclone damage divided by GDP by region in 2100. The ratio of damage to GDP is highest in the Caribbean–Central American region but
North America, Oceania and East Asia all have above-average ratios.

Projections of U.S. Insured Damage
Emanuel, K. A., 2012, Weather, Climate, and Society