the production of protein isolates from the aqueous extraction … · 2013-07-13 · abstract two...
TRANSCRIPT

The Production of Protein Isolates from the Aqueous
Extraction of de-hulled Yellow Mustard Flour and
Determination of their Functional Properties
by
Benjamin Hijar Soltero
A thesis submitted in conformity with the requirements for the degree of Master of Applied Science (M. A. Sc.)
Graduate Department of Chemical Engineering and Applied Chemistry University of Toronto
© Copyright by Benjamin Hijar Soltero (2013)

ii
The Production of Protein Isolates from the Aqueous Extraction of de-hulled Yellow
Mustard Flour and Determination of their Functional Properties
Benjamin Hijar Soltero
Master of Applied Science
Graduate Department of Chemical Engineering and Applied Chemistry
University of Toronto
2013
ABSTRACT
Two types of protein isolates were prepared from de-hulled yellow mustard flour by aqueous
extraction, membrane processing and acid precipitation of proteins at the isoelectric point (IEP
5.5). Their electrophoretic, main functional properties and protein composition were determined.
The precipitated and acid soluble protein isolates had 83.0 and 96.0% protein content on a
moisture and oil free basis, respectively. The acid soluble protein isolate had comparable
functional properties to those of commercially available soybean and other protein isolates. The
precipitated protein isolate exhibited less desirable functionality than the soluble isolate, due to
its high lipid content (~25%); however, it was still comparable to soybean isolates. Storage
temperature had limited effect on lipid oxidation, and hence the stability of the precipitated
protein isolate at 25-45ºC. Taste and texture of wieners and bologna prepared with 1-2% of this
isolate as binder were comparable to those prepared with soy protein isolates.

iii
ACKNOWLEDGMENTS
First and foremost I would like to thank Professor L. L. Diosady for giving me the opportunity of
being part of the Food Engineering group and the opportunity of pursuing this degree. His
guidance, advice and support throughout this project made possible its successful completion. I
would also like to thank both Professor O. Trass and Professor C. Q. Jia for their valuable
feedback. I would also like to thank the Mexican Council of Science and Technology
(CONACYT) for making this project possible through its financial support. My sincere thanks
also go to all my colleagues in the Food Engineering group, especially Solmaz, Sayeh, Veronica
and Bih King for their assistance. Finally, I would like to thank my family and friends for their
support, especially my wife Elizabeth.

iv
TABLE OF CONTENTS
ABSTRACT .............................................................................................................................................. ii
ACKNOWLEDGMENTS .................................................................................................................... iii
TABLE OF CONTENTS ...................................................................................................................... iv
LIST OF FIGURES .............................................................................................................................. vii
LIST OF TABLES .............................................................................................................................. viii
1. INTRODUCTION............................................................................................................................... 1
2. LITERATURE REVIEW ................................................................................................................. 2
2.1 Mustard seed ............................................................................................................................................... 2 2.1.1 Types of mustard ............................................................................................................................................. 2 2.1.2 Mustard uses .................................................................................................................................................... 5
2.2 Mustard seed components ........................................................................................................................... 6 2.2.1 Oil .................................................................................................................................................................... 8 2.2.2 Protein .............................................................................................................................................................. 8 2.2.3 Protein-oil interactions in mustard seeds ....................................................................................................... 13 2.2.4 Glucosinolates ................................................................................................................................................ 15 2.2.5 Phytates .......................................................................................................................................................... 17 2.2.6 Phenolic compounds ...................................................................................................................................... 18
2.3 Protein extraction .......................................................................................................................................20 2.3.1 Solvent extraction process ............................................................................................................................. 21 2.3.2 Aqueous extraction process ........................................................................................................................... 23
2.4 Protein purification and isolation ...............................................................................................................26 2.4.1 Ultrafiltration ................................................................................................................................................. 28 2.4.2 Diafiltration .................................................................................................................................................... 30
2.5 Functional properties in protein isolates ....................................................................................................32 2.5.1 Hydration properties ...................................................................................................................................... 33 2.5.1.1 Water and oil absorption ............................................................................................................................. 34 2.5.1.2 Protein Solubility ........................................................................................................................................ 35 2.5.2 Properties related to protein surface ............................................................................................................... 35 2.5.2.1 Foaming properties ..................................................................................................................................... 37 2.5.2.2 Emulsifying properties ................................................................................................................................ 37
v
2.5.3 Properties related to protein structure: Gelation ............................................................................................ 38
2.6 Lipid oxidation in lipid-protein systems .....................................................................................................39 2.6.1 Lipid and protein oxidation mechanisms ....................................................................................................... 40 2.6.2 Accelerated lipid oxidation evaluation ........................................................................................................... 42
3. PROJECT OBJECTIVES .............................................................................................................. 44
4. EXPERIMENTAL METHODS .................................................................................................... 45
4.1 Starting materials .......................................................................................................................................45
4.2 Solvents ......................................................................................................................................................45
4.3 Reagents .....................................................................................................................................................45
4.4 Equipment and materials ...........................................................................................................................47
4.5 Experimental Methods ...............................................................................................................................48 4.5.1 Aqueous extraction process ........................................................................................................................... 48 4.5.2 Membrane processing of protein solution and isoelectric precipitation ......................................................... 51 4.5.3 Protein isolates recovery ................................................................................................................................ 54 4.5.4 Temperature effect on lipid oxidation in the precipitated protein isolate ....................................................... 56 4.5.5 Functional properties ..................................................................................................................................... 56 4.5.6 Other analytical methods ............................................................................................................................... 58
5. RESULTS AND DISCUSSION ..................................................................................................... 60
5.1 Starting material analysis ...........................................................................................................................60
5.2 Aqueous extraction process ........................................................................................................................60
5.3 Membrane processing of protein solution and isoelectric precipitation .....................................................63
5.4 Protein isolates recovery ............................................................................................................................65
5.5 Functional properties .................................................................................................................................71 5.5.1 Colour and Flavour ........................................................................................................................................ 71 5.5.2 Gel electrophoresis ........................................................................................................................................ 71 5.5.3 Nitrogen Solubility Index (NSI) .................................................................................................................... 74 5.5.4 Water absorption capacity (WAC) and oil absorption capacity (OAC) ......................................................... 75 5.5.5 Emulsifying Properties ................................................................................................................................... 78 5.5.6 Foaming Properties ........................................................................................................................................ 80 5.5.7 Gelation .......................................................................................................................................................... 83
5.6 Temperature effect on lipid oxidation in the precipitated protein isolate ...................................................84

vi
6. MEAT PRODUCT TESTING ....................................................................................................... 88
7. CONCLUSIONS ............................................................................................................................... 91
8. RECOMMENDATIONS ................................................................................................................. 95
8. REFERENCES .................................................................................................................................. 97
9. APPENDICES................................................................................................................................. 107
APPENDIX A ................................................................................................................................................ 108
Analytical Methods ........................................................................................................................................ 108
APPENDIX B ................................................................................................................................................ 128
Results ........................................................................................................................................................... 128 B1. Yellow mustard flour analyses ....................................................................................................................... 129 B2. Aqueous extraction ......................................................................................................................................... 131 B3. Membrane processing and isoelectric precipitation ....................................................................................... 134 B4. Protein isolates analyses ................................................................................................................................. 138 B5. Functional properties ...................................................................................................................................... 140 B6. TBA values for the precipitated protein isolate stored at different temperatures ........................................... 145 B7. Meat testing forms and results ....................................................................................................................... 149

vii
LIST OF FIGURES
Figure 1: Types of mustard seeds .................................................................................................................. 4
Figure 2: Average fix oil content of mustard seeds in Canada ..................................................................... 7
Figure 3: Average crude protein content for mustard seeds in Canada ......................................................... 7
Figure 4: Amino acid structure ..................................................................................................................... 9
Figure 5. Structure of oil bodies (Huang 1992) .......................................................................................... 14
Figure 6: Isothyocianate release reaction for sinapis alba .......................................................................... 16
Figure 7: Isothyocianate release reaction for brassica juncea .................................................................... 17
Figure 8: Chemical structure of phytic acid ................................................................................................ 18
Figure 9: Chemical structure of phenolic compounds ................................................................................. 19
Figure 10: Main operations in a solvent extraction system (Becker 1970) ................................................. 22
Figure 11: Main operations in aqueous extraction systems (Cater, et al. 1974) ......................................... 24
Figure 12: Ultrafiltration principle of operation ......................................................................................... 28
Figure 13: Fatty acid radical chain oxidation mechanism ........................................................................... 41
Figure 14: Flow diagram of the aqueous extraction process ....................................................................... 50
Figure 15: Ultrafiltration/Diafiltration process schematics ......................................................................... 51
Figure 16: Protein extract membrane processing ........................................................................................ 55
Figure 17: Aqueous extraction. Mass balance of key components (*Estimate) .......................................... 63
Figure 18: Protein fractions A and B after membrane processing .............................................................. 66
Figure 19: Yields for the membrane process and isoelectric precipitation of the protein solution ............. 68
Figure 20: Protein isolates comparison ....................................................................................................... 71
Figure 21: Non-reducing conditions SDS-PAGE patterns of the precipitated protein isolate (lanes a and
b), acid soluble protein isolate (lanes c and d) and protein standards (lane e) ............................................ 72
Figure 22: Reducing conditions SDS-PAGE patterns of the precipitated protein isolate (lanes a and b),
acid soluble protein isolate (lanes c and d) and protein standards (lane e) ................................................. 73
Figure 23: Foam stability expressed as the foam volume (%) remaining against time ............................... 83
Figure 24: Malondialdehyde formation in the precipitated protein isolate at three temperatures ............... 87

viii
LIST OF TABLES
Table 1: Seeded area and production of Canadian mustard .......................................................................... 5
Table 2: Fatty acid composition of Yellow and Brown mustard .................................................................. 8
Table 3: Values of oriental and yellow mustard amino acid composition compared to FAO indispensable
amino acid requirements ............................................................................................................................. 11
Table 4: Reagents used for experiments ..................................................................................................... 45
Table 5: Equipment and materials used for the experiments ...................................................................... 47
Table 6: Yellow mustard flour characterization .......................................................................................... 60
Table 7: Protein and oil composition of the resulting fractions after aqueous extraction ........................... 62
Table 8: Protein and oil composition of the resulting fractions before and after membrane processing .... 67
Table 9: Final product characterization ....................................................................................................... 70
Table 10: Nitrogen solubility index value of different protein isolates....................................................... 75
Table 11: Water absorption capacity for different protein isolates ............................................................. 76
Table 12: Oil absorption capacity for different protein isolates .................................................................. 77
Table 13: Emulsifying properties of protein isolates .................................................................................. 79
Table 14: Foam expansion values for protein isolates ............................................................................... 80
Table 15: Foam stability data ...................................................................................................................... 81
Table 16: Foam volume stability values for selected protein isolates ......................................................... 82
Table 17: Least gelation concentration values for selected protein isolates ............................................... 83
Table 18: TBA values for the starting materials ......................................................................................... 85
Table 19: TBA values for samples stored at different temperatures ........................................................... 86
Table 20: Ratings for wieners produced with precipitated protein isolate and meal residue derived from
the aqueous extraction process, membrane processing and isoelectric precipitation .................................. 89
Table 21: Ratings for bologna produced with precipitated protein isolate and meal residue derived from
the aqueous extraction process, membrane processing and isoelectric precipitation .................................. 89
Table 22: Pairs of mean ratings with significant differences at the 95% confidence level ......................... 90

1
1. INTRODUCTION
Canada is the largest exporter of mustard seeds in the world and stands in second place in world
production with an average of 176,600 metric tonnes, with yellow mustard representing over
40% of the total production.
Yellow mustard (sinapis alba) seed is mostly used to prepare food condiments, such as the hot-
dog mustard. Its uses are limited in food products because of its anti-nutritional components,
spicy flavour precursors and astringent phenolic compounds. Furthermore, the retained oil
readily oxidizes, resulting in rancidity over time.
The seed is high in oil and protein. Since the oil is high in erucic acid, a monounsaturated fatty
acid associated with certain heart conditions its use has been prohibited in North America and
Europe from human consumption but there is a great potential for its use in biofuel production.
Mustard protein, on the other hand, has a well-balanced amino acid profile and a high nutritional
value. However protein use in food systems relies more in the desirable functional properties and
sensory attributes they are able to provide. Animal proteins have been traditionally the main
source of functional ingredients, however it is estimated that about 8 kg of protein from a
vegetable source are needed to produce 1 kg of animal protein. Considering this low ratio, the
increasing protein demand due to population growth and land use competition between food
crops and biofuel, oilseeds such as mustard offer an interesting alternative as a renewable source
of oil for biofuel production and protein to provide sensory characteristics and nutritional value
to food products as a replacement of animal protein.

2
Oil extraction from oilseeds is usually performed using hexane, achieving high extraction yields
but causing significant damage to the protein during desolventizing, affecting its functionality. In
addition, there are cost, environmental and safety implications limiting the use of hexane as an
extraction solvent. Aqueous extraction processes allow simultaneous recovery of oil and protein
with improved functionality without the use of hazardous solvents. In our Food Engineering
group, several research projects have focused on the aqueous extraction of Canadian oil seeds
(Canola, rapeseed and mustard) in order to obtain high extraction yields for both oil and protein.
Yields of more than 90% protein and up to 80% oil have been achieved in the case of yellow
mustard. Due to the presence of anti-nutritional components in the seed, such as glucosinolates,
phytates and phenolic compounds, further processing is necessary to obtain high quality protein
isolates. Techniques developed in our Food Engineering laboratory to treat the protein extract
include membrane processing by ultrafiltration and isoelectric precipitation for protein recovery.
On the other hand, as a result of the aqueous extraction and the presence of oleosin and other
proteins, the protein isolates will inherently contain some oil that could impact their
functionality.
This project aims to find an optimized process for the production of high quality protein isolates
with low levels of anti-nutritional factors and low oil content starting with the aqueous extraction
of de-hulled yellow mustard flour, and the determination of the food functionality and thermal
stability of the protein products produced. Ultimately, the project is expected to result in protein
isolates with high purity, low oil content and with the required food functionality for their
application in the food industry.
3
2. LITERATURE REVIEW
2.1 Mustard seed
Mustard is a series of plants of the genera Brassica and botanical family Cruciferae. Evidence of
human use of mustard seeds has been traced back to 4000 B.C. in China and Pakistan (Fenwick,
Heaney and Mullin 1982), carbonized seeds dated to 3000 BC have also been found in Iraq,
evidencing the use of mustard by the Mesopotamian civilization (Zohary and Hopf 2000). The
cultivation of mustard is believed to have been introduced to Europe by the moors. Its spread
around Europe during the middle ages can be explained by factors such as the Crusades and the
development of commerce around the Mediterranean (Fenwick, Heaney and Mullin 1982). The
English word mustard has its origin in the French term “moustarde”, from Latin “mustum”.
2.1.1 Types of mustard
There are three different kinds of mustard seeds: black mustard (brassica nigra), popular in the
Middle East and parts of Asia; brown and oriental mustard (brassica juncea), whose origin is
uncertain, with proposed sources between Eastern Europe, the Middle East or China (Labana and
Gupta 1993); and yellow mustard (sinapis alba), which originated in the Mediterranean region
and is broadly consumed around the world.
Black mustard seeds are roughly globular with a diameter of 1 to 1.5 mm and a dark brown
colour; the seed coat is pitted and when soaked in water the seeds produce a strong pungent
odour. Brown mustard seeds are similar to black mustard seeds, their diameter is less than 2 mm
and have a reddish brown to dark brown colour, it is primarily grown for the European market
and has also become popular in North America as a replacement of yellow mustard. Oriental

4
mustard seeds vary in colour from yellow to dark yellow and brown. It is mostly used in the
Asian and Japanese markets as a condiment. These varieties have a pungent taste and contain
about 28% of oil and 30% of protein (Heath 1981). Yellow mustard seeds, on the other hand,
vary in colour from light creamy yellow to yellow and in some cases yellowish brown, have a
roughly globular shape and have a diameter of 2 to 3 mm; the seed coat is minutely pitted, and
seeds turn mucilaginous when soaked in water. Yellow mustard has a pungent taste and is low in
starch, contains about 30% of oil and 25% of protein (Heath 1981) (Figure 1).
Figure 1: Types of mustard seeds
Mustard is a broad-leaved, yellow-flower plant that requires a short growing season, between 85
to 95 days for yellow mustard seeds to reach maturity and between 95 to 105 days for the
oriental and brown varieties to reach maturity (McKenzie 2010). Crops require an annual
precipitation of between 350 and 450 mm and give higher yields in temperate zones with a cool
and dry weather. Mustard is capable of growing in a variety of soils from sandy loam to clay
loam (Agroecommerce Network Private Ltd. 2002). Mustard seeds are considered more tolerant
to frost, drought and heat than other crops like canola or flax, which makes the dry brown and
dark soils, warm dry summers and cold dry winters in the southern Canadian prairies an ideal
place for mustard growth.
Yellow Mustard Oriental Mustard Brown Mustard Black Mustard

5
The sowing of mustard in Canada began in the 1930s with a modest 40 hectares, but in the next
30 years, it quickly grew to 60,000 hectares (Agriculture and Agri-Food Canada 2011). As of
2007, mustard crop occupied 176,000 hectares of harvested area with an annual production of
114,000 tonnes, representing a farm gate value of around 100 million dollars (Agriculture and
Agri-Food Canada 2007). Canada is considered the world largest exporter of mustard seed and
the second largest producer (Canadian Special Crops Association 2007) surpassed only by India.
Mustard seed production for the year 2011 is presented in Table 1.
Table 1: Seeded area and production of Canadian mustard
Region Seeded Area (2011)1
Production (2011)2
Mean Production
(2001-2010)2
Manitoba - - 2.6
Saskatchewan 107.3 103.2 140.3
Alberta 20.2 21.6 33.7
Total 127.5 124.8 176.6
1 Thousand hectares. November Estimates of Production of Principal Field Crops, Catalogue no. 22-002-X, vol. 90 no. 8 Released December 6, 2011; Statistics Canada
2 Thousand tonnes. Small Area Data 1976-2010 Statistics Canada, Agriculture Division, Crop Section
2.1.2 Mustard uses
Pythagoras mentioned the use of mustard seeds for scorpion stings and Hippocrates used it for
the preparation of medicines. The medicinal properties of mustard were known to the Greeks and
Romans, and ancient documents written by Cato, Columella and Pliny (Fenwick, Heaney and
Mullin 1982) suggest that mustard seeds were cultivated and used as a condiment, mixing the
6
ground seeds with wine must to make a paste, hence the name “mustard”. The use of mustard
seeds to prepare food condiments is still their main use, and has a wide range of applications in
the food industry. Dried seeds are milled for flour production and wet milling is used to
manufacture mustard paste. Whole ground seeds are also used for spice mix preparations and
meat processing. Traditional or hot-dog mustard is prepared using the whole ground seed.
Mustard is also used as a protein source, flavour enhancer and as a binder in the manufacturing
of processed meats. The different mucilage contents in the three varieties of mustard allow the
manufacturing of products with different viscosities. Seed hulls are also used as a thickening
agent and stabilizers in prepared foods. Heat inactivated whole ground seed is used in a variety
of food products to enhance their flavour, colour, texture and viscosity and it can also be used as
an emulsifier agent. The presence of sinigrin in the brown and oriental varieties makes them
suitable for the manufacture of hot mustard for the European market and the production of
mayonnaise. High oil content oriental mustard is used to cover the oilseed demand in the Indian
subcontinent where one of its main uses is cooking oil production (Jimmerson 2005).
2.2 Mustard seed components
Mustard seeds contain a hull that represents between 15 and 20% of the seed weight and is
composed of a hygroscopic integument containing lignin, cellulose, hemicellulose and mucilage,
while the kernel makes up between 80 and 85% and contains most of the oil, proteins and soluble
sugars. They have a thin endosperm membrane and occur in seed pods varying in quantity from
10 to 40 seeds (Appelqvist 1971). Mustard seeds contain 28-32% protein by weight and 30-35%
of oil, although these values can vary slightly between varieties, growing regions and crop years
as shown by Figures 1 and 2 (Canadian Grain Commission 2012).

7
Figure 2: Average fix oil content of mustard seeds in Canada
Survey data from the Grain Research Laboratory shows that cool and moist weather tends to
increase the fixed oil content in the seed as well as the iodine values, on the other hand protein
content tends to be lower (Siemens 2011).
Figure 3: Average crude protein content for mustard seeds in Canada
0.0%
10.0%
20.0%
30.0%
40.0%
50.0%
2007 2008 2009 2010 2011
Fixed oil content for Canadian mustard crops
Yellow Mustard Oriental Mustard Brown Mustard
0.0%5.0%
10.0%15.0%20.0%25.0%30.0%35.0%40.0%
2007 2008 2009 2010 2011
Crude protein content for Canadian mustard crops
Yellow Mustard Oriental Mustard Brown Mustard

8
2.2.1 Oil
Between 95 and 98% of the oil in brassica seeds is composed of triglycerides, and only a small
amount, in the range of 0.3 to 0.5% are free fatty acids (Appelqvist 1971), although the quantity
may increase due to incorrect seed handling after harvest. The content of mono and diglycerides
is usually low. The typical brassica juncea and sinapis alba varieties have a high erucic acid
content (Table 2).
Nonsaponifiable material in mustard seeds is low and in the order of 0.5% of the oil. Mustard
seeds also contain polar lipids apart from nonpolar triglycerides, mainly phospholipids and
galactolipids which are comparable to soybean phospholipids.
Table 2: Fatty acid composition of Yellow and Brown mustard
Seed type Palmitic (%) Oleic (%) Linoleic (%) Linolenic (%) Eicosenoic (%) Erucic acid (%)
Brassica juncea 2-4 7-22 12-24 10-15 6-14 18-49
Sinapis Alba 2-3 16-28 7-10 9-12 6-11 33-51
2.2.2 Protein
Around 28-32% of the mustard seed total weight is composed of proteins. Proteins are polymers
of amino acids. Proteins form the structural elements of cells and tissue in the human body and
are considered as the basis of life, but they are also essential components in different food
systems. Proteins are complex bio-molecules formed by amino acid aggregates and are
essentially composed of carbon (50-55%), hydrogen (6-7%), oxygen (20-23%), nitrogen (12-
29%) and sulfur (0.2-3%) but also may contain phosphorous, iron, magnesium and copper
among other elements.

9
The building blocks of proteins are L-α-amino acids, organic compounds containing a central
carbon atom connected to a basic amino group (-NH2), an acid carboxyl group (-COOH) and one
of the 20 possible organic substituents (R) as shown in Figure 4. These substituents differ in their
physical and chemical properties and hence are the basis of the physicochemical differences in
proteins such as polarity, acidity, basicity, conformational flexibility, reactivity and functionality.
Amino acids can be classified according to the chemical characteristics of the substituent chain
in: nonpolar, polar uncharged, polar positively charged and polar negatively charged (Ludescher
1996).
Regardless of the side chain, amino acids are zwitterions at neutral pH, which means that are
molecules with both a positive and a negative electrical charge (Figure 4).
Amino acids can polymerize through the formation of a peptide bond into polypeptides, which
are the basic constituents of proteins.
The peptide bond is a kind of covalent bonding between the amine group of an amino acid and
the carboxyl group of another, producing an amide and a water molecule. The electronic
structure of the peptide bond gives proteins and peptides their conformational properties
(Ludescher 1996).
Amino acid Zwitterion
Figure 4: Amino acid structure

10
The shape and functionality of proteins are determined by their secondary, tertiary and
quaternary structures, while their composition or sequence of amino acids along their backbone
determines their primary structure. The secondary structure of a protein is the spatial
configuration of the amino acid sequence. Secondary structures can be periodic, where there is a
repetition in the values of the dihedral angles generating a helix, such as α-helices and β-sheets
structure types; and aperiodic, where there is no repetition of the dihedral angles, like in β-turns
structures (Ludescher 1996). In proteins, the secondary structure is defined by non-covalent
interactions and patterns of hydrogen bonds between the backbone amide and carboxyl groups.
The tertiary structure describes the atomic coordinates of each atom in a protein molecule. It is
the folded and complete tri-dimensional structure of the polypeptide chain and is consequence of
all non-covalent interactions between the amino acids in the molecule and between the molecule
and the solution. Quaternary structure is the result of the association through weak non-covalent
bonds of several polypeptide chains with a tertiary structure to form a larger protein complex.
Each of the polypeptide chains is a subunit, and the quaternary structure is their assembling
arrangement; it is the consequence of the non-covalent interactions between the subunits in the
molecule and between the molecule and the solution (Ludescher 1996).
Most of the 20 amino acids can be synthetized by the human body, but there are nine essential
amino acids that cannot be made by the organism and must be supplied in the diet. Amino acid
requirement values for essential amino acids, as well as the amino acid composition of yellow
mustard protein are shown in Table 3. The amino acid composition is well-balanced and
comparable to other vegetal protein sources such as soybeans. It has been proposed that mustard
proteins, along with other brassica proteins have a lower digestibility value than casein, due their

11
structural rigidity and lower nitrogen release in early digestion phases (Wanasundara 2011),
particularly napin proteins show more resistance to degradation.
Table 3: Values of oriental and yellow mustard amino acid composition compared to FAO indispensable amino acid
requirements
Indispensable
amino acid
requirements
(WHO/FAO 2007)
Soybeans
(Rackis, et al.
1961)
Yellow mustard
(VanEtten, et
al. 1967)
(Cserhalmi,
et al. 2001)
(Sarwar, et
al. 1981)
Amino acid Composition (mg/g protein)
Alanine - 45 45 42 38
Arginine - 84 61 62 33
Aspartic acid - 120 79 78 101
Glutamic acid - 210 180 191 133
Glycine - 45 61 55 66
Histidine - 26 29 37 23
Isoleucine 30 51 41 40 32
Leucine 59 77 73 74 56
Lysine 45 69 59 61 87
Methionine 16 16 17 - 10
Phenylalanine 38* 50 41 45 34
Proline - 63 64 111 95
Serine - 56 43 51 69
Threonine 23 43 46 47 71
Tryptophan 6 13 - - 5
Tyrosine 38* 39 33 29 55
Valine 39 54 56 31 60
Hydroxyproline - - 11 - -
* Value for phenylalanine + tyrosine
12
Of the proteins in mustard seed, around 70% is composed of storage proteins, cruciferin and
napin, which are found inside the protein bodies and have no catalytic functions. Up to 10% is
considered to be oleosin, a main structural component of the membrane surrounding the oil
bodies (Bell, Rakow and Downey 1999), the rest of the protein in the seed is part of other
cellular organelles while some of have catalytic functions, such as myrosinase (Appelqvist
1971). There are two main types of storage proteins present in mustard seeds: legumin type
globulins (11S, cruciferins), and napin-type proteins (2S, napins), which are water soluble and
have an isoelectric point around a pH value of 7 (Wanasundara 2011). Proteins are found in
special organelles called protein bodies, which are generated by the storage protein vacuoles
inside the seed. The relative content of cruciferin and napin proteins in mustard is variable and
depends on the seed variety.
Although allergic reactions to 2S napins in mustard seed have been reported, including celiac
disease and asthma (Monsalve, Villalba and Rodriguez 2001), the incidence of mustard allergies
in animals seems to be low, since canola and mustard meals have long been used as a
proteinaceous feed. Because of the occurrence of 2S napins in mustard seed and others from the
brassica family, the European Union has listed mustard as an allergenic food ingredient (EU
Directive 2003/89/EC).
Mustard, as well as other brassica oilseeds can be considered an important source of protein, but
is most currently used for livestock feeding due to its content of anti-nutritional components and
due to protein denaturation during industrial oil extraction, limiting its uses in the food industry.
The utilization of friendly processing conditions and proper separation processes such as the
ones used in this study would open the opportunity for value increase of mustard seeds. These
techniques will be discussed in the following sections.

13
2.2.3 Protein-oil interactions in mustard seeds
Different binding forces are present in lipid protein interactions, such as covalent binding,
electrostatic binding, polarization interaction, dispersion interaction and hydrophobic binding.
Evidence has shown that electrostatic and hydrophobic binding and metal ion participation are
particularly important in lipid protein structures (Chapman 1969).
The main lipid-protein interaction within mustard seeds occurs in cellular organelles. Mustard
seeds, like most oil bearing seeds, store oil reserves in oil bodies. Oil bodies have a spherical
shape, with a diameter that ranges from 0.2 to 2.5 µm (Huang 1992) depending on the seed
species and consist in a triacylglycerol core surrounded by a phospholipid monolayer and an
outer surface layer composed of proteins (Figure 5). The average size is also affected by
nutritional and environmental factors. The main component, triacylglycerols comprise about 92 –
98% of the total organelle weight. Phospholipids represent 0.6 – 4% and proteins around 0.6 –
3% (Gitte, Mundy and Jason 2001). The phospholipid monolayer in oil bodies is composed of
phosphatidylcholine, and lesser quantities of phosphatidylserine, phosphatidylethanolamine, and
phosphatidylinositol are also present (Huang 1992). The outer layer of oil bodies is formed by a
special type of proteins called oleosins.
Oleosins are alkaline proteins with a molecular weight varying from 15 to 30 kDa. Recent
studies have found that these proteins are not only present in the oil bodies, and as much as 5%
can be found on endoplasmatic reticulum segments inside the cells (Gitte, Mundy and Jason
2001). Oleosin structure consists of three different regions according to its amino acid sequence:
A hydrophilic N-terminal portion which contains between 50 – 70 amino acid residues, a central
portion which is a hydrophobic chain made of around 70 amino acid residues and a C-terminal

14
amphipatic portion of variable length that interacts with the phospholipid layer, with the
positively charged residues facing the phospholipid monolayer and the negatively charged
residues facing the oil body surface (Hsieh and Huang 2004). It has been proposed that the center
of the hydrophobic portion is formed by two antiparallel β-strands connected by three proline
and one serine residues, interacting to form a “proline knot” that is inserted into the
triacylglycerol matrix (Hsieh and Huang 2004).
Due to the presence of the oleosin and phospholipid monolayer, oil bodies present a negative
electrical charge at neutral pH and a hydrophilic surface, preventing coalescence with one
another and are able to retain their shape even through seed desiccation. The main function of
these discrete and small organelles is to provide a large surface area per triacylglycerol unit in
order to enable lipase binding during seed germination (Hsieh and Huang 2004). Oil body size in
oilseeds is related to the particular seed species and is also determined by the relationship
between oil and oleosin contents. As the triacylglycerol content in the oil bodies increase, the
phospholipid and protein content decreases and the diameter of the oil bodies grows larger. It has
oil bodies
protein body
Figure 5. Structure of oil bodies (Huang 1992)

15
been found that oil bodies in mustard seeds have an average diameter of 0.73 µm and a
composition of around 95% lipids, 3% protein and 1.5% phospholipids (Tzen, et al. 1993).
The presence of oil bodies in mustard seeds may play an important role in the efficiency of the
extraction process, particularly in an aqueous extraction process. The extent of the disruption of
the cell oil bodies prior to extraction has a direct impact in oil yields as they may remain intact
after flaking or grinding, although coalescence can be induced by the use of enzymes (Campbell,
Glatz and Johnson, et al. 2011).
2.2.4 Glucosinolates
Glucosinolates are considered anti-nutritional compounds and their presence is important for the
food applications of brassica seed meals and derived products. In vivo models in rats show that
high levels of glucosinolates and their breakdown products have an adverse thyrotoxic effect, but
are not seen when protein isolates with low glucosinolate levels are used (Wanasundara 2011).
They are responsible for the bitter taste of mustard, and their breakdown products,
isothyocianates, for the pungency and hot flavour. Glucosinolates in brassica seeds are digested
by the endogenous enzyme myrosinase to isothiocyanates, glucose and sulfates. The
glucosinolate content in brown/oriental mustard is about 5-7% (Mustakas, et al. 1965) and in
yellow mustard around 9% (Josefsson 1970). Glucosinolates are thioglucosides with a cyano
and a sulfate group (Zrybko, Fuduka and Rosen 1997). There is a considerable variation in the
glucosinolate content of mustard seeds due to factors such as genetic origin, age, and
environmental conditions in which the plant is grown (Fenwick, Heaney and Mullin 1982). The
predominant thioglucoside in yellow mustard (sinapis alba) is sinalbin and its reaction with
myrosinase is shown in Figure 6.

16
Similarly, in the brown/oriental mustard (brassica juncea), the main thioglucoside sinigrin reacts
in the presence of myrosinase to produce allyl isothyocianate (Figure 7), which is a volatile
pungent liquid and gives brown/black mustard its pungent flavour and odour. The main function
of these substances in the plant is self defense mechanisms against pests and other diseases
(Zrybko, Fuduka and Rosen 1997). Several studies have found that isothyocianates can inhibit
the neoplastic effects of different carcinogens in different organs (Stoewsand 1995 and Spitz, et
al. 2000). On the other hand, isothyocianates have also been shown to have goitrogenic
Sinalbin
Sinapine acid sulfate p-Hydroxybenzyl isothiocyanate
Myrosinase H2O
+ +
Glucose
Figure 6: Isothyocianate release reaction for sinapis alba

17
properties, interfering with iodine uptake and affecting the function of the thyroid glands,
inhibiting hormone production (Zukalová and Vasák 2002). Heat treatment for the inactivation
of myrosinase has been shown to be an effective method to avoid the breakdown of
glucosinolates from brassica seeds (Fenwick and Heaney 1983) but has an adverse effect due to
protein denaturation during the thermal process and glucosinolates may undergo an enzyme
mediated reaction to produce isothyocianates after ingestion. Alternatively membrane processing
has also been shown effective for the reduction of glucosinolates from mustard protein isolates
(Lui 1998).
2.2.5 Phytates
Phytates, salts of calcium, magnesium and potassium from phytic acid (Figure 8) are other of the
components in mustard seeds. About 3% of the yellow mustard seed is composed by phytates, on
an oil free basis (Luo 1998). These compounds accumulate in the protein storage vacuoles as
crystals and show strong electrostatic interactions with proteins, particularly at pH values lower
than their isoelectric point, above which both dissociate. Phytic acid is capable of forming
insoluble protein complexes and attention should be kept in the pH extraction values of the
Figure 7: Isothyocianate release reaction for brassica juncea
Myrosinase
H2O
Sinigrin
+ +
Glucose Allyl isothiocyanate Potassium bisulfite

18
protein (Okubo, Myers and Iacobucci 1976). Because of the nature of phytic acid, there have
been a series of studies that show contrasting consequences of phytate ingestion. While
beneficial effects related to its natural antioxidant activity have been reported, suppressing iron-
mediated oxidation reaction in the colon (Graf and Empson 1987), phytic acid is a strong
chelating agent and can decrease the bioavailability of minerals such as calcium, zinc and iron
and lead to mineral deficiencies in mammals. Studies have shown that rats fed with yellow
mustard protein concentrate show symptoms of zinc deficiency (Wanasundara 2011).
Alkaline extraction of grounded yellow mustard seed, followed by ultrafiltration and diafiltration
of the protein extract has been considered an effective method in the reduction of phytic acid
levels in protein isolates, where the excess of basic cations prevents the formation of protein-
phytate complexes and free phytates are effectively removed by membrane processing (Luo
1998).
Figure 8: Chemical structure of phytic acid
2.2.6 Phenolic compounds
There is a wide variety of phenolic compounds in mustard seeds which includes esterified and
free forms of phenolic acids. These compounds are usually found as methoxylated derivatives of

19
benzoic and cinnamic acids. The most abundant phenolic compounds present in yellow mustard
are p-hydroxybenzoic acid and sinapic acid (Figure 9), present also as sinapine, its choline ester
form (Kozlowska, Zadernowski and Sosulski 1983). Phenolic compounds are known to have a
strong antioxidant effect, but are also responsible for a bitter and astringent taste in the mustard
seed meal as well as a dark colour (Shahidi and Naczk 1989), both of them un-wanted
characteristics in a food additive or a food ingredient. Four types of interactions exist between
these compounds and proteins: hydrogen bonding, covalent bonding, ionic bonding and
hydrophobic interactions (Xu and Diosady 2002). It has been shown that alkaline extraction,
followed by treatment with 0.05 M sodium chloride and membrane processing can reduce the
unbound phenolic fraction and the ionic protein-bonded fraction, while treatment with sodium
lauryl sulphate is able to reduce the hydrophobic protein-bonded fraction (Xu and Diosady
2002).
Figure 9: Chemical structure of phenolic compounds
Sinapic acid p-hydroxybenzoic acid

20
2.3 Protein extraction
Two main problems arise when considering mustard seed and other oilseeds for the production
of food grade protein isolates; current oil extraction methods increase protein denaturation by the
use of organic solvents and high temperatures (Pedroche, et al. 2004), and the presence of anti-
nutritional components such as phytates, glucosinolates and phenolic compounds (Naczk, et al.
1998).
Protein denaturation is a physical-chemical process in which the configuration, conformation and
state of folding of the polypeptide chains within the molecule is changed to a different
arrangement by an energy input that can consist in heat, light, pressure, etc. Depending on the
type of protein, denaturation can hinder or induce desirable functional properties. Proteins can be
denatured by different types of processes such as thermal effects, presence and concentration of a
denaturant like urea, guanidine hydrochloride and various salts that induce conformational
changes of proteins (Kilara and Harwalkar 1996), high pressures related to extrusion processes
and changes in pH that can lead to an unstable protein molecule. The effects of any of these
factors depend on the nature of the protein; not all will suffer denaturation at the same conditions
of temperature, pH, pressure or salt ion concentration.
Currently, most of the oilseed processing plants are focused in the production of edible oil and
little attention has been given to the production of food grade protein from the meal fraction. But
the need for additional sources of high quality protein for human nutrition has pushed forward
the development of alternative processes, such as aqueous extraction systems.

21
2.3.1 Solvent extraction process
In the traditional solvent extraction process, the time-temperature-moisture relationship is
essential (Becker 1970). As the value of each of these variable increases, the protein denaturation
will also increase, affecting the quality and functional properties of the final product. The use of
organic solvents such as hexane, derived from a non-renewable source, has inherent safety risks
to both the manufacturing facilities and personnel due to flammability and explosion hazards. In
addition hexane vapors can react with nitrogen oxides in the atmosphere and increase ground
level ozone (Campbell et al. 2011). The Environment Protection Agency (EPA) in the United
States has classified hexane as a hazardous air pollutant so its emission to the atmosphere has to
be monitored and reported (Environmental Protection Agency 2001) and is subject to costly fines
if the limits are exceeded.
In the typical solvent extraction process, seeds are first cleaned by aeration and sieving (Becker
1970). After cleaning seeds are submitted to hull decortication followed by the separation of the
kernels, although in the case of Canola seeds de-hulling is not performed. Size reduction is
usually the next step, the seeds are cracked using a rolling mill which helps disrupt the cellular
structure and increases the surface area to improve oil extraction yield. After de-hulling and size
reduction, oilseeds are tempered or cooked. Usual cooking temperatures vary from 120°C for
rapeseed, 100°C for canola to 65°C for soybeans (Dunford 2012). Cooking inactivates the
myrosinase enzyme which prevents the hydrolysis of glucosinolates into isothyocianates and
nitriles in brassica seeds. Tempering also improves pressing and solvent extraction efficiencies
(Dunford 2012); it is also useful to decrease the oil viscosity prior pressing and to complete the
cell disruption and facilitate the oil extraction (Ward 1984). A prepress-solvent extraction
process is usually the next step (Figure 10). Lower temperatures and pressures applied in the
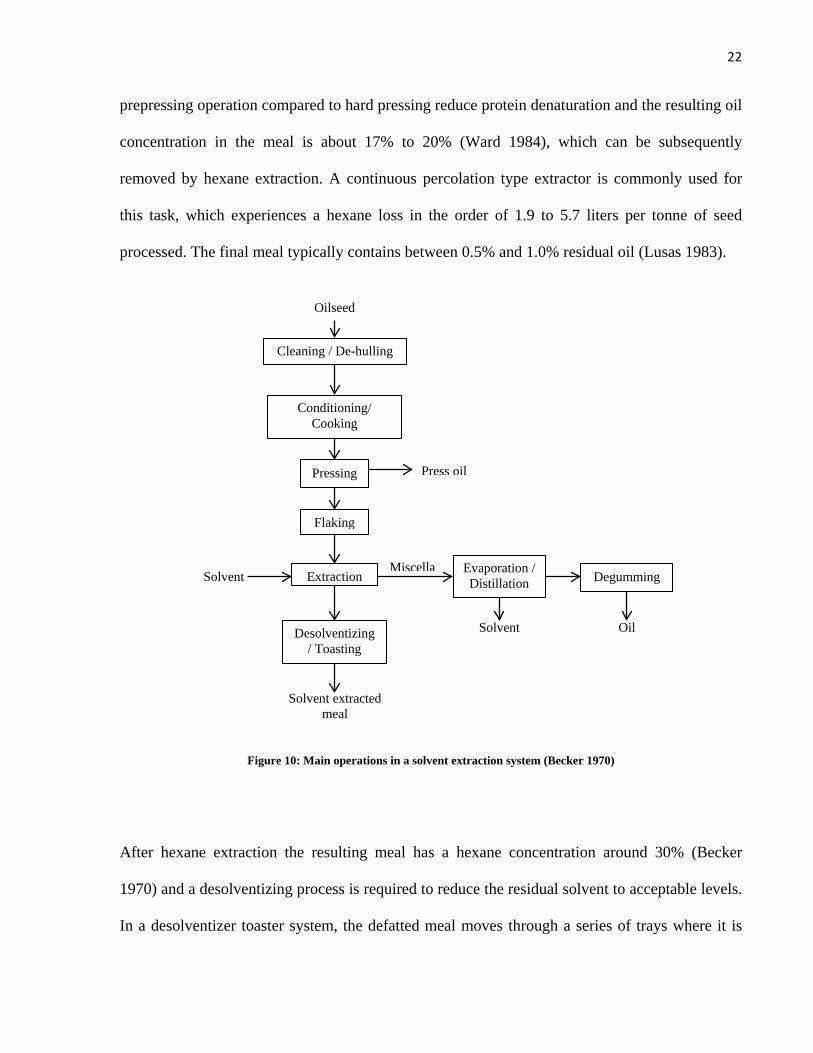
22
prepressing operation compared to hard pressing reduce protein denaturation and the resulting oil
concentration in the meal is about 17% to 20% (Ward 1984), which can be subsequently
removed by hexane extraction. A continuous percolation type extractor is commonly used for
this task, which experiences a hexane loss in the order of 1.9 to 5.7 liters per tonne of seed
processed. The final meal typically contains between 0.5% and 1.0% residual oil (Lusas 1983).
Figure 10: Main operations in a solvent extraction system (Becker 1970)
After hexane extraction the resulting meal has a hexane concentration around 30% (Becker
1970) and a desolventizing process is required to reduce the residual solvent to acceptable levels.
In a desolventizer toaster system, the defatted meal moves through a series of trays where it is
Cleaning / De-hulling
Conditioning/ Cooking
Pressing
Flaking
Extraction
Desolventizing / Toasting
Evaporation / Distillation Degumming
Oilseed
Press oil
Miscella Solvent
Oil Solvent
Solvent extracted meal
23
heated in order to remove most of the solvent, live steam is then injected to strip the remaining
hexane, and finally the meal is toasted in the lower trays at a temperature of 107°C (Becker
1970) to reduce the moisture content of the product. It has been shown that under the same
desolventizing conditions, factors such as the moisture content of the seeds prior crushing, de-
hulling and solvent extraction times affect the residual hexane content (Wolff 1983).
2.3.2 Aqueous extraction process
The development of aqueous extraction processes from oilseeds to obtain both oil and protein
date back to the 1950’s. Chayen (1953) and Subrahmanyan (1959) considered the extraction of
oil and protein with water as the main solvent in an analogous way to traditional extraction,
where all or a part of the oil is first removed. Just a limited number of these methods have been
fully developed to a commercial level. Further aqueous processes for the recovery of oil and
protein were developed for a wide variety of oilseeds, like coconuts (Hagenmaier, Cater and
Mattil 1972), sunflower seeds (R. D. Hagenmaier 1974), peanuts (Rhee, Cater and Mattil 1972),
soybeans (Campbell and Glatz 2009) and rapeseed (Caviedes 1996) have also been studied.
Protein and oil can be simultaneously recovered in an aqueous system, where protein in the
resulting aqueous and solid phases can be further processed and purified. The efficiency of the
process greatly depends on the main operations involved: cell disruption, oil and protein
extraction, centrifugation, de-emulsification (Campbell K. A., 2011; Cater, et. al 1974 and
Rosenthal, 1996) and protein purification and isolation. A general process diagram is shown in
Figure 11.
The conditions, methods and degree of cell disruption are fundamental in an aqueous extraction
processes. Cells in the seeds to be extracted must be efficiently destroyed to increase the

24
extraction yields of both oil and protein. Insufficient disruption may leave large quantities of oil
and protein in the solid residue (Cater, et al. 1974), while excessive comminution might result in
a highly stable oil and water emulsion due to the smaller oil droplets (Rosenthal, Pyle and
Niranjan 1996) and an increase in the oil content of the aqueous phase. Moisture content,
physical structure and chemical composition of the seed are important in deciding the disruption
method, and wet or dry operations. Commonly used methods include flaking, extrusion, dry
grinding and wet grinding.
Figure 11: Main operations in aqueous extraction systems (Cater, et al. 1974)
The extraction operation consists in the agitation of a dispersion composed of the disrupted seed
material and water; factors that influence the effectiveness and extent of the extraction are solid
to water ratio, pH, temperature (Cater, et al. 1974), particle size, agitation degree, extraction time
(Rosenthal, Pyle and Niranjan 1996), extraction stages and ionic strength. After the extraction,
the dispersion is separated, usually by centrifugation, into a water in oil emulsion, a solid phase
Cell disruption
Extraction
Centrifugation
Protein purification and isolation
De-emulsification and oil recovery Meal drying
Oilseed
Aqueous phase
Emulsion Solids
25
containing insoluble components such as fibers, protein and oil, and an aqueous phase with the
soluble components of the seed. Studies in our food laboratory have found that for full fat yellow
mustard flour, an optimum water to solid ratio of 4 to 1, pH of 12, ambient temperature, 30
minutes of extraction time and 3 stages yield the highest amount of protein and oil extraction
(Prapakornwiriya 2002 and Balke 2006).
Filtration of the aqueous phase rich in soluble protein is an essential step for the recovery of
protein concentrates and isolates with low levels of anti-nutritional components. Several methods
have been developed in our food engineering laboratory group for the recovery of high quality
products that include microfiltration, ultrafiltration and diafiltration.
The removal of water from the protein solution is the final step. The use of a freeze drying or
spray drying systems may be considered depending on the scale of the production process.
The aqueous extraction processing of oilseeds has important advantages. High quality protein
can be obtained, since heating and toasting steps that can irreversibly cause denaturation are
omitted. Safety risks regarding the use of highly volatile solvents are eliminated which have an
important impact on equipment and training costs. There is also a considerable decrease in the
environmental footprint of the process and costs related to volatile organic compounds emission
and control. An aqueous extraction process has a smaller number of operations than the solvent
extraction, making it a simpler, more energy efficient process and having the possibility of being
designed for continuous or batch operation. Even though there are important advantages, there
are also some disadvantages due to the nature of the process. There is a lower oil extraction yield
compared to solvent treatment and there is the need of a de-emulsification step when oil is
recovered in the form of an emulsion, additionally there is an increased potential for microbial

26
contamination because the material is wet during most of the operations (Cater, et al. 1974 and
Rosenthal, 1996).
The use of enzymes in aqueous extraction systems can increase both oil and protein yields.
Depending on the seed and its components different kinds of enzymes or combination of
enzymes can be used. Carbohydrases, such as cellulases, pectinases and hemicellulases help
degrade the cell wall materials and can increase the oil recovery, while proteolitic enzymes
hydrolyze proteins including oleosins, which may increase the release of oil (Rosenthal, Pyle and
Niranjan 1996).
2.4 Protein purification and isolation
In order to obtain food quality products by either a solvent or an aqueous extraction, protein must
be purified. Several protein purification and separation processes rely on the differences in
solubility between them, or between proteins and non-protein materials in a solution.
Precipitation is one of the techniques used for the recovery of proteins, and is usually
accompanied by a concentration step in order to reduce the volume of the initial solution and the
level of undesired, micro-molecular components. The principles of protein precipitation are
related to forces acting between the polypeptide chains in the proteins and also their interaction
with the solvent molecules. Changes in the solvent-protein and protein-protein interactions which
lead to precipitation can be induced by modifying the temperature, the composition of the
solvating medium or the pH (Li-Chan 1996). At the isoelectric point, where there are an equal
number of positive and negative charged groups, the surface of the protein will be least solvated
facilitating hydrophobic interactions and aggregation.
27
One of the most common processes for protein precipitation is known as “salting out”, where a
high salt concentration leads to a decrease in the effective concentration of water. The
concentration and nature of the salt used is important to determine the effect on protein-protein
and protein-water interactions. In general terms, salts with high molal surface tension values are
effective in protein precipitation, while salts with low values have the opposite effect, called
“salting in” (Li-Chan 1996). An alternate process for protein precipitation proposed by Murray,
et al. (1979) called micellization consists of the extraction of proteins from seed meals using a
“salting in” technique followed by precipitation by the dilution of the concentrated extract with
water and a temperature adjustment, favoring hydrophobic interactions and protein aggregation.
In some cases the solubility of proteins at their isoelectric point is low enough to allow their
recovery by a pH adjustment, this process is known as isoelectric precipitation. Previous studies
in our food engineering laboratory have shown that isoelectric precipitation is a suitable process
to recover most of the mustard seed proteins after an alkaline extraction. The isoelectric point for
the alkaline extracted proteins from defatted mustard is around a pH value of 4.75 (Lui 1998 and
Xu, Lui, et al. 2003) while a value of 5.5 has been found and used for alkaline extracted full fat
mustard (Prapakornwiriya 2002). It must be considered that for the mustard protein extraction,
isoelectric precipitation of the protein extract would result in a product with high levels of anti-
nutritional components that would limit its use for human consumption. Since the molecular
weight of mustard proteins is considerably larger than most anti-nutritional components or
contaminants, membrane processing via ultrafiltration and diafiltration is used as a purification
step.

28
2.4.1 Ultrafiltration
Ultrafiltration is a cross-flow membrane separation process. In a solution containing low
molecular weight and high molecular weight solutes, the latter will be retained by the membrane,
while the smaller low molecular weight particles will permeate through. The driving force in
order to achieve the separation is a pressure difference applied to a solution on the feed side of a
membrane. Ultrafiltration membrane pore sizes are usually classified according to the molecular
weight of the species that will be retained by assigning to them a molecular weight cut off
(MWCO). A schematic of this process is shown in Figure 12. The solvent and low molecular
weight species passes through the membrane and constitute the permeate, while solutes with a
larger weight than the MWCO are retained and form the retentate.
Figure 12: Ultrafiltration principle of operation
Since micro molecular components have significantly lower molecular weights, it is possible to
separate them from other macromolecular compounds in aqueous solution by using
Pressure
Retentate Ultrafiltration membrane
Permeate
29
ultrafiltration. Membrane molecular weight cut offs in this case are typically between 5 and 500
kDa and are able to retain proteins, polymers, and chelates of heavy metals (Cheryan 1998).
Since low-molecular-weight solutes flow through the membrane, osmotic pressure is not an
issue. However, since retained large molecules and colloidal particles have low diffusivities in
the liquid medium, ultrafiltration membranes are more susceptible to fouling and concentration
polarization than reverse osmosis or microfiltration membranes (Cheryan 1998).
Usually, not all the particles larger than the molecular weight cut off of the membrane are
rejected, and some particles smaller than this parameter may be partially rejected. In order to
estimate the separation degree attained by the process, a mathematical model has been developed
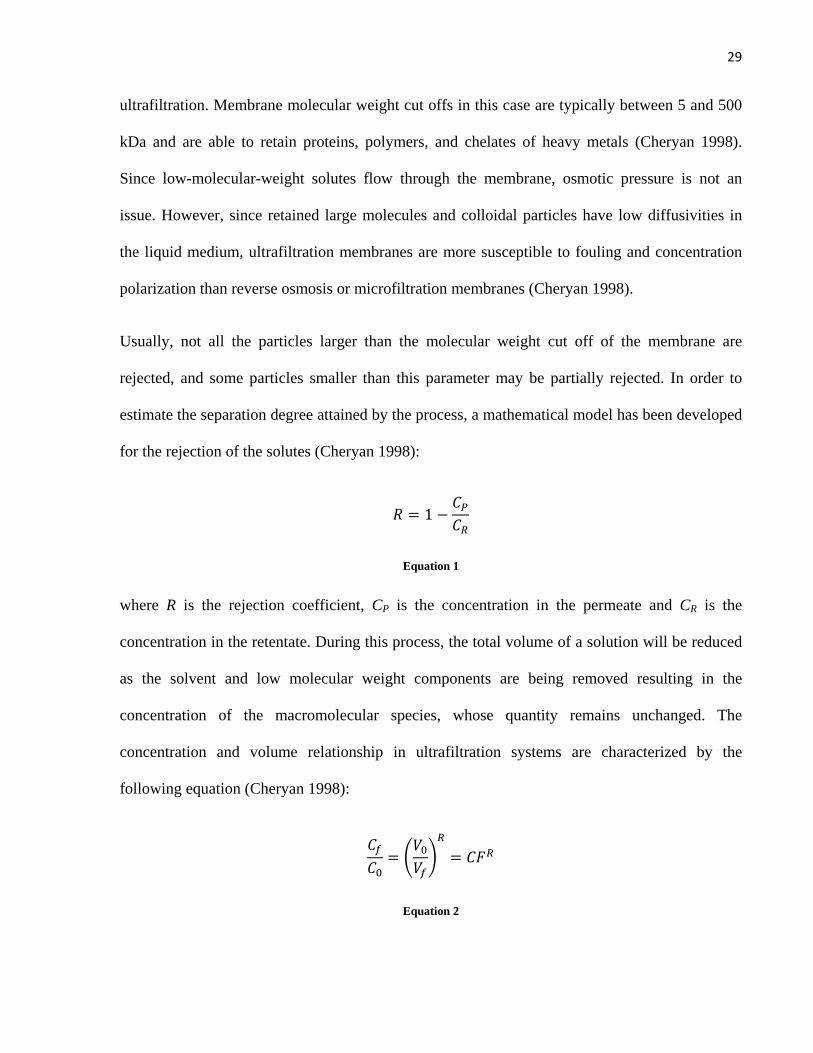
for the rejection of the solutes (Cheryan 1998):
𝑅 = 1 −𝐶𝑃𝐶𝑅
Equation 1
where R is the rejection coefficient, CP is the concentration in the permeate and CR is the
concentration in the retentate. During this process, the total volume of a solution will be reduced
as the solvent and low molecular weight components are being removed resulting in the
concentration of the macromolecular species, whose quantity remains unchanged. The
concentration and volume relationship in ultrafiltration systems are characterized by the
following equation (Cheryan 1998):
𝐶𝑓𝐶0
= �𝑉0𝑉𝑓�𝑅
= 𝐶𝐹𝑅
Equation 2
30
Where Cf is the final concentration of the feed, C0 is the initial concentration of the feed, V0 is the
initial feed volume, Vf is the final feed volume, CF is the concentration factor and R is the
rejection coefficient.
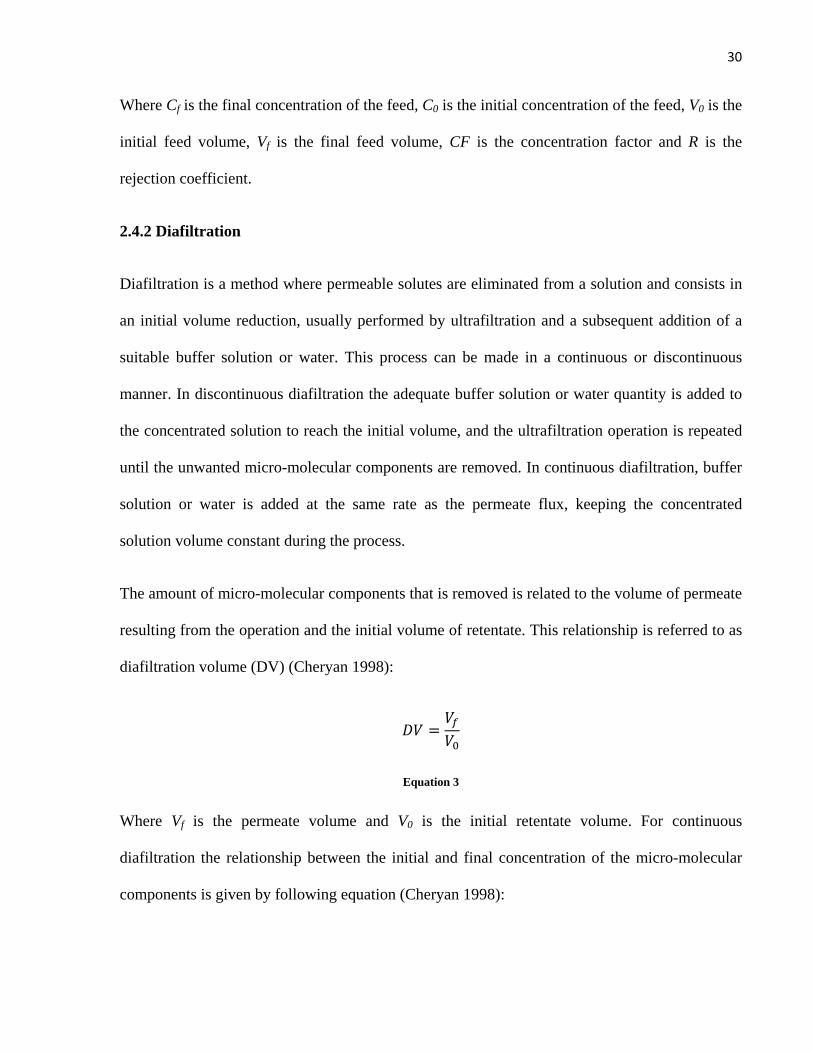
2.4.2 Diafiltration
Diafiltration is a method where permeable solutes are eliminated from a solution and consists in
an initial volume reduction, usually performed by ultrafiltration and a subsequent addition of a
suitable buffer solution or water. This process can be made in a continuous or discontinuous
manner. In discontinuous diafiltration the adequate buffer solution or water quantity is added to
the concentrated solution to reach the initial volume, and the ultrafiltration operation is repeated
until the unwanted micro-molecular components are removed. In continuous diafiltration, buffer
solution or water is added at the same rate as the permeate flux, keeping the concentrated
solution volume constant during the process.
The amount of micro-molecular components that is removed is related to the volume of permeate
resulting from the operation and the initial volume of retentate. This relationship is referred to as
diafiltration volume (DV) (Cheryan 1998):
𝐻𝑉 =𝑉𝑓𝑉0
Equation 3
Where Vf is the permeate volume and V0 is the initial retentate volume. For continuous
diafiltration the relationship between the initial and final concentration of the micro-molecular
components is given by following equation (Cheryan 1998):

31
𝐶𝑅 = 𝐶0𝑒−𝐷𝑉(1−𝑅)
Equation 4
Where CR is the final concentration of the micro-molecular component, C0 is the initial
concentration, and R is the rejection coefficient. As a result of continuous diafiltration, the final
volume and concentration of the macro-molecular components retained by the membrane does
not change. As shown by the equation, a diafiltration volume of 6 is enough to remove more than
99.5% of a micro-molecular component with a rejection coefficient of 0. The given formula also
shows that when the solute is partially retained by the membrane (the rejection coefficient is
greater than 0), the diafiltration volume needed to reach the same removal will increase.
The main limitations for membrane separation processes are concentration polarization and
membrane fouling. Concentration polarization controls the performance of ultrafiltration. It is an
effect where particles rejected by the membrane tend to form a layer near the surface causing
further resistance to the flow of the permeate. The flux decrease is usually explained by two
mechanisms: The first one is an increase in the osmotic pressure due to the increased solute
concentration near the surface of the membrane in comparison to the bulk concentration in the
feed, and the second one is the hydrodynamic resistance of the boundary layer (Cheryan 1998).
To reduce the effect of concentration polarization several factors such as pressure, feed
concentration, temperature and turbulence in the feed channel must be optimized.
Membrane fouling on the other hand is characterized by an irreversible decline in the flux that
cannot be counteracted with fluid management techniques. It is due to the accumulation of feed
components on the membrane surface or within the pores of the membrane and is influenced by
the chemical natures of both the membrane and the solutes and membrane-solute and solute-
32
solute interactions (Cheryan 1998). Usually the only way of restoring the flux of a fouled
membrane is through cleaning. Fouled membranes and auxiliary equipment are generally cleaned
by clean-in-place procedures (Lindau and Jönson 1994) which are usually based on various
chemical or enzymatic treatments to restore the membrane to its original state.
2.5 Functional properties in protein isolates
The importance of protein isolates when used in food systems does not rely only in their
nutritional value, but in the desirable properties and sensory attributes that the additives are able
to provide. Emulsification capacity, water and lipid holding capacity, gelation capacity, foaming
capacity and foaming stability are functional properties that enhance food sensory and
organoleptic characteristics including colour, flavour, odour, texture or mouth feel. For centuries
animal proteins have been traditionally the main source of functional ingredients; milk, egg and
animal meat proteins have unique properties and functionality applications, however it is
estimated that about 8 kg of protein from a vegetable source are needed to produce 1 kg of
animal protein (Damodaran 1996). Considering this low ratio, the increasing protein demand due
to population growth and land use competition between food crops, non-food crops for biofuel,
and cattle, oilseeds such as mustard offer an interesting alternative as a renewable source of oil
for biofuel production and protein to provide sensory characteristics and nutritional value to food
products as a replacement of animal protein.
Kinsella and Melachouris (1976) defined the functional properties of proteins as those physical
and chemical properties which have an influence on their behavior in diverse food systems,
whether it is in their preparation, storage, cooking or consumption. The size, shape, amino acid
composition and sequence, net charge, charge distribution, hydrophobicity, hydrophilicity,

33
structural arrangements and molecular flexibility of proteins are intrinsic characteristics that
define their functionality and interactions with other food ingredients.
Functional properties can be classified in three groups according to their action mechanism in
food systems: properties due to hydration such as solubility and wettability, properties related to
protein structure such as viscosity and gelation, and properties related to protein surface such as
emulsifying and foaming capacities (Moure, et al. 2006 and Siong, et al. 2011).
2.5.1 Hydration properties
Important functional properties such as solubility, wettability, dispersibility, foaming,
emulsification and gelling properties are affected by the solvation and dissolution characteristics
of the protein and depend on the interaction between the molecules and the solvent. The
hydration mechanism of a protein describes different states of water in hydrated proteins
(Kinsella, Fox and Rockland 1986): structural water is formed by water molecules that are part
of the protein structure, bound by hydrogen bonds; this water is not available for chemical
reactions, is un-freezable and not relevant for the functional properties of the protein. Monolayer
water is composed by water molecules bound via dipole-induced dipole, ion-dipole and dipole-
dipole interactions with polar groups in the protein and hydrophobic hydration of nonpolar
groups. The monolayer forms when the water activity is in the range from 0.05 to 0.3 and is
unavailable for most chemical reactions. On the other hand, water states related to protein
functionality include: multilayer water at water activities between 0.3 and 0.7, un-freezable water
consisting of multilayer ordered water molecules up to a water activity of 0.9, capillary water
bound due to capillary forces in crevices and cavities, which appears when the water activity is

34
between 0.5 and 0.95 and finally, hydrodynamic hydration water that exists at a water activity
over 0.99 and affects viscosity and diffusion properties of the protein.
2.5.1.1 Water and oil absorption
In food systems, the water absorption capacity of a protein is the ability to hold water against
gravity and form network structures with other proteins via non-covalent interactions. The
capacity of retaining moisture influences the texture and mouth-feel of foodstuffs (Kinsella and
Melachouris 1976 and Johnson 1970) and is function of the fraction of charged residues, polar
amino acid side chains and nonpolar residues of the protein (Moure, et al. 2006). Amino acid
residues with charged side chains will experience strong ion-dipole interaction and bind more
water. External factors like pH, ionic strength, protein concentration, temperature and particle
size of protein powders have a considerable effect in water absorption (Damodaran 1996 and
Johnson 1970). Most proteins have the lowest water binding capacity at their isoelectric pH.
Water absorption is usually described by the water absorption capacity (WAC), the amount of
water retained per unit mass of protein after mixing and centrifugation (F. Sosulski 1962) and the
water hydration capacity (WHC) (Naczk, Diosady and Rubin 1985).
Similarly, oil absorption can be defined as the amount of oil retained per unit mass of protein
after thorough mixing and centrifugation (Lin and Humbert 1974 and Sosulski, Humbert and Bui
1976). The importance of fat absorption by protein in food systems lies in the in the ability of
lipid molecules to modify and in some cases provide odours and flavours as well as a pleasant
mouth feel (Forss 1972), and an improvement in flavour transport during food processing
(Kinsella and Melachouris 1976). The oil-protein binding mechanism is related to capillary
forces in crevices and cavities of the protein molecule surface which are able to entrap oil
35
molecules as well as hydrophobic interactions between non-polar side chains and lipid
molecules.
2.5.1.2 Protein Solubility
Protein solubility can be described as a thermodynamic equilibrium between protein-solvent and
protein-protein interactions. As protein solubility increases, it can be more easily incorporated
into foodstuffs, increasing its functionality and applications. Solubility of a protein is influenced
by the balance of hydrophobic and hydrophilic residues on the protein surface, given by the
amino acid composition. A low number of hydrophobic residues, as well as a high number of
electrostatic repulsions and ionic hydration lead to high solubility (Moure, et al. 2006). Solubility
is also affected by the environmental conditions of the solution such as pH, ionic strength, ion
types, temperature, solvent polarity and processing conditions, all of which interfere with the
hydrophilic and hydrophobic interactions at the protein surface (Damodaran 1996). In the case of
pH and ionic strength, their effect on solubility can be explained by the changes in the protein
electrostatic forces (Kinsella and Melachouris 1976). At pH values around the isoelectric point,
the solubility of a protein will be at its minimum value. Processing conditions that promote
protein denaturation lead to conformational changes that even at a low extent can alter the
hydrophobic and hydrophilic balance at the protein surface affecting solubility. The nitrogen
solubility index (NSI) given as the percentage of water-soluble nitrogen from a given sample
under slow stirring is the usually adopted method to determine protein solubility (AOCS, 1999).
2.5.2 Properties related to protein surface
Many processed foods are in foam or emulsion type systems. Emulsions and foams are two-
phase systems consisting of a dispersed and a continuous phase. Foam can be defined as a
36
substance formed by the dispersion gas cells in a continuous liquid phase that contains a
surfactant, while an emulsion is a mixture of two or more liquids that are normally immiscible
where one of the liquids is dispersed in the other. Because of the amphipathic nature of proteins,
they act as macromolecular surfactants in emulsions and foam-type products. Proteins act by
lowering the interfacial tensions and also are able to produce a continuous film at the interface
via intermolecular interactions. The high viscosity and high dilatational modulus of protein films
makes them able to withstand external forces, producing more stable foams and emulsions than
low molecular weight surfactants. These characteristics are the result of protein surface activity,
which is affected by molecular properties such as conformational stability, flexibility, the
symmetry in the distribution of hydrophilic and hydrophobic side chains and external factors
such as pH, ionic strength and temperature (Moure, et al. 2006). The dynamics of protein
adsorption proceed through the sequential attachment of polypeptide segments. The first step is
the transport of the protein from the bulk to the interface where the global free energy of the
protein is lower. The kinetics of adsorption of proteins has been proposed to follow a diffusion
controlled model that depends not only in the concentration and diffusion coefficient, but on an
activation energy for adsorption at the interface that arise from physiochemical constraints of the
protein related to hydrophobic, hydrophilic and conformational flexibility of the molecule
(Damodaran 1996). The surfactant properties of proteins are improved when they possess a high
rate of diffusion and adsorption, are able to unfold rapidly and are able to form a cohesive and
viscous film at the interface. Protein adsorbs to interfaces in multiple contact points according to
the degree of flexibility of the polypeptide chain and may change their conformation upon
interface adsorption (Damodaran 1996).

37
2.5.2.1 Foaming properties
Foaming properties in proteins describe their ability to form a large and stable interfacial film
between the solution and the surrounding air that will withstand internal and external forces. The
foaming ability of a protein depends on its rate of adsorption at the interface, on its molecular
flexibility, that is, the rates at which it can unfold and undergo molecular rearrangements to
reduce the surface tension, and its capacity to form a cohesive film (Moure, et al. 2006). On the
other hand, the stability of the foam is affected by the molecular rigidity of the protein and the
rheological properties of protein films such as film viscosity, shear resistance, elasticity and the
disjoining pressure between protein layers. Ultimately, an adequate balance of flexibility and
rigidity must be present to produce stable foams (Damodaran 1996). External factors such as pH
(Sathe, Deshpande and Salunkhe 1982), temperature (Richert, Morr and Cooney 1974) and the
presence of other components such as sugars or lipids (Yasumatsu, et al. 1972) also affect the
foaming properties and foam stability. The foam capacity can be determined by the measure of
the foam volume produced after whipping of a protein dispersion with a specific concentration
(Lin and Humbert 1974), while foam stability can be expressed as the volume of foam remaining
after a certain amount of time has passed.
2.5.2.2 Emulsifying properties
An emulsion can be defined as a two phase system in which one liquid is dispersed as droplets in
another. Thermodynamically speaking, an emulsion is an unstable system and given enough time
the phases will separate, but it can be stabilized by the addition of surface active molecules or
surfactants. The emulsifying potential of a protein can be described by the emulsifying activity
index, the emulsion stability index and the emulsifying capacity (Kinsella and Melachouris

38
1976). Factors that affect the emulsifying properties of proteins include the rate of adsorption at
the interface, the amount of protein adsorbed, the conformational rearrangement at the interface,
molar mass, and external factors such as pH, ionic strength and temperature (Moure, et al. 2006).
Disjoining forces generated by electrostatic, steric and solvation interactions in the aqueous
phase also have a major role in the stability of emulsions (Damodaran 1996). Most emulsions are
more stable at pH values that are far away from the isoelectric point of the protein, where
electrostatic repulsion and hydration repulsion forces are maximized. Heat denaturation, as well
as some chemical and enzymatic treatments, like succinylation, phosphorylation and
glycosylation can improve the emulsifying properties (Damodaran 1996).
2.5.3 Properties related to protein structure: Gelation
Gels are considered as an intermediate phase between a solid and a liquid. In food systems the
liquid phase is usually water and the solid phase is formed by proteins or carbohydrates. Protein
gels are formed by polymeric molecules covalently or non-covalently cross-linked in a three-
dimensional network. Gels provide a structural matrix able to hold water, flavours, sugars and
other food ingredients. The ability to form a gel by a protein solution is affected by its molecular
weight and its ability to denature (Moure, et al. 2006). The mechanism for protein gelation is a
stepwise process (Damodaran 1996) in which the protein solution is first irreversibly converted
to a pro-gel by heating above the denaturation temperature to expose the functional groups which
interact to form the network, then the protein forms one of two types of gel networks depending
on the type of protein, its amino acid composition and external factors such as pH and ionic
strength: a coagulant gel is formed by proteins with high levels of nonpolar residues, and a
transparent type gel is formed by proteins that contain hydrophilic amino acid residues. The
minimum protein concentration necessary to form a self-supporting gel network is known as the

39
least gelation concentration (LGC). Below this critical concentration, proteins unfolded by heat
treatment undergo random aggregation which may lead to precipitation. Globular proteins
usually have higher LGC values than fibrous proteins.
2.6 Lipid oxidation in lipid-protein systems
One of the disadvantages of an aqueous extraction process, as mentioned in section 2.3.2, is that
proteins are recovered in a solution containing oil. Oil concentration depends on factors such as
the cell disruption methods used prior extraction, the extraction conditions, the use of enzymes,
and oil and protein contents of the starting material. Proteins form large molecular aggregates
along with remaining oil bodies in the solution (Dendukuri and Diosady 2003) preventing oil
from being permeated during membrane processing, and being unavoidably recovered in the
protein isolates after isoelectric precipitation. As an oil containing ingredient, the isolates are
prone to lipid oxidation and the subsequent interactions between the oxidation products and
proteins.
Lipid oxidation is one of the most important processes for food deterioration as it causes the
development of unpleasant odours, flavours and rancidity in both oils and oil rich foodstuffs.
Lipid oxidation reactions may also decrease the nutritional value of the food (Pokorný,
Kolakowska and Bienkiewicz 2005). Toxic substances can also be generated, which can be
associated with health risks to consumers (Tazi, et al. 2009 and St. Angelo and Ory 1975).
Lipid oxidation in food systems is a complex process, since oxidation products may react with
other components in the food system such as proteins, carbohydrates, water and vitamins. The
result of lipid oxidation under these conditions has different effects in the functional properties,
texture, mouth feel, aroma, nutritional value, colour and safety of food and food ingredients
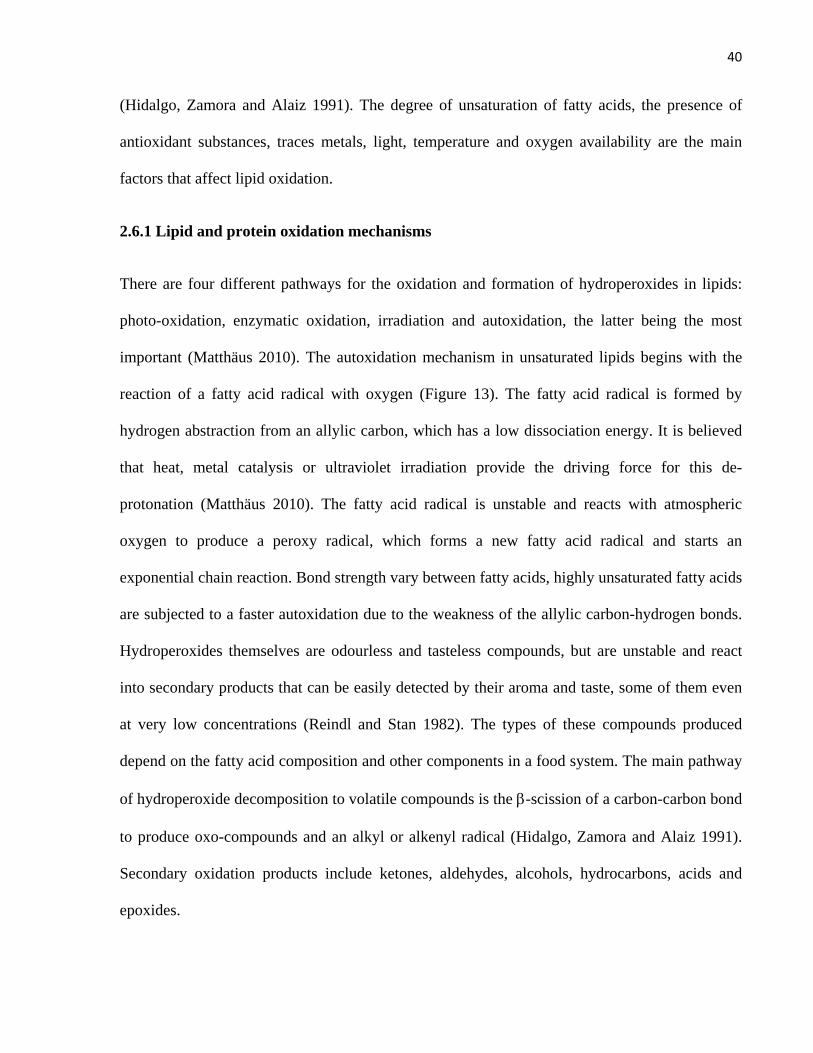
40
(Hidalgo, Zamora and Alaiz 1991). The degree of unsaturation of fatty acids, the presence of
antioxidant substances, traces metals, light, temperature and oxygen availability are the main
factors that affect lipid oxidation.
2.6.1 Lipid and protein oxidation mechanisms
There are four different pathways for the oxidation and formation of hydroperoxides in lipids:
photo-oxidation, enzymatic oxidation, irradiation and autoxidation, the latter being the most
important (Matthäus 2010). The autoxidation mechanism in unsaturated lipids begins with the
reaction of a fatty acid radical with oxygen (Figure 13). The fatty acid radical is formed by
hydrogen abstraction from an allylic carbon, which has a low dissociation energy. It is believed
that heat, metal catalysis or ultraviolet irradiation provide the driving force for this de-
protonation (Matthäus 2010). The fatty acid radical is unstable and reacts with atmospheric
oxygen to produce a peroxy radical, which forms a new fatty acid radical and starts an
exponential chain reaction. Bond strength vary between fatty acids, highly unsaturated fatty acids
are subjected to a faster autoxidation due to the weakness of the allylic carbon-hydrogen bonds.
Hydroperoxides themselves are odourless and tasteless compounds, but are unstable and react
into secondary products that can be easily detected by their aroma and taste, some of them even
at very low concentrations (Reindl and Stan 1982). The types of these compounds produced
depend on the fatty acid composition and other components in a food system. The main pathway
of hydroperoxide decomposition to volatile compounds is the β-scission of a carbon-carbon bond
to produce oxo-compounds and an alkyl or alkenyl radical (Hidalgo, Zamora and Alaiz 1991).
Secondary oxidation products include ketones, aldehydes, alcohols, hydrocarbons, acids and
epoxides.
41
Deterioration of proteins in dry food products is similar to lipid oxidation, and is promoted by
the increase in water activity. Proteins are oxidized by an initial electron abstraction, by the
transfer of a hydrogen atom by plant phenols or by free radical scavenging, trapping radicals by
hydrogen donation during the first steps of lipid oxidation (Elias and Decker 2010) acting as
lipid antioxidants. The de-protonation of the α-carbon in a protein molecule leads to a radical
formation that can combine to form cross-links with other protein molecules or lipid oxidation
products, changing the texture and functional properties of foods. They could also undergo an
oxidation reaction to produce a protein hydroperoxide (Pokorný, Kolakowska and Bienkiewicz
2005).
Reactive functional groups in both proteins and lipid hydroperoxides explain the complexity of
the interaction between them. Reactions between both moieties follow two types of mechanisms
(Hidalgo, Zamora and Alaiz 1991); the first one is the formation of non-covalent complexes with
the hydroperoxides or secondary oxidation products, and takes place through hydrophobic
bonding. The second mechanism is covalent bonding by radical and non-radical reactions
RH
R· + O2
R· + H·
2R·
2RO2
RO2·
RO2· + R· + O2
RO2H + R·
R· + RO2·
RO2·
Initial phase
Propagation
Termination
Stable products
Figure 13: Fatty acid radical chain oxidation mechanism

42
between amino acids and lipid hydroperoxides or secondary oxidation products. Amino groups
from proteins react to produce an imine (Pokorný, Kolakowska and Bienkiewicz 2005), which
increases the hydrophobicity of the protein molecule due to the covalently bound lipid residue.
The solubility of the protein also decreases with these interactions and the resulting insoluble
proteins are cleaved with proteases slowly or incompletely, decreasing their digestibility. Protein
reaction with lipid hydroperoxides decreases their availability during the propagation step of
lipid oxidation, and can be considered as a protein antioxidant mechanism (Elias and Decker
2010).
2.6.2 Accelerated lipid oxidation evaluation
The main reason to assess lipid oxidation in food and food ingredients is to follow the oxidation
state by comparison with an initial sample at different stages after being submitted to oxidation
conditions, until the oxidation products render the food unacceptable or a previously set limit is
reached. Different titrimetric and spectroscopic techniques have been developed for the
determination of hydroperoxides or secondary products of lipid oxidation, while
chromatographic techniques are used when a more detailed description of the reaction products
is needed. Under ideal conditions, a product should be submitted for an oxidation evaluation
under the intended storage conditions, but for products with long shelf life an accelerated
stability test is usually performed, which consists of the oxidation evaluation of a product stored
at higher temperatures than the intended storage temperature. The kinetics of lipid oxidation over
time, as well as for other food quality indexes can be represented by:
−𝑑𝐴𝑑𝑡
= 𝑘𝐴𝑛
Equation 5

43
Where A is the lipid oxidation value, t is the temperature, k is the rate constant and n is the
reaction order. Although most chemical reactions responsible for food deterioration are complex
enough not to follow a zero or first order reaction model, they can be integrated and simplified to
a pseudo-zero (Equation 6) or pseudo-one (Equation 7) order reaction kinetics.
𝐴𝑒 = 𝐴0 − 𝑘𝑡
Equation 6
ln �𝐴𝑒𝐴0� = −𝑘𝑡
Equation 7
Where k is the rate constant, Ae is the final oxidation value or oxidation limit parameter, A0 is the
initial oxidation value and t is the time. On the other hand, the oxidation rate, in the same manner
as other chemical reactions, is temperature dependent and follows the Arrhenius relationship
(Equation 8).
𝑘 = 𝐴𝑒−𝐸𝐴𝑅𝑇
Equation 8
Where k is the rate constant, A is the pre-exponential factor, EA is the activation energy, R is the
universal gas constant ant T the absolute temperature. By measuring the lipid oxidation rate at
different temperatures, the activation energy can be calculated and applied to a shelf life model
which can be used for shelf life estimation at different temperatures.

44
3. PROJECT OBJECTIVES
The main objectives of this project are to characterize the yellow mustard protein isolates
obtained from the aqueous extraction of full fat, de-hulled yellow mustard flour and the
membrane processing of the resulting protein solution, to evaluate their potential applications,
not only in terms of their nutritional benefits already discussed in section 2.2.2, but more
importantly in terms of the functionality they may be able to provide as food ingredients, such as
their solubility, water and oil absorption, and their emulsifying, foaming and gelling properties.
Finally, to evaluate lipid oxidation in the precipitated protein isolate, which contains significant
amounts of oil.
In order to develop an integrated process, the following detailed objectives were pursued:
• Recovery and characterization of a protein solution from mustard flour using an aqueous
process, based on a method previously developed in the food engineering laboratory.
• Recovery of protein isolates by the concentration and isoelectric precipitation of a protein
solution, based on a method previously developed in the food engineering laboratory that
includes the use of an ultrafiltration and diafiltration process with a 5 kDa membrane.
• Characterization of the protein isolates, including their main composition, electrophoretic
properties and functional properties, comparing the obtained values with those reported in
the literature for mustard protein isolates and commercially available soybean protein
isolates.
• Evaluation of the storage temperature effect on lipid oxidation in the oil containing
protein fraction.

45
4. EXPERIMENTAL METHODS
4.1 Starting materials
Pure yellow mustard flour: product code 106, containing traces of volatile oil and with mild
strength, as described by the supplier, was used for all extraction experiments. This material was
provided by G. S. Dunn dry mustard millers, Hamilton Ontario. Product from lot number
1480811 was used.
4.2 Solvents
The main solvent used throughout the experiments was reverse osmosis water, obtained from the
Walberg building facility services, at the University of Toronto.
4.3 Reagents
All reagents used are described in Table 4.
Table 4: Reagents used for experiments
Reagent Grade/Description Supplier
1-butanol Reagent A.C.S. BDH Chemicals, Poole, England
2-thiobarbituric acid Minimum 98% Sigma Aldrich, St. Louis, MO, USA
2-mercaptoethanol Electrophoresis purity Bio-Rad Laboratories, Hercules,
CA, USA
Ammonium hydroxide Reagent 28.0-30.0% EMD, Gibbstown, NJ, USA
Anhydrous ethyl alcohol - Commercial Alcohols, Brampton,
ON, Canada
Ascorbic acid USP Fisher Scientific, Fair Lawn, NJ,
USA
Boric acid Reagent A.C.S. Fisher Scientific, Fair Lawn, NJ, USA

46
Diethyl ether Reagent A.C.S. >99.0% Sigma Aldrich, St. Louis, MO, USA
Glass wool Low in lead BDH Chemicals, Poole, England
Hydrochloric acid Reagent 36.5-38.0% Caledon, Georgetown, ON, Canada
Kjeldahl Tablets 3.5g K2SO4/0.175g HgO Fisher Scientific, Fair Lawn, NJ,
USA
Laemmli sample buffer - Bio-Rad Laboratories, Hercules,
CA, USA
Liquid nitrogen - Linde Canada Limited, Mississauga,
ON, Canada
N-point indicator - EMD, Gibbstown, NJ, USA
Petroleum ether (B.P. 35-
60°C) Reagent A.C.S. BDH Chemicals, Poole, England
Phosphoric acid Reagent >85.0% Caledon, Georgetown, ON, Canada
Sodium chloride Reagent >99.0% Bioshop, Burlington, ON, Canada
Sodium hydroxide (50%
Solution) Analytical
VWR Scientific, West Chester, PA,
USA
Sodium thiosulfate Reagent A.C.S. Fisher Scientific, Fair Lawn, NJ,
USA
Sulfuric acid Reagent, 95-98% Caledon, Georgetown, ON, Canada
Sulfuric acid 0.1000 N Analytical VWR Scientific, West Chester, PA,
USA
Enzymatic detergent Terg-A-Zyme Alconox Inc., New York. U.S.A.

47
4.4 Equipment and materials
The list of equipment and materials used for all experiments is described in Table 5.
Table 5: Equipment and materials used for the experiments
Equipment Model/Part no. Supplier
Analytical balance 2001 MP2 Sartorius, Germany
Analytical balance Mettler AC100 Mettler Toledo, Zurich, Switzerland
Balance Mettler PC 4400 Mettler Toledo, Zurich, Switzerland
Balance Mettler PE 3600 Mettler Toledo, Zurich, Switzerland
Centrifuge J-20 XP Beckman Instruments, Fullerton, CA,
USA
Clinical centrifuge 1968H International Equipment Company,
Boston, MA, USA
Convection oven Blue M-0V-490-A2 Electric Company, Blue Island, IL, USA
Electric 1 HP motor CSM3546-2 Baldor Motors and Drives, Fort Smith,
AR, USA
Electrophoresis station PowerPac HC Bio-Rad Laboratories, Hercules, CA,
USA
Freeze dryer Freezone 12-plus Labconco, Kansas City, MO, USA
Positive displacement
diaphragm pump Hydracell M-03E
Wanner Engineering Inc., Mineapolis,
MN, USA
Kjeldahl digestor 425 Büchi, Switzerland
Kjeldahl distillation unit K-350 Büchi, Switzerland
Laboratory mixer/emulsifier L2R Silverson Machines Ltd., Waterside,
England
Low temperature incubator 307 Fisher Scientific, Fair Lawn, NJ, USA
Low temperature incubator 315 Precision Scientific, Chicago, IL, USA
Mechanical stirrer RZR 50 Caframo, Warton, ON, Canada
Membrane cell system SEPA CF II General Electric Osmonics,
Minnetonka, MN, USA
Pellicon 2 mini P2C0 05V 01 EMD Millipore, Billerica, MA, USA

48
ultrafiltration membrane
Pellicon filter holder XX42 PMI NI EMD Millipore, Billerica, MA, USA
Peristaltic pump 7518-12 Cole-Parmer Instrument Co., Bernon
Hills, IL, USA
pH meter 8000 VWR Scientific, West Chester, PA,
USA
Polyacrylamide gel, 4-20%,
10 well 161-1105
Bio-Rad Laboratories, Hercules, CA,
USA
Prestained protein ladder, 10
to 170 kDa 26616
Thermo Scientific Pierce, Rockford, IL,
USA
Refrigerator/Freezer RB1855SW Samsung, Daehu, South Korea
Rotary evaporator Rotavapor-R Büchi, Switzerland
Ultrafiltration membrane YMPTSP1905 Sterlitech, Kent, WA, USA
Plastic storage bags Ziploc
165 x 149 mm
SC Johnson Canada, Brantford, ON,
Canada
4.5 Experimental Methods
4.5.1 Aqueous extraction process
The aqueous extraction process used for the current study is based on the experimental
procedures followed by Balke (2006) and Ataya (2010). The materials and conditions for this
process were:
• 400 grams of mustard flour
• 3 minutes homogenizing time
• 4:1 water to flour ratio
• 30 minutes extraction time
• Extraction pH of 11.00 ± 0.05
49
• Ambient temperature (~25°C)
• 3 stages
Figure 14 shows the flow diagram for the aqueous extraction. Yellow mustard flour was mixed
with 4 times its weight with water using a spatula in a 2L beaker until a uniform paste was
obtained, free of lumps. The mixture was homogenized for three minutes using a L2R Silverson
mixer at top speed followed by the addition of ascorbic acid (1% w/w) as antioxidant. The native
pH of the mixture was around 4.75 and it was adjusted and maintained at a value of 11.00 ± 0.05
by the addition of sodium hydroxide solution (50% w/w). The extraction was performed for a
period of 30 minutes, after which the mixture was poured evenly into 3 1L bottles and
centrifuged for 20 minutes at ~10500 x g (6500 rpm). Three fractions were separated: a solid
residue at the bottom of the bottle, a liquid protein solution in the middle and an oil rich
emulsion at the top. The emulsion and protein extract were recovered and weighed in separate
containers, while the solid residue was transferred back to the extraction beaker, enough water
was added to reach the weight of the initial mixture, and it was re-homogenized for three minutes
and re-extracted under the same conditions. After centrifugation, the protein solution and
emulsion were recovered and weighed. The solid residue was re-suspended in water up to 4:1
water to solids ratio, homogenized for three minutes and centrifuged again. The final solid
residue was neutralized with 6 M phosphoric acid to a pH value around 7.50. The three protein
solutions were combined.

50
NaOH, 50%
Homogenizer – 3 min.
Mixing at pH 11 for 30 min. Room temp.
Emulsion
Meal Residue
Add water (4:1) Homogenizer – 3 min.
Centrifugation 20 min @ 6500 rpm
25ºC Protein Extract / Emulsion
Water addition (4:1)
Centrifugation 20 min @ 6500 rpm
25ºC
Protein Extract
Mixing at pH 11 for 30 min. Room temp.
Centrifugation 20 min @ 6500 rpm
25ºC
Meal Residue
Add water (4:1) Homogenizer - 3 min.
Centrifugation 20 min @ 6500 rpm
25ºC
Washing
Neutralize meal residue
PO4H3, 6M
Protein Extract / Emulsion
Figure 14: Flow diagram of the aqueous extraction process
Yellow mustard flour
NaOH, 50%

51
4.5.2 Membrane processing of protein solution and isoelectric precipitation
For the purification and isolation of the proteins extracted by the aqueous process, membrane
processing and isoelectric precipitation operations were followed. The protein solution obtained
from the aqueous extraction process was first filtered using Whatman filter paper No. 1. After
filtration, enough reverse osmosis water was added to the solution to obtain a concentration
factor between 5.5 and 6.0 during the ultrafiltration process. Water addition was necessary in
order to obtain a concentrated protein solution with a final concentration below 10%, which is
near the solubility limit of mustard proteins. The water quantity was calculated by multiplying
the protein solution quantity after filtration by a factor of 0.5672. An additional 2.92 g/L,
considering the overall quantity of water and protein solution, of sodium chloride was added and
dissolved to obtain a 0.05 M sodium chloride concentration. The solution was heated and
maintained between 55 and 60ºC for a 30 minute period, treatment that could break the phenolic-
protein complexes bonded ionically (Diosady, Xu and Chen 2005) and later be removed during
membrane processing.
PI
Feed
Permeate Concentrate
Membrane Buffer solution Diafiltration
Figure 15: Ultrafiltration/Diafiltration process schematics

52
After the heating treatment the solution was cooled down to 40ºC, a sample was taken for protein
determination, and the rest was submitted to ultrafiltration and diafiltration. Two different
equipments were used; the first was a Pellicon filtration system consisting of a Cole-Parmer
peristaltic pump, a filter holder and a regenerated celulose acetate membrane with a MWCO of 5
kDa and a membrane area of 0.1 m2. The second equipment consisted in a SEPA CF II filtration
system equiped with a Hydracell diaphragm pump, a Baldor electric motor with a frequency
variator capable of achieving different motor speeds and pump flows, and a 5 kDa MWCO
polyethersulfone membrane with an effective area of 0.015 m2. This equipment had been used in
our food laboratory for high pressure membrane processing, such as reverse osmosis and
nanofiltration applications, and needed to be addapted for ultrafiltration operations. The
adaptation consisted in the replacement of the pressure gauge for one with a lower range capable
of measuring pressures between 0 and 100 psi with more accuracy, and the addition of a pressure
dampener for the gauge, in order to decrease the pointer pulsation and be able to obtain reliable
measurements. Unfortunately, due to the high volumes used during the experiments, the use of
this equipment became unpractical because of its design, which offers a smaller effective
membrane area and does not allow filter stacking in the membrane cell system.
Molecular weight profiles of alkaline mustard extracts show that most of the mustard proteins
have a molecular weight above 5 kDa (Dendukuri and Diosady 2003, Ranjana, Bhattacherjee and
Ghosh 2009), hence a membrane with a MWCO of 5 kDa was selected for the ultrafiltration and
diafiltration processes in order to obtain maximum protein recovery. During the operation of
both systems in ultrafiltration mode, solvent and low molecular weight components that were
able to pass through the membrane were collected as permeate. The concentrated solution was
recycled to the feed container and recovered as the retentate (Figure 15). After ultrafiltration, the
53
retentate was submitted to a continuous diafiltration step by the addition of enough 0.05 M
sodium chloride solution at pH 11.0 to obtain a diafiltration volume of 5.5, at the end of which a
sample was withdrawn for protein determination. The ultrafiltration and diafiltration permeate
fractions were mixed, a sample was taken for protein determination and the rest was discarded.
Upon completion of each experiment, the unit was immediately drained and flushed with
distilled water. A 7.5 g/L enzymatic detergent solution was then recycled through the unit for
about one hour. After draining, the unit was again flushed with distilled water until the initial
water flux was restored. A volume of 15-20 liters of distilled water was usually used. The
cleaned membrane cartridge was stored in a 0.5% (w/v) formaldehyde solution. One day prior to
use, the cartridge was rinsed and soaked in distilled water.
For the isoelectric precipitation of the concentrated protein extract, 6 M phosphoric acid was
added in a drop-wise manner under continuous agitation in order to decrease the pH to a value of
around 5.50. Moderate agitation was maintained for an additional 20 minutes.
The Pellicon system was used under the following operating conditions:
• Peristaltic pump speed setting of 300 rpm
• Typical flow rate of 0.5 L/min
• Backpressure of 30 psi (~200 kPa)
• System temperature of 40ºC
On the other hand, the operating conditions for the SEPA CF II filtration system were the
following:
• 20 Hz motor frequency
• Typical flow rate of 2.22 L/min
• Backpressure of 50 psi (~350 kPa)

54
• System temperature of 40ºC
In this work, it was assumed that any problems with phytate, glucosinolate and phenolics content
could be resolved by application of membrane technology already developed for use with
extracts from defatted flour (Luo 1998, Lui 1998, Xu 1998, Xu et al. 2003).
4.5.3 Protein isolates recovery
After 20 minutes of mixing at a pH around 5.50, the suspended solids dispersion was centrifuged
at ~10500 x g (6500 rpm) for 20 minutes. The supernatant consisting of protein solution A was
separated, while the solid fraction was re-suspended and washed with 5 times its weight of
reverse osmosis water and was likewise centrifuged. The supernatant consisting of protein
solution B was again separated and the solid fraction, consisting of precipitated protein isolate,
was frozen with liquid nitrogen and freeze-dried. Both protein solution fractions were then
submitted separately to an ultrafiltration and diafiltration process using the Pellicon system. For
both of the protein solutions A and B, the operating conditions during membrane processing
were:
• Peristaltic pump speed setting of 300 rpm
• Typical flow rate of 0.5 L/min
• Backpressure of 30 psi (~200 kPa)
• System temperature of 40ºC
After ultrafiltration and diafiltration, both fractions were mixed, shell-frozen with liquid nitrogen
and freeze-dried. Figure 16 shows a complete flow diagram for the protein recovery process.

55
Figure 16: Protein extract membrane processing
Ultrafiltration 40°C, CF >= 5.0
Diafiltration, pH=11, 0.05 M NaCl. DV >= 5.5
Isoelectric Precipitation. Mixing 20 min.
Filtration. Whitman Filter paper #1
Protein Solution Heat treatment 55°C 30 min.
Centrifugation 20 min @ 6500 rpm
25C
Ultrafiltration. 40°C, CF = 2.30
Diafiltration. DV >= 5.50 PPI washing
(water 5:1)
Protein solution A
Centrifugation 20 min @ 6500 rpm
25C
Ultrafiltration. 40°C, CF = 7.70
Diafiltration. DV >= 5.50
Protein solution B
PIAB Freeze drying
PPI Freeze drying
NaCl 0.05M
PO4H3 6M

56
4.5.4 Temperature effect on lipid oxidation in the precipitated protein isolate
To determine the storage temperature effect on the oxidation of the oil contained in the
precipitated protein isolate, 3 sets of 7 ten-gram samples of the powder were stored in plastic
storage bags and stored at 25ºC, 35ºC and 45ºC. Thiobarbituric acid reactive substances
(TBARS) associated with the isolate oil were monitored at 1 week intervals.
TBARS of the extracted oil were measured using AOCS method Cd 19-90 (Appendix A10). For
the oil extraction, a 10-gram sample was mixed with 100 mL of a mixture of petroleum ether and
diethyl ether (50:50 v/v) and stirred for a 5 hour period at room temperature. The mixture was
then centrifuged at 2000 rpm for ten minutes and the supernatant was recovered in a round
bottom flask. The solvent was evaporated using a rotary evaporator system at 30ºC. The oil
recovered was frozen at -20ºC until analyzed.
4.5.5 Functional properties
4.5.5.1 Nitrogen solubility index (NSI)
The NSI was determined by AOCS method Ba 11-65. A 2.5% dispersion in reverse osmosis
water was stirred at 30ºC in a water bath. After centrifugation the supernatant was filtered
through a glass fiber plug and protein content was determined by AOCS method Ba 4d-90. A
detailed description of the procedure can be consulted in Appendix A4.
4.5.5.2 Water absorption capacity (WAC)
Water absorption for the protein isolates was determined by the method developed by Naczk et
al. (1985). A two-gram sample was dispersed in 16 ml of reverse osmosis water in a 50 mL
centrifugation tube and mixed 30 seconds every 10 minutes 7 times. The mixture was then
57
centrifuged at 2000 x g. The supernatant was carefully decanted and the tube was tilted and
drained at an angle between 15º and 20 º mouth down for 15 minutes and weighed inmediatly. In
the case of soluble protein isolates, the product remaining in the tube was determined by
completely washing the contents into a 50 mL beaker and drying the wet sample in an oven at
105 ºC for 24 hours. The WAC was reported as the percentage increase of sample weight. A
detailed description of the procedure can be consulted in Appendix A6.
4.5.5.3 Oil absorption capacity (OAC)
Oil absorption was measured using the method developed by Sosulski et al. (1976) by dispersing
a two-gram sample in 12 mL of canola oil in a 50 mL centrifuge tube. The contents were stirred
for 30 seconds every 5 minutes, and after 30 minutes the tubes were centrifuged at 1600 x g for
25 minutes and the supernantant was carefuly decanted. Oil absorbed by the sample was
measured as weight gain. A detailed description of the procedure can be consulted in Appendix
A5.
4.5.5.4 Emulsifying activity and emulsifying stability
Emulsifying activity was measured using the method developed by Yasumatsu et al. (1972),
while emulsion stability was assayed by the method used by Naczk et al. (1985). A 3.5 g sample
was dispersed in 50 mL of reverse osmosis water. 25 mL of canola oil were added and the
mixture was emulsified for 30 seconds. A further 25 mL of canola oil were added and the
mixture was again emulsified for 90 seconds. The emulsion was divided evenly in 50 mL
centrifugation tubes and centrifuged at 2000 rpm. The emulsifying activity was then calculated
as the relationship between the emulsifyied layer in the tube and the tube total contents. For the
emulsion stability, emulsions prepared as described were heated to 85ºC for 15 minutes prior

58
centrifugation, and the emulsion stability was expressed as a percentage of the emulsifying
activity remaining after heating. A detailed description of the procedures can be consulted in
Appendices A7 and A8.
4.5.5.5 Foam expansion and foam volume stability
The foam expansion value was determined by the method used by Naczk et al. (1985). 3%
dispersions were homogenized for 6 minutes. The resulting mixture was transferred to a
graduated cylinder and the foam volume noted. The foam stability after 20, 40, 60 and 120
minutes was reported as the foam volume stability (FVS) calculated according to the method of
Patel et al. (1988). A detailed description of the procedure can be consulted in Appendix A9.
4.5.5.6 Least gelation concentration
Least gelation concentration (LGC) was assayed by the method of Moure, et al. (2002). 2, 4, 6, 8,
10, 12 and 14% dispersions (w/v) were prepared using reverse osmosis water. The dispersions
were adjusted to pH 7.0 by the addition of 1 N NaOH and mixed. 5 mL of each dispersion were
added to a test tube and heated in boiling water for 1 hour, followed by rapid cooling under cold
tap water and additional cooling at 4ºC for 2 hours. The LGC was calculated as the concentration
above which the sample remained in the bottom of the inverted tube. A detailed description of
the procedure can be consulted in Appendix A11.
4.5.6 Other analytical methods
• Oil content was determined by the Mojonnier method. AOAC Method 922.06 was used
for lipids in flour or solid samples and AOAC Method 995.19 was used for lipids in
emulsions. Results were reported as oil percentage by acid hydrolysis.

59
• Protein content was determined by Kjeldahl method AOCS Ba4d-90 and reported as
Nx6.25%.
• Moisture content was measured using AACC method 44-155A.
• SDS-PAGE analyses for reduced and non-reduced conditions were run on 4-20%
gradient gels according to the manufacturer’s instructions (Bio-Rad Laboratories).
Samples were mixed with sample buffer and heated to 95ºC for ten minutes, cooled to
room temperature and centrifuged at 16000 x g for 10 seconds. A 14 µl aliquot was
loaded onto the gel. Reduced samples were prepared by adding 5% 2-mercaptoethanol to
the sample buffer prior heat treatment.
For details, refer to Appendices A1, A3, A2 and A12 respectively.

60
5. RESULTS AND DISCUSSION
5.1 Starting material analysis
The same batch of de-hulled yellow mustard flour was used for all the experiments presented in
the following sections. Protein, moisture and oil determination were performed and the TBA
value of an oil sample extracted from the flour was also determined. The characterization of the
yellow mustard flour is presented in Table 6.
Table 6: Yellow mustard flour characterization
Content
(wt %, as is) Crude proteina 31.24 ± 0.14 Oila 36.78 ± 0.11 Moisturea 5.01 ± 0.29 TBA Value* 0.1037 ± 0.0021
*TBA value reported as mg of malondialdehyde per kilogram of sample (Mean value ± standard deviation) aData reported as mean values ± standard deviation
The oil and protein values are consistent with protein and oil contents for yellow mustard seeds
harvested in 2011. The measured TBA value was similar to the value of 0.99 reported in AOCS
method Cd 19-90 for rapeseed oil.
5.2 Aqueous extraction process
Aqueous extraction of yellow mustard flour was performed following the procedure described in
Section 4.5.1. In a previous project carried out in our food engineering group many variables
where considered to have an influence in the aqueous extraction of yellow mustard seeds. It was
concluded that pH had a very significant effect. Maximum oil and protein extraction was
observed at high pH values. Water to flour ratio, extraction time, temperature and

61
blending time were also studied and it was concluded that pH 11, 4:1 water to flour ratio, 3 min
blending time, room temperature and 30 min of extraction, with two extraction and one washing
stages of the solid residue under the same conditions, represented the best set of parameters for
oil and protein recovery (Balke, 2006).
For all extractions, approximately 400 g of yellow mustard flour were mixed with 4500 g of
water, 4 grams of ascorbic acid, and around 35 g of 50% NaOH solution in order to maintain the
pH at 11.0 ± 0.5. After centrifugation, a solid residue phase, a liquid protein solution and an
emulsion phase were separated in each stage. Every batch produced around 180 g of emulsion,
4000 g of protein solution and 580 g of meal residue. The protein solution represented 84% of
the total weight of the three phases, the solid residue 12% and the emulsion phase 4%.
The composition of each of the fractions resulting from the aqueous extraction is presented in
Table 7, and the key component balance is presented in Figure 17 and further expanded in
Appendix B2. The protein solution is rich in protein, with 81.5% of the total crude protein
present in the original flour, while the emulsion and residue contain 4.9% and 7.8% of the
original crude protein respectively, giving a crude protein extraction yield of at least 86.3%.
Mustard protein is highly soluble at high pH and protein extraction yields of over 90% have been
previously reported (Balke 2006) when extracted at a pH value of 12. Part of the protein present
in the emulsion phase is likely to be oleosin, which is not soluble at alkaline pH, while most of
the non-oleosin protein is dissolved in the protein solution.
The crude protein concentration in the protein solution was low, around 2.6%. Further processing
was necessary to recover protein isolates with high purity. A process involving ultrafiltration and
diafiltration followed by isoelectric precipitation before drying of the final products was used to
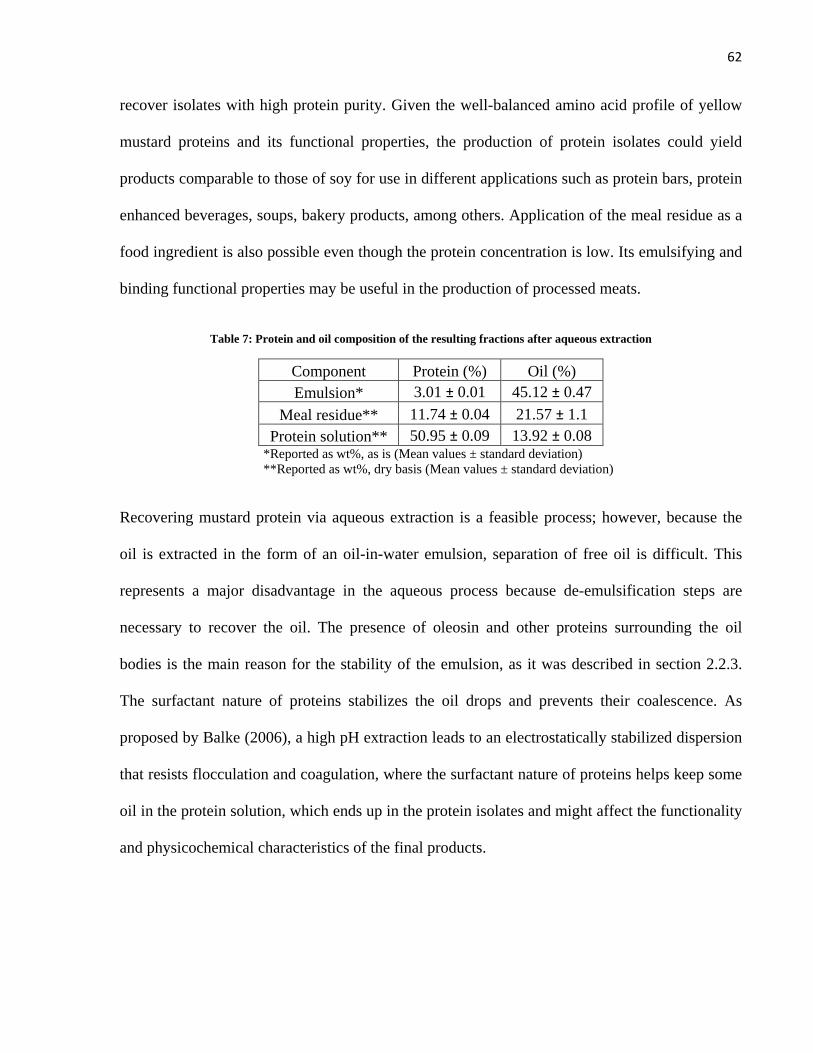
62
recover isolates with high protein purity. Given the well-balanced amino acid profile of yellow
mustard proteins and its functional properties, the production of protein isolates could yield
products comparable to those of soy for use in different applications such as protein bars, protein
enhanced beverages, soups, bakery products, among others. Application of the meal residue as a
food ingredient is also possible even though the protein concentration is low. Its emulsifying and
binding functional properties may be useful in the production of processed meats.
Table 7: Protein and oil composition of the resulting fractions after aqueous extraction
Component Protein (%) Oil (%) Emulsion* 3.01 ± 0.01 45.12 ± 0.47
Meal residue** 11.74 ± 0.04 21.57 ± 1.1 Protein solution** 50.95 ± 0.09 13.92 ± 0.08
*Reported as wt%, as is (Mean values ± standard deviation) **Reported as wt%, dry basis (Mean values ± standard deviation)
Recovering mustard protein via aqueous extraction is a feasible process; however, because the
oil is extracted in the form of an oil-in-water emulsion, separation of free oil is difficult. This
represents a major disadvantage in the aqueous process because de-emulsification steps are
necessary to recover the oil. The presence of oleosin and other proteins surrounding the oil
bodies is the main reason for the stability of the emulsion, as it was described in section 2.2.3.
The surfactant nature of proteins stabilizes the oil drops and prevents their coalescence. As
proposed by Balke (2006), a high pH extraction leads to an electrostatically stabilized dispersion
that resists flocculation and coagulation, where the surfactant nature of proteins helps keep some
oil in the protein solution, which ends up in the protein isolates and might affect the functionality
and physicochemical characteristics of the final products.
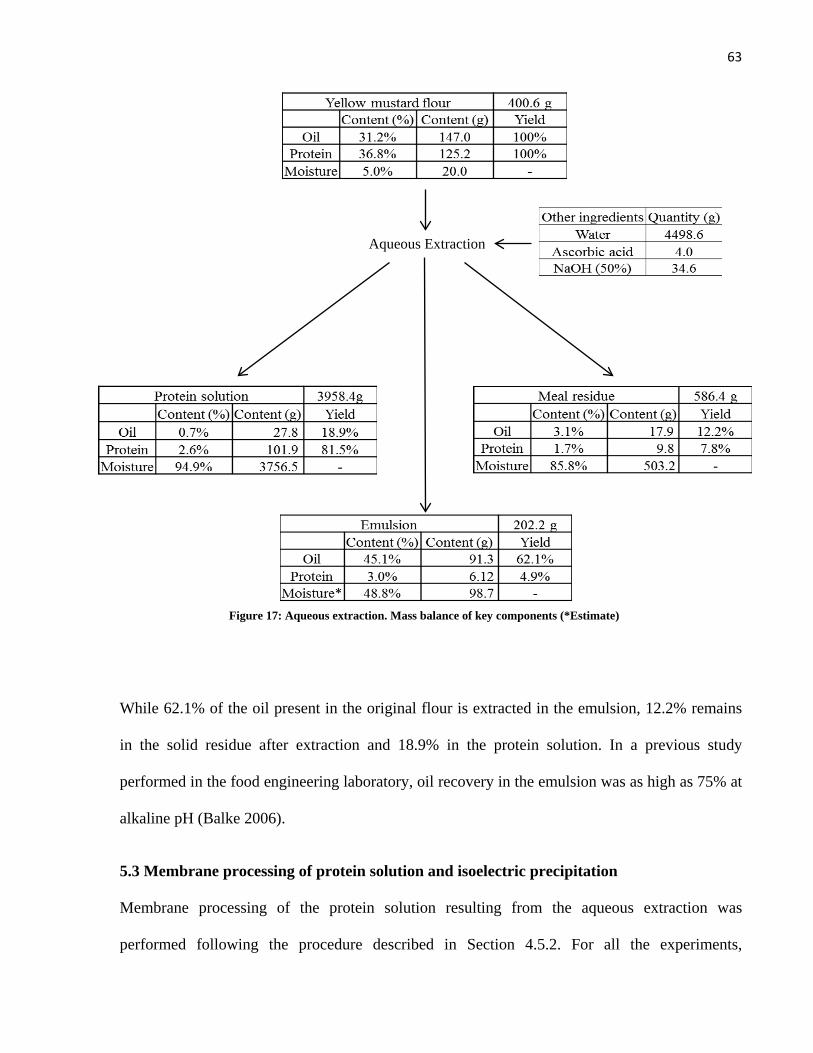
63
While 62.1% of the oil present in the original flour is extracted in the emulsion, 12.2% remains
in the solid residue after extraction and 18.9% in the protein solution. In a previous study
performed in the food engineering laboratory, oil recovery in the emulsion was as high as 75% at
alkaline pH (Balke 2006).
5.3 Membrane processing of protein solution and isoelectric precipitation
Membrane processing of the protein solution resulting from the aqueous extraction was
performed following the procedure described in Section 4.5.2. For all the experiments,
Figure 17: Aqueous extraction. Mass balance of key components (*Estimate)
Aqueous Extraction

64
approximately 4000 g of protein solution resulting from the aqueous extraction process were
filtered using a Whatman No. 1 filter paper. After filtration, around 2330 g of reverse osmosis
water were added to the filtrate in order to obtain a concentration factor between 5.0 and 6.0 in
the following ultrafiltration operation. Subsequently, sodium chloride was added to the diluted
protein solution prior to the heat treatment, after which the solution was submitted to
ultrafiltration with an average concentration factor of 5.5. The average flux for this operation was
17.2 liters per square meter of membrane per hour (Lmh) when using the Pellicon equipment,
and around 25.0 Lmh when using the SEPA CF II system. In every batch an average of 5441.1 g
of permeate and 957.2 g of retentate were produced. After ultrafiltration, the retentate was
diafiltered in a continuous manner by the addition of approximately 5330 g of 0.05 M sodium
chloride solution at pH 11.0 in order to get a diafiltration volume of 5.5. The average flux for the
diafiltration process was 13.6 Lmh when using the Pellicon equipment, and around 20.0 Lmh
when using the SEPA CF II equipment. The diafiltration permeate accounted for the 5330 g of
brine continuously added during the process. The differences in the ultrafiltration and
diafiltration flux for the two systems can be attributed to the different pressures and recirculation
flows used. Additionally, the polyethersulfone membrane used in the SEPA CF II equipment was
brand new, while the regenerated cellulose membrane used in the Pellicon equipment had been
used for several years and although it was meticulously washed after each use, its use resulted in
irreversible fouling and a lower flux. After the membrane process, the concentrated protein
solution, which had a dark brown colour and high viscosity, was acidified by the addition of
approximately 14.5 g of 6 M phosphoric acid, and was treated as described in section 4.5.2. After
isoelectric precipitation, the colour of the protein suspension changed to a lighter brown and
changes in viscosity were also noted, increasing with acid addition to a maximum near pH 7.0,

65
and decreasing again at pH 5.5. Similarly to other brassica oilseeds like canola or rapeseed,
mustard has a wide variety of proteins and a broad spectrum of isoelectric points. There is not a
clear maxima for protein precipitation along pH range from 3.0 to 9.0 (Balke 2006), however a
pH value around 5.5 is considered to be in the region of highest protein precipitation.
5.4 Protein isolates recovery
Following the procedure described in section 4.5.3, after centrifugation of the 957.2 g of
acidified protein suspension, the supernatant, consisting of approximately 632 g of protein
solution A was kept aside while the precipitate was washed with around 2217 g of reverse
osmosis water and centrifuged again. The second supernatant, consisting of 2185.1 g of protein
solution B on average, was poured in a separate bottle and the 318.8 grams of precipitate
obtained on average were freeze-dried. Protein solutions A and B were not mixed prior to
membrane processing. The mixture of both protein solutions resulted in protein precipitation,
which can be explained by a “micellization” effect similar to the reported by Murray et al.
(1979), where the dilution of the protein solution A, with a higher ionic strength and
concentration, with protein solution B induced a “salting out” effect. Altough this method could
be applied for the recovery of some of the protein, after centrifugation and freeze-drying of the
precipitate, the resulting product had a salty flavour and a protein concentration of 81.96% on a
moisture free basis, and it was concluded that a diafiltration step was still necessary to improve
its quality. Since the precipitate resulting from the mixture of both protein solutions would likely
decrease the flux during membrane processing, it was decided to treat them separetly.
The 632 g of protein solution A obtained from each batch were submitted to ultrafiltration using
the Pellicon system with a concentration factor of 2.33, after which around 360 g of permeate
were obtained and discarded, and the remaining retentate was diafiltered up to a diafiltration

66
volume of 5.5 using reverse osmosis water. For the protein solution B, the 2185.1 g obtained for
each batch were submitted to ultrafiltration with a concentration factor of 7.7, and the resulting
retentate to a continuous diafiltration process with a diafiltration volume of 5.5 using reverse
osmosis water. The average ultrafiltration flux measured after the treatment of both protein
solutions was 18.0 Lmh, while the average diafiltration flux was lower at 5.6 Lmh mainly due to
the high amount of protein precipitation during this step. Both retentate fractions were mixed
after membrane processing shell-frozen using liquid nitrogen and freeze-dried. As shown in
Figure 18, the concentrated protein suspension had a milky appearance.
Figure 18: Protein fractions A and B after membrane processing
The composition of each of the fractions is presented in Table 8, while the distribution and yields
of oil and protein for the membrane processing and the recovery of protein isolates are presented
in Figure 19 and further expanded in Appendix B3. After ultrafiltration of the initial protein
solution, the retentate contained approximately 66.2% of the original crude protein present in the
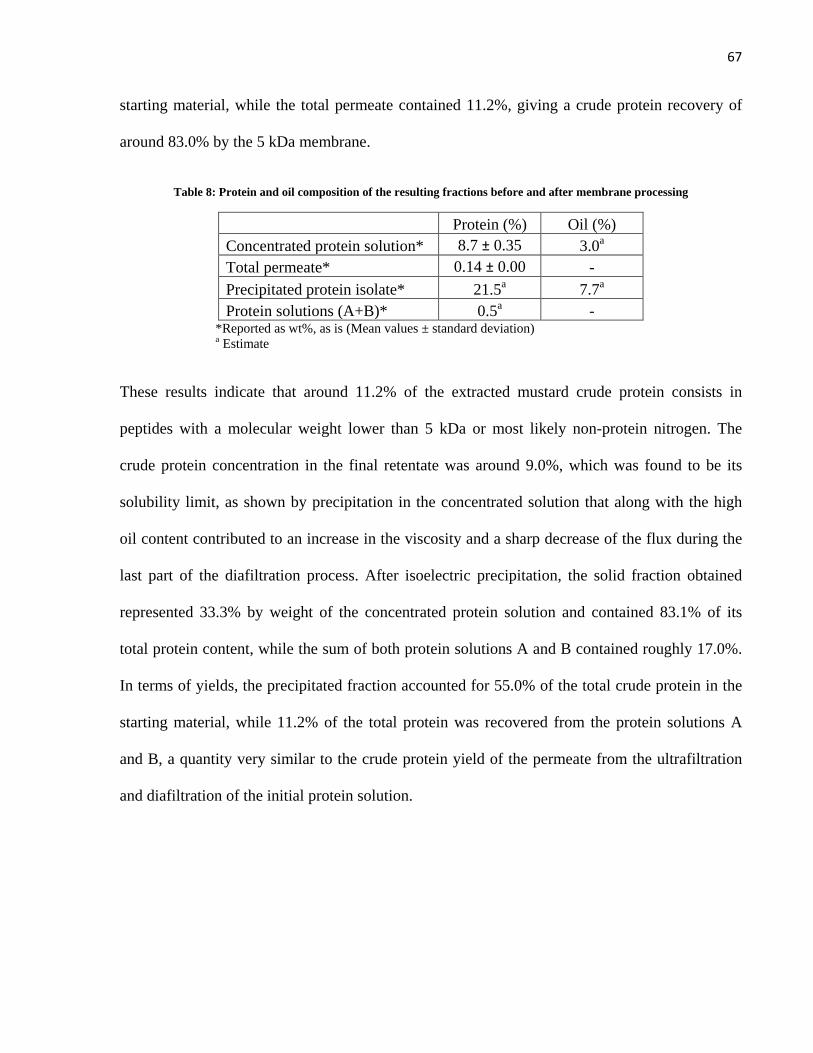
67
starting material, while the total permeate contained 11.2%, giving a crude protein recovery of
around 83.0% by the 5 kDa membrane.
Table 8: Protein and oil composition of the resulting fractions before and after membrane processing
Protein (%) Oil (%)
Concentrated protein solution* 8.7 ± 0.35 3.0a Total permeate* 0.14 ± 0.00 - Precipitated protein isolate* 21.5a 7.7a Protein solutions (A+B)* 0.5a -
*Reported as wt%, as is (Mean values ± standard deviation) a Estimate
These results indicate that around 11.2% of the extracted mustard crude protein consists in
peptides with a molecular weight lower than 5 kDa or most likely non-protein nitrogen. The
crude protein concentration in the final retentate was around 9.0%, which was found to be its
solubility limit, as shown by precipitation in the concentrated solution that along with the high
oil content contributed to an increase in the viscosity and a sharp decrease of the flux during the
last part of the diafiltration process. After isoelectric precipitation, the solid fraction obtained
represented 33.3% by weight of the concentrated protein solution and contained 83.1% of its
total protein content, while the sum of both protein solutions A and B contained roughly 17.0%.
In terms of yields, the precipitated fraction accounted for 55.0% of the total crude protein in the
starting material, while 11.2% of the total protein was recovered from the protein solutions A
and B, a quantity very similar to the crude protein yield of the permeate from the ultrafiltration
and diafiltration of the initial protein solution.

68
While 18.9% of the oil present in the original flour is extracted into the protein solution, only
16.8% could be accounted for in the protein isolates. Around 2% of the oil was lost during
membrane processing and in the permeates. During the oil analysis of the protein, difficulties
were encountered in closing the oil mass balance. Similar difficulties have been reported by
Balke (2006) in the analysis of precipitated protein isolates from alkaline full fat yellow mustard
flour aqueous extraction. Balke proposed that a material either proteinaceous or a saccharide
extracted at alkaline pH associated with the oil bodies and was responsible for hexane extraction
resistance. Flash freezing using liquid nitrogen prior freeze-drying improved the effectiveness of
Filtration Heat treatment Ultrafiltration Diafiltration
Isoel. Precipitation Washing
Centrifugation
Figure 19: Yields for the membrane process and isoelectric precipitation of the protein solution

69
hexane for defatting, probably because the smaller particle size obtained by this technique as
opposed to a tougher glassy structure obtained by slow freezing, but the improvement was not
enough to give good closure to the mass balance. Lipids remaining in the protein solution after
alkaline extraction are likely bound to proteins or polysaccharides by hydrophobic or hydrogen
bonding. Non-polar solvents like hexane are typically able to extract hydrophobically bound
lipids, although in some cases hydrophobic regions may be surrounded by polar regions,
preventing extraction. In such cases, proteins may be able to provide an ionic barrier to non-polar
solvents, or water molecules strongly hydrogen-bonded to protein and polar lipids may form
stabilized aqueous regions so that the non-polar lipids are not exposed to the extracting solvent
(Nelson 1975). To overcome this problem, the method of lipid extraction by acid hydrolysis was
used as described in section 4.5.6 throughout the experiments.
After freeze-drying an average of 97.46 grams of precipitated protein isolate, and 17.08 grams of
protein isolate from solutions A and B (called acid soluble protein isolate hereafter) were
recovered per batch, these quantities represented 28.6% of the initial mass of yellow mustard
flour and around 66.2% of its initial crude protein content. As mentioned before, 4.9% of the
initial protein was recovered in the emulsion fraction, 7.8% remained in the meal residue, 11.2%
was recovered in the permeate fractions and around 10.0% was lost during the different steps of
the process. On the other hand, 62.1% of the oil was recovered in the emulsion, 12.2% remained
un-extracted in the meal residue, 9.0% was lost in the process, and 16.7% ended up in the protein
isolates. The quality of the protein products obtained is described in Table 9. It is interesting to
note the hydrophobic nature of both protein isolates, hence the low moisture content, which was
enhanced by the high oil concentration in the case of the precipitated protein isolate.

70
While the protein concentration of the precipitated protein isolate was only 70.43% in “as is”
basis, it had a purity of 96.0% on a moisture and oil free basis. For the acid soluble protein
isolate, on the other hand, a purity of 83.5% was reached on a moisture and oil free basis. Oil
determination shows that more than 98% of the oil recovered in the isolates was precipitated
along with the proteins during the pH adjustment, and less than 2% remained bound with the
proteins in solutions A and B; the precipitated protein isolate had 0.35 grams of oil per gram of
protein while the acid soluble protein isolate had 0.06 grams of oil per gram of protein.
Table 9: Final product characterization
Precipitated protein isolate Acid soluble protein isolate Protein* (%) 70.43 ± 0.97 81.88 ± 0.79 Oil* (%) 25.11 ± 0.36 0.48 ± 0.03 Moisture* (%) 1.56 ± 0.01 1.47 ± 0.20 Others* (%) 2.90a 16.17a Mass yield (%) 24.30b 4.26b TBA value** 0.1165 ± 0.0036 N.D.
*Reported as wt%, as is (Mean values ± standard deviation) a Estimate b Reported as wt% of the initial mustard flour quantity **Reported as mg of malondialdehyde per kg of sample (Mean values ± standard deviation)
The comparison between the TBA value of the initial mustard flour and that of the precipitated
protein isolate indicates there is some lipid oxidation during the process, which was expected due
to the frequent transferring, mixing and heating to which the product was submitted. The TBA
value for the acid soluble protein isolate was not determined due to its low oil content. The high
oil amount and the different protein concentration for both isolates were expected to have an
impact in their functional properties, especially for the precipitated protein isolate. These factors
were studied and the results presented in the following sections.

71
5.5 Functional properties
5.5.1 Colour and Flavour
The precipitated protein isolate obtained during the experiments had a slightly darker colour than
the acid soluble protein isolate. Both products were compared to soybean protein isolate Supro
500E (Figure 20) which is a standard commercial isolate. While the soybean protein isolate was
slightly yellow, the precipitated protein isolate was light tan in colour and the acid soluble
protein isolate was off-white, lighter than the soybean product. All three products had a similar
consistency, mostly composed of fine particles. The precipitated protein isolate had a very bland
flavour, not salty and with a slightly bitter aftertaste, conversely the soybean protein isolate had a
more creamy mouth feel, a characteristic soybean flavour and was a little bit salty, while the acid
soluble protein isolate had an astringent taste, a slightly bitter aftertaste and was slightly salty.
5.5.2 Gel electrophoresis
The molecular weight distribution of polypeptides in the protein isolates can provide important
information about their functionality in food systems. Differences between the polypeptide
compositions may relate to differences in some of the functional properties observed in this
Precipitated protein isolate
Acid soluble protein isolate
Soybean protein isolate (Supro 500 E)
Figure 20: Protein isolates comparison

72
study. Figures 21 and 22 show the molecular weight profiles of both products, obtained by gel
electrophoresis for non-reducing and reducing conditions, respectively.
In Figure 21, two of the mustard characteristic storage proteins can be identified in both isolates;
the 14 kDa band shows the presence of the 1.7s storage protein, which has an estimated
molecular weight of 15 kDa, and the 25 kDa band, also present in both products, belongs to the
2S storage protein of mustard seeds (Aluko and McIntosh 2004). The Figure also shows that
there is a marked difference in the 55 and 50 kDa bands between the products. For the acid
soluble protein isolate, both bands have a higher intensity, which indicates that the isolate is
more abundant in polypeptides with such molecular weights and that these are more resistant to
acid precipitation.
a b c d
~130
~120
~50
~14
~55
~25
e
Figure 21: Non-reducing conditions SDS-PAGE patterns of the precipitated protein isolate (lanes a and b), acid soluble protein isolate (lanes c and d) and protein
standards (lane e)

73
Also, the precipitated protein isolate gel pattern shows intense bands around 36, 25 and 20 kDa,
which are missing or are less intense in the acid soluble protein isolate, suggesting that
polypeptides of those molecular weights form proteins susceptible to acid precipitation. These
proteins might have a higher concentration of hydrophobic groups at their surface which favor
lipid-protein and protein-protein interactions. Acid soluble protein isolate presents high intensity
bands in the 26 to 35 kDa range, which are less intense or missing in the precipitated protein
isolate.
Figure 22 shows the gel patterns for both isolates under reducing conditions. The addition of 2-
mercaptoethanol as a reducing agent during the SDS-PAGE procedure helped identify the
presence of disulfide bonds in the polypeptides. In both cases, bands at 130, 120, 55, 50, 25 and
14 kDa that can be identified in Figure 21, disappeared almost completely in Figure 22,
indicating that each of these proteins contain polypeptides held together by disulfide bonds,
a b c d
~70
~12 ~8
~35 ~30
e
Figure 22: Reducing conditions SDS-PAGE patterns of the precipitated protein isolate (lanes a and b), acid soluble protein isolate (lanes c and d) and protein
standards (lane e)

74
while bands at 70, 30, 35, 12 and 8 kDa appeared in both cases. The presence of disulfide bonds
in proteins is usually related to limited levels of molecular flexibility, unfolding and
reorientation, all fundamental aspects for protein adsorption at the interface during the formation
of foams and emulsions. On the other hand, it has been proposed that in globular proteins
disulfide bonds may increase the average molecular weight or increase the polymer chain length
during gelation (Damodaran 1996).
5.5.3 Nitrogen Solubility Index (NSI)
As shown in Table 10, there was a large difference between the NSI values of the precipitated
protein isolate and the acid soluble protein isolate. The first was as low as 1.36% and the second
reached 39.53%, which is comparable to the value obtained by Lin (2007) for soybean protein
isolate Supro 500E (44.5%). It is also close to the solubility value of 35.0% reported by
Pedroche, et al. (2004) for abyssinian mustard precipitated protein isolate and the value of 39.8%
reported by Liadakis et al. (1998) for soybean protein isolate Supro 670, but it is low compared
to the NSI values of defatted whole ground yellow mustard soluble protein isolate, double-zero
oriental mustard soluble protein isolate and the value reported for rapeseed soluble protein
isolate (Yumiko et al. 2008).
The precipitated protein isolate, on the other hand, exhibited lower solubility than the reported
for defatted whole ground yellow mustard precipitated protein isolate (2.64%), the reported value
of 2.8% for Chinese rapeseed precipitated protein isolate (Xu et al. 1994), and the values of
12.1% and 26.4% for double-zero oriental mustard precipitated protein isolate (Lin 2007) and
rapeseed precipitated protein isolate (Yumiko et al. 2008), respectively. Since the most important
factor that affects the solubility of a protein is the balance of hydrophobic and hydrophilic
residues on its surface, these results suggest that the protein isolates obtained in this study have a

75
structure or conformation where hydrophilic groups are most likely blocked, and their interaction
with the aqueous environment is hindered.
Table 10: Nitrogen solubility index value of different protein isolates
*DWGYM = Defatted whole ground yellow mustard PPI = precipitated protein isolate. SPI = soluble protein isolate
a Mean values ± standard deviation
In the precipitated protein isolate this effect might be amplified by its high oil content. In
addition, the pH used for the test was very near to their isoelectric points.
5.5.4 Water absorption capacity (WAC) and oil absorption capacity (OAC)
The water absorption capacity (WAC) can be used as an index of the water-binding properties of
a protein product and suggests the degree of protein interaction with water. In this study it was
found that the WAC value for the precipitated protein isolate was low (Table 11), which could be
explained by the presence of oil, since water binding by proteins is influenced by their physical-
chemical environment, and it might also suggest low availability of polar amino acids, which are
the primary sites for water interaction of proteins (Sathe et al. 1982). This value is comparable to
those reported by Lin (2007) for the precipitated protein isolate produced from double-zero
Product NSI (%) Reference DWGYM* SPI 95.71 Lin (2007) Rapeseed SPI 93.3 Yumiko et al. (2008) 0-0 Oriental mustard SPI 75.9 Lin (2007) Soybean Supro 500 E 44.5 Soybean Supro 670 39.8 Liadakis et al. (1998) Acid soluble protein isolatea 39.53 ± 0.45 Current study Abyssinian mustard PPI 35 Pedroche et al. (2004) Rapeseed PPI 26.4 Yumiko et al. (2008) 0-0 Oriental mustard PPI 12.1 Lin (2007) Chinese rapeseed PPI 2.8 Xu et al. (1994) DWGYM* PPI 2.64 Lin (2007) Precipitated protein isolatea 1.36 ± 0.12 Current study
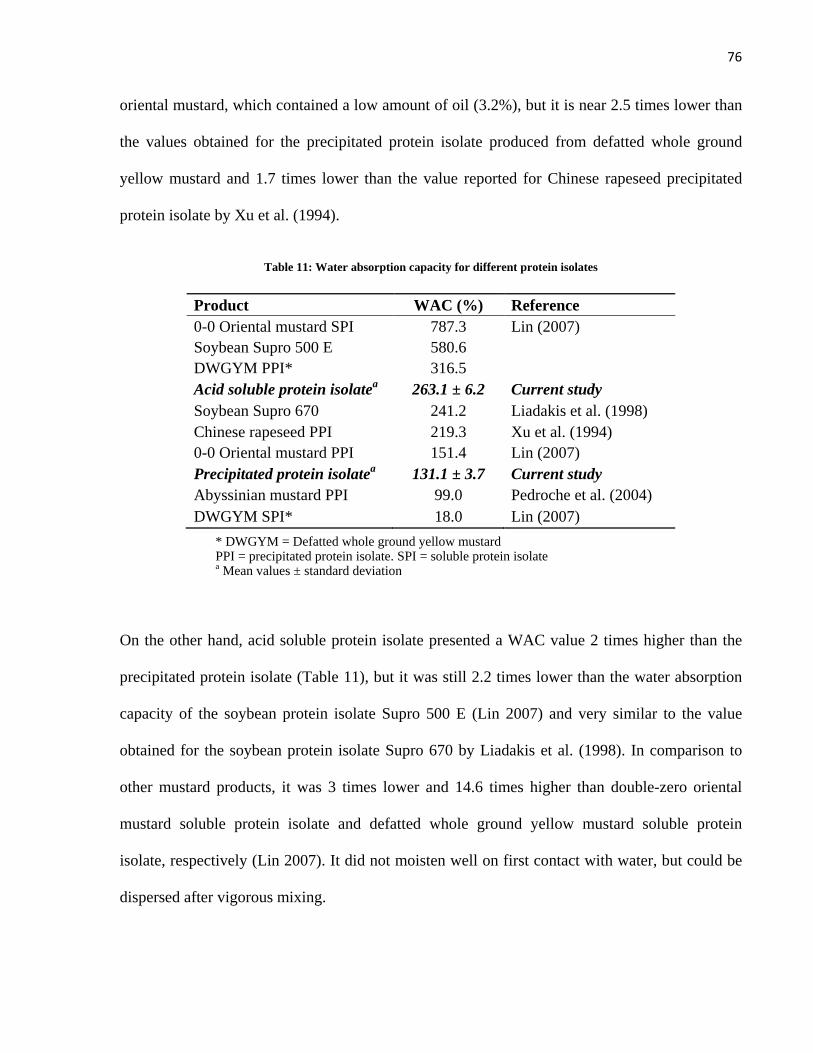
76
oriental mustard, which contained a low amount of oil (3.2%), but it is near 2.5 times lower than
the values obtained for the precipitated protein isolate produced from defatted whole ground
yellow mustard and 1.7 times lower than the value reported for Chinese rapeseed precipitated
protein isolate by Xu et al. (1994).
Table 11: Water absorption capacity for different protein isolates
* DWGYM = Defatted whole ground yellow mustard PPI = precipitated protein isolate. SPI = soluble protein isolate a Mean values ± standard deviation
On the other hand, acid soluble protein isolate presented a WAC value 2 times higher than the
precipitated protein isolate (Table 11), but it was still 2.2 times lower than the water absorption
capacity of the soybean protein isolate Supro 500 E (Lin 2007) and very similar to the value
obtained for the soybean protein isolate Supro 670 by Liadakis et al. (1998). In comparison to
other mustard products, it was 3 times lower and 14.6 times higher than double-zero oriental
mustard soluble protein isolate and defatted whole ground yellow mustard soluble protein
isolate, respectively (Lin 2007). It did not moisten well on first contact with water, but could be
dispersed after vigorous mixing.
Product WAC (%) Reference 0-0 Oriental mustard SPI 787.3 Lin (2007) Soybean Supro 500 E 580.6
DWGYM PPI* 316.5 Acid soluble protein isolatea 263.1 ± 6.2 Current study
Soybean Supro 670 241.2 Liadakis et al. (1998) Chinese rapeseed PPI 219.3 Xu et al. (1994) 0-0 Oriental mustard PPI 151.4 Lin (2007) Precipitated protein isolatea 131.1 ± 3.7 Current study Abyssinian mustard PPI 99.0 Pedroche et al. (2004) DWGYM SPI* 18.0 Lin (2007)
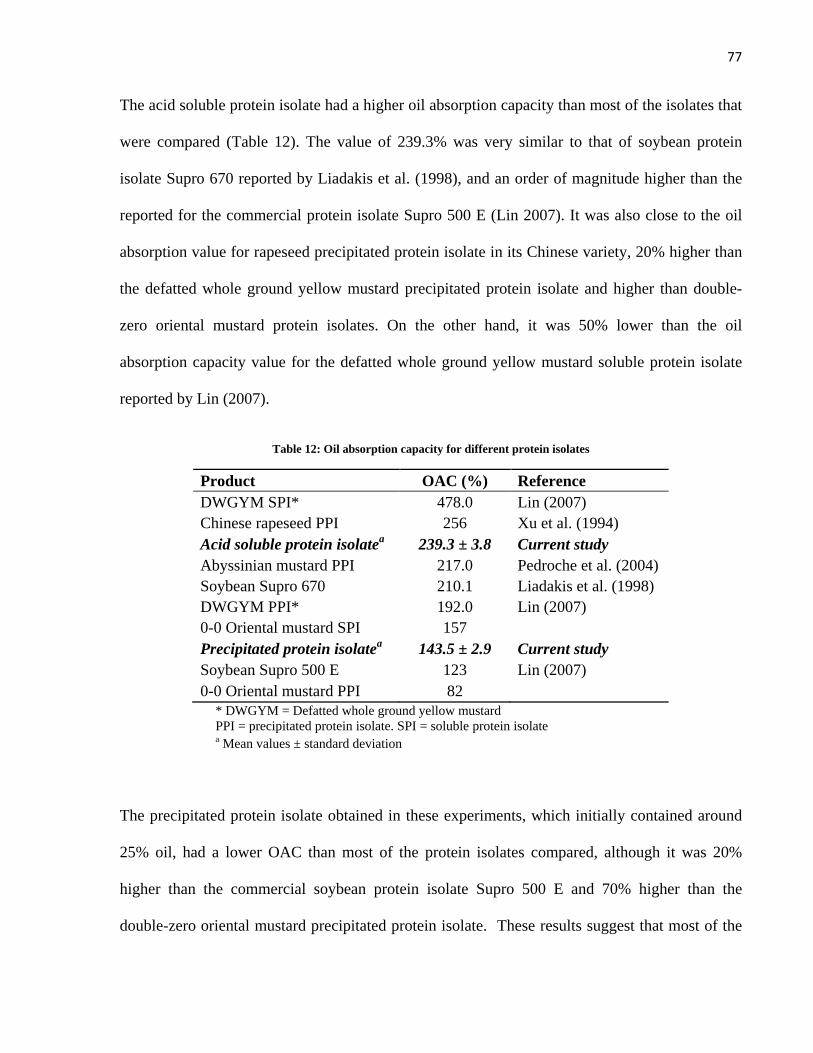
77
The acid soluble protein isolate had a higher oil absorption capacity than most of the isolates that
were compared (Table 12). The value of 239.3% was very similar to that of soybean protein
isolate Supro 670 reported by Liadakis et al. (1998), and an order of magnitude higher than the
reported for the commercial protein isolate Supro 500 E (Lin 2007). It was also close to the oil
absorption value for rapeseed precipitated protein isolate in its Chinese variety, 20% higher than
the defatted whole ground yellow mustard precipitated protein isolate and higher than double-
zero oriental mustard protein isolates. On the other hand, it was 50% lower than the oil
absorption capacity value for the defatted whole ground yellow mustard soluble protein isolate
reported by Lin (2007).
Table 12: Oil absorption capacity for different protein isolates
Product OAC (%) Reference DWGYM SPI* 478.0 Lin (2007) Chinese rapeseed PPI 256 Xu et al. (1994) Acid soluble protein isolatea 239.3 ± 3.8 Current study Abyssinian mustard PPI 217.0 Pedroche et al. (2004) Soybean Supro 670 210.1 Liadakis et al. (1998) DWGYM PPI* 192.0 Lin (2007) 0-0 Oriental mustard SPI 157
Precipitated protein isolatea 143.5 ± 2.9 Current study Soybean Supro 500 E 123 Lin (2007) 0-0 Oriental mustard PPI 82
* DWGYM = Defatted whole ground yellow mustard PPI = precipitated protein isolate. SPI = soluble protein isolate a Mean values ± standard deviation
The precipitated protein isolate obtained in these experiments, which initially contained around
25% oil, had a lower OAC than most of the protein isolates compared, although it was 20%
higher than the commercial soybean protein isolate Supro 500 E and 70% higher than the
double-zero oriental mustard precipitated protein isolate. These results suggest that most of the

78
mustard proteins are lipophilic in nature. Kinsella et al. (1976) proposed that the mechanism for
oil absorption relies mostly on the physical entrapment of oil by capillary attraction, but the high
oil absorption of mustard proteins may also be explained by the abundance of hydrophobic
groups on the protein surface which bind the hydrocarbon chains of lipids.
5.5.5 Emulsifying Properties
The emulsifying properties of the precipitated protein isolate and the acid soluble protein isolate
were investigated by measuring both the emulsifying activity index (EAI) and emulsion stability
(ES) (Table 13). The emulsions of both protein isolates appeared in the form of thick mixtures
and were apparently affected by the oil content. The precipitated protein isolate obtained from
the aqueous extraction in this study showed lower emulsifying activity than both the reported
value for soybean protein isolate Supro 500E (Lin 2007) and the acid soluble protein isolate,
while the latter was actually superior to the other two and to all other compared protein isolates.
The emulsifying activity of the acid soluble protein isolate was 15% higher than the 84.9% value
reported for Supro 500E and up to 55% higher than any of the other values reported for yellow
mustard and Abyssinian mustard protein isolates (Lin 2007 and Pedroche et al. 2004). On the
other hand, the emulsifying activity for the precipitated protein isolate was almost 20% lower
than the reported for Supro 500 E, it was comparable to the value of 68.5% reported by Lin
(2007) for the double-zero oriental mustard soluble protein isolate, and at least 25% higher than
the values reported for Abyssinian mustard precipitated protein isolate (Pedroche et al. 2004),
Chinese rapeseed precipitated protein isolate (Xu et al. 1994) and defatted whole ground yellow
mustard isolates.
Both the precipitated protein isolate and the acid soluble protein isolate showed good emulsion
stability. Heat denaturation usually increases the protein surface hydrophobicity, improving the

79
emulsifying properties. This effect was confirmed, as the emulsion volumes tended to increase
during heating. In the case of the precipitated protein isolate, there was a 3% increase in the
emulsifying activity. In the case of the acid soluble protein isolate the increment was around 2%,
although it was noted that after heat treatment and centrifugation the thick emulsion had gelled,
probably because the heat treatment of the globular proteins caused polymerization via
Table 13: Emulsifying properties of protein isolates
Product EAI (%) ES (%) Reference Acid soluble protein isolatea 98.8 ± 0.1 100.4 ± 0.2 Current study Soybean Supro 500 E 84.9 100 Lin (2007) Precipitated protein isolatea 70.4 ± 1.7 103.5 ± 4.8 Current study 0-0 Oriental mustard SPI 68.5 96 Lin (2007) Chinese rapeseed PPI 56.1 99.4 Xu et al. (1994) Abyssinian mustard PPI 54.0 5.0 Pedroche et al. (2004) DWGYM PPI* 53.5 59.7 Lin (2007) DWGYM SPI* 49.0 71.5
0-0 Oriental mustard PPI 45.7 120 * DWGYM = Defatted whole ground yellow mustard PPI = precipitated protein isolate. SPI = soluble protein isolate a Mean values ± standard deviation
sulfhydryl-disulfide interchange reactions (Damodaran 1996). For the other mustard protein
isolates, the emulsion stability values reported show that heat treatment has different effects on
the emulsifying activity, most likely due to different oil contents, carbohydrate contents and
protein physicochemical characteristics. Emulsifying properties show strong correlation with
surface hydrophobicity and the ability of the protein to change its conformation at the interface.
The oil content, low solubility, low water absorption and high values for oil absorption of both
protein isolates produced in this study show their hydrophobic nature, which contributes to their
emulsifying properties.

80
5.5.6 Foaming Properties
The foaming properties of a protein depend on an adequate balance between its flexibility and
rigidity. While the foaming expansion is generally related to protein flexibility and rate of
adsorption at the interface, foam stability is affected by their molecular rigidity (Moure et al.
2006 and Damodaran 1996).
The acid soluble protein isolate obtained from the aqueous extraction of yellow mustard flour
had higher foam expansion values than most of the values for protein isolates reported in the
literature (Table 14), surpassed only by the value reported for the defatted whole ground yellow
mustard soluble protein isolate (Lin 2007) which was 40% higher, and the value reported by Xu
et al. (1994) for the Chinese rapeseed precipitated protein isolate.
Table 14: Foam expansion values for protein isolates
* DWGYM = Defatted whole ground yellow mustard PPI = precipitated protein isolate. SPI = soluble protein isolate
a Mean values ± standard deviation
The value of 213.3% was 2.8 times higher than the 75% reported for Supro 500E (Lin 2007) and
3.1 times higher than the value reported for Supro 670 (Liadakis et al. 1998). Soybean protein
Product FE (%) Reference DWGYM SPI* 306.0 Lin (2007) Chinese rapeseed PPI 275 Xu et al. (1994) Acid soluble protein isolatea 213.3 ± 1.5 Current study Abyssinian mustard PPI 163 Pedroche, et al. (2004) DWGYM PPI* 147.5 Lin (2007) 0-0 Oriental mustard SPI 125
Precipitated protein isolatea 95.0 ± 5.0 Current study 0-0 Oriental mustard PPI 82 Lin (2007) Soybean Supro 500 E 75
Soybean Supro 670 66.8 Liadakis, et al. (1998)

81
isolates had the lowest reported foaming activity. On the other hand, the precipitated protein
isolate had a foam expansion value almost 50% lower than the acid soluble protein isolate and it
was also lower than the values reported for Abyssinian mustard precipitated protein isolate
(Pedroche et al. 2004), defatted whole ground yellow mustard precipitated protein isolate and the
double-zero oriental mustard soluble protein isolate (Lin 2007). The low foam expansion value
obtained in this study for the precipitated protein isolate can be explained by its high oil content,
since the presence of lipids in protein isolates hinder their foaming capacity (Yasumatsu et al.
1972).
Although the foam expansion of the precipitated protein isolate was relatively low, it had high
foam stability during the first part of the evaluation test, but after 60 minutes it showed a steep
collapsing rate, without leveling off during the two hour test period. The foam stability data and
the foam volume stability percentage values (FVS) are tabulated in Tables 15 and 16, and the
data plotted in Figure 23.
Table 15: Foam stability data
Foam stability (ml) Product 0.5 min 20 min 40 min 60 min 120 min Acid soluble protein isolate 300.0 ± 7.0 237.3 ± 2.5 224.7 ± 1.2 213.3 ± 2.9 202.0 ± 7.2
Precipitated protein isolate 96.3 ± 5.5 92.3 ± 3.8 82.7 ± 2.3 79.7 ± 4.5 58.0 ± 2.6
Mean values ± standard deviation
This can be attributed to the de-foaming effects of the lipids contained in this isolate.
Conversely, the acid soluble protein isolate and the data for all other protein isolates compared
showed a different and characteristic behavior, where the collapsing rate was high during the
first ~25 minutes but then abruptly decreased and leveled off. The acid soluble protein isolate

82
had the highest foam stability, maintaining 76% of its initial foam volume after 20 minutes and
65% after two hours. The precipitated protein isolate, on the other hand, maintained up to 95% of
its initial foam volume after 20 minutes, but then dropped off and retained only 60% after two
hours. The foam stability values reported by Lin (2007) for the soybean protein isolate Supro 500
E show that only 55% of the initial foam volume remains after a period of 20 minutes and 44%
after two hours, while for the Abyssinian mustard precipitated protein isolate the values reported
by Pedroche et al. (2004) show 48% foam retention after 20 minutes and 34% after two hours.
Table 16: Foam volume stability values for selected protein isolates
FVS (%) Product 20 min 30 min 40 min 120 min Reference Acid soluble protein isolate 75.7 72.9 71.7 64.5 Current study Precipitated protein isolate 47.3 44.7 42.4 29.7 Chinese rapeseed PPI 60.0 - 58.0 50.7 Xu et al. (1994) 0-0 Oriental mustard SPI 52.0 - 45.1 30.0 Lin (2007) 0-0 Oriental mustard PPI 44.0 - 38.5 27.5 Soybean Supro 500 E 52.6 - 47.7 42.0 Abyssinian mustard PPI 47.5 - 39.8 33.9 Pedroche, et al. (2004) Soybean Supro 670 - 40.6 - - Liadakis, et al. (1998) SPI = soluble protein isolate. PPI = precipitated protein isolate
According to the values reported by these authors, the soybean protein isolate Supro 500 E had
lower foam stability than the reported for other mustard protein isolates including the ones from
this study. This suggests that mustard proteins are able to form more cohesive viscoelastic films
through intra-molecular interactions than soybean proteins and could be more suited for foaming
applications.

83
5.5.7 Gelation
The effect of protein isolate concentration on the gel formation is shown in Table 17. The
minimal protein isolate concentration required for inverting a tube without producing sliding of
the gel in the walls is known as the least gelation concentration (LGC). LGC was measured only
in the acid soluble protein isolate, it was not measured for the precipitated protein isolate because
of its high oil contents and limited solubility.
Table 17: Least gelation concentration values for selected protein isolates
Product LGC (%) Reference Rosa Mosqueta protein isolate 6 Moure et al. (2001) Acid soluble protein isolate 8 Current study Lupin protein isolate 12 Lqari et al (2002) Soybean Promine D 14 Okezie and Bello (1988) Soybean protein isolate 16 Moure et al. (2005)
30.00%
40.00%
50.00%
60.00%
70.00%
80.00%
90.00%
100.00%
0 20 40 60 80 100 120 140
Foam
per
cent
age
(%)
Time (min)
Acid soluble protein isolate Precipitated protein isolateSupro 500E
Figure 23: Foam stability expressed as the foam volume (%) remaining against time

84
A value of 8% was found to be the least gelation concentration for acid soluble protein isolate,
which formed a hard, white, coagulant-type gel. According to Shimada et al. (1980) proteins
with non-polar residues tend to form this type of gel. The LGC value was found to be similar to
the reported by Moure et al. (2001) for rosa mosqueta protein isolate, 33% lower than the value
reported for lupin protein isolate (Lqari, et al. 2002) and at least 1.75 times lower than the values
for soybean protein isolates reported in the literature. It has been suggested that for globular
proteins, in addition to non-covalent interactions, the ability to form intra-molecular disulfide
bonds during heat treatment is important for gelation and it is likely that disulfide cross-linking
increases polymer chain length and the molecular weight-average (Monahan, et al. 1995 and
Damodaran 1996). In addition, acid soluble protein isolate composition (Table 9) shows that
approximately 20% of its mass is not formed by proteins, lipids or moisture, but it is most likely
formed by carbohydrates, which may improve the gelling properties (Sathe, Deshpande and
Salunkhe 1982). The type of gel formed also suggests the hydrophobic, non-polar nature of the
proteins in the isolate.
5.6 Temperature effect on lipid oxidation in the precipitated protein isolate
The lipid oxidation study on the precipitated protein isolate was performed following the
procedure described in Section 4.5.4. 10-gram samples were stored at three different
temperatures in closed plastic bags. Each week the oil from a sample for each temperature was
extracted using a solvent mixture of petroleum and diethyl ether at room temperature. The
solvent in the recovered miscella was then evaporated. The same extraction procedure was
applied to the starting material (de-hulled yellow mustard flour) and a sample of the precipitated
protein isolate from the final batch, which was kept frozen until the analysis. Although the

85
extraction method used was not quantitative, the extraction results showed consistency
throughout the experiments. For the samples of precipitated protein stored at 25°C the extracted
oil represented an average of 10.80% of their initial mass, for the samples stored at 35°C it
represented an average of 10.02% and for the samples stored at 45°C the average value was
10.18%. In the case of the initial precipitated protein isolate sample and for the yellow mustard
flour sample, the values obtained were 10.62% and 29.52% of their initial mass, respectively.
The TBA value was determined for each of the recovered oil samples. The results are shown in
Table 18 for the starting materials and in Table 19 for the heated samples.
Table 18: TBA values for the starting materials
Sample TBA value* Mustard flour 0.1037 ± 0.0021 Initial PPI 0.1165 ± 0.0036
*TBA value reported as mg of malondialdehyde per kg of sample (Mean values ± standard deviation)
The TBA values of the precipitated protein isolate obtained after the aqueous extraction,
membrane processing, isoelectric precipitation and freeze drying show an increment of 12.3% in
comparison to the value of the starting material. This increment was expected due to material
handling and to the heating step prior the protein solution membrane processing, where it was
heated up to a temperature of 60°C for at least 30 minutes. These factors might have promoted
the formation of lipid free radicals, hydroperoxides and secondary oxidation products. In
comparison with the initial TBA value for the precipitated protein isolate, samples stored at 25°C
presented an increment of almost 52% after 35 days. Samples stored at 35°C presented an
increment of 56%, and for the samples stored at 45°C the TBA value increase was 68.5%.

86
Table 19: TBA values for samples stored at different temperatures
TBA values* Time (days) 25ºC Storage 35°C Storage 45°C Storage
7 0.1265 ± 0.0025 0.1341 ± 0.0047 0.1368 ± 0.0089 14 0.1502 ± 0.0056 0.1556 ± 0.0087 0.1583 ± 0.0066 21 0.1359 ± 0.0031 0.1424 ± 0.0063 0.1500 ± 0.0062 27 - 0.1683 ± 0.0010 0.1708 ± 0.0074 28 0.1678 ± 0.0051 - - 35 0.1765 ± 0.0033 0.1821 ± 0.0075 0.1963 ± 0.0047
*TBA value reported as mg of malondialdehyde per kg of sample (Mean values ± standard deviation)
Samples stored at 45°C presented a slightly faster oxidation rate when compared to those
samples stored at lower temperatures. The maximum TBA value for the samples stored at 45°C
after 35 days was 7.8% higher than the maximum value of samples stored at 35°C and 11.2%
higher than the value of the samples stored at 25°C after the same amount of time (Figure 30).
However, the analysis of variance for the TBA values obtained every 7 days for the three
temperature treatments showed that the differences between them were not significant at the 95%
confidence level (p>0.05), suggesting that under these circumstances the lipid oxidation was only
slightly dependent on the storage temperature. Similar observations were made by Kristensen, et
al. (2001) in oxidative stability studies of processed cheese at 5°C, 20°C and 37°C, and by
Thomsen, et al. (2005) in the lipid oxidation evaluation of whole milk powder at 37°C and 45°C.
On the other hand, several authors have reported a maximum TBA value in lipid oxidation
studies; Danowska-Oziewics et al. (2005) reported a maximum in the TBA values when
assessing quality changes of soybean and rapeseed oils during heating. Similar observations were
made by Tazi, et al. (2009) in the oxidation of almond paste and by Liu, et al. (1991) in the
stability study of lean ground beef patties.

87
Figure 24: Malondialdehyde formation in the precipitated protein isolate at three temperatures
Since the TBA values in the current study did not show a maximum, it is suggested that they
may still increase with storage time.
The low oxidation rates and small differences between the TBA values obtained may be due to
the high protein content in the isolate and its antioxidant properties. Proteins inhibit lipid
oxidation reactions in food lipid-protein systems by the mechanisms outlined in section 2.6.1,
and its effects have been shown by several authors; Tong et al. (2000) showed that whey proteins
decrease the oxidation rate in salmon oil emulsions, while Cheng et al. (2010) found lower lipid
oxidation rates in soybean oil-in-water emulsions treated with potato protein hydrolysates as
antioxidants. Taylor et al. (1980) also showed the antioxidant activity of skim milk proteins in a
linoleate emulsion.
0.1000
0.1200
0.1400
0.1600
0.1800
0.2000
0.2200
0 10 20 30 40
TB
A V
alue
(mg
of m
alon
dial
dehy
de/k
g)
Time (days)
25°C
35°C
45°C

88
6. MEAT PRODUCT TESTING
One of the potential uses of mustard protein is as binders in meat products such as sausages and
hams, as a replacement for the soy protein currently used by the industry. While not all binders
are protein based, the addition of soy protein is a common industrial practice to aid in stabilizing
the fat and water of the meat emulsion, producing a firmer and moister product.
Tests were performed using the precipitated protein isolate produced by the aqueous extraction
of de-hulled yellow mustard flour, followed by membrane processing of the protein solution with
a 5kDa membrane, isoelectric precipitation and freeze drying. The mustard flour meal residue, a
byproduct of the aqueous extraction process, was also used. Unfortunately, not enough acid
soluble protein isolate was produced for a pilot-scale meat test. Both products were tested as a
binder in a typical emulsion product. The formulation (standard Hermann Laue base formulation
plus 1% or 2% added protein) was stuffed into fibrous casings, which allow penetration of
smoke, and cooked in a smoke house for wiener production, or in waterproof casings, and
cooked in an industrial oven to produce bologna. The meat products were evaluated and
compared against a control of pure meat by an untrained panel. Participants were asked to assess
the taste of the products and their impressions and comments were recorded using the form given
in Appendix B7, following a hedonic or affective test method. In the case of the wieners, as
shown in Table 20, the ratings were similar indicating that all products had pleasant flavours and
mouth feels, but all agreed that the wieners manufactured with either the meal residue or
precipitated protein isolate had a more firm consistency than the control. Wieners manufactured
with 2% meal residue or 2% precipitated protein isolate were described in some cases as dry.

89
Table 20: Ratings for wieners produced with precipitated protein isolate and meal residue derived from the aqueous extraction process, membrane processing and isoelectric precipitation
Overall preference (9 is the highest rating) Control MR 1% MR 2% PPI 1% PPI 2%
Total responses 6 6 6 6 6 Mean rating 6.0 6.6 5.7 5.7 6.9 Standard deviation 2.5 1.5 1.8 2.4 1.8
Although the samples manufactured using 2% of precipitated protein isolate had a higher mean
rating than the rest, statistical analysis of the data showed that the differences between ratings
were not significant at the 95% confidence level (p>0.05). As expected, the standard deviations
of this test were high, reflecting the wide differences among people in their preferences and
feelings about food. These results show that the mustard meal residue and precipitated protein
isolate do not have a negative impact in the acceptance of the wieners and actually conferred
some characteristics that made them more preferable for some of the participants.
In the case of the bologna type products, the samples containing yellow mustard protein products
were also described as having a firm texture. The ratings are shown in Table 21.
Table 21: Ratings for bologna produced with precipitated protein isolate and meal residue derived from the aqueous extraction process, membrane processing and isoelectric precipitation
Overall preference (9 is the highest rating) Control MR 1% MR 2% PPI 1% PPI 2%
Total responses 7 7 7 7 7 Mean rating 5.7 4.9 5.1 6.2 8.2 Standard deviation 1.6 0.9 1.6 1.0 1.4
Statistical analysis of the data showed that the differences between mean ratings were significant
at the 95% confidence level (p<0.05). In order to determine which of the means had significant

90
differences, the Tukey HSD (honestly significant difference) test was performed on them.
Significant differences were found between the pairs of mean ratings showed in Table 22.
Table 22: Pairs of mean ratings with significant differences at the 95% confidence level
Sample Mean Sample Mean Control 5.7 PPI 2% 8.2 MR 1% 4.9 PPI 2% 8.2 MR 2% 5.1 PPI 2% 8.2
The results indicate that the samples prepared with 2% precipitated protein isolate had a higher
rating and were preferred over the control samples and over the samples containing meal residue.
The sensory characteristics provided by this isolate, probably due to its oil content, had
noticeable differences in its sensory perception. As in the case of the wieners, samples
manufactured with 2% meal residue were also described in some cases as dry. The differences in
the preparation method for both wieners and bologna, where the first are cooked in a smoke
house, might affect the final product characteristics and their sensory perception, leading to the
noted differences. As in the case of wieners, the addition of yellow mustard derived protein
products did not show a negative impact in the acceptance of the bologna.

91
7. CONCLUSIONS
• Aqueous extraction of full fat mustard flower is a good approach to the simultaneous
recovery of oil and protein. The crude protein extraction yield for the process was 86.4%.
As much as 81.5% was recovered in a protein solution, 4.9% was recovered in an oil-in-
water emulsion and 7.8% remained un-extracted in the meal residue. The protein solution
was mainly composed of water (94.9%), had a crude protein content of 2.57%, and an oil
content of 0.7%.
• Membrane processing via ultrafiltration and diafiltration with a 5kDa membrane resulted
in a crude protein recovery of 83.0% of the total protein in the initial protein solution,
while 17.0% was lost in the permeate fraction. The crude protein recovery yield as
permeate was around 11.2%, a lower value than the 20% reported by Balke (2006) when
using a 10 kDa membrane. The protein loss was most likely non-protein nitrogen and
some low MW polypeptides.
• Isoelectric precipitation resulted in two protein isolates. A precipitated protein isolate that
represented 55% of the total crude protein from the starting material, had a protein
content of around 96% on a dry, oil free basis. However contained a considerable amount
of lipids (~25%). The acid soluble isolate represented 11.2% of the crude protein in the
starting material, had a low lipid and moisture content, and a protein concentration of
83.5% on moisture and oil free basis. An average of 5.7 times more precipitated protein
isolate was obtained per gram of acid soluble protein isolate.
92
• The precipitated protein isolate was light tan in colour and with a bland taste and a
slightly bitter aftertaste. The acid soluble protein isolate was off-white with an astringent
and salty taste. Their texture and colour was similar to soybean protein isolate Supro 500
E, which also had a salty flavour.
• SDS-PAGE analysis of the two mustard isolates show that they are mostly composed of
polypeptides with MW below 60 kDa. MW distribution varied among isolates, and that at
least 6 protein groups contain disulfide bonds which may affect their molecular flexibility
and rigidity, most likely increasing the polymer chain length and average molecular
weight during gelation.
• Low NSI values suggest that the protein isolates obtained in this study, at their dispersion
pH, have a structure or conformation where hydrophilic groups are most likely blocked,
and their interaction with the aqueous environment is hindered. This effect in the
precipitated protein isolate is amplified by its high oil content.
• The WAC and OAC values suggest that most of the mustard proteins from these isolates
are lipophilic in nature at their native pH, with abundance of hydrophobic groups on the
protein surface which bind the hydrocarbon chains of lipids. The WAC value for the acid
soluble protein isolate was comparable to the value reported for the soybean protein
isolate Supro 670. In the case of the OAC, both isolates had similar or higher values than
those reported for the soybean protein isolates.
• The precipitated protein isolate had good emulsifying properties, but low foaming
expansion and foaming stability values, attributed to its high oil content. Conversely, the
acid soluble protein isolate presented high emulsifying and foaming properties compared

93
to other mustard and soybean protein isolates, which confirms its hydrophobic nature, its
ability to undergo conformational changes at the interface, and a better balance between
molecular flexibility and rigidity.
• The low least gelation concentration obtained for the acid soluble protein isolate is
attributed to the formation of intra-molecular disulfide bonds and also to its carbohydrate
content, which may play an important role. The LGC value was lower than those reported
in the literature for soybean protein isolates.
• The analysis of the temperature effect on lipid oxidation of the precipitated protein isolate
showed that there were no significant differences between the TBA values at 25°C, 35°C
and 45°C during a 35 days period, which suggests that temperature has a moderate effect
on lipid oxidation under the tested conditions. The low oxidation rates can be explained
by the antioxidant effects of proteins as outlined in section 2.6.1. While rancidification is
impaired by proteins and might not be a concern during normal storage conditions, the
reaction of amino acids with lipid free radicals and hydroperoxides, may hinder the
functionality and nutritional properties of the protein isolate.
• The meat testing confirmed the good binding and emulsifying properties of the
precipitated protein isolate and of the yellow mustard meal residue of the aqueous
extraction, without affecting in a negative way the flavour or mouth feel of the products.
Both isolates obtained in this study exhibited good functionality, indicating their usefulness in
many food applications. In comparison to the soybean protein isolates Supro 500 E and Supro
670, they presented a superior performance in the oil absorption, emulsifying, foaming and
gelation properties. The precipitated protein isolate presented a lower NSI and WAC than the

94
reported values for soybean isolates, while the acid soluble protein isolate had a NSI and WAC
similar to the values reported for the Supro 670 isolate, but lower than the values reported for the
Supro 500 E isolate.
These results show that the aqueous extraction of de-hulled yellow mustard flour along with
membrane processing of the protein solution are a potential source of high quality protein
products which in terms of functionality, can be viewed as direct competitors of their soybean
counterparts. Furthermore, the increasing value of plant protein isolates as replacement of animal
derived proteins, and the increasing demand for natural and organic products should encourage
the application of solvent-free technologies, that are able to provide environmentally friendly
solutions to the energy and food industries.

95
8. RECOMMENDATIONS
• Since the quantity of precipitated protein isolate produced is almost 6 times larger than
acid soluble protein isolate, the addition of enzymes could be considered after the
extraction process in order to increase the production and solubility properties of the acid
soluble protein isolate.
• Although the effects of storage temperature on lipid oxidation were found to be low, the
effects of lipid-protein interactions in the functionality of the precipitated protein isolate
should be studied since the loss of functionality will negatively affect the effectiveness of
the product.
• Being a water intensive process, nanofiltration or reverse osmosis treatment of the
permeate fraction should be studied in order to recover other valuable compounds, such
as phenolic compounds and water for its recirculation into the aqueous extraction
process.
• Considering the promising results obtained by the precipitated protein isolate and the
meal residue in the meat test, enough acid soluble protein isolate should be produced and
tested in order to evaluate its functionality in a food system and its effects on the flavour
and mouth feel of the final product. The functional properties of the meal residue should
also be assessed to evaluate additional applications.
• While the acid soluble protein isolate had a low gelation concentration, additional studies
on cold and hot gel strength should be considered, in order to determine the gellation
properties and more specific applications.

96
• A solubility profile over a wide range of pH values should be determined for both protein
isolates in order know how their functionality is affected under more acidic or basic
conditions, increasing its applications in the production of acidic beverages or other food
systems.
• A preliminary economic analysis of the protein isolates production should be performed
in order to verify its viability as a competitor for other plant protein isolates currently in
the market.

97
8. REFERENCES
Agriculture and Agri-Food Canada. Mustard seed statistics. 03 21, 2007. http://www4.agr.gc.ca/AAFC-AAC/display-afficher.do?id=1174504635719&lang=eng (accessed May 31, 2012).
—. The Case for Canadian Mustard. August 11, 2011. http://www.ats-sea.agr.gc.ca/pro/4512-eng.htm (accessed May 24, 2012).
Agroecommerce Network Private Ltd. 2002. http://www.agroecommerce.com/agroecom/BriefInfo/Crops/MustardInfo.asp (accessed May 4, 2012).
Aluko, R. E., and T. McIntosh. "Polypeptide profile and functional properties of defatted meals and protein isolates of canola seeds." Journal of Science of Food and Agriculture 81 (2001): 391-396.
Aluko, Roitimi E., and Tara McIntosh. "Electrophoretic and functional properties of mustard seed meals and protein concentrates." Journal of the American Oil Chemists' Society 81, no. 7 (2004): 679-683.
Appelqvist, L. A. "Composition of seeds of Cruciferous oil crops." Journal of the American Oil Chemists' Society 48 (1971): 851 - 859.
Ataya Pulido, Veronica Maria. The production of a potential feedstock for biodiesel using water and isopropyl alcohol to extract yellow mustard oil. Toronto: M. A. Sc. thesis, Chemical Engineering and Applied Chemistry, University of Toronto, 2010.
Baker, Richard W. Membrane Technology and Applications. London: John Wiley & Sons, 2004.
Balke, David Thomas. The production of higher value food ingredients from white mustard seed via aqueous extraction. Toronto: Ph. D. thesis, Chemical Engineering and Applied Chemistry, University of Toronto, 2006.
Becker, K. W. "Processing of Oilseeds to Meal and Protein Flakes." Journal of the American Oil Chemists' Society 48 (1970): 299-304.
Bell, J. M., G. Rakow, and R. K. Downey. "Comparisons of amino acid and protein levels in oil-extracted seeds of Brassica and Sinapis species, with observations on environmental effects." Canadian Journal of Animal Science, 1999: 169-174.
Campbell, K. A., and C. E. Glatz. "Mechanisms of aqueous extraction of soybean oil." Journal of Agricultural and Food Chemistry 57 (2009): 10904-10912.

98
Campbell, K. A., C. E. Glatz, L. A. Johnson, S. Jung, J. M. N. de Moura, and V., Murphy, P. Kapiche. "Advances in aqueous extraction processing of soybeans." Journal of the American Oil Chemists' Society 88 (2011): 449-465.
Canadian Grain Commission. Western Canadian mustard - Scientific analysis of harvest quality. March 22, 2012. http://www.grainscanada.gc.ca/mustard-moutarde/hqmm-mqrm-eng.htm (accessed May 24, 2012).
Canadian Special Crops Association. Facts about Canadian mustard seed, sunflower, buckwheat and canary seed. Winnipeg: Agriculture and Agri-Food Canada, 2007.
Cater, C. M., K. C. Rhee, R. D. Hagenmaier, and K. F. Mattil. "Aqueous extraction - an alternative oilseed milling process." Journal of the American Oil Chemists' Society 51 (1974): 137-141.
Caviedes, J. Aqueous processing of rapeseed. Toronto: M.A.Sc. Thesis, Chemical Engineering and Applied Chemistry, University of Toronto, 1996.
Chapman, Dennis. "Physical Studies of Lipid-lipid and Lipid-protein Interactions." Lipids 4, no. 4 (1969): 251-260.
Chayen, I. H., and D. R. Ashworth. "The application of impulse rendering to the animal-fat industry." Journal of Applied Chemistry 3, no. 12 (1953): 529-537.
Cheng, Yu, Youling L. Xiong, and Jie Chen. "Antioxidant and emulsifying properties of potato protein hydrolysate in soybean oil-in-water emulsions." Food Chemistry 120 (2010): 101-108.
Cheryan, M. Ultrafitlration and Microfiltration Handbook. Pennsylvania: Technomic Publishing, 1998.
Cserhalmi, Zs., Zs. Márkus, B. Czukor, Á. Baráth, and M. Tóth. "Physico-chemical properties and food utilization possibilities of RF-treated mustard seed." Innovative Food Science & Emerging Technologies 1 (2001): 251-254.
Damodaran, Srinivasan. "Functional Properties." In Food Proteins: properties and characterization, by S. Nakai and H. W. Modler, 167-224. New York: VCH Publishers, Inc., 1996.
Danowska-Oziewics, Marzena, and Miroslawa Karpinska-Tymoszczyk. "Quality changes in selected frying fats during heating in a model system." Journal of Food Lipids 12 (2005): 159-168.

99
Dendukuri, Dhananjay, and Levente L. Diosady. "Oil-free protein isolates from full-fat, dehulled mustard flour by microfiltration." Journal of the American Oil Chemists' Society 80, no. 3 (2003): 287-294.
Diosady, Levente L., Lei Xu, and Bih-King Chen. Production of high-quality protein isolates from defatted meals of brassica seeds. United States Patent 6,905,713 B2. June 14, 2005.
Dobarganes, M. C., J. Velasco, and A. Dieffenbacher. "Determination of polar compounds, polymerized and oxidized triacylglycerols, and diacylglycerols in oils and fats." Pure and Applied Chemistry 72, no. 8 (2000): 1563-1575.
Dubois, Michel, K. A. Gilles, J. K. Hamilton, P. A. Rebers, and Fred Smith. "Colorimetric method for determination of sugars and related substances." Anal. Chem. 28 (1956): 350-356.
Dunford, N. "Oil and oilseed processing." Food and agricultural products center, Oklahoma State University. 2012. http://www.fapc.okstate.edu/ (accessed June 04, 2012).
Elias, R. J., and E. A. Decker. "Protein antioxidants for the stabilization of lipid foods: current and potential applications." In Oxidation in foods and beverages and antioxidant applications, by Eric A. Decker, Ryan J. Elias and D. Julian McClements, 249-271. Oxford: Woodhead Publishing, 2010.
Environmental Protection Agency. "National emission standards for hazardous air pollutants: solvent extraction for vegetable oil production: final rule." Federal Register, April 12, 2001.
Fenwick, R. G., and R. K. Heaney. "Glucosinolates and their breakdownproducts in cruciferouscrops, foods and feedingstuffs." Food Chemistry 11, no. 4 (1983): 249-271.
Fenwick, R. G., R. K. Heaney, and J. W. Mullin. "Glucosinolates and their breakdown products in food and food plants." CRC Critical Rreviews in Food Science and Nutrition 18, no. 2 (1982): 123-201.
Forss, D. A. "Odors and flavor compounds from lipids." Progress in the Chemistry of Fats and other Lipids 13, no. 4 (1972): 177-258.
Georing, K. J., O. O. Thomas, D. R. Beardsley, and W. A. Curran. "Nutritional value of mustard and rape seed meals as protein source for rats." The Journal of Nutrition 72 (1960): 210-216.
Gitte, Frandsen I., John Mundy, and Tzen T. C. Jason. "Oil bodies and their associated proteins, oleosin and caleosin." Physiologia Plantarum 112 (2001): 301-307.
100
Graf, E., and K. L. Empson. "Phytic Acid. A natural antioxidant." The Journal of Biological Chemistry 262, no. 24 (1987): 11647-11650.
Hagenmaier, R. D. "Aqueous processing of full-fat sunflower seeds: yields of oil and protein." Journal of the American Oil Chemists' Society 51, no. 10 (1974): 470-471.
Hagenmaier, R., C. M. Cater, and K. F. Mattil. "Critical unit operations of the aqueous processing of fresh coconuts." Journal of the American Oil Chemists' Society 49 (1972): 178-181.
Heath, Henry B. Source Book of Flavors. New York: Van Nostrand Reinhold, 1981.
Hidalgo, F. J., R. Zamora, and M. Alaiz. "Modificaciones producidas en las proteínas alimentarias por su interacción con lípidos peroxidados." Grasas y Aceites 42, no. 5 (1991): 379-386.
Hsieh, Kai, and Anthony H. C. Huang. "Endoplasmic reticulum, oleosins, and oils in seeds and tapetum cells." Plant Physiology 136 (2004): 3427-3434.
Huang, Anthony H. C. "Oil bodies and oleosins in seeds." Annual Review of Plant Physiology and Plant Molecular Biology 43 (1992): 177-200.
Jimmerson, Vincent H. Smith and Jason. "Briefing." Briefing No. 59. Montana: Montana State University, November 2005.
Johnson, Dale W. "Functional properties of oilseed proteins." Journal of the American Oil Chemists' Society 47, no. 10 (1970): 402-407.
Josefsson, E. "Content of p-hydroxybenzylglucosinolate in seed meals of Sinapis alba as affected by heredity, environment and seed part." Journal of the Science of Food and Agriculture 21 (1970): 94-97.
Kilara, Arun, and Venkatesh R. Harwalkar. "Denaturation." In Food Proteins. Proteins and Characterization, by S. Nakai and H. W. Modler, 71-148. New York: VCH Publishers, Inc., 1996.
Kinsella, John E., and Nicholas Melachouris. "Functional properties of proteins in foods: A survey." C R C Critical Reviews in Science and Nutrition 7, no. 3 (1976): 219-280.
Kinsella, John E., Patrick F. Fox, and Louis B. Rockland. "Water sorption by proteins: Milk and whey proteins." CRC Critical Reviews in Food Science and Nutrition 24, no. 2 (1986): 91-139.
Kozlowska, H., Zadernowski, and F. W. Sosulski. "Phenolic acids in oilseed flours." Nahrung 5 (1983): 449-453.

101
Kristensen, Dorthe, Eva Hansen, Allan Arndal, Rikke Appelgren Trinderup, and Leif H. Skibsted. "Influence of light and temperature on the colour and oxidative stability of processed cheese." International Dairy Journal 11 (2001): 837-843.
Labana, K. S., and M. L. Gupta. Breeding Oilseed Brassicas. Berlin: Springer, 1993.
Liadakis, G. N., C. Tzia, V. Oreopoulou, and C. D. Thomopoulos. "Isolation of tomato seed meal proteins with salt solutions." Journal of Food Science 63, no. 3 (1998): 450-453.
Li-Chan, Eunice. "Separation and purification." In Food proteins: Properties and characterization, by S. Nakai and H. W. Modler, 432-503. New York: VCH Publishers, Inc., 1996.
Lin, M. J. Y., and E. S. Humbert. "Certain functional properties of sunflower meal products." Journal of Food Science 39 (1974): 368-370.
Lin, Wenlie. Functional properties of double-zero oriental mustard protein products. Toronto: M. Eng. thesis, Chemical Engineering and Applied Chemistry, University of Toronto, 2007.
Lindau, J., and A.S. Jönson. "Cleaning of ultrafiltration membranes after treatment of oily waste water." Journal of Membrane Science 87 (1994): 71-78.
Liu, M. N., D. L. Huffman, W. R. Egbert, T. A. McCaskey, and C. W. Liu. "Soy protein and oil effects on chemical, physical and microbial stability of lean ground beef patties." Journal of Food Science 56, no. 4 (1991): 906-912.
Lqari, H., J. Vioque, J. Pedroche, and F. Millan. "Lupinus angustifolius protein isolates: chemical composition, functional properties and protein characterization." Food Chemistry 76, no. 3 (2002): 349-356.
Ludescher, Richard D. "Physical and Chemical Properties of Amino Acids and Proteins." In Food Proteins. Properties and Characterization, by S. Nakai and H. W. Modler, 23-68. New York: VCH Publishers, Inc., 1996.
Lui, Flora Y. H. The production of protein isolates from hexane-defatted ground yellow mustard meal. Toronto: M.A.Sc. thesis. Department of Chemical Engineering and Applied Chemistry, University of Toronto, 1998.
Luo, Haoqun. The production of food-grade protein isolates from yellow mustard seed by solvent extraction and membrane processing techniques. Toronto: M.A.Sc. Thesis. Department of Chemical Engineering and Applied Chemistry, University of Toronto, 1998.
Lusas, E. W. "Comparative processing practices of the world's major oilseed crops." Economic Botany 37, no. 4 (1983): 444-458.

102
Matthäus, B. "Oxidation of edible oils." In Oxidation in foods and beverages and antioxidant applications, by Eric A. Decker, Ryan J. Elias and Julian D. McClements, 183-238. Cambridge: Woodhead Publishing Limited, 2010.
McKenzie, R. "Mustard Production for Alberta." Alberta Agricultural and Rural Development. 01 06, 2010. http://www1.agric.gov.ab.ca/$department/deptdocs.nsf/all/agdex12947!OpenDocument&Click= (accessed 05 31, 2012).
Monahan, Frank J., Bruce J. German, and John E. Kinsella. "Effect of pH and temperature on protein unfolding and thiol/disulfide interchange reactions during heat-induced gelation of whey proteins." Journal of Agricultural and Food Chemistry 43 (1995): 46-52.
Monsalve, I. R., M. Villalba, and R. Rodriguez. "Internet Symposium on Food Allergens." Allergy to Mustard Seeds: The Importance of 2S Albumins. 2001. http://www.food-allergens.de (accessed May 24, 2012).
Moure, A., J. Sineiro, and H. Dominguez. "Extraction and functionality of membrane-concentrated protein from defatted Rosa rubiginosa seeds." Food Chemistry 74, no. 3 (2001): 327-339.
Moure, Andrés, Herminia Domínguez, María Elvira Zúñiga, Carmen Soto, and Rolando Chamy. "Characterisation of protein concentrates from pressed cakes of Guevina avellana (Chilean hazelnut)." Food Chemistry 78 (2002): 179-186.
Moure, Andres, J. Sineiro, Herminia Dominguez, and Juan Carlos Parajo. "Functionality of oilseed protein products: A review." Food Research International 39 (2006): 945-963.
Murray, Edward D., Chester D. Myers, and Larry D. Barker. Protein product and process for preparing same. United States of America Patent 4,169,090. September 25, 1979.
Mustakas, G. C., L. D. Kirk, V. E. Sohns, and E. L. Griffin. "Mustard seed processing: Improved methods for isolating the pungent factor and controlling protein quality." Journal of the American Oil Chemists' Society 42, no. 1 (1965): 33-37.
Naczk, M., L. L. Diosady, and L. J. Rubin. "Functional properties of canola meals produced by two-phase solvent extraction system." Journal of Food Science 50 (1985): 1685-1688.
Naczk, M., R. Amarowicz, A. Sullivan, and F. Shahidi. "Current research developments on polyphenolics of rapeseed/canola: a review." Food Chemistry 62, no. 4 (1998): 489-502.
Nakai, S., and H. W. Modler. Food Proteins: Properties and Characterization. New York: John Wiley & Sons, 1996.
103
Nelson, Gary J. "Isolation and purification of lipids from animal tissues." In Analysis of Lipids and Lipoproteins, by Edward George Perkins, 1-22. Champaign: American Oil Chemists Society, 1975.
Okezie, B. O., and Bello, A. B. “Physicochemical and functional properties of winged bean flour and isolate compared with soy isolate.” Journal of Food Science 53, no. 2 (1998): 450–454
Okubo, K., D. V. Myers, and G. A. Iacobucci. "Binding of phytic acid to glicinin." Cereal
Chemistry 53, no. 4 (1976): 513-524.
Patel, P. D., A. M. Stripp, and J. C. Fry. "Whipping test for the determination of foaming capacity of protein: a collaborative study." International Journal of Food Science and Technology 23 (1988): 57-63.
Pedroche, J., M. M. Yust, H. Lqari, J. Girón-Calle, J. Vioque, F. Millán. "Brassica carinata protein isolates: chemical composition, protein characterization and improvement of functional properties by protein hydrolysis." Food Chemistry 88 (2004): 337-346.
Pokorný, Jan, Anna Kolakowska, and Grzegorz Bienkiewicz. "Analysis of interaction products of oxidized lipids with amino acids, proteins and carbohydrates." In Analysis of lipid oxidation, by Afaf Kamal-Eldin and Jan Pokorný, 263-280. Champaign, Illinois: AOCS Press, 2005.
Prapakornwiriya, Narongechai. Microfiltration based process for the production of mustard protein isolates. Toronto: M. A. Sc. Thesis, Chemical Engineering and Applied Chemistry, University of Toronto, 2002.
Rackis, J. J., R. L. Anderson, H. A. Sesame, A. K. Smith, and C. H. VanEtten. "Soybean Amino Acids, Amino Acids in Soybean Hulls and Oil Meal Fractions." Journal of Agricultural and Food Chemistry 9, no. 5 (1961): 409-412.
Ranjana, Das, Chiranjib Bhattacherjee, and Santinath Ghosh. "Preparation of Mustard (Brassica juncea L.) Protein Isolate and Recovery of Phenolic Compounds by Ultrafiltration." Industrial & Engineering Chemistry Research 48 (2009): 4939-4947.
Reindl, Bertram, and Hans Juergen Stan. "Determination of volatile aldehydes in meat as 2,4-dinitrophenylhydrazones using reversed-phase high-performance liquid chromatography." Journal of Agricultural and Food Chemistry 30, no. 5 (1982): 849-854.
Rhee, K. C., C. M. Cater, and K. F. Mattil. "Simultaneous recovery of protein and oil from raw peanuts in an aqueous system." Journal of Food Science 37 (1972): 90-93.

104
Richert, S. H., C. V. Morr, and C. M. Cooney. "Effect of heat and other factors upon foaming properties of whey protein concentrates." Journal of Food Science 39, no. 1 (1974): 42-48.
Rosenthal, A., D. L. Pyle, and K. Niranjan. "Aqueous and enzymatic processes for edible oil extraction." Enzyme and Microbial Technology 19 (1996): 402-420.
Sarwar, G., J. M. Bell, T. F. Sharby, and J. D. Jones. "Nutritional evaluation of meals and meal fractions derived from rape and mustard seed." Canadian Journal of Animal Science 61 (1981): 719-733.
Sathe, S. K., S. S. Deshpande, and D. K. Salunkhe. "Functional properties of lupin seed proteins and protein concentrates." Journal of Food Science 47 (1982): 491-497.
Shahidi, F., and M. Naczk. "Effects of processing on the content of condensed tannins in rapeseed meals." Journal of Food Science 54, no. 4 (1989): 1082-1083.
Siemens, B. J. Quality of western Canadian mustard 2011. Manitoba: Canadian Grain Commission, 2011.
Siong, H. Tan, Rodney J. Mailer, Christopher L. Blanchard, and Samson O. Agboola. "Canola proteins for human consumption: Extraction, profile and functional properties." Journal of Food Science 76, no. 1 (2011): 16-28.
Sosulski, F. W. "The centrifuge method for determining flour absorption in hard red spring wheats." Cereal Chemistry 39 (1962): 344-349.
Sosulski, F., E. S. Humbert, and K. Bui. "Functional properties of rapeseed flours, concentrate and isolate." Journal of Food Science 41 (1976): 1349-1352.
Spitz, Margaret R., Cherie M. Duphorne, Michelle A. Detry, Patricia C. Pillow, Christopher I. Amos, Mariza de Andrade, Xiangjun Gu, Waun K. Hong, and Xifeng Wu. "Dietary Intake of Isothiocyanates: Evidence of a Joint Effect with Glutathione S-Transferase Polymorphisms in Lung Cancer Risk." Cancer Epidemiology, Biomarkers and Prevention 9 (2000): 1017-1020.
St. Angelo, Allen J., and Robert L. Ory. "Effects of Lipoperoxides on Proteins in Raw and Processed Peanuts." Journal of Agricultural and Food Chemistry 23, no. 2 (1975): 141-146.
Stoewsand, G.S. "Bioactive organosulfur phytochemicals in Brassica oleracea vegetables-A review." Food and Chemical Toxicology 33, no. 6 (1995): 537-543.
105
Subrahmanyan, V., D. S. Bhatia, and S. S. Kalbag. "Integrated processing of peanut for the separation of major constituents." Journal of the American Oil Chemists' Society 36, no. 2 (1959): 66-70.
Taylor, M. J., and T. Richardson. "Antioxdiant activity of skim milk: effect of heat and resultant sulfhydryl groups." Journal of Dairy Science 63, no. 11 (1980): 1783-1795.
Tazi, Sanaa, Floriane Plantevin, Christian Di Falco, Antoine Puigserver, and El Hassan Ajandouz. "Effects of light, temperature and water activity on the kinetics of lipoxidation in almond-based products." Food Chemistry 115 (2009): 958-964.
Thomsen, Marianne K., Lene Lauridsen, Leif H. Skibsted, and Jens Risbo. "Temperature effect on lacotse crystallization, maillard reactions, and lipid oxidation in whole milk powder." Journal of Agricultural and Food Chemistry 53 (2005): 7082-7090.
Tong, L. M., S. Sasaki, D. J. McClements, and E. A. Decker. "Antioxidant activity of whey in a salmon oil emulsion." Journal of Food Science 65, no. 8 (2000): 1325-1329.
Tzen, Jason T. C., Yi-zhi Cao, Pascual Laurent, Chandra Ratnayake, and Anthony H. C. Huang. "Lipids, proteins, and structure of seed oil bodies from diverse species." Plant Physiology 101 (1993): 267-276.
VanEtten, C. H., W. F. Kwolek, J. E. Peters, and A. S. Barclay. "Plant seeds as protein sources for food or feed. Evaluation based on amino acid composition of 379 species." Journal of Agricultural and Food Chemistry 15, no. 6 (1967): 1077-1089.
Wanasundara, J. P. D. "Proteins of Brassicaceae Oilseeds and their potential as a plant protein source." Critical Reviews in Food Science and Nutrition 51 (2011): 635-677.
Ward, J. A. "Pre-pressing of oil from rapeseed and sunflower." Journal of the American Oil Chemists' Society 61, no. 8 (1984): 1358-1361.
WHO/FAO. Protein and amino acid requirements in human nutrition. Singapore: World Health Organization, 2007.
Wolff, J. P. "Residual hexane in meals." Journal of American Oil Chemists' Society 60, no. 2 (1983): 220-223.
Xu, L., and L. L. Diosady. "Removal of phenolic compounds in the production of high-quality canola protein isolates." Food Research International 35 (2002): 23-30.
Xu, L., F. Lui, H. Luo, and L. L. Diosady. "Production of protein isolates from yellow mustard meals by membrane processes." Food Research International 36 (2003): 849-856.
106
Xu, Lei., and L. L. Diosady. "Functional properties of Chinese rapeseed protein isolates." Journal of Food Science 50, no. 5 (1994): 1127-1130.
Yasumatsu, Katsuharu, Koshichi Sawada, Shintaro Moritaka, Masaru Misaki, Jun Toda, Takeo Wada, and Kiyofumi Ishii. "Whipping and emulsifying properties of soybean products." Agricultural and Biological Chemistry 36 (1972): 719-727.
Yumiko, Yoshie-Stark, Yoshiko Wada, and Andreas Wäsche. "Chemical composition, functional properties, and bioactivities of rapeseed protein isolates." Food Chemistry 107 (2008): 32-39.
Zohary, D., and M. Hopf. Domestication of plants in the Old World: The origin and spread of Cultivated plants in west Asia, Europe and the Nile valley. New York: Oxford University Press, 2000.
Zrybko, Carol L, Elaine K. Fuduka, and Robert T. Rosen. "Determination of glucosinolates in domestic and wild mustard by high-performance liquid chromatography with confirmation by electrospray mass spectrometry and photodiode-array detection." Journal of Chromatography A 767, no. 2 (1997): 43-52.
Zukalová, H., and J. Vasák. "The role and effects of glucosinolates of Brassica species - a review." ROSTLINNÁ VÝROBA 48, no. 4 (2002): 175-180.

107
9. APPENDICES
108
APPENDIX A
Analytical Methods

109
A1. Determination of oil content using the Mojonnier Method
All measurements were performed in triplicate. For all analysis, corks were soaked in water for
at least 1 hour.
AOAC Method 922.06. Fat in flour by acid hydrolysis
This method was used for solid samples.
1. Weigh 2 g of sample (to nearest 0.1mg) in 50 ml beaker.
2. Add 2 ml ethanol and stir to moisten particles to prevent lumping on addition of acid.
3. Add 10 ml HCl (25+11), mix well, set beaker in water bath held at 70-80ºC stirring in
frequent intervals during 30-40 min.
4. Add 10 ml ethanol and cool to room temperature.
5. Weigh 4 150 ml beakers to nearest 0.1 mg.
6. Transfer the mixture to a mojonnier flask. Rinse beaker into extraction flask with 25 ml
diethyl ether added in 3 portions, stopper flask (cork stopper) and shake vigorously for 1
min.
7. Add 25 ml petroleum ether and shake for 1 min.
8. Let stand until upper liquid is practically clear. Draw off as much possible of ether-lipid
solution through a filter consisting of cotton ball packed just firmly enough in the funnel
stem to let ether pass freely into a previously weighed 150 ml beaker.
9. Re-extract liquid remaining in flask twice, each time with only 15 ml of each ether.
Shake well on addition of each ether and draw off the ether solution into same beaker.
Wash tip of funnel and end of funnel with few ml of mixture of ethers in equal volumes.

110
10. Evaporate ethers inside a fume hood, and then dry the lipids in an oven at 90ºC for 90
min.
11. Remove beaker from oven, let cool down and weight.
12. Run a blank using only reagents for each set of experiments
13. Calculation
𝐿 = �𝑊1 −𝑊0 −𝑊𝐵
𝑊𝑆�100
Where: L is the lipid percentage in the sample, W1 is the weight of the beaker containing the
lipids, W0 is the weight of the empty beaker, WB is the weight of the blank and WS is the weight
of the sample.
AOAC Method 995.19. Fat in cream
This method was used for emulsion samples.
1. Place test sample in a water bath at 38.0 ± 1ºC. Mix thoroughly and weight aliquot
immediately. Do not let samples remain in water bath more than 15 min after reaching
38ºC.
2. Weight an empty mojonnier flask.
3. Pipet into flask enough cream to yield 0.3-0.6g of extracted fat (0.8g of 60% emulsion)
and weight to the nearest 0.01 g.
4. Dilute test portion with 10 ml distilled water at room temperature.
5. Weigh 4 150 ml beakers to the nearest 0.1 mg.

111
6. To test portions in the mojonnier flask add 1.5 ml NH4OH and mix thoroughly. It
neutralizes any acid present.
7. Add 3 drops of phenolphthalein indicator to sharpen visual appearance of interface.
8. Add 10ml ethanol, stopper with water-soaked cork and shake vigorously 15 s.
9. For first extraction add 25 ml diethyl ether, stopper with cork and shake for 1 min. Hold
body of flask horizontally with lower bulb and stopper up.
10. Loosen cork gently to release built-up pressure. Add 25 ml petroleum ether, shake for 1
min.
11. Let stand until ether phase and the pink aqueous phase are separated and transfer ether-
lipid solution to weighed beaker.
12. For second extraction add 5 ml ethanol, stopper with same cork used for first extraction
and shake 15 s.
13. Add 15 ml diethyl ether, replace cork and shake 1 min.
14. Add 15 ml petroleum ether, stopper with same cork and shake 1 min.
15. Let phases separate. If interface is below neck of flask, add water to bring level half way
up neck. Add water slowly to cause minimum disturbance of separation. Decant ether
solution into same beaker used for first extraction.
16. For third extraction omit addition of ethanol and repeat procedure for second extraction.
17. Evaporate solvents in the fume hood. Dry extracted lipids at 90ºC for 90min
18. Remove beaker from oven and place them in a desiccator. Cool down and weigh.
19. Run 1 blank with reagents and substitute emulsion with 10 ml distilled water. Reagent
blank should be < 0.0020g residue
20. Calculation:

112
𝐿 = �𝑊1 −𝑊0 −𝑊𝐵
𝑊𝑆�100
Where: L is the lipid percentage in the sample, W1 is the weight of the beaker and flask, W0 is the
weight of the empty beaker, WB is the weight of the blank and WS is the weight of the sample.

113
A2. Moisture Analysis (AACC Method 44-15A)
1. Record the weight of an aluminum tray.
2. Weight the sample in the tray and record the data.
3. Cover the plate with a sheet of aluminum foil and punch several small holes on the foil.
4. Put the sample in an oven at 105°C for 24 hours.
5. Remove samples from oven. Cool in a desiccator and record weight.
6. Calculate the moisture content using the following equation:
𝑚 = �𝑊2 −𝑊0
𝑊1�100
Where m is the percent moisture content, W2 is the weight of the dry sample and the tray, W0 is
the weight of the tray and W1 is the weight of the initial sample.

114
A3. Protein Analysis (Kjeldahl Method, AOCS method Ba 4d-90)
1. For solid samples weight ~0.2 g of each sample on a nitrogen free paper or for liquid
samples weight 5-30 g into each digestion tube.
2. For solid samples place a clean nitrogen free paper in the blank tube or for liquid samples
weight 5-30 g of distilled water in the blank tube.
3. Add 4 Kjeldahl Tablets (3.5g K2SO4, 0.175 HgO per Tablet) and 25 ml concentrated
H2SO4 to each tube.
4. Clamp the suction manifold onto the digestion tubes. Insert the suction tube into the end
of the manifold and a tuft of glass wool into the other to allow air passage through the
manifold. Turn on the tap water of the aspirator.
5. Place the connected tubes onto the Digestion unit. Heat the tubes at setting 4 for 20
minutes or until the foam subsides. Raise the temperature to setting 6 for 10 minutes or
until the foam subsides and the air in the tubes show mist. Then turn the setting up to 10
and digest for 35 minutes ensuring that the walls of the glass are clean and that the
solution is colourless or very pale yellow for at least 30 minutes before taking off the
heat.
6. Remove the tubes from the digester and place in a rack with the suction continuing until
the solution is cool (~ 30 minutes). Then remove the suction tube and place the rack in a
fume hood to finish cooling.
7. Remove the glass manifold. Rinse the manifold with water and leave it aside to air dry.

115
8. Add 50 ml of distilled water to each tube and swirl until the precipitate is dissolved. Then
add 25 ml of sodium thiosulfate solution (8% Na2S2O3·5H2O) to each tube and swirl.
Cover the tubes and cool before proceeding with the distillation procedure.
9. For the distillation, turn on the Büchi Distillation Unit K-350 and the cooling water line.
Wait until the equipment warms up.
10. Label 4 500 ml Erlenmeyer flasks (one per sample and one blank). Add 60 ml of 4%
(w/v) boric acid and three drops of N-point indicator to each flask.
11. When the machine is ready, rinse for 2 minutes using distilled water in a clean tube.
12. Replace the water tube with the blank tube. Place the blank labeled Erlenmeyer flask in
the distillate outlet of the unit. Make sure the outlet tube is as far below the surface of
boric acid solution as possible.
14. Add 90 ml of 32% NaOH solution by pressing the reagent button or until the total
solution volume is around 180 ml.
15. Set the distillation time to 5 minutes and start the distillation.
16. When the instrument is finished replace the current tube with the next sample tube.
Replace the current Erlenmeyer flask (rinse off any liquid from the straw into the flask
using distilled water) with the corresponding sample flask in the distillate outlet.
17. Repeat steps 14 to 16 for the remaining samples.
18. Titrate the boric acid solutions in the Erlenmeyer flasks with 0.1000N H2SO4 from green
to the same shade of pink as that in the blank.
19. Calculate the protein content of the sample using the following equations:
𝐻𝑁 =(𝑉1 − 𝑉0)(1.4007)(𝑁)
𝑊
𝑃 = (𝐻𝑁)6.25

116
Where: V1 is the volume (ml) of titrant used for the sample, V0 is the volume (ml) of titrant used
for the blank, N is the acid normality used for titration, W is the sample weight (grams), SN is the
percent nitrogen in the sample and P is the percent protein in the sample.
Note: Oilseed protein is assumed to have 16% nitrogen, thus the factor 6.25 is the reciprocal of
16%.

117
A4. Nitrogen Solubility Index (NSI) (AOCS Official Method Ba 11-65 or AACC Method
46-23 )
1. Accurately weigh 5.0 g of the sample into a 500 ml beaker. Measure 200 ml of distilled
water at 30°C. Add a small portion of the water at a time and disperse it thoroughly with
a stirring rod. Stir in the remainder of the water, using the last of it to wash off the
stirring rod.
2. Stir the mixture at 120 rpm with the mechanical stirrer for 120 min in a water bath at
30°C.
3. Transfer the mixture to a 250 ml volumetric flask by carefully washing out the contents
of the beaker into the flask. Add 1 or 2 drops of antifoam, dilute to mark with distilled
water and mix the contents of the flask thoroughly.
4. Allow to stand for a few minutes and decant off about 40 ml into a 50 ml centrifuge tube.
Centrifuge at 1500 rpm for 10 min and decant the supernatant through a funnel
containing a plug of glass fiber. Collect the clear filtrate in a 100 ml beaker.
5. Pipet 5 -30 ml of the clear liquid into a Kjeldahl tube.
6. Determine total nitrogen in the sample using standard protein analysis.
7. Calculate the water soluble nitrogen percentage (WSN):
𝑊𝐻𝑁 =(𝑉1 − 𝑉0)(𝑁)(1.4007)(6.25)
𝑊
Where V1 is the volume of acid used for titration of the sample, V0 is the volume of acid used for
titration of the blank, N is the normality of the acid used for the titration and:
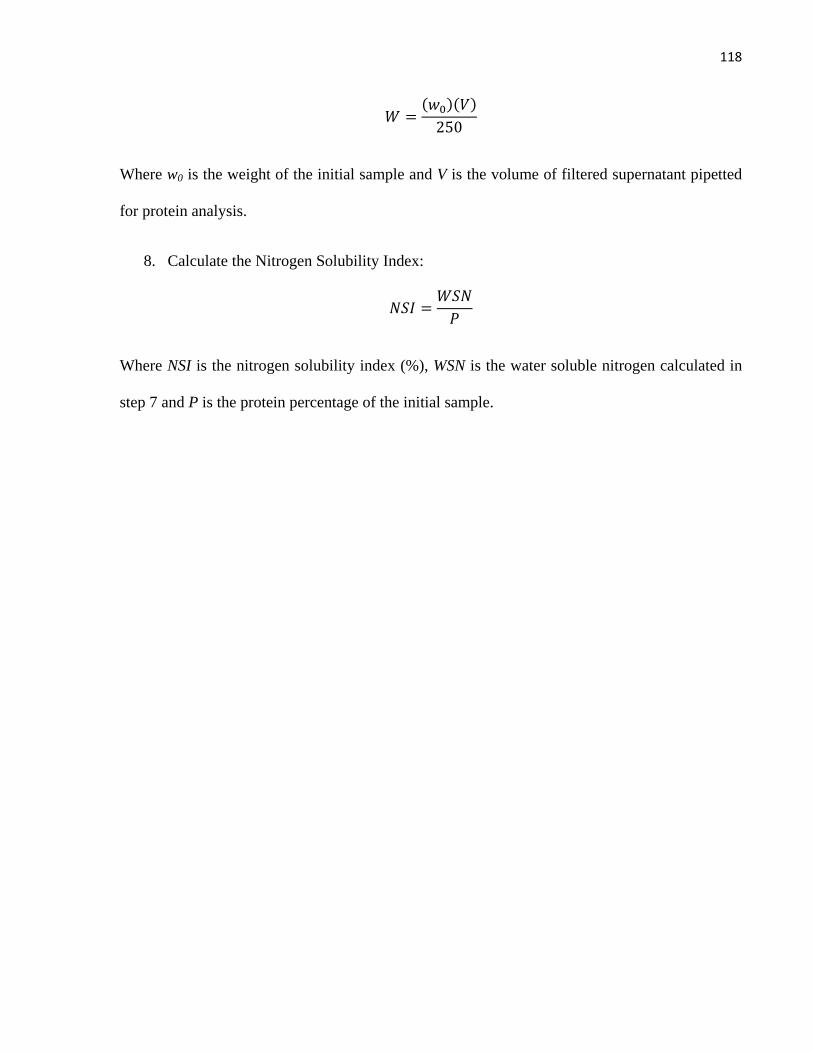
118
𝑊 =(𝑀0)(𝑉)
250
Where w0 is the weight of the initial sample and V is the volume of filtered supernatant pipetted
for protein analysis.
8. Calculate the Nitrogen Solubility Index:
𝑁𝐻𝐼 =𝑊𝐻𝑁𝑃
Where NSI is the nitrogen solubility index (%), WSN is the water soluble nitrogen calculated in
step 7 and P is the protein percentage of the initial sample.

119
A5. Oil absorption capacity (Sosulski et al, 1976)
1. Accurately weigh 2.0 g of sample in a 50 ml centrifuge tube.
2. Add 12 ml of canola seed oil.
3. Stir the sample for 30 seconds using a stirring rod every 5 min.
4. Repeat the stirring procedure 6 times.
5. Centrifuge at 1600 x g for 25 min.
6. Carefully decant the supernatant oil right after centrifugation.
7. Weight the tube immediately after decanting.
8. Calculate the oil absorption capacity:
𝑂𝐴𝐶 = �𝑊𝑓
𝑊𝑖�100
Where OAC is the oil absorption capacity (%), Wf is the final weight of the sample after oil
decanting and Wi is the initial weight of the sample.

120
A6. Water absorption capacity (Naczk et al, 1985)
1. Accurately weigh 2.0 g of sample in a 50 ml centrifuge tube.
2. Add 16 ml of distilled water.
3. Stir the sample for 30 s every 10 min using a stirring rod.
4. Repeat the stirring procedure 7 times.
5. Centrifuge at 2000 x g for 15 min.
6. Carefully decant the supernatant right after centrifugation.
7. Tilt the tube 15º to 20º mouth down for 15 minutes.
8. Weight the tube immediately.
9. Calculate the water absorption capacity:
𝑊𝐴𝐶 = �𝑊𝑓
𝑊𝑖�100
Where WAC is the water absorption capacity (%), Wf is the final weight of the sample after water
decanting and Wi is the initial weight of the sample.

121
A7. Emulsifying Activity (EA) (Yasumatsu et al, 1972 and Naczk et al, 1985)
1. Suspend 3.5 g of sample with 50 ml distilled water in a 400 ml beaker using a spatula or
stirring rod.
2. Add 25 ml of canola seed oil and homogenize/emulsify for 30 sec.
3. Add 25 ml of canola seed oil and homogenize/emulsify for an additional 90 sec.
4. The emulsion obtained is divided evenly into 50ml centrifuge tubes and centrifuged at
2000 rpm for 5 minutes.
5. Calculate the emulsifying activity using the equation:
𝐸𝐴 = �𝑉1𝑉0�100
Where: EA is the emulsifying activity (%), V1 is the volume of emulsion formed, and V0 is the
volume of the total tube contents.

122
A8. Emulsion Stability (ES) (Naczk et al, 1985)
1. Suspend 3.5g of sample in 50ml distilled water in a 400 ml beaker using a spatula or
stirring rod.
2. Add 25 ml of canola seed oil and homogenize/emulsify for 30 sec.
3. Add 25 ml of canola seed oil and homogenize/emulsify for an additional 90 sec.
4. The emulsion obtained is heated in an 85°C water bath for 15 minutes, covering the
beaker with foil to avoid water loss. Slow stirring is applied during heating.
5. After heating and cooling, divide evenly into 50ml centrifuge tubes and centrifuge at
2000 rpm for 5 minutes.
6. Calculate the emulsifying activity of the heated emulsion:
𝐸𝐴 = �𝑉1𝑉0�100
Where: EA is the emulsifying activity (%), V1 is the volume of emulsion formed, and V0 is the
volume of the total tube contents.
7. Calculate the emulsion stability:
𝐸𝐻 = �𝐸𝐴1𝐸𝐴0
�
Where: ES is the emulsion stability (%), EA1 is the emulsifying activity after the heating
treatment and EA0 is the emulsifying activity before the heating treatment.

123
A9. Foam expansion and foam stability (Naczk et al. 1985 and Patel et al. 1988)
1. Disperse 3.0 g of sample in 100ml of distilled water with a spatula.
2. Whip the suspension using a homogenizer at 10,000 rpm for 6 minutes.
3. Immediately transfer the contents into a 250 ml graduated cylinder (or the best suitable
volume according to the foam volume formed) and record the volume increase.
4. Record the foam volume in the standing cylinder at 0.5, 20, 40, 60 and 120 minutes after
whipping.
5. Calculate the foam expansion (%) as follows:
𝐹𝐸 = �𝑉1 − 𝑉0𝑉0
�100
Where FE is the foam expansion (%), V1 is the volume of the foam plus the liquid just after
whipping and V0 is the initial volume of the dispersion.
6. Calculate the foam volume stability (%) at 20, 30, 40, 60 and 120 minutes using the
following formula:
𝐹𝑉𝐻 = �𝑉𝑡𝑉0�100
Where FVS is the foam volume stability (%), Vt is the foam volume at time t and V0 is the initial
volume of the dispersion.

124
A10. AOCS method Cd 19-90. 2-Thiobarbituric acid value. Direct method.
1. Accurately weigh 50-200 mg of the sample into a 25 ml volumetric flask. Dissolve the
sample in a small volume of 1-butanol and make up the volume with 1-butanol.
2. Transfer, using a pipette, 5.0 ml of the sample solution to a dry test tube; add by pipette
5.0 ml of the TBA reagent solution (200 mg 2-thiobarbituric in 100 ml 1-butanol). Close
the test tube with a ground-glass stopper and mix thoroughly.
3. Place the prepared test tube into a thermostated bath at 95°C.
4. After 120 min., remove the test tube from the bath and cool it under running tap water for
about 10 minutes until it reaches room temperature.
5. Measure the absorbance of the reaction solution in a 10 mm cuvette at 530 nm using
distilled water in the reference cuvette.
6. Prepare a reagent blank at the same time as the sample. The reading of the blank
determination should not exceed 0.1 in a 10 mm cuvette.
CALCULATION
Results are calculated as follows:
𝑇𝐵𝐴 𝑣𝑎𝑙𝑢𝑒 = 50 × (𝐴 − 𝐵)
𝑚
Where A is the absorbance of the test solution, B is the absorbance of the reagent blank and m is
the mass of the test portion in mg.

125
A11. Least gelation concentration (LGC) (Moure et al. 2002)
1. Prepare 2, 4, 6, 8, 10, 12 and 14% (w/v) dispersions of the sample in 50 ml of distilled
water.
2. Adjust the pH of the dispersion to a value of 7.0 ± 0.05 by the drop wise addition of 1 N
NaOH solution, or 1 N HCl solution.
3. After the pH value is reached, mix the dispersion for another 3 to 5 min.
4. Take a 5ml aliquot of each dispersion and pour it in clean and dry glass test tube.
5. Heat the test tubes with the samples for 1 h in a water bath at 95 – 100°C.
6. After the heating treatment, immediately cool the tubes under running tap water for 10
minutes.
7. Place the tubes in a refrigerator at 4°C for an additional 2 h.
8. Take the samples out the refrigerator and find the LGC.
9. The LGC is the concentration above which the sample remains in the bottom of the
inverted tube.

126
A12. Sodium dodecyl sulfate polyacrylamide gel electrophoresis
1. Prepare a protein solution with the initial sample in distilled water with a target
concentration between 4.8 and 5.6 mg of protein per ml (pH adjustment might be
necessary to ensure complete dissolution of the sample). Prepare the solution
immediately before the analysis.
2. Add 20 µl of the sample solution in a 0.5 ml centrifuge tube with lid.
3. Add 10 µl of sample buffer (containing 62.5 mM Tris-HCl, 25% glycerol, 2% SDS and
0.01% bromophenol blue) for non-reduced condition analysis.
4. Add 9.5 µl of sample buffer and 0.5 µl of β-mercaptoethanol for reduced condition
analysis.
5. Close the tube lid and heat the sample for 10 min at 95°C.
6. Immediately after heating, centrifuge the sample for 10 s at 14000 rpm.
7. Take a suitable already made or purchased Tris-HCl gel and insert the gel cassette into
the cassette holder assembly with the short plastic plate facing inwards.
8. Insert the assembly into the cell and fill it up with running buffer (0.1% SDS, 0.3% tris,
1.44% glycine).
9. Using a micropipette, inject 14 µl of the previously heated and centrifuged samples in
each well.
10. Inject a suitable amount of prestained protein ladder solution in another well(s).
11. Close the cell with the appropriate lid, being careful to align and connect the positive and
negative electrodes correctly.
127
12. Connect the cell to the power supply and run the samples at a constant voltage of 130 V
until they reach the bottom of the gel.
13. Turn off the power supply, disconnect and disassemble the cell lid and the cassette
holder. Take out the gel cassette and open it carefully by separating the two plates.
Gently nudge the gel off one corner of the plate and allow it to roll off into an awaiting
staining solution (40% methanol, 10% acetic acid and 0.1% Coomassie blue R-250). Let
stand for 30 min on a shaking platform.
14. After the staining period, destain the gel by immersion in a 40% methanol, 10% acetic
acid solution on a shaking platform. Change the destaining solution as often as necessary
until the background is clear, usually 2 to 3 times. Destaining takes 2 to 3 hours.

128
APPENDIX B
Results

129
B1. Yellow mustard flour analyses
Protein content AS IS
Sample Weight (g) SO4H2 0.1 N (ml) Nitrogen content
(%) 1 0.2963 10.60 31.30 2 0.3083 10.95 31.08 3 0.2933 10.50 31.32 4 0.2829 10.15 31.40 5 0.3122 11.15 31.25 6 0.3324 11.80 31.06
Average 31.24
SD 0.14
Oil content AS IS Sample Weight (g) Oil (g) Oil content (%)
1 1.5032 0.5505 36.62% 2 1.4391 0.5310 36.90% 3 1.9833 0.7297 36.79% 4 1.5565 0.5708 36.67% 5 1.6785 0.6194 36.90% 6 1.9865 0.7305 36.77%
Average 36.78%
SD 0.11
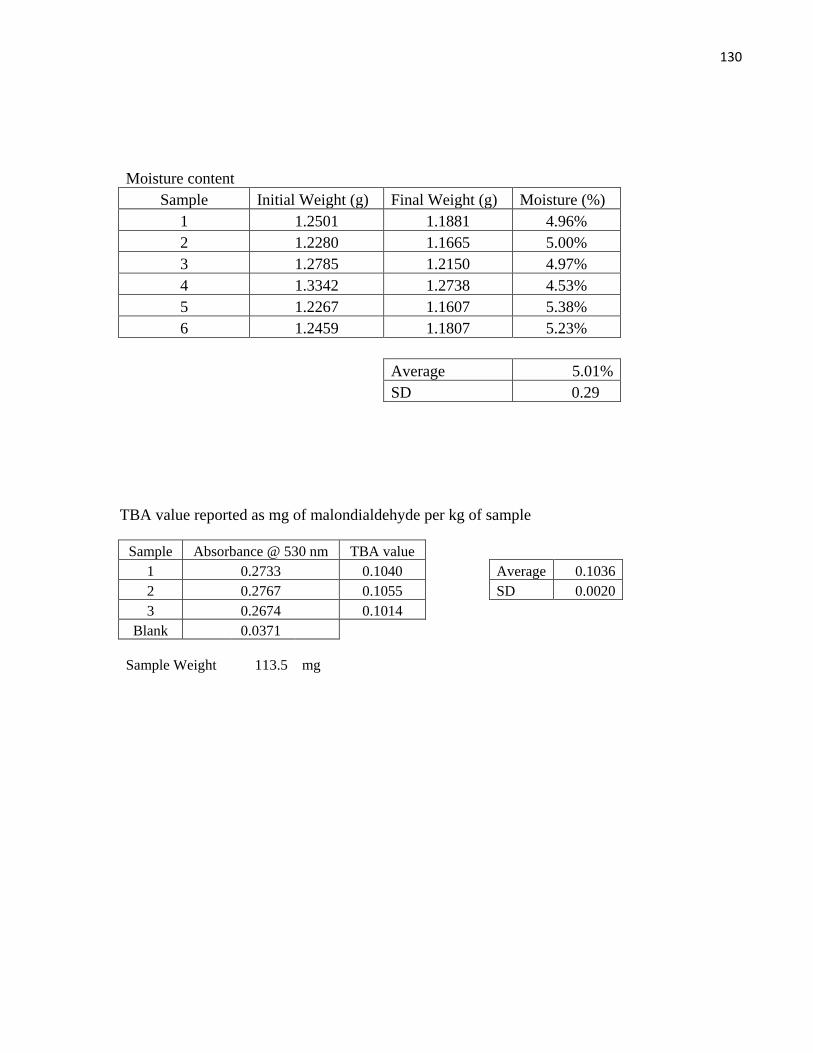
130
Moisture content
Sample Initial Weight (g) Final Weight (g) Moisture (%) 1 1.2501 1.1881 4.96% 2 1.2280 1.1665 5.00% 3 1.2785 1.2150 4.97% 4 1.3342 1.2738 4.53% 5 1.2267 1.1607 5.38% 6 1.2459 1.1807 5.23%
Average 5.01%
SD 0.29
TBA value reported as mg of malondialdehyde per kg of sample
Sample Absorbance @ 530 nm TBA value 1 0.2733 0.1040
Average 0.1036 2 0.2767 0.1055
SD 0.0020
3 0.2674 0.1014 Blank 0.0371
Sample Weight 113.5 mg
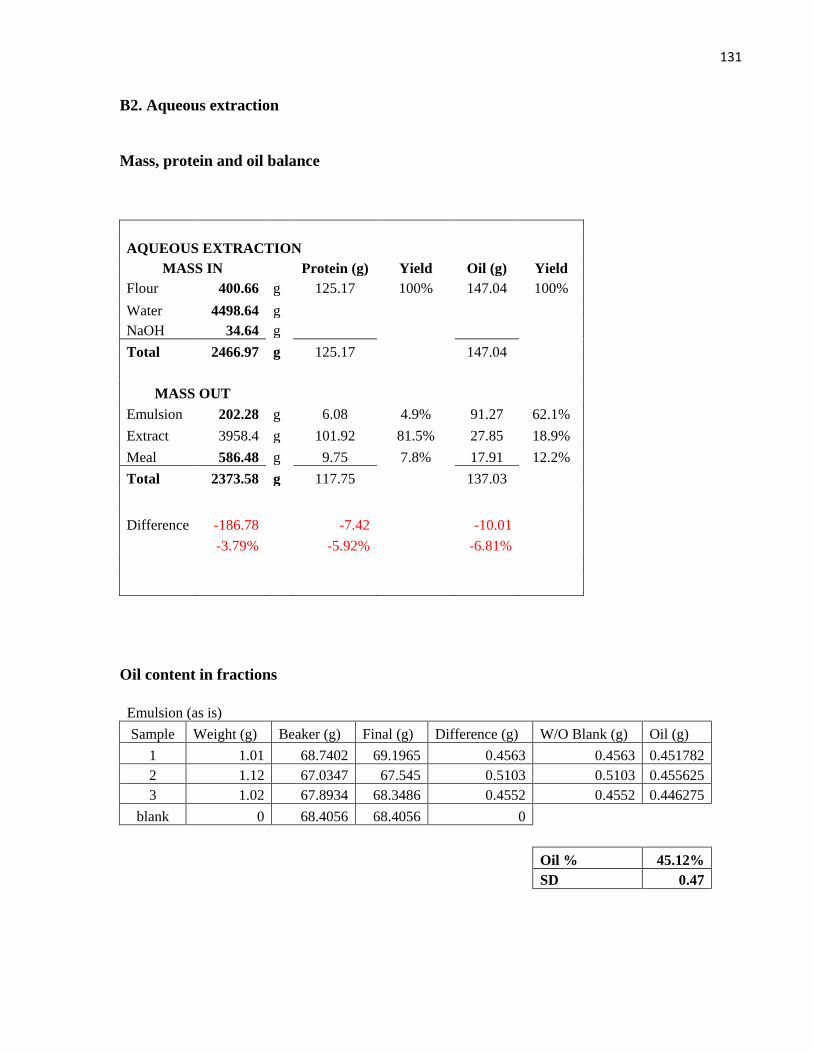
131
B2. Aqueous extraction
Mass, protein and oil balance
AQUEOUS EXTRACTION
MASS IN Protein (g) Yield Oil (g) Yield Flour 400.66 g 125.17 100% 147.04 100% Water 4498.64 g NaOH 34.64 g Total 2466.97 g 125.17 147.04
MASS OUT Emulsion 202.28 g 6.08 4.9% 91.27 62.1% Extract 3958.4 g 101.92 81.5% 27.85 18.9% Meal 586.48 g 9.75 7.8% 17.91 12.2% Total 2373.58 g 117.75 137.03
Difference -186.78 -7.42 -10.01 -3.79% -5.92% -6.81%
Oil content in fractions
Emulsion (as is) Sample Weight (g) Beaker (g) Final (g) Difference (g) W/O Blank (g) Oil (g)
1 1.01 68.7402 69.1965 0.4563 0.4563 0.451782 2 1.12 67.0347 67.545 0.5103 0.5103 0.455625 3 1.02 67.8934 68.3486 0.4552 0.4552 0.446275
blank 0 68.4056 68.4056 0 Oil % 45.12% SD 0.47
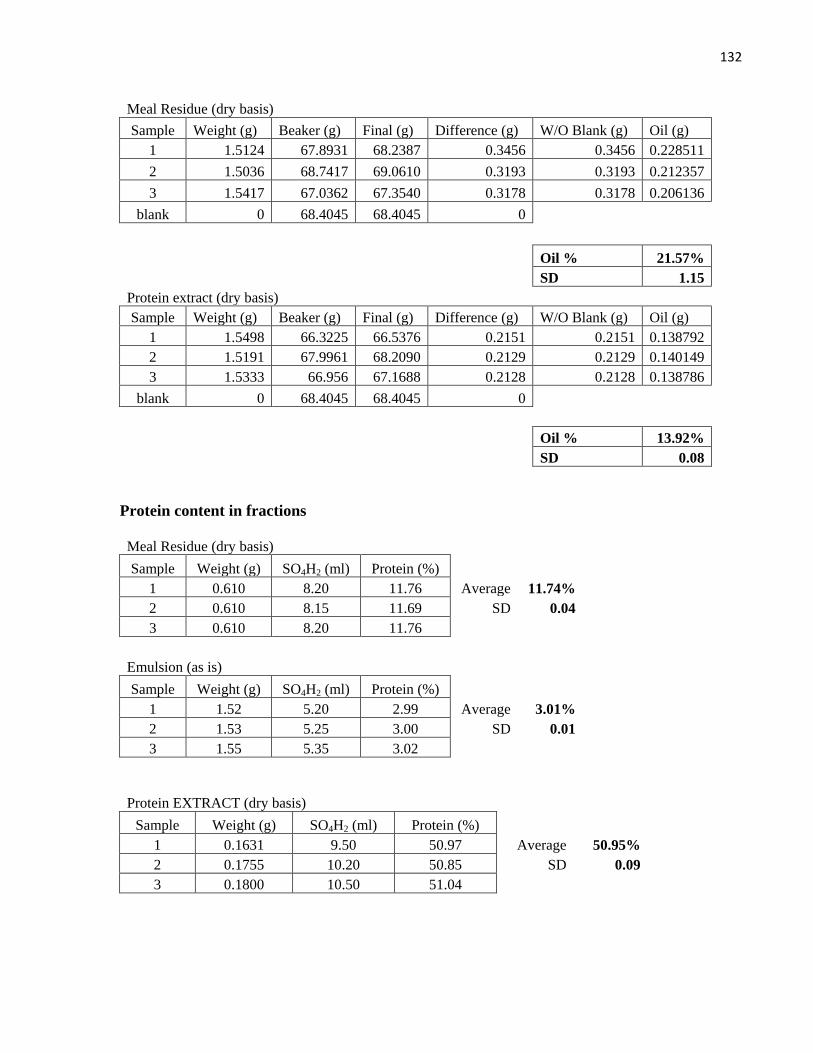
132
Meal Residue (dry basis) Sample Weight (g) Beaker (g) Final (g) Difference (g) W/O Blank (g) Oil (g)
1 1.5124 67.8931 68.2387 0.3456 0.3456 0.228511 2 1.5036 68.7417 69.0610 0.3193 0.3193 0.212357 3 1.5417 67.0362 67.3540 0.3178 0.3178 0.206136
blank 0 68.4045 68.4045 0 Oil % 21.57% SD 1.15 Protein extract (dry basis) Sample Weight (g) Beaker (g) Final (g) Difference (g) W/O Blank (g) Oil (g)
1 1.5498 66.3225 66.5376 0.2151 0.2151 0.138792 2 1.5191 67.9961 68.2090 0.2129 0.2129 0.140149 3 1.5333 66.956 67.1688 0.2128 0.2128 0.138786
blank 0 68.4045 68.4045 0 Oil % 13.92% SD 0.08
Protein content in fractions
Meal Residue (dry basis) Sample Weight (g) SO4H2 (ml) Protein (%)
1 0.610 8.20 11.76 Average 11.74% 2 0.610 8.15 11.69 SD 0.04
3 0.610 8.20 11.76
Emulsion (as is) Sample Weight (g) SO4H2 (ml) Protein (%)
1 1.52 5.20 2.99 Average 3.01% 2 1.53 5.25 3.00 SD 0.01
3 1.55 5.35 3.02
Protein EXTRACT (dry basis) Sample Weight (g) SO4H2 (ml) Protein (%)
1 0.1631 9.50 50.97 Average 50.95% 2 0.1755 10.20 50.85 SD 0.09 3 0.1800 10.50 51.04

133
Aqueous extraction. Final Batches
Run Flour
(g) Total water
(g) NaOH
Soln.(g) Asc. Acid
(g) Extract
(g) Emulsion
(g) Residue
(g) 11 400.93 4531.90 35.65 4.00 4056.82 152.05 579.70 12 400.10 4525.20 34.42 4.10 4044.19 172.86 570.80 13 400.90 4537.00 35.36 4.02 4083.84 175.69 570.00 14 401.80 4547.00 37.58 4.04 4096.15 179.37 575.60 15 400.60 4525.00 36.11 4.04 4051.66 173.85 575.60 16 401.30 4524.00 34.01 4.02 4054.76 191.64 578.00 17 401.90 4528.00 35.33 4.04 4086.80 185.31 575.90

134
B3. Membrane processing and isoelectric precipitation
Mass, protein and oil balance
MEMBRANE PROCESS MASS IN Protein (g) Yield Oil (g)
Extract 4048.7 g 101.4 80.8% 27.6 18.9% Water 7662.0 g 0 0 NaCl 34.2 g 0 0
Total 11744.9 g 101.4 27.6
MASS OUT Permeate 10770.0 g 14.1 11.2% N.D. Retentate 957.2 g 83.3 66.5% N.D.
Total 11727.2 g 97.4
Difference -17.70 -4.02 -0.2% -3.96%
ISOELECTRIC PRECIPITATION MASS IN Protein (g) Yield Oil (g) Yield
Retentate 957.2 g 83.3 N.D. PO4H3 14.5 g 0 0 Water 2216.8 g 0 0 Total 3188.5 g 83.3 MASS OUT PPI 318.8 g 68.7 54.9% 24.5 16.6% SPI 2817.0 g 14.0 11.2% 0.09 0.1% Total 3135.8 g 82.7
Difference -52.7 -0.6 -1.65% -0.73%

135
Protein content in fractions
Final Retentate (as is) Sample Weight (g) SO4H2 (ml) Protein (%)
1 1.02 10.4 8.92 Average 8.74% 2 0.84 8.6 8.96 SD 0.35 3 1.47 14.0 8.33
Total permeate (as is)
Sample Weight (g) SO4H2 (ml) Protein (%) 1 10.03 1.5 0.131 Average 0.13% 2 10.12 1.6 0.138 SD 0.00 3 10.59 1.6 0.132
Membrane processing: final batches
Ultrafiltration and diafiltration of the initial protein solution
Run Extract
(g) After Filt.
(g) Water
(g) NaCl (g)
DF Soln. (g)
Retentate (g)
UF Permeate (g)
Tot. permeate
(g) 11 4056.82 4035.00 2325.00 18.58 5403.00 951.55 5413.00 10816.00 12 4044.19 4030.40 2322.30 18.56 5345.00 969.78 5402.00 10747.00 13 4083.84 4063.50 2341.40 18.72 5350.00 969.10 5455.00 10805.00 14 4096.15 4085.20 2353.90 18.82 5350.00 948.91 5509.00 10859.00 15 4051.66 4040.00 2327.80 18.61 5350.00 955.75 5431.00 10781.00 16 4054.76 4023.70 2318.50 18.53 5250.00 949.69 5411.00 10661.00 17 4086.84 4062.80 2341.00 18.71 5250.00 955.50 5467.00 10717.00
Isoelectric precipitation
Run PO4H3 (g) Water (g) PPI wet (g) Total SPI (g) 11 15.00 2147.23 303.03 2778.3 12 13.07 2088.00 290.00 2625.0 13 12.50 2196.00 313.53 2682.4 14 15.89 2046.00 313.53 2710.9 15 14.72 2314.80 319.49 2953.8 16 14.72 2337.17 356.38 2945.2 17 15.46 2388.23 335.89 3023.3

136
Ultrafiltration and diafiltration parameters for the acid soluble protein solution A
Run SPI1 (g) Ret1 (g) CF1 Water1 (g) DV1 permeate1 (g) 11 661.8 275.8 2.4 1551.0 5.6 386.0 12 597.4 270.2 2.2 1500.0 5.6 327.2 13 553.5 269.8 2.1 1500.0 5.6 283.7 14 591.3 271.3 2.2 1500.0 5.5 320.0 15 631.5 271.5 2.3 1500.0 5.5 360.0 16 709.5 269.5 2.6 1500.0 5.6 440.0 17 678.0 270.0 2.5 1500.0 5.6 408.0
Ultrafiltration and diafiltration parameters for the acid soluble protein solution B
Run SPI2 (g) Ret2 (g) CF2 Water2 (g) DV2 permeate2 (g) 11 2116.5 350.0 6.0 1900.0 5.4 1766.5 12 2027.6 297.6 6.8 1640.0 5.5 1730.0 13 2128.9 270.9 7.9 1500.0 5.5 1858.0 14 2119.6 269.6 7.9 1500.0 5.6 1850.0 15 2322.3 272.3 8.5 1500.0 5.5 2050.0 16 2235.7 270.7 8.3 1500.0 5.5 1965.0 17 2345.3 270.3 8.7 1500.0 5.5 2075.0
Overall fluxes, concentration factors and diafiltration volumes
Run
11 12 13 14 15 16 17
CF (In. Extract) 6.7 6.3 6.4 6.6 6.4 6.5 6.5 Flux (Lmh) 12.03 18.50 17.21 17.66 20.34 16.65 18.22 DV (In. Extract) 5.7 5.5 5.5 5.6 5.6 5.5 5.5 Flux (Lmh) 9.00 15.27 13.38 13.38 15.29 13.93 14.79 CF (SPI) 4.4 4.8 4.9 5 5.5 5.45 5.6 Flux (Lmh) 20.80 21.70 20.80 14.80 13.40 18.00 19.40 DV (SPI) 5.7 5.6 5.6 5.6 5.6 5.55 5.55 Flux (Lmh) 8.90 10.20 7.50 6.80 6.10 7.30 7.10

137
Isolate recovery in grams:
Run
11 12 13 14 15 16 17
Precipitated PI 95.70 97.10 97.48 98.98 98.68 96.28 98.02 Acid soluble PI 16.10 17.40 17.90 16.59 17.10 17.64 16.88

138
B4. Protein isolates analyses
Protein PPI Sample Weight (g) SO4H2 (ml) Protein (%)
1 0.1527 12.1 69.34 Average 70.43% 2 0.1539 12.45 70.78 SD 0.97
3 0.1512 12.3 71.18
Protein acid sol. isolate
Sample Weight (g) SO4H2 (ml) Protein (%) 1 0.1529 14.45 82.69 Average 81.88%
2 0.1465 13.7 81.83 SD 0.79 3 0.1494 13.85 81.12
Oil Content in PPI
Sample Weight (g) Beaker (g) Final (g) Difference W/O Blank Oil 1 1.5394 65.4964 65.8850 0.3886 0.3886 0.2524 2 1.5792 68.7421 69.1430 0.4009 0.4009 0.2538 3 1.7846 67.9955 68.4365 0.441 0.441 0.2471
blank 0 68.4045 68.4045 0
Oil % 25.11% SD 0.36
Oil Content in acid soluble isolate
Sample Weight Beaker Final Difference W/O Blank Oil 1 2.0113 67.7747 67.7844 0.0097 0.0097 0.0048
blank 0 68.4045 68.4045 0
Oil % 0.48%

139
Moisture determination
PPI Sample Dish Initial final Moisture
1 2.0952 1.0155 0.9832 3.18% 2 2.087 1.053 1.0365 1.57% 3 2.088 1.06 1.0436 1.55%
Moisture 2.10%
SD 0.014 Acid soluble isolate Sample Dish Initial final Moisture
1 2.072 0.514 0.507 1.36% 2 2.114 0.504 0.4954 1.71% 3 2.0893 0.517 0.51 1.35%
Moisture 1.47%
SD 0.201
TBA value of precipitated protein isolate (reported as mg of malondialdehyde per kg of precipitated protein isolate)
Sample Absorbance @ 530 nm TBA value 1 0.3536 0.119886
Average 0.1165 2 0.3347 0.112727
SD 0.0036
3 0.3455 0.116818 Blank 0.0371

140
B5. Functional properties
Nitrogen solubility index
Precipitated protein isolate
Sample 1 Sample 2 Sample 3
SO4H2 0.60 0.50 0.55 ml
Blank 0 0 0 ml
Vol. pip 24.90 24.90 24.92 ml
W 0.501 0.501 0.501 g
Sample 5.03 5.03 5.03 g
Sample P 70.43 70.43 70.43 %
WSN 1.048 0.874 0.960 %
NSI 1.36% NSI 1.49 1.24 1.36 % SD 0.12
Acid soluble protein isolate
Sample 1 Sample 2 Sample 3 SO4H2 1.2 1.2 1.75 ml Blank 0 0 0 ml Vol. pip 2.01 2.01 2.99 ml W 0.032 0.032 0.048 g Sample 4.01 4.01 4.01 g Sample P 81.88 81.88 81.88 % WSN 32.584 32.584 31.944 % NSI 39.53%
NSI 39.79 39.79 39.01 % SD 0.45
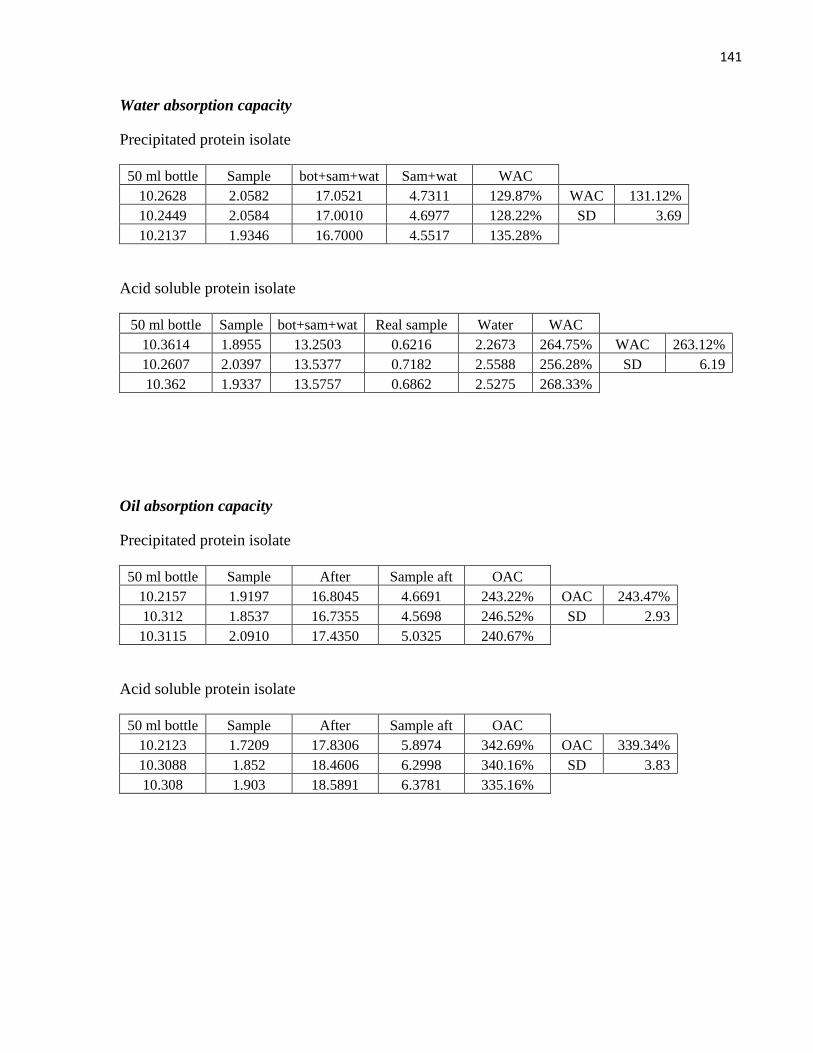
141
Water absorption capacity
Precipitated protein isolate
50 ml bottle Sample bot+sam+wat Sam+wat WAC 10.2628 2.0582 17.0521 4.7311 129.87% WAC 131.12% 10.2449 2.0584 17.0010 4.6977 128.22% SD 3.69 10.2137 1.9346 16.7000 4.5517 135.28%
Acid soluble protein isolate
50 ml bottle Sample bot+sam+wat Real sample Water WAC 10.3614 1.8955 13.2503 0.6216 2.2673 264.75% WAC 263.12% 10.2607 2.0397 13.5377 0.7182 2.5588 256.28% SD 6.19 10.362 1.9337 13.5757 0.6862 2.5275 268.33%
Oil absorption capacity
Precipitated protein isolate
50 ml bottle Sample After Sample aft OAC 10.2157 1.9197 16.8045 4.6691 243.22% OAC 243.47% 10.312 1.8537 16.7355 4.5698 246.52% SD 2.93
10.3115 2.0910 17.4350 5.0325 240.67%
Acid soluble protein isolate
50 ml bottle Sample After Sample aft OAC 10.2123 1.7209 17.8306 5.8974 342.69% OAC 339.34% 10.3088 1.852 18.4606 6.2998 340.16% SD 3.83 10.308 1.903 18.5891 6.3781 335.16%

142
Emulsifying activity
Precipitated protein isolate
Sample Total Volume Emulsion volume EA 1 42.50 29.38 69.12% 2 41.88 29.38 70.15% 3 42.50 31.25 73.53% 4 42.50 30.00 70.59% 5 42.50 30.00 70.59%
Average 70.42% 6 43.75 30.00 68.57%
SD 1.73
Acid soluble protein isolate
Sample Total Volume Emulsion volume EA 1 47.50 47.0 98.95% 2 41.25 40.8 98.79% 3 41.25 40.8 98.91% 4 40.00 39.5 98.75% 5 37.50 37.0 98.67%
Average 98.79% 6 37.50 37.0 98.67%
SD 0.12
Emulsion stability
Emulsifying activity after heating at 85 °C
Precipitated protein isolate.
Sample Total Volume Emulsion volume EA 1 43.75 33.75 77.14% 2 45.00 32.50 72.22% 3 43.75 31.25 71.43% 4 45.00 33.12 73.61% 5 45.00 32.00 71.11%
Average 72.82% 6 43.75 31.25 71.43%
SD 2.30
Emulsion stability 103.41%

143
Acid soluble protein isolate
Sample Total Volume Emulsion volume EA 1 47.50 47.20 99.37% 2 50.00 49.50 99.00% 3 45.00 44.70 99.33% 4 43.75 43.40 99.20% 5 45.00 44.60 99.11%
Average 99.23% 6 47.50 47.20 99.37%
SD 0.15
Emulsion stability 100.45%
Foaming properties
Precipitated protein isolate
Foam expansion
Sample Weight (g) Initial Vol. (ml) Whip. Vol. (ml) F.E. 1 3.00 100 190 90% 2 3.00 100 195 95% 3 3.02 100 200 100%
F. E. 95.00% SD 5.00
Foam stability
Sample 1 Sample 2 Sample 3 Time (min) Foam (ml) Foam (ml) Foam (ml) Average SD FVS
0.5 90 99 100 96.33 5.51 49.40% 20 88 94 95 92.33 3.79 47.35% 40 84 84 80 82.67 2.31 42.39% 60 80 84 75 79.67 4.51 40.85%
120 60 59 55 58.00 2.65 29.74%

144
Acid soluble protein isolate
Foam expansion
Sample Weight (g) Initial Vol. (ml) Whip. Vol. (ml) F.E. 1 3.02 100 312 212% 2 3.01 100 313 213% 3 2.99 100 315 215%
F. E. 213.33% SD 1.53
Foam stability
Sample 1 Sample 2 Sample 3 Time (min) Foam (ml) Foam (ml) Foam (ml) Average SD FVS
0.5 292 303 305 300.00 7.00 95.74% 20 237 235 240 237.33 2.52 75.74% 40 224 226 224 224.67 1.15 71.70% 60 215 210 215 213.33 2.89 68.09%
120 200 196 210 202.00 7.21 64.47%
Foam percentage remaining against time:
30.00%
40.00%
50.00%
60.00%
70.00%
80.00%
90.00%
100.00%
0 20 40 60 80 100 120 140
Foam
per
cent
age
(%)
Time (min)
Acid soluble protein isolate Precipitated protein isolate
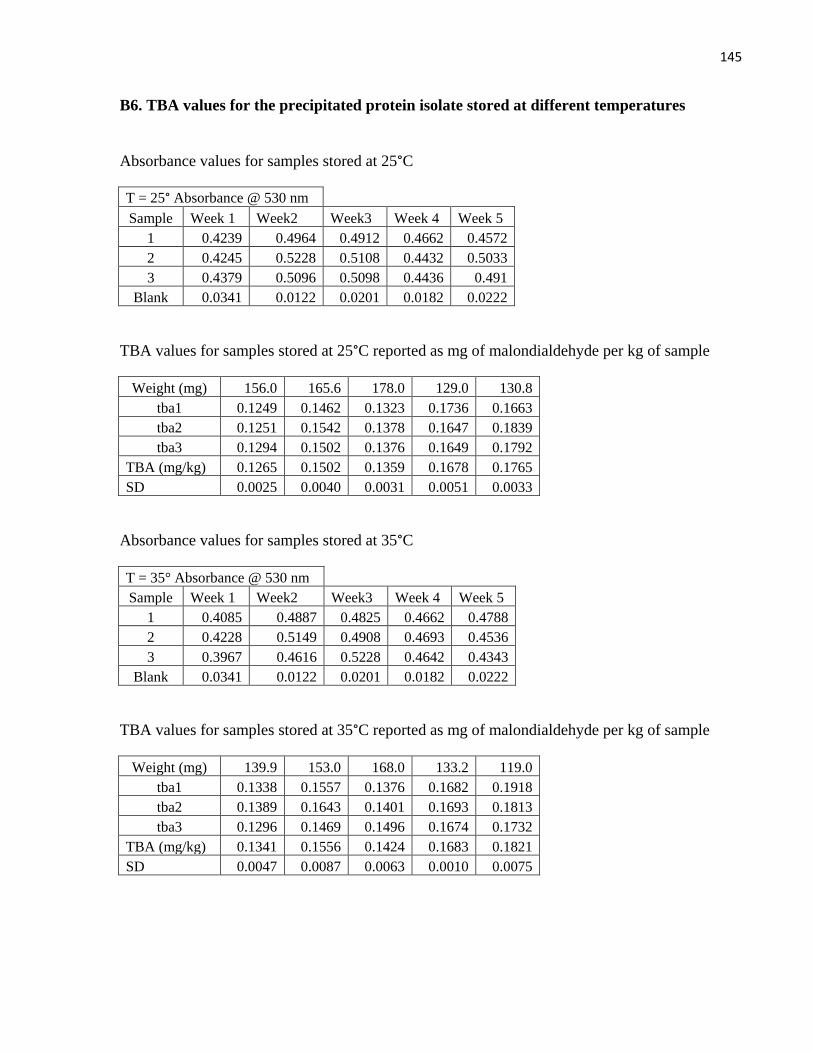
145
B6. TBA values for the precipitated protein isolate stored at different temperatures
Absorbance values for samples stored at 25°C
T = 25° Absorbance @ 530 nm Sample Week 1 Week2 Week3 Week 4 Week 5
1 0.4239 0.4964 0.4912 0.4662 0.4572 2 0.4245 0.5228 0.5108 0.4432 0.5033 3 0.4379 0.5096 0.5098 0.4436 0.491
Blank 0.0341 0.0122 0.0201 0.0182 0.0222
TBA values for samples stored at 25°C reported as mg of malondialdehyde per kg of sample
Weight (mg) 156.0 165.6 178.0 129.0 130.8 tba1 0.1249 0.1462 0.1323 0.1736 0.1663 tba2 0.1251 0.1542 0.1378 0.1647 0.1839 tba3 0.1294 0.1502 0.1376 0.1649 0.1792
TBA (mg/kg) 0.1265 0.1502 0.1359 0.1678 0.1765 SD 0.0025 0.0040 0.0031 0.0051 0.0033
Absorbance values for samples stored at 35°C
T = 35° Absorbance @ 530 nm Sample Week 1 Week2 Week3 Week 4 Week 5
1 0.4085 0.4887 0.4825 0.4662 0.4788 2 0.4228 0.5149 0.4908 0.4693 0.4536 3 0.3967 0.4616 0.5228 0.4642 0.4343
Blank 0.0341 0.0122 0.0201 0.0182 0.0222
TBA values for samples stored at 35°C reported as mg of malondialdehyde per kg of sample
Weight (mg) 139.9 153.0 168.0 133.2 119.0 tba1 0.1338 0.1557 0.1376 0.1682 0.1918 tba2 0.1389 0.1643 0.1401 0.1693 0.1813 tba3 0.1296 0.1469 0.1496 0.1674 0.1732
TBA (mg/kg) 0.1341 0.1556 0.1424 0.1683 0.1821 SD 0.0047 0.0087 0.0063 0.0010 0.0075

146
Absorbance values for samples stored at 45°C
T = 45° Absorbance @ 530 nm Sample Week 1 Week2 Week3 Week 4 Week 5
1 0.3408 0.4181 0.5260 0.4795 0.4866 2 0.3341 0.45 0.5112 0.5166 0.4868 3 0.3273 0.4479 0.5407 0.515 0.5062
Blank 0.0341 0.0122 0.0201 0.0182 0.0222
TBA values for samples stored at 45°C reported as mg of malondialdehyde per kg of sample
Weight (mg) 109.6 134.7 168.6 142.1 120.0 tba1 0.1399 0.1507 0.1500 0.1623 0.1935 tba2 0.1368 0.1625 0.1456 0.1754 0.1936 tba3 0.1338 0.1617 0.1544 0.1748 0.2017
TBA (mg/kg) 0.1368 0.1583 0.1500 0.1708 0.1963 SD 0.0031 0.0066 0.0044 0.0074 0.0047
0.1000
0.1200
0.1400
0.1600
0.1800
0.2000
0.2200
0 5 10 15 20 25 30 35 40
TB
A V
alue
Time (days)
25°C
35°C
45°C

147
Single factor ANOVA analysis for weekly TBA values at three storage temperatures.
Week 1
SUMMARY Groups Count Sum Average Variance
Week 1 25 3 0.3794 0.1264 6.43628E-06 Week1 35 3 0.4023 0.1341 2.18199E-05 Week1 45 3 0.2736 0.1368 1.89652E-05
ANOVA Source of Variation SS df MS F P-value F crit
Between Groups 0.000151008 2 7.55038E-05 5.0017 0.0641 5.7861 Within Groups 0.000075477 6 1.50955E-05
Total 0.000226485 8
Week 2
SUMMARY Groups Count Sum Average Variance
Week 2 25 3 0.3003 0.1501 3.17685E-05 Week2 35 3 0.4668 0.1556 7.58565E-05 Week2 45 3 0.4749 0.1583 4.38632E-05
ANOVA Source of Variation SS df MS F P-value F crit
Between Groups 7.97483E-05 2 3.98741E-05 0.7351 0.52495 5.7861 Within Groups 0.000271208 6 5.42416E-05
Total 0.000350956 8
Week 3
SUMMARY Groups Count Sum Average Variance
Week 3 25 3 0.4077 0.1359 9.61474E-06 Week3 35 3 0.4273 0.1424 4.01104E-05 Week3 45 3 0.3000 0.1500 3.82683E-05
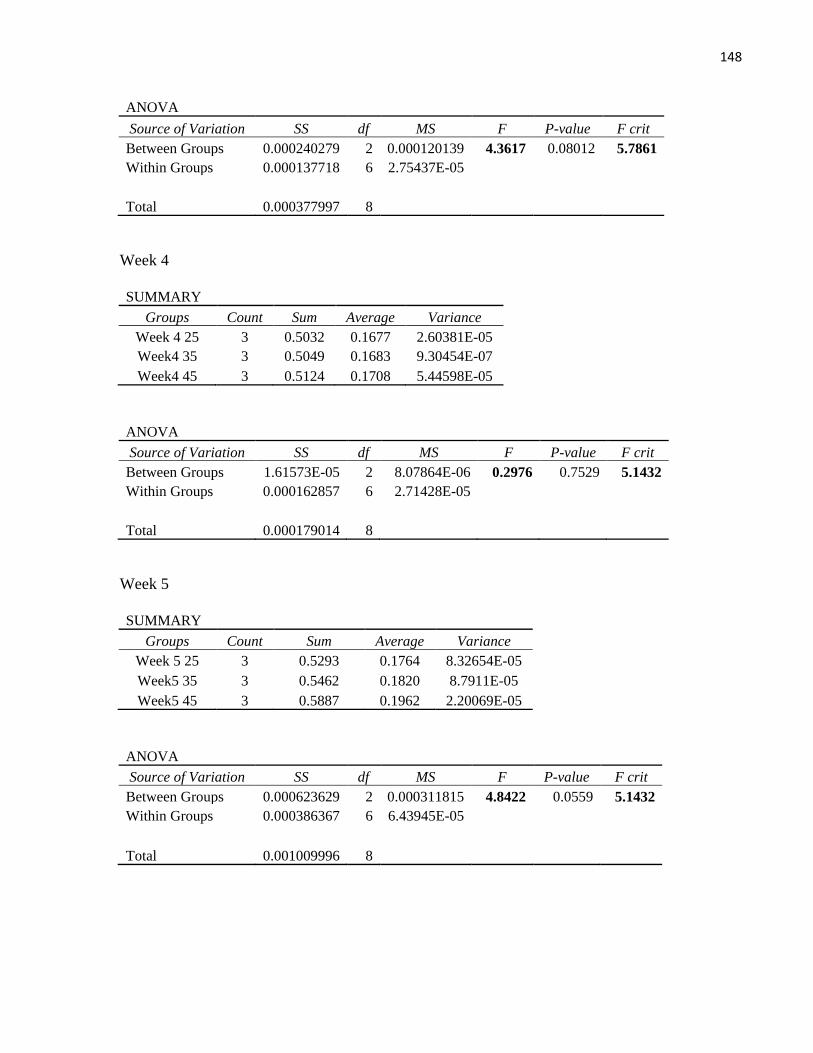
148
ANOVA Source of Variation SS df MS F P-value F crit
Between Groups 0.000240279 2 0.000120139 4.3617 0.08012 5.7861 Within Groups 0.000137718 6 2.75437E-05
Total 0.000377997 8
Week 4
SUMMARY Groups Count Sum Average Variance
Week 4 25 3 0.5032 0.1677 2.60381E-05 Week4 35 3 0.5049 0.1683 9.30454E-07 Week4 45 3 0.5124 0.1708 5.44598E-05
ANOVA Source of Variation SS df MS F P-value F crit
Between Groups 1.61573E-05 2 8.07864E-06 0.2976 0.7529 5.1432 Within Groups 0.000162857 6 2.71428E-05
Total 0.000179014 8
Week 5
SUMMARY Groups Count Sum Average Variance
Week 5 25 3 0.5293 0.1764 8.32654E-05 Week5 35 3 0.5462 0.1820 8.7911E-05 Week5 45 3 0.5887 0.1962 2.20069E-05
ANOVA Source of Variation SS df MS F P-value F crit
Between Groups 0.000623629 2 0.000311815 4.8422 0.0559 5.1432 Within Groups 0.000386367 6 6.43945E-05
Total 0.001009996 8

149
B7. Meat testing forms and results
Distribution of responses on Hedonic scale for wieners testing
Frequency of responses
Scale description Assigned
value Control MR 1% MR 2% PPI 1% PPI 2% Like least 1.8 1 0 0 1 0 Like slightly 3.6 0 0 1 0 0 Like moderately 5.4 2 3 4 3 3 Like very much 7.2 2 2 0 1 1 Like extremely 9 1 1 1 1 2
Total responses
6 6 6 6 6 Mean rating
6.0 6.6 5.7 5.7 6.9
Standard deviation
2.46 1.47 1.77 2.39 1.77 Percentage "dislike" responses 16.7% 0.0% 16.7% 16.7% 0.0%
Single factor ANOVA analysis for wiener ratings
SUMMARY Groups Count Sum Average Variance
Control 6 36 6.0 6.05 MR 1% 6 39.6 6.6 2.16 MR 2% 6 34.2 5.7 3.13 PPI 1% 6 34.2 5.7 5.72 PPI 2% 6 41.4 6.9 3.13
ANOVA
Source of Variation SS df MS F P-value F crit Between Groups 7.13 4 1.78 0.44 0.78 2.76 Within Groups 100.98 25 4.04
Total 108.11 29
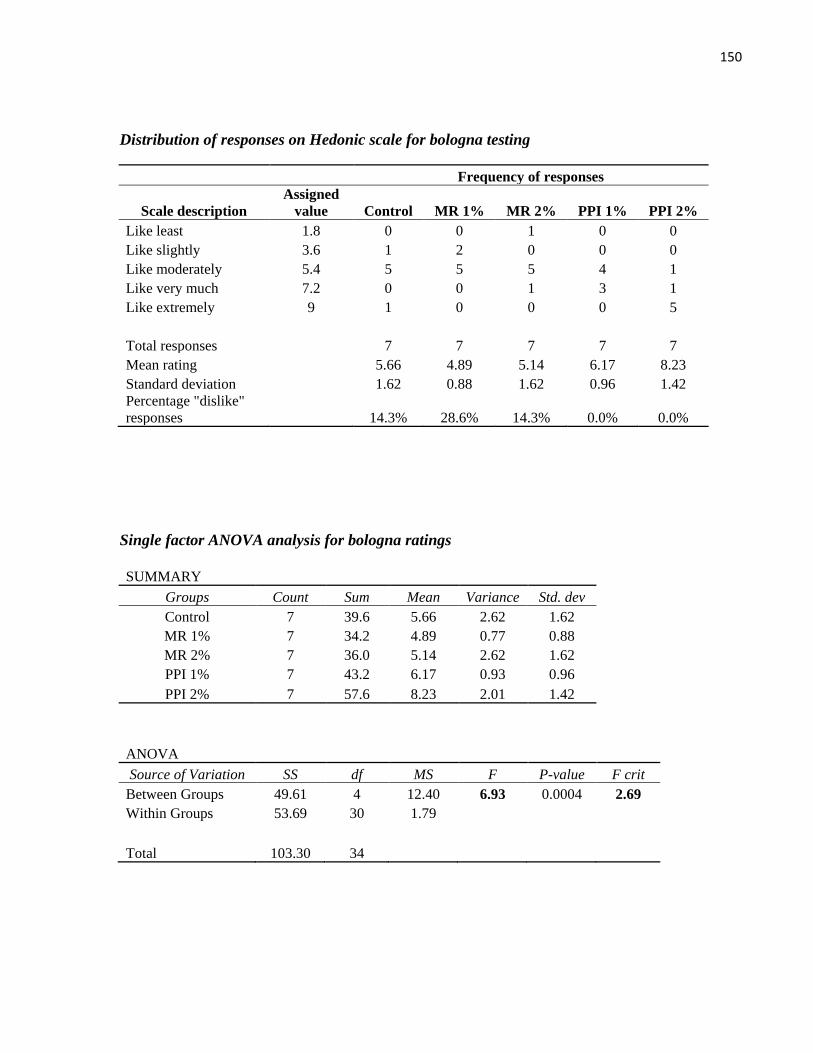
150
Distribution of responses on Hedonic scale for bologna testing
Frequency of responses
Scale description Assigned
value Control MR 1% MR 2% PPI 1% PPI 2% Like least 1.8 0 0 1 0 0 Like slightly 3.6 1 2 0 0 0 Like moderately 5.4 5 5 5 4 1 Like very much 7.2 0 0 1 3 1 Like extremely 9 1 0 0 0 5
Total responses
7 7 7 7 7 Mean rating
5.66 4.89 5.14 6.17 8.23
Standard deviation
1.62 0.88 1.62 0.96 1.42 Percentage "dislike" responses
14.3% 28.6% 14.3% 0.0% 0.0%
Single factor ANOVA analysis for bologna ratings
SUMMARY Groups Count Sum Mean Variance Std. dev
Control 7 39.6 5.66 2.62 1.62 MR 1% 7 34.2 4.89 0.77 0.88 MR 2% 7 36.0 5.14 2.62 1.62 PPI 1% 7 43.2 6.17 0.93 0.96 PPI 2% 7 57.6 8.23 2.01 1.42
ANOVA
Source of Variation SS df MS F P-value F crit Between Groups 49.61 4 12.40 6.93 0.0004 2.69 Within Groups 53.69 30 1.79
Total 103.30 34

151
Tukey HSD test for bologna mean ratings
q calculation k 5 df 30 q 4.102
HSD 2.074
Means compared Difference Control MR 1% 0.771 Not different
Control MR 2% 0.514 Not different Control PPI 1% 0.514 Not different Control PPI 2% 2.571 Significantly different MR 1% MR 2% 0.257 Not different MR 1% PPI 1% 1.286 Not different MR 1% PPI 2% 3.343 Significantly different MR 2% PPI 1% 1.029 Not different MR 2% PPI 2% 3.086 Significantly different PPI 1% PPI 2% 2.057 Not different
𝐻𝐻𝐻 = 𝑞�𝑀𝐻𝑀𝑛
154
Weiner and Bologna evaluation form
Wiener ratings Control 1% MR 2% MR 1% PPI 2% PPI 1% Tex 2% Tex Colour Texture Taste Like least Like extremely Bologna ratings Control 1% MR 2% MR 1% PPI 2% PPI 1% Tex 2% Tex Colour Texture Taste Like least Like extremely