the professor’s position trading methodology rifle...
TRANSCRIPT
The Professor’s Position
Trading Methodology
Rifle Trades
Hank Swiencinski August 22, 2013
Disclaimer
• The statements, opinions, buy and sell signals, and analysis contained
in this presentation are provided for general information and education
only. Opinions, estimates, buy and sell signals, and probabilities
expressed in this presentation constitute the judgment of the presenter,
and are subject to change without notice. The information contained in
this presentation is expressed in good faith, but its accuracy is not
guaranteed. Nothing contained in this presentation is intended to be,
nor shall be construed as, investment advice, nor is it to be relied on in
making any investment or other decision. Prior to making any
investment, you are advised to consult with your broker, investment
advisor, or other appropriate tax or financial professional to determine
the suitability of any investment. Neither the presenter, Henry J.
Swiencinski, nor AIQ Systems Inc., shall be responsible or have any
liability for investment decisions based upon, or the results obtained
from, the information provided.

Outline
• Best times to trade – when the
odds are in your favor
• Technical Indicators
• Rifle Trading Strategy
• Using the Dean’s List to identify
stocks
• Examples

The Four Best Times to Trade
#1: When the market is changing
direction
#2: Small change in the A-D oscillator.
Small change = BIG MOVE (>100 Dow
points).
#3: When the market is trending (Rifle
Trades)
#4: When it’s not – Scalp Trades

Trends vs. Non Trends
Trending
Not Trending - Correcting
DMI, MACD, P-Volume
RSI Wilder
Aggressive, larger positions, adding to position
Cautious – scalp trades Smaller positions
- Look for a change in direction

Stock Movement is Similar to
Driving a Car
To get from point A to point B, a car needs three things:
– The car needs to be pointed in the right direction
– The car needs to be moving
– To continue moving, it needs gas

Three Technical Indicators
• Direction: The Directional Movement Indicator (DMI)
– Math formula developed by Wells Wilder, used to determine direction of a stock
• Momentum: Moving Average Convergence Divergence (MACD)
• Gas: Positive Volume Indicator

Rules
Rule #1: Buy when all three indicators turn
positive
Rule #2: Sell when all three indicators turn
negative. To protect profits, Sell when 2
of the 3 indicators are negative
Do the opposite for shorts

Enter
Exit 60 min chart
Using the MACD
• Most traders do not understand how to
use the indicator
• Positive momentum: when the MACD
indicator is above the zero line
• The standard MACD is 12-25-9. I use 10-
20-1. Using the “1” eliminates the signal
line .
• Also look for divergences. They are very
useful in Position Trading

Buy
MACD Remains Positive
60 min chart

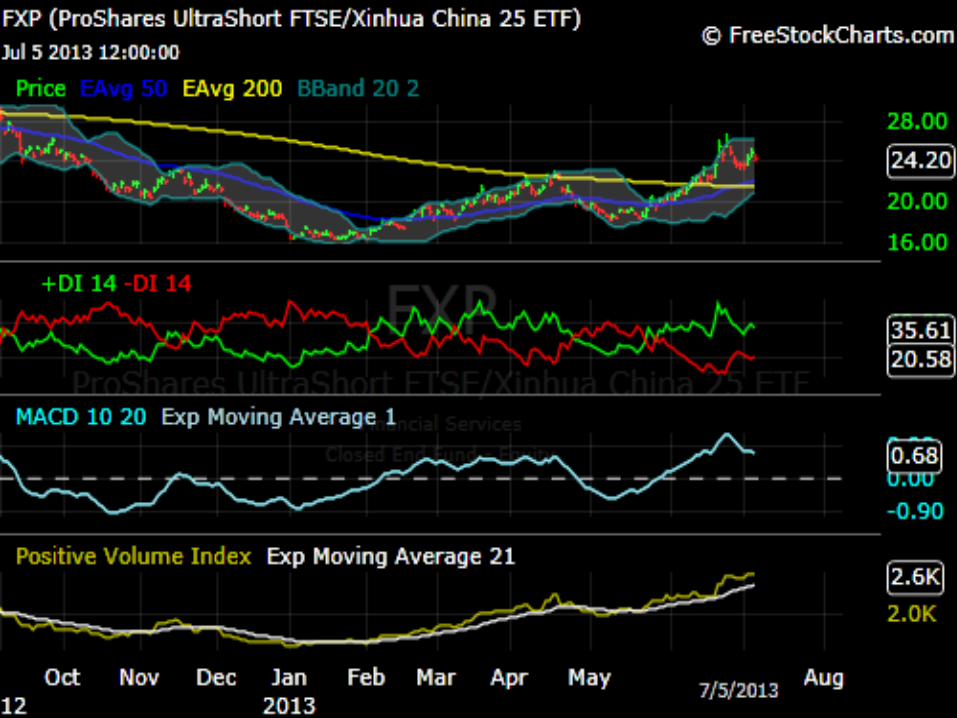
Setting up the Indicators from
AIQ or the Internet
• Use live data from AIQ Alerts screen or freestockcharts.com
• Basic trading screen should have:
- a 60 min chart set for one month’s data
- DMI set for 14 periods
- MACD set for 10-20. Set signal line to 1.
- P-volume or Positive Volume Indicator with the moving average set for 21 periods.

Basic Strategy for Trading
Trending Markets (Buying cake and Eating it too)
• Identify stocks that could be entering a
trend mode
• Initial Buy (Basic Position) is always
established on a DMI turn, after a
Reversing Pattern
• Basic Position (The Cake) is always
managed on a Daily Chart
• Subsequent trades (Eatin’ Cake) are
triggered and managed as Rifle Trades on
the 60 min chart

Daily chart
Basic Position
Basic Position

Rifle Trades (Eatin’ Cake)
• Once stock is in Uptrend on Daily
Chart with positive PT Indicators, look
for opportunities to RT on pullbacks
• Wait for 2 period RSI Wilder to
become oversold (<30)
• Then use PT indicators on 60 min
chart (The Rifle) to trigger the trade
• Manage the Rifle Trade on the 60s
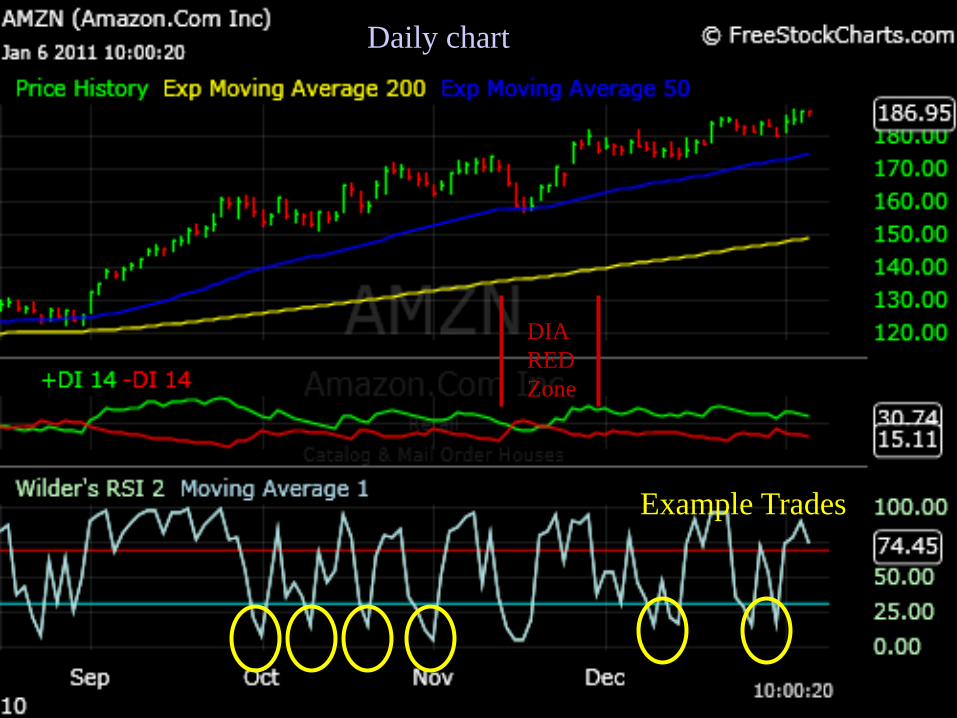
Daily chart
DIA
RED
Zone
Example Trades

60 min chart
Buy Buy
Sell
Rifle Trades

Sizing and Managing Rifle
Trades • Rifle Trades are sized at ½ the Basic
Position
• Example: If Basic Position of 1000 shares
of RCL was bought on Daily Chart
• Rifle Trade is 500 shares. Managed on 60s.
• If Basic Position was not established on
DMI turn, first Rifle Trade is used to
establish Basic Position.
• This Rifle Trade would be managed on
Daily’s, not 60s.

Daily Chart
Buy Basic Position
(1,000 shares)

Daily Chart
Let’s look at this

60 Min Chart
Rifle Trade
Buy 500 shares


Buy
60 min Rifle Trade
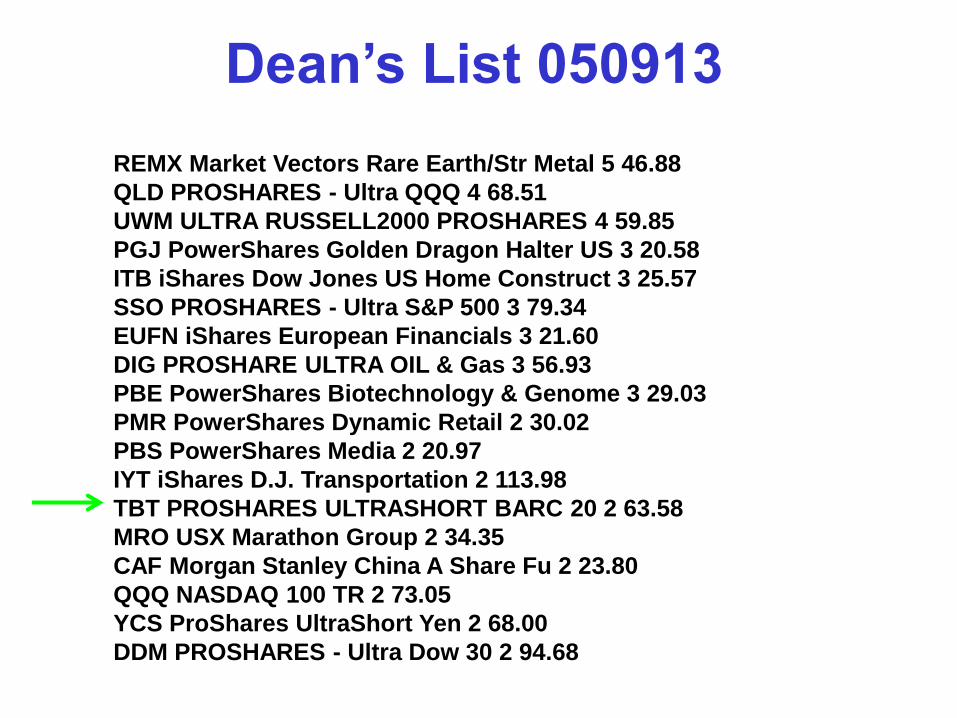
REMX Market Vectors Rare Earth/Str Metal 5 46.88
QLD PROSHARES - Ultra QQQ 4 68.51
UWM ULTRA RUSSELL2000 PROSHARES 4 59.85
PGJ PowerShares Golden Dragon Halter US 3 20.58
ITB iShares Dow Jones US Home Construct 3 25.57
SSO PROSHARES - Ultra S&P 500 3 79.34
EUFN iShares European Financials 3 21.60
DIG PROSHARE ULTRA OIL & Gas 3 56.93
PBE PowerShares Biotechnology & Genome 3 29.03
PMR PowerShares Dynamic Retail 2 30.02
PBS PowerShares Media 2 20.97
IYT iShares D.J. Transportation 2 113.98
TBT PROSHARES ULTRASHORT BARC 20 2 63.58
MRO USX Marathon Group 2 34.35
CAF Morgan Stanley China A Share Fu 2 23.80
QQQ NASDAQ 100 TR 2 73.05
YCS ProShares UltraShort Yen 2 68.00
DDM PROSHARES - Ultra Dow 30 2 94.68
Dean’s List 050913

Buy Basic Position
Daily Chart
5/10
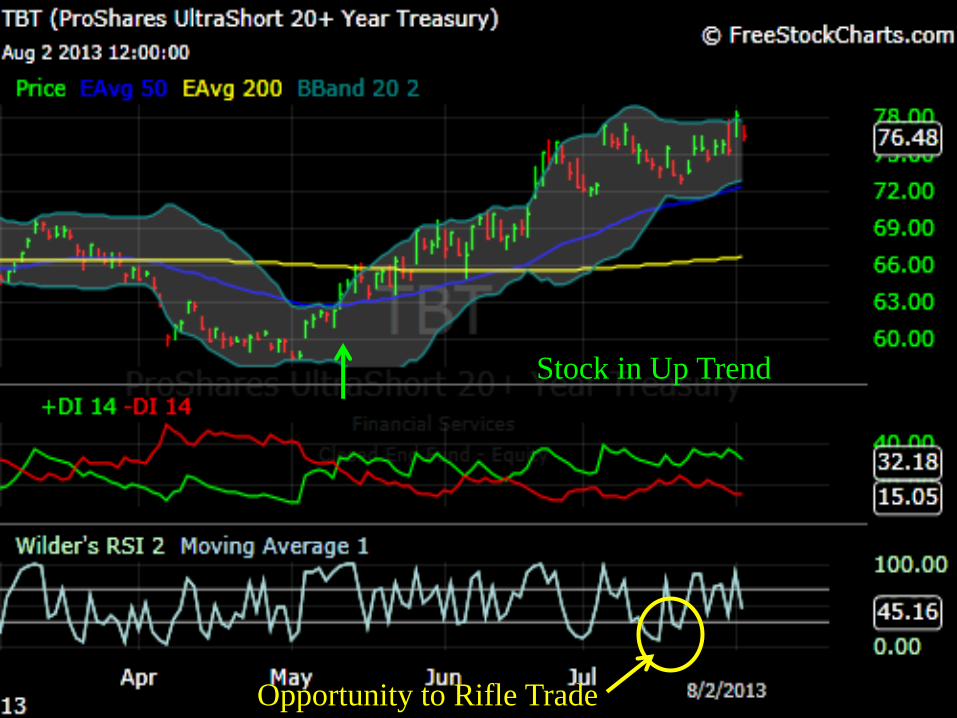
Opportunity to Rifle Trade
Stock in Up Trend
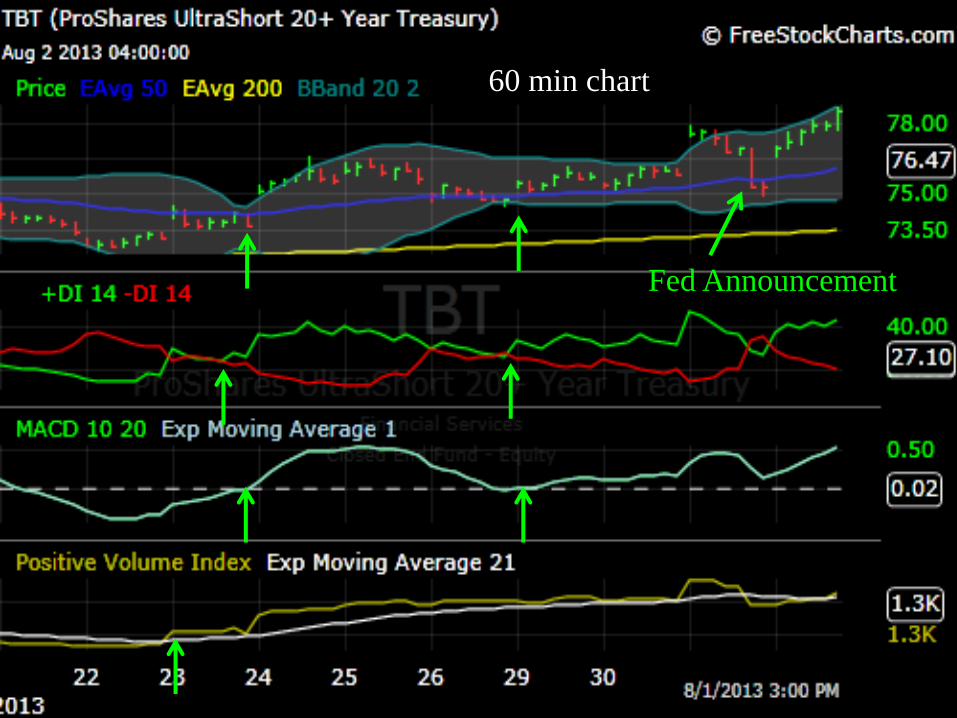
Fed Announcement
60 min chart

DIG Proshares Ultra Oil & Gas 3 46.27
EWD iShares MSCI Sweden 3 26.11
SSO PROSHARES - Ultra S&P 500 3 47.82
DDM PROSHARES - Ultra Dow 30 3 61.64
QLD PROSHARES - Ultra QQQ 3 84.43
XLF Select Sector SPDR-Financial 3 13.34
CORN Teucrium Corn ETF 2 42.62
PBS PowerShares Media 2 13.50
RWR SPDR Dow Jones REIT 2 64.97
EWC iShares MSCI Canada 2 27.40
PRF PowerShares FTSE RAFI US 1000 2 55.36
PXE PowerShares Energy Exploration & Pr 2 23.34
XLI Select Sector SPDR-Industrial 2 34.49
EWQ iShares MSCI France 2 20.16
PWV PowerShares Dynamic Large Cap Value 2
19.48
EWZ iShares MSCI Brazil 2 59.70
XLV Select Sector SPDR-Health Care 2 35.14
Dean’s List 01/03/2012


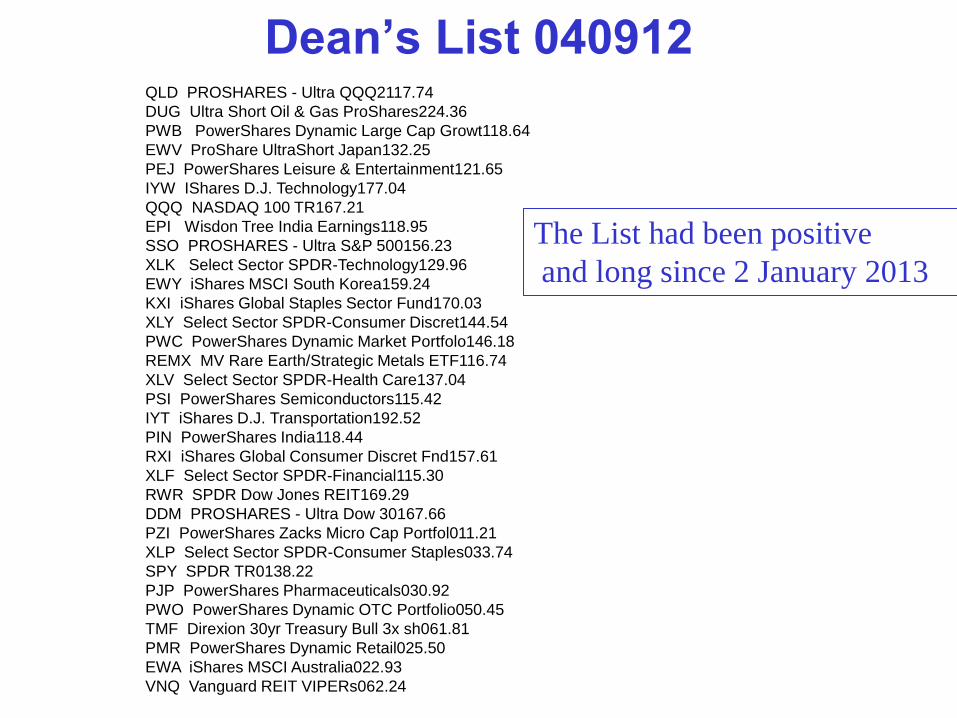
Dean’s List 040912 QLD PROSHARES - Ultra QQQ2117.74
DUG Ultra Short Oil & Gas ProShares224.36
PWB PowerShares Dynamic Large Cap Growt118.64
EWV ProShare UltraShort Japan132.25
PEJ PowerShares Leisure & Entertainment121.65
IYW IShares D.J. Technology177.04
QQQ NASDAQ 100 TR167.21
EPI Wisdon Tree India Earnings118.95
SSO PROSHARES - Ultra S&P 500156.23
XLK Select Sector SPDR-Technology129.96
EWY iShares MSCI South Korea159.24
KXI iShares Global Staples Sector Fund170.03
XLY Select Sector SPDR-Consumer Discret144.54
PWC PowerShares Dynamic Market Portfolo146.18
REMX MV Rare Earth/Strategic Metals ETF116.74
XLV Select Sector SPDR-Health Care137.04
PSI PowerShares Semiconductors115.42
IYT iShares D.J. Transportation192.52
PIN PowerShares India118.44
RXI iShares Global Consumer Discret Fnd157.61
XLF Select Sector SPDR-Financial115.30
RWR SPDR Dow Jones REIT169.29
DDM PROSHARES - Ultra Dow 30167.66
PZI PowerShares Zacks Micro Cap Portfol011.21
XLP Select Sector SPDR-Consumer Staples033.74
SPY SPDR TR0138.22
PJP PowerShares Pharmaceuticals030.92
PWO PowerShares Dynamic OTC Portfolio050.45
TMF Direxion 30yr Treasury Bull 3x sh061.81
PMR PowerShares Dynamic Retail025.50
EWA iShares MSCI Australia022.93
VNQ Vanguard REIT VIPERs062.24
The List had been positive
and long since 2 January 2013
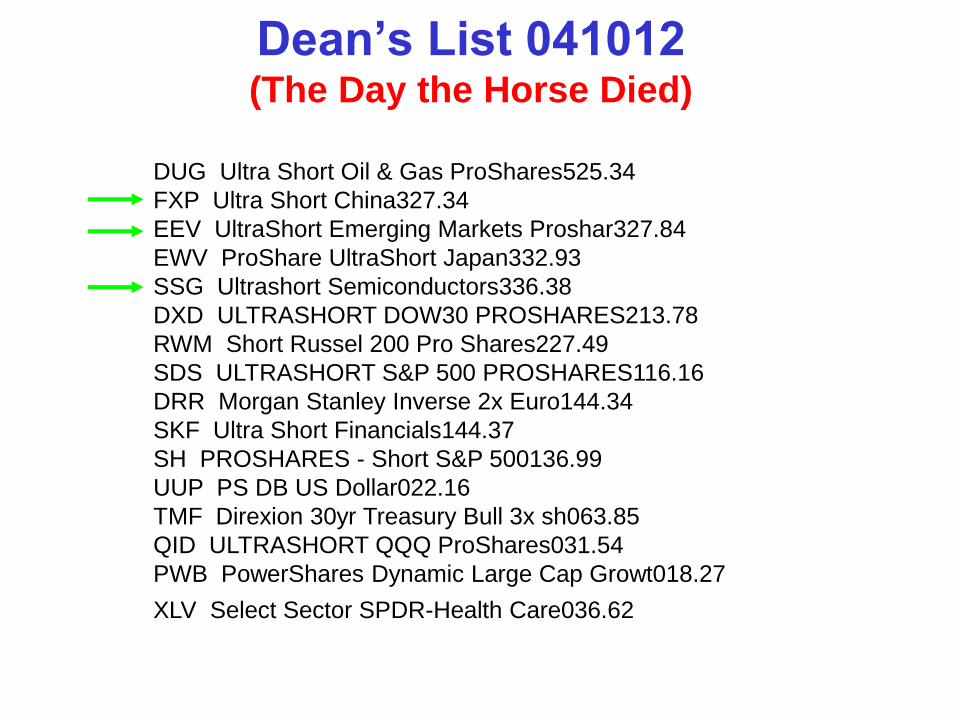
Dean’s List 041012 (The Day the Horse Died)
DUG Ultra Short Oil & Gas ProShares525.34
FXP Ultra Short China327.34
EEV UltraShort Emerging Markets Proshar327.84
EWV ProShare UltraShort Japan332.93
SSG Ultrashort Semiconductors336.38
DXD ULTRASHORT DOW30 PROSHARES213.78
RWM Short Russel 200 Pro Shares227.49
SDS ULTRASHORT S&P 500 PROSHARES116.16
DRR Morgan Stanley Inverse 2x Euro144.34
SKF Ultra Short Financials144.37
SH PROSHARES - Short S&P 500136.99
UUP PS DB US Dollar022.16
TMF Direxion 30yr Treasury Bull 3x sh063.85
QID ULTRASHORT QQQ ProShares031.54
PWB PowerShares Dynamic Large Cap Growt018.27
XLV Select Sector SPDR-Health Care036.62


Dean’s List 081613
RGLD ROYAL GOLD INC 14 61.66
CDE COEUR D ALENE MINES CORP IDA 13 15.92
SA Seabridge Gold Inc 11 14.32
SLW SILVER WHEATON CORP 11 26.77
ABX BARRICK GOLD CORP 10 19.33
AU ANGLOGOLD LTD 9 14.75
GDX MARKET VECTORS ETF TR 9 29.79
FNV Franco-Nevada Corporation 8 46.24
GG GOLDCORP INC NEW 8 31.07
AUY YAMANA GOLD INC 8 11.26
SIVR ETFS Physical Silver Shares 7 22.91
CLF Cleveland Cliffs Inc 7 22.83
SLV ISHARES SILVER TRUST ETF 6 22.34
BIDU BAIDU COM INC 6 134.64
PAAS PAN AMERN SILVER CORP 6 13.64
AAPL Apple Computers Inc 5 502.34
GMCR GREEN MTN COFFEE ROASTERS IN 4 76.38
VALE Vale SA 4 15.37
MT ARCELORMITTAL SA LUXEMBOURG 4 13.95
SSG PROSHARE TRUST ULTRASHORT SE 3 28.23
PBR PETROBRAS BRASILEIRO 3 14.43
GLD STREETTRACKS GOLD TR 3 132.58
SAM BOSTON BEER INC 2 205.61
DXD ULTRASHORT DOW30 PROSHARES 2 34.11
MU Micron Technology 2 14.01
NCR N C R Corp 2 37.40
TOT TOTAL S A 2 55.25
BTU PEABODY ENERGY CORP 2 17.44
MYL MYLAN LABORATORIES IN 2 36.19
OIL iPath S&P GSCI Crude Oil TR Index 2 25.40
RTN Ratheon Company 2 76.74
JCI Johnson Ctls Inc 2 40.54
DOW Dow Chem Co 1 36.89
DUG PROSHARE TRUST ULTRASHORT OI 1 61.56
RCL ROYAL CARIBBEAN CRUISES LTD 1 38.65
CMI CUMMINS INC 1 124.94
TDC TERADATA CORP 1 61.68
CEE Central Europe & Russia Fund 1 31.43
PSE Pioneer Southwest Energy Partners 1 39.95
HAL Halliburton Co 1 46.95
NFLX NETFLIX COM INC 1 258.87
SLB Schlumberger Ltd 1 81.92
GPOR GULFPORT ENERGY CORP 1 53.42
RT on 8/15
RT on 8/16 Look for Rifle Trades in middle of List

Basic Position

Oversold

5 min chart

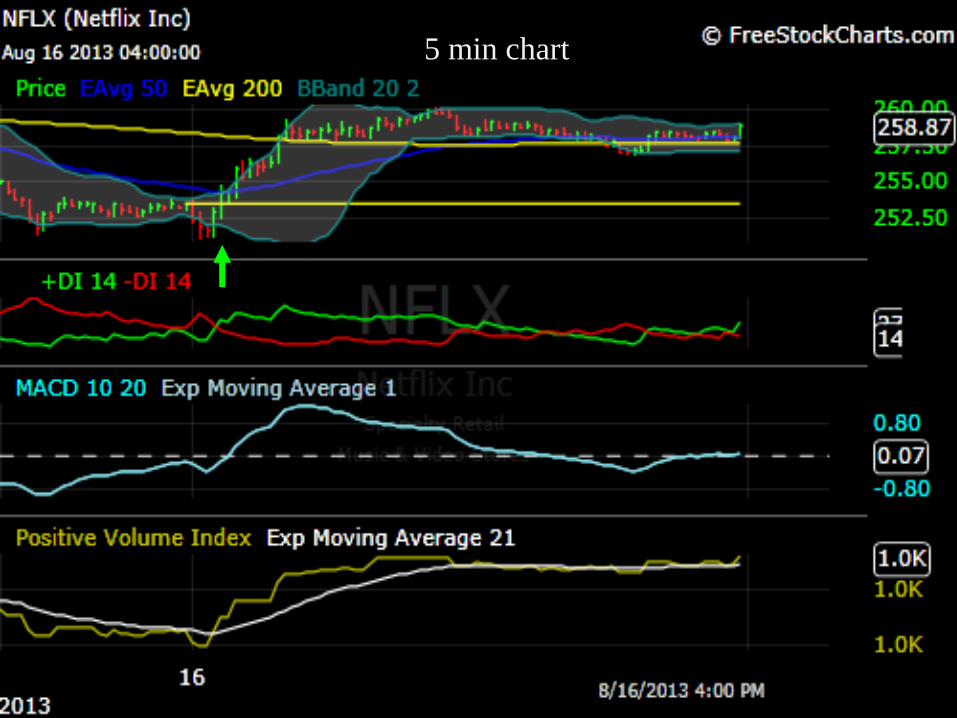
5 min chart

Summary
• Use the Dean’s List to find strong stocks or
ETFs to trade.
• Establish a Basic Position on the Daily Charts
using the PT indictors.
• After the stock moves into an Uptrend, look
for periods when it becomes oversold to
perform Rifle Trades on 60 min bars.
• Exit the trades when 2 or 3 indicators turn
against the trade.
• That’s it! Keep it simple.

For More Information
• Call or email Barbara Greer at AIQ Sales:
– Phone: 800-332-2999
– Email: [email protected]
• AIQ’s OneMinuteStock.com Cum Laude
Service: http://oneminutestock.com
• Dates for future seminars and webinars.
• The Professor’s Book: One Minute Guide
to Stock Management
- Available at OneMinuteStock.com