the promise of natural gas as a transportation fuel · beliefs of westport’s management and...
TRANSCRIPT

The Promise of Natural Gas as a Transportation Fuel

Forward Looking Statements•
This presentation contains forward‐looking statements that are based on the
beliefs of Westport’s management and reflect Westport’s current expectations.
Investors are cautioned that all forward‐looking statements involve risks and
uncertainties that could cause actual results to differ materially from those
expressed in these forward‐looking statements, including, without limitation,
Westport’s ability to develop viable fuel systems; Westport’s ability to provide the
capital required for research, product development, operations, and marketing;
product development, production and commercial launch delays; changing
environmental regulations; Westport’s ability to attract and retain key personal
and business partners; competition from conventional diesel fueled
engines; and
Westport’s ability to protect its intellectual property. These factors should be
considered carefully and investors should not rely on any forward‐looking
statements. Investors are encouraged to review Management’s Discussion and
Analysis and the Risk Factors section in Westport’s most recently filed Annual
Information Form and filings with securities regulators for a more complete
discussion of factors that could affect Westport’s future performance. We
undertake no obligation to update or revise any forward‐looking statements,
whether as a result of new information, future events or otherwise, except as
required by law.
2

3
Westport at a Glance•
Headquartered in Vancouver, B.C.•
Exchange
Symbols:
Toronto
Stock
Exchange:
“WPT”NASDAQ: “WPRT”
•
Market cap:
~$400 million (~US$370 million)
•
Market focus:
Transformation of markets for petroleum‐fueled
engines to alternative fuels
•
Position:
Global leader in medium and heavy‐duty
commercial vehicle engines operating on
alternative fuels such as natural gas
•
Strategy:
Market penetration via partnerships and JV’s; All
manufacturing outsourced

4
11
$0
$25
$50
$75
$100
$125
FY 2005 FY 2006 FY 2007 FY 2008 FY2009N. America Asia Rest of World Westport HD
4
Summary Historical Financial Overview
1,277 1,327
2,001
2,720
4,038
0
500
1,000
1,500
2,000
2,500
3,000
3,500
4,000
4,500
FY 2005 FY 2006 FY 2007 FY 2008 FY2009
Total Unit SalesRevenue
(CAN$ millions; Westport Fiscal Year Mar 31)
$43.6
$60.5
$71.5
$34.4
$121.8

5
Deep and Comprehensive IP
•
One of Canada’s leading R&D
companies •
Global patent portfolio
pivotal to Westport’s market
leading position –
Covers all key areas of
engine deployment
•
59 issued U.S. patents as of
January, 2009; many new
applications pending under
the international Patent
Cooperation Treaty
Compressors
HPDI
Cryogenic Storage / Delivery
CNG Direct Injection
Technologies
Hydrogen Direct Injection
Aftertreatment Systems

Recognized Sustainability Leadership
6
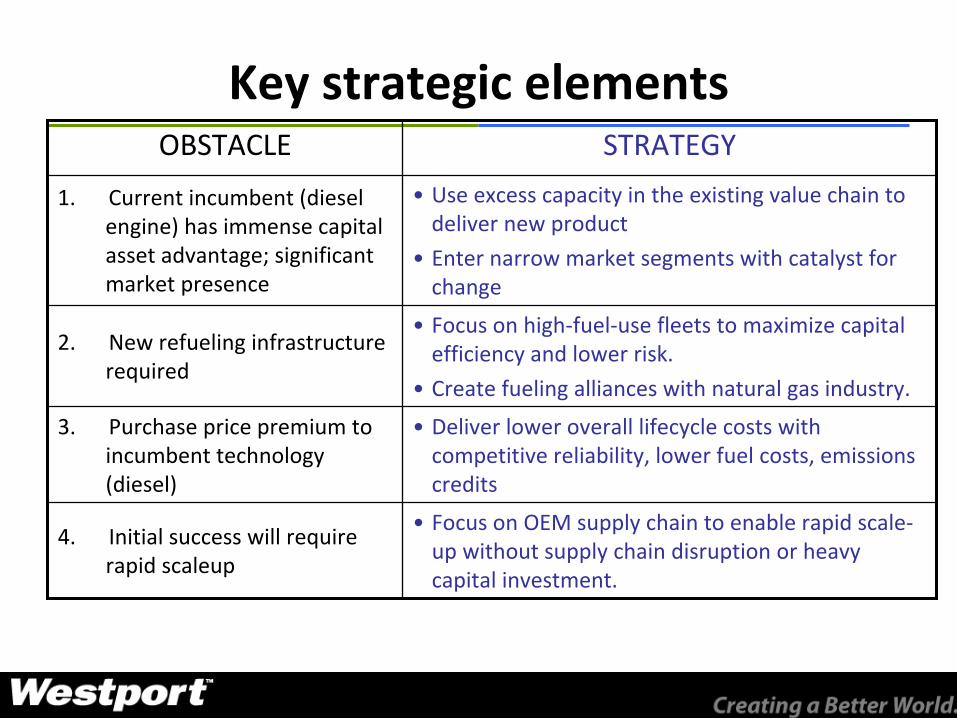
Key strategic elements OBSTACLE STRATEGY
1. Current incumbent (diesel
engine) has immense capital
asset advantage; significant
market presence
•
Use excess capacity in the existing value chain to
deliver new product
•
Enter narrow market segments with catalyst for
change
2. New refueling infrastructure
required
•
Focus on high‐fuel‐use fleets to maximize capital
efficiency and lower risk.
•
Create fueling alliances with natural gas industry.
3. Purchase price premium to
incumbent technology
(diesel)
•
Deliver lower overall lifecycle costs with
competitive reliability, lower fuel costs, emissions
credits
4. Initial success will require
rapid scaleup
•
Focus on OEM supply chain to enable rapid scale‐
up without supply chain disruption or heavy
capital investment.

An ‘Ocean’
of Opportunity for Natural GasPrice History for Crude Oil, Diesel Fuel, and NYMEX Natural Gas Contracts
$-
$20
$40
$60
$80
$100
$120
$140
Jan-00 Jan-01 Jan-02 Jan-03 Jan-04 Jan-05 Jan-06 Jan-07 Jan-08 Jan-09
Dai
ly C
rude
Oil
Spot
Pric
e, C
ushi
ng, O
K W
TI S
pot P
rice
FOB
[Dol
lars
per
Ba
rrel
]
$-
$1.00
$2.00
$3.00
$4.00
$5.00
$6.00
$7.00
Ret
ail D
iese
l and
Nat
ural
Gas
Pric
es [D
olla
rs p
er D
iese
l-equ
ival
ent G
allo
n]
Cushing, OK WTI Spot Price FOB (EIA) [Dollars per Barrel]
U.S. No 2 Diesel Retail Sales by All Sellers (EIA) [Dollars per Gallon]
NYMEX Natural Gas Futures Contract 1 (EIA) [$/DEG]
data source: US DOE Energy Information Administration
last update Sept. 3, 2009
8

Global Leader: Natural Gas Bus and Truck Engines
Refuse HaulersTransit Buses Delivery Vehicles School Buses
9
Only certified manufacturer in North America

CWI Business Model
• 50:50 JV established in 2001
• Sells mid-range 5.9- to 8.9-liter engines to vehicle OEM’s globally
• 20,000+ natural gas engines sold to date
• 30% revenue CAGR since 2004 and profitable since 2004
• Cummins provides:
• base diesel engine, components, supply chain
• sells, produces, and services engines
• all working capital
A leader in gaseous fuel engine technology and
market creation
A leading independent builder of commercial
diesel engines with global production and distribution
Cummins Westport Inc
10

CWI OEM Applications TodayREFUSESPECIALTY BUSTRUCK

New ISL G Truck Availability 08‐09
Freightliner M2 – 112 May 2009
Mack Australia April 2009
Capacity September 2008
McNeilus May 2009
Mack June 2009
Peterbilt July 2009
Sterling Setback 113 June 2008
12

•Buses extremely fuel intensive
•Fuel is a major operating cost
•1995 –
2005: Environmental mandate
•Today: Economic savings
•Share taken from diesel to CNG
– CNG 10 year CAGR 28%
– Diesel 10 year CAGR 0.7%
Source: US DOE; APTA Data Book April 2007
Case Study: CNG Transit Bus Adoption in US 1995–2005
Diesel68%
Electricity15%
CNG12%
Gasoline5%
Diesel77%
Electricity15%
CNG1%
Gasoline7%
0
100
200
300
400
500
600
700
800
900
1995 1996 1997 1998 1999 2000 2001 2002 2003 2004 20050
20
40
60
80
100
120
140
Diesel Electricity Gasoline CNG
U.S. Transit Energy Consumption Mix - 1995 U.S. Transit Energy Consumption Mix - 2005
Total transit bus fuel consumption
(diesel gallon equivalent)
CNG transit bus fuel consumption
(diesel gallon equivalent)
13

CWI’s Future Objectives
•
Continue to profitably compound revenue at rolling 30% CAGR
•
2009: expected growth although considerably slower than 2008. Several bright spots:
–
New truck product launch (Freightliner, Mack, Peterbilt)
–
Bus engines in India: deliver Delhi order (through Apr/10)
and expand market –
US Stimulus programs (DOE Clean Cities, etc)
–
Port programs
•
2010: growth acceleration with economic recovery

World Truck Production 2007 ranked by >16t volumes
0 50 100 150 200 250 300 350 400 450 500
Daimler
Volvo
Paccar
CNHDTC
FAW
Dongfeng
MAN
Scania
Tata
Iveco
Shanxi Automobile
Kamaz
Navistar
Hino
SAIC
VW
Hyundai
Isuzu
Ford
Ashok Leyland
Beijing
GM
Anhui
Eicher Motors
Chengdu Wangpai
all others
World truck production 2007 [thousands]
6-16 tonnes>16 tonnes
data source: The World’s Truck Manufacturers, A strategic review of finance and operations, 11th Edition (2008), Edited by Jonathan Storey, Data by Polk-Marketing Systems, Published by Automotive World Ltd, www.automotiveworld.com
15
NG Products supplied by WPT/CWI

North America Heavy Duty Truck Volumes
Market for Heavy Duty Trucks – North America
140.1 146 141
203
252284
151 145
0
100
200
300
2001 2002 2003 2004 2005 2006 2007 2008
Num
ber o
f Tru
cks
/ Yea
r (00
0 un
its)
Source: www.nada.org
16


18
Direct Injection Fuel System
•
Proprietary and patented
technology; 9 years
development; >$100 million
R&D to date
•
Complete LNG fuel solution
integrated with engine
•
Only heavy‐duty truck natural
gas engine in the world with
diesel‐equivalent performance,
range, efficiency

Status 2009: Prepare for Growth
•
Significant on‐road HD presence in California for over 12 months including at Los Angeles Ports
•
Very good market feedback to date–
Truck performance “as good or better”
than diesel equivalent–
Mileage equivalent; fuel is cheaper–
Drivers prefer natural gas trucks
•
Primary obstacles: capital cost premium; shortage of infrastructure
–
Truck market generally remains extremely depressed; credit
challenges remain
–
Natural gas infrastructure maturing nationally; capable of
supporting 1,000’s of trucks; “Blue corridors”
emerging–
Capital cost: NATGAS ACT; Westport cost reduction
19

HD Engines in Europe
Freightliner M2 – 112 (Daimler) May 2009
Mack and Mack Australia (Volvo) Renault France
June 2009
20
•
Leading European diesel engine manufacturers
Daimler and Volvo have both launched products with
our CWI natural gas engines this year for North
America
•
Westport announced summer 2008 material
investment in engineering for the “leading European
engine company”
•
Unique European challenges: both oil and gas supply
concerns; greenhouse gas an immediate issue; fuel
prices high and rising
•
Biomethane
a promising energy source with
significant recent success
•
Recent focus on the truck opportunity for both
emissions and energy security benefits
•
Advantages for Westport are compelling if one or
more of the integrated major OEM’s partners with us

Weichai Westport: HD Engines in China
Hong Kong Peterson (CNG) Equipment Limited
35% share40% share
25% share
21
•
Joint venture announced to develop a new heavy‐duty engine
for the market in China with Westport’s HPDI technology•
Weichai highlights include:–
Biggest powertrain
manufacturer in China –
Owns the most integrated heavy‐duty vehicle value
chain in China
•
JV not yet legally approved but engineering
collaboration underway

Corporate Structure
22
•
Formed in October 2007–
Headquartered in
Vancouver, Canada
–
Joint venture between
Westport (49%) and OMVL
SpA
(51%), subsidiary of
SIT Group
•
Juniper will be the leading clean light‐
duty industrial engine provider–
Leveraging parent strengths and
competencies
–
Global focus, competitive pricing–
Long term supply partnership with
Hyundai of Korea
–
EPA & CARB 2010 certification
•
Start of Production target 2010

23
Looking Ahead

24
2009/10 Market Transition: Environmental Niche to Economic Mainstream
•
Global OEM’s increasingly seeing customer demand for lower‐cost fuel such as natural gas
•
New government policy encourages alternative fuel vehicle adoption and market penetration
–
U.S. NAT GAS Act proposing significant tax incentives for natural gas
trucks (Senate Bill 1408)
–
August 2009 DOE announcement awarding Clean Cities funding for up
to 2800 natural gas vehicles
•
Early markets reaching confidence in our products and solutions

Westport Strategy for 2009/101.
Continue to profitably grow CWI
2.
Expand product coverage to new markets, partners, product features to position for scaleable growth post‐
recession
3.
Accelerate commercialization of HD Truck business to demonstrate lower total economic cost per mile in this
huge global market.
4.
Maintain prudent, focused cash control and strong balance sheet. Review the many compelling emerging
opportunities; act on strategic priorities.
25

Thank you