the propagation of probabilistic and possibilistic ...ijesd.org/papers/432-cd0136.pdf ·...
TRANSCRIPT

Abstract—The use of a life cycle assessments (LCA) is
dramatically increasing, partially due to the ease of use of the commercial software. However, there is a critical doubt about the credibility of the assessment results, particularly in endpoint assessments. Each phase of a LCA involves some simplifications, assumptions and choices. More research is required to improve the credibility of assessments, such as studies of time and space effects and studies of dose-response effects. Another method of improving the credibility of assessments is to characterize, propagate and analyze uncertainty in a LCA. In this study, a probabilistic method (Monte Carlo simulation) and a possibilistic method (fuzzy set theory) are used to model uncertainty in the inventory (input data) of a naphtha cracking plant in Taiwan. The results of the probabilistic and possibilistic approaches are compared and discussed. The results show that although probability and possibility distributions have approximately the same bottom width, their highest peaks have almost the same value. The primary difference between probabilistic and possibilistic methods is in the number of calculations. In this study, at least 10,000-time simulations are used for a Monte Carlo simulation, in order to obtain a smoother curve and the vertex method for the possibilistic approach only uses 11 α-cuts (intervals), to produce a smooth triangle.
Index Terms—Life cycle assessment, Monte Carlo simulation, fuzzy set theory, possibility theory.
I. INTRODUCTION A life-cycle assessment is a technique to assess the
environmental impact that is associated with all of the stages of a product's life, from raw material extraction through materials processing, manufacture, distribution, use, repair and maintenance, and disposal or recycling. According to the ISO 14040 [1] and 14044 [2] standards, a Life Cycle Assessment has four distinct phases. The first phase is 'Goal and scope', which requires an explicit statement of the goal and scope of the study. It establishes the context of the study and explains how and to whom the results are to be communicated. The second phase is a ‘Life cycle inventory (LCI)’, which involves the creation of an inventory of the flows from and to nature for a product system. Inventory flows include inputs of water, energy and raw materials, and releases to air, land and water. The third phase is a ‘Life cycle
Manuscript received January 13, 2013; revised March 13, 2013. K. F. R. Liu, S. Y. Chiu, and M. J. Hung are with the Department of
Safety, Health and Environmental Engineering, Ming Chi University of Technology, New Taipei City, Taiwan (e-mail: [email protected]; [email protected]).
J. Y. Kuo is with the Department of Science and Information Engineering, National Taipei University of Technology, Taipei, Taiwan (e-mail: [email protected]).
impact assessment (LCIA)’, which evaluates the significance of any potential environmental impact, based on the LCI flow results. A classical LCIA consists of the following mandatory elements: selection of impact categories, category indicators and characterization models. In the classification stage, the inventory parameters are sorted and assigned to specific impact categories. In impact measurement, the categorized LCI flows are characterized, using one of many possible LCIA methodologies, into common equivalence units that are then summed to provide an overall impact category total. The last phase is ‘Interpretation’, which is a systematic technique that identifies, quantifies, checks, and evaluates information from the results of the life cycle inventory and/or the life cycle impact assessment. The results of the inventory analysis and impact assessment are summarized during the interpretation phase.
Fig. 1. Uncertainty sources and types in a LCA.
Uncertainty can occur in each phase and is often not considered in LCA studies, although it can be significant [3]. The sources of uncertainty in a LCA are the data, choices and relationships, as shown in Fig.1. Data uncertainty refers to uncertainty in the input data, such as resource consumption or emissions. Data uncertainty can be variable, mis-specified, erroneous, incomplete, or subject to rounding-off. Uncertainty in choices is a consequence of the difference in output that results from choices for the system boundaries, allocation principles, impact assessment models and time horizons for an assessment model. Uncertainty of choices may occur because of an inconsistency in the goal and scope of the analysis, or inconsistency in alternatives, possibly due to the assignment of different allocation methods for different product chains. Relationship uncertainty is the uncertainty that results from model parameters (characteristic factors, GWP, weighting, etc.) and the discounting formula used to calculate long-term impact. Relationships may be wrong,
The Propagation of Probabilistic and Possibilistic Uncertainty in a Life Cycle Assessment: A Case Study of a
Naphtha Cracking Plant in Taiwan
Kevin Fong-Rey Liu, Si-Yu Chiu, Ming-Jui Hung, and Jong-Yih Kuo
International Journal of Environmental Science and Development, Vol. 4, No. 6, December 2013
652DOI: 10.7763/IJESD.2013.V4.432

incomplete, or may have been implemented inaccurately in the software.
Uncertainty can be dealt with in several ways [3]: the scientific way, the social way and the statistical way. The first two methods remove or reduce the uncertainty, but the third quantifies it. This study uses probabilistic and possibilistic approaches to characterize, propagate and analyze uncertainty in input data. The probabilistic method uses a Monte Carlo Simulation and the possibilistic method uses fuzzy set theory. The case study is an analysis of the environmental impact of the expansion plan for a naphtha cracking plant in Taiwan. The results of the probabilistic and possibilistic approaches are compared and discussed.
II. METHODS AND MATERIALS
A. Case Study The case study is a naphtha cracking plant that is located in
Yunlin County, in Taiwan, as shown in Fig. 2. It is in an offshore industrial zone, with a total area of 2,603 hectares. Currently, 61 factories have an annual output of 6,221 tons. In response to market demand, the plant proposes an expansion plan, in order to extend the number of factories to 77 and to increase production to 8,174 tons per year. However, the expansion plan will also increase its emissions of TSP from 3,340 to 4,323 tons per year, SO2 from 16,000 to 19,788 tons per year, NO2 from 19,622 to 23,881 tons per year, VOC from 4,302 to 5,389 tons per year and waste-water from 188,000 to 304,500 tons per day.
Fig. 2. The case study: a naphtha cracking plant in Taiwan.
B. Life Cycle Impact Assessment Two life cycle impact assessments are selected for the
study: Eco-indicator 99 [4] and ReCiPe [5]. Eco-indicator 99 (Fig. 3) is one of the most widely used impact assessment methods for a LCA. It is the successor of Eco-indicator 95, the first endpoint impact assessment method, which allows the environmental load of a product to be expressed in a single score.
This model is used for the following impact categories:
Carcinogens: carcinogenic affects due to the emission of carcinogenic substances to air, water and soil. Damage is expressed in Disability adjusted Life Years (DALY)/kg emitted.
Respiratory organics: respiratory effects resulting from summer smog, due to the emission of organic substances to the air, which cause respiratory problems. Damage is expressed in DALY/kg emitted.
Respiratory inorganics: respiratory effects resulting from winter smog, caused by the emission of dust, sulfur and nitrogen oxides to the air. Damage is expressed in DALY/kg emitted.
Climate change: damage, expressed in DALY/kg emitted, resulting from an increase in diseases and death caused by climate change.
Radiation: damage, expressed in DALY/kg emitted, resulting from radioactive radiation
Ozone layer: damage, expressed in DALY/kg emitted, due to increased UV radiation as a result of the emission of ozone-depleting substances to the air.
Ecotoxicity: damage to the quality of the ecosystem as a result of the emission of ecotoxic substances to the air, water and soil. Damage is expressed in Potentially Affected Fraction (PAF)*m2*year/kg emitted.
Acidification/ Eutrophication: damage to the quality of the ecosystem as a result of the emission of acidifying substances to the air. Damage is expressed in Potentially Disappeared Fraction (PDF)*m2*year/kg emitted.
Land use: damage as a result of either the conversion of land or the occupation of land. Damage is expressed in Potentially Disappeared Fraction (PDF)*m2*year/m2 or m2a.
Minerals: surplus energy per kg mineral or ore as a result of decreasing ore grades.
ReCiPe (Fig. 4) is an impact assessment method that uses harmonized category indicators at the midpoint and the endpoint level. It is an improvement on CML 2000 and Eco-indicator 99. The main contributors to this project are PRé, CML and RIVM and Radboud University. This model is applicable to the following impact categories: climate change, ozone depletion, acidification, eutrophication, toxicity, human health damage due to PM10 and Ozone, ionising radiation, land-use, water depletion, mineral resource depletion and fossil fuel depletion.
C. Dealing with probabilistic uncertainty in a LCIA: the Monte Carlo method
Monte Carlo methods are a broad class of computational algorithms that rely on repeated random sampling to obtain numerical results; i.e., by running simulations many times over in order to calculate those same probabilities heuristically, similarly to actually playing and recording results in a real casino; hence the name. They are often used in physical and mathematical problems and are most suited to situations where it is impossible to obtain a closed-form expression or where it is infeasible to use a deterministic algorithm. Monte Carlo methods are mainly used for three distinct types of problem: optimization, numerical integration and the generation of samples from a probability distribution. In this study, every input data is associated with a triangular probability distribution that expresses its probabilistic uncertainty and 10,000 simulations are run to produce the probabilistic distribution, as shown in Fig. 5.
International Journal of Environmental Science and Development, Vol. 4, No. 6, December 2013
653

Fig. 3. Framework of Eco-indicator 99 [4].
Fig. 4. Framework of ReCiPe [5].
Fig. 5. Triangular probabilistic and possibilistic distributions of the input
data.
D. Dealing with possibilistic uncertainty in a LCIA: the fuzzy method Possibility theory is an uncertainty theory that is devoted
to the handling of incomplete information [6]. In Zadeh's view [6], possibility distributions provide a graded semantics for natural language statements. A possibility distribution is a mapping, π, from a set of states of affairs, S, to a totally ordered scale, such as the unit interval [0, 1]. The function, π, represents the knowledge of an agent (about the actual state of affairs) to distinguish what is plausible from what is less plausible, what is the normal course of things from what is
not and what is surprising from what is expected. In this study, every input data is also associated with a triangular possibility distribution that expresses its possibilistic uncertainty and only 11-cuts are used to obtain 11 intervals. Interval-based calculations are performed, as shown in Fig. 6.
Fig. 6. Triangular probabilistic and possibilistic distributions of the input
data.
III. RESULTS The uncertainty in the input data is propagated in
Eco-indicator 99 and ReCiPe. The results from Eco-indicator 99 are shown in Figs. 7 to 13 and those from ReCiPe are shown from Figs. 14 to 24.
International Journal of Environmental Science and Development, Vol. 4, No. 6, December 2013
654
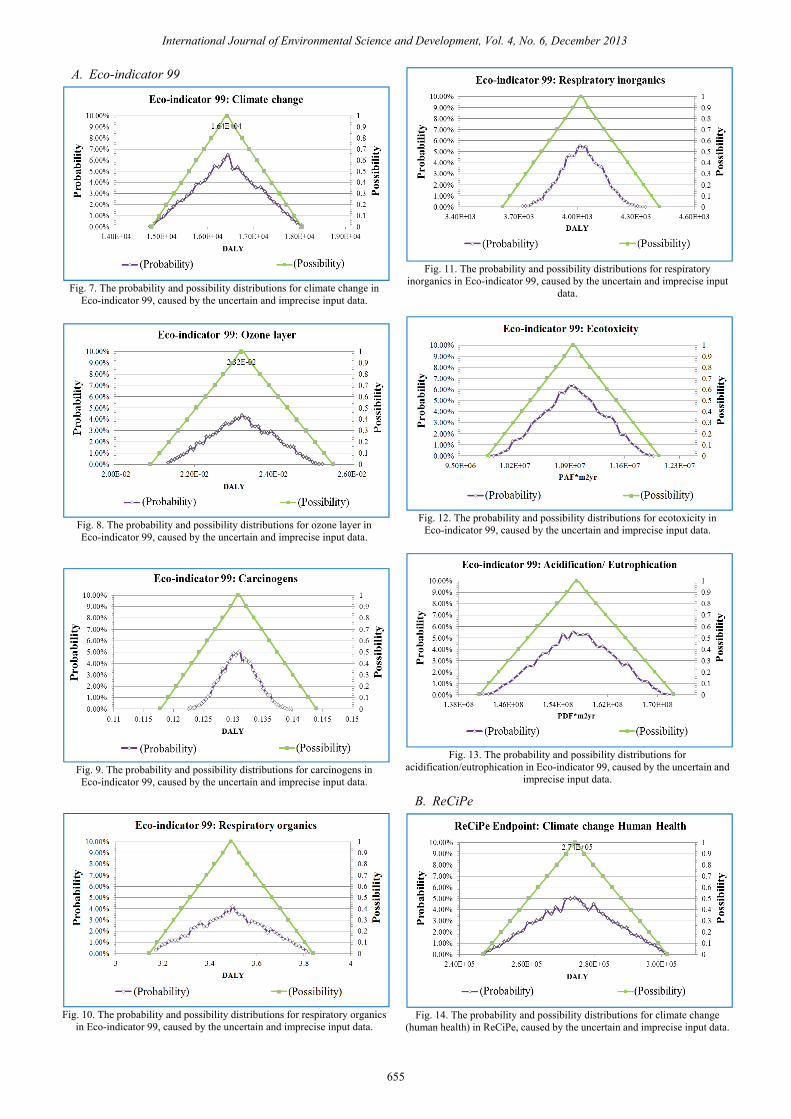
A. Eco-indicator 99
Fig. 7. The probability and possibility distributions for climate change in
Eco-indicator 99, caused by the uncertain and imprecise input data.
Fig. 8. The probability and possibility distributions for ozone layer in Eco-indicator 99, caused by the uncertain and imprecise input data.
Fig. 9. The probability and possibility distributions for carcinogens in Eco-indicator 99, caused by the uncertain and imprecise input data.
Fig. 10. The probability and possibility distributions for respiratory organics
in Eco-indicator 99, caused by the uncertain and imprecise input data.
Fig. 11. The probability and possibility distributions for respiratory
inorganics in Eco-indicator 99, caused by the uncertain and imprecise input data.
Fig. 12. The probability and possibility distributions for ecotoxicity in
Eco-indicator 99, caused by the uncertain and imprecise input data.
Fig. 13. The probability and possibility distributions for
acidification/eutrophication in Eco-indicator 99, caused by the uncertain and imprecise input data.
B. ReCiPe
Fig. 14. The probability and possibility distributions for climate change
(human health) in ReCiPe, caused by the uncertain and imprecise input data.
International Journal of Environmental Science and Development, Vol. 4, No. 6, December 2013
655

Fig. 15. The probability and possibility distributions for ozone depletion in
ReCiPe , caused by the uncertain and imprecise input data.
Fig. 16. The probability and possibility distributions for human toxicity in
ReCiPe, caused by the uncertain and imprecise input data.
Fig. 17. The probability and possibility distributions for photochemical
oxidant formation in ReCiPe, caused by the uncertain and imprecise input data.
Fig. 18. The probability and possibility distributions for particulate matter
formation in ReCiPe, caused by the uncertain and imprecise input data.
Fig. 19. The probability and possibility distributions for climate change
(ecosystems) in ReCiPe, caused by the uncertain and imprecise input data.
Fig. 20. The probability and possibility distributions for terrestrial
acidification in ReCiPe, caused by the uncertain and imprecise input data.
Fig. 21. The probability and possibility distributions for freshwater
eutrophication in ReCiPe, caused by the uncertain and imprecise input data.
Fig. 22. The probability and possibility distributions for terrestrial
ecotoxicity in ReCiPe, caused by the uncertain and imprecise input data.
International Journal of Environmental Science and Development, Vol. 4, No. 6, December 2013
656

Fig. 23. The probability and possibility distributions for freshwater
ecotoxicity in ReCiPe, caused by the uncertain and imprecise input data.
Fig. 24. The probability and possibility distributions for marine ecotoxicity
in ReCiPe 99, caused by the uncertain and imprecise input data.
IV. DISCUSSION The distributions of these outputs have the following
features. Shape. The probability distributions are not smooth, but
the possibility distributions are approximately triangular. The highest peaks of the probability and possibility distributions for a specific output have almost the same value. The highest peak of a possibility distribution is 1, but the area under a probability distribution is 1.
Bottom width. The probability and possibility distributions have approximately the same bottom width.
Number of calculations. The primary difference between the probabilistic and possibilistic methods lies in the number of calculations. In this study, at least 10,000 simulations are run for the Monte Carlo simulation, in order to obtain a smoothe curve; while the vertex method for possibilistic method only uses 11 α-cuts (intervals) to produce a smooth triangle.
These features are also similar to the analysis in [7], although [7] use normal distributions.
V. CONCLUSION This study proposes the use of a Monte Carlo simulation as
the probabilistic method and fuzzy set theory as a possibilistic method to characterize, propagate, and analyze the uncertainty in a LCA. The analysis of the propagation of the uncertainty propagation in a LCA allows an understanding of the effect of data uncertainty and demonstrates its importance. The source of the uncertainty
for this study is the input data, which is uncertain because of measurement error or because the information used is incomplete. Future studies will extend this concept to deal with model uncertainty that is due to model knowledge and model parameters.
ACKNOWLEDGMENT The authors would like to thank the National Science
Council of the Republic of China (Taiwan) for financially supporting this research under Contract NSC 101-2221 -E-131-027.
REFERENCES [1] ISO 14040: Environmental management – Life cycle assessment –
Principles and framework, International Organisation for Standardisation (ISO), Geneve, 2006.
[2] ISO 14044: Environmental management – Life cycle assessment – Requirements and guidelines, International Organisation for Standardisation (ISO), Geneve, 2006.
[3] G. Finnveden, M. Z. Hauschild, T. Ekvall, and J. Guinée, R. Heijungs, S. Hellweg, A. Koehler, D. Pennington, S. Suh, “ Recent developments in Life Cycle Assessment,” Journal of Environmental Management, vol. 91, pp.1-21, 2009.
[4] M. J. Goedkoop, R. Spriensma, The Eco-indicator 99 – A Damage-oriented Method for Life Cycle Impact Assessment. Methodology Report, second ed., 17-4-2000. Pre´ Consultants, B.V. Amersfoort, The Netherlands, 2000.
[5] M. J. Goedkoop, R. Heijungs, M. Huijbregts, A. De Schryver, J. Struijs, and R. Van Zelm, ReCiPe 2008, A life cycle impact assessment method which comprises harmonised category indicators at the midpoint and the endpoint level, First edition Report I: Characterisation, 6 January 2009.
[6] L.A. Zadeh, “Fuzzy Sets as the Basis for a Theory of Possibility,” Fuzzy Sets and Systems, vol.1, pp.3-28, 1978.
[7] T. B. Santos, J. R. F. Arrud, D. Brissaud, "Treating Input Data Uncertainty in LCA: Monte Carlo and Fuzzy Approaches," presented at 4th International Workshop on Advances in Cleaner Production, São Paulo-SP, May 22nd to 24th, 2013.
Kevin Liu received the Ph.D. degree in 1998, in civil engineering from National Central University, Taiwan. Currently, he is a professor in the Department of Safety, Health and Environmental Engineering, Ming Chi University of Technology, Taiwan. His research interest is the use of decision analysis and artificial intelligence techniques to environmental management issues.
Si-Yu Chiu received the master degree in 2011, in the Department of Safety, Health and Environmental Engineering, Ming Chi University of Technology, Taiwan. She currently works for a environmental management company. Her research interest is the uncertainty analysis in LCA.
Ming-Jui Hung received the Ph.D. degree in 1999, in civil engineering from National Central University, Taiwan. Currently, he is an assistant professor in the Department of Safety, Health and Environmental Engineering, Ming Chi University of Technology, Taiwan. His research interest is indoor air quality, UVGI technique, study of green building materials.
Jong-Yih Kuo received the Ph.D. degree in 1998, computer science and information engineering from National Central University, Taiwan. Currently, he is an associate professor in the Department of Computer Science and Information Engineering, National Taipei University of Technology, Taiwan. His research interest is agent-base software engineering, intelligent agent system, agent system development, web-base application, machine learning and fuzzy theory.
International Journal of Environmental Science and Development, Vol. 4, No. 6, December 2013
657