the prosody-voice screening profile (pvsp): psychometric data and
TRANSCRIPT
THE PROSODY-VOICE SCREENING PROFILE (PVSP):
PSYCHOMETRIC DATA AND REFERENCE
INFORMATION FOR CHILDREN
Phonology Project Technical Report No. 1
Lawrence D. Shriberg
Joan Kwiatkowski
Carmen Rasmussen*
Gregory L. Lof
Jon F. Miller
Spring, 1992
Phonology Project, Waisman Center on Mental Retardation and Human Development,
University of Wisconsin-Madison
* Madison Metropolitan School District
Preparation of this report was supported by research grant R01 DC00496 from the NationalInstitute on Deafness and Other Communication Disorders, National Institutes of Health.

2
ABSTRACT
BACKGROUND
The Prosody-Voice Screening Profile PVSP. A final section provides detailed(PVSP) is a perceptual procedure to assess a prosody-voice reference data for children withspeaker's prosody and voice in conversational normal speech-language development andspeech. The PVSP provides summative and children with speech-language disorders ofper-utterance data on the appropriateness of known and unknown origin.a speaker's phrasing, rate, stress, loudness,pitch, and quality. Quantitative information isobtained on 31 types of exclusion codes re-flecting paralinguistic status and 31 subtypesof inappropriate prosody and voice. Thisreport is divided into three sections: (a) con-ceptual and technical rationale forconversation-based prosody-voice assessment, Conceptual and Technical Considerations(b) psychometric findings from validity, reli-ability, and efficiency studies, and (c) Prosody occupies a unique place in theprosody-voice reference data for 252 approxi- study of normal and deviant communication.mately 3-19 year-old children with normal Unlike speech, language, fluency, voice, andand disordered speech development. Some of hearing disorders, which each have their ownthe information in this first technical report research literatures and clinical subspecialities,overlaps information available in more detail the area of prosody disorders has no recog-in the PVSP Training Manual. Other sections nized subdiscipline. Relevant theories, re-present new technical data gathered in 1990- search, and applied information on prosody are1992. found in many fields, including descriptive
A prosody-voice assessment procedure nication arts, the phonetic sciences, and com-termed The Prosody-Voice Screening Profile municative disorders. Theoretical frameworks(hereafter, for convenience, the PVSP; Shri- and applications include proposals to charac-berg, Kwiatkowski, & Rasmussen, 1990) was terize the underlying organization of prosodydeveloped in the context of a research pro- in languages and language users, algorithms togram in speech disorders of known and un- deal with prosodic information in speechknown origin. The goal was to develop a recognition systems, models of the motorpsychometrically stable procedure based on control and phonatory mechanisms subservingthe same conversational speech sample used to prosody in manifest speech, and functionalassess speech production, language produc- analyses of prosody as a reflection oftion, and intelligibility. The first section of this sociolinguistic mores and affective traits andtechnical report provides background on states. Assessment methods for disorderedprosody and voice assessment, including prosody range from brief check lists, to elabo-
rationale on conceptual and technical issuesand a brief description of the major elementsof the procedure. The second section describesfindings from psychometric studies to estimatethe validity, reliability, and efficiency of the
linguistics, psycholinguistics, neurolinguistics,developmental linguistics, psychiatry, commu-

3
rated scaling tasks, to a variety of instrumental distinctions in collateral levels of processingapproaches, with increasing availability of within the prosodic domain of phonology.dedicated devices and applications software to That is, for both conceptual clarity in researchdisplay and quantify relevant acoustic corre- and for the use of PVSP information in clinicallates. contexts, the hyphenated term prosody-voice
Definitions suprasegmental domain of communication.Traditional linguistics distinguishes speech
from language, with speech divided into seg- Perceptual vs. Instrumental Assessment ofmental and suprasegmental levels of process- Prosody-Voiceing. A useful applied distinction between the For validity, reliability, and efficiencysegmental and suprasegmental (i.e., prosodic) purposes, an instrumental approach to thedomains of speech is provided by Stevens, measurement of prosody-voice is preferable toNickerson, and Rollins (1983), who defined a purely perceptual approach. Although dedi-prosody as: " . . . those characteristics that cated instruments and applications softwarespan linguistic units longer than a phonetic are available for certain measurement tasks insegment" (p. 35). Stevens and colleagues then clinical speech pathology, completely objectivespecify the three primary linguistic parameters measurement of all relevant parameters forwithin prosody: " . . . the contour of funda- prosody-voice assessment is currently not amental frequency versus time, the durations of technical option. For example, recognition,certain of the speech events and pauses, and quantification, and classification of such di-the assignment of relative prominence or stress verse prosody-voice behaviors as sound/to different syllables" (p. 35). syllable repetitions, use of inappropriate lexi-
A conceptual and methodological problem cal, emphatic, and sentential stress, inappropri-in the assessment of the suprasegmental behav- ate intonation in pragmatic contexts,iors described by Stevens et al. (1983) is that breathiness, nasality, denasality, and othersuch information is always referenced to the parameters cannot be accomplished by currentspeaker's vocal function values. Because voice or speech recognition programs. Al-suprasegmental elements 'ride' on voice pro- though emerging algorithms for computer-duction, a prosody assessment procedure assisted assessment of these and other parame-needs to deal directly with vocal function as ters have promise for future implementationreferenced to normative data in the appropriate (cf., Karnell, Scherer, & Fischer, 1991), aambient community. Thus, in addition to the comprehensive procedure providing informa-phrasing, rate, and stress domains of tion on all relevant parameters of prosody-suprasegmentals as defined by Stevens and voice analysis is currently feasible only ifcolleagues, a clinically-relevant prosody as- accomplished using the perceptual decisions ofsessment procedure must also include informa- a trained examiner (cf., Crystal, 1982; Gelfer,tion on the perceptual correlates of a speaker's 1988; Hirano, 1981; Laver, 1980; Murry,vocal pitch, loudness, and quality. Although Brown, & Rothman, 1987).the term prosody could reasonably be ex-tended to subsume both prosody and these Screening Prosody-Voicelatter characteristics, the hyphenated term The rationale for two additional perspec-prosody-voice in the PVSP retains the relevant tives on the measurement of prosody-voice is
is proposed as an appropriate label for the

4
also based on current technical limitations on profile on six suprasegmentals reflects a majorthe availability of a comprehensive instrumen- issue in clinical assessment: what is the appro-tal approach to assess phrasing, rate, stress, priate sampling context for prosody-voicepitch, loudness, and quality. First, if an omni- assessment? As with all assessment instru-bus prosody-voice assessment procedure can ments in communicative disorders, the basiccurrently be based only on perceptual judge- choice is whether the data are to reflect aments, the procedure should limit its assess- socially valid sample of customary or typicalment goals to screening rather than detailed speech, or whether the data reflect verbalanalyses or differential diagnosis. Specifically, behaviors evoked in response to a specific setthe primary goals should be limited to the of test stimuli (cf., Morrison & Shriberg, inidentification of potential speakers with press). Conversational speech with a relativeprosody-voice involvement and perhaps for or peer, with the sample recorded in a naturalsuch uses in intervention as generalization and setting without the speaker's knowledge, mightmaintenance probes to monitor progress. For be considered one endpoint on a samplingpersons identified as having potential prosody- dimension. At the other end are controlledvoice involvement, subsequent analyses using stimulus-response tasks, such as recording themore fine-grained diagnostic-assessment tools, speaker repeating a list of nonsense words orincluding instrumental technologies and other short experimental phrases or utterancesprotocols, can provide the required quantita- presented by an unfamiliar examiner. Debatetive and qualitative information for specific on the value of data from such spontaneousclinical and research questions. versus controlled or 'formal' assessment con-
The second rationale following from cur- texts and associated scoring permutations isrent technical limitations is that a screening found throughout the assessment literature.instrument should provide a profile reflecting The typical consensus position favors anpass-fail status for each of the relevant behav- assessment battery including both sampling ap-iors within the domain. Unlike diagnostic proaches, followed by careful interpretation ofinstruments, a screening measure does not findings.need to scale severity of involvement for each A conversational speech sample is used inprosody-voice characteristic. Rather, consis- the PVSP procedure because it is the onlytent with the psychometric goals of other sampling context that enables an integratedscreening instruments, the validity of a screen- assessment of speech-language-prosody. Asing instrument for prosody-voice should be described in the following sections, this meth-judged on how well it meets sensitivity/ speci- odological approach requires the developmentficity criteria. The screening instrument should of many conventions to account for the varietyhave the requisite sensitivity to detect all of frequent and infrequent behaviors that occurinvolved individuals, at the cost of specificity in unconstrained conversational speech. Theconstraints resulting in over-referral of persons increased costs in procedural complexity arewho on subsequent assessment are within the offset by gains in clinical and research validity,normal range on the construct under test. as well as in the efficiency of accomplishing
Sampling Context conversational speech sample.A final consideration in developing a
procedure to yield a prosody-voice screening
speech-language-prosody analyses on one
5
Development and Brief Description of the sites in the United States and Canada, includ-PVSP ing speakers (primarily children) with normal
History and Research Plan unknown origin, dysarthria, dysfluency,A protoversion of the PVSP was used in apraxia of speech, craniofacial disorders, voice
studies describing speech, language, and disorders, hearing disorders, emotional disor-prosody-voice characteristics of children with ders, and mental retardation; (b) develop thespeech delays of unknown origin (Shriberg & form and content of the procedure, includingKwiatkowski, 1982; Shriberg, Kwiatkowski, conceptual, perceptual, and instrumentalBest, Hengst, & Terselic-Weber, 1986). The support for each procedural guideline, rule,procedure used in these studies yielded only and code; (c) select and validate the audio-nominal-level summative decisions based on cassette exemplars and associated instructionalthe percentages of utterances in which perfor- text to teach the perceptual skills required tomance on each of six suprasegmentals (Phras- code prosody-voice; (d) conduct initialing, Rate, Stress, Pitch, Loudness, Quality) psychometric studies, including validity, reli-was judged inappropriate for the conversa- ability, and efficiency estimates; (e) dissemi-tional context. Specifically, each of the six nate preliminary findings for commentsuprasegmental categories was estimated as (Shriberg, Kwiatkowski, & Rasmussen, 1989a,either normal (no inappropriate utterances in 1989b); (f) conduct external psychometricthe sample), questionable (10%-15% inappro- studies and disseminate the procedurepriate utterances), or involved (more than 15% (Shriberg et al., 1990); and (g) collect andinappropriate utterances). disseminate all relevant technical information
The original prosody-voice assessment on the PVSP, including reference data forprocedure was later elaborated in a study of speech-normal and speech-disordered childrenphonological and social-vocational issues in a (this technical report).group of adults with mental retardation(Shriberg & Widder, 1990). Codes for sub- Brief Description of the PVSPtypes of inappropriate prosody-voice behaviors Data for the PVSP are based on audio-were developed specifically for individuals cassette recordings of spontaneous conversa-with mental retardation, including a set of tional speech samples. A set of free speechperceptual criteria for each code and summary sampling procedures is followed to insure highanalyses at the interval-level of measurement. quality recordings and linguistically appropri-The theoretical and clinical utility of the ate samples (Shriberg et al., 1990). The paperprosody-voice data obtained from these stud- and pencil formats for scoring and plottingies provided the impetus to initiate a research PVSP data are illustrated in the sample caseprogram to develop and psychometrically data in Figures 1 and 2. As shown in the leftvalidate a more comprehensive screening panel in Figure 1 [see Figure 1, page 45],instrument. utterances in the speech sample are coded to
The current PVSP was developed over a yield a pass-fail profile reflecting the percent ofthree-year period that included five sequential appropriate utterances for the three prosodyresearch goals: (a) collect and review audio- and the four voice suprasegmentals. A score ofcassettes containing continuous speech sam- 90% or better meets criteria for pass, whereasples from 10 speaker groups from different a score below 90% is considered a fail. Evi-
speech development, speech-language delay of

6
PSYCHOMETRIC STUDIES
dence presented later suggests the utility of four panels in the Prosody-Voice Profileadding a questionable fail (80%-89.9%) area display respectively: the summative data on theto the high end of the fail range. six suprasegmentals (top left); the percentage
Utterances in the sample are excluded from of utterances excluded because they metprosody-voice coding if they meet one or more criteria for one or more of the 31 exclusionof 31 exclusion codes as shown in the top codes (top right; see Figure 1, right panel forsection of the right panel in Figure 1. Data on key to all codes); and the percentages ofthe frequency of occurrence of each exclusion utterances codable for prosody-voice that metcode provide potentially useful information on criteria for 1 of the 15 inappropriate prosodya number of diagnostic and discourse issues, codes (lower left) and 16 voice codes (lowerincluding evidence of both appropriate and right). Detailed information for each of the ele-inappropriate paralinguistic behaviors. Also ments shown in these clinical (Figures 1 and 2)shown in the right panel in Figure 1 are the 31 and research (Figure 3) examples are pre-inappropriate prosody-voice codes from which sented in the following discussions of validity,the summative data in the left panel are de- reliability, and efficiency studies.rived. In addition to the category for appropri-ate prosody-voice, 15 categories are used todescribe inappropriate prosody occurring in anutterance, and 16 categories are used to clas-sify inappropriate voice. Specific informationon normative issues and several other consid-erations used to generate response definitionsfor each code are provided in a followingsection on concurrent validity.
As shown in the left panel in Figure 2 [see Face, Content, and Consensual ValidityFigure 2, page 46], coding logs are used tokeep track of the sequence of PVSP decisions, Face, content, and consensual validity forwith as few as 12 codable utterances required a measure is claimed when the consensusfor valid prosody-voice screening of certain opinion of experts is that the items and sub-speakers. A page for Comments and Recom- scales are a valid reflection of the contentmendations, as illustrated in the right panel in domain for the constructs the measure pur-Figure 2, is used to summarize clinical-re- ports to assess. Under such validity inspectionsearch findings and recommendations. for the PVSP are the following questions (see
The four-panel display in Figure 3 [see Figure 1 for all references to PVSP elements):Figure 3, page 47], termed a Prosody-Voice (a) Do the 31 Exclusion Codes have face,Profile illustrates the use of PVSP information content, and consensual validity as necessaryin a research context. A Prosody-Voice Profile and sufficient utterance conditions underis obtained from a utility program in the PEP- which prosody-voice should not be coded? (b)PER package running on a VAXstation 3100 Do the 31 inappropriate Prosody-Voice Codes(Shriberg, 1986, in submission). The data in have face, content, and consensual validity asthis figure were taken from a study of children necessary and sufficient descriptors for thewith normally developing (N) and delayed (D) varieties of disordered prosody-voice observedspeech (to be described in a later section). The in children with communicative disorders? and
Validity Studies
7
(c) Do the six suprasegmentals divided into adequacy of the 31 codes for inappropriateProsody (Phrasing, Rate, Stress) and Voice prosody-voice.(Loudness, Pitch, Quality: Laryngeal; Reso-nance) have face, content, and consensual Criterion Validityvalidity as necessary and sufficient subdomainsof suprasegmentals in conversational speech? Development of response definitions to
Validity data for the three questions were identify each of the inappropriate prosody-obtained in three stages. First, a review of the voice codes was guided by literature sourcesprosody-voice literature was undertaken to and, where possible, instrumental verificationidentify and cross-tabulate the categories used using audiotaped samples from the library ofto classify disordered prosody and voice tapes of speech-normal and speech-delayed(Shriberg et al., 1989a, 1989b). Research with children. The several stages of these proce-the two previous versions of the procedure dures for each of the relevant suprasegmentalshad established the need for many categories; are described in the Appendix.emphasis for the current procedure was to Where possible, instrumental proceduresexpand the procedures for use with more were also used to estimate the criterion valid-involved and older speakers. Second, emerging ity of over 300 audiotaped exemplars selectedand candidate categories and terms were to teach the coding procedures. Exemplarsdiscussed with colleagues who conduct clinical were coded by consensus by the first threeresearch in the primary areas of speech, lan- authors, using well-maintained Dictaphoneguage, fluency, voice, and hearing disorders. 2550 audiocassette playback devices. WhereThird, the first three authors listened to several the criterion validity of these perceptually-hundred speech samples from the 10 normal based coding decisions could not be deter-and disordered speech-language categories mined by instrumental means, criterion validitylisted earlier to attempt to capture all percep- was estimated using comparisons with thetual aspects of voice and prosody. New and perceptual decisions of a panel of expertmodified exclusion and prosody-voice codes listeners. The following sections describe thewere developed as necessary until they were methodologies and findings of the instrumentalsufficient to quantify perceptual impressions of and perceptual studies.inappropriate prosody-voice on all new speechsamples. For example, PV32: Nasopharyngeal Instrumental Validity Studyresonance was developed because no one term Of the six suprasegmentals--Phrasing,currently used in the literature clearly captured Rate, Stress, Loudness, Pitch, and Qualitythis percept. Thus, the claim of face and con- (Laryngeal; Resonance)--instrumental valida-tent validity for the PVSP is based on the tion of perceptual decisions was feasible forsurvey of the literature, prior work, and the Rate, Stress, Pitch, and two of the descriptorsdevelopment of the necessary and sufficient for inappropriate Quality. Two signal process-codes to describe inappropriate prosody-voice ing environments, CSpeech (Milenkovic,occurring in the extensive audiocassette li- 1991) and VOCAL (1989), were used for thebrary. The claim for consensual validity is comparative analyses in these fourbased on discussions with knowledgeable suprasegmental domains. All instrumentalclinical-research colleagues on the provisional measures were accomplished by the fourth
author who worked independently of the first

8
three authors and was blind to their consensus randomly selected group of 28 of the 50perceptual decisions on most exemplars. The (56%) Stress exemplars, with 25 confirmationsAppendix provides technical information on yielding an overall agreement level of 89%. Asthe software and procedures used to digitize, shown in Table 1, all three (100%) of theobtain reference values, and compare percep- PV13: Multisyllabic Word Stress exemplarstual to instrumentally-aided decisions. The were judged by instrumental criteria to fit thefollowing sections review the data obtained response definitions established for the percep-from procedures described in the Appendix tual coding decisions. Four of the four (100%)and summarized in Table 1 [see Table 1, page exemplars for PV14: Reduced/Equal Stress28]. In Table 1, instrumental confirmations of and 18 of the 21 (86%) exemplars for PV15:perceptual decisions are expressed as percent- Excessive/Equal/Misplaced Stress were con-ages of confirmations. firmed by the acoustic data. The remaining
1. Rate. As shown in the left side of Table three exemplars for PV15 were not actually1, perceptual-instrumental comparisons were disconfirmed, as the acoustic data were onlymade on 26 of the 39 (67%) exemplars used in useful to support the perceptual correlates ofa manual to train listeners to identify inappro- intensity, frequency, and duration involved inpriate Rate (Shriberg et al., 1990). As shown the perception of inappropriate stress. Foron the right side of Table 1, 92% of the Rate example, the concept of misplaced stresscomparisons confirmed the perceptual judge- requires a linguistic decision on whether thements, with 20 (77%) exactly similar and an manifest word stress is appropriate in theadditional 4 (15%) in the same subclass. Be- discourse context. The validity of such percep-ginning with the Too Slow subclass, the instru- tual decisions can be supported by acousticmental confirmation data for 10 of the 14 data, but the acoustic signal does not provide(71%) Too Slow exemplars, PV9: Slow Artic- a point-to-point representation of the constructulation/Pause Time and PV10: Slow/ Pause of appropriate linguistic stress.Time, supported the perceptual decisions. Two 3. Pitch. The Appendix describes theof the failures to confirm the perceptual deci- procedures used to establish reference data forsions met criteria for the classification of Too children's fundamental frequency and thoseSlow but disagreed at the subclass level of used to assess the concurrent validity of thePV9 versus PV10. In one of these exemplars, pitch exemplars used in the PVSP to trainan equivocal signal associated with audible listeners to identify inappropriate pitch. Asinspiration/expiration may have influenced the shown in Table 1, 14 of the 14 (100%) pitchacoustic timing of Articulation Time. Both of exemplars in the PVSP training materials werethe other confirmation failures met instrumen- technically appropriate for concurrent validitytal criteria for Too Slow but were perceptually comparison with exact confirmations obtainedjudged as borderline counterexamples. Ten of on 10 (71%) exemplars and within-class con-the 12 (83%) exemplars for PV11: Fast and firmations for the remaining 4 (29%) exem-PV12: Fast/ Acceleration were supported plars. Two of the exemplars for PV19: Lowinstrumentally. Pitch/Glottal Fry could not be confirmed
2. Stress. The acoustic output and agree- instrumentally for the criterion duration andment criteria for Stress judgements are de- sentence location of glottal fry. Similarly, twoscribed and illustrated in the Appendix. Con- of the exemplars for PV21: High Pitch/ Fal-current validity was randomly assessed for a setto could not be confirmed instrumentally for

9
the criterion frequency and duration of fal- propriate voice code. They also were asked tosetto. provide a written rationale for each of their
4. Quality. Although considerable progress decisions. Results are shown in Table 2 [seehas been made on the objective assessment of Table 2, page 29].such disordered voice qualities as breathy, The percentage data in Table 2 indicaterough, and denasal, considerable disagreement that on average, the judges provided criterionabout appropriate methodology is evident in validation for approximately four out of everythe acoustics and aerodynamics literatures. five (78%) exemplars used to teach a type ofTherefore, the validity of most of the voice inappropriate voice pitch, laryngeal quality, orquality exemplars was assessed in the percep- resonance quality. Three classes of disagree-tual validity study (to follow). As shown in ments on the exemplars were evident in analy-Table 1, the criterion validity of 25 of the 31 sis of the judges' anecdotal comments: (a) they(81%) exemplars for PV26: did not hear the percept described as theBreak/Shift/Tremulous and PV27: Register criteria for the exemplar, (b) they heard theBreak was assessed instrumentally using the percept, but it was not severe enough to meetprocedures described in the Appendix. their understanding of the criteria for inappro-Twenty-four of the 25 (96%) perceptually- priate voice, and/or (c) they heard the criterialbased codes were exactly confirmed by the inappropriate voice, but it did not meet ainstrumental analyses. PVSP rule for those codes that required inap-
Perceptual Criterion Validity Study words in the utterance. As shown in Table 2,Three clinicians-researchers provided criterion validation was strongest for the
concurrent perceptual validity data on the laryngeal quality exemplars (Breathy, Rough,PVSP codes that could not be assessed by Strained, and Diplophonia; average agreement,instrumental means alone. Each of the judges 86.4%), less strong for the inappropriate Pitchhad extensive experience in hospital-based exemplars (Low/Glottal Fry, Low,voice clinics, as well as research credentials in High/Falsetto, High; average agreement,the voice sciences. Each of these off-cite 77.1%), and least strong for the resonancejudges was provided with a stimulus tape and quality exemplars (Nasal, Denasal, Nasopha-a booklet of definitions for the descriptors they ryngeal; average agreement, 74.5%).were to use to evaluate inappropriate pitch and Three observations about the data in Tableinappropriate laryngeal and resonance quality. 2 are important to underscore. First, the num-The judges independently progressed through ber of exemplars for some categories wasthe materials using their preferred audio play- relatively small (i.e., 7 of the 11 categories hadback system. For each of the 167 samples on fewer than 10 exemplars). Second, among thethe stimulus tape--136 exemplars of 136 exemplars, there were only 4 that wereinappropriate pitch and quality and 31 ran- not attested as meeting criterion by at least onedomly assigned foils (i.e., utterances that did of the three judges. Finally, there were observ-not meet PVSP criteria for an exemplar able trends among the three judges, with Judgecategory)--the judges indicated whether or not 2 and Judge 3 differing most in agreement withthey agreed with its use as an exemplar. That the keyed exemplars. Together with findingsis, they were asked to decide whether the from the instrumental validity studies, the dataexemplar met the PVSP criteria for the inap- in Table 2 are viewed as support for the
propriate voice to occur on at least 50% of the

10
criterion validity of the PVSP inappropriate ring on more than 15% of utterances in theprosody and voice codes. To the degree that sample (fail). The cross-hatched bars are thejudges disagreed with the key and with one percentages of a new group of 57 speech-another, these findings are consistent with the delayed children who failed based on theevident limitations in perceptual judgement procedures used in the current PVSP proce-that have been reported in all areas of commu- dure. Coding of the 57 speech-delayed chil-nicative disorders (eg., fluency: Ingham, 1990; dren in the current data set was done by theLudlow, 1990; Moore & Perkins, 1990; seg- third author who followed all coding guide-mental transcription: Shriberg & Lof, 1991; lines and procedures in Shriberg et al. (1990).dysarthria: Sheard, Adams, & Davis, 1991). Compared to data from prior studies using
Concurrent Validity estimates of involvement are reasonably similar
In addition to face, content, consensual, Phrasing, Stress, Loudness, and Quality.and criterion validity, an estimate of a meas- However, clear differences are apparent forure's concurrent validity provides important the remaining two domains, Rate and Pitch. Indata on the interpretation of scores from a the current sample, only one or two (2%)clinical measure. In the present context, there children were at least questionable on theseis no comparable prosody-voice measure variables, whereas the prior studies indicatedagainst which to compare PVSP scores. In lieu that approximately 25% of children were atof an alternative measure, one estimate of the least questionably involved. Inspection of bothconcurrent validity of the PVSP can be ob- sets of data in relation to coding criteria fortained by comparing PVSP data obtained with the original and the revised procedures sug-the present instrument to data generated on gests that these differences cannot be allocateddifferent subjects using the previous version of to differences in only subjects or measures.the PVSP. Rather, it appears that both variables may
Figure 4 [see Figure 4, page 48] is a sum- account for the obtained differences. Specifi-mary of the prosody-voice involvements of cally, the 90 speech-delayed children in theeach of two study groups. Based on the earlier samples may have had more prosody-PVSP's 90% screening cutoff for a pass, the voice involvement, as indicated by their lowerfilled bars are the percentages of 90 speech- intelligibility scores (cf., Shriberg &delayed children who failed or were question- Kwiatkowski, in submission); however, theable fails on each of the six prosody-voice current PVSP procedure has more stringentsuprasegmentals, as reported in Shriberg & criteria for rate and pitch judgements. AnKwiatkowski (1982) and Shriberg et al. estimate of the standard error of measurement(1986). Prosody-voice coding of the 90 chil- for each of the six suprasegmentals, based ondren in the previous data sets was accom- a dataset of 252 samples (to be described),plished by panels of judges using the 1982 indicates that measurement error for scaleprotoversion of the PVSP, with 0 = appropri- scores ranges from less than 1% to approxi-ate prosody-voice (pass); 1 = slight to pro- mately 3%. Thus, with the previous caveats innounced deviation occurring on fewer than mind, the generally similar prevalence patterns10%-15% of utterances (questionable fail); for prior and current groups of speech-delayedand 2 = slight to pronounced deviation occur- children assessed by different versions of the
the protoversion of the procedure, current
for four of the six prosody-voice domains:

11
PVSP is viewed as providing concurrent clinical entity. Similar prosody-voice analysesvalidity support for the procedure. using the PVSP have been completed on
Construct Validity constructs of prosody-voice involvement are
Finally, support for the construct validity syndrome, fluctuating conductive hearing lossof the PVSP is suggested by the data in Figure associated with early recurrent otitis media5 [see Figure 5, page 49]. The two trends in with effusion, and psychosocial-affectivethis Prosody-Voice Profile are prosody-voice involvement.data for a group of 64 children (the 57 childrendescribed previously, plus 7 more children)and a group of 14 children with suspectedapraxia of speech (Shriberg, Aram, & Several independent estimates of the reli-Kwiatkowski, in preparation). According to ability of PVSP data were obtained, includingthe literature on the adult form of acquired information on sampling stability, interjudgeapraxia of speech, a hallmark diagnostic char- and intrajudge reliability of coding, and inter-acteristic of this clinical entity is prosodic nal consistency and stability of screeninginvolvement (Kent & Rosenbek, 1982). If the decisions.construct validity of a procedure is supportedto the degree that it explicates the target Stability of Speech Samplingconstruct, to what degree does the PVSPprovide useful information on the type and The stability of the conversational speechdegree of prosody-voice involvement in chil- samples has been supported in a number ofdren with suspected developmental apraxia of studies concerned with segmental variablesspeech? (Shriberg & Lof, 1991; Morrison & Shriberg,
As shown in Figure 5, compared to the in press; Shriberg & Kwiatkowski, 1982,speech-delayed children, children with sus- 1985; Shriberg & Widder, 1990). Detailedpected developmental apraxia of speech pro- descriptive and inferential statistical analysesduced a statistically lower percentage of ap- presented in these studies indicate that childrenpropriate utterances (top left panel) and corre- and adults produce continuous conversationalspondingly higher percentages of inappropriate speech samples that are consistent within andprosody codes (lower left panel). Substantive across subjects for measures of utterancediscussion of these findings (see key to productivity, intelligibility, representativenessdescriptors, Figure 1) will be reported in a of canonical, grammatical, and intended seg-forthcoming paper. In the present context, the mental forms, and reactivity. Specific to thedescriptive trends and significant prosody- present context, the intersample andvoice differences between speech-delayed intrasample stability of such distributionalchildren and children with suspected develop- characteristics as parts of speech, type/tokenmental apraxia of speech are viewed as con- ratios per minute, number of intelligible wordsstruct validity support for the PVSP proce- per minute, canonical forms, percentage ofdure. Essentially, the procedure provides a occurrence of intended phonemes, and inmeans to explicate the nature of prosodic particular, speech registers (Shriberg &involvement in children with this putative Kwiatkowski, 1985), indicates that conversa-
several other clinical groups within whom the
also of interest, including children with Down
Reliability Studies
12
tional speech is robust relative to structural, dimension being judged. Agreement waslinguistic, and pragmatic characteristics. The lowest when the exemplar represented a mid-procedures for speech sampling presented in way point on the dimension being judged andShriberg et al. (1990) are the outgrowth of certain segmentation, exclusion, and prosody-methodological work to standardize proce- voice rules and codes were routinely associ-dures for conversational speech sampling, ated with lower interjudge and intrajudgeincluding provisions for identifying affective agreement.states in which a speaker's speech samplewould be invalid for the purposes of prosody- Examiner Reliability Study Ivoice assessment. The first of two examiner reliability studies
Intrajudge and Interjudge Agreement who responded to a notice for a short-term
Initial Studies and two undergraduates--were hired on anThe three domains in which examiner hourly basis to learn the procedure on their
reliability is relevant in the PVSP procedure own from the training manual and audiotapes,are: (a) the application of rules for segmen- and when ready, to take three tests to assesstation (i.e., parsing the conversational speech their understanding and reliability of exclusionsample into utterance length units), (b) the and prosody-voice coding. No other selectionapplication of rules and perceptual decisions criteria were used; the three judges werefor excluding utterances from prosody-voice essentially the first three persons to respond tocoding (exclusion codes), and (c) the appli- the job vacancy notice. They proceededcation of rules and perceptual decisions for independently to learn the PVSP proceduresdetermining appropriate prosody-voice and (see the following Efficiency section for moreclassifying inappropriate prosody-voice behav- detail). They then each took a 30-utteranceiors. The reliability of computational and test, received brief feedback on the nature ofclerical tasks required to derive percentage their disagreements with the key, and thenscores was not considered relevant to estimate. took a second and third 30-utterance testFormatting procedures were designed to without further feedback. The three tests hadmaximize accurate and efficient recording of been equated for overall difficulty.codes, percentage calculations, and summative In keeping with the need to estimate indi-scoring. vidual reliability percentages for 'easy' versus
During the different stages of PVSP devel- 'hard' perceptual decisions (cf., Diedrich &opment, interjudge and intrajudge agreement Bangert, 1976; Kearns, 1990; Kearns &estimates on utterance segmentation, exclusion Simmons, 1988), two percentages of agree-coding, and prosody-voice coding within and ment were calculated for each of the judges:among the first three authors ranged from agreement on whether an item was appropri-point-to-point percentages of agreement in the ate or inappropriate (i.e., without regard tolow 70%s to 100% agreement (Shriberg et al., the exact inappropriate code) and exact agree-1989a). The general pattern of the disagree- ment on the code used for all utterances keyedments was predictably related to the cognitive as inappropriate. The overall agreement data,and/or perceptual difficulty of the coding task agreement on appropriate and inappropriate,in relation to the status of the utterance on the are taken to reflect the reliability of screening
was conducted with three university students
research job. The students--one masters-level

13
decisions (i.e., the summative percentages examiner reliability study. One of the authorsused for pass/fail decisions). Agreement on had independently scored 24-utterance speechonly those utterances keyed as inappropriate samples from 28 children with normally-devel-was presumed to reflect the outcome for the oping speech and speech delays of known andmore difficult perceptual decision. Table 3 [see unknown origin. The former group consistedTable 3, page 30] is a summary of the agree- of 14 3-19 year-old children (M = 6 years, 3ment data for all judges on each of the three months) randomly selected from a referencetests. It should be kept in mind that the num- database for language acquisition (Miller,ber of tokens keyed as inappropriate was 1990) and from control subjects used in otheralmost half the number keyed as appropriate. studies. The 14 3-15 year-old speech disor-The three judges averaged low to mid 80% dered children were randomly selected from aagreement with the key on both agreement database of subjects in a variety of studies;criteria, with Judge 1 having more difficulty they included children with speech delays oflearning the task (see later Efficiency section). unknown origin and speech delays associated
For the most stringent test of reliability--an with mental retardation, psychosocial involve-estimate of agreement with the key reached by ment, early recurrent otitis media, and sub-'average' independent learners using the train- mucosal clefts of the palate. All tapes had beening materials--the agreement data in Table 4 prosody-voice coded by one of the authors[see Table 4, page 31] are the averaged perfor- (see later Efficiency section for information onmance of all three judges over all three tests. procedures). For the current purposes, theThe two levels of agreement are the same as randomly selected sample of 28 tapes repre-those described for Table 3. These estimates sented 11% of a database of 252 samples. Theyielded overall interjudge agreement figures author and the masters-level student who hadranging from approximately 77% to 96%, with participated in Study I individually scored allmean agreement on the exact codes for just the the transcripts using a master transcript toutterances keyed as inappropriate ranging enable utterance-by-utterance comparison.from approximately 69% to 100%. The pattern Reliability analyses for exclusion coding andof percentages is generally consistent with the prosody-voice coding are summarized respec-criterion validity data, with reliable use of the tively in Table 5 and Table 6 [see Tables 5 andquantitative and perceptual criteria for inap- 6, pages 32-33].propriate pitch and quality among the more Table 5 is a summary of three increasingdifficult PVSP codes to acquire. Again, this levels of precision of intrajudge and interjudgereliability estimate reflects averaged perfor- agreement on exclusion coding. The first blockmance over three tests of the first three stu- of agreement percentages indicates relativelydents who applied for a job requiring they high (81%-100%) intrajudge and interjudgelearn a set of guidelines and perceptual skills agreement on the assignment of utterances toentirely on their own. either an exclusion code or a prosody-voice
Examiner Reliability Study II indicates good (76.5%-100%) intrajudge andThe intrajudge and interjudge consistency interjudge agreement on assignment of an
of PVSP scores for a large sample of children utterance to one of the four categories ofwith speech-language disorders of known and exclusion codes (i.e., indicating agreement thatunknown origin was estimated in a second an exclusion was assigned a Content/Context,
code. The middle block of agreement data also

14
Environment, Register, or State code). Finally, codes, as shown in the second set of intrajudgewhen percentaged on the basis of exact agree- and interjudge data in Table 6, was fromment on 1 of the 31 Exclusion Codes, agree- approximately 47% to 100%. Overall Exactment again ranged from 76.5% to 100%. Agreement, reflecting agreement on utterancesMean agreement percentages for all six esti- judged appropriate and the exact inappropri-mates were above 90%. ate code, ranged from approximately 74% to
Table 6 is a summary of the intrajudge and 99% across the six suprasegmentals.interjudge percentage of agreement on the six As indicated in both these Screeningprosody-voice domains, divided into Screening Agreement and the Exact Agreement esti-Agreement and Exact Agreement. The three mates, intrajudge and interjudge reliability forestimates of the reliability of screening deci- the use of the 31 prosody-voice codes maysions reflect the consequences of prosody- range from acceptable to unacceptable forvoice coding on the summative percentage certain utterances, children, codes, examiners,scores used for a pass/fail decision on each of and lengths of time. PVSP screening decisionsthe six suprasegmentals. The three sets of and assignment of an inappropriate code werepercentages indicate agreement on utterances particularly difficult for pitch and laryngealconsidered appropriate (referenced to the quality. These findings are consistent withcomparison transcript or judge), inappropri- criterion validity results, reflecting the particu-ate, and an overall appropriate plus inappro- lar difficulties in making unaided perceptualpriate estimate. Both intrajudge and interjudge decisions in these vocal function domains foragreement on appropriate ranged from ap- speakers who have marginal involvement. Asproximately 86% to 100% across the sum- with all assessment instruments, it is importantmative screening variables. Intrajudge and to obtain frequent reliability checks on PVSPinterjudge agreements for utterances judged decisions and to undertake recalibration asinappropriate by the standard judge (i.e., one needed.of the authors) on the first listening rangedfrom approximately 22% to 97%. The total Internal Consistency of PVSP Scores andnumber of tokens and number of tokens per PVSP Screening Outcomeschild sample was relatively small for many ofthese comparisons (e.g., only nine utterances Initial Studiesfor inappropriate pitch). Anecdotal comments The internal consistency of the PVSP wasby the standard judge indicate that there may first assessed in a study using the first andhave been some 'drift' or 'decay' (O'Leary & second 12 utterances in 24-utterance samplesKent, 1972) in the response definitions used from 64 children with developmental phono-for some suprasegmentals. Some of the sam- logical disorders. Using the 90% pass criterionples had been scored more than one year for each suprasegmental, results indicated thatearlier, at a time when response definitions and 80%-100% of the retest decisions were similarthe audiocassette training tapes had not been across the six suprasegmentals, providing thefully developed. As shown in the Overall data child received a pass based on the first 12for Screening Agreement, point-to-point utterances. There were too few subjects re-percentages ranged from approximately 80% ceiving a fail on the first 12 utterances toto 99%. The ranges of Exact Agreement on adequately assess the stability of failing scoreseach of the 31 inappropriate prosody-voice on these few occurrences. Pending confirma-

15
tion in the studies described below, the find- coefficients for Phrasing, Rate, Stress, andings from the initial studies generated the Loudness. The screening outcome findingsinterim procedural guideline that a 12-utter- summarized in Table 8 form a similar patternance sample is sufficient for speakers who to the findings in Table 7. Across the sixhave a clear pass on all six suprasegmentals, or suprasegmentals and the two speech statuswho consistently produce the same, readily- groups, the internal consistency of pass andcoded inappropriate prosody-voice in each fail scores are higher for the part-whole com-utterance. However, a 24-utterance sample is parisons. The internal consistency of the failsuggested for speakers with low utterance decisions is considerably less stable than thatproductivity or speakers whose prosody-voice of the pass decisions, but there were too fewis inconsistently or marginally inappropriate on samples available for appropriate comparisons.any one of the six suprasegmentals. The data in Table 7 and Table 8 are viewed
Large Group Study PVSP, including the guidelines for obtainingA second estimate of the internal consis- 12-utterance versus 24-utterance samples
tency of PVSP scores was obtained using two developed in the internal consistency study. Assamples of scores randomly selected from the inferred from both Table 7 and Table 8, a 12-database of 252 PVSP samples described utterance sample is stable (and very efficient)above. Table 7 [see Table 7, page 34] is a for speakers whose non-involvement yields asummary of the internal consistency results clear pass, whereas speakers whose inconsis-based on PVSP scores and Table 8 [see Table tent involvement yields a fail based on 128, page 35] is a summary of internal consis- random utterances are more reliably testedtency findings for screening outcome deci- with a 24-utterance PVSP sample.sions. The data in both tables were obtainedfrom the same two randomly chosen PVSPtranscripts from 40 subjects in each of the twospeech status groups referred to previously-- Efficiency issues in assessment are con-the 115 speech-normal children and 137 cerned with the time and effort needed to (a)speech-delayed children. The transcripts were accurately learn a procedure, (b) reliablysplit into odd and even utterances, with sum- administer a procedure, (c) validly score amary percentages (Table 7) and screening procedure, and (d) insightfully interpret theoutcomes (Table 8) for each of the six supra- results from a procedure. To date, PVSP datasegmentals calculated from the 12 utterances on the first three of these four efficiency do-in each half. mains has been collected in several studies.
As shown in Table 7, all of the part-wholeSpearman Rho coefficients are statistically Efficiency Data on Learning the PVSPsignificant at the .01 alpha level, with theabsolute magnitude of the Rho values ranging Information concerning the learning pro-from .66 to 1.00 (M = .88) across supra- cess during the acquisition of the conceptualsegmentals and between the two speech status and perceptual skills required in PVSP scoringgroups. The split-half coefficients were attenu- was obtained in three studies: (a) an initialated by the large number of tied scores which, study involving two clinical instructors, (b) anon inspection, greatly affected the obtained independent learning study involving a group
as supporting the internal reliability of the
Efficiency Studies
16
of three students who learned the procedure min). Their session lengths averaged 1 hour 33entirely from the training manual and audio- minutes (range = 56 min to 2 hr 26 min), andtapes, and (c) a group learners study involving they reported spending an average of 16 ses-a class of students who learned the procedure sions (range = 15 to 18 sessions) to learn thewith the assistance of classroom instruction. procedure completely on their own. In all
Initial Study time to learn the procedure, and the leastInformation on processes involved in experienced undergraduate student took the
learning the PVSP was first assessed in a field most time. Interestingly, these overall trainingtest of a preliminary version of the procedure. data correspond to typical times and sessionsTwo experienced clinical instructors volun- used in semester-based laboratory work, suchteered to learn the materials from a preliminary as learning phonetic transcription.version of the text and take three perceptualtests that assessed learning of exclusion and Group Learners Studyprosody-voice coding. The quantitative results Informal assessment of the learning pro-and their anecdotal comments on the training cess for PVSP was completed by a class of 25materials provided invaluable information on undergraduate students who learned the proce-modifications in form and content needed to dure in the context of a quarter-semester classefficiently teach the procedure. Essentially, in phonological disorders (P. Hargrove, per-they experienced difficulty with the individual sonal communication). Over a period of nineresponse definitions for the many codes, sug- weeks, approximately one hour per week wasgesting the need for training formats that spent in class discussion of conceptual andwould assist the reader in acquiring and retain- procedural issues and group listening to theing the cognitive concepts and perceptual training tapes, with students optionally spend-skills. ing additional and independent time reading
Independent Learning Group Study tapes. Students each completed an analysis ofThe independent learners were the three the prosody of one speaker.
students--one masters-level and two under- The teacher's anecdotal report of thegraduates--whose reliability data were de- process and outcome of student learning canscribed previously. They were hired on an be summarized as follows: (a) they eventuallyhourly basis to independently learn the proce- grasped each element of the procedure, al-dure entirely from the training materials. When though the complexity of the task was initiallythey felt they were appropriately prepared, perceived as somewhat daunting; (b) they mostthey took tests to assess their understanding readily learned the utterance segmentationand interjudge agreement with the scoring key. tasks; (c) they had some difficulty reachingThe independent learners also kept information agreement on some of the exclusion codes;on the number of hours needed to learn the and (d) they had the most overall difficultymaterials, with the decision left completely up learning to code Loudness and Pitch, withto them about when they felt ready to take the disagreements on specific inappropriatefirst test. Their logs indicated a mean total prosody-voice codes distributed across the 31training time of 15 hours 7 minutes to learn the codes. These findings reflect the limitations inprocedure (range = 10 hr 15 min to 18 hr 45 perceptual evaluation of voice, as observed
cases, the masters-level student took the least
the training manual and listening to the training

17
previously in both the validity and the reliabil- children's utterances were excluded fromity data. More generally, they are reminiscent prosody-voice coding (range = 15% to 85% ofof the course of learning to phonetically tran- utterances). Inspection of the exclusion codesscribe speech, wherein certain response classes indicated that 44% of these utterances metare extremely difficult for some, but not all, criteria for one of three codes: C7: Only Onestudents to learn. As with other clinical skills, Word (35%), C12: Too Many Unintelligiblelearning to assess prosody-voice requires a Words (5%), and R2: Narrative Register (4%).substantial commitment of time. The remaining 56% of excluded utterances
Efficiency Data on Administering the PVSP These findings indicate the importance of
As the PVSP data are taken from the same PVSP scoring. Specifically, the examiner canconversational speech samples used for vari- maximize efficiency of subsequent PVSPous forms of speech assessment (e.g., severity scoring by using speech sampling techniquesof involvement, error pattern, intelligibility that yield relatively low frequencies of one-index) and language assessment (e.g., struc- word responses and narrative registers. Thetural stage, discourse analysis), the approxi- total times required for exclusion coding andmately 10 minutes needed to obtain a sponta- prosody-voice coding averaged 1.1 minute perneous conversational speech sample is consid- utterance (range = .5 min to 1.5 min). Assum-ered an efficient use of both a subject's and an ing approximately one minute per utterance forexaminer's time. That is, no special skills, glossing/segmenting utterances, the totalstimuli, or associated time demands beyond scoring time for a 12-utterance sample wouldthose needed for conversational speech-lan- be approximately 25 minutes.guage sampling are required to obtain a suit-able sample for a PVSP analysis. As described Large Group Studyabove, the training manual provides specific Reference data from a large group study ofguidelines to insure that the samples are valid the time needed to score the PVSP and otherand efficient for PVSP scoring. efficiency questions are presented in Table 9
Efficiency Data on Scoring the PVSP from time logs kept by one of the authors who
Initial Study database of 252 speech samples from 11An initial study of efficiency issues was subgroups of children with normal and disor-
completed based on data provided by one of dered speech acquisition. For the presentthe authors who independently completed purposes, children in the 11 subgroups werePVSP analyses on 57 3-5 year-old children divided into two large groups. A group of 137with moderate to severe speech disorders of approximately 3-19 year-old children (Mean =unknown origin (Shriberg et al., 1989a, 6 years, 3 months; SD = 4.0 years) had speech1989b). The conversational speech samples disorders of unknown origin and disordershad been gathered prior to the development of associated with risk factors and suspectedthe PVSP and associated guidelines for obtain- etiologies, including early recurrent otitising samples for efficient PVSP coding. Results media, mental retardation, suspected apraxiaindicated that approximately 50% of these of speech, unilateral brain lesion, psychosocial
were spread across the other exclusion codes.
sampling procedures for the efficiency of
[see Table 9, page 36]. These data were taken
completed PVSPs on the previously described

18
involvement, and submucosal clefts. A group of obtained-to-codable utterances for bothof 115 approximately 3-18 year-old speech- speech-normal and speech-delayed children.normal children (Mean = 5 years, 5 months; However, as described earlier, many of theSD = 2 years, 11 months) was comprised of 71 exclusion codes provide information about a3-5 year-old children sampled from a language speaker's paralinguistic performance and thusdatabase (Miller, 1990) and 44 children used provide important information in their ownas control samples in the speech disorders right on pragmatics and discourse. It is for thisstudies. The actual number of samples used for reason that the excluded utterances have beenthe different calculations in Table 9 ranged divided into the 31 types, and data on theirfrom 71 to 252. reliability and frequency of occurrence has
As shown in the first row of Table 9, the been carefully assembled. For example, usingaverage sample for both groups took approx- an earlier form of the PVSP, the prosody-imately 42 minutes to score (SD = approxi- voice of some adults with mental retardationmately 25 min). The speech-disordered chil- was characterized as including high frequen-dren required twice as much time (64.7 min) as cies of some socially inappropriate behaviorsthe speech-normal children (28.8 min). These (Shriberg & Widder, 1990; see also discussionfigures reflect only the time needed to segment of interpretation of PVSP results in Shriberg etand code the samples, as glosses were already al., 1990). The reference data in the thirdavailable from prior phonetic transcription. section of this report provides information on
The second row in Table 9 provides data the relative occurrence of each of the exclu-on the total number of utterances that had to sion codes in speech-normal and speech-de-be coded to meet the criteria of 24 utterances layed children. Additional detail at the level ofeligible for prosody-voice coding, including groups based on risk factors and suspectedthe three codable warm-up utterances required etiological origin will be reported in subse-by the PVSP procedure (Shriberg et al., 1990). quent studies. Thus, although the average timeAcross the speech-normal and speech-disor- required to score a PVSP may be lengthy, thedered groups an average of approximately additional time required to code the exact52.7 utterances (SD = 22.4) were needed, bases for the exclusions is not viewed as ineffi-including the average of five utterances that cient. Times could be shortened for certainwere needed to obtain the three codable warm- clinical-research tasks, however, if exclusionup utterances. The average number of utter- coding was elected to be handled as a simpleances required was approximately 25% more binary decision.for the speech disordered group (59.9) com- The third row in Table 9 provides infor-pared to the speech-normal children (44.1), mation on a third procedural convention in therepresenting approximately twice the number PVSP that impacts efficiency--the requirementof prosody-voice codable utterances (24), plus that at least 50% of the utterances in a samplethe three codable warm-up utterances. These be four or more words in length. As shown indata are in good agreement with data from the the third row, an average of approximatelyinitial study. 71% of utterances of four or more words in
If excluded utterances in a sample are length were actually included in the samples,considered to be theoretically or clinically with similar percentages for both speech-statusuninteresting, the procedure would be con- groups. As indicated later in the reference datasidered fairly inefficient based on this 2:1 ratio (Table 10; see Table 10, pages 37-38), only

19
REFERENCE DATA
approximately 7% of subjects had frequencies among the relative involvement of the child,of occurrence of 5% or more of this exclusion the skills of the examiner who obtains thecode (i.e., had utterances that had to be ex- sample, and the skills of the prosody-voicecluded due solely to this requirement). This judge. Our experience suggests that withloss in efficiency is considered reasonable in practice, total times decrease substantially.relation to the validity concerns requiring thatjudgements of prosody-voice require utter-ances of varying lengths.
The final rows in Table 9 provide an infor-mal estimate of the relative difficulty of scor-ing PVSP samples. The coder used a four-category system to indicate if the samples wereparticularly difficult to score and the perceived Reference data for 252 children withsource of the difficulty. As shown, across both normally-developing speech-language andgroups approximately 87% of the samples speech disorders of unknown and knownwere scored without comment, with external origin are provided in Tables 10, 11, and 12.factors (e.g., inadequate speech sample, poor The data are taken from the same samples asaudio signal, interfering tape noises) account- described in the prior section, including 115ing for 7.6% of the remaining tapes and the speech-normal children and 137 children withspeaker's severity of involvement accounting speech delays of both known and unknownfor an additional 4.3% of the difficult samples. origin.These data differ somewhat for each of the Table 10 provides general reference dataspeech status groups, with proportionally more for the occurrence of the 31 PVSP exclusionspeech-delayed children's tapes experienced as codes in the speech samples. The left side ofmore difficult to score due to both external Table 10 provides group central tendency andfactors and severity of involvement. In addi- distributional data for the proportional occur-tion to supporting the expectation that it takes rence of each exclusion code in the two sub-more time and effort to code disordered com- groups, speech-normal and speech-disordered,pared to normal prosody-voice, these effi- and combined statistics. The right side of theciency findings also underscore the value of table provides data on the percentage of chil-obtaining good speech samples and high qual- dren in each of three categories of exclusionity audio recordings. code occurrence: 0% occurrence of the code;
Overall, these efficiency figures agree with 1-4.9% occurrence; 5% or greater occurrence.the data from the initial studies, indicating an As shown in the left side of Table 10, each ofaverage of two minutes coding time per utter- the exclusion codes occurs at least once in atance. Thus, anything that reduces the overall least one speech sample, thus supporting thenumber of utterances needed for a valid PVSP content validity of the 31 exclusion codes. Thesample reduces the time needed for scoring. most frequently occurring codes are C7: OnlyThe time needed for glossing differs consider- one word (approximately 25% of total utter-ably, depending on such factors as the child's ances), R2: Narrative register (approximatelymoment-to-moment intelligibility and the 7% of total utterances), and C12: Too manyexaminer's familiarity with the child. As with unintelligibles (approximately 4% of totalall such data, efficiency reflects interactions utterances). These figures are in good agree-

20
ment with those found in the initial efficiency high occurrence of some inappropriatestudies. prosody-voice scores. These data are purpose-
Of particular interest in Table 10 is the fully representative of an undifferentiatedsimilarity in the occurrence of exclusion codes group of children with normal and disorderedin the speech-normal and speech-delayed speech, providing reference data against whichchildren. The distributions for each group are to compare suprasegmental involvement ofcomparable for most of the three distributional well-defined subgroups (e.g., Shriberg &statistics in the proportional occurrence data Widder, 1990); see also Figure 5.(mean, SD, range) and in each of the percent- Table 12 [see Table 12, page 41] providesage categories in the percentage of children data for the seven summary-level supra-data (percentage of children with 0% occur- segmentals that comprise the PVSP profile.rence of the code, 1-4.9% occurrence, and 5% The left section provides group central ten-or greater occurrence of the exclusion code). dency and dispersion data, and the right sideIn addition to its use as reference data, the provides the percentages of children whosimilarity in the two groups in Table 10 pro- scored 90% or above (pass), 80%-90% (ques-vides additional support for the stability of tionable fail), or below 80% (fail) on thisconversational speech samples. For example, screening measure. The speech-normal andapproximately 29% of both speech-normal and speech-delayed children are clearly different onspeech-disordered children respond with "I several of the summary suprasegmentals,don't know" (C3) on approximately 1%-5% of although inferential tests to assess the statisti-their utterances. Most interesting from a cal significance of differences were notclinical-research perspective are the values in deemed appropriate to compute for thesethe range column in the left side of Table 10, reference data (see Figure 3 for a relatedwhich indicate that some individual children comparison). Inspection of each of the cells inhave extremely high percentages of occurrence Table 12 and comparison of data for theof certain exclusion codes. Aside from expla- speech-normal versus speech-disorderednations due to technical or speech sampling children generates a number of hypothesesconstraints, the correlates of such high rates of about prosody-voice in normal and disorderedbehaviors within any of the four classes of speech development. In the present context,exclusion codes are interesting to pursue in the technical focus of the data is primarilytheir own right. toward the use of the PVSP as a screening
Table 11 [see Table 11, pages 39-40] device for clinical research.provides data on the 31 inappropriate prosody- The data in Table 12 support the decisionvoice codes. The formats for data presentation to locate the cutoff levels at 90% for clearare the same as those used in Table 10. Over- pass and 80% - 90% for questionable fail. Asall, the data for the speech-normal and speech- indicated in the percentage ranges for alldisordered children are generally similar. What variables, children acquiring speech normallydifferences are observed generally indicate may have PVSP scores below these two cutoffmore involvement for the speech-disordered points. The goal of a screening instrument is tochildren, particularly on several stress codes adjust the rates of false positives and falseand several resonance codes. Again, the range negatives such that no child with a potentialdata provide the most provocative findings, problem passes the screen. Follow-up inspec-with individual children in both groups having tion of the prosody-voice codes and instru-

21
CONCLUSION
ACKNOWLEDGMENTS
mental analysis can determine the clinical ders, DC00496. We wish to acknowledge theseverity of the problem. For example, a ques- collegiality and competent assistance of a verytionable fail or fail on laryngeal or resonance large number of persons who made crucialquality could readily be explained by transient contributions at the several stages of thislower or upper respiratory involvement (see project. Space limitations permit only thethe boxes for these state variables in Figure 1). following alphabetized list: Dorothy Aram,Similarly, low appropriate phrasing scores Russell Attoe, Barri Babow, Diane Bless,could be due to the high rates of repetitions or Dolores Boyd, Eugene Buder, Karen Carlson,revisions that are associated with periods of Maria Cavicchio, Barbara Ekelman, Patricialanguage expansion or particular affective Engebose, Stanley Ewanowski, Florencestates. Filley, Karen Forrest, Leslie Glaze, Sandy
These psychometric and initial empirical Linda Rammage, Dorothy Rorick, Margaretdata on the prosody-voice characteristics of Rosin, Hye-Kyeung Seung, John Strei, Robinchildren suggest that there is much to be Susser, Edie Swift, Helen Thielke, Catherinelearned about this domain of communicative Trost-Steffen, Gary Weismer, Dennis White,disorders. As much or perhaps more than any Carol Widder, Frank Wilson, and Wayneof the other areas of speech-language process- Zimmerman.ing, prosody-voice function involves trait andstate variables that play a vital role in aspeaker's perceived communicative compe-tence. Perceptual screening procedures such asthe instrument described in this technicalreport represent first generation approaches,ideally to be followed by instrumentally-aidedtechnologies for diagnostic assessment needsin research and clinical practice.
This work was supported by a grant fromthe Public Health Service, National Instituteon Deafness and Other Communication Disor-
Grafton, Patricia Hargrove, Kirsteen Harrison,Anne Heintzelman, Linda Hesketh, RebeccaHinke, Megan Hodge, Sara Hoffman, DorisKistler, Anne Kleckner, Karen Koerber, DannaKoschkee, Mark Leddy, Jane Loncke, PaulMilenkovic, Linda Milosky, Kellie Moran,Lois Nelson, Bruce Orchard, Amparo Ortiz,

22
REFERENCES
Baken, R. J. (1987). Clinical measurement of of Speech and Hearing Research, 31, 131-speech and voice. Boston, MA: Little, 136.Brown and Company. Kent, R. D., & Rosenbek, J. C. (1982). Pro-
Crystal, D. (1982). Profiling linguistic dis- sodic disturbance and neurologic lesion.ability. London: Edward Arnold. Brain and Language, 15, 259-291.
Diedrich, W. M., & Bangert, J. (1976). Train- Laver, J. (1980). The phonetic description ofing speech clinicians in recording and voice quality. Cambridge: Cambridgeanalysis of articulatory behavior. Washing- University Press.ton, DC: US Office of Education Grant Ludlow, C. L. (1990). Research proceduresNo. OEG-0-70-1689 and OEG-0-71-1689. for measuring stuttering severity. In J. A.
Forrest, K., & Rockman, B. K. (1988). Cooper (Ed.), Research needs in stutter-Acoustic and perceptual analysis of word- ing: Roadblocks and future directions (pp.initial stop consonants in phonologically 26-31). ASHA Reports, No. 18.disordered children. Journal of Speech and Milenkovic, P. (1987). Least mean squareHearing Research, 31, 449-459. measures of voice perturbation. Journal of
Gelfer, M. P. (1988). Perceptual attributes of Speech and Hearing Research, 30, 529-voice: Development and use of rating 538.scales. Journal of Voice, 2, 320-326. Milenkovic, P. (1991). CSpeech User's Man-
Hirano, M. (1981). Clinical examination of ual, Version 3.1. Dept. of Electrical andvoice. New York: Springer-Verlag. Computer Engineering, University of
Ingham, R. J. (1990). Theoretical, method- Wisconsin-Madison.ological, and ethical issues in treatment Miller, J. F. (1990). SALT Reference Dataefficacy research: Stuttering therapy as a Base Project. Language Analysis Labora-case study. In L. B. Olswang, C. K. tory, Waisman Center on Mental Retar-Thompson, S. F. Warren, & N. J. Min- dation and Human Development, Univer-ghetti (Eds.), Treatment efficacy research sity of Wisconsin-Madison.in communication disorders (pp. 15-29). Moore, S. E., & Perkins, W. H. (1990). Valid-Rockville, MD: American Speech-Lan- ity and reliability of judgements of authen-guage-Hearing Foundation. tic and simulated stuttering. Journal of
Karnell, M. P., Scherer, R. S., & Fischer, L. Speech and Hearing Disorders, 55, 383-B. (1991). Comparison of acoustic voice 391.perturbation measures among three inde- Morrison, J. A., & Shriberg, L. D. (in press).pendent voice laboratories. Journal of Articulation testing versus conversationalSpeech and Hearing Research, 34, 781- speech sampling. Journal of Speech and790. Hearing Research.
Kearns, K. J. (1990). Reliability of procedures Murry, T., Brown, W. S., & Rothman, H.and measures. In L. B. Olswang, C. K. (1987). Judgements of voice quality andThompson, S. F. Warren, & N. J. preference: Acoustic interpretations. Jour-Minghetti (Eds.), Treatment efficacy re- nal of Voice, 1, 252-257.search in communication disorders (pp.
79-90). Rockville, MD: American Speech-Language-Hearing Foundation.
Kearns, K. P., & Simmons, N. N. (1988).Interobserver reliability and perceptualratings: More than meets the ear. Journal

23
O'Leary, K. D., & Kent, R. (1972). Behavior Shriberg, L. D., Kwiatkowski, J., & Rasmus-modification for social action: Research sen, C. (1989a, November). The Prosody-tactics and problems. In L. A. Voice Screening Profile (PVSP): I. De-Hammerlynck, L. C. Handy, & E. J. Mash scription and psychometric studies. Paper(Eds.), Behavior change: Methodology, presented at the Annual Convention of theconcepts, and practice. Champaign, IL: American Speech-Language-HearingResearch Press. Association, St. Louis, MO.
Sheard, C., Adams, R. D., & Davis, P. J. Shriberg, L. D., Kwiatkowski, J., & Rasmus-(1991). Reliability and agreement of rat- sen, C. (1989b, November). The Prosody-ings of ataxic dysarthric speech samples Voice Screening Profile (PVSP): II. Refer-with varying intelligibility. Journal of ence data and construct validity. PaperSpeech and Hearing Research, 34, 285- presented at the Annual Convention of the293. American Speech-Language-Hearing
Shriberg, L. D. (1986). PEPPER: Programs Association, St. Louis, MO.to examine phonetic and phonologic eval- Shriberg, L. D., Kwiatkowski, J., & Rasmus-uation records. Hillsdale, NJ: Lawrence sen, C. (1990). The Prosody-VoiceErlbaum. Screening Profile. Tucson, AZ: Commu-
Shriberg, L. D. (in submission). Four new nication Skill Builders.speech-prosody measures for genetics and Shriberg, L. D., & Lof, G. L. (1991). Reli-other subgroup research in developmental ability studies in broad and narrow pho-phonological disorders. netic transcription. Clinical Linguistics
Shriberg, L. D., Aram, D. M., & Kwiatkow- and Phonetics, 5, 225-279.ski, J. (in preparation). Segmental and Shriberg, L. D., & Widder, C. J. (1990).suprasegmental characteristics of children Speech and prosody characteristics ofwith developmental apraxia of speech. adults with mental retardation. Journal of
Shriberg, L. D., & Kwiatkowski, J. (1982). Speech and Hearing Research, 33, 627-Phonologic disorders I: A diagnostic clas- 653.sification system. Journal of Speech and Stevens, K. N., Nickerson, R. S., & Rollins,Hearing Disorders, 47, 226-241. A. M. (1983). Suprasegmental and pos-
Shriberg, L. D., & Kwiatkowski, J. (1985). tural aspects of speech production andContinuous speech sampling for phono- their effect on articulatory skills and intelli-logic analyses of speech-delayed children. gibility. In I. Hochberg, H. Levitt, & M. J.Journal of Speech and Hearing Disorders, Osberger (Eds.), Speech of the hearing50, 323-334. impaired: Research, training and person-
Shriberg, L. D., & Kwiatkowski, J. (in sub- nel preparation (pp. 35-51). Baltimore,mission). A descriptive profile and sub- MD: University Park Press.group studies in developmental phono- VOCAL: Program to edit and analyze verballogical disorders. utterances. (1989). Research Computing
Shriberg, L. D., Kwiatkowski, J., Best, S., Facility, Waisman Center on Mental Retar-Hengst, J., & Terselic-Weber, B. (1986). dation and Human Development, Univer-Characteristics of children with speech sity of Wisconsin-Madison.delays of unknown origin. Journal ofSpeech and Hearing Disorders, 51, 140-161.

24
APPENDIX
DEVELOPMENT OF RESPONSEDEFINITIONS AND CRITERION
VALIDITY PROCEDURES
Instrumental Measures four inappropriate rate codes and to assess the
CSpeech (Milenkovic, 1991), operating on 1), acoustic rate characteristics were examinedan IBM-PC platform, was used for information for a sample of 21 utterances. From among theon fundamental frequency, jitter, shimmer, hundreds of recorded utterances collectedduration, and a waveform display. A Marantz during the development of the PVSP, the 21PMD221 3-head audiocassette recorder was samples met the following criteria: (a) spokenused as the input device. Speech signals were by a child, (b) contained a minimum of fourpreamplified and low-pass filtered using an syllables, (c) did not meet any of the exclusioneight-pole Butterworth filter (Model 901F1, code criteria affecting rate (i.e., respiratoryFrequency Device, Inc., Haverhill, MA) with involvement, overtalk, reading, singing, repeti-a 10K Hz cutoff frequency and subsequently tions, interfering noise, character register,sampled at 20K Hz using an analog-to-digital narrative register, whisper, belch, cough,converter with 12 bits of numeric resolution hiccup, laugh, or yawn), and (d) had not been(Labmaster, Scientific Solutions, Solon, OH). tentatively categorized as inappropriate forMeasurements of fundamental frequency, rate by the first three authors. The fourthjitter, and shimmer use Henke's FPRD algo- author obtained the following measures forrithm (cf., Forrest & Rockman, 1988; see also each of the 21 utterances, using the originalMilenkovic, 1987). transcripts and the cursers and expanded
VOCAL, a waveform editing and analyzing waveform displays in CSpeech for segmenta-software package running in the Harris/800 tion and duration:minicomputer environment, provided displays 1. Total Syllables: Number of syllables inof the fundamental frequency contour and the utterance glossed and segmented by theamplitude intensity displays of the peak volt- examiner.age envelope. A Sony TCM-5000 3-head 2. Utterance Length: Duration of utteranceaudiocassette recorder was used as the input (in milliseconds) from onset to offset of wave-device. The speech samples were digitized at form.20K Hz after processing through a low-pass 3. Syllables Per Second: Total Syllablesseven-pole elliptical filter by a DigiSound 16 divided by Utterance Length.analog-to-digital converter (Micro Technology 4. Articulation Time: Duration of theUnlimited, Raleigh, NC) with a conservative continuous energy portions of the utterance,cutoff of 9.8K Hz. Fundamental frequency as minus breaks in the energy pattern within anda function of time is calculated as the recipro- between words.cal of the period between successive glottal
pulses using Henke's FPRD algorithm. Theintensity contour uses the method of the firstdifference, rectified and smoothed, and pro-vides a peak voltage tracing for qualitativeevaluation.
Response Definitions for Rate
To develop the response definitions for the
concurrent validity of the exemplars (see Table

25
5. Pause Time: Utterance Length minus Criterion Validation for StressArticulation Time.
6. Syllables Per Articulation Time: Total The waveform, pitch envelope, and inten-syllables divided by Articulation Time. sity envelope routines of VOCAL were used to
7. Percent Pause Time: Pause Time di- assess the concurrent validity of the stressvided by Utterance Length. exemplars. To establish a reference database
8. Percent Articulation Time: 100 minus for the acoustic correlates of appropriatePercent Pause Time. stress, waveforms and pitch-intensity enve-
9. Average Syllable Time: Articulation lopes for 20 utterances perceived by the fourthTime divided by Total Syllables. author as grossly appropriate in stress were
Table A1 [see Table A1, page 42] is a randomly selected from the audiocassettesummary of descriptive data for the five rate database. Visual examination of the glossesmeasures. Relative to the 2-4 syllables per and acoustic records for these reference sam-second generally considered normal rate for ples were thus available for comparison toyoung children (Baken, 1987) and used for the exemplars selected for three individual PVSPperceptual decisions, these averaged instru- inappropriate stress codes--PV13: Multi-mental data suggested that syllable rates below syllabic Word Stress, PV14: Reduced/Equal2.2 syllables per second (syll/s) would be the Stress, and PV15: Excessive/Equal/Misplacedmore appropriate cutoff point for too slow and Stress.above 3.6 syll/s for too fast. A rate of 2.2 syll/s Criterion validation of 30 exemplars wasreflects a point two standard deviations below undertaken. The 30 selected exemplars werethe average of 3.7 syll/s shown in Table A1, free of involvement in other suprasegmentalsplus 10% for measurement error (i.e., 3.7 - (2 that would obviate or complicate acousticX .83) + 10% = 2.24 syll/s). Similarly, a rate analysis of stress. Criterion validation of one ofof 3.6 syll/s reflects a 10% margin for the three inappropriate stress codes in Table 1measurement error (i.e., 4 syll/s, less 10%). was considered confirmed if visual examina-The values for Percent Articulation Time and tion of the acoustic displays indicated one orAverage Syllable Time in Table 1 were used to more of the following correlates: (a) abruptdivide slow utterances into PV9: Slow Articu- increase in intensity, (b) extended duration, (c)lation /Pause Time or PV10: Slow/Pause extreme pitch alteration, (d) visible breaks inTime. If fewer than 50% of syllables in the the pitch and/or intensity envelopes, (e) equal-utterance were 300 ms or longer (i.e., mean ity of the pitch and intensity peaks per syllable,(248 ms) + one standard deviation (48.2)), the and (f) inappropriate number or duration ofrate was determined to be PV10, that is, too pauses.slow due to pause time only. Instrumental Figure A1 [see Figure A1, page 50] is ananalysis could not provide the information example of the VOCAL output used for crite-needed to differentiate PV11: Fast from PV12: rion validation of an exemplar for PV13:Fast/Acceleration (i.e., fast speech containing Multisyllabic Word Stress. The upper left-handat least one train of increasingly shorter sylla- panel is the waveform trace of the clinician-bles). child interaction. The clinician asks, "[I won-
der] if there are any other toys you have thatare fun?" (250 to 2750 ms), and the childresponds, "My little ponies." (3200 to 4800

26
ms). The lower left-hand panel is the frequency Response Definitions for Pitchtracing of the utterance, with an abrupt up-ward frequency shift occurring on the second The pitch extraction routines of CSpeechsyllable of "ponies" (4200 ms). The two right- were used to establish central tendencies forhand panels are waveform and frequency fundamental frequency in children and toanalysis expansions of the left-panels for the assess the concurrent validity of the pitchportion in which the inappropriate word stress exemplars. Syllable-level data on fundamentaloccurs. Note in the lower right panel the frequency was obtained at the midpoint of theincreased intensity of this syllable (peak volts) vowel. The fourth author randomly selected 21and the rapid upward fundamental frequency utterances from the audiocassette librarychange. meeting the following criteria: (a) spoken by a
Figure A2 [see Figure A2, page 51] is an child, (b) contained a minimum of four sylla-example of the VOCAL output used for crite- bles, (c) did not meet any of the exclusionrion validation of a PVSP exemplar for PV14: code criteria affecting pitch (i.e., respiratoryReduced/Equal Stress. The child was per- involvement, overtalk, reading, singing, repeti-ceived to say "Alice and I watch it" with tions, interfering noise, character register,reduced/equal stress evident in pitch, loudness, narrative register, whisper, belch, cough,and duration. This is confirmed in the VOCAL hiccup, laugh, or yawn), and (d) had not beenwaveform (top panel) and frequency/intensity judged abnormal for pitch.information (lower panel), indicating nearly Table A2 [see Table A2, page 43] is aflat frequency tracing of the first four syllables summary of the fundamental frequency data(175-1450 ms) with little variation in fre- derived from the total of 141 syllables in thequency, intensity, and duration. 21-utterance sample. The mean fundamental
The four panels in Figure A3 [see Figure frequency for the sample of syllables was 268A3, page 52] provide an example of the VO- Hz (SD = 46 Hz). Based on these empiricalCAL output used for criterion validation of a findings the response definition for PV20: LowPVSP exemplar for PV15: Excessive/ Equal/ Pitch was set at 50% or more syllables in theMisplaced Stress (also coded PV9: Slow utterance lower than one standard deviationArticulation/Pause Time). The two left panels below the reference mean (i.e., 268 Hz - 46 Hzare the VOCAL waveform and frequency/ = 222 Hz). Utterances meeting this criteriaintensity trace for a 17-syllable utterance with that also include 50% or more syllables belowan elapsed time of approximately 18 seconds. the 80 Hz cutoff established for fry registerThe waveform, frequency contours, and inten- (Baken, 1987) were given the code PV19:sity envelopes all show sharp onsets, lack of Low Pitch/Glottal Fry. The code for PV22:coarticulation from syllable to syllable, and High Pitch was set at the criterion of 50% orlimited variation in intensity, duration, and more syllables above 314 Hz (i.e., 268 Hz +frequency on each syllable. As shown in the 46 Hz = 314 Hz). Utterances meeting thisright two panels, expansion of the segments criteria that also include 50% or more syllablesoccurring from 7000-11000 ms in the left approximately 500 Hz or above were assignedpanels clearly reveals the syllable-by-syllable the code PV21: High Pitch/Falsetto.pattern of speech production, with approxi-mately equal-length pauses between syllables.
27
Criterion Validation for Quality
Outputs from CSpeech were used forcriterion validity assessment of two PVSPquality codes, PV26: Break/Shift/Tremulousand PV27: Register Break. Figure A4 [seeFigure A4, page 53] is a CSpeech waveform(upper tracing) and a frequency envelope(lower tracing) illustrating a frequency shiftsufficient to meet PVSP criteria for PV26 (asdistinguished from pitch shifts associated withPV13: Multisyllabic Word Stress). The initial638 ms of the utterance ". . . form a rainbow"has a steady pitch with a midpoint F of 179o
Hz. There is an obvious upward pitch shiftbeginning at "bow" which averages 350 Hz.
Figure A5 [see Figure A5, page 54] is aCSpeech display that illustrates the acousticconfirmation of PV 27: Register Break. Thefirst three words of the utterance, "Nope,they're not dead" has pitch levels of approxi-mately 207 Hz. On the final word, an upwardshift of approximately 278 Hz occurs, with thisadolescent hearing-impaired boy's voice break-ing into a falsetto range of approximately 485Hz.

28
Table 1. Summary of findings from the instrumental criterion validity study.
Confirmations Exemplars
Exact Within Class TotalSupra- Prosody-Voice Number Number %segmental Code Trained Sampled Sampled Number % Number %
Rate 39 26 67% 20 77% 4 15% 92%
Class: Too Slow 24 14 58% 10 71% 4 29% 100%
PV9: Slow Articulation/ 19 10 53% 8 80% 2 20% 100% Pause TimePV10: Slow/Pause Time 5 4 80% 2 50% 2 50% 100%
Class: Too Fast 15 12 80% 10 83% 0 -- 83%
PV11: Fast 6 5 83% 4 80% 0 -- 80%PV12: Fast/Acceleration 9 7 78% 6 86% 0 -- 86%
Stress 50 28 56% 25 89% 0 -- 89%PV13: Multisyllabic Word 3 3 100% 3 100% 0 -- 100% StressPV14: Reduced/Equal Stress 8 4 50% 4 100% 0 -- 100%PV15: Excessive/Equal/ 39 21 54% 18 86% 0 -- 89% Misplaced Stress
Pitch 14 14 100% 10 71% 4 29% 100%
Class: Low Pitch 6 6 100% 4 67% 2 33% 100%
PV19: Low Pitch/Glottal Fry 4 4 100% 2 50% 2 50% 100%PV20: Low Pitch 2 2 100% 2 100% 0 -- 100%
Class: High Pitch 8 8 100% 6 75% 2 25% 100%
PV21: High Pitch/Falsetto 5 5 100% 3 60% 2 40% 100%PV22: High Pitch 3 3 100% 3 100% 0 -- 100%
Quality 33 25 81% 24 96% 0 -- 96%
PV26: Break/Shift/Tremulous 31 23 74% 22 96% 0 -- 96%PV27: Register Break 2 2 100% 2 100% 0 -- 100%

29
Table 2. Summary of findings from the perceptual criterion validity study.
Percentage of Agreementa
Number of Utterances Judge 1 Judge 2 Judge 3 Mean Judges
Supra- PVsegmental Code Exemplars Foils Total E E+F E E+F E E+F E E+Fb b
Pitch 19 2 21 72.1 77.1 74.6 77.1 72.1 77.1 72.9 77.1
PV19: Low Pitch/ 4 0 4 75.0 75.0 75.0 75.0 75.0 75.0 75.0 75.0 Glottal Fry
PV20: Low Pitch 3 1 4 50.0 66.7 100 100 50.0 66.7 66.7 77.8
PV21: High Pitch/ 6 1 7 80.0 83.3 40.0 50.0 80.0 83.3 66.7 72.2 Falsetto
PV22: High Pitch 6 0 6 83.3 83.3 83.3 83.3 83.3 83.3 83.3 83.3
Quality 58 16 74 97.7 97.0 86.1 85.1 73.3 77.0 85.7 86.4
PV23: Breathy 9 1 10 100 100 62.5 66.7 75.0 77.8 79.2 81.5
PV24: Rough 33 11 44 90.9 87.9 81.8 84.8 68.2 69.7 80.3 80.8
PV25: Strained 7 1 8 100 100 100 100 66.7 71.4 88.9 90.5
PV28: Diplophonia 9 3 12 100 100 100 88.9 83.3 88.9 94.4 92.6
Resonance 59 13 72 81.4 74.1 73.5 74.8 68.7 74.7 74.5 74.5
PV30: Nasal 19 5 24 71.4 68.4 57.1 57.9 64.3 73.7 64.3 66.7
PV31: Denasal 17 5 22 83.3 76.5 83.3 88.2 66.7 76.5 77.8 80.4
PV32: Naso- 23 3 26 89.5 77.3 80.0 78.3 75.0 73.9 81.5 76.5 pharyngeal
Totals 136 31 167 83.9 83.5 78.5 79.4 71.6 76.4 78.0 79.8
All values are percentagesa
Exemplars (E); Exemplars plus Foils (E+F)b
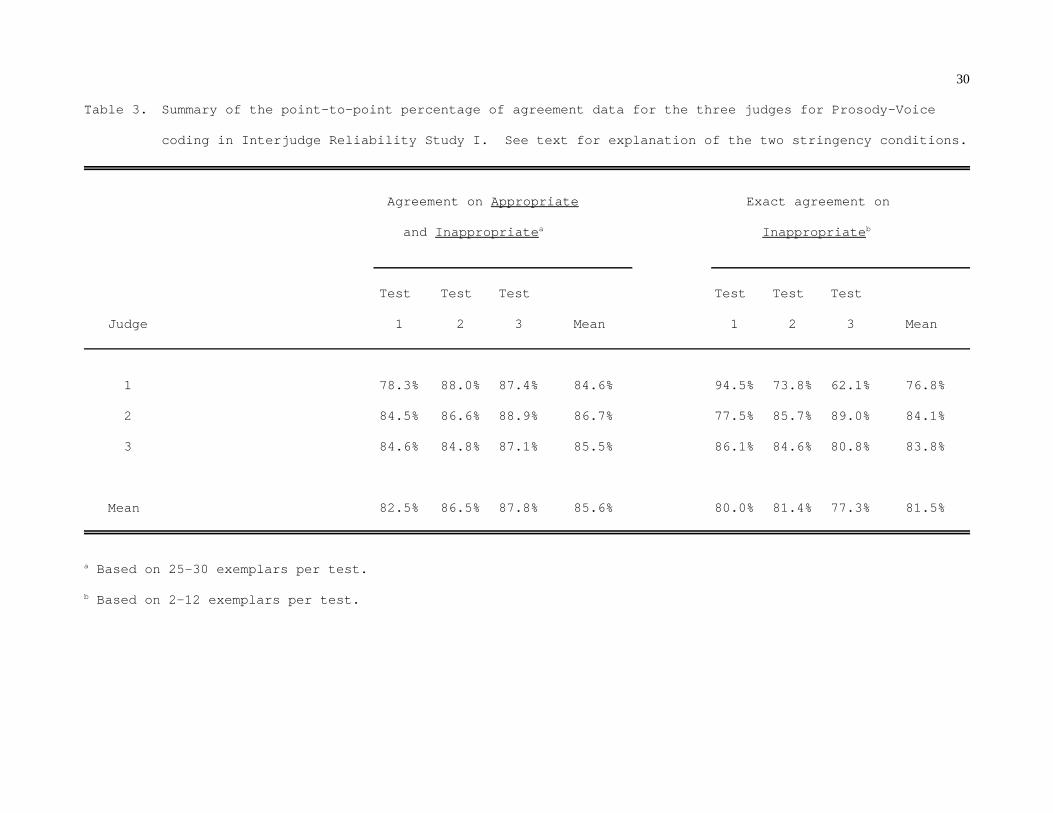
30
Table 3. Summary of the point-to-point percentage of agreement data for the three judges for Prosody-Voice
coding in Interjudge Reliability Study I. See text for explanation of the two stringency conditions.
Agreement on Appropriate Exact agreement on
and Inappropriate Inappropriatea b
Test Test Test Test Test Test
Judge 1 2 3 Mean 1 2 3 Mean
1 78.3% 88.0% 87.4% 84.6% 94.5% 73.8% 62.1% 76.8%
2 84.5% 86.6% 88.9% 86.7% 77.5% 85.7% 89.0% 84.1%
3 84.6% 84.8% 87.1% 85.5% 86.1% 84.6% 80.8% 83.8%
Mean 82.5% 86.5% 87.8% 85.6% 80.0% 81.4% 77.3% 81.5%
Based on 25-30 exemplars per test.a
Based on 2-12 exemplars per test.b

31
Table 4. Mean point-to-point interjudge agreement for exclusion and prosody-voice coding in Examiner
Reliability Study I.
Agreement on Appropriate Exact agreement on
Variable and Inappropriate Inappropriate
Exclusion Codes 87.9% 83.8%
Prosody-Voice Codes 86.5% 81.8%
Prosody 85.7% 77.2%
Phrasing 96.2% 69.1%
Rate 81.6% 77.4%
Stress 79.4% 85.2%
Voice 87.2% 86.4%
Loudness 92.6% 100%
Pitch 89.1% 77.8%
Quality 79.8% 81.3%
Laryngeal 82.1% 76.4%
Resonance 77.4% 86.1%

32
Table 5. Intrajudge and interjudge exclusion coding reliability based on 28 conversational speech samples
assessed in Examiner Reliability Study II.
Agreement on Agreement on Agreement on
Exclusion Code vs. Class of the the Exact
Prosody-Voice Code Exclusion Code Exclusion Code
M SD Range M SD Range M SD Range
Intrajudge 96.8% 3.6 85.7%-100% 95.4% 6.8 76.5%-100% 91.7% 5.3 84.2%-100%
Interjudge 91.7% 4.7 81.0%-100% 95.9% 5.8 81.0%-100% 90.6% 6.8 76.5%-100%

33
Table 6. Intrajudge and interjudge prosody-voice coding reliability in Examiner Reliability Study II.
Screening Agreement Exact Agreement
Appropriate Inappropriate Overall Inappropriate Overall
n n n n n n n n n n PV Code Samples Utterances Average Samples Utterances Average Samples Utterances Average Samples Utterances Average Samples Utterances Average
Intrajudge
Phrasing 28 535 97.4% 25 102 94.1% 28 634 96.2% 25 96 82.3% 28 633 94.0%
Rate 28 597 98.5% 12 37 45.9% 28 634 95.4% 8 17 88.2% 25 634 95.1%
Stress 28 547 97.3% 20 79 34.2% 28 628 90.6% 14 27 92.6% 28 634 89.4%
Loudness 28 580 97.8% 11 54 79.6% 28 634 96.2% 9 43 100% 28 634 96.2%
Pitch 28 623 99.7% 3 9 44.4% 28 634 98.9% 2 4 100% 28 634 98.9%
Quality
Laryngeal 25 496 92.1% 24 137 63.5% 28 634 85.3% 18 87 90.8% 28 634 85.0%
Resonance 27 553 89.2% 13 80 92.5% 28 634 89.4% 10 74 100% 28 634 89.6%
Interjudge
Phrasing 28 529 96.6% 24 103 82.5% 28 632 94.1% 23 87 60.9% 28 632 89.1%
Rate 28 592 93.8% 12 35 65.7% 28 632 91.6% 11 23 95.7% 28 632 89.7%
Stress 28 533 85.7% 22 93 51.5% 28 632 80.1% 17 50 84.0% 28 632 77.2%
Loudness 28 579 97.2% 10 53 54.7% 28 632 93.7% 6 29 100% 28 632 93.7%
Pitch 28 632 97.1% 3 9 22.2% 28 632 96.0% 2 2 100% 28 632 96.0%
Quality
Laryngeal 25 476 89.3% 22 146 52.1% 28 632 80.9% 14 77 46.8% 28 632 74.2%
Resonance 26 512 91.2% 12 117 96.6% 28 632 91.6% 9 113 100% 28 632 91.9%

34
Table 7. Internal consistency of PVSP scores.a
Split-Half Coefficients Part-Whole Coefficients
Speech- Speech- Speech- Speech- Normal Disordered All Normal Disordered All
Variable D p D p D p D p D p D p
Prosody
Phrasing .409 .0107 .197 .2194 .301 .0074* .834 .0001* .799 .0001* .816 .0001*
Rate .415 .0095* .519 .0012* .534 .0001* .785 .0001* .866 .0001* .873 .0001*
Stress .048 .7629 .695 .0001* .514 .0001* .579 .0003* .927 .0001* .847 .0001*
Voice
Loudness .591 .0002* .620 .0001* .605 .0001* .873 .0001* .842 .0001* .857 .0001*
Pitch 1.00 .0001* .827 .0001* .822 .0001* 1.00 .0001* 1.00 .0001* 1.00 .0001*
Quality
Laryngeal .611 .0001* .778 .0001* .707 .0001* .859 .0001* .899 .0001* .881 .0001*
Resonance .724 .0001* .903 .0001* .832 .0001* .884 .0001* .995 .0001* .957 .0001*
All coefficients are Spearman Rho (D) values corrected for ties (Siegel and Castellan, 1988) based on sample sizes of 40 speech-normala
and 40 speech-disordered children.* p < .01
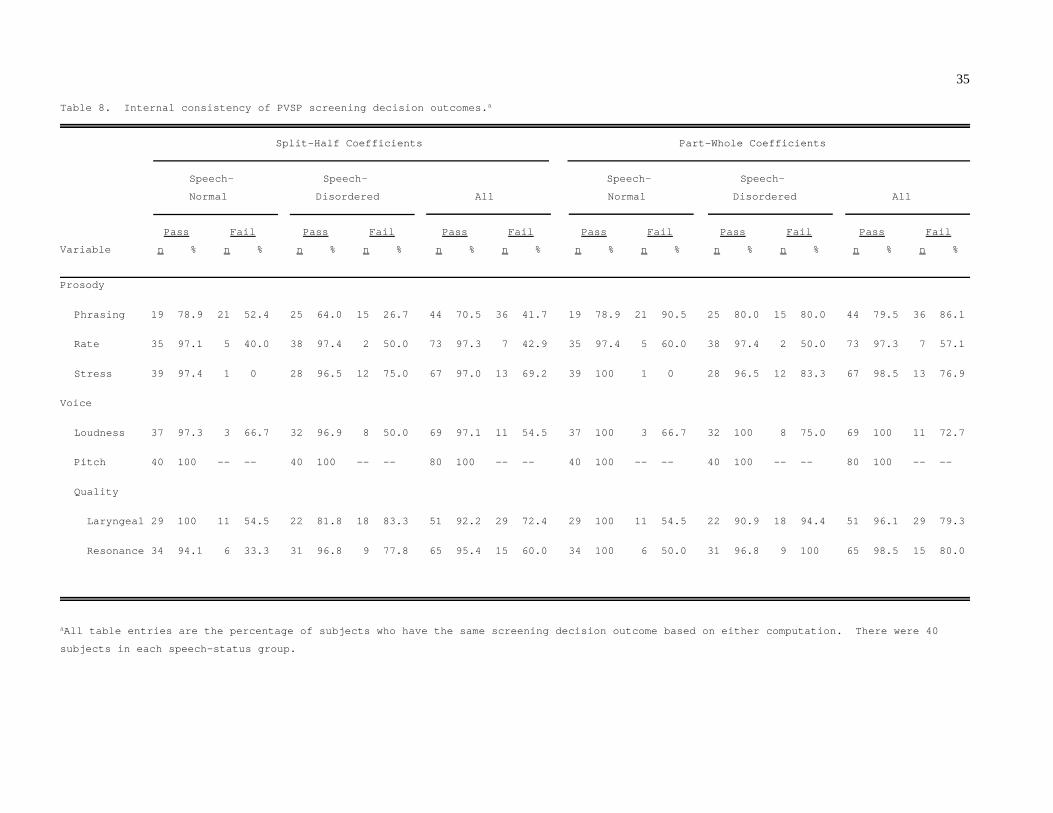
35
Table 8. Internal consistency of PVSP screening decision outcomes.a
Split-Half Coefficients Part-Whole Coefficients
Speech- Speech- Speech- Speech-
Normal Disordered All Normal Disordered All
Pass Fail Pass Fail Pass Fail Pass Fail Pass Fail Pass Fail
Variable n % n % n % n % n % n % n % n % n % n % n % n %
Prosody
Phrasing 19 78.9 21 52.4 25 64.0 15 26.7 44 70.5 36 41.7 19 78.9 21 90.5 25 80.0 15 80.0 44 79.5 36 86.1
Rate 35 97.1 5 40.0 38 97.4 2 50.0 73 97.3 7 42.9 35 97.4 5 60.0 38 97.4 2 50.0 73 97.3 7 57.1
Stress 39 97.4 1 0 28 96.5 12 75.0 67 97.0 13 69.2 39 100 1 0 28 96.5 12 83.3 67 98.5 13 76.9
Voice
Loudness 37 97.3 3 66.7 32 96.9 8 50.0 69 97.1 11 54.5 37 100 3 66.7 32 100 8 75.0 69 100 11 72.7
Pitch 40 100 -- -- 40 100 -- -- 80 100 -- -- 40 100 -- -- 40 100 -- -- 80 100 -- --
Quality
Laryngeal 29 100 11 54.5 22 81.8 18 83.3 51 92.2 29 72.4 29 100 11 54.5 22 90.9 18 94.4 51 96.1 29 79.3
Resonance 34 94.1 6 33.3 31 96.8 9 77.8 65 95.4 15 60.0 34 100 6 50.0 31 96.8 9 100 65 98.5 15 80.0
All table entries are the percentage of subjects who have the same screening decision outcome based on either computation. There were 40a
subjects in each speech-status group.

36
Table 9. Efficiency data for scoring the PVSP.
Speech-Normal Speech-Disordered All
Variable n M SD Range Total n M SD Range Total n M SD Range Total
Time required to score 114 28.8 14.7 15.0- 66 64.7 21.5 20.0- 180 42.0 24.6 15.0-
PVSP (minutes) 90.0 140.0 140.0
Number of utterances 115 44.1 12.3 25.0- 137 59.9 26.2 21.0- 252 52.7 22.4 21.0-
required to obtain 24 96.0 196.0 196.0
codeable utterances
including 3 codeable
warmups
Percentage of utterances 115 76.1% 13.1% 38.5%- 137 66.6% 15.6% 14.3%- 252 70.9% 15.6% 14.9%-
containing 4 or more words 100% 95.8% 100%
Percentage of samples
perceived as difficult to
score and source of
difficulty:
No comment 106 93.0% 54 76.1% 160 86.5%
Difficult due to 7 6.1% 7 9.9% 14 7.6%
external factors
Difficult due to 1 0.9% 7 9.9% 8 4.3%
severity of involvement
Difficult due to both 0 0% 3 4.2% 3 1.6%
factors above

37
Table 10. Reference data for the frequency of occurrence of the 31 Exclusion Codes in 115 speech-normal children and 137 speech-delayed children.
Proportional Occurrence Percentage of Childrena b
Speech-normal Speech-delayed Both Speech-normal Speech-delayed Both
Code M SD Range M SD Range M SD Range 0% 1-4.9% >5% 0% 1-4.9% >5% 0% 1-4.9% >5%
Content/Context
C1: Automatic sequential 0.07 0.39 0-2.3 0.09 0.40 0-2.4 0.08 0.39 0-2.4 96.5 3.5 0 94.9 5.1 0 95.6 4.4 0
C2: Back channel/aside 0.17 0.63 0-3.0 0.25 1.15 0-10.4 0.21 0.95 0-10.4 93.0 7.0 0 92.7 5.8 1.5 92.9 6.4 0.8
C3: I don't know 1.36 2.19 0-9.3 1.07 2.05 0-13.2 1.20 2.12 0-13.2 61.7 27.8 10.4 65.7 30.7 3.7 63.9 29.4 6.8
C4: Imitation 0 -- -- 0.19 0.78 0-5.0 0.10 0.58 0-5.0 100 0 0 93.4 5.8 0.7 96.4 3.2 0.4
C5: Interruption/overtalk 1.81 2.54 0-14.3 1.50 2.45 0-15.9 1.64 2.49 0-15.9 52.2 33.9 13.9 56.2 38.0 5.8 54.4 36.1 9.5
C6: Not 4(+) words 0.48 3.43 0-33.3 1.86 6.52 0-47.4 1.23 5.37 0-47.4 96.5 0.9 2.6 83.9 5.1 11.0 89.7 3.2 7.1
C7: Only one word 21.65 11.92 0-48.3 27.09 13.36 0-63.6 24.60 12.99 0-63.6 2.6 3.5 93.9 2.2 0.7 97.1 2.4 2.0 95.6
C8: Only person's name 0.56 1.54 0-8.6 0.89 1.87 0-10.0 0.74 1.73 0-10.0 85.2 10.4 4.4 71.5 23.4 5.1 77.8 17.5 4.8
C9: Reading 0.02 0.20 0-2.1 0.01 0.06 0-0.8 0.01 0.14 0-2.1 99.1 0.9 0 99.3 0.7 0 99.2 0.8 0
C10: Singing 0.11 0.65 0-5.0 0.13 0.72 0-6.1 0.12 0.69 0-6.1 96.5 2.6 0.9 94.9 4.4 0.7 95.6 3.6 0.8
C11: Second repetition 0.02 0.22 0-2.3 0.10 0.60 0-6.1 0.06 0.47 0-6.1 99.1 0.9 0 96.4 2.9 0.7 97.6 2.0 0.4
C12: Too many 2.17 3.30 0-19.6 6.22 6.68 0-43.7 4.35 5.77 0-43.7 53.9 30.4 15.7 23.4 31.4 45.3 37.3 31.0 31.8
unintelligibles
Environment
E1: Interfering noise 0.44 1.03 0-6.5 0.73 1.90 0-13.6 0.60 1.57 0-13.6 81.7 17.4 0.9 75.2 21.9 2.9 78.2 19.8 2.0
E2: Recorder wow/flutter 0.07 0.44 0-3.5 0.56 5.43 0-63.2 0.33 4.01 0-63.2 97.4 2.6 0 95.6 2.9 1.5 96.4 2.8 0.8
E3: Too close to 0.02 0.18 0-1.9 0.41 1.11 0-9.0 0.23 0.85 0-9.0 99.1 0.9 0 81.0 17.5 1.5 89.3 9.9 0.8
microphone
E4: Too far from 0.49 1.76 0-12.5 1.37 3.08 0-27.3 0.97 2.59 0-27.3 88.7 8.7 2.6 62.8 29.2 8.0 74.6 19.8 5.6
microphone
Register
R1: Character register 0.36 2.02 0-20.0 0.94 5.84 0-64.4 0.67 4.52 0-64.4 93.9 4.4 1.7 89.1 8.0 2.9 91.3 6.4 2.4
R2: Narrative register 5.47 13.41 0-55.8 7.57 14.06 0-70.6 6.61 13.78 0-70.6 80.0 2.6 17.4 58.4 11.7 29.9 68.3 7.5 24.2
R3: Negative register 0.10 1.07 0-11.5 0.22 0.88 0-6.3 0.17 0.97 0-11.5 99.1 0 0.9 92.0 7.3 0.7 95.2 4.0 0.8
R4: Sound effects 0.27 1.04 0-7.0 0.22 0.80 0-5.6 0.24 0.91 0-7.0 92.2 6.1 1.7 90.5 8.0 1.5 91.3 7.1 1.6
R5: Whisper 0.65 3.59 0-35.8 0.26 1.24 0-12.5 0.44 2.59 0-35.8 89.6 8.7 1.7 91.2 8.0 0.7 90.5 8.3 1.2

38
Table 10. Continued.
Proportional Occurrence Percentage of Childrena b
Speech-normal Speech-delayed Both Speech-normal Speech-delayed Both
Code M SD Range M SD Range M SD Range 0% 1-4.9% >5% 0% 1-4.9% >5% 0% 1-4.9% >5%
States
S1: Belch 0 -- -- 0.03 0.28 0-2.8 0.02 0.21 0-2.8 100 0 0 98.5 1.5 0 99.2 0.8 0
S2: Cough/throat clear 0.02 0.21 0-2.2 0.11 0.58 0-4.4 0.07 0.45 0-4.4 99.1 0.9 0 96.4 3.7 0 97.6 2.4 0
S3: Food in mouth 0.04 0.32 0-2.7 0.02 0.19 0-2.3 0.03 0.26 0-2.7 98.3 1.7 0 99.3 0.7 0 98.8 1.2 0
S4: Hiccup 0.11 0.83 0-8.3 0 -- -- 0.05 0.57 0-8.3 97.4 1.7 0.9 100 0 0 98.8 0.8 0.4
S5: Laugh 1.45 4.04 0-25.9 1.26 2.78 0-15.5 1.34 3.40 0-25.9 75.7 16.5 7.8 74.5 14.6 11.0 75.0 15.5 9.5
S6: Lip smack 0.03 0.30 0-3.2 0.03 0.38 0-4.4 0.03 0.35 0-4.4 99.1 0.9 0 99.3 0.7 0 99.2 0.8 0
S7: Body movement 0.12 0.61 0-4.6 0.03 0.22 0-1.7 0.07 0.45 0-4.6 95.7 4.4 0 97.8 2.2 0 96.8 3.2 0
S8: Sneeze 0 -- -- 0.04 0.40 0-4.4 0.02 0.29 0-4.4 100 0 0 98.5 1.5 0 99.2 0.8 0
S9: Telegraphic 0.11 0.57 0-4.2 0.42 1.17 0-8.1 0.28 0.95 0-8.1 95.7 4.4 0 83.2 15.3 1.5 88.9 10.3 0.8
S10: Yawn 0.04 0.31 0-2.5 0.08 0.44 0-4.1 0.06 0.39 0-4.1 98.3 1.7 0 95.6 4.4 0 96.8 3.2 0
Entries are the percentages of code occurrence based on each child's total number of utterances in the speech sample.a
For each code, children were categorized into one of three groups; the table entries indicate the percentage of children in each group: children whob
had 0% of their utterances meeting criteria for the exclusion code, 1%-4.9% of their utterances meeting criteria for the exclusion code, or 5% or more
of their utterances meeting criteria for the exclusion code.

39
Table 11. Reference data for the frequency of occurrence of the 31 inappropriate Prosody-Voice Codes in 115 speech-normal children and 137 speech-
delayed children.
Proportional Occurrence Percentage of Childrena b
Speech-normal Speech-delayed Both Speech-normal Speech-delayed Both
Code M SD Range M SD Range M SD Range 0% 1-4.9% >5% 0% 1-4.9% >5% 0% 1-4.9% >5%
Phrasing
PV2: Sound/syllable 1.57 2.13 0-11.1 1.83 2.66 0-16.1 1.71 2.43 0-16.1 54.8 38.3 7.0 45.3 46.0 8.8 49.6 42.5 7.9
repetition
PV3: Word repetition 2.55 3.10 0-20.0 1.73 3.24 0-26.5 2.11 3.19 0-26.5 39.1 42.6 18.3 54.0 38.0 8.0 47.2 40.1 12.7
PV4: Sound/syllable and 0.22 1.20 0-10.5 0.33 1.35 0-9.8 0.28 1.28 0-10.5 94.8 3.5 1.7 90.5 7.3 2.2 92.5 5.6 2.0
word repetition
PV5: More than one word 0.25 0.91 0-6.7 0.40 1.22 0-8.9 0.33 1.09 0-8.9 91.3 7.8 0.9 85.4 12.4 2.2 88.1 10.3 1.6
repetition
PV6: One word revision 1.39 2.02 0-10.0 0.50 1.05 0-5.5 0.91 1.63 0-10.0 58.3 36.5 5.2 77.4 21.9 0.7 68.7 28.6 2.8
PV7: More than one word 0.19 0.68 0-3.4 0.07 0.38 0-2.8 0.13 0.54 0-3.4 92.2 7.8 0 96.4 3.7 0 94.4 5.6 0
revision
PV8: Repetition and 0.65 1.70 0-11.4 0.21 0.71 0-4.4 0.41 1.28 0-11.4 80.0 18.3 1.7 90.5 9.5 0 85.7 13.5 0.8
revision
Rate
PV9: Slow articulation/ 0.04 0.46 0-4.9 0.71 3.53 0-34.9 0.40 2.64 0-34.9 99.1 0.90 0 86.9 10.2 2.9 92.5 6.0 1.6
pause time
PV10: Slow/pause time 0.11 0.61 0-5.0 0.17 0.59 0-2.9 0.14 0.60 0-5.0 96.5 2.6 0.9 91.2 8.8 0 93.7 6.0 0.4
PV11: Fast 1.55 6.47 0-56.3 0.59 2.57 0-20.4 1.03 4.78 0-56.3 85.2 8.7 6.1 86.9 10.2 2.9 86.1 9.5 4.4
PV12: Fast/acceleration 0.06 0.45 0-3.7 0 -- -- 0.03 0.30 0-3.7 98.3 1.7 0 100 0 0 99.2 0.8 0
Stress
PV13: Multisyllabic word 0.06 0.50 0-4.8 0 -- -- 0.03 0.34 0-4.8 98.3 1.7 0 100 0 0 99.2 0.8 0
stress
PV14: Reduced/equal stress 0.02 0.23 0-2.5 0.48 2.46 0-21.8 0.27 1.83 0-21.8 99.1 0.9 0 89.8 8.0 2.2 94.1 4.8 1.2
PV15: Excessive/equal/ 0.85 1.74 0-10.0 5.03 9.75 0-50.0 3.12 7.57 0-50.0 74.8 20.9 4.4 48.9 28.5 22.6 60.7 25.0 14.3
misplaced stress
PV16: Multiple stress 0 -- -- 0 -- -- 0 -- -- 100 0 0 100 0 0 100 0 0
features

40
Table 11. Continued
Proportional Occurrence Percentage of Childrena b
Speech-normal Speech-delayed Both Speech-normal Speech-delayed Both
Code M SD Range M SD Range M SD Range 0% 1-4.9% >5% 0% 1-4.9% >5% 0% 1-4.9% >5%
Loudness
PV17: Soft 1.06 4.27 0-35.0 2.77 7.54 0-60.0 1.99 6.31 0-60.0 85.2 9.6 5.2 65.7 19.0 15.3 74.6 14.7 10.7
PV18: Loud 0.05 0.37 0-3.1 0.91 3.23 0-27.9 0.52 2.43 0-27.9 98.3 1.7 0 82.5 11.7 5.8 89.7 7.1 3.1
Pitch
PV19: Low pitch/ 0.27 1.32 0-12.3 0.28 1.44 0-12.7 0.27 1.38 0-12.7 93.9 5.2 0.9 94.2 3.7 2.2 94.1 4.4 1.6
glottal fry
PV20: Low pitch 0 -- -- 0.04 0.42 0-4.9 0.02 0.31 0-4.9 100 0 0 99.3 0.7 0 99.6 0.4 0
PV21: High pitch/falsetto 0 -- -- 0 -- -- 0 -- -- 100 0 0 100 0 0 100 0 0
PV22: High pitch 0 -- -- 0.04 0.42 0-4.8 0.02 0.31 0-4.8 100 0 0 98.5 1.5 0 99.2 0.8 0
Quality
Laryngeal features
PV23: Breathy 0.12 0.58 0-3.9 0.32 1.25 0-10.4 0.23 1.00 0-10.4 95.7 4.4 0 89.8 8.0 2.2 92.5 6.4 1.2
PV24: Rough 4.96 14.13 0-81.5 8.23 14.78 0-71.0 6.74 14.55 0-81.5 66.1 16.5 17.4 48.2 20.4 31.4 56.4 18.7 25.0
PV25: Strained 0.18 0.63 0-2.9 0.30 1.79 0-19.1 0.25 1.39 0-19.1 92.2 7.8 0 94.2 4.4 1.5 93.3 6.0 0.8
PV26: Break/shift/ 0.80 1.75 0-7.9 1.04 1.87 0-11.8 0.93 1.82 0-11.8 78.3 15.7 6.1 65.0 29.9 5.1 71.0 23.4 5.6
tremulous
PV27: Register break 0 -- -- 0 -- -- 0 -- -- 100 0 0 100 0 0 100 0 0
PV28: Diplophonia 0 -- -- 0 -- -- 0 -- -- 100 0 0 100 0 0 100 0 0
PV29: Multiple laryngeal 0.19 0.90 0-6.7 0.95 4.29 0-40.0 0.60 3.24 0-40.0 94.8 3.5 1.7 86.1 10.2 3.7 90.1 7.1 2.8
features
Resonance features
PV30: Nasal 0.18 1.35 0-12.9 0.60 2.50 0-25.4 0.41 2.06 0-25.4 97.4 0.9 1.7 85.4 11.7 2.9 90.9 6.8 2.4
PV31: Denasal 2.89 8.98 0-48.3 2.44 8.13 0-55.6 2.65 8.52 0-55.6 81.7 6.1 12.2 80.3 8.0 11.7 81.0 7.1 11.9
PV32: Nasopharyngeal 0 -- -- 4.68 15.21 0-70.6 2.55 11.44 0-70.6 100 0 0 90.5 0 9.5 94.8 0 5.2
Entries are the percentages of code occurrence based on each child's total number of utterances in the speech sample.a
For each code, children were categorized into one of three groups; the table entries indicate the percentage of children in each group: children whob
had 0% of their utterances meeting criteria for the exclusion code, 1%-4.9% of their utterances meeting criteria for the exclusion code, or 5% or more
of their utterances meeting criteria for the exclusion code.

41
Table 12. Reference data for the appropriateness of the six PVSP suprasegmentals in 115 speech-normal children and 137 speech-delayed children.
Proportional Occurrence Percentage of Childrena b
Speech-normal Speech-delayed Both Speech-normal Speech-delayed Both
Code M SD Range M SD Range M SD Range $90% 80-89.9% <80% $90% 80-89.9% <80% $90% 80-89.9% <80%
Prosody
Phrasing 88.20 10.20 29.2-100 88.88 11.47 29.2-100 88.57 10.90 29.2-100 53.9 28.7 17.4 58.4 27.0 14.6 56.4 27.8 15.9
Rate 97.34 9.09 25.0-100 96.53 10.01 8.3-100 96.90 9.59 8.3-100 93.0 2.6 4.4 93.4 2.2 4.4 93.3 2.4 4.4
Stress 98.14 3.78 77.8-100 87.26 21.45 0-100 92.22 16.89 0-100 96.5 1.7 1.7 70.8 8.8 20.4 82.5 5.6 11.9
Voice
Loudness 96.25 15.14 0-100 89.73 19.73 0-100 92.70 18.05 0-100 94.8 0.9 4.4 73.0 13.9 13.1 82.9 7.9 9.1
Pitch 99.53 2.91 70.8-100 99.16 3.86 66.7-100 99.33 3.46 66.7-100 99.1 0 0.9 97.1 2.2 0.7 98.0 1.2 0.8
Quality 83.51 26.20 0-100 60.78 36.64 0-100 71.15 34.17 0-100 64.4 11.3 24.4 29.9 16.1 54.0 45.6 13.9 40.5
Laryngeal 89.20 21.70 0-100 75.34 31.41 0-100 81.66 28.22 0-100 77.4 7.8 14.8 49.6 16.1 34.3 62.3 12.3 25.4
Resonance 94.30 15.66 8.3-100 83.38 31.95 0-100 88.36 26.35 0-100 87.8 3.5 8.7 73.7 5.1 21.2 80.2 4.4 15.5
Entries are the percentage of utterances coded as appropriate, based on each child's total number of utterances eligible for prosody-voice coding.a
Percentage of children who had 90% or more appropriate utterances (pass), from 80% to 89.9% appropriate utterances (questionable fail), or below 80%b
appropriate utterances (fail).
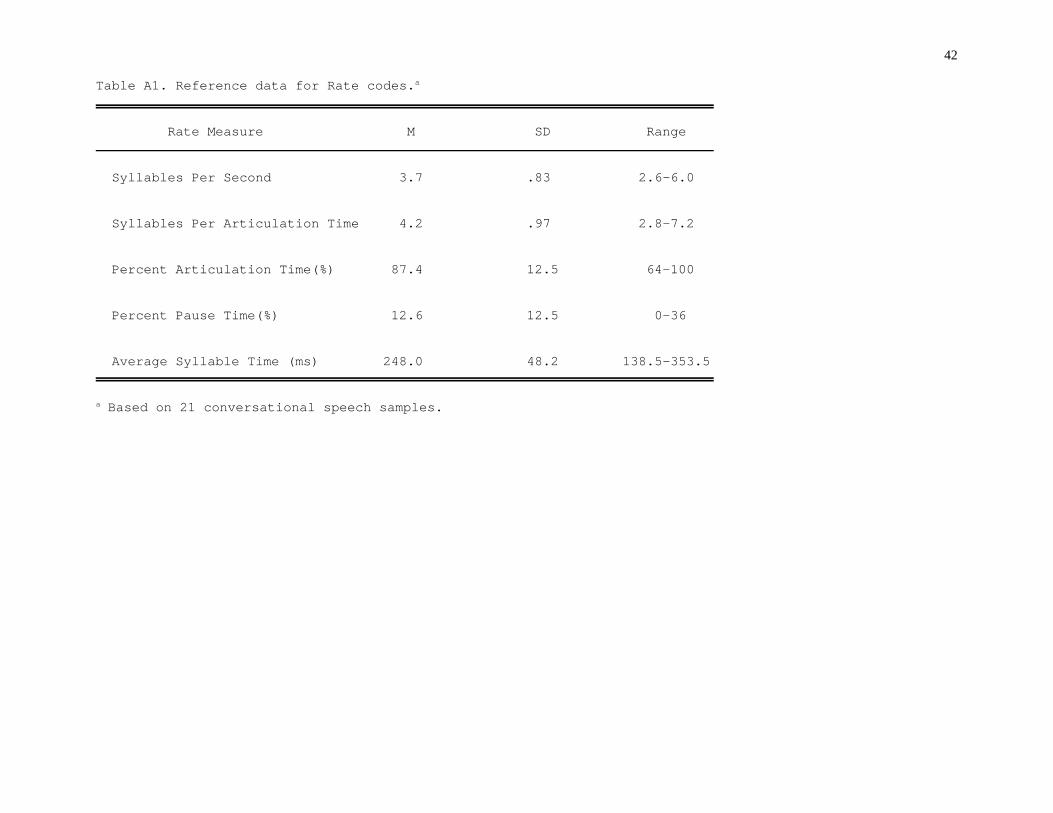
42
Table A1. Reference data for Rate codes.a
Rate Measure M SD Range
Syllables Per Second 3.7 .83 2.6-6.0
Syllables Per Articulation Time 4.2 .97 2.8-7.2
Percent Articulation Time(%) 87.4 12.5 64-100
Percent Pause Time(%) 12.6 12.5 0-36
Average Syllable Time (ms) 248.0 48.2 138.5-353.5
Based on 21 conversational speech samples.a

43
Table A2. Reference data for Pitch and Quality codes.a
Number of
Variable Syllables M SD Range
Fundamental Frequency (Hz) 141 267.90 46.10 198.0-443.3
Jitter (Hz) 141 0.027 0.014 0.010-0.088
Shimmer (%) 141 3.230 1.710 1.21-12.48
Signal-to-Noise Ratio (dB) 140 23.81 4.540 12.74-33.31
Based on 21 conversational speech samples.a

44
FIGURE CAPTIONS
Figure 1. Sample of the first and second pagesof the Prosody-Voice Screening Profile(PVSP) scoring form. The left panel illus-trates the summative PVSP profile. Theright panel includes the key to the 31PVSP exclusion codes and the 31 inappro-priate prosody-voice codes. Portions ofthe original handwritten text and tallies arenot legible in this reduced illustration.
Figure 2. Sample of the third pages and fourthpages of the Prosody-Voice ScreeningProfile (PVSP) scoring form. The leftpanel includes the grids used to tally theutterance-by-utterance occurrence ofExclusion and Prosody-Voice codes. Theright panel illustrates the emphasis in thePVSP on interpretation of the quantitativescreening information. Portions of theoriginal handwritten text and tallies are notlegible in this reduced illustration.
Figure 3. Sample Prosody-Voice Profile illus-trating research use of data from theProsody-Voice Screening Profile (PVSP).The open circles are profiles for a group of71 3-5 year-old children with normallydeveloping (N) speech (Miller, 1990). Thefilled circles are the mean PVSP profilesfor a group of 57 3-5 year-old childrenwith delayed speech (D) of unknownorigin (Shriberg & Kwiatkowski, in sub-mission).
Figure 4. Prosody-Voice Screening Profile(PVSP) findings for two samples of chil-dren with speech delays of unknown ori-gin. The filled bars are the percentages of90 children who had fails or questionablefails on the protoversion of the PVSP(Shriberg & Kwiatkowski, 1982; Shriberg,Kwiatkowski, Best, Hengst, & Terselic-
Weber, 1986). The cross-hatched bars arethe percentages of fails and questionablefails for a recent group of 57 childrenassessed with the PVSP (Shriberg &Kwiatkowski, in submission).
Figure 5. Prosody-Voice Screening Profile(PVSP) findings for two groups of speech-involved children. The filled circles are theProsody-Voice Profile profiles for 64 3-5year-old children with speech delays ofunknown origin. The open circles areprofiles for 14 5-15 year-old children withsuspected developmental apraxia of speech(Shriberg, Aram, and Kwiatkowski, inpreparation).
Figure A1. VOCAL output used for criterionvalidation of a PVSP exemplar for PV13:Multisyllabic Word Stress. See text forexplanation of the four panels.
Figure A2. VOCAL output used for criterionvalidation of a PVSP exemplar for PV14:Reduced/Equal Stress. See text for expla-nation of the two panels.
Figure A3. VOCAL output used for criterionvalidation of a PVSP exemplar for PV15:Excessive/Equal/Misplaced Stress. Seetext for explanation of the four panels.
Figure A4. CSpeech output used for criterionvalidity of a PVSP exemplar for PV26:Break/Shift/Tremulous. See text for expla-nation.
Figure A5. CSpeech output used for criterionvalidity of a PVSP exemplar for PV27:Register Break. See text for explanation.