the public dsa framework for market access countries
TRANSCRIPT

The Public DSA Framework for The Public DSA Framework for Market Access CountriesMarket Access Countries
Instructor: Adina Popescu (IMF)
LEARNING OBJECTIVES ANDUnit 1
LEARNING OBJECTIVES AND STRUCTURE OF PART 2
“This training material is the property of the International Monetary Fund and is intended for use in IMF Institute for Capacity Development courses. Any reuse requires the permission of the IMF. The views expressed in this material are those of the course staff and do not necessarily represent those of the IMF or IMF policy.”

U1 V1U1.V1
Content and Goals of Part 2
U1 V2U1.V2
A History of Debt and Growth:Understand the past, chart theUnderstand the past, chart the
Future (IMF Video)

DEBT SUSTAINABILITY IN MARKETUnit 2
DEBT SUSTAINABILITY IN MARKET ACCESS COUNTRIES
U2 V1U2.V1
What is the MAC DSA ?

What is the MAC DSA ?What is the MAC DSA ?
Description ApproachTimelineDescription
� Part of the IMF’s framework for debt sustainability analysis
ApproachTimeline
debt sustainability analysis
� Designed and followed by the IMF to assess public debtIMF to assess public debt sustainability in market access countries (MACs)
� In the context of both surveillance and program d i / idesign/reviews
MAC DSA TimelineMAC DSA Timeline
Definition ApproachTimelineDefinition ApproachTimeline

The MAC DSA AproachThe MAC DSA Aproach
Definition ApproachTimeline
�A formal and
Definition ApproachTimeline
A formal and standardized tool
� Implemented through an gExcel based template
Who are Market Access Countries?Who are Market Access Countries?
C t i ith• Countries with significant access to international capitalinternational capital markets on a durable and sustainable basis
• De facto all advanced economies and mostemerging markets

U2 V2U2.V2
Assessing Sustainability in the MAC DSA
How is Debt Sustainability Assessed in the MAC DSA ?
• Solvency
• Liquidity
• Realistic adjustmentadjustment

What is Solvency ?
Th t d bt t k i f ll Th t ill b bl t
What is Solvency ?
The current debt stock is fully covered by the present discounted value of all expected future primary
balances
The government will be able to service the debt in the short,
medium and long run without renegotiating or defaultingbalances renegotiating or defaulting
SOLVENCY
The debt burden indicators are
SOLVENCY
The debt burden indicators are projected to either stabilize or
decline - in the baseline scenario and under plausible shock scenarios
What is Liquidity ?
L l d t j t f d bt b d
What is Liquidity ?
Available financing and liquid assets are sufficient to meet maturing
obligations
Level and trajectory of debt burden indicators facilitate continued
market access and rollover risk is lowlow
LIQUIDITY
h d b f l ll b l d
LIQUIDITY
The debt profile is well balanced in terms of: maturity, currency
composition, and investor base

What is Realistic Adjustment ?What is Realistic Adjustment ?
Realistic macroeconomic assumptions and projections for the
primary balance adjustment
Adjustment is economically and politically feasible
REALISTIC ADJUSTMENT
Potential growth is preserved at a satisfactory level
Caveats …Caveats …
• DSAs involve probabilistic judgments• DSAs involve probabilistic judgments about the trajectory of debt and the availability of financing on favorable terms
• DSAs should not be interpreted in a mechanistic or rigid fashionmechanistic or rigid fashion
• DSAs should take into considerationDSAs should take into consideration country-specific circumstances

U2 V3U2.V3
What are the Benchmarks in the MAC DSA?
Main Features of the MAC DSA TemplateMain Features of the MAC DSA Template
• A complex and multifaceted exerciseA complex and multifaceted exercise
• Highlights the risks and uncertaintyHighlights the risks and uncertainty surrounding the central forecast
• Is “risk-based” - more analysis required for countries with greater q gvulnerabilities

Lower versus Higher ScrutinyLower versus Higher Scrutiny
• Lower scrutiny
Countries are classified as:
Lower scrutiny
• Higher scrutiny
on the basis of:
• a set of benchmarks of debt burden and other indicatorsburden and other indicators
• access to Fund resources
What Are the Benchmarks for Classification ?What Are the Benchmarks for Classification ?
f fPublic debt level
> 50% of GDP for EMs> 60% of GDP for AEs> 10% of GDP for EMs
Public gross financing needs> 10% of GDP for EMs> 15% of GDP for AEs
Exceptional access to IMFExceptional access to IMF

Early Warning ModelsEarly Warning Models
• Benchmarks estimated from “early warning models”
• These identify the level of the• These identify the level of the indicators which best predict the occurrence of a crisis
• The MAC DSA benchmarks are conservative estimates (about 15conservative estimates (about 15 percent less than the model estimates)
However …However …
• Debt problems ma emerge• Debt problems may emerge at lower debt burden levels than the ones suggestedthan the ones suggested above (particularly for EMs)
• Other indicators may point to emerging vulnerabilitiesto emerging vulnerabilities
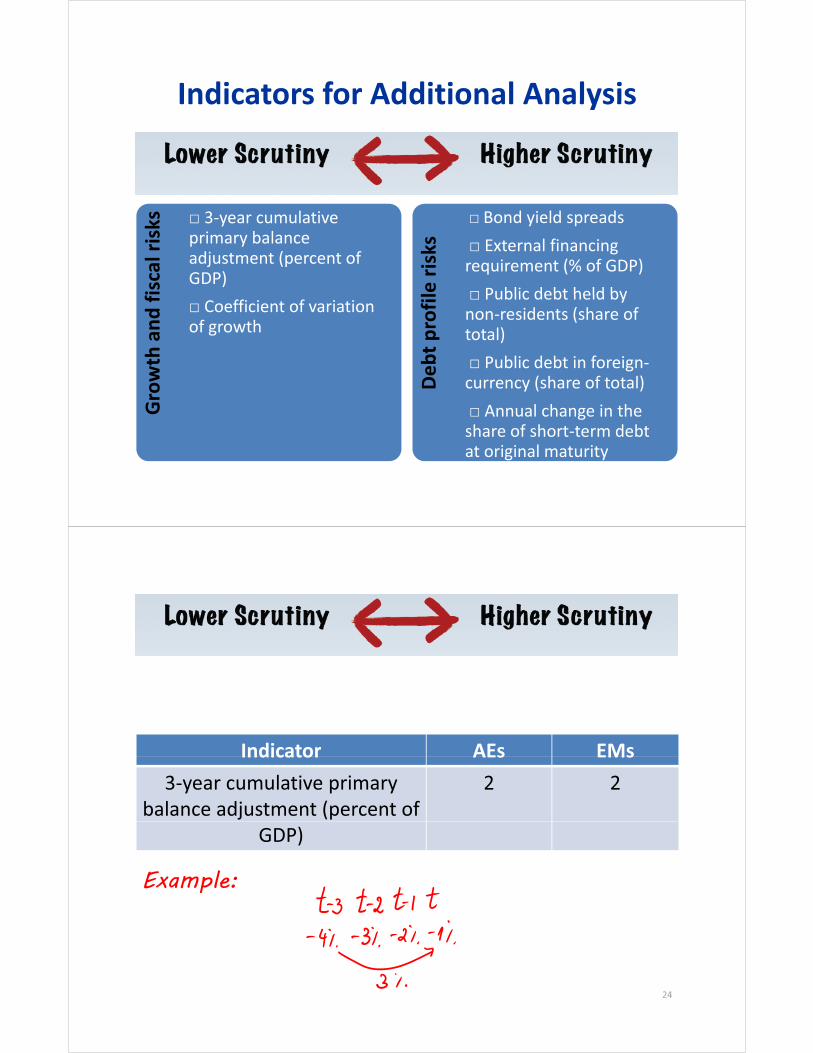
Indicators for Additional AnalysisIndicators for Additional Analysis
sks � 3-year cumulative � Bond yield spreads
isca
l ris primary balance
adjustment (percent of GDP)
le ri
sks � External financing
requirement (% of GDP)� Public debt held by
th a
nd f � Coefficient of variation
of growth
bt p
rofil � Public debt held by
non-residents (share of total)� Public debt in foreign
Gro
wt
Deb � Public debt in foreign-
currency (share of total)� Annual change in the h f h d bshare of short-term debt
at original maturity
Indicator AEs EMsIndicator AEs EMs3-year cumulative primary
balance adjustment (percent of 2 2
GDP)
Example:Example:
24

Indicator AEs EMsCoefficient of variation of
growth1 1
Coeff. of variation = Standard deviation�Mean
Indicator AEs EMsBond yield spreads or EMBI global spreads (basis points)
600 600
Spread over US or German
JP Morgans'sEMBI
bondsEMBI

Indicator AEs EMsExternal financing
requirements (percent of GDP)25 15
Externall financingg requirementss =External financing requirements ST External debt + Amortization of MLT external debt - Current account balance
Indicator AEs EMsPublic debt held by non- 45 45yresidents (share of total)
Public debt in foreign currency n.a. 60(share of total)
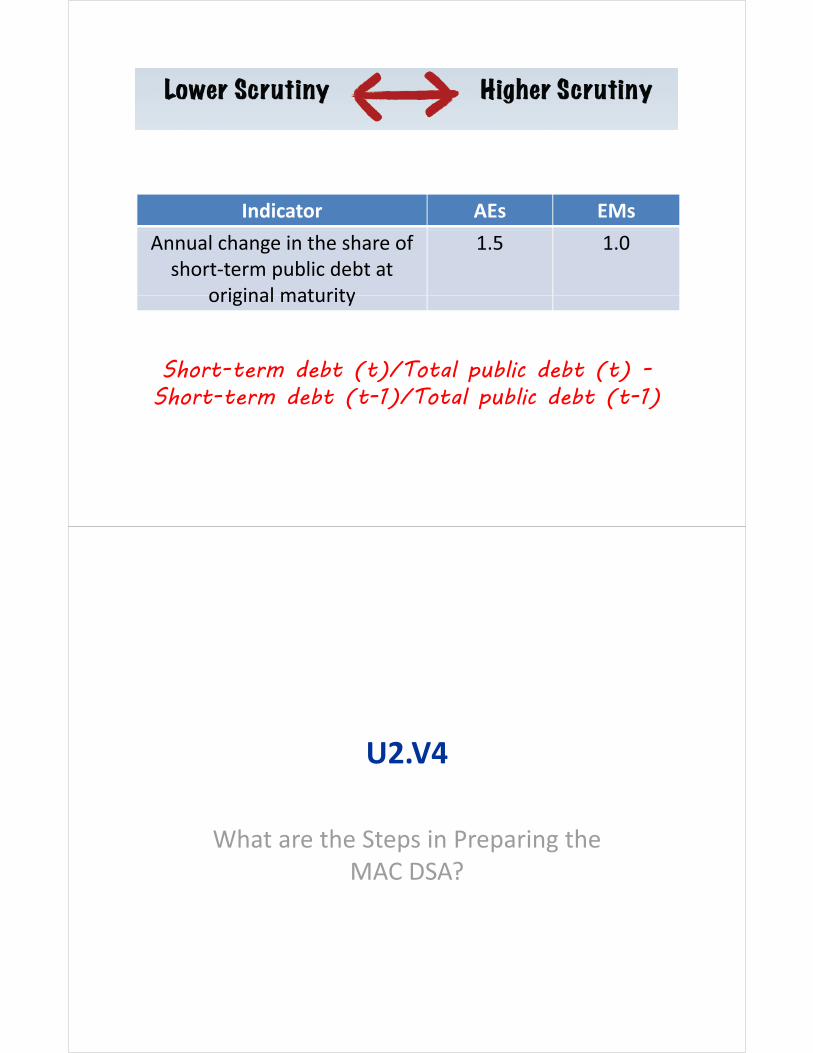
Indicator AEs EMsAnnual change in the share of
short-term public debt at original maturity
1.5 1.0
original maturity
S d dShort-term debt (t)/Total public debt (t) -Short-term debt (t-1)/Total public debt (t-1)
U2 V4U2.V4
What are the Steps in Preparing the MAC DSA?

Roadmap: the MAC DSA Template
Lowerr scrutinyLower scrutinycountries
Higherr scrutinyHigher scrutinycountries
Basic DSA
Customized
Standardized alternative
alternative scenarios
Baseline scenario
alternative scenarios
(contingent liabilities)

Risk Identification and Analysisy
Vulnerability
Sensitivity
Contingent liabilities
yof the debt profile
Realism of baseline
Sensitivity to macro-fiscal risks
baseline scenario
Risk ReportingRisk Reporting
Write-up
Fan charts
p
Heat map

DATA: COVERAGE, ISSUES, SOURCESUnit 3
DATA: COVERAGE, ISSUES, SOURCES
U3 V1U3.V1
Data Coverage and Issues

Issues Related to Coverage of Public Debt
Coverage of the publicCoverage of the public
Issues Related to Coverage of Public Debt
Coverage of the public Coverage of the public sectorsector
Gross versus net debtGross versus net debtGross versus net debtGross versus net debt
LongLong--term spending term spending pressures pressures
The Coverage of the Public Sector: hThe Issue
Sub-national governments
Contingent li bilitigovernments liabilities
Bailouts
State-owned enterprises (SOEs)
Bailouts
Offset fiscalenterprises (SOEs)Public-private
partnerships (PPPs)
Offset fiscal adjustments efforts

Example: PortugalExample: PortugalThe reclassification of reclassifications of SOEs and PPPs into the general government has weighed on the sizableinto the general government has weighed on the sizable increase in general government debt
Source: IMF
Public Sector Coverage: GuidelinesPublic Sector Coverage: Guidelines
The coverage of public debt in the DSA g pshould be:
• as broad as possible, ideally based on the entire public sector
• one should try to add, at least, high-risk public enterprisespublic enterprises
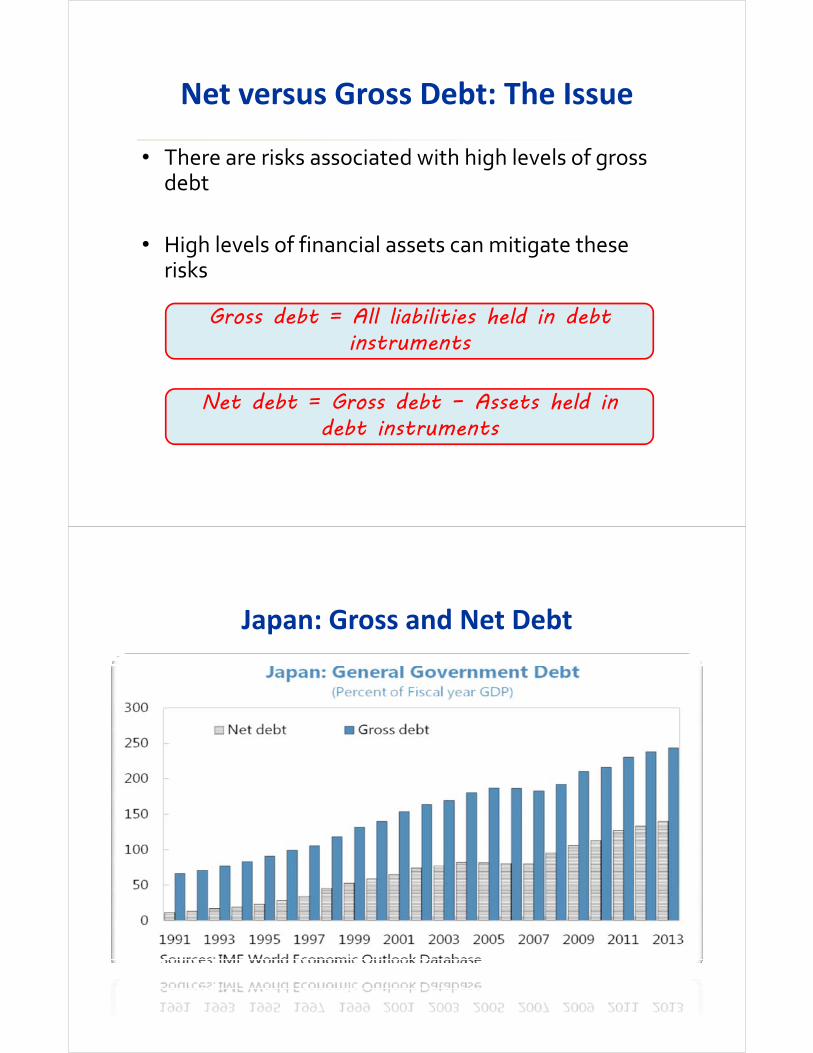
Net versus Gross Debt: The IssueNet versus Gross Debt: The Issue
• There are risks associated with high levels of gross g gdebt
• High levels of financial assets can mitigate these risks
Gross debt = All liabilities held in debt instruments
Net debt = Gross debt – Assets held in d bt in t um ntdebt instruments
Japan: Gross and Net DebtJapan: Gross and Net Debt

Net versus Gross Debt: GuidelinesNet versus Gross Debt: Guidelines
Th MAC DSA i b d• The MAC DSA is based on gross debt
• Net debt – complementary p ymeasure
Long-Run Spending Pressures: The IssueLong Run Spending Pressures: The Issue
Long-run spending pressurespressures
Pensions Health-care
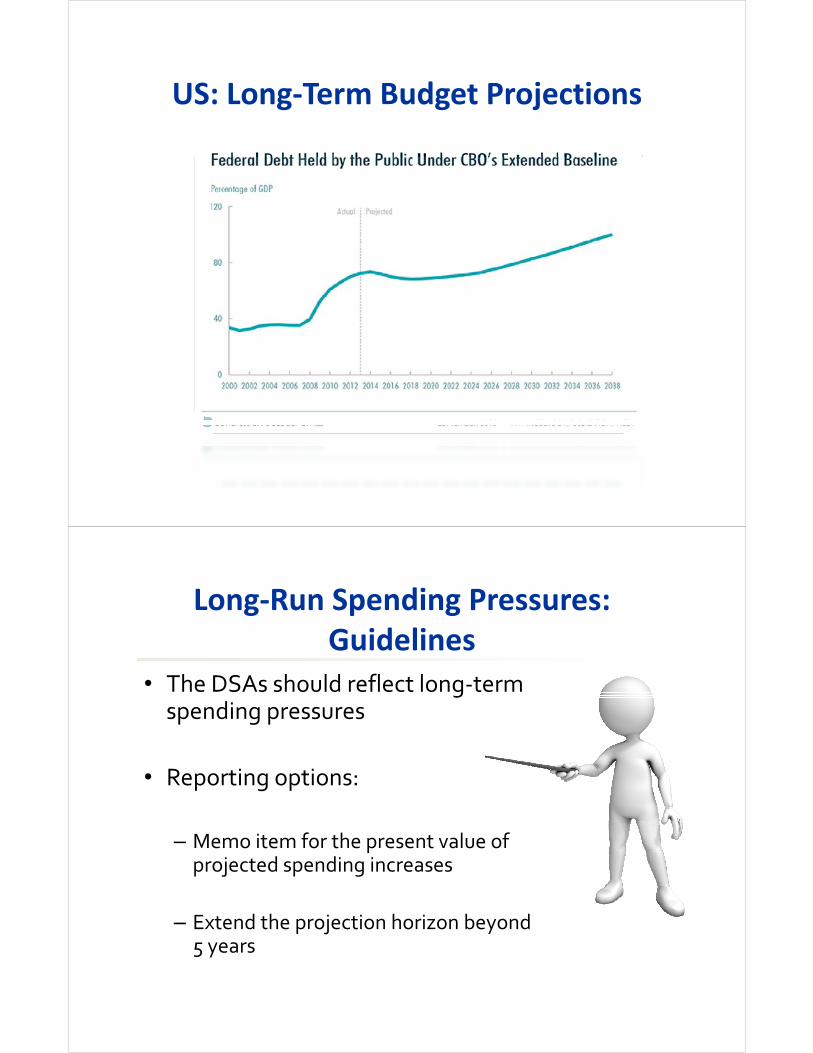
US: Long-Term Budget ProjectionsUS: Long Term Budget Projections
Long-Run Spending Pressures: d lGuidelines
• The DSAs should reflect long-term gspending pressures
• Reporting options:
– Memo item for the present value of projected spending increases
– Extend the projection horizon beyond 5 years5 years

U3 V2U3.V2
MAC DSA Template: Introductory Video
THE BASELINE SCENARIOUnit 4
THE BASELINE SCENARIO

U4 V1U4.V1
How to Construct the Baseline Scenario ?
Constructing a Baseline ScenarioConstructing a Baseline Scenario
Macroeconomic framework
the most likely scenario - for surveillance countries - based on
current and projected governmentcurrent and projected government policies
the programmed macroeconomic adjustment - for program countries

Generic Debt Dynamics Equationautomatic debt dynamics
Generic Debt Dynamics Equationresidual
ttttt resopbdd ������ �1* )1(�
debt/GDP ratio
primary balance
th id tifi d
o Privatization receipts o Recognition of implicit
other identified debt-creating
flows
g por contingent liabilities
o Other (e.g. bank recapitalization)p )
What Drives the Debt-to-GDP Dynamics ?What Drives the Debt to GDP Dynamics ?
Contribution of Contribution real GDP growth of the primary
balance
�� td��
����
)1)(1()1(
tt
ttwt
ggi
)1)(1( tt
t
gg
��� 1
1
)1)(1()1(
��
��
���
� ttt
fttt d
gi
��...�� tpb
Contribution of Cont ibution ofContribution of effective real interest rate
Contribution of exchange ratedepreciation

ExampleExample10
Debt-Creating Flows (i t f GDP)
30
40
5(in percent of GDP)
10
20
0
-20
-10
0
-5
-40
-30
-10t t+1 t+2 t+3 t+4 t+5 t+6 t+7 t+8 t+9 t+10Primary deficit Real GDP growthReal interest rate Exchange rate depreciation
-50cumulative
Real interest rate Exchange rate depreciationOther debt-creating flows ResidualChange in gross public sector debt
Where Do Residuals Come From ?
sales/purchases of financial
changes in gross debt arising from below-the-line
sales/purchases of financial assets
from below the line operations
“one-off” factors affecting the stock of debt
th f diff t d fi itithe use of different definitions for the stock of debt and the
fiscal balance
cross-currency movements

U4 V2U4.V2
MAC DSA Template: The Baseline Scenario
REALISM OF THE BASELINEUnit 5
REALISM OF THE BASELINE ASSUMPTIONS

U5 V1U5.V1
How to Evaluate the Forecast Track Record ?
Realism Tools Does in the MAC DSA
R li f ti
Realism Tools Does in the MAC DSA
Realism of macro-assumptions• Examines the track record in
projecting macroeconomicprojecting macroeconomic variables
Realism of fiscal adjustment• Assesses the realism of projected
fiscal adjustments
Boom-bust analysis• Assesses growth projections in
countries that may have entered acountries that may have entered a boom-bust cycle

Realism of Macro-AssumptionsRealism of Macro Assumptions
The DSA template automatically produces
• charts• statistics
The DSA template automatically produces
statistics
for the forecast track record for
• real GDP growth• primary balance• inflation• inflation
by comparing forecast errors for a country to the distribution of forecast errors for other MACs
What is the Forecast Track Record ?
Forecast error (t) = Actual (t,t+2) - Projection (t,t-1)

Summary StatisticsSummary Statistics
in the distribution of median forecastof median forecast errors of all MACs
How to Interpret the Forecast Errors ?p
SuggestSuggest systematic
projection bias
Calibrate li tirealistic
baselineprojectionsp j
U5 V2U5.V2
How to Evaluate the Realism of the Projected Fiscal Adjustment ?
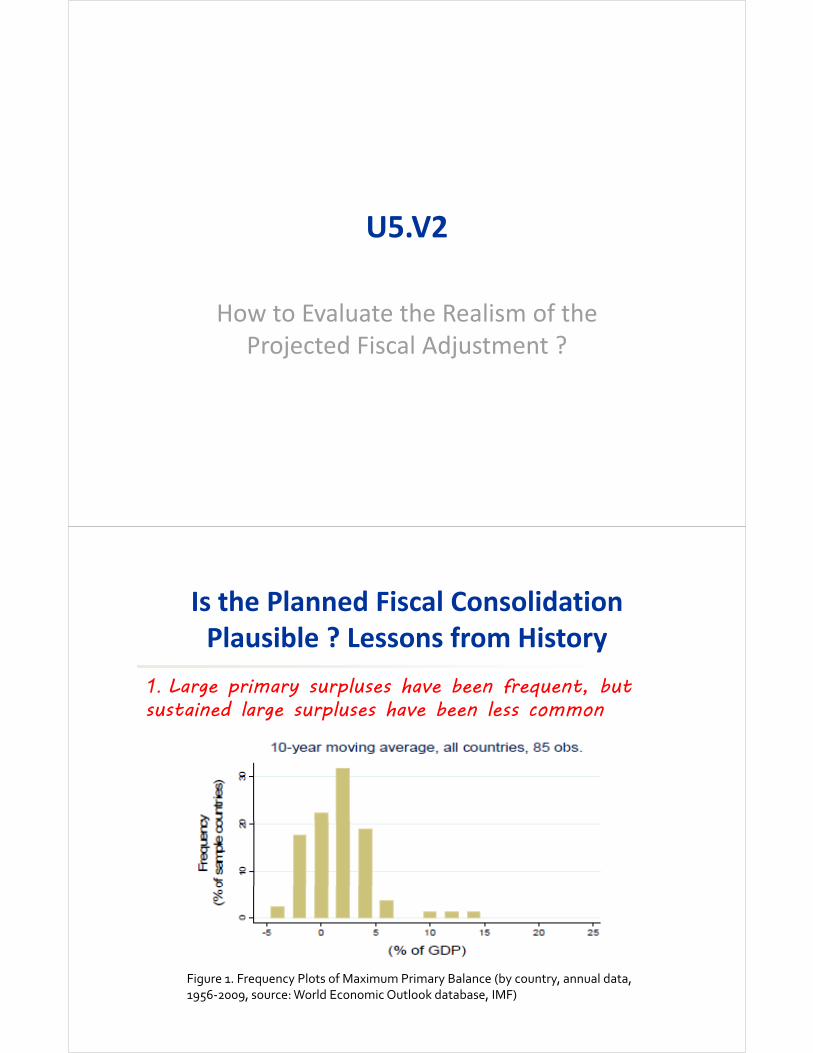
Is the Planned Fiscal Consolidation l ibl ? f iPlausible ? Lessons from History
1. Large primary surpluses have been frequent, but1. Large primary surpluses have been frequent, but sustained large surpluses have been less common
Figure 1. Frequency Plots of Maximum Primary Balance (by country, annual data, 1956-2009, source: World Economic Outlook database, IMF)

Is the Planned Fiscal Consolidation l ibl ? f iPlausible ? Lessons from History
2. Large fiscal corrections are usually associated with2. Large fiscal corrections are usually associated with worse starting fiscal positions
Figure 2. Largest Primary Balance Turnaround (source: World Economic Outlook database, IMF)
Some Simple Rules-of-ThumbSome Simple Rules of Thumb
Close scrutiny of assumptions warranted if planned fiscal adjustment is located close to the right-hand tail of the cross-country distributions
maximum 3-yearmaximum 3-year yaverage leveladjustment

Country-Specific InformationCountry Specific Information
The analysis would
past record of fiscal adjustment
would take account of
extent of political commitment
the design of the authorities’ fiscalof the design of the authorities fiscal adjustment plans
experience regarding budget forecastexperience regarding budget forecast errors
legal and institutional mechanisms
U5 V3U5.V3
How to Use the Boom-Bust Tool ?

What are the Triggers for the Boom-Bust l ?Tool ?
Countries are identified to be in a boom if either of theCountries are identified to be in a boom, if either of the following conditions is met:
A positive output gap• during the last 3
A 3-year cumulative level change in private sector credit-to-GDP • during the last 3
consecutive years exceeding• 15 percent for EMs• 30 percent for AEs3 p
Output gap =
Example: Private sector credit-to-GDPt t+1 t+2 t+3p g p
Actual output –Potential output
t t+1 t+2 t+330% 35% 45% 50%
20%
The Boom-Bust ToolThe Boom Bust Tool
• Compares growth Boom-Bust Analysis Compares growth assumptions for a particular country to 8
Real GDP growth
Example
(in percent)
the historical experience of b b t 0
2
4
6
boom-bust cases
I t til 6
-4
-2
0Boom-bust inter-quartile range around crisis events (t)
Interquartile range= 75th percentile -25th percentile
-6t-5 t-4 t-3 t-2 t-1 t t+1 t+2 t+3 t+4 t+5
Median

U5.V4
MAC DSA Template: Realism Tools
DEALING WITH UNCERTAINTY 1:Unit 6
DEALING WITH UNCERTAINTY 1: ALTERNATIVE SCENARIOS

U6 V1U6.V1
Sensitivity Analysis in the MAC DSA
Sensitivity Analysis in the MAC DSASensitivity Analysis in the MAC DSA
lHistorical scenario
Constant primary
Standardized sensitivity analysis
Constant primary balance scenario
Standardized macro-fiscal stress tests
Financial sector ti tcontingent
liabilities shock
Customized sensitivity Customized sensitivity
analysis scenarios

Historical ScenarioHistorical Scenario
Set at historical average• real GDP growth • the primary balance• real interest rates
Oth i bl iBaseline
Other variables same as in baseline
Constant Primary Balance (CPB) ScenarioConstant Primary Balance (CPB) Scenario
The primary balance assumed to remain unchanged at current level
Other variables same as inBaseline
Other variables same as in baseline

How to Analyze the Historical and CPB i ?Scenarios ?
Are baseline Are policy actions b i l hAre baseline
assumptions unrealistic (overly
i i i ) ?
substantial enough to make a credible break from past oroptimistic) ? break from past or
current trends?
Standardized Macro-Fiscal ShocksStandardized Macro Fiscal Shocks
Primary balance
Real GDP
Standardized macro fiscal
growth
Interest ratemacro-fiscal stress tests
Interest rate
E h tExchange rate
CombinedCombined macro-fiscal

Primary Balance ShockPrimary Balance Shock
Size and duration of shockSize and duration of shock
Minimum shock equivalent to the maximum of:- 50% of planned cumulative adjustment in the baseline- baseline minus half of the 10-year historical standard deviation of the primary balance
Default interactions
- Increase in interest rates
Real GDP Growth ShockReal GDP Growth Shock
Size and duration of shockSize and duration of shock
Real GDP growth is reduced by 1 standard deviation for 2 consecutive years
Default interactions
- Deterioration in the primary balanceDeterioration in the primary balance - Increase in interest rates - Decrease in inflation

Interest Rate ShockInterest Rate Shock
Size and duration of shockSize and duration of shock
Interest rate increases by the maximum of:- the difference between average real interest rate level over the projection period and maximum real historical level, or- 200bps
fDefault interactions
- None
Exchange Rate ShockExchange Rate Shock
Size and duration of shockSize and duration of shock
Exchange rate increases by the maximum of:- estimated overvaluation- maximum historical movement of the exchange rate
Default interaction
- pass-through to inflation (default elasticity of 0.25 for EMs and 0.03 for AEs)
change in domestic i fl ti d tinflation due to a
change in the exchange rate

Combined Macro-FiscalCombined Macro Fiscal
Size and duration of shock
Based on the underlying shocks
Default interactions
h l ff f i di id l h k llIncorporates the largest effect of individual shocks on all relevant variables (real GDP growth, inflation, primary balance, exchange rate, and interest rate)g
U6 V2U6.V2
MAC DSA Template: Introduction to the Alternative Scenarios, the Historical Scenario and the No Policy ChangeScenario and the No-Policy Change
Scenario

U6 V3U6.V3
MAC DSA Template: The Standardized Macro-fiscal Stress
Tests
DEALING WITH UNCERTAINTY 2: Unit 7
CUSTOMIZED SCENARIOS AND FAN CHARTSCHARTS
U7 V1U7.V1
MAC DSA Template: Customized Alternative Scenarios
U7 V2U7.V2
Fan Charts

What Does the Fan Chart Tool Do?What Does the Fan Chart Tool Do?
provides a probabilistic view of theprovides a probabilistic view of the uncertainty around the baseline
shows a spectrum of possible outcomes based on the stochastic properties the data
incorporates interaction between macroeconomic variables
relies on historical data to calibrate the persistence of shockspersistence of shocks
How Are Fan Charts Constructed ?How Are Fan Charts Constructed ?
RGDP,RIRw,PRER,PB
Historicaldata
�,� N(�,�)
DrawsProjectionsConfidence
b ndsbands

What are the Types of Fan Charts ?What are the Types of Fan Charts ?
Symmetric
• upside risks match downside risks • centered around the baseline
Asymmetric
• downside risks higher than upsidet th l t’ b t t f th• capture the analyst’s best assessment of the
likely balance of risks
Symmetric Fan ChartsSymmetric Fan Charts
idupside and
downside45
Fan ChartEvolution of Debt-to-GDP ratio
downside risks are equally l k l
35
40
likely30
25t t+1 t+2 t+3 t+4 t+5 t+6 t+7
10th-25th 25th-50th 50th-75th 75th-90th Baseline

Asymmetric Fan Chartsy
t ff thcut off the upward or downward
45
Fan ChartEvolution of Debt-to-GDP ratio
distribution of shocks in order to represents 35
40
to represents the analyst’s
best t f
30
assessment of the likelihood
of shocks
25t t+1 t+2 t+3 t+4 t+5 t+6 t+7
10th-25th 25th-50th 50th-75th 75th-90th Baseline
U7 V3U7.V3
MAC DSA Template: Fan Charts

CONTINGENT LIABILITIESUnit 8
CONTINGENT LIABILITIES
U8 V1U8.V1
What are Contingent Liabilities ?

What are Contingent Liabilities (CLs) ?What are Contingent Liabilities (CLs) ?Government financial
public entities (including sub-national t t t d t i (SOE ) dfinancial
interventions which arise out of
governments, state-owned enterprises (SOEs) and state banks)
bli i hi ( )explicit and implicit guarantees to
public-private partnerships (PPPs)
to
depositors (deposit insurance)
support to private companies deemed too big to pp p p gfail, etc.
Explicit LiabilitiesExplicit Liabilities
Recognizedd byy aa laww orr contractExamples State guarantees for non-sovereign borrowing and
obligations issued by subnational governments
Recognized by a law or contract
obligations issued by subnational governments and public or private sector entitiesState guarantees for various types of loans and
i t i t tprivate investments
Trade and exchange rate guaranteesTrade and exchange rate guarantees
St t i hState insurance schemes

Implicit LiabilitiesImplicit LiabilitiesAssumed due to public and interest-group
Examples Defaults on non-guaranteed debt and other obligations by b ti l t bli i t t i
p g ppressures
subnational governments or public or private enterprises
Financial system bailout
Corporate sector bailout
Clean-up of liabilities of entities being privatized
Implicit insurance for disaster relief
Contingent Liabilities Are SignificantContingent Liabilities Are Significant

Contingent Liabilities in the DSAContingent Liabilities in the DSA
The DSA envisages Treatment in thegseveral types of CL
shocks
Treatment in the MAC DSA
Guaranteed debt (of SOEs and
PPPs)
d
Natural disasters
Customized scenariosNot standardized
Banking/financialBuilt-in financial CL
Banking/financial crisis
scenarioStandardized
U8 V2U8.V2
Contingent Liabilities Stemming from a Financial Crisis

Costs of Banking CrisesCosts of Banking Crises
Median gross fiscal costs (net of any subsequent recoveries)
13% fwere 13% of banking system assets
Source: Laeven and Valencia (2012)
Triggers for the Financial CL Shock
Contingent Liabilities: Quantitative Triggers for Baking Crises
EMs AEs
Private sector credit-to-GDP (3-yearcumulative level change), in percent
15 30
Loan to deposit ratio
Additi l
Loan-to-deposit ratio 1.5 1.5
average annual increase in nominal housing prices over the preceding 5-
Additional
ov h p i gyear period in excess of
7.5%

The Financial CL in the MAC DSA
The standard contingent
A financial CL shock of 10% of banking sectorIf a quantitative contingent
liability shock also includes
banking sector assets is
automatically generated
trigger is breached
• negative shock to growth
•Or other financial vulnerabilities are growth
• resulting deterioration of the primary balance
• increase in interest rates
identified
rates • decrease in inflation
U8 V2U8.V2
MAC DSA Template: The Financial Contingent Liabilities Shock

VULNERABILITIES STEMMING FROM Unit 9
THE DEBT LEVEL AND FINANCING PROFILEPROFILE
U9 V1U9.V1
Vulnerabilities Stemming from the Level of Debt

Why is High Debt an Issue ?Why is High Debt an Issue ?
i hHigh debt
requires large primary fiscal surpluses to service it
exacerbates an economy’s vulnerability to shocks
exposes a country to a higher risk of a rollover crisisg
may be detrimental to economic growtheconomic growth
Benchmarks for the Debt Burden diIndicators
• Based on “early warning models” whichBased on early warning models which trigger higher scrutiny in the MAC DSA
• To assess risks to debt-to-GDP: indicative benchmarks derived from the signal approach are increased by about 20 percent (to 70 for EMs and 85 for AEs)

Debt Burden Benchmarks for Risk-i hAssessment in the Heat Map
Debt Burden Benchmarks for Risk Assessment Debt profile indicators Debt-to-GDP GFN-to-GDP
EM 70 15EMs 70 15
AEs 85 20
U9 V2U9.V2
The Assessment of Debt Profile Risks in the MAC DSA

Risks from the Debt Financing ProfileRisks from the Debt Financing Profile
Currency Composi
Maturity
Creditor
Composition
base
Debt ProfileDebt Profile Vulnerabilities
Indicators of Debt Profile VulnerabilitiesIndicators of Debt Profile Vulnerabilities
D bt Bond yield spreads (EMBI Global spreads forDebt profile i k
Bond yield spreads (EMBI Global spreads for EMs or Spread over US bonds for AEs)
External financing requirement (% of GDP)risks External financing requirement (% of GDP)
Public debt held by non-residents (share of ytotal)
Public debt in foreign-currency (share of total)
Annual change in the share of short-term debt at original maturityat original maturity
Benchmarks for Debt Profile VulnerabilitiesBenchmarks for Debt Profile Vulnerabilities
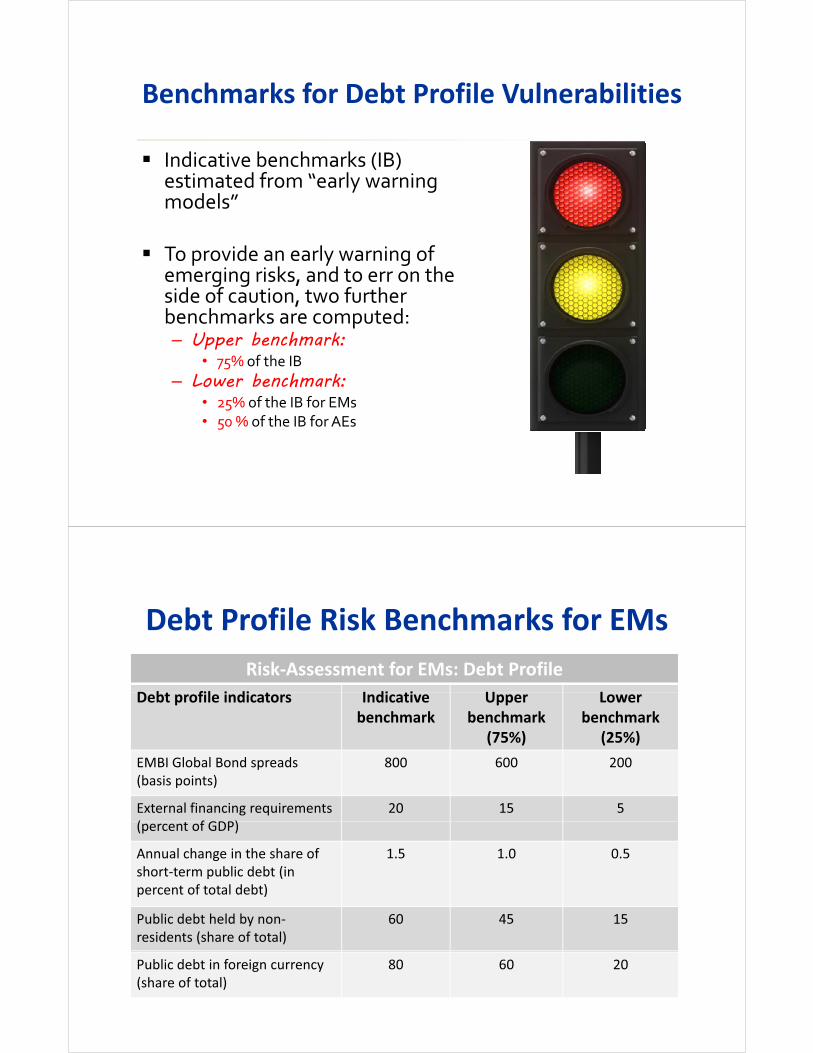
� Indicative benchmarks (IB)Indicative benchmarks (IB) estimated from “early warning models”
� To provide an early warning of emerging risks, and to err on the side of caution two furtherside of caution, two further benchmarks are computed:– Upper benchmark:
• 75% of the IB• 75% of the IB– Lower benchmark:
• 25% of the IB for EMs• 50 % of the IB for AEs50 % of the IB for AEs
Debt Profile Risk Benchmarks for EMsDebt Profile Risk Benchmarks for EMsRisk-Assessment for EMs: Debt Profile
D b fil i di I di i U LDebt profile indicators Indicative benchmark
Upper benchmark
(75%)
Lower benchmark
(25%) EMBI Global Bond spreads(basis points)
800 600 200
External financing requirements ( f GDP)
20 15 5(percent of GDP)
Annual change in the share of short-term public debt (in
t f t t l d bt)
1.5 1.0 0.5
percent of total debt)
Public debt held by non-residents (share of total)
60 45 15
Public debt in foreign currency (share of total)
80 60 20

Debt Profile Risk Benchmarks for AEsDebt Profile Risk Benchmarks for AEsRisk-Assessment for EMs: Debt Profile
D b fil i di I di i U LDebt profile indicators Indicative benchmark
Upper benchmark
(75%)
Lower benchmark
(50%) EMBI Global Bond spreads(basis points)
800 600 400
External financing requirements ( t f GDP)
35 25 17.5(percent of GDP)
Annual change in the share of short-term public debt (in percent of total debt)
2.0 1.5 1.0
percent of total debt)
Public debt held by non-residents (share of total)
60 45 30
Differences with EMs
Reporting of Debt Profile RisksReporting of Debt Profile Risks

U9 V3U9.V3
MAC DSA Template: Financing Assumptions and the Debt Profile
ASSESSMENT AND WRITE-UPUnit 10
ASSESSMENT AND WRITE UP

U10 V1U10.V1
The Heat Map
The Heat MapThe Heat Map
Conveys in aConveys in a standardized way the risks to d btdebt sustainability from the various modules in the template

Assessment of Risks from Macro-Fiscal d i i bili i h kand Contingent Liabilities Shocks
Risk Assessment: Macro-Fiscal Risks and Contingent Liabilities(d i ll f ll )(done automatically for all stress tests)
Baseline Stress-test
High (red) above benchmark above benchmark
Moderate (yellow) below benchmark above benchmarkModerate (yellow) below benchmark above benchmark
Low (green) below benchmark below benchmark
Assessment of Debt Profile Risks for EMsAssessment of Debt Profile Risks for EMsRisk-Assessment for EMs: Debt Profile
Debt profile indicators Low Moderate risk HighDebt profile indicators Low risk
Moderate risk High Risk
Bond spreads (basis points) Below Between 200 and Above 200 600 600
External financing requirements (percent of GDP)
Below 5 Between 5 and 15 Above 15
Annual change in the share of short-term public debt (in percent of total debt)
Below 0.5
Between 0.5 and 1.0
Above 1.0
)Public debt held by non-residents (share of total)
Below 15 Between 15 and 45
Above 45
Public debt in foreign currency Below 20 Between 20 and AbovePublic debt in foreign currency (share of total)
Below 20 Between 20 and 60
Above 60

Assessment of Debt Profile Risks for AEsAssessment of Debt Profile Risks for AEsRisk-Assessment for AEs: Debt Profile
Debt profile indicators Low Moderate risk HighDebt profile indicators Low risk
Moderate risk High Risk
Bond spreads (basis points) Below Between 400 and Above 400 600 600
External financing requirements (percent of GDP)
Below 17 Between 17 and 25
Above 25
Annual change in the share of short-term public debt (in percent of total debt)
Below 1.0
Between 1.0 and 1.5
Above 1.5
)Public debt held by non-residents (share of total)
Below 30 Between 30 and 45
Above 45
Summarizing Risks: Heat MapsSummarizing Risks: Heat Maps Public DSA Risk Assessment
Heat Map
Debt level Real GDP Growth Shock
Primary Balance Shock
Real Interest
Rate Shock
Exchange Rate Shock
Contingent Liability shock
Gross financing needs
Real GDP Growth Shock
Primary Balance Shock
Real Interest
Rate Shock
Exchange Rate Shock
Contingent Liability Shock
Market Perception
External Financing
Requirements
Change in the Share of Short-Term
Debt
Public Debt Held by
Non-Residents
Foreign Currency
DebtDebt profile

U10 V2U10.V2
The Write-Up and Risk-AssessmentNatalia NovikovaNatalia Novikova
Ireland: High Vulnerabilities from the Debt Level
Source: Ireland: Twelfth Review under the Extended Arrangement and Proposal for Post program Monitoring, December 2013.

Ireland: High Vulnerabilities from the Debt Level
• ‘…the planned reduction in the large cash buffer after a major p g ff f jdebt amortization in January 2014 allows gross public debt to decline from 2014… net public debt … falls to just below 100 percent of GDP by 2018 when the cash buffer is assumed topercent of GDP by 2018 when the cash buffer is assumed to shrink to more normal levels of about 7 percent of GDP.’
• ‘Debt reductions from asset sales present an upside risk. Current baseline assumptions do not incorporate proceeds from state asset disposals of up to €3 billion (around 1¾ percent of GDP) at least half of which are to be used for debt reductionGDP) …, at least half of which are to be used for debt reduction. Similarly, no allowance is made for further transactions reducing the cost incurred in supporting the banking system … ‘
Source: Ireland: Twelfth Review under the Extended Arrangement and Proposal for Post program Monitoring, December 2013.
Low Debt LevelLow Debt Level
Belarus
Source: Republic of Belarus: Fifth Post-Program Monitoring Discussions, January 2014.
Mexico
Source: Mexico: Staff Report for the 2013 Article IV Consultation, November 2013.
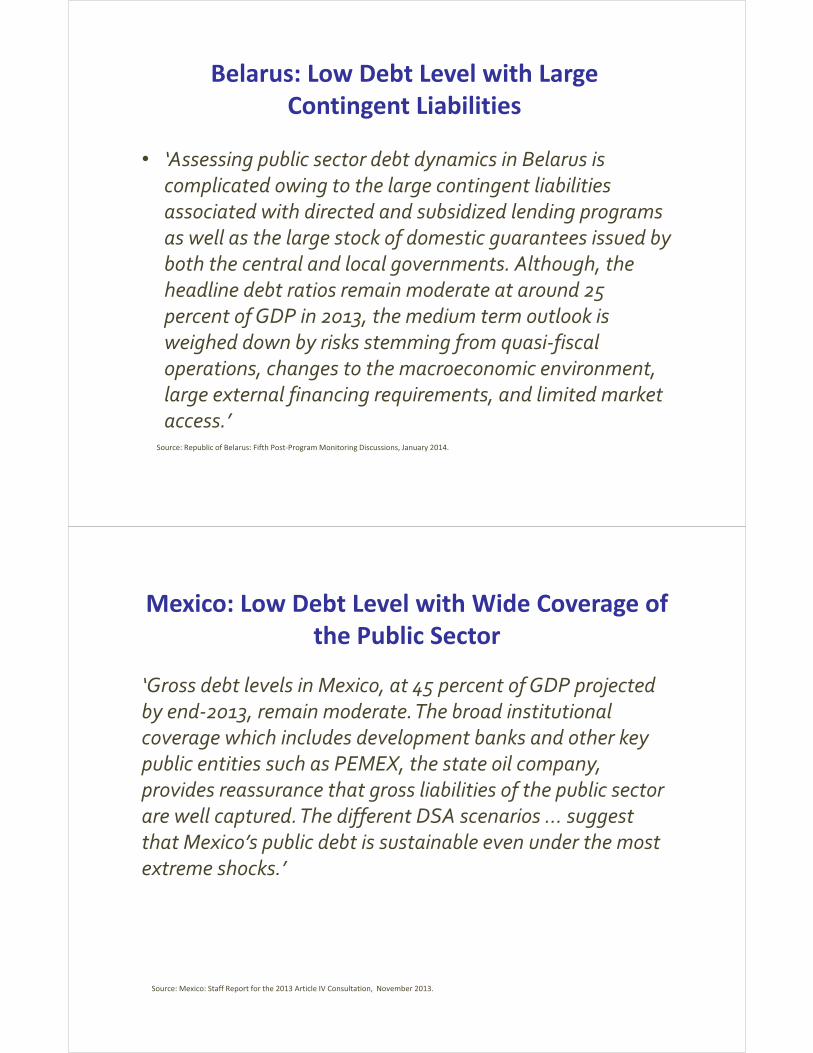
Belarus: Low Debt Level with Large Contingent LiabilitiesContingent Liabilities
• ‘Assessing public sector debt dynamics in Belarus is ssess g pub c secto debt dy a cs e a us scomplicated owing to the large contingent liabilities associated with directed and subsidized lending programs
ll h l k f d i i d bas well as the large stock of domestic guarantees issued by both the central and local governments. Although, the headline debt ratios remain moderate at around 25headline debt ratios remain moderate at around 25 percent of GDP in 2013, the medium term outlook is weighed down by risks stemming from quasi-fiscal
h hoperations, changes to the macroeconomic environment, large external financing requirements, and limited market access ’
Source: Republic of Belarus: Fifth Post-Program Monitoring Discussions, January 2014.
access.
Mexico: Low Debt Level with Wide Coverage of h P bli Sthe Public Sector
‘Gross debt levels in Mexico, at 45 percent of GDP projected G oss debt e e s e co, at 45 pe ce t of G p ojectedby end-2013, remain moderate. The broad institutional coverage which includes development banks and other key
bli i i h PEMEX h ilpublic entities such as PEMEX, the state oil company, provides reassurance that gross liabilities of the public sector are well captured.The different DSA scenarios … suggestare well captured. The different DSA scenarios … suggest that Mexico’s public debt is sustainable even under the most extreme shocks.’
Source: Mexico: Staff Report for the 2013 Article IV Consultation, November 2013.

U10 V3U10.V3
Concluding remarks
Supplementary MaterialSupplementary Material
The Benchmarks in the MAC DSA: Methodology and Usages

How are the Benchmarks Derived ?How are the Benchmarks Derived ?
• Signal approach/ early warning modelsTh l i b h k
False alarms
• The early warning benchmarks are derived by finding the value of the threshold X that minimizes the:minimizes the:
ADB
B��ratio signal-to-Noise
Type II Type I
CAA�
g
Missed
135
yperrors = B/(B+D)
yperrors = C/(A+C)
crises
Use of the Benchmarks in the TemplateUse of the Benchmarks in the Template
Indicative/Early warning/Signal
approachapproach benchmarks
Classification Benchmarks forbenchmarks: lower vs higher
scrutiny
Benchmarks for assessing risks in
the heat mapscrutiny

Debt Burden Indicators
Indicative benchmarks Debt/GDP
-15% +20%
Classification benchmarks
Heat map benchmarksbenchmarks benchmarks
Debt-to-GDP Benchmarks
Debt-to-GDP
Indicative Classification Heat mapbenchmark benchmark benchmark
EM 60 -15%*60= 51� 50 +20%*60=72 � 705 5 5 7 7
AE 70 -15%*70= 59.5� 60 +20%*70=84� 85

GFN-to-GDP Benchmarks
GFN-to-GDP
Indicative benchmark
Classification benchmark
Heat mapbenchmarkbenchmark benchmark benchmark
EM 15 -15%*15=12.75 �10 15
AE 20 -15%*20=17� 15 20
Summary: Debt Burden Indicatorsh kBenchmarks
Benchmarks for Debt Burden IndicatorsEM EM EM AE AE AE
Heat HeatIndicator Unit Indic Classif
Heatmap Indic Classif
Heatmap
Gross government debt Percent of GDP 60 50 70 70 60 85Gross public sector financing
requirements Percent of GDP 15 10 15 20 15 20

Assessment of Risks from Macro-Fiscal d i i bili i h kand Contingent Liabilities Shocks
Debt-to-GDPBaseline < 70/85 < 70/85 > 70/85
Shock Scenario < 70/85 > 70/85 > 70/85
GFN-to-GDPBaseline < 15/20 < 15/20 > 15/20
Shock Scenario < 15/20 > 15/20 > 15/20
Benchmarks for Debt Profile Vulnerabilities
Indicative benchmarks
Lower early Upper early EMs:25% 75%warning
benchmarkswarning
benchmarks
EMs:25%AEs:50%
75%
ClassificationClassification benchmarks
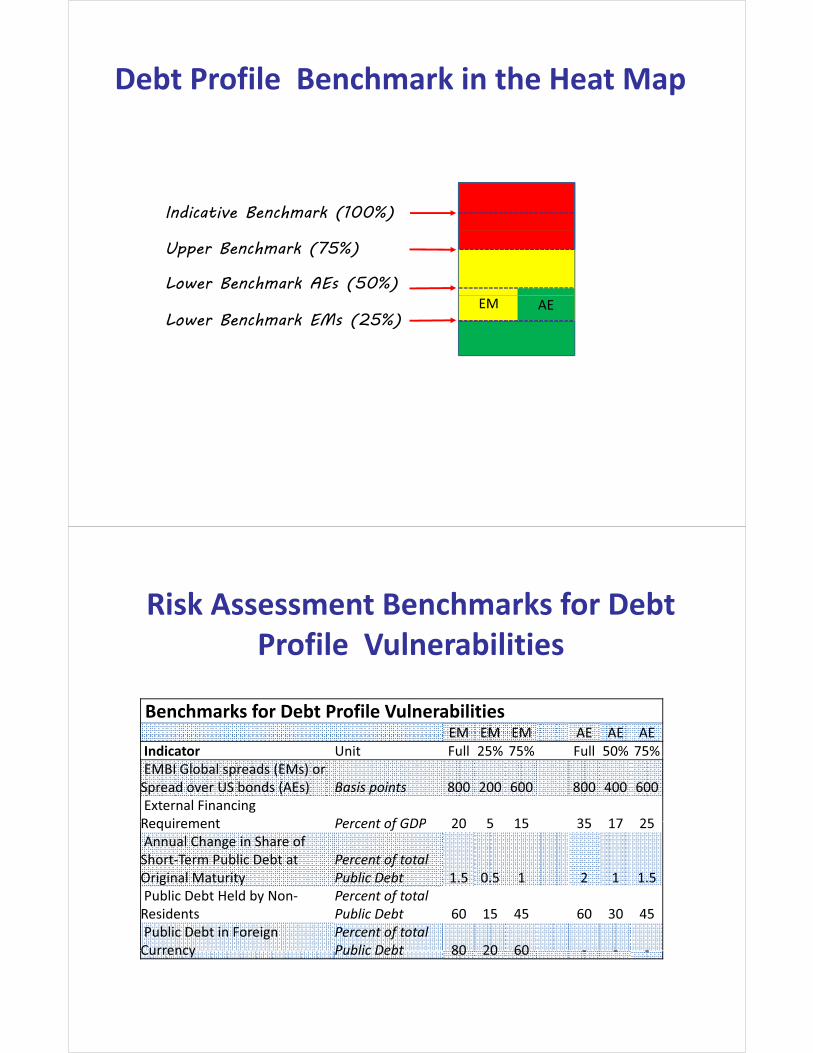
Debt Profile Benchmark in the Heat Map
Indicative Benchmark (100%)
Upper Benchmark (75%)
Lower Benchmark AEs (50%)
Lower Benchmark EMs (25%)EM AE
Risk Assessment Benchmarks for Debt Profile Vulnerabilities
Benchmarks for Debt Profile VulnerabilitiesEM EM EM AE AE AE
Indicator Unit Full 25% 75% Full 50% 75%EMBI Global spreads (EMs) or
Spread over US bonds (AEs) Basis points 800 200 600 800 400 600External Financing Requirement Percent of GDP 20 5 15 35 17 25Requirement Percent of GDP 20 5 15 35 17 25Annual Change in Share of
Short-Term Public Debt at Original Maturity
Percent of total Public Debt 1.5 0.5 1 2 1 1.5
Public Debt Held by Non-Residents
Percent of total Public Debt 60 15 45 60 30 45
Public Debt in Foreign Currency
Percent of total Public Debt 80 20 60 - - -Currency Public Debt 80 20 60 - - -