the public school employees’ retirement system of ...€¦ · ©2014 xerox corporation and buck...
TRANSCRIPT

The Public School Employees’ Retirement
System of Pennsylvania
Information Required Under Governmental Accounting Standards Board Statement No. 67 as of June 30, 2014

©2014 Xerox Corporation and Buck Consultants, LLC. All rights reserved. Xerox® and Xerox and Design® are trademarks of Xerox Corporation in the United States and/or other countries. Buck Consultants® is a registered trademark of Buck Consultants, LLC in the United States and/or other countries. BRXXXX.
Other company trademarks are also acknowledged.
Document Version: 1.0 (July 2014).

David L. Driscoll Principal, Consulting Actuary Edward Quinn Director, Retirement Actuary Salvador Nakar Senior Consultant, Actuary Buck Consultants, LLC 500 Plaza Drive Secaucus, NJ 07096 [email protected] [email protected] [email protected] tel 201.902.2300 fax 201.633.5168
January 13, 2015
The Retirement Board Public School Employees’ Retirement System of Pennsylvania P.O. Box 125 Harrisburg, Pennsylvania 17108 Members of the Board: This valuation provides information concerning the Public School Employees’ Retirement System of Pennsylvania (PSERS) in accordance with the Governmental Accounting Standards Board (GASB) Statement No. 67. This Statement is an amendment of Statements No. 25, Financial Reporting for Defined Benefit Pension Plans and Note Disclosures for Defined Contribution Plans, and No. 50, Pension Disclosures, effective for the fiscal year ending June 30, 2014. We certify that the information contained in this Actuarial Report has been prepared in accordance with generally accepted actuarial principles and practices. To the best of our knowledge, the information fairly presents the actuarial position of PSERS in accordance with the requirements of GASB Statement No. 67 as of June 30, 2014. The Board of Trustees and staff of PSERS may use this report for the review of the operation of the System and as a source of information for the Commonwealth financial statements. The report may also be used in the preparation of the System’s audited financial statements. Use of this report for any other purpose or by anyone other than the Board of Trustees or the staff of PSERS may not be appropriate and may result in mistaken conclusions because of failure to understand applicable assumptions, methods, or inapplicability of the report for that purpose. No one may make any representations or warranties based on any statements or conclusions contained in this report without Buck Consultants’ prior written consent. Future actuarial measurements may differ significantly from current measurements due to System experience differing from that anticipated by the economic and demographic assumptions, increases or decreases expected as part of the natural operation of the methodology used for these measurements, and changes in System provisions or applicable law. An analysis of the potential range of such future differences is beyond the scope of this valuation. In preparing the actuarial results, we have relied upon information provided by the staff of PSERS regarding System provisions, System participants, System assets, contribution rates and other matters used in the actuarial valuation. Although we did not audit the data, we reviewed the data for reasonableness and consistency with the prior year’s information. The accuracy of the results presented herein is dependent on the accuracy of the data. As required under Section 8502(j) of the Retirement Code, experience studies are performed once in every five year period. This valuation was prepared on the basis of the demographic and economic assumptions that were selected on the basis of the July 1, 2005 to June 30, 2010 Experience Review and adopted by the Board of Trustees at their March 11, 2011 meeting, which include a 7.50% per annum rate of investment return. As mandated by the Retirement Code, these assumptions will remain in effect for valuation purposes until such time the Board of Trustees adopts revised assumptions.

January 13, 2015Board of Trustees Page 2 In our opinion, the actuarial assumptions used are appropriate for purposes of the valuation and are reasonably related to the experience of the System and to reasonable long-term expectations. The mortality improvement assumption was selected in accordance with Actuarial Standard of Practice No. 35. This report was prepared under our supervision. We are Members of the American Academy of Actuaries. We meet the Academy’s qualification Standards to issue this Statement of Actuarial Opinion. This report has been prepared in accordance with all applicable Actuarial Standards of Practice and we are available to answer questions about it. Buck Consultants, LLC
David L. Driscoll, FSA, EA, MAAA, FCA Principal, Consulting Actuary
Edward Quinn, EA, MAAA, FCA Director, Retirement Actuary
Salvador Nakar, EA, MAAA, FCA Senior Consultant, Actuary

Table of Contents
Section I
GASB 67 Information ................................................................................................ 1
Section II
Actuarial Assumptions and Methods ......................................................................... 6
Section III
Summary of System Provisions ................................................................................ 8
Appendix A
Financial Information Provided by Hewitt EnnisKnupp, an AON Company ............ 11
Page 1
Section I – GASB 67 Information
Notes to the Financial Statements for the Year Ended June 30, 2014
Summary of Significant Accounting Policies
Method used to value investments. Investments are reported at fair value.
System Description
System administration. The administrative staff of the Public School Employees’ Retirement System of Pennsylvania (PSERS or System) administers the System. The System is a governmental cost-sharing multi-employer defined benefit pension plan that provides retirement benefits to public school employees of the Commonwealth of Pennsylvania (Commonwealth). The members eligible to participate in the System include all full-time public school employees, part-time hourly public school employees who render at least 500 hours of service in the school year, and part-time per diem public school employees who render at least 80 days of service in the school year in any of the reporting entities in Pennsylvania.
The control and management of the System, including the investment of its assets, is vested in the Board of Trustees (Board). The Board consists of 15 members: the Secretary of Education, ex officio; the State Treasurer, ex officio; two Senators; two members of the House of Representatives; the executive secretary of the Pennsylvania School Boards Association, ex officio; two Governor appointees, at least one of whom shall not be a school employee or an officer or employee of the State of Pennsylvania; three who are elected by the active professional members of the System from among their number; one who is elected by annuitants from among their number; one who is elected by the active nonprofessional members of the System from among their number; and one who is elected by members of Pennsylvania public school boards from among their number. The chairman of the Board is elected by the Board members. Each ex officio member of the Board and each legislative member of the Board may appoint a duly authorized designee to act in their stead.
The Commonwealth’s General Assembly has the authority to amend the benefit terms of the System by passing bills in the Senate and House of Representatives and sending them to the Governor for approval.
Page 2
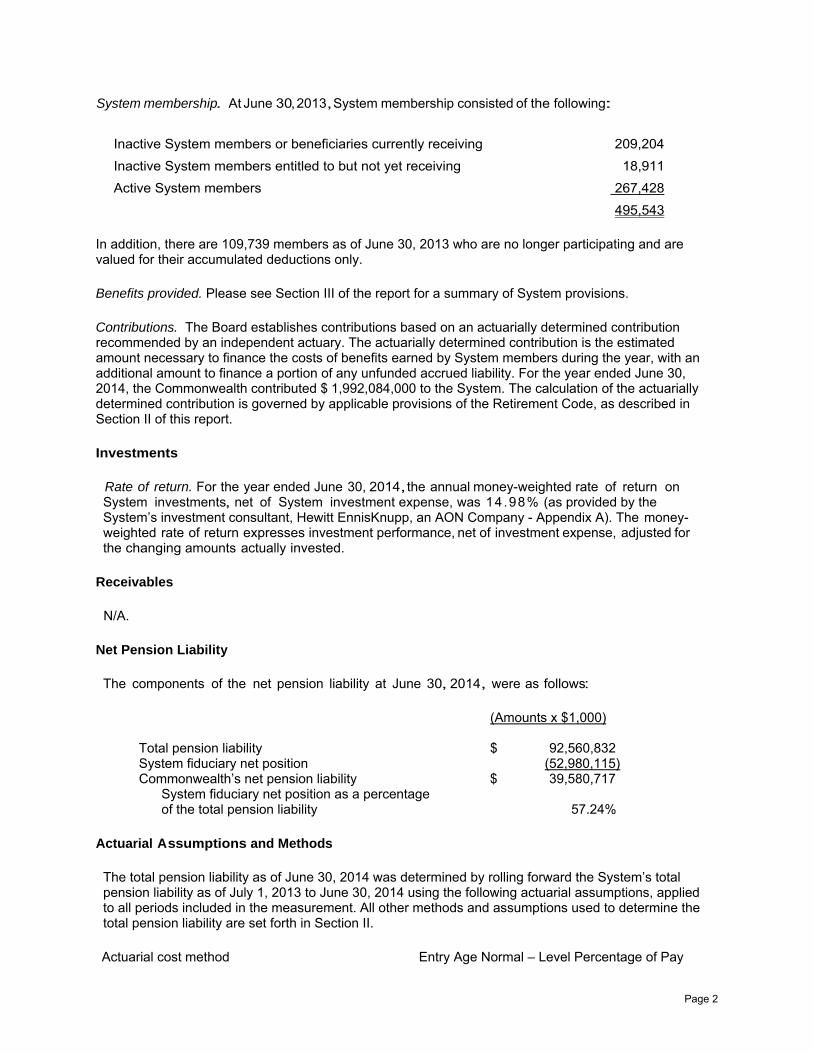
System membership. At June 30, 2013, System membership consisted of the following:
Inactive System members or beneficiaries currently receiving 209,204 Inactive System members entitled to but not yet receiving 18,911 Active System members 267,428 495,543
In addition, there are 109,739 members as of June 30, 2013 who are no longer participating and are valued for their accumulated deductions only.
Benefits provided. Please see Section III of the report for a summary of System provisions.
Contributions. The Board establishes contributions based on an actuarially determined contribution recommended by an independent actuary. The actuarially determined contribution is the estimated amount necessary to finance the costs of benefits earned by System members during the year, with an additional amount to finance a portion of any unfunded accrued liability. For the year ended June 30, 2014, the Commonwealth contributed $ 1,992,084,000 to the System. The calculation of the actuarially determined contribution is governed by applicable provisions of the Retirement Code, as described in Section II of this report.
Investments
Rate of return. For the year ended June 30, 2014, the annual money-weighted rate of return on System investments, net of System investment expense, was 14.98% (as provided by the System’s investment consultant, Hewitt EnnisKnupp, an AON Company - Appendix A). The money-weighted rate of return expresses investment performance, net of investment expense, adjusted for the changing amounts actually invested.
Receivables
N/A.
Net Pension Liability
The components of the net pension liability at June 30, 2014, were as follows:
(Amounts x $1,000) Total pension liability $ 92,560,832 System fiduciary net position (52,980,115) Commonwealth’s net pension liability $ 39,580,717 System fiduciary net position as a percentage
of the total pension liability
57.24%
Actuarial Assumptions and Methods
The total pension liability as of June 30, 2014 was determined by rolling forward the System’s total pension liability as of July 1, 2013 to June 30, 2014 using the following actuarial assumptions, applied to all periods included in the measurement. All other methods and assumptions used to determine the total pension liability are set forth in Section II.
Actuarial cost method Entry Age Normal – Level Percentage of Pay

Page 3
The long-term expected rate of return on pension System investments was determined using a building-block method in which best-estimate ranges of expected future real rates of return (expected returns, net of pension System investment expense and inflation) are developed for each major asset class. These ranges are combined to produce the long-term expected rate of return by weighting the expected future real rates of return by the target asset allocation percentage and by adding expected inflation. Best estimates of arithmetic rates of return for each major asset class included in the System's target asset allocation as of June 30, 2014 are summarized in Appendix A, as provided by the System’s investment consultant - Hewitt EnnisKnupp, an AON Company.
Discount rate. The discount rate used to measure the total pension liability was the funding valuation rate of 7.50%. The projection of cash flows used to determine the discount rate assumed that Commonwealth contributions will continue to follow the current funding policy as prescribed by Act 120 of 2010. Based on those assumptions, the System's fiduciary net position was projected to be available to make all projected future benefit payments of current System members. Therefore, the long-term expected rate of return on pension plan investments was applied to all periods of projected benefit payments to determine the total pension liability, in accordance with the method prescribed by GASB Statement No. 67. We believe this assumption is reasonable for the purposes of the measurements required by the Statement. In the event of benefit payments not covered by the Plan’s fiduciary net position, a municipal bond rate of 3.66% would be used to discount the benefit payments not covered by the Plan’s fiduciary net position. The 3.66% rate equals the S&P Municipal Bond 20-Year High Grade Rate Index at June 30, 2014.
The discount rate is the single rate that reflects (1) the long-term expected rate of return on System investments that are expected to be used to finance the payment of benefits, to the extent that the System’s fiduciary net position is projected to be sufficient to make projected benefit payments and System assets are expected to be invested using a strategy to achieve that return, and (2) a yield or index rate for 20-year, tax-exempt general obligation municipal bonds with an average rating of AA/Aa or higher (or equivalent quality on another scale), to the extent that the conditions for use of the long-term expected rate of return are not met.
The projections of the Fiduciary Net Plan Position are based on contributions to the System in accordance with the provisions of Act 120 of 2010. Should contributions to the System be reduced from those based on the provisions of Act 120 of 2010, the results would reflect the new contribution policy and may result in the Fiduciary Net Plan Position not being sufficient to cover the System’s benefit payments at some future date and thus lowering the discount rate used to determine the System’s Total Pension Liability.
Sensitivity of the net pension liability to changes in the discount rate. The following presents the net pension liability, calculated using the discount rate of 7.50%, as well as what the Commonwealth's net pension liability would be if it were calculated using a discount rate that is 1-percentage-point lower (6.50%) or 1-percentage-point higher (8.50%) than the current rate:
1% Decrease (6.50%)
Current Discount Rate
(7.50%)
1% Increase (8.50%)
Net Pension Liability (Amounts x $1,000) $ 49,371,459 $ 39,580,717 $ 31,222,108
Page 4
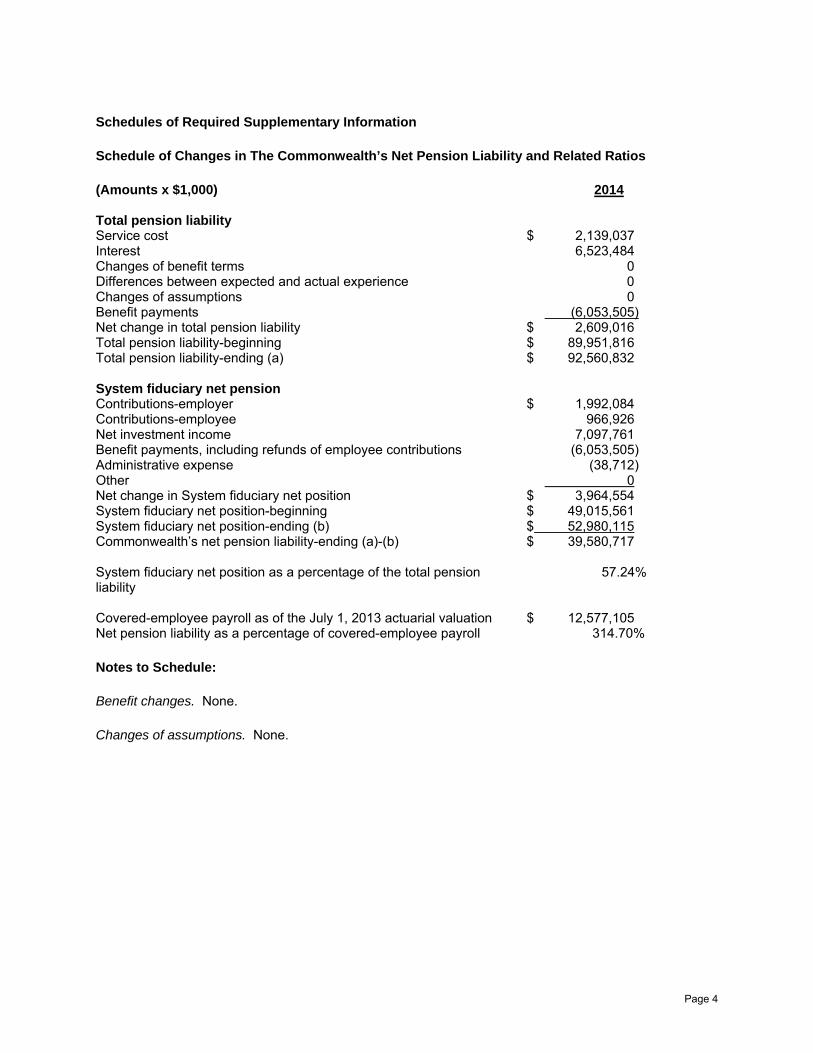
Schedules of Required Supplementary Information
Schedule of Changes in The Commonwealth’s Net Pension Liability and Related Ratios
(Amounts x $1,000) 2014 Total pension liability Service cost $ 2,139,037 Interest 6,523,484 Changes of benefit terms 0 Differences between expected and actual experience 0 Changes of assumptions 0 Benefit payments (6,053,505) Net change in total pension liability $ 2,609,016 Total pension liability-beginning $ 89,951,816 Total pension liability-ending (a) $ 92,560,832 System fiduciary net pension Contributions-employer $ 1,992,084 Contributions-employee 966,926 Net investment income 7,097,761 Benefit payments, including refunds of employee contributions (6,053,505) Administrative expense (38,712) Other 0 Net change in System fiduciary net position $ 3,964,554 System fiduciary net position-beginning $ 49,015,561 System fiduciary net position-ending (b) $ 52,980,115 Commonwealth’s net pension liability-ending (a)-(b) $ 39,580,717 System fiduciary net position as a percentage of the total pension liability
57.24%
Covered-employee payroll as of the July 1, 2013 actuarial valuation $ 12,577,105 Net pension liability as a percentage of covered-employee payroll 314.70%
Notes to Schedule:
Benefit changes. None.
Changes of assumptions. None.

Page 5
Schedule of Commonwealth Contributions
(Amounts x $1,000) 2014 Actuarially determined contribution $ 2,965,715 Contributions related to the actuarially determined contribution 1,992,084 Contribution deficiency (excess) $ 973,631
Notes to Schedule
Valuation date: Actuarially determined contributions are calculated as of the June 30 preceding the fiscal year in which contributions are made. That is, the contribution calculated as of the June 30, 2013 actuarial valuation will be made during the fiscal year ended June 30, 2015.
The methods and assumptions used to determine the actuarially determined contributions to the System are set forth in Section II.
Schedule of Investment Returns
2014 Annual money-weighted rate of return, net of investment expenses* 14.98%
* Provided by the System’s investment consultant, Hewitt EnnisKnupp, an AON Company - Appendix A.

Page 6
Section II – Actuarial Assumptions and Methods
Interest Rate: 7.50% per annum, compounded annually (adopted as of June 30, 2011). The components are 3.00% for inflation and 4.50% for the real rate of return. Actuarial equivalent benefits are determined based on 4% (since 1960). Separation from Service: Illustrative rates of assumed separation from service are shown in the following table (adopted as of June 30, 2011).
Annual Rate of: Vested Withdrawal*
Age Non-Vested Withdrawal
Less Than 10 Years of
Service
10 or More Years of Service Death Disability
Early Retirement**
SuperannuationRetirement
MALES 25 30 35 40 45
50 55 60 65 69
12.50% 10.50 11.00 13.00 13.00
13.00 11.00 10.50
5.50% 3.20 3.00 3.50 3.50
3.50 3.50 3.50
2.00% 2.00 1.50 1.25 1.25
1.70 3.00 4.50
.037%
.038
.056
.090
.121 .173 .245 .363 .592 .810
.024%
.024
.100
.180
.180 .280 .430 .580 .100 .100
15.00% 12.00
25.00%
25.00 30.00 28.00 20.00 18.00
FEMALES 25 30 35 40 45
50 55 60 65 69
13.00% 13.00 13.00 10.90 10.90
10.90 10.90 10.90
8.50% 6.50 5.50 4.50 4.00
3.75 3.75 4.50
5.00% 4.00 3.00 1.50 1.50
1.75 3.00 5.50
.018%
.019
.022
.035
.055 .085 .133 .197 .301 .428
.030%
.040
.060
.100
.150 .200 .380 .380 .130 .130
15.00% 15.00
30.00%
30.00 30.00 30.00 25.00 20.00
* Vested Withdrawal – At least 5 years of service for Class T-C and Class T-D members and 10 years of service for Class T-E and Class T-F members but not eligible for Early or Superannuation retirement.
** Early Retirement – Age 55 with 25 years of service, but not eligible for Superannuation retirement.
Death after Retirement: The RP-2000 Combined Healthy Annuitant Tables (Male and Female) with age set back 3 years for both genders for healthy annuitants and for dependent beneficiaries. The RP-2000 Combined Disabled Tables (Male and Female) with age set back 7 years for males and set back 3 years for females for disabled annuitants. (A unisex table based on the RP-2000 Combined Healthy Annuitant Tables (Male and Female) with age set back 3 years for both genders assuming the population consists of 25% males and 75% females is used to determine actuarial equivalent benefits.) No specific additional provision has been made to reflect possible future improvements in mortality.

Page 7
Salary Increase: Effective average of 5.50% per annum, compounded annually (adopted as of June 30, 2011). The components are 3.00% for inflation, 1% for real wage growth and 1.5% for merit or seniority increases. Representative values are as follows:
Age
Annual Rate of Salary Increase
20 30 40 50
10.75% 8.25 6.25 4.25
55 60 65 70
3.75 3.75 3.75 3.75
Payroll Growth: 3.50% per annum. MISCELLANEOUS Option 4 Elections: 100% of Class T-C and Class T-D members are assumed to elect a refund of contributions and a reduced annuity. Withdrawal Annuity: 90% of members are assumed to commence payment immediately and 10% are assumed to defer payment to superannuation age. METHODS Asset Valuation Method for Pension Funding: A ten-year moving market average (five-year moving market average prior to June 30, 2010) value of assets that recognizes the 7.50% (8.00% prior to June 30, 2011, 8.25% prior to June 30, 2009, and 8.50% prior to June 30, 2008) actuarial expected investment return immediately and spreads the difference between the actual return on the market value of assets and the expected return on the actuarial value of assets over a period of ten years is prescribed for use in funding calculations under Act 120 of 2010. The averaging period is being phased-in from fiscal year 2006. Actuarial Cost Method for Pension Funding: Entry Age Normal Cost Method (modified slightly as of June 30, 2005 to use a pay-weighted average normal contribution rate). The results of each June 30 valuation normally determine the employer contribution rate for the second succeeding fiscal year. Act 120 revised the funding method effective with the June 30, 2010 valuation. Act 120 mandated that the outstanding balance of the unfunded accrued liability as of June 30, 2010, including changes in the unfunded accrued liability due to the funding reforms of Act 120, be amortized over a 24-year period, as a level percent of pay, beginning July 1, 2011. Future valuation gains and losses, and changes in the unfunded accrued liability resulting from changes in actuarial assumptions and methods, are amortized over a 24-year period, as a level percent of pay. Future increases in the unfunded accrued liability due to legislation will be amortized over a 10-year period, as a level percent of pay. Act 120 also modified the employer pension contribution requirements by imposing collars on the rate at which employer contributions may rise from year to year. For the fiscal years ending June 30, 2012, June 30, 2013, and on or after June 30, 2014 the pension contribution rate can be no more than 3%, 3.5% and 4.5%, respectively, of total compensation of all active members, greater than the prior year’s final contribution rate. Beginning with the fiscal year in which the actuarially required contribution rate is less than the collared rate, the final contribution rate is the actuarially determined contribution rate, provided that the final contribution rate is not less than the employer normal contribution rate.

Page 8
Section III – Summary of System Provisions
Pennsylvania Statutes, Title 24, PART IV. RETIREMENT FOR SCHOOL EMPLOYEES
MEMBERSHIP For valuation purposes, all employees are considered to be full coverage. All employees who become members on and after January 1, 1966 are members of the dual coverage group. Dual coverage members contribute to both PSERS and to Social Security. BENEFITS Superannuation Annuity Eligibility Age 62, or age 60 with 30 years of service, or 35 years of service
regardless of age. For Class T-E and Class T-F members, age 65 with a minimum of three years of service credit, or any combination of age and service that totals 92 with at least 35 years of credited service
Amount 2.5% of final average salary times years of school service and
intervening military service. 2% of final average salary for non-school service, for members who did not elect Class T-D coverage, and for Class T-E members. Minimum of $100 per year of service. "Final average salary" means the highest average annual salary for any 3 years of service.
Annual salary is subject to a limit of $200,000, as adjusted under
Section 401(a)(17) of the Internal Revenue Code. As of June 30, 2013, the adjusted limit is $255,000.
For members who elect coverage under Class T-D, the maximum
benefit is equal to the limit established by Section 415 of the Internal Revenue Code.
For Class T-E and Class T-F members, the maximum benefit is
equal to the lesser of the limit established by Section 415 of the Internal Revenue Code or 100% of final average salary.
Early Retirement Annuity Eligibility Age 55 with 25 years of service. Amount Accrued benefit as of date of retirement, reduced 1/4% for each
month by which commencement of payments precedes Superannuation Age.
For members who elect coverage under Class T-D, the maximum
benefit is equal to the limit established by Section 415 of the Internal Revenue Code.
For Class T-E and Class T-F members, the maximum benefit is
equal to the lesser of the limit established by Section 415 of the Internal Revenue Code or 100% of final average salary.

Page 9
Withdrawal Annuity Eligibility 5 years of service. For Class T-E and Class T-F members, ten years of service. Amount Accrued benefit deferred to superannuation retirement age or an
actuarially reduced benefit payable immediately. Actuarially equivalent benefits are based on 4% interest and a unisex table based on the RP-2000 Combined Healthy Annuitant Tables (Male and Female) with age set back 3 years for both genders assuming the population consists of 25% males and 75% females.
Disability Annuity Eligibility 5 years of service. Amount The standard single life annuity if the total number of years of
credited service is greater than 16.667, otherwise the standard single life annuity multiplied by the lesser of the following ratios: (Y*/Y) or (16.667/Y) where Y is the number of years of credited service and Y* is the total years of credited service if the member were to continue as a school employee until superannuation retirement age (or at current age, if later). Minimum of $100 per year of service.
Return of Contributions Eligibility Death or separation from service and member does not qualify for
other benefits. Amount Refund of accumulated deductions includes interest (less annuity
payments received prior to death in the case of a retired member). Death Benefit Eligibility Death of an active member or vestee who was eligible to receive an
annuity. Amount The present value of the annuity that would have been effective if the
member retired on the day before death. Option 1 assumed payable if no other option elected.
Normal and Optional Forms of Benefits Normal Form: Life annuity with a guaranteed payment equal to member
contributions with interest. Option 1: Reduced benefit with refund of balance of present value of annuity at
retirement over payments received. If balance is less than $5,000, benefit is paid in lump sum; otherwise, beneficiary may elect annuity and/or lump sum.
Option 2: Joint and 100% survivorship annuity. Option 3: Joint and 50% survivorship annuity.
Page 10
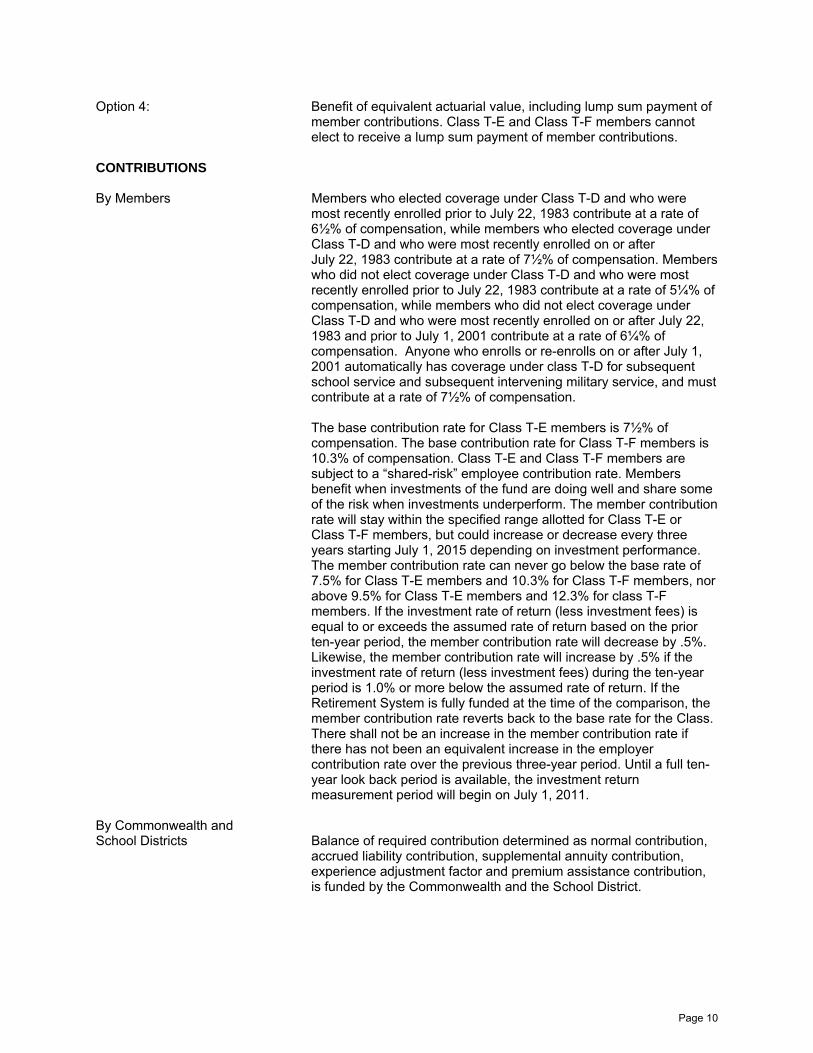
Option 4: Benefit of equivalent actuarial value, including lump sum payment of member contributions. Class T-E and Class T-F members cannot elect to receive a lump sum payment of member contributions.
CONTRIBUTIONS By Members Members who elected coverage under Class T-D and who were
most recently enrolled prior to July 22, 1983 contribute at a rate of 6½% of compensation, while members who elected coverage under Class T-D and who were most recently enrolled on or after July 22, 1983 contribute at a rate of 7½% of compensation. Members who did not elect coverage under Class T-D and who were most recently enrolled prior to July 22, 1983 contribute at a rate of 5¼% of compensation, while members who did not elect coverage under Class T-D and who were most recently enrolled on or after July 22, 1983 and prior to July 1, 2001 contribute at a rate of 6¼% of compensation. Anyone who enrolls or re-enrolls on or after July 1, 2001 automatically has coverage under class T-D for subsequent school service and subsequent intervening military service, and must contribute at a rate of 7½% of compensation.
The base contribution rate for Class T-E members is 7½% of
compensation. The base contribution rate for Class T-F members is 10.3% of compensation. Class T-E and Class T-F members are subject to a “shared-risk” employee contribution rate. Members benefit when investments of the fund are doing well and share some of the risk when investments underperform. The member contribution rate will stay within the specified range allotted for Class T-E or Class T-F members, but could increase or decrease every three years starting July 1, 2015 depending on investment performance. The member contribution rate can never go below the base rate of 7.5% for Class T-E members and 10.3% for Class T-F members, nor above 9.5% for Class T-E members and 12.3% for class T-F members. If the investment rate of return (less investment fees) is equal to or exceeds the assumed rate of return based on the prior ten-year period, the member contribution rate will decrease by .5%. Likewise, the member contribution rate will increase by .5% if the investment rate of return (less investment fees) during the ten-year period is 1.0% or more below the assumed rate of return. If the Retirement System is fully funded at the time of the comparison, the member contribution rate reverts back to the base rate for the Class. There shall not be an increase in the member contribution rate if there has not been an equivalent increase in the employer contribution rate over the previous three-year period. Until a full ten-year look back period is available, the investment return measurement period will begin on July 1, 2011.
By Commonwealth and School Districts Balance of required contribution determined as normal contribution,
accrued liability contribution, supplemental annuity contribution, experience adjustment factor and premium assistance contribution, is funded by the Commonwealth and the School District.

Page 11
Appendix A – Financial Information Provided by Hewitt EnnisKnupp, an AON Company

Pennsylvania School Employees’ Retirement System
GASB 67 Reporting September, 2014

2
• PSERS Total Fund Fiscal Year 2014 Money-Weighted Return (IRR)* is 14.98%.
• Notes on inputs and methodology • Market value of PSERS Total Fund at the beginning of fiscal year 2014 (July 1) is
$49,016.6 million and market value of PSERS Total Fund at the end of fiscal year (ending June 30) is $52,570.7 million. • Market value and cash flows within the illiquid investments (private real estate and
private markets) are reflected on a quarter lag • External net cash flows (inflows netted by outflows) are determined on a daily basis as
they have occurred each month from July 1, 2013 to June 30, 2014
*Please note PSERS Total Fund Fiscal Year 2014 Time -Weighted Return (TWR) is 14.91% .
PSERS Total Fund FY 2014 Money Weighted Return
3
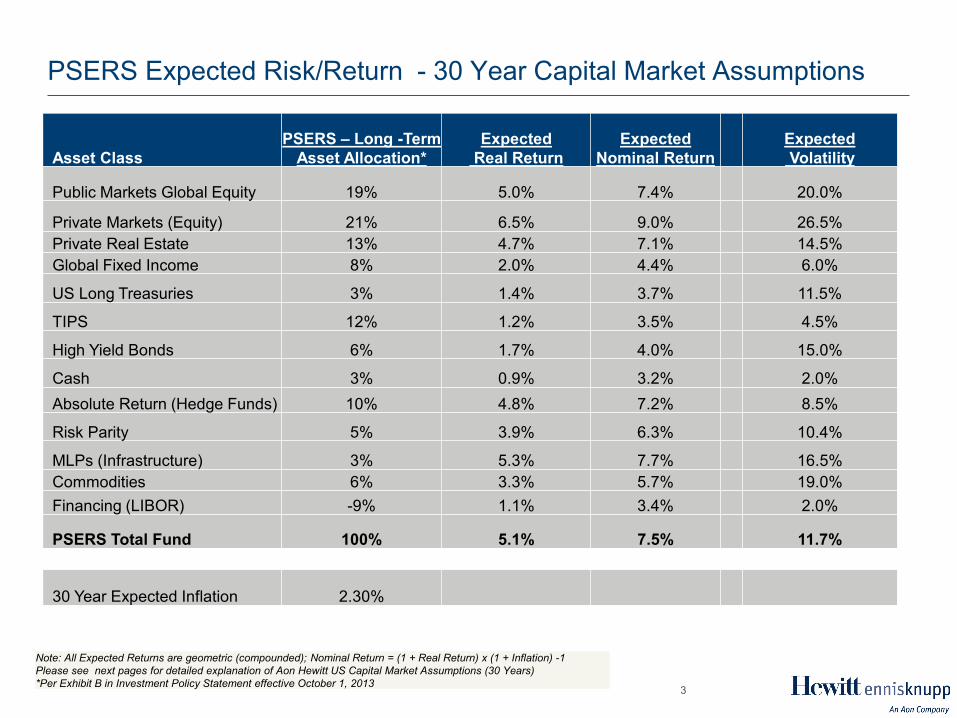
PSERS Expected Risk/Return - 30 Year Capital Market Assumptions
Asset Class PSERS – Long -Term
Asset Allocation* Expected
Real Return Expected
Nominal Return Expected Volatility
Public Markets Global Equity 19% 5.0% 7.4% 20.0%
Private Markets (Equity) 21% 6.5% 9.0% 26.5% Private Real Estate 13% 4.7% 7.1% 14.5% Global Fixed Income 8% 2.0% 4.4% 6.0%
US Long Treasuries 3% 1.4% 3.7% 11.5%
TIPS 12% 1.2% 3.5% 4.5%
High Yield Bonds 6% 1.7% 4.0% 15.0%
Cash 3% 0.9% 3.2% 2.0% Absolute Return (Hedge Funds) 10% 4.8% 7.2% 8.5%
Risk Parity 5% 3.9% 6.3% 10.4%
MLPs (Infrastructure) 3% 5.3% 7.7% 16.5% Commodities 6% 3.3% 5.7% 19.0% Financing (LIBOR) -9% 1.1% 3.4% 2.0%
PSERS Total Fund 100% 5.1% 7.5% 11.7%
30 Year Expected Inflation 2.30%
Note: All Expected Returns are geometric (compounded); Nominal Return = (1 + Real Return) x (1 + Inflation) -1 Please see next pages for detailed explanation of Aon Hewitt US Capital Market Assumptions (30 Years) *Per Exhibit B in Investment Policy Statement effective October 1, 2013