the quality of education: some policy suggestions based...
TRANSCRIPT

SACMEQ Policy Research: Report No. 1 Series Editor: Kenneth N. Ross
The quality of education: some policy suggestions
based on a survey of schools
Mauritius
bY
Dhurumbeer Kulpoo Ministry of Education and Human Resource Development
Port Louis, Mauritius
International Institute for Educational Planning, UNESCO
Ministry of Education and Human Resource Development,
Mauritius

The designations employed and the presentation of material throughout this document do not imply the expression of any opinion whatsoever on the part of UNESCO or IIEP concerning the legal status of any country, territory, city or area of its authorities, or concerning its frontiers or boundaries.
This document has been composed by IIEP Publications and printed in IIEP’s Printshop
Published by the International Institute for Educational Planning 7-9 rue Eugene-Delacroix, 75116 Paris, France
Cover design by Marie Moncet. Woodcut by Helene D&y.
0 UNESCO 1998
Foreword
The Southern Africa Consortium for Monitoring Educational Quality (SACMEQ) is a consortium of Ministries of Education located in the Southern Africa sub-region. For several years these Ministries have worked in close partnership with the IIEP in order to undertake educational policy research with the main aim of generating reliable information that can be used by decision-makers to plan the quality of education.
In January 1997 the Government of Zimbabwe officially registered SACMEQ as an international non-governmental organization. SACMEQ’s Sub-regional Co-ordinating Centre is located within UNESCO’s Harare Office. The work of the Centre is managed by a Director and is guided by a Committee chaired by Zimbabwe’s Minister of Education. The ‘founding members’ of SACMEQ are the IIEP, Kenya, Malawi, Mauritius, Mozambique, Namibia, Tanzania (Mainland and Zanzibar), Swaziland, Zambia, and Zimbabwe.
SACMEQ’s programme of research and training has four features which have optimized its contributions to the field of educational planning in Africa: it provides research- based policy advice concerning issues that have been identified by key decision-makers, it functions as a co-operative venture based on a strong network of educational planners, it combines research and training components that are linked with institutional capacity building, and its future directions are defined by the participating Ministries.
SACMEQ’s initial educational policy research project was assisted during 1994/1995 through a Funds-in-Trust (FIT) agreement between the Italian Government and UNESCO. In 1996 SACMEQ’s sub-regional activities were financed under an FIT agreement with the Netherlands Government. This arrangement was renewed in 1997 for the launch of SACMEQ’s Sub-regional Co-ordinating Centre.
The costs associated with future SACMEQ projects will be financed from two sources. First, the SACMEQ Sub-regional Co-ordinating Centre will support co-operative sub-regional activities which include project design, sub-regional training workshops, construction of data archives, and dissemination of results. Second, the participating Ministries will cover their own within-country research costs related to printing, field work operations, data entry and cleaning, the provision of general overheads for project co- ordination, and the publication of national reports.
This report presents the research results and policy suggestions that emerged from the implementation of SACMEQ’s initial educational policy research project. It is offered to other educational planners - not as a final evaluative comment, but rather as a stimulus for constructive discussion of educational policy options, and also as a successful model of productive collaboration among educational planners from many different countries.
Hon. Mr Kadress R. Chedumbarum Pillay Dr Jacques Hallak Minister of Education and Human Resource Development ADG UNESCO / Director, IIEP Port Louis, Mauritius Paris, France

Further Information
For further information about SACMEQ and its policy research programme, please contact:
The Director SACMEQ UNESCO Regional Office 8 Kenilworth Road Harare Zimbabwe
Telephone: (263-4) 776 114-5,776 775,746 23 1,786 598 Fax: (263-4) 776 055 E-mail: [email protected]
For further information about the REP’s programme of co-operation with SACMEQ please contact:
Dr Kenneth N. Ross International Institute for Educational Planning 7-9 rue Eugene-Delacroix 75 116 Paris France
Telephone: (33-l) 45 03 77 19 Fax: (33-l) 40 72 83 66 E-mail: 100143.37compuserve.com
Acknowledgements
SACMEQ’s initial educational policy research project was a co-operative cross- national initiative focused on shared policy concerns that were related to planning the quality of primary education in the Southern Africa sub-region. Each national educational policy report prepared for this project therefore represents a ‘team effort’ that has been made possible through the hard work of many people.
The International Institute for Educational Planning and the SACMEQ network of Ministries of Education would like to thank everyone involved in the successful implementation of this important project and, in particular, to acknowledge the contributions made to this report by the following people.
Kenya Mary Kariuki
Malawi Joseph Chimombo
Mauritius Dhurumbeer Kulpoo
Namibia Friedhelm Voigts
Zambia Manasseh Nkamba
Joe Kanyika
Zimbabwe Thomas Machingaidze
Patrick Pfukani Sibangani Shumba
Tanzania (Zanzibar) Sebtuu Nassor
Khadija Ali Mohammed
IIEP Kenneth N. Ross
T. Neville Postlethwaite Mioko Saito
Jocelyne Vellien

Contents
Page
Foreword Acknowledgements
Chapter 1: The setting for the study Introduction School education in Mauritius Finance for education Recent plans for educational reform Resulting policy concerns A response to the policy concerns The five main policy-related questions for SACMEQ’s initial project
Chapter 2: The conduct of the study Introduction Co-operation with SACMEQ Instrument development Sampling Calculation of sampling errors Data collection Data entry and cleaning Conclusion
Chapter 3: What are the baseline data for selected educational inputs to primary schools in Mauritius?
Introduction A note on the interpretation of the data analyses Specific policy questions related to educational inputs What were the characteristics of Grade 6 pupils? What were the characteristics of Grade 6 teachers? What were the teaching conditions in primary schools? What aspects of the teaching function designed to improve the quality of education were in place? What was the general condition of school buildings? What level of access did pupils have to books? Conclusion
Chapter 4: How do the conditions of schooling in Mauritius compare with the Ministry’s own benchmark standards?
Introduction Basic organizational features of schooling Classroom furniture and supplies Academic and professional qualifications of teachers and school heads Conclusion
6 6 7 9
12 16 17 17
19 19 20 20 27 30
33 42 45 46
47 47 50 53 56
xi
Chapter 5: Have educational inputs to primary schools in Mauritius been allocated in an equitable fashion?
Introduction Two approaches to the measurement of equity Equity calculations for material resource inputs Equity calculations for human resource inputs Conclusion
57 57 59 61 63
Chapter 6: What is the level of reading for Grade 6 pupils overall and in the three domains of reading literacy?
Introduction 64 The structure of the reading test 64 The construction of six reading test scores 65 Analyses of mastery levels 66 Analysis of mastery levels for sub-groups 69 Analysis of narrative, expository, and document sub-scales 72 Conclusion 74
Chapter 7: Which educational inputs to primary schools in Mauritius have most impact on the reading literacy achievement of Grade 6 pupils?
Introduction Educational inputs and pupil achievement Bivariate relationships Construct formation A causal model Conclusion
75 75 75 78 79 82
Chapter 8: An Agenda for Action Introduction Classification of policy suggestions A four-stage Agenda for Action Co-ordination of Ministry responses to the Agenda for Action The future
84 84 93 94 94
References 95
Figure Figure 7.1: Path diagram for analysis of factors affecting reading literacy 81
xii

Chapter 1
The setting for the study
Introduction
Mauritius consists of three main islands and some smaller islands in the Indian Ocean. The main islands are: mainland Mauritius, the island of Rodrigues, and the island of Agalega. The smaller islands are virtually uninhabited. Mauritius became independent in 1968 and a Republic in 1992. In 1993 the estimated population was just over one million inhabitants with a population density of 638 persons per square kilometre. By the mid-1990s the population growth rate had stabilized at 1 .l percent per annum. Mauritius is a multiracial, multilingual, and pluricultural country. It is a country where the official language is English, the generally spoken one is French, the common finguafranca is Creole, and the language at home can be Bhojpuri, Hindi, Urdu, Tamil, Telegu, or Mandarin, among others. The teaching of these different languages and the level at which they should be introduced into the school curriculum have always been controversial issues. Children study English and French in primary school and some of them also study an Asian language.
School education in Mauritius
Education is compulsory from the ages of 5 to 12 years. The gross enrolment ratio for the primary school age group (5 to 11 years old) is estimated to be 107 percent. The net enrolment ratio for the same age group is estimated to be 98.5 percent. Education is free at all levels, although there are some fee-paying schools. For most schools the formal school structure is 6+5+2. That is, six years of compulsory primary school, five years of lower secondary school, and two years of upper secondary school.
(a) Pre-primary education
In 1994 the enrolment at pre-primary level was just over 32,500 pupils, accounting for about 78 percent of the three to five years-old age group. These pupils were enrolled in about 950 private pre-primary schools. In addition, about 37 percent of state primary schools held pre-primary classes on their premises. Increased participation of mothers in the labour force has generated the need for early education and socialization of the very young. The demand for early schooling is expected to remain strong in the foreseeable future.
(b) Primary education
Enrolment in primary schools was just over 125,000 pupils in 1994. These pupils were enrolled in 223 government schools, 53 government-aided schools, and five non-aided private schools. Drop-out was negligible and almost all schools were co-educational. The primary school day lasts six hours and the school year has 185 days divided into three terms. Attendance in primary schools was made compulsory in 1993. Participation rates of boys and girls were similar. About 4,000 teachers taught in the primary schools and the overall teacher/pupil ratio was 1:21. To encourage cultural diversity the education system provides for instruction in seven of the Mauritians’ ancestral Asian languages at the primary level. About 70 percent of the student population is taught these languages by about 28 percent of
1
the teaching force. In 1995, about 42 percent of the teaching force were women, and only 32 percent of school heads were women. An aggressive family planning campaign launched in the 196Os, together with an employment rate of nearly 100 percent, has resulted in sharp declines in the birth rate and therefore a decline of enrolment at the primary school level.
(c) Secondary education
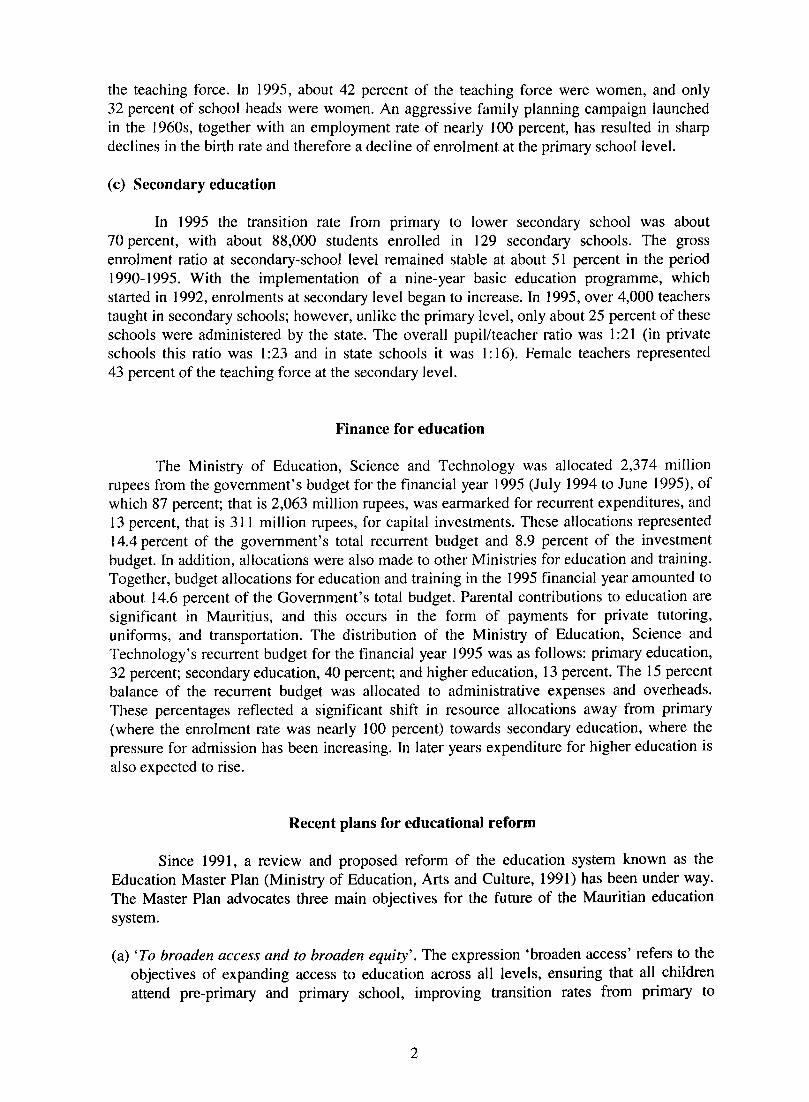
In 1995 the transition rate from primary to lower secondary school was about 70 percent, with about 88,000 students enrolled in 129 secondary schools. The gross enrolment ratio at secondary-school level remained stable at about 51 percent in the period 1990-1995. With the implementation of a nine-year basic education programme, which started in 1992, enrolments at secondary level began to increase. In 1995, over 4,000 teachers taught in secondary schools; however, unlike the primary level, only about 25 percent of these schools were administered by the state. The overall pupil/teacher ratio was 1:21 (in private schools this ratio was 1:23 and in state schools it was 1: 16). Female teachers represented 43 percent of the teaching force at the secondary level.
Finance for education
The Ministry of Education, Science and Technology was allocated 2,374 million rupees from the government’s budget for the financial year 1995 (July 1994 to June 1995), of which 87 percent; that is 2,063 million rupees, was earmarked for recurrent expenditures, and I3 percent, that is 3 I 1 million rupees, for capital investments. These allocations represented 14.4 percent of the government’s total recurrent budget and 8.9 percent of the investment budget. In addition, allocations were also made to other Ministries for education and training. Together, budget allocations for education and training in the 1995 financial year amounted to about 14.6 percent of the Government’s total budget. Parental contributions to education are significant in Mauritius, and this occurs in the form of payments for private tutoring, uniforms, and transportation. The distribution of the Ministry of Education, Science and Technology’s recurrent budget for the financial year 1995 was as follows: primary education, 32 percent; secondary education, 40 percent; and higher education, 13 percent. The 15 percent balance of the recurrent budget was allocated to administrative expenses and overheads. These percentages reflected a significant shift in resource allocations away from primary (where the enrolment rate was nearly 100 percent) towards secondary education, where the pressure for admission has been increasing. In later years expenditure for higher education is also expected to rise.
Recent plans for educational reform
Since 1991, a review and proposed reform of the education system known as the Education Master Plan (Ministry of Education, Arts and Culture, 1991) has been under way. The Master Plan advocates three main objectives for the future of the Mauritian education system.
(a) ‘To broaden access und to broaden equity’. The expression ‘broaden access’ refers to the objectives of expanding access to education across all levels, ensuring that all children attend pre-primary and primary school, improving transition rates from primary to
2
secondary school, and increasing enrolment at the tertiary level. The expression ‘broaden equity’ refers to the objectives of ensuring that access to education is the same in all regions of the country, and guaranteeing that the quality of education provided will be of the same high standard in all regions.
(b) ‘To improve the quality of education’. This objective involves the enrichment of the learning environment, adapting the curriculum to meet the needs and aspirations of future Mauritian citizens, upgrading the skills and knowledge of the teaching force, strengthening the teaching of science and mathematics, and establishing a national inspectorate for monitoring the teaching-learning process.
(c) ‘To strengthen management skills in education’. This objective involves the provision of training in up-to-date management skills at the national, regional, and school levels. The assumption here is that this training will ensure that the education system as a whole will become more efficient in the use of resources.
Resulting policy concerns
The Master Plan recognized that, in the past, there had been too much educational policy developed on the basis of a reliance on anecdotal evidence and intuition, and that there was a growing need for ‘hard evidence’ about the education system, which needed to be gathered through well-designed educational research studies.
The Master Plan also pointed to impending financial constraints which underlined the need for the Mauritian education system to become more efficient and more cost-effective. However, all attempts to improve efficiency and cost-effectiveness require some factual knowledge about the levels of achievement in the different subject matters at different grade levels, and also some factual evidence concerning fundamental education provision. These kinds of data are essential in order to judge the extent to which there has been improvement, no improvement, or even a deterioration in achievement levels and the basic conditions of schooling.
The lack of key data has been a major problem in Mauritius at the Grade 6 level because of the relatively low transition rates between Grade 6 and Grade 7 (which is the first year of school at the lower secondary school level). It is widely recognized in Mauritius that, at this level, there is a need to raise the ‘real’ standards of achievement, rather than being tempted into creating an ‘artificial’ appearance of quality by lowering the passing scores on the examination that is used to certify movement from primary to secondary schooling.
In addition to these policy concerns, many people within the Ministry have expressed the need for further research into the many factors that influence achievement in different subject-matter areas in Mauritius. In particular, there has been a great deal of interest in identifying those factors under government control which can be shown to have a major effect on pupil achievement.

A response to the policy concerns
Discussion within the Ministry about these policy concerns resulted in the decision to mount a major educational policy research study. It was agreed that this study would need to be focused on the final year of primary schooling and, due to resource constraints, limited in its collection of pupil achievement data to one field of study (rather than many school subjects), and to a well-designed sample of pupils (rather than a full coverage, or census, of pupils). It was at this point in time that the Minister and the Permanent Secretary became aware of the existence of a major educational policy research project that had just been completed in Zimbabwe (Ross, Ed. 1995) as a co-operative venture by the International Institute for Educational Planning (IIEP) and the Zimbabwe Ministry of Education and Culture. Mauritius was able to send a representative to attend the final sub-regional meeting for the Zimbabwe project, at which the results of the study were being discussed with the senior personnel of the Ministry (Moyo et al., 1993). Other countries in Southern Africa also became interested in this kind of study and the IIEP therefore responded by launching a sub- regional co-operative research project with the participation of eight countries - including Mauritius.
This project has become widely known as the ‘Southern Africa Consortium for Monitoring Educational Quality’ (SACMEQ). It was propitious for Mauritius that the target grade for SACMEQ’s initial educational policy research project was Grade 6 - which was the final grade of primary school. Furthermore, the subject matter that had been selected was reading. This also suited Mauritius, since reading was considered to be the key subject in primary school because it was an essential prerequisite for successful learning in secondary school and beyond.
The aims of the SACMEQ project included a focus on the collection of baseline data that would provide an assessment of the conditions of schooling, and also several proposals to employ data analyses designed to determine the relative effects of educational input variables on achievement. All of these issues, as mentioned earlier, were of major concern to the Mauritius Ministry of Education and Culture.
The five main policy-related questions for SACMEQ’s initial project
SACMEQ’s initial educational policy research project commenced with a dialogue between the SACMEQ National Research Co-ordinators (NRCs) and the key decision-makers within ministries of education in eight countries of the Southern Africa sub-region. This dialogue provided eight lists of ‘high-priority’ educational policy concerns that were subsequently reviewed by the SACMEQ NRCs in a search for common themes. The review yielded five general areas of policy concern, which were then used to generate the following five main policy-related questions.
(a) What are the baseline data for selected inputs to primary schools?
(b) How do the conditions of primary schooling compare with the Ministry’s own benchmark standards?

(c) Have educational inputs to primary schools been allocated in an equitable fashion among and within education districts?
(d) What is the level of reading achievement for Grade 6 pupils?
(e) Which educational inputs to primary schools have most impact upon the reading achievement of Grade 6 pupils?
Not only were these policy questions appropriate for Mauritius, but the co-operative nature of the SACMEQ project allowed Mauritius to learn a great deal about the ways in which neighbouring countries used research to tackle important areas of educational policy. It also allowed the personnel working in the Mauritius Master Plan Co-ordinating Unit to learn the technical skills of sampling, instrument design, field work procedures, data entry/cleaning, and computer-based data analysis. All of these skills are required to conduct high-quality, large-scale educational policy research surveys. It was recognized that the acquisition of these skills was necessary if the Ministry was to be able to undertake a continuing programme of research that would monitor and evaluate the growth and performance of the Mauritian education system.
Chapter 2
The conduct of the study
Introduction
This chapter describes the way in which the first educational policy research project of the Southern Africa Consortium for Monitoring Educational Quality (SACMEQ) was conducted in Mauritius. First, it describes the co-operative work undertaken by the SACMEQ countries in order to plan and implement the study in each country. Secondly, it describes the instrument development, the sampling procedures, the data collection, the data entry and data cleaning exercises, and finally presents an overview of the structure of this report.
Co-operation with SACMEQ
In 1991-1992 the IIEP and the Ministry of Education and Culture of Zimbabwe worked together in order to conduct a research study on ‘Indicators of the quality of education’. The research reports which emerged from this study (for example, Ross and Postlethwaite (1992) and Murimba et al. (Eds.) (1994) became widely respected in many countries of the Southern Africa sub-region because of their direct impact upon educational policy in Zimbabwe. In October 1992, an IIEP workshop on ‘Data building and data management’, based on knowledge and experience gathered from the Zimbabwe study, was organized in Harare to provide around 50 educational planners from eight countries in Southern Africa with the technical skills and research materials required to undertake a national study of primary schools. Further ‘hands-on’ training on all aspects of computer- based data processing was provided at a more advanced IIEP workshop on ‘Data processing for policy report preparation’ which was held in Harare, in September 1993.
The educational planners who attended the 1993 seminar subsequently prepared a proposal (Moyo et al., 1993) which was designed to launch a co-operative sub-regional project aimed at monitoring progress towards the achievement of the educational quality goals defined by the 1990 Jomtien conference on ‘Education for All’. This proposal was developed into a major research plan at two meetings, in Paris (July, 1994) and Harare (September, 1994), and it was on the basis of this research plan that the Southern Africa Consortium for Monitoring Educational Quality (SACMEQ) was launched.
At the 1994 Harare meeting the data collection instruments to be used for SACMEQ’s initial educational policy research project were constructed in first draft form so that they could be trail-tested by SACMEQ’s National Research Co-ordinators (NRCs) in their respective countries. At the same time, blank (or ‘dummy’) tables were designed which would later be used to summarize the results of the data analyses. The NRCs attending these meetings were from Ministries of Education in Kenya, Malawi, Mauritius, Namibia, Tanzania (Mainland), Tanzania (Zanzibar), Zambia, and Zimbabwe.
6

Instrument development
The instruments developed by the SACMEQ NRCs were: a pupil test of basic reading literacy; a pupil questionnaire; a teacher questionnaire; and a school head questionnaire.
For the purposes of SACMEQ’s initial study, reading literacy was defined as: “the ability to understand and use those written language forms required by society and/or valued by the individual”. This definition was found to be sufficiently general to accommodate the diversity of traditions and languages represented in the participating SACMEQ countries, but specific enough to provide guidance for test construction. Writing ability was deliberately excluded from the definition, and only a minimal amount of writing was required of students throughout the testing process.
The domains or types of reading literacy materials included in the pupil test were concentrated on the following three dimensions.
(a) Narrative prose: Continuous text in which the writer aimed to tell a story - whether fact or fiction.
(b) Expository prose: Continuous text in which the writer aimed to describe, explain, or otherwise convey factual information or opinion to the reader.
(c) Documents: Structured information organized in such a way that pupils were required to search, locate, and process selected facts rather than to read every word of a continuous text.
After examining syllabi across SACMEQ countries in the subject area of Grade 6 reading, a common framework or ‘blueprint’ for the pupil reading test was developed. The blueprint was constructed by preparing a ‘skills by domain’ table. The three domains have been described above. The seven reading skills were obtained after exhaustive discussion of the most important skills mentioned in the reading syllabus for each country. This table has been reproduced as Table 2.1. There were 2 1 cells in the table and, in order to ensure that the test provided a balanced coverage of the required reading skills and the main reading domains, the number of items allocated for each cell was in proportion to the emphasis given to it across the syllabi. This was a difficult task because it was necessary to restrict the total number of items in the test to around 60 so as to avoid problems of pupil fatigue. In fact, following extensive trial-testing and further analyses of the data from the final data collection, a final list of 59 items was prepared.
To illustrate, across the syllabi around one third of the emphasis was on ‘Narrative’ (and therefore 21 of the 59 items were allocated for this domain); and within ‘Narrative’ around one half of the emphasis in the syllabi was on ‘Verbatim Recall’ of information (and therefore 10 of the 21 items that had been allocated to ‘Narrative’ were designated for the cell representing ‘Narrative and Verbatim Recall’).
A deliberate decision was taken not to have ‘rotated tests’ - in which different test forms containing subsets of ‘common items’ are administered to groups of students. It had been found in previous research carried out by the International Association for the Evaluation of Educational Achievement that some countries had experienced difficulties in
7

fieldwork operations when employing rotated tests. Further, since this study was concerned with reading and not with school subjects that have many subskill areas (for example, mathematics or science), it was felt that around 60 items was sufficient to cover the general construct of reading literacy.
Table 2.1. ‘Skills by domain’ blueprint for the pupil reading test
Reading skills
Verbatim recall
Paraphrase concept
Find main idea
Infer from text
Locate information
Locate and process
Apply rules
Reading domain Total items
Narrative Expository Documents
10 14 0 24
6 4 0 10
1 1 0 2
4 2 0 6
0 0 9 9
0 0 6 6
0 2 0 2
Total items 21 23 15 59
Following the construction of the test blueprint, the reading passages and their accompanying test questions were prepared and then subjected to extensive expert review. These passages were selected from items submitted by the SACMEQ nations. All items were in a multiple choice format with four options per item. The possibility of including open- ended questions was considered and rejected because of financial constraints within countries for the training of scorers and for conducting the scoring.
For the trial testing in each country, a judgement sample of at least five schools and one intact class per school was used. A classical item analysis was undertaken on each country’s data, and also on the pooled data from all countries. Where the point biserial correlation between the ‘correct’ answer and the total score was less than 0.20 then either the passage part, item stem, or option answer was improved or, if this was not possible, the item was dropped from the final test. Furthermore, if the point biserial correlation between a wrong answer and the total score was positive, then either the option was reworded or the item was dropped from the final test.
After the analysis of the trial-testing data, the reliability of the total test score was considered to be too low and further trial-testing was undertaken on other items. The second phase of trial-testing resulted in a final test version of 59 items with internal structure, as shown in Table 2.1. At the same time, it was agreed that a pooled item analysis of the final test data should be undertaken and that if there were items that were ‘misbehaving’ then they should be dropped. The reliability (KR 20) of the final form of the test used for the main data collection in Mauritius was 0.93. The reliabilities of the subscales were: narrative, 0.87; expository, 0.80; and documents, 0.82.

The questions for the different questionnaires were then prepared so as to address the data collection needs outlined in the blank tables that had been prepared at the initial design phase of the study. Where an indicator was required for a table, the specific variables required for the indicator were listed and then the questions required for each variable were prepared. The questions were then ordered in a systematic fashion within the different questionnaires. The questionnaires were trial-tested on the pupils in the judgement sample schools. The Teacher Questionnaire was tried on the reading teachers of the judgement sample pupils, and the School Head Questionnaire on the school heads of the judgement sample schools. The distributions of responses were examined and, where necessary, revisions were made to the questions. Interviews were also held with the teachers and school heads after they had completed their questionnaires in order to obtain their inputs concerning the clarity and relevance of each question. It should be noted that in one or two countries there were some questions that were considered not to be relevant for the country’s system but were, nevertheless, retained for the sake of comparability among all of the SACMEQ countries.
Sampling
All sample designs applied in SACMEQ’s initial project were selected so as to meet the standards set down by the International Association for the Evaluation of Educational Achievement (Ross, 1991). These standards require sample estimates of important pupil population parameters to be (a) adjusted by weighting procedures designed to remove the potential for bias that may arise from different probabilities of selection, and (b) have sampling errors that are of the same magnitude or smaller than a simple random sample of 400 pupils (thereby guaranteeing 95 percent confidence limits for sample estimates of population percentages of plus or minus 5 percentage points, and 95 percent confidence limits for sample estimates of population means of plus or minus one tenth of a pupil standard deviation unit).
The desired target population in Mauritius was ‘all pupils at the Grade 6 level in 1995 at the eighth month of the school year who were attending registered government or non- government schools in the country’. The numbers of pupils in the desired, excluded, and defined populations have been presented in Table 2.2.
There were nine pupils excluded from the desired population in one school on the island of Agalega. This island is situated about 100 kilometres from the main island. Communication is difficult to and from Agalega, and the expense of travel is high. At the same time, schools which had Grade 6 enrolments of fewer than 20 pupils were also excluded. There were seven such schools in the whole country and, taken with the one excluded school in Agalega, this resulted in eight schools being excluded out of a total of 283 schools. Altogether, there were 133 pupils excluded out of a total of 27,849 pupils. The excluded population of pupils represented less than half of 1 percent of all pupils in the desired target population.
In the districts of Black River and Rodrigues, all schools in the defined target population were taken into the sample. This was because the Master Plan had identified these two districts as low-achieving areas compared with the rest of the country. Sampling weights were then applied to all data in order to ‘adjust’ for missing data and also to ensure that the
9

relative size of the defined target population across school districts was accurately represented in the relative sizes of the weighted sample data across school districts.
From the defined population a probability sample of schools (with probability proportional to the Grade 6 enrolment in each school) was drawn. In Black River and Rodrigues all schools in the defined target population were selected into the sample. This resulted in a planned national sample of 159 schools and 3,180 pupils. This sample design was designed to yield an ‘equivalent sample size’ (Ross and Wilson, 1994) of 400 pupils- based on an estimated intra-class correlation (rho) for pupil reading test scores of around 0.30. In fact, after the rho was calculated for the reading scores, it was found to be 0.21 - which was considerably lower than had been expected.
Within schools, a simple random sample of 20 pupils from all Grade 6 pupils was drawn. The figure of 20 pupils was selected because, from practical experience, it was known that increasing the number of pupils within schools above this figure would increase the accuracy of sampling by a negligible amount, but would increase the cost of the data collection considerably. There were also concerns among the SACMEQ NRCs that conditions in many schools would not permit a valid administration of the reading test if more than 20 pupils per school were involved.
Table 2.2. The numbers of schools and pupils in the desired, excluded, and defined populations for Mauritius
Stratum Desired Excluded Defined
Schools Pupils Schools Pupils Schools Pupils
Port Louis 33 4324 1 17 32 4307
Pamplemousse 22 2194 1 18 21 2176
Riviere 27 2428 1 17 26 2411
Flacq 35 2812 0 0 35 2812
Grand Port 31 2626 1 19 30 2607
Savanne 19 1456 1 15 18 1441
Plaine Upper 33 4139 0 0 33 4139
Moka 24 1514 1 19 23 1495
Black River 13 987 1 19 12 968
Rodrigues 12 1252 0 0 12 1252
Plaine Lower 33 4108 0 0 33 4108
Agalega 1 9 1 9 0 0
Mauritius 283 27849 8 133 275 27716
The planned sample was designed to contain 159 schools allocated across districts, as shown in the first column of figures in Table 2.3. After the sample of schools was selected it
10

was found that one school in the district of Riviere du Rempart had adopted an ‘International School’ curriculum for Grade 6 which was quite different from the approved Ministry curriculum. It was therefore decided to remove this school from the sample. The final achieved sample therefore contained 158 schools.
The response rates for the sample have been recorded in Table 2.3. The percentage response for schools was 99.4 percent and that of pupils was 91.8 percent. The non- responding pupils were those who were absent on the day of testing. By district, this absenteeism varied from 2 to 12 percent.
At the first stage of sampling, schools were selected with probability proportional to the number of pupils who were members of the defined target population. To achieve this selection a ‘random start - constant interval’ procedure was applied (Ross, 1987). In several strata there were some schools with numbers of pupils in the defined target population that exceeded the size of the ‘constant interval’, and therefore each of these schools was randomly broken into smaller ‘pseudo schools’ before the commencement of the sampling.
At the second stage of sampling a simple random sample of 20 pupils was selected within each selected school. Sampling weights were used to adjust for the disproportionate allocation of the sample across districts and also to account for the small loss of student data due to absenteeism on the day of the data collection.
Table 2.3. The planned and achieved samples of schools and pupils
Strata Schools Pupils
Planned Achieved Planned Achieved
Port Louis 15 15 300 268
Pamplemousse 15 15 300 277
Riviere 15 14 300 256
Flacq 15 15 300 281
Grand Port 15 15 300 285
Savanne 15 15 300 274
Plaine Upper 15 15 300 281
Moka 15 15 300 278
Black River 12 12 240 211
Rodrigues 12 12 240 229
Plaine Lower 15 15 300 279
Mauritius 159 158 3180 2919
11
Calculation of sampling errors
When data are collected using multi-stage sample designs from sources at different levels of data aggregation (pupil, teacher, school) a great deal of care needs to be taken in interpreting the stability of sample estimates of population characteristics. For this report, all data analyses were undertaken at the between-pupil level, That is, all data collected from teachers and school heads were disaggregated across the pupil data file before analyses were undertaken.
The interaction of sample design and level of data analysis required that extra caution be used in interpreting estimates obtained by using information from teachers or school heads. The sampling errors of estimates derived from these two ‘disaggregated’ sources were larger than the figures that were reported when using standard statistical software packages.
In the following chapters of this report the standard errors of sampling have been provided for all important variables. The calculation of these errors acknowledged that the sample was not a simple random sample - but rather a complex two-stage cluster sample that included weighting adjustments to compensate for variations in selection probabilities. The errors were calculated by using the PC-CARP software (Fuller et al., 1986). This software employs the Taylor’s Series Approximation in order to calculate sampling errors and design effects.
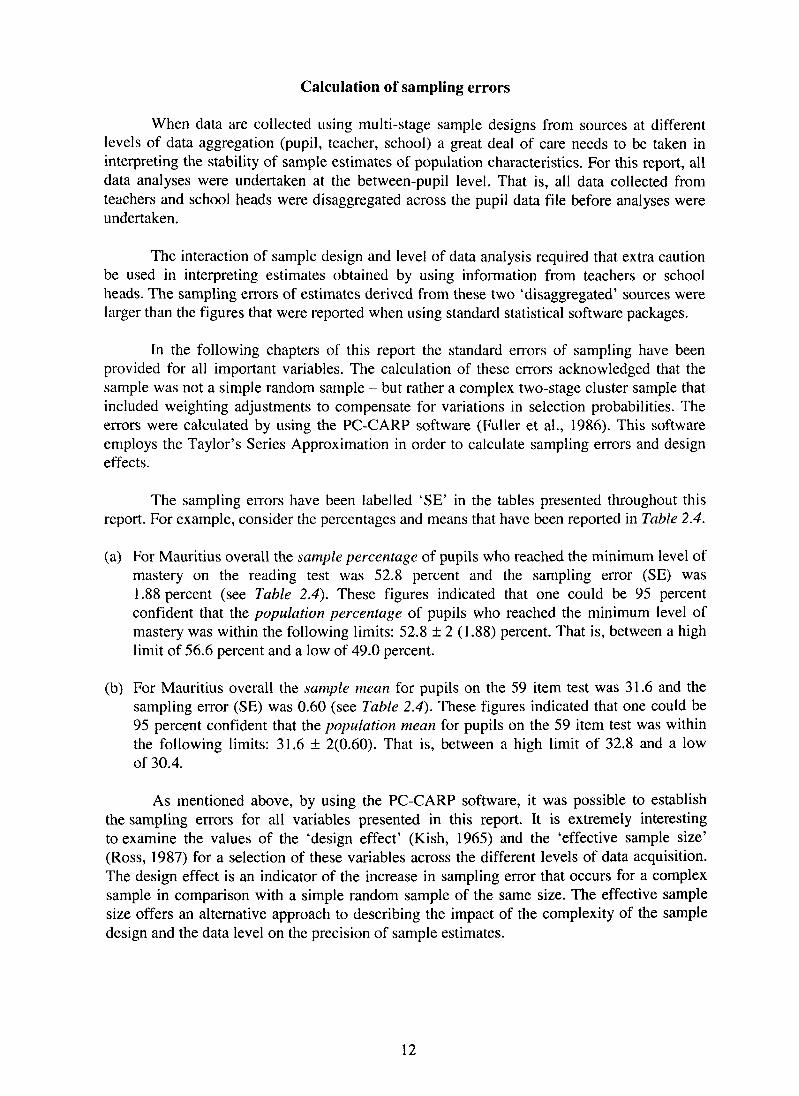
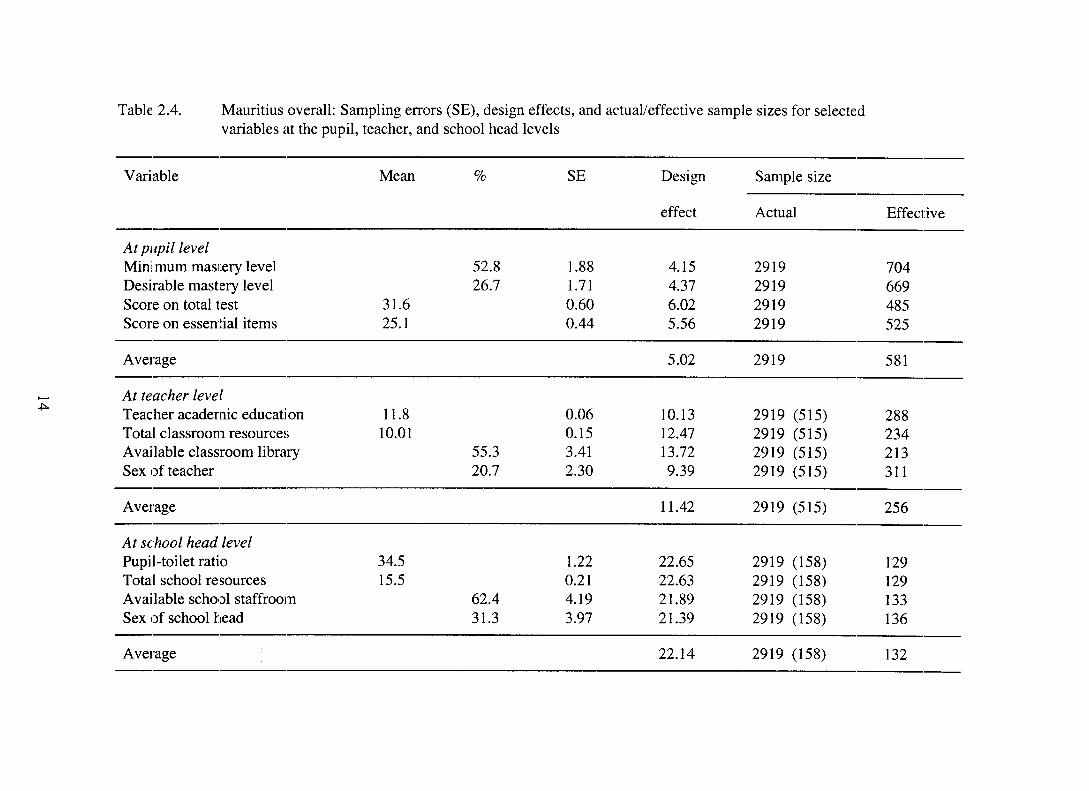
The sampling errors have been labelled ‘SE’ in the tables presented throughout this report. For example, consider the percentages and means that have been reported in Table 2.4.
(a) For Mauritius overall the sample percentage of pupils who reached the minimum level of mastery on the reading test was 52.8 percent and the sampling error (SE) was 1.88 percent (see Table 2.4). These figures indicated that one could be 95 percent confident that the population percentage of pupils who reached the minimum level of mastery was within the following limits: 52.8 + 2 (1.88) percent. That is, between a high limit of 56.6 percent and a low of 49.0 percent.
(b) For Mauritius overall the sample mean for pupils on the 59 item test was 31.6 and the sampling error (SE) was 0.60 (see Tuble 2.4). These figures indicated that one could be 95 percent confident that the population mean for pupils on the 59 item test was within the following limits: 31.6 + 2(0.60). That is, between a high limit of 32.8 and a low of 30.4.
As mentioned above, by using the PC-CARP software, it was possible to establish the sampling errors for all variables presented in this report. It is extremely interesting to examine the values of the ‘design effect’ (Kish, 1965) and the ‘effective sample size’ (Ross, 1987) for a selection of these variables across the different levels of data acquisition. The design effect is an indicator of the increase in sampling error that occurs for a complex sample in comparison with a simple random sample of the same size. The effective sample size offers an alternative approach to describing the impact of the complexity of the sample design and the data level on the precision of sample estimates.
12

To illustrate, consider the design effect and effective sample size values for the variable describing minimum mastery level in Table 2.4. The design effect value of 4.15 indicated that the variance of the sample estimate of the mean on this variable was 4.15 times larger than would be expected for a simple random sample of the same size. The effective sample size value of 704 showed that the complex sample of 2,919 pupils had a sampling error for this variable which was the same as would be obtained by employing a simple random sample of 704 pupils.
13
14
15

Now consider the values of the effective sample size for data collected at the teacher and school head level. These data were disaggregated across the 2,919 pupils - but notice that the effective sample size for these variables was much smaller. For example, the effective sample size for ‘Teacher academic education’ was 288 pupils, and the effective sample size for ‘Pupil-toilet ratio’ was 129 pupils. The main point made here is that the sampling errors of teachers and school heads were much larger than would be expected using the total number of pupils as the sample size in sampling error calculations.
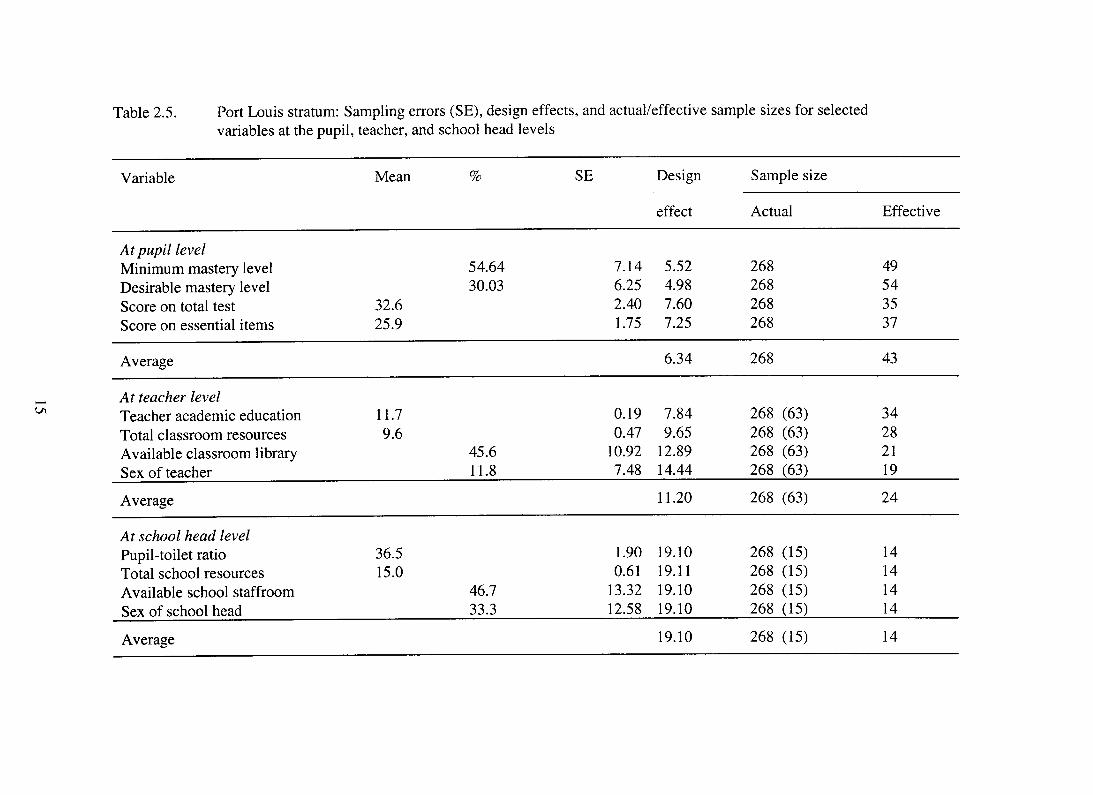
This result was understandable because the ‘actual’ number of teachers that were linked to the 2,919 pupils was 5 15, and the actual number of school heads was 158. These numbers have been presented in brackets in Table 2.4. The corresponding ‘actual’ figures for teachers and school heads in the Port Louis stratum was 63 and 15, respectively. These numbers have been presented in brackets in Table 2.5.
In Table 2.5 the information concerning sampling errors, design effects, and actual effective sample sizes, have been presented, as an illustration, for one district: Port Louis. The information contained within this table permitted one to consider the stability of sample estimates obtained for pupils in the Port Louis district. Notice that, again, the source of data (pupil, teacher, or school head), had a dramatic impact upon the values of the design effects and the effective sample sizes.
The data presented in Tables 2.4 and 2.5, and the sampling error tables for all of the other districts in Mauritius, were employed to make valid estimates of sampling errors for all estimates presented in this report.
Data collection
The total number of schools to be tested was 158 and it was estimated that it would take one day to collect all of the data in one school. This amount of data collection required the equivalent of 158 ‘test administrator days’. The time allowed for the data collection was one week and hence a minimum of 32 data collectors were needed. In fact 42 of them were trained. School Inspectors were used as the data collectors because they were known in the schools and would therefore be able to gain the co-operation of school heads. Further, each inspector could use his own personal means of transport for visiting schools with the testing materials.
This was the first data collection exercise of this kind for the inspectors. A decision was taken to pay them for this work. In retrospect, this turned out to be unfortunate because, in future, it is likely that the Ministry will need to undertake other similar surveys of this kind and now a precedent has been established so that inspectors may well expect to be paid for all survey data collections. It would have been better to have had the Ministry include this work as part of their normal duties.
The island of Rodrigues is some 500 kilometres from mainland Mauritius and the cost of transport is high. Therefore a second smaller group of data collectors were trained for Rodrigues - of which only one was an inspector and the others were Ministry personnel from the island.
16

The testing materials were distributed to the inspectors from the central office of the Ministry. The inspectors collected the materials in the afternoon, administered them the following morning, and then returned the completed instruments in the afternoon.
The fieldwork was guided by two detailed manuals which had been developed by the SACMEQ National Research Co-ordinator (NRC): one NRC manual which listed precisely what had to be done at every step in the conduct of the study, and another manual for Data Collectors which detailed every step that had to be taken from the minute the materials were received to the minute the materials were returned to the Ministry. The manual for the data collectors was used by the NRCs to conduct training sessions for the data collectors. Training sessions usually lasted one whole day, and no particular problems were encountered.
The data collection took place in Rodrigues from 21 to 23 August 1995, and on the main island from 29 August to 2 September 1995. The NRC had arranged a crisis unit for emergency situations that might occur during the data collection. He had three assistants and he himself had a mobile phone so that he could be reached at any time. In three cases the inspectors contacted the NRC where it had become apparent that they were not sure how to proceed. Otherwise, all fieldwork operations proceeded smoothly.
Data entry and cleaning
Once the instruments were returned to the main Ministry office they were checked to ensure that the correct number of pupil tests and questionnaires for pupils, teachers, and school heads were there. Each questionnaire was checked for completeness because there were not meant to be any missing data. A team of five data enterers had been trained by the NRC. One personal computer was available to be used full-time for the data entry. Three other computers could be used when available.
The Data Entry Manager (DEM) computer software developed at the IIEP (Schleicher, 1995) was used to manage the data entry. This software was adapted specifically for the entry of SACMEQ data. No problems were encountered in the installation and use of this software.
The data entry took five weeks. All data were entered once and a sample of schools was taken for double entry. No major problems were encountered. The data were returned to the IIEP in two batches, the first in the first week of January 1996 and the second towards the end of January. The Mauritius NRC visited the IIEP in Paris in order to work with IIEP specialists on data cleaning and data analysis. This work was completed during February 1996.
Conclusion
This chapter has described the procedures undertaken in order to conduct the Mauritius component of the first educational policy research project of the Southern Africa Consortium for Monitoring Educational Quality. Detailed explanations were given of the development of instrumentation, the sampling methods, and the fieldwork operations.
The following five chapters of this report concentrate on the educational policy implications of the results arising from the data analyses. Each of these chapters addresses
17

one of the five main policy questions described in the first chapter. Chapter 3 presents the results from the analysis baseline data for selected inputs to primary schools. Chapter 4 examines the results on how the conditions of schooling in Mauritius compare with the Ministry’s own benchmark standards. Chapter 5 analyzes the extent to which educational inputs to schools have been allocated in an equitable fashion among and within regions. Chapter 6 presents the reading test results. Chapter 7, the most complex of all of the chapters, discusses the results of the analyses to determine which educational inputs have most impact on the reading achievement of Grade 6 pupils. Each of the Chapters 3 to 7 have a concluding section which includes a series of policy suggestions, based on the results presented in them. Finally, Chapter 8 presents ‘An Agenda for Action’ which summarizes the policy suggestions, classifies them in terms of low to high cost, and indicates whether they involve short- or long- term action.
18
Chapter 3
What are the baseline data for selected educational inputs to primary schools in Mauritius?
Introduction
The aim of this chapter is to present some examples of baseline data for inputs to Mauritian primary schools in order to establish a descriptive account of the pupils, their teachers, and their schools. These data are important for two reasons. The first is that they provide a ‘context’ for the analyses described later in this report. The second is that, over time, the levels and distributions of the data may well change. Therefore, when Mauritius undertakes a similar Grade 6 reading survey in future, it will be possible to compare the extent to which such context variables have changed. High-quality data that address the two important areas of ‘context’ and ‘levels and distribution’ provide educational planners with a sound means of mapping the general evolution of the education system and also offer tools for the identification of existing or emerging problems. The first educational policy suggestion to be presented in this report therefore looks to the future in acknowledgement of the importance of establishing data collections which can be used to study trends over time.
Policy Suggestion 3.1: The Ministry should plan to undertake a follow-up survey of the same target population employed during the SACMEQ’s initial project in order to examine changes in important educational indicators over time.
A note on the interpretation of the data analyses
Before presenting the results, two points should be stressed. The first is that the variables presented in this chapter represent a small subset of the large number of variables for which data were collected. A separate publication containing descriptive statistics for all variables in the study will be made available by the Ministry to interested readers.
The second point is that it is very important to interpret each statistic in association with its sampling error. It will be recalled from Chapter 2 that the sample was drawn in order to yield standard errors of sampling for pupils in Grade 6 in Mauritius, such that a sample estimate of a population percentage would have a standard error of k2.5 percent. For this level of sampling accuracy we can be sure 19 times out of 20 that the population value of a percentage lies within 3~5 percent of the estimate derived from the sample. The sampling errors for means are also given in the tables and the same principle applies for limits of two standard errors of sampling.
Where a percentage or a mean is presented for a sub-group of pupils (such as for districts) then the standard error will be greater than for the sample as a whole. This occurs, in part, because the sample sizes for sub-groups are smaller than the total sample sizes. Had smaller standard errors for sub-groups been required, this would have increased the size of the total sample and also of the budget required to undertake much larger field data collections and data analyses.
To illustrate, consider the first column of entries in Table 3.1. The average age of pupils in months at the time of the data collection has been presented separately for each district and
19

for Mauritius overall. The standard error (SE) of each average has also been presented. For the first district, Port Louis, the average student age was 136.6 months at the time of the data collection, and the standard error for this estimate was 0.91 months. That is, there were 19 chances in 20 that the average age of the population of Grade 6 pupils in Port Louis was 136.6 + 2(0.91). In other words, it can be said that we can be 95 percent confident that the population value was between 134.8 months and 138.4 months.
It is important to note that the value of the standard error for each estimate changed from district to district. This variation was caused by two main factors: differences in the distribution of pupils among schools within districts and the structure of the sample design within each district. The smallest standard error of 0.25 months occurred for the sample estimate of average age for the whole population of Grade 6 pupils in Mauritius. This result was to be expected because the overall sample estimate was based on a much larger sample of schools and pupils than the corresponding estimate for any single district.
In interpreting the values in Table 3.1 and other tables throughout this report, it is important to remember that the percentages and means have been presented in terms of pupils. That is, pupils were the units of analysis - even though some variables described in this report referred to teachers and schools. Where a percentage for a variable that describes teachers has been presented, this percentage should be interpreted as ‘the stated percentage of pupils were in schools with teachers having the particular characteristic’. Similarly, a percentage for a variable that describes schools should be interpreted as ‘the stated percentage of pupils were in schools with the particular characteristic’.
Specific policy questions related to educational inputs
As a starting point, in order to guide the data analyses, the very broad educational policy question posed in the title of this chapter was divided into six specific questions. These six questions were used to develop a more structured response to the educational policy issues surrounding the main question.
(a) What were the characteristics of Grade 6 pupils? (b) What were the characteristics of Grade 6 teachers? (c) What were the teaching conditions in primary schools? (d) What aspects of the teaching function designed to improve the quality of education were in
place? (e) What was the general condition of school buildings? (f) What level of access did pupils have to books?
What were the characteristics of Grade 6 pupils?
A wide range of information about pupil characteristics has been presented in Tables 3.1 and 3.2. Information has been listed concerning the age of Grade 6 pupils in months, the sex of these pupils, the number of books they had in their homes, the wealth of their homes (as measured by an Index of possessions), the regularity of eating meals (as measured by an Index of regular meals), the educational level of their parents, the use of the English language in their homes, the number of days that they were absent in the month before data collection, the
20
percentage of pupils who were taking extra lessons, the extent to which the pupils were given homework, and, finally, the amount of grade repetition. The information in Table 3.1 covers those background characteristics that were more ‘home related’, and the information in Table 3.2 presents ‘school related’ information.
(a) Age of Grade 6 pupils
The annual school census in Mauritius has shown that, for a number of years, nearly 100 percent of the five- to six-year-olds enter Grade 1. By Grade 6 these pupils should be aged 10 to 11 years. In Table 3.1 it can be seen that the average age of a Grade 6 pupil in Mauritius during the first week of the eighth month of the school year was 136.5 months or 11 years and 4.5 months. The value of the age of Grade 6 pupils was calculated in months by comparing birth dates with the date of testing. This result for average age was much higher than expected and may be explained by the fact that about 25 percent of Grade 6 pupils (see later discussion) had repeated at least one grade - either due to poor school performance or because of a desire to improve examination results in the Certificate of Primary Education examination. It should be noted that repeating Grade 6 in order to improve final examination results has become widespread in Mauritius (even among able pupils) because excellent results at this level guarantee access to the ‘best’ secondary schools.
From these results we may conclude that the ‘average Grade 6 pupil’ in Mauritius has spent almost an extra year in the primary education system. There are major resource implications related to this situation, and there are important questions that should be asked by the Ministry in order to establish whether an extra year of primary schooling provides educational benefits for the nation that can be justified in economic terms.
Policy Suggestion 3.2: The Planning Unit should undertake an investigation into the practice of grade repeating in Mauritius in order to determine whether the extra year of schooling being received by the ‘average Grade 6 pupil’ can be justified on either educational or economic grounds.
(b) Gender distribution
In Table 3.1 the percentage of girls in Grade 6 has been given for the different districts and the country as a whole. For Mauritius, the gender distribution of pupils at the Grade 6 level was well balanced with 49 percent girls and 51 percent boys. Taking into account the standard errors of sampling, it may therefore be said that there was no difference between the percentages of boys and girls in school at Grade 6 level. Some fluctuations in percentages were noticeable across districts - but these, again, were well within the bounds of sampling error.
(c) Books in the home
The number of books in a pupil’s home can be regarded as a reading resource. From other studies (Elley, 1992) it has been found that, in most countries of the world, the availability of books for children to read is highly conducive to better levels of reading achievement. The Grade 6 pupils involved in this study were asked to indicate the approximate number of books in their home according to six categories: 1 = no books in the home; 2 = l-10 books in the home; 3 = 1 l-50 books in the home; 4 = 5 l-100 books in the home; 5 = 101-200 books in the home; 6 = more than 200 books in the home.
21


The mid-point of each value range was used to estimate the total number of books in the home. For example, the value 1 was recoded as zero books, the value 2 was recoded as five books, and so on. The value 6 was recoded (as an estimate) to 250 books. From Table 3.1 it can be seen that the average Grade 6 pupil in Mauritius came from a home where there were 37.8 books. Although the standard deviation is not reported in the table, it was 48, indicating that there were a number of pupils with no books at home and others with over 200. The variation in values across districts ranged from homes having an average of 48.8 books in the district of Riviere du Rempart and 48.0 books in the district of Savanne, down to homes having an average of 15.7 books in the district of Rodrigues and 16.1 books in the district of Black River. The wide range of these figures indicated major differentials between the reading resources of homes in different districts.
(d) Possessions in the home
The Grade 6 pupils were asked if they had the following 14 items in the home: daily newspaper, weekly or monthly magazine, radio, television set, video-cassette recorder, cassette player, telephone, refrigerator, car, motorcycle, bicycle, electricity, piped water, and a table to write on. For each item, pupils were given a score of 0 if they did not have the item and a score of 1 if they had the item. These scores were summed to form an ‘Index of possessions’ which reflected the material wealth of the home. A pupil from a home with none of these items received a score of 0 and a pupil from a home with all of these items received a score of 14.
The mean scores on this index have been presented in Table 3.1. The average for the country was 10.4 possessions. The only major variation between districts was that Rodrigues had a very low average of 7.2 possessions and that Port Louis, the capital, was somewhat above the rest of the districts.
The substantial difference between Rodrigues and all other districts on this variable suggested that there were some pockets of relative poverty on this island. This research finding indicated the need for gathering more detailed information about this situation with a view to establishing whether educational problems associated with poverty have emerged, or will emerge, in Rodrigues.
(e) Index of regular meals
It has often been pointed out (Pollitt, 1990) that poor nutrition results in a lack of concentration and reduced perseverance in school. Regularity of meals was therefore seen as a factor likely to influence the acquisition of reading skills. The ‘Index of regular meals’ was a measure on a 12-point scale that assessed the number of meals that pupils reported they ate in a week. These meals were breakfast, lunch, and dinner. If a pupil ate no meals at all the score was 3, but if a pupil ate all meals each day, the score was 12.
In Table 3.1 the means for this index have been presented. The national mean was 11.6 and there were no major differences between the districts on this index. This was a very pleasing research finding because it indicated that Grade 6 pupils were receiving regular meals and that this picture was consistent across districts. It should also be pointed out at this point that it has been Ministry policy for some time that all primary-school pupils should be provided with a balanced mid-day meal consisting of bread, milk, cheese and dried fruits on every school day that they are in attendance.
23

(f) Parent education
Questions were asked in the pupil questionnaire about the level of education that each of their parents had received. This information was coded as follows: did not go to school = 1; completed some primary school = 2; completed all primary school = 3; completed some secondary school = 4, completed all secondary school = 5; completed some education and/or training after secondary school = 6.
The answers for each child’s mother and father were summed to provide an ‘Index of parent education’. In Table 3.2 it can be seen that the average value for this index for Mauritius was 6.6. There was quite a range of values across districts for this index - ranging from high values of 7.5 in Lower Plaine Wilhems and 7.3 in Upper Plaine Wilhems, to low values of 4.7 in Rodrigues and 5.5 in Black River.
The general trend of these values across districts mirrored the results reported above for the number of books in the home. Both of these factors are widely recognized as being of major importance to pupil achievement and therefore their impact upon the reading performance of pupils in this study will be taken up in more detail in a later chapter.
Policy Suggestion 3.3: The Ministry should establish a task force to implement strategies for taking educational action to compensate for the limited educational resources (books, possessions, parent education) available in the homes of pupils from Black River and Rodrigues.
(g) Speak English at home
English is the medium of instruction in Mauritian schools. However, outside school several languages are spoken. The reading test used in this study was in English, and therefore it was expected that the extent to which pupils had an opportunity to speak English outside of the school would influence their reading performance in a test in English.
In Table 3.2 it may be seen that the percentage of pupils who answered that they spoke some English at home (sometimes, often, or all of the time) was 50.6 for Mauritius. There was, however, considerable variation across districts. In Savanne 62.1 percent of the pupils reported that they spoke all or some English at home - which implied that over one third of the pupils in Savanne never spoke English at home. The situation in Lower Plaine Wilhems, Flacq, and Upper Plaine Wilhems was similar, with around 60 percent of pupils speaking English at home. In contrast, in Black River and Rodrigues the percentages were very low at 26.8 and 29.5 respectively. These large differences between regions need to be recognized by educational planners when making decisions concerning the allocation of human and material resources related to the learning of English. For example, perhaps the Ministry could arrange for teachers with an excellent command of English to be posted to Rodrigues and Black River; or perhaps teachers could be encouraged to share their knowledge of English with parents and the general community.
Policy Suggestion 3.4: The Ministry should give a high priority to the allocation of teachers with an excellent command of English to Rodrigues and Black River in order to address the situation of the very high percentage of Grade 6 pupils who are from homes where no English is spoken.
24
(h) Days absent in previous month
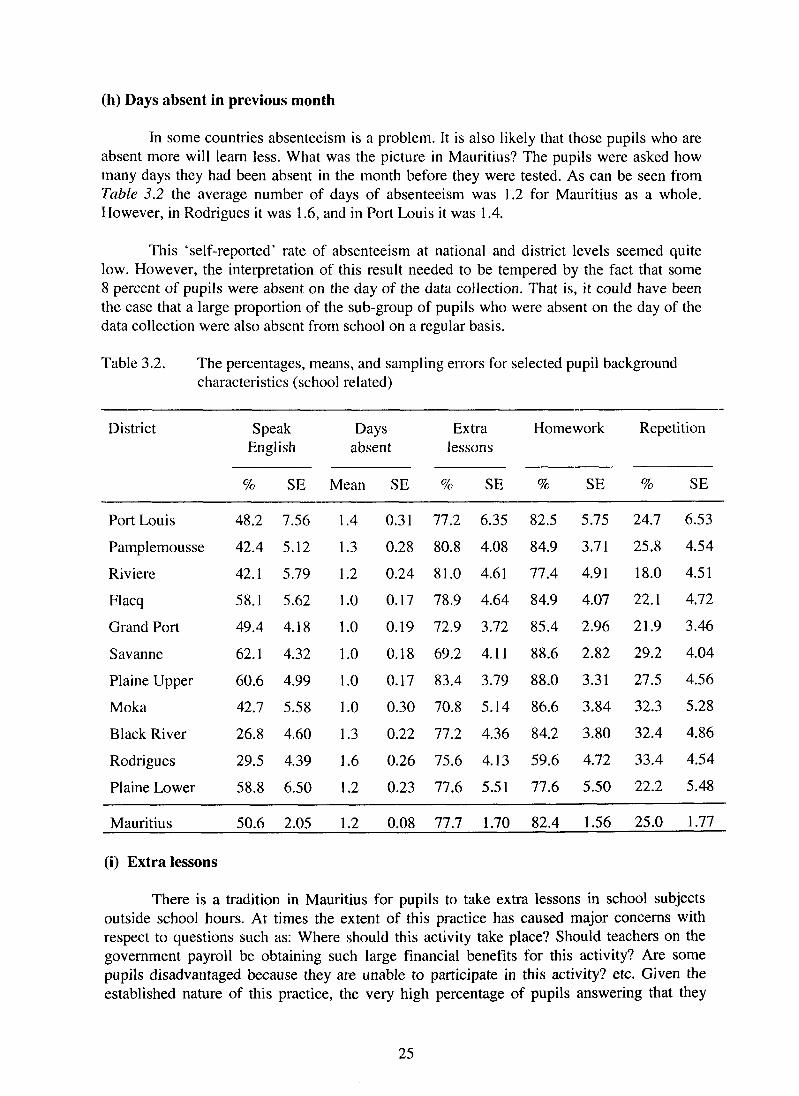
In some countries absenteeism is a problem. It is also likely that those pupils who are absent more will learn less. What was the picture in Mauritius? The pupils were asked how many days they had been absent in the month before they were tested. As can be seen from Table 3.2 the average number of days of absenteeism was 1.2 for Mauritius as a whole. However, in Rodrigues it was 1.6, and in Port Louis it was 1.4.
This ‘self-reported’ rate of absenteeism at national and district levels seemed quite low. However, the interpretation of this result needed to be tempered by the fact that some 8 percent of pupils were absent on the day of the data collection. That is, it could have been the case that a large proportion of the sub-group of pupils who were absent on the day of the data collection were also absent from school on a regular basis.
Table 3.2. The percentages, means, and sampling errors for selected pupil background characteristics (school related)
District Speak Days Extra Homework Repetition English absent lessons
% SE Mean SE % SE % SE % SE
Port Louis 48.2 7.56 1.4 0.31 77.2 6.35 82.5 5.75 24.7 6.53
Pamplemousse 42.4 5.12 1.3 0.28 80.8 4.08 84.9 3.71 25.8 4.54
Riviere 42.1 5.79 1.2 0.24 81.0 4.61 77.4 4.91 18.0 4.5 1
Flacq 58.1 5.62 1.0 0.17 78.9 4.64 84.9 4.07 22.1 4.72
Grand Port 49.4 4.18 1.0 0.19 72.9 3.72 85.4 2.96 21.9 3.46
Savanne 62.1 4.32 1.0 0.18 69.2 4.11 88.6 2.82 29.2 4.04
Plaine Upper 60.6 4.99 1.0 0.17 83.4 3.79 88.0 3.31 27.5 4.56
Moka 42.7 5.58 1.0 0.30 70.8 5.14 86.6 3.84 32.3 5.28
Black River 26.8 4.60 1.3 0.22 77.2 4.36 84.2 3.80 32.4 4.86
Rodrigues 29.5 4.39 1.6 0.26 75.6 4.13 59.6 4.72 33.4 4.54
Plaine Lower 58.8 6.50 1.2 0.23 77.6 5.51 77.6 5.50 22.2 5.48
Mauritius 50.6 2.05 1.2 0.08 77.7 1.70 82.4 1.56 25.0 1.77
(i) Extra lessons
There is a tradition in Mauritius for pupils to take extra lessons in school subjects outside school hours. At times the extent of this practice has caused major concerns with respect to questions such as: Where should this activity take place? Should teachers on the government payroll be obtaining such large financial benefits for this activity? Are some pupils disadvantaged because they are unable to participate in this activity? etc. Given the established nature of this practice, the very high percentage of pupils answering that they
25
-.-
were taking extra tuition was not a surprise. The average for Mauritius was 77.7 percent. In Upper Plaine Wilhems it was 83.4 percent, and in Pamplemousse and Riviere du Rempart it was around 81 percent, while in Savanne it was only 69.2 percent.
If these generally high figures continue to grow in Mauritius, then the Ministry needs to begin to examine the potential detrimental effects that this may have on normal schooling. If teachers are able to earn substantial amounts of tax-free income in addition to their government salary via out-of-school tuition, then what incentive is there for them to do a sound job of covering the official curriculum within school hours?
Policy Suggestion 3.5: The Ministry should ask the Staffing Branch to meet with Teacher Union representatives to discuss the potential ‘conflict of interest’ that arises from the current practice of allowing the teachers of around 80 percent of Grade 6 pupils to receive high financial rewards for teaching their own pupils as private clients outside of school hours.
Cj) Homework
The pupils were asked how often they received homework. The possible responses were: I do not get any homework; once or twice per month; once or twice per week; and most days of the week. The percentages of pupils that reported that they received regular homework (that is, ‘at least once or twice each week’) have been presented as the penultimate variable in Table 3.2.
It can be seen that the percentage of pupils receiving regular homework was a very high value of 82.4 percent for Mauritius overall. This high level applied across all districts, with the percentage of pupils receiving regular homework being in the range of 80 to 90 percent or higher for most districts.
Policy Suggestion 3.6: The Inspectorate should develop a national policy on homework for Grade 6 - giving particular attention to the existing arrangements for homework in Rodrigues.
(k) Grade repetition
The issue of grade repetition was discussed earlier in the context of an analysis of the average age of Grade 6 pupils. In the final set of figures in Table 3.2 the percentages of Grade 6 students who repeated at least one grade have been listed for Mauritius and the 11 districts. The percentages for districts showed very large variations from a low value of 18 percent in Riviere du Rempart to high values of around 32 to 33 percent in Moka, Rodrigues, and Black River.
A separate analysis of the reading literacy levels of the pupils who had repeated a grade showed some very interesting results. To illustrate, one in ten of the top 25 percent of readers had repeated a grade. That is, some of the best readers in Mauritius had repeated a grade. This result could imply that grade repetition had resulted in a dramatic improvement in the reading performance of these pupils - or that these able pupils had been wasting their time by repeating grades. Whatever the explanation, there is certainly a need for more information about this aspect of the Mauritian primary education system. For example, it would be very
26
---

interesting to establish whether the identification of pupils for grade repetition bears any relationship to objective measures of pupil performance.
Policy Suggestion 3.7: The Planning Unit should undertake a study (a) to examine the procedures used by schools to identify pupils for grade repetition, and (b) to test whether these procedures are being applied in a ‘rational’ manner (in the sense that they are linked to valid measures of pupil performance).
What were the characteristics of Grade 6 teachers?
Several important characteristics of teachers were also measured. These concerned the age of teachers, sex of teachers, academic qualifications, professional qualifications, years of teacher experience, and number of in-service courses. The results of the analysis of these variables have been reported in Table 3.3,
(a) Age of teachers
The average age of Grade 6 teachers in the different districts and in Mauritius as a whole has been presented as the first variable in Table 3.3. The average age of all Grade 6 teachers for Mauritius in the sample was 43.2 years. Higher average ages were noted for Port Louis, Pamplemousse, Upper Plaine Wilhems and Lower Plaine Wilhems, where the average age of Grade 6 teachers was around 46 years. On the other hand, in Black River and Rodrigues the average age was around 36 years. This ten-year gap in teacher age was much larger than could ordinarily be attributed to random fluctuations and therefore raised a number of questions about the allocation of teachers to regions. For example: are there systematic staff allocation arrangements applied by the Ministry that have resulted in younger teachers being sent to some districts and not to others?
(b) Sex of teachers
The gender distribution of Grade 6 teachers in Mauritius was 79.3 per cent male and 20.7 percent female. The one district that was very different was Black River, where 56.1 percent of the Grade 6 pupils were being taught by a female teacher.
However, when the distribution of all teachers in primary schools (that is, teachers for all grades and not just Grade 6 teachers) was examined in the official Ministry statistical reports, it was found that there were 42 percent of pupils being taught by female teachers and 58 percent by male teachers. The discrepancy between the sex of Grade 6 teachers and all teachers can probably be explained by the fact that it is often, by tradition, the male teachers who are requested by the Ministry to teach Grades 5 and 6. Mauritius has a policy of encouraging teachers to stay with the same class for two years through Grade 5 level and Grade 6 level. A possible second reason that might explain the high percentage of Grade 6 male teachers is that since most of the Grade 6 pupils take private tuition after school hours from their own class teachers, female teachers, who often have extra home and family responsibilities in the evening, prefer to avoid teaching Grade 6 pupils so that they do not have to stay at school after normal hours. A third possible reason is that only the most senior teachers in the school are given Grade 6 classes - which implies that female teachers are under-represented among the most senior teachers.
27

28

Each of these three possible reasons for the discrepancy between the percentage representation of female teachers at Grade 6 level and the overall percentage can lead to different policy options. Clearly, this issue needs to be opened up to debate both inside and outside the Ministry in order to establish whether firm action should be taken to redress this major gender imbalance across the nation.
(c) Years of academic education
The teachers were asked to record the years (excluding grade repetition) of academic education (for example, primary, secondary, and post-secondary education) that they had received. From Table 3.3 it may be seen that the average Grade 6 pupil in Mauritius had a teacher who had received 11.8 years of education. This implied that the average Grade 6 pupil had a teacher who had completed six years of primary education followed by at least five years of secondary education. The excess over 11 years of education suggested that some Grade 6 teachers had completed one or more years of post-secondary education.
There was little variation among districts on this variable. The only district where the average academic qualifications of Grade 6 teachers were much lower than the national average was Rodrigues. The average value of 10.8 years of academic education for Grade 6 teachers in Rodrigues indicated that there were quite a few teachers who had not completed their secondary school education.
(d) Years of teacher training
In Mauritius, all primary-school teachers should have attended a two-year teacher training programme before commencing their careers. The average number of years of teacher training for Grade 6 teachers has been presented in Table 3.3. For Mauritius overall it was 1.9 years and the average figure for Flacq and Black River was the lowest at 1.7 years. In general, there was relatively little variation among regions on this variable.
(e) Years of teaching experience
The average number of years of teaching experience for Grade 6 teachers has been listed in Table 3.3. The average for Mauritius was 20.1 years, with a standard deviation of eight years. In Port Louis and both Upper and Lower Plaine Wilhems districts, the average number of years of teaching experience was around 23 to 24 years, but in Black River and Rodrigues it was around 14 to 15 years. The results for Black River and Rodrigues, when taken into consideration with the variations observed in teacher age among districts, suggest a major difference in school staffing policy for those two districts. An investigation is warranted here in order to establish whether this situation is desirable and, if not, what should be done to obtain a more balanced allocation of experienced teachers across districts?
Policy Suggestion 3.8: A special team selected from across the main administrative divisions of the Ministry should be asked to examine future options for school staffing policies which will address the inequities arising from (a) the posting of younger and less experienced Grade 6 teachers to Black River and Rodrigues, and (b) the problem of Grade 6 teachers in Rodrigues who have not completed secondary education.
29
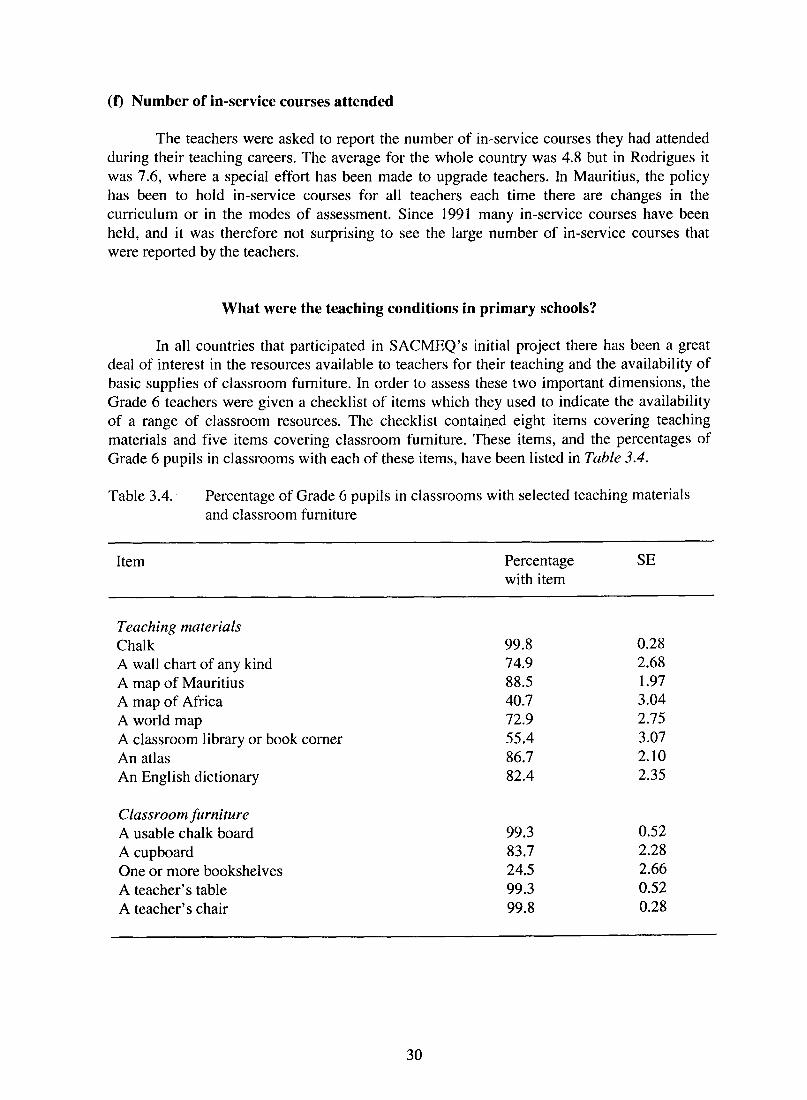
(f) Number of in-service courses attended
The teachers were asked to report the number of in-service courses they had attended during their teaching careers. The average for the whole country was 4.8 but in Rodrigues it was 7.6, where a special effort has been made to upgrade teachers. In Mauritius, the policy has been to hold in-service courses for all teachers each time there are changes in the curriculum or in the modes of assessment. Since 1991 many in-service courses have been held, and it was therefore not surprising to see the large number of in-service courses that were reported by the teachers.
What were the teaching conditions in primary schools?
In all countries that participated in SACMEQ’s initial project there has been a great deal of interest in the resources available to teachers for their teaching and the availability of basic supplies of classroom furniture. In order to assess these two important dimensions, the Grade 6 teachers were given a checklist of items which they used to indicate the availability of a range of classroom resources. The checklist contained eight items covering teaching materials and five items covering classroom furniture. These items, and the percentages of Grade 6 pupils in classrooms with each of these items, have been listed in Table 3.4.
Table 3.4. Percentage of Grade 6 pupils in classrooms with selected teaching materials and classroom furniture
Item Percentage with item
SE
Teaching materials Chalk A wall chart of any kind A map of Mauritius A map of Africa A world map A classroom library or book comer An atlas An English dictionary
Classroom furniture A usable chalk board A cupboard One or more bookshelves A teacher’s table A teacher’s chair
99.8 0.28 74.9 2.68 88.5 1.97 40.7 3.04 72.9 2.75 55.4 3.07 86.7 2.10 82.4 2.35
99.3 0.52 83.7 2.28 24.5 2.66 99.3 0.52 99.8 0.28
30

(a) Teaching materials and classroom furniture
Several surprising results emerged from the analyses associated with teaching materials and classroom furniture. First, it was expected that certain fundamental resources (such as an atlas, an English dictionary, and a bookshelf) would be found in all Grade 6 classrooms. This was not the case, with 13.3 percent of pupils in classrooms with no atlas, 17.6 percent with no English dictionary, and a surprising 75.5 percent with no bookshelves.
Second, only half of the Grade 6 pupils were in classrooms that had a classroom library or book comer. This was a most disturbing finding because a number of research studies have shown that increasing pupil access to books by making them ‘closer’ to ordinary daily classroom activities is a key factor in improving pupil literacy levels (Postlethwaite and Ross, 1992).
The teacher checklist responses concerning each set of resources were combined to form two scales: a Teaching Materials Index (constructed by adding up the number of teaching material items that each teacher reported out of a total of eight items) and a Classroom Furniture Index (constructed by adding up the number of items of classroom furniture that each teacher reported out of a total of five items). The mean score for these indices across districts, and for Mauritius overall, have been reported in Table 3.5.
Table 3.5. Means and sampling errors for the Index of teaching materials and the Index of classroom furniture
District Teaching materials Classroom furniture index (8 items) index (5 items)
Mean SE Mean SE
Port Louis 5.7 0.41 4.0 0.11
Pamplemousse 6.1 0.30 4.1 0.12
Riviere 4.7 0.49 4.0 0.14
Flacq 5.8 0.37 3.9 0.12
Grand Port 6.7 0.33 4.2 0.12
Savanne 5.9 0.39 3.8 0.12
Plaine Upper 6.3 0.34 4.1 0.11
Moka 6.2 0.48 4.2 0.15
Black River 6.5 0.18 4.3 0.12
Rodrigues 6.0 0.27 4.2 0.13
Plaine Lower 6.4 0.23 4.2 0.08
Mauritius 6.0 0.12 4.1 0.04
31
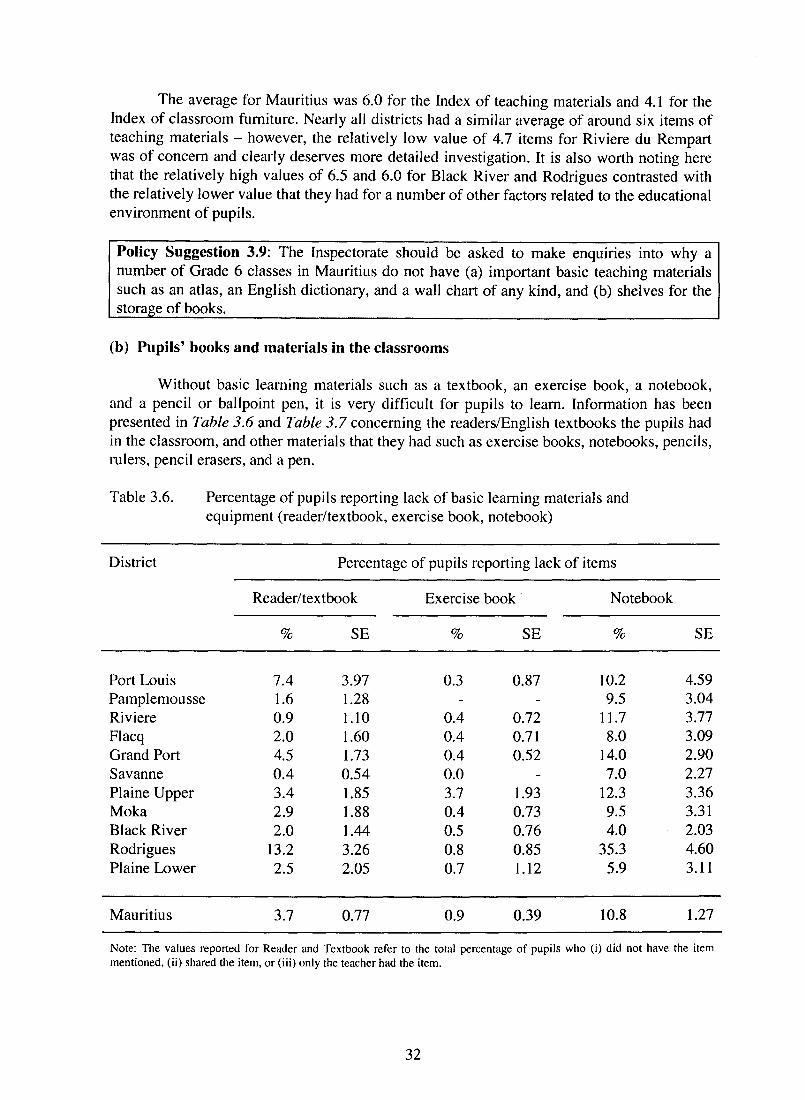
The average for Mauritius was 6.0 for the Index of teaching materials and 4.1 for the Index of classroom furniture. Nearly all districts had a similar average of around six items of teaching materials - however, the relatively low value of 4.7 items for Riviere du Rempart was of concern and clearly deserves more detailed investigation. It is also worth noting here that the relatively high values of 6.5 and 6.0 for Black River and Rodrigues contrasted with the relatively lower value that they had for a number of other factors related to the educational environment of pupils.
Policy Suggestion 3.9: The Inspectorate should be asked to make enquiries into why a number of Grade 6 classes in Mauritius do not have (a) important basic teaching materials such as an atlas, an English dictionary, and a wall chart of any kind, and (b) shelves for the storage of books.
(b) Pupils’ books and materials in the classrooms
Without basic learning materials such as a textbook, an exercise book, a notebook, and a pencil or ballpoint pen, it is very difficult for pupils to learn. Information has been presented in Tubfe 3.6 and Table 3.7 concerning the readers/English textbooks the pupils had in the classroom, and other materials that they had such as exercise books, notebooks, pencils, rulers, pencil erasers, and a pen.
Table 3.6. Percentage of pupils reporting lack of basic learning materials and equipment (reader/textbook, exercise book, notebook)
District Percentage of pupils reporting lack of items
Reader/textbook Exercise book Notebook
% SE % SE % SE
Port Louis 7.4 3.97 Pamplemousse 1.6 1.28 Riviere 0.9 1.10 Flacq 2.0 1.60 Grand Port 4.5 1.73 Savanne 0.4 0.54 Plaine Upper 3.4 1.85 Moka 2.9 1.88 Black River 2.0 1.44 Rodrigues 13.2 3.26 Plaine Lower 2.5 2.05
0.3 0.87
0.4 0.4 0.4 0.0 3.7 0.4 0.5 0.8 0.7
0.72 0.71 0.52
1.93 0.73 0.76 0.85 1.12
10.2 4.59 9.5 3.04
11.7 3.77 8.0 3.09
14.0 2.90 7.0 2.27
12.3 3.36 9.5 3.31 4.0 2.03
35.3 4.60 5.9 3.11
Mauritius 3.7 0.77 0.9 0.39 10.8 1.27
Note: The values reported for Reader and Textbook refer to the total percentage of pupils who (i) did not have the item mentioned, (ii) shared the item, or (iii) only the teacher had the item.
32
In Table 3.6 it may be seen that in Mauritius as a whole just over 96 percent of pupils had either their own English reader or their own English textbook. There were very few pupils reporting that either they had none (0.2 percent) or that only the teacher had one (I .3 percent), or that they shared with one or two other pupils (2.3 percent). However, the overall figure of 13.2 percent for pupils lacking an English reader/textbook in Rodrigues was substantially higher than for the other districts, and therefore a major effort needs to be made to remedy this problem.
An exercise book was defined as ‘a book for writing that is marked by the teacher’ and a notebook as ‘a book that is used for writing and is not marked by the teacher’. The figures prepared in Table 3.6 illustrated that there were few pupils (0.9 percent) in Mauritius who declared that they did not have an exercise book. However, 10.8 percent of pupils in Mauritius declared that they did not have a notebook, and for the districts of Port Louis, Riviere, Grand Port, Upper Plaine Wilhems, and Rodrigues, the figure exceeded 10 percent. Indeed, for Rodrigues it was 35.3 percent. Further exploration of the data is warranted with respect to these two variables. It is important to discover if the pupils knew exactly what was meant by the two different books. If the percentages are correct then it would seem that some remedial action is required by the national ministry as well as by the responsible officers for particular districts.
With the exception of Upper Plaine Wilhems, the results presented in Table 3.7 indicated that nearly all children had a pencil. There were more children who did not have a ballpoint pen and the percentage for Rodrigues was 45 percent. There were only 17 children in the whole of the sample declaring themselves to have neither a pencil nor a pen.
Finally, only 3.9 and 3.6 percent of pupils said that they did not have a ruler or eraser respectively. The districts of Riviere, Black River, and Rodrigues had somewhat higher percentages than the other districts.
In general, the results presented in Table 3.6 and Table 3.7 indicated that the majority of Grade 6 pupils in Mauritius had an adequate supply of basic learning materials and equipment. The exception to this general pattern appeared to be Rodrigues, where some shortfalls for pupils were observed and therefore deserved more detailed examination.
Policy Suggestion 3.10: The Supply Branch of the Ministry should investigate the reasons for the relatively high percentage of Grade 6 pupils in Rodrigues who reported that they lacked basic learning materials.
What aspects of the teaching function designed to improve the quality of education were in place?
A number of variables were examined with respect to this important aspect of the educational environment. Most of them related to teaching practices that were known from previous research to influence pupil learning, or with the teachers’ perceptions of the inspectors and the factors that are related to job satisfaction. Four issues were examined: frequency of testing pupils, regularity of meetings with parents, perceptions of the professional performance of the inspectorate, and perceptions of what it is that they believe makes them satisfied with their job. The results of these analyses have been presented in Tables 3.8 to 3.12.
33

SG
” ’
. .
- 0
34
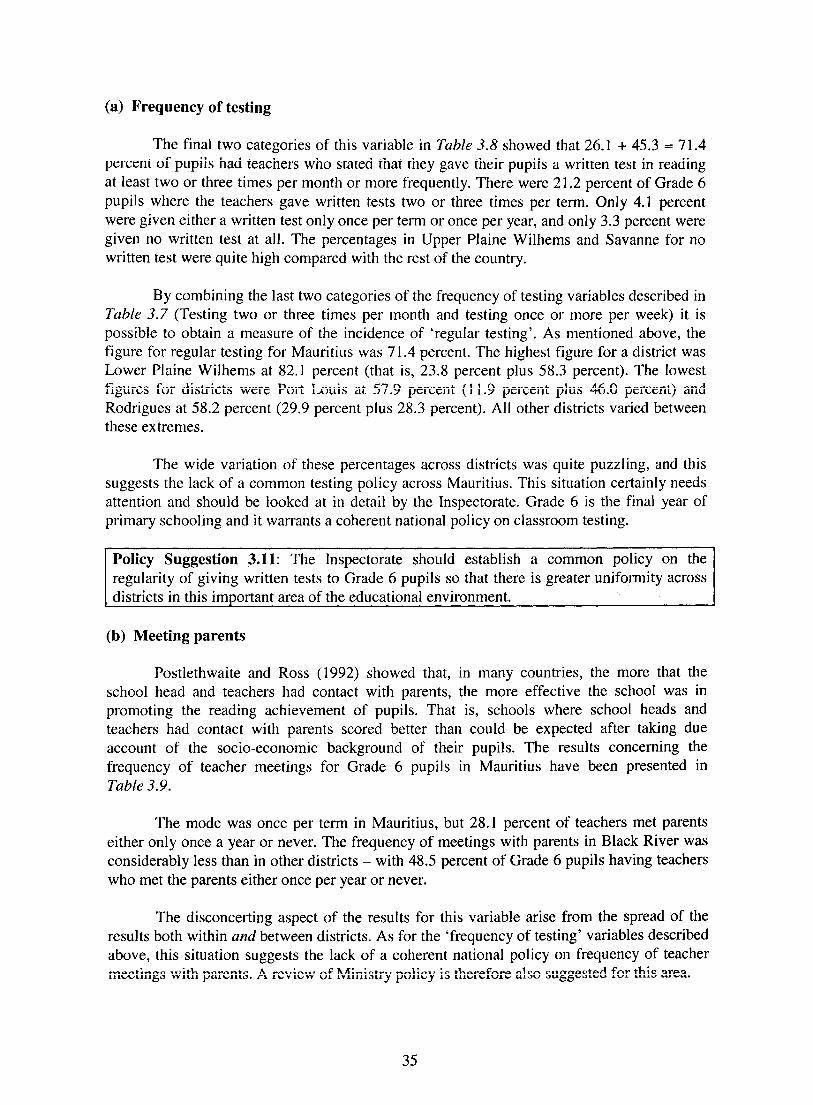
(a) Frequency of testing
The final two categories of this variable in Table 3.8 showed that 26.1 + 45.3 = 71.4 percent of pupils had teachers who stated that they gave their pupils a written test in reading at least two or three times per month or more frequently. There were 2 1.2 percent of Grade 6 pupils where the teachers gave written tests two or three times per term. Only 4.1 percent were given either a written test only once per term or once per year, and only 3.3 percent were given no written test at all. The percentages in Upper Plaine Wilhems and Savanne for no written test were quite high compared with the rest of the country.
By combining the last two categories of the frequency of testing variables described in Table 3.7 (Testing two or three times per month and testing once or more per week) it is possible to obtain a measure of the incidence of ‘regular testing’. As mentioned above, the figure for regular testing for Mauritius was 7 1.4 percent. The highest figure for a district was Lower Plaine Wilhems at 82.1 percent (that is, 23.8 percent plus 58.3 percent). The lowest figures for districts were Port Louis at 57.9 percent (11.9 percent plus 46.0 percent) and Rodrigues at 58.2 percent (29.9 percent plus 28.3 percent). All other districts varied between these extremes.
The wide variation of these percentages across districts was quite puzzling, and this suggests the lack of a common testing policy across Mauritius. This situation certainly needs attention and should be looked at in detail by the Inspectorate. Grade 6 is the final year of primary schooling and it warrants a coherent national policy on classroom testing.
Policy Suggestion 3.11: The Inspectorate should establish a common policy on the regularity of giving written tests to Grade 6 pupils so that there is greater uniformity across districts in this important area of the educational environment.
(b) Meeting parents
Postlethwaite and Ross (1992) showed that, in many countries, the more that the school head and teachers had contact with parents, the more effective the school was in promoting the reading achievement of pupils. That is, schools where school heads and teachers had contact with parents scored better than could be expected after taking due account of the socio-economic background of their pupils. The results concerning the frequency of teacher meetings for Grade 6 pupils in Mauritius have been presented in Table 3.9.
The mode was once per term in Mauritius, but 28.1 percent of teachers met parents either only once a year or never. The frequency of meetings with parents in Black River was considerably less than in other districts - with 48.5 percent of Grade 6 pupils having teachers who met the parents either once per year or never.
The disconcerting aspect of the results for this variable arise from the spread of the results both within and between districts. As for the ‘frequency of testing’ variables described above, this situation suggests the lack of a coherent national policy on frequency of teacher meetings with parents. A review of Ministry policy is therefore also suggested for this area.
35
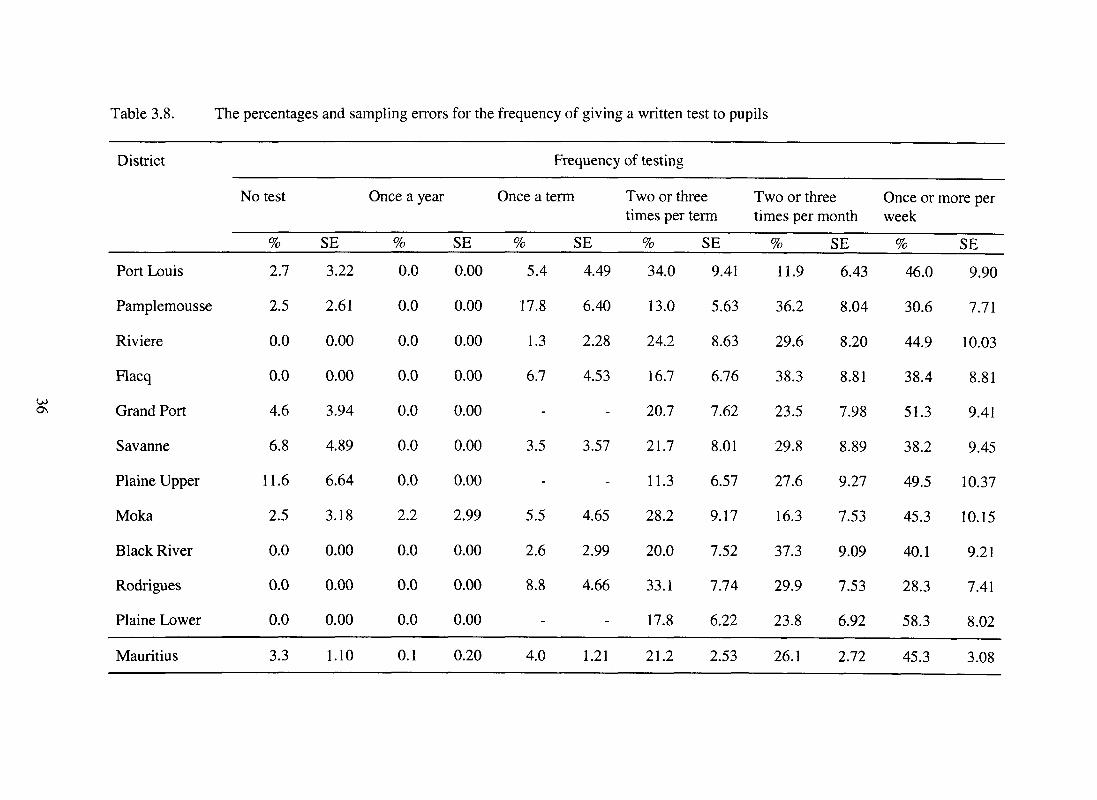
36

Table 3.9. Percentages and sampling errors for frequency of teacher meetings with parents
District Never Once per year
Once per term
Once (+) per month
% SE % SE % SE % SE
Port Louis 12.7 6.62
Pamplemousse 16.4 6.19
Riviere 10.7 6.23
Flacq 13.2 6.13
Grand Port 7.3 4.90
Savanne 10.5 5.96
Plaine Upper 5.7 4.81
Moka 15.5 7.38
Black River 21.9 7.77
Rodrigues 0.00 0.00
25.4
20.5
15.2
12.7
30.7
26.6
8.2
15.8
26.6
25.8
8.2
8.65 39.5 9.71 22.4 8.28
6.75 51.6 8.36 11.5 5.34
7.24 55.6 10.02 18.6 7.84
6.03 44.0 8.99 30.1 8.31
8.68 47.2 9.39 14.8 6.68
8.59 34.8 9.26 28.1 8.74
5.69 75.2 8.96 10.9 6.46
7.44 37.6 9.87 31.1 9.44
8.30 41.1 9.24 10.4 5.74
7.20 67.0 7.73 7.2 4.25
4.46 65.0 7.76 19.4 6.43 Plaine Lower 7.4 4.26
Mauritius 10.3 1.88 17.8 2.37 53.1 3.09 18.8 2.42
Policy Suggestion 3.12: The Ministry should convene a meeting of school heads to establish a national policy concerning the frequency of teacher meetings with parents.
(c) Teachers’ perception of the role of inspectors
The changing role of the Inspectorate has recently become an important issue in many education systems. The teachers in this study were given an opportunity to describe their perceptions of the impact of the inspectors on their work. Their responses have been tabulated in Table 3.10.
The teacher’s responses in this area were tabulated under three broad headings that described the main dimensions of the work carried out by inspectors: ‘Pedagogical role’; ‘Critical versus advisory role’; and ‘Professional development role’. It can be seen from the results that the teachers had ‘mixed feelings’ about the role of the inspectors. They were quite positive about the pedagogical role of the inspectors concerning the bringing of new ideas, clarification of objectives, and recommending new material. However, they were somewhat less positive about the pedagogical role of inspectors with respect to their work on explaining the curriculum and making contributions to classroom teaching.
37
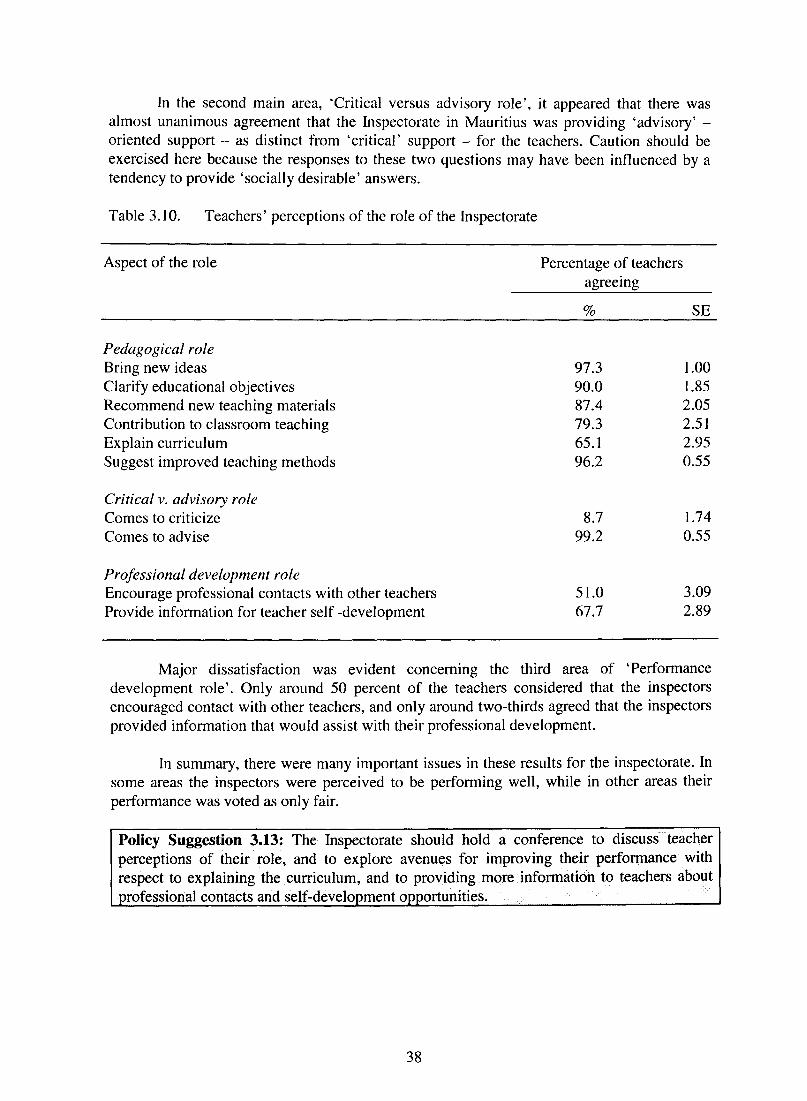
In the second main area, ‘Critical versus advisory role’, it appeared that there was almost unanimous agreement that the Inspectorate in Mauritius was providing ‘advisory’ - oriented support - as distinct from ‘critical’ support - for the teachers. Caution should be exercised here because the responses to these two questions may have been influenced by a tendency to provide ‘socially desirable’ answers.
Table 3.10. Teachers’ perceptions of the role of the Inspectorate
Aspect of the role Percentage of teachers agreeing
% SE
Pedagogical role Bring new ideas Clarify educational objectives Recommend new teaching materials Contribution to classroom teaching Explain curriculum Suggest improved teaching methods
97.3 1 .oo 90.0 1.85 87.4 2.05 79.3 2.51 65.1 2.95 96.2 0.55
Critical v. advisory role Comes to criticize Comes to advise
8.7 1.74 99.2 0.55
Professional development role Encourage professional contacts with other teachers 51.0 3.09 Provide information for teacher self -development 67.7 2.89
Major dissatisfaction was evident concerning the third area of ‘Performance development role’. Only around 50 percent of the teachers considered that the inspectors encouraged contact with other teachers, and only around two-thirds agreed that the inspectors provided information that would assist with their professional development.
In summary, there were many important issues in these results for the inspectorate. In some areas the inspectors were perceived to be performing well, while in other areas their performance was voted as only fair.
Policy Suggestion 3.13: The Inspectorate should hold a conference to discuss teacher perceptions of their role, and to explore avenues for improving their performance with respect to explaining the curriculum, and to providing more information to teachers about professional contacts and self-development opportunities. ,
38

(d) Sources of teacher satisfaction
The motivation of teachers is a critical issue for any programme designed to improve the quality of education. In the SACMEQ countries there has been considerable interest in this issue - especially concerning the factors that contribute most to job satisfaction. It is widely acknowledged that satisfied teachers will tend to work harder for the benefit of the pupils, and are less likely to leave the teaching profession.
Teachers in this study were given an opportunity to respond to 13 possible reasons for their satisfaction with their jobs. The 13 reasons have been grouped under five headings in Table 3.21: living conditions, school facilities/equipment, relationships with others, career advancement, and educational outcomes of pupils.
It was interesting to note that the reasons related to ‘living conditions’ seemed less important to the teachers than for the other four groups of reasons. This result was clearly related to the fact that, unlike other SACMEQ countries, Mauritius expects teachers to find their own accommodation in the private housing market - rather than providing them with government housing. The fact that teachers are able to ‘choose’ their own housing has therefore probably resulted in the issue of teacher housing being perceived as less important.
In contrast there was strong support for the items covering ‘school facilities and equipment’. Around 80 to 90 percent of the teachers indicated that the quality of school buildings, classroom furniture, and classroom supplies were ‘very important’ factors contributing towards their job satisfaction.
39

Table 3.11. Percentage and sampling errors for sources of teacher satisfaction
Source Percentage of teachers indicating reason as
‘very important’
% SE
Living conditions Travel distance to school Availability of teacher housing Quality of teacher housing
School facilitieslequipment Quality of school buildings Quality of classroom furniture Quality of classroom supplies
Relationships with others Quality of school manpower and administration Amicable working relations with other teachers Good relations with community
Career advancement Expanded opportunities for promotion Opportunities for professional development Level of teacher salary
Educational outcomes of pupils Seeing pupils learn
55.8 3.07 32.9 2.91 43.9 3.07
82.3 2.36 85.8 2.16 89.4 1.90
92.4 1.64 83.9 2.27 66.5 2.92
87.2 2.07 85.5 2.18 93.1 1.57
96.7 1.10
The trend in the three figures listed for the ‘relationships with others’ group indicated a clear dichotomy between school and community relationships - with relationships within the school being perceived as much more important. Most important of all was relationships with the school administration (that is, with the school head) followed closely by relationships with other teachers. The low results obtained for ‘good relations with the community’ was disappointing given the large amount of research showing that this is an important factor in making schools most effective (Postlethwaite and Ross, 1992).
It was pleasing to see that the area of ‘educational outcomes of pupils’ was rated at a very high level. High values were also recorded for ‘career advancement’ issues related to opportunities for promotion and professional development.
When the teachers had completed the checklist of 13 reasons for job satisfaction, they were given an opportunity to select one reason that was the ‘most important’. The results of this selection have been listed in Table 3.12. In this table the percentages of teachers selecting the five reasons with the highest ratings have been presented. Also in this table the district in which each of these reasons had the highest rating has been listed.
40

It is clear from the results in Table 3.12 that teacher salary is the factor that is most important to the Grade 6 teachers in Mauritius. This result, coupled with the widespread participation of teachers as after-hours paid tutors for their own pupils, suggests an urgent need for a comprehensive Ministry investigation into reward systems for teachers.
From the rating of 39.2 percent for teacher salaries, there was a drop of around 15 percent to ‘seeing my pupils learn’. Then a similar-sized percentage drop to opportunities for personal development, opportunities for promotion, and quality of school management.
Table 3.12. Percentage of sampling errors for five reasons rated as ‘most important’ in a list of 13 reasons dealing with teacher job satisfaction
Five most important reasons Percentage rating as District with highest ‘most important’ frequency
% SE
Level of teacher salary 39.2 3.02 Flacq (5 1.7%)
Seeing my pupils learn 24.1 2.64 Grand Port (41.5%)
Opportunities for personal development 12.7 2.06 Rodrigues (25.9%)
Opportunities for promotion 10.7 1.91 Moka (2 1.1%)
Quality of school management 9.1 1.78 Plaine Lower (19.6%)
Policy Suggestion 3.14: The Staffing Branch should meet with Teachers Unions to discuss the responses of teachers concerning job satisfaction in order to identify strategies for addressing some of their national- and district-level concerns.
41

What was the general condition of school buildings?
The assessment of the general condition of school buildings in Mauritius was obtained by examining the responses to questions asked of school heads concerning the state of the buildings (from being in order, to needing different amounts of repair, to needing to be completely rebuilt). Another indicator of the general condition of the buildings was the amount of space per pupil in square metres. Finally, the provision of toilets per pupil is a matter of general concern in many SACMEQ countries and it became an issue of particular concern in early 1996 in Mauritius. The responses by teachers concerning these three areas have been listed in Table 3.13.
(a) Repair status
The school head was asked to state the condition of his or her school building on a five-point scale with the following values: 5 = in good condition; 4 = some classrooms need minor repairs; 3 = most or all classrooms need minor repairs; 2 = some classrooms need major repairs; and 1 = school needs complete rebuilding. This variable was recoded so that it was possible to calculate the percentage of Grade 6 pupils in schools where the school head perceived that these schools were either ‘in need of major repair’ or ‘needed complete rebuilding’. These percentages have been listed in Table 3.13.
The analysis revealed that 19.8 percent of Grade 6 pupils in Mauritius were in schools which were perceived by the school heads to be in need of major repairs or rebuilding. There were wide variations among the regions, ranging from 6.7 percent in the districts of Moka, Lower Plaine Wilhems and Savanne, to 40.0 percent in the district of Upper Plaine Wilhems. It was quite alarming to note that 40 percent of Grade 6 pupils in the district of Upper Plaine Wilhems attended schools thought to be in need of major repairs or rebuilding. It was also quite a surprising result because this district is a well-resourced urban area.
Policy Suggestion 3.15: The Ministry should conduct an audit of the state of repair of school buildings and undertake those major repairs of school buildings that must be attended to immediately in order to prevent an acceleration of damage to buildings and the resources contained in them.
(b) Classroom space
The value for this variable was obtained by dividing the whole of the internal area of all classrooms by the total number of pupils enrolled in the school. The national average for classroom space was 1.4, implying that, on average, each primary-school pupil in Mauritius was allotted an area of 1.4 square metres. There was very little variation among the districts on this variable, although schools in the districts of Port Louis, Pamplemousse and Rodrigues seemed to be slightly more crowded than schools in the district of Moka or Savanne.
(c) Toilet provision
At the national level, Grade 6 pupils attended schools where there were 34.5 pupils for one toilet. This ratio varied from 27.0 in the district of Savanne to 38.7 in the district of Upper Plaine Wilhems. The ratio, as expected, tended to be higher in more crowded schools.
42

Table 3.13. The means and sampling errors for selected school building characteristics
District Repair status Classroom space Toilet provision
Mean SE Mean SE Mean SE
Port Louis 20.0 10.68 1.2 0.13 36.5 1.90
Pamplemousse 33.3 12.59 1.2 0.06 37.5 2.74
Riviere 14.3 9.70 1.5 0.10 32.7 3.21
Flacq 26.7 11.81 1.4 0.15 28.2 3.69
Grand Port 13.3 9.07 1.4 0.13 32.5 4.09
Savanne 6.7 6.66 1.6 0.07 27.0 1.46
Plaine Upper 40.0 13.07 1.3 0.14 38.7 4.79
Moka 6.7 6.53 1.7 0.2 1 32.4 3.20
Black River 8.0 9.19 1.4 0.14 34.4 3.97
Rodrigues 20.0 11 .Ol 1.1 0.09 28.9 4.38
Plaine Lower 6.7 6.66 1.3 0.12 38.4 4.05
Mauritius 19.8 3.47 1.4 0.04 34.5 1.21
(d) General school facilities
From Table 3.14 it can be seen that most Grade 6 pupils in Mauritius were in schools that were generally well equipped with facilities. However, there were some areas of provision that were lacking. In particular, the low percentage of pupils in schools that had a school hall, a school garden, and a duplicator was surprising. How do the children meet as a school if there is no school hall? How do the primary-school children learn some horticulture and/or gardening if there is no school garden? And, how do the teachers prepare their own learning materials if there is no duplicator in the school?
Of particular concern were the low figures for ‘playground’ and ‘sports area’. At the primary-school level one would have expected a figure of 100 percent for playground and a much higher figure than 5 1.2 percent for sports area.
The lack of the more modem technological machines such as fax machines, overhead projectors, photocopiers, and computers was not a surprise because of limitations in funds available for implementing the Master Plan. However, this is an area where the Ministry may commence to review resource allocation decisions - especially with respect to the low levels of access (3.3 percent) to computer facilities.
43

Table 3.14.
Facility
Percentages and sampling errors for pupils in schools with selected facilities
Percentage with facility
% SE
School buildings School library School hall S taffroom School heads’ office School secretary’s office Storeroom Cafeteria
School grounds Sports area Playground School garden
General services Piped water Well or borehole Electricity Telephone
Equipment Fax machine Typewriter Duplicator Radio Tape recorder Overhead projector TV Film projector Video-cassette recorder Photocopier Computer
96.5 1.60 11.4 2.77 62.4 4.22 88.4 2.79 33.8 4.12 92.1 2.35 72.0 3.91
51.2 4.35 89.1 2.71 46.4 4.34
98.0 1.22 4.0 1.71
98.0 1.22 95.4 1.82
1.0 0.87 66.5 4.11 49.6 4.35 97.8 1.28 87.5 2.88
5.4 1.97 99.7 0.48
2.1 1.25 94.7 1.95
8.7 2.45 3.3 1.56
Policy Suggestion 3.16: The Staffing Branch should consult with school heads and parent/teacher associations concerning available school facilities with a view to developing a priority list for spending over the next few years.
44

What level of access did pupils have to books?
Elley (1992) showed that the more that children were able to read books and the more that they had books available for them to read, the higher would be their achievement in reading literacy. In this study, several questions were asked about the availability of a classroom library, school library, and the arrangements for allowing pupils to borrow books from these libraries. The responses to the questions have been summarized in Table 3.15.
(a) Classroom library
An international study of reading literacy (Elley, 1992) involving 32 systems of education, showed that high levels of literacy were associated with the availability of classroom libraries from which pupils could borrow books. That is, it was the availability of classroom libraries, as distinct from school libraries, that was important in many countries. The Grade 6 teachers in this study were asked about the number of books in the classroom library. If there was no classroom library, the teacher was directed to record zero books. In Table 3.15 the first column presents the percentage of Grade 6 pupils in classrooms with a library. Around 55 percent of Grade 6 pupils were in classrooms with a classroom library - which also implied that 45 percent were in classrooms that had no library. There was wide variation among the districts on this variable. While in the district of Riviere du Rempart only 36.0 percent of the Grade 6 pupils were in a class with classroom library facilities, 76.1 percent of the Grade 6 pupils in the district of Black River attended schools where there were classroom libraries.
(b) School library
Most Grade 6 pupils in Mauritius were in schools that had a school library. Some pupils were in schools that had both. Very few pupils were in schools that had neither. It can be seen that 85.3 percent of all Grade 6 pupils attended schools that had a school library, and that the percentages for all districts were in the range of 90 to 100 percent. In all discussions of access to library books in schools it is important to take into account the need to have the ‘right’ books. That is, the selection of library books should be fine-tuned to the age levels and interests of the pupils who will be using them. Little is known about this in Mauritius and it is time that a library book audit was conducted in all schools to assess both the numbers of books available and their ‘quality’ in terms of meeting the reading needs of pupils.
Policy Suggestion 3.17: The Curriculum Branch should conduct a national book audit to assess (a) book availability, and (b) book quality.
(c) Borrowing books
Even though schools may have classroom libraries and a school library, it often occurs that the pupils are not allowed to borrow books in order to take them home to read. Thus, a question was asked of the school heads about this point. It must be remembered that only 3.5 percent of schools did not have a school library. It can be seen that 85.3 percent of Grade 6 pupils in Mauritius attended schools where they were allowed to borrow books. In general, the pupils in most districts were allowed to borrow at a similar or better rate than the national figure. There were two rather striking deviations from this in Rodrigues and Lower Plaine Wilhems. What is most important in these figures is the difference between the figures
45
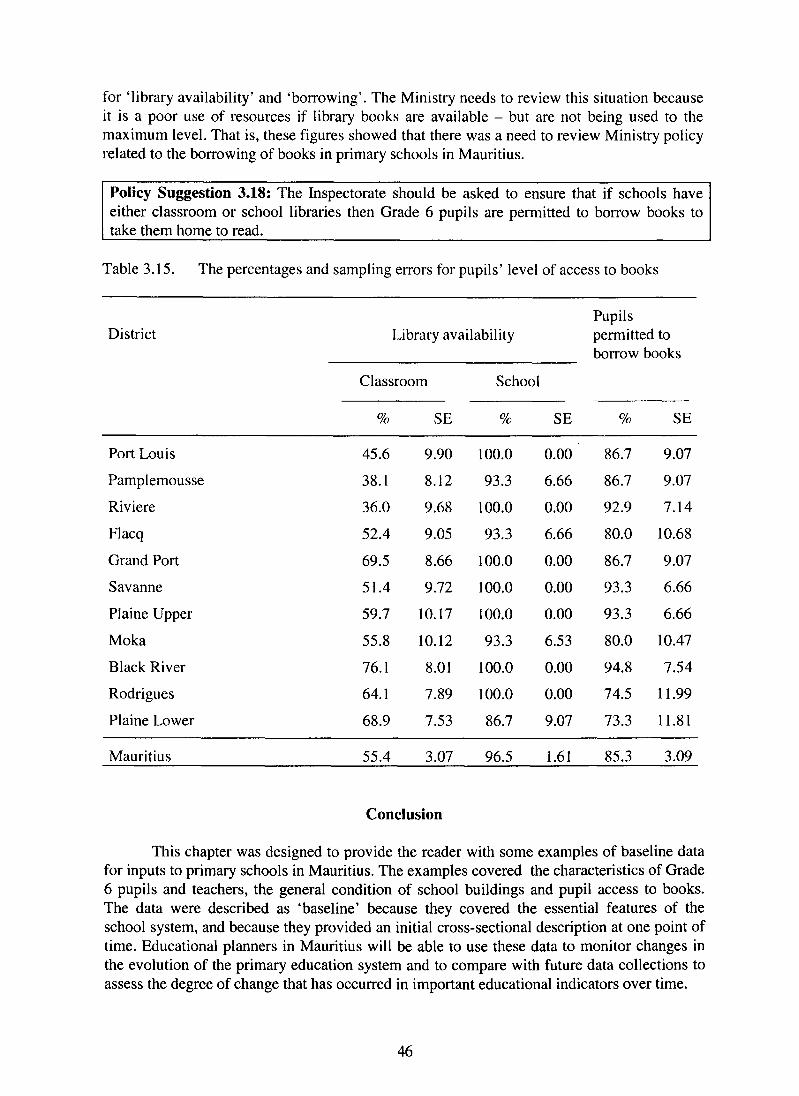
for ‘library availability’ and ‘borrowing’. The Ministry needs to review this situation because it is a poor use of resources if library books are available - but are not being used to the maximum level. That is, these figures showed that there was a need to review Ministry policy related to the borrowing of books in primary schools in Mauritius.
Policy Suggestion 3.18: The Inspectorate should be asked to ensure that if schools have either classroom or school libraries then Grade 6 pupils are permitted to borrow books to take them home to read.
Table 3.15. The percentages and sampling errors for pupils’ level of access to books
Pupils District Library availability permitted to
borrow books
Classroom School
% SE % SE % SE
Port Louis 45.6 9.90 100.0 0.00 86.7 9.07
Pamplemousse 38.1 8.12 93.3 6.66 86.7 9.07
Riviere 36.0 9.68 100.0 0.00 92.9 7.14
Flacq 52.4 9.05 93.3 6.66 80.0 10.68
Grand Port 69.5 8.66 100.0 0.00 86.7 9.07
Savanne 51.4 9.72 100.0 0.00 93.3 6.66
Plaine Upper 59.7 10.17 100.0 0.00 93.3 6.66
Moka 55.8 10.12 93.3 6.53 80.0 10.47
Black River 76.1 8.01 100.0 0.00 94.8 7.54
Rodrigues 64.1 7.89 100.0 0.00 74.5 11.99
Plaine Lower 68.9 7.53 86.7 9.07 73.3 11.81
Mauritius 55.4 3.07 96.5 1.61 85.3 3.09
Conclusion
This chapter was designed to provide the reader with some examples of baseline data for inputs to primary schools in Mauritius. The examples covered the characteristics of Grade 6 pupils and teachers, the general condition of school buildings and pupil access to books. The data were described as ‘baseline’ because they covered the essential features of the school system, and because they provided an initial cross-sectional description at one point of time. Educational planners in Mauritius will be able to use these data to monitor changes in the evolution of the primary education system and to compare with future data collections to assess the degree of change that has occurred in important educational indicators over time.
46
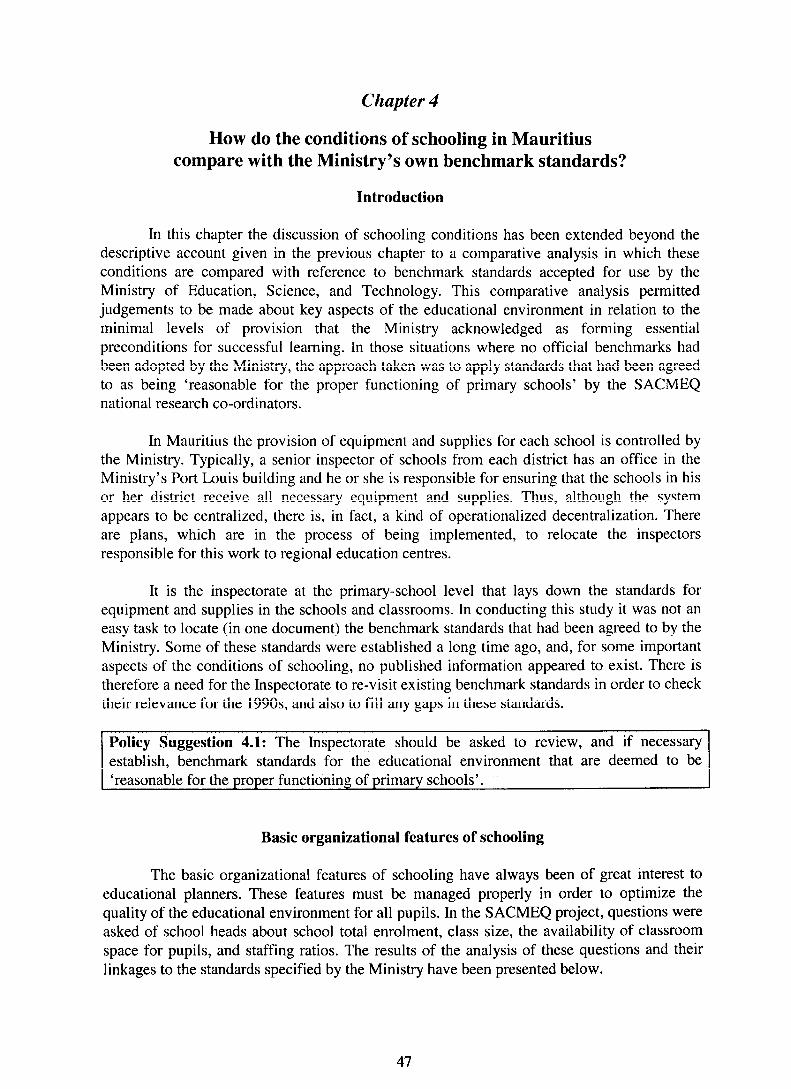
Chapter 4
How do the conditions of schooling in Mauritius compare with the Ministry’s own benchmark standards?
Introduction
In this chapter the discussion of schooling conditions has been extended beyond the descriptive account given in the previous chapter to a comparative analysis in which these conditions are compared with reference to benchmark standards accepted for use by the Ministry of Education, Science, and Technology. This comparative analysis permitted judgements to be made about key aspects of the educational environment in relation to the minimal levels of provision that the Ministry acknowledged as forming essential preconditions for successful learning. In those situations where no official benchmarks had been adopted by the Ministry, the approach taken was to apply standards that had been agreed to as being ‘reasonable for the proper functioning of primary schools’ by the SACMEQ national research co-ordinators.
In Mauritius the provision of equipment and supplies for each school is controlled by the Ministry. Typically, a senior inspector of schools from each district has an office in the Ministry’s Port Louis building and he or she is responsible for ensuring that the schools in his or her district receive all necessary equipment and supplies. Thus, although the system appears to be centralized, there is, in fact, a kind of operationalized decentralization. There are plans, which are in the process of being implemented, to relocate the inspectors responsible for this work to regional education centres.
It is the inspectorate at the primary-school level that lays down the standards for equipment and supplies in the schools and classrooms. In conducting this study it was not an easy task to locate (in one document) the benchmark standards that had been agreed to by the Ministry. Some of these standards were established a long time ago, and, for some important aspects of the conditions of schooling, no published information appeared to exist. There is therefore a need for the Inspectorate to re-visit existing benchmark standards in order to check their relevance for the 199Os, and also to fill any gaps in these standards.
Policy Suggestion 4.1: The Inspectorate should be asked to review, and if necessary establish, benchmark standards for the educational environment that are deemed to be ‘reasonable for the proper functioning of primary schools’.
Basic organizational features of schooling
The basic organizational features of schooling have always been of great interest to educational planners. These features must be managed properly in order to optimize the quality of the educational environment for all pupils. In the SACMEQ project, questions were asked of school heads about school total enrolment, class size, the availability of classroom space for pupils, and staffing ratios. The results of the analysis of these questions and their linkages to the standards specified by the Ministry have been presented below.
47

(a) Total school enrolment
There were no official guidelines on total school enrolment in Mauritius. However, consultations with several senior Ministry staff showed that there was broad ‘unofficial’ agreement that school size should be limited to ‘not more than 720 pupils’. This viewpoint on school size was based on the assumption that a ‘manageable’ school in the Mauritian context would be one with three classes at six levels with a maximum of 40 pupils per class.
The percentages of Grade 6 pupils that were attending Mauritius schools that satisfied the total school enrolment benchmark of 720 pupils have been listed for Mauritius and the 11 school districts in the first column of Table 4.1. For Mauritius overall, only 66.4 percent of Grade 6 pupils were in schools that satisfied the benchmark, and the percentages for most districts were in the range of 60 to 90 percent. The most noticeable district outliers were Lower Plaine Wilhems (53.3 percent) and Port Louis (46.7 percent). The results for these two districts deviated markedly from the general pattern elsewhere and therefore should be investigated in order to establish whether more schools need to be built in these two districts.
Policy Suggestion 4.2: The Planning Unit should examine the situation concerning large schools in Lower Plaine Wilhems and Port Louis - with the aim of establishing whether there is a need to build more schools in these two areas.
@I Cl ass size
The Ministry’s norm for class size was that ‘no more than 40 pupils should be in any one class’. The percentage of Grade 6 Pupils in classes that satisfied the Ministry’s class size benchmark have been listed in Table 4.1. The percentage relating to the benchmark for Mauritius overall was 79.1 percent. That is, over 20 percent of Grade 6 pupils were being taught in classes that were ‘overcrowded’ according to the Ministry’s own definition. This was a most disturbing result - and even more so in the districts of Port Louis, Pamplemousse and Upper Plaine Wilhems, where only around 65 to 70 percent of Grade 6 pupils were being taught in classes that satisfied the benchmark.
Policy Suggestion 4.3: The Staffing Branch should immediately consider staffing rearrangements to establish whether a reallocation, or further recruitment, of teaching staff can be employed to address the problem of the 20 percent of Grade 6 pupils being taught in overcrowded classes.
(c) Classroom space
The Ministry benchmark for classroom space was ‘ 1.2 square metres or more per pupil’. The number of square metres per pupil was calculated by dividing the total square metres available for classroom space in the school by the total school enrolment. In other SACMEQ countries the total school enrolment was replaced by the size of the largest shift attending the school. Fortunately, in Mauritius, there was only one shift and this simplified the calculations. It should be noted that this measure is probably an overestimate of the space per pupil because in any one classroom there are items of furniture (cupboards, bookshelves, teacher table and chair, movable blackboard, etc.) that take up a considerable amount of space.
48
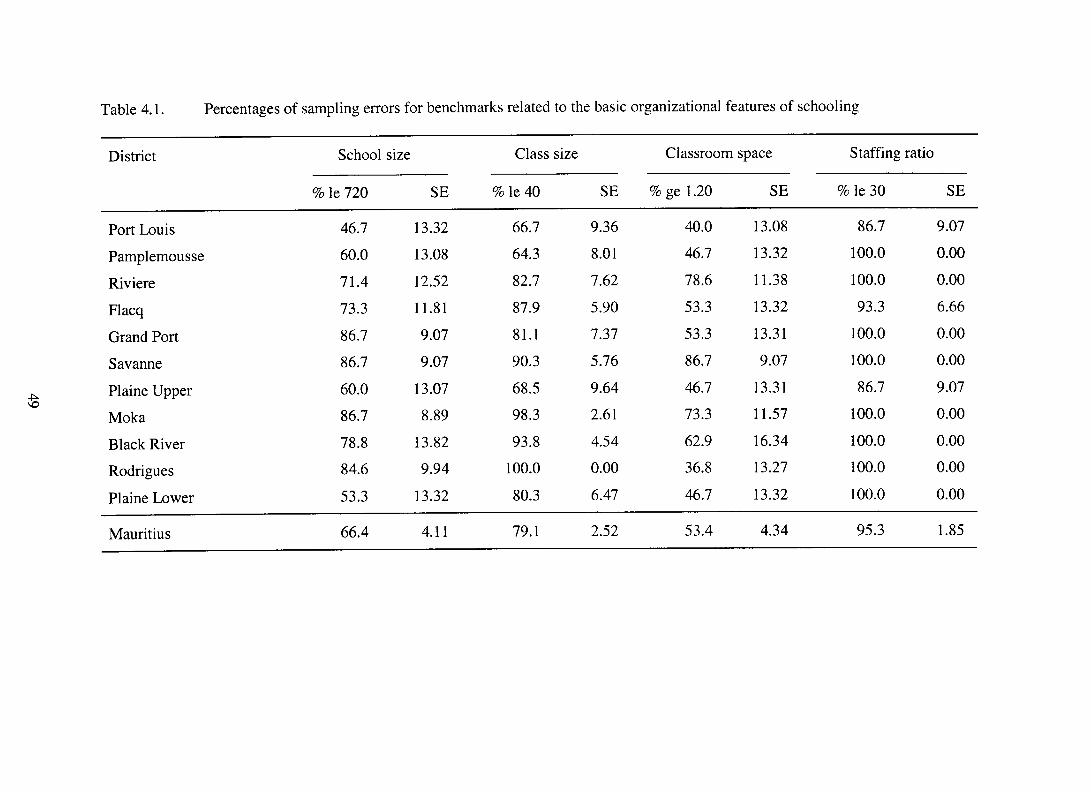
~;80\00000 0\000~0
0; d
ddddo;d

The percentage of Grade 6 pupils attending schools that satisfied the Ministry’s classroom space benchmark has been listed in Table 4.1. The percentage reaching the benchmark for Mauritius overall was 53.4 percent. That is, around half of the Grade 6 pupils were attending schools that had classroom space that was less than 1.2 square metres per pupil. Severe problems in this area were associated with five districts: Port Louis, Pamplemousse, Upper Plaine Wilhems, Rodrigues, and Lower Plaine Wilhems. Each of these districts had more than half of their Grade 6 pupils in schools that lacked acceptable levels of classroom space. The situation in Rodrigues was particularly poor, with only 36.8 percent of Grade 6 pupils being in schools that satisfied the classroom space benchmark.
Policy Suggestion 4.4: The Buildings Branch should be asked to undertake an audit of the schools where classroom space does not meet the Ministry standards and then prepare a long-term plan for the amelioration of this problem.
(d) Staffing ratio
The staffing ratio is often referred to as the pupil/teacher ratio. This measure should be distinguished from class size. For this study the staffing ratio was calculated as the total number of pupils in the school divided by the total number of full-time equivalent teachers posted at that school. In a sense it reflects the ‘wealth’ of the school in terms of the provision of teachers. The benchmark set by the Ministry for Mauritius was “a maximum of 30 pupils per teacher”.
The percentages of Grade 6 pupils in schools that satisfied the Ministry’s staffing ratio benchmark have been presented as the final variable in Table 4.1. The value for Mauritius overall was 95.3 percent. That is, almost all Grade 6 pupils were in schools that had a staffing ratio of 30 pupils to one teacher or better. This result was also reflected in the results for districts - with eight of them reaching 100 percent and three others reaching around 90 percent.
Classroom furniture and supplies
There were nine areas related to classroom furniture and classroom supplies that were employed in benchmark comparisons. The results of these analyses have been reported in Tables 4.2 and 4.3. There were no published benchmark levels in these two areas for Mauritius and therefore it was decided to apply the benchmarks that had been agreed to by the SACMEQ national research co-ordinators. These benchmarks were mostly derived from ‘common sense’ judgements concerning the minimal levels of provision that would be acceptable in most school systems of the Southern Africa sub-region. That is, the benchmarks tended to be rather low by world standards because they were derived as a consensus position by a group of educational planners who were working in relatively poor countries. It was therefore expected that, given the low levels of these figures, Grade 6 pupils in Mauritius would be attending schools that satisfied most, if not all, of these ‘SACMEQ benchmarks’.
(a) Classroom furniture
The percentage of Grade 6 pupils in classrooms satisfying the benchmark figures for three items of classroom furniture has been presented in Table 4.2. In the Mauritian context it
50

was expected that each pupil should have a sitting and a writing place (indicated by ‘one p.p.’ or ‘one per pupil’ in the table) and should also be in a class with at least one usable chalkboard (indicated by ‘one p.cl.’ or ‘one per class’ in the table).
Levels of provision for these three items were excellent for Mauritius overall, with 100.0 percent of Grade 6 pupils having their own sitting place, 100 percent having their own writing place, and 95 percent being in classrooms with a usable chalkboard. Given the universal availability of sitting and writing places for pupils it seemed rather strange to observe that some Grade 6 teachers have reported that there was no chalkboard in their classrooms. This result deserved closer scrutiny and should therefore be the subject of further examination.
Table 4.2. Percentages and sampling errors for benchmarks related to classroom furniture
District Sitting places Writing places Chalkboard (one p.p.) (one P.P.) (one p.cl.)
% SE % SE % SE
Port Louis 100.0 0.00 100.0 0.00 100.0 0.00
Pamplemousse 100.0 0.00 100.0 0.00 98.0 2.34
Riviere 100.0 0.00 100.0 0.00 97.7 3.00
Flacq 100.0 0.00 100.0 0.00 97.0 3.07
Grand Port 100.0 0.00 100.0 0.00 100.0 0.00
Savanne 100.0 0.00 100.0 0.00 100.0 0.00
Plaine Upper 100.0 0.00 100.0 0.00 100.0 0.00
Moka 100.0 0.00 100.0 0.00 100.0 0.00
Black River 100.0 0.00 100.0 0.00 100.0 0.00
Rodrigues 100.0 0.00 100.0 0.00 100.0 0.00
Plaine Lower 100.0 0.00 100.0 0.00 100.0 0.00
Mauritius 100.0 0.00 100.0 0.00 99.4 0.50
(b) Classroom supplies
The percentages of Grade 6 pupils in classrooms with supplies that satisfied the benchmark figures have been presented in Table 4.3. For five of these items the benchmark was one per pupil (indicated by ‘one p.p.’ in the table), and for the sixth, pencils, it was three per pupil (indicated by ‘three p.p.’ in the table).
51
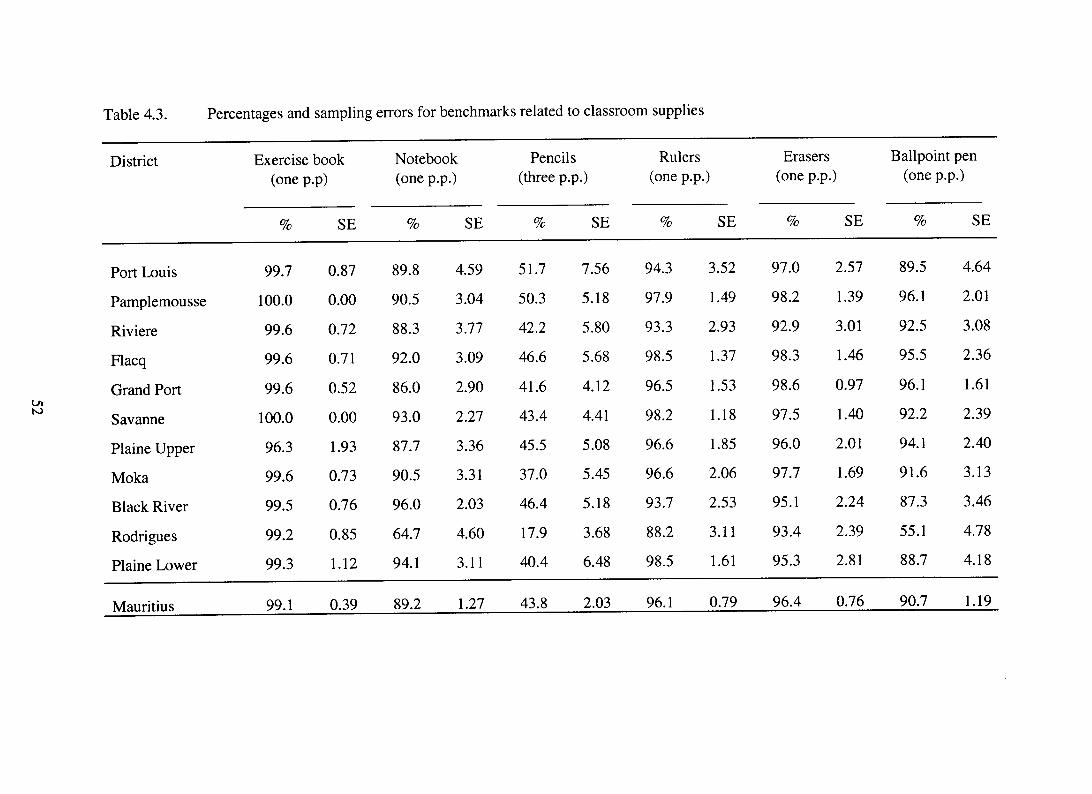
52

The overall pattern of provision for classroom supplies was quite good - with all items but one showing that around 90 to 100 percent of pupils had access to these essential tools for learning. The results for the pencils benchmark were quite low in all districts. However, further examination of the data showed that this was due to some pupils having one or two pencils and some pupils using a ballpoint pen rather than a pencil for their writing.
The one disturbing feature of the Grade 6 results for classroom supplies was the high percentage of Grade 6 pupils in Rodrigues that were in classrooms that did not satisfy the benchmark standards for either pencils or pens. This finding deserved immediate investigation because a lack of basic writing materials is a barrier to effective classroom learning.
Policy Suggestion 4.5: The Inspectorate should undertake an audit of the classroom-supplies situation in Rodrigues and suggest a means of addressing basic needs in this area.
Academic and professional qualifications of teachers and school heads
In Mauritius, all teachers and school heads are expected to have completed a minimum (excluding repeated years) of 11 years of primary and secondary education. The completion of this amount of schooling is a prerequisite for entering teacher training programmes, and therefore this level of education was accepted as the benchmark for both teachers and school heads.
For professional qualifications, a Grade 6 teacher must have completed two years of pre-service teacher training. However, in earlier years and in some special cases, it was possible for a few teachers to have received only one year of training. The benchmark for this area was therefore set at one year. On the other hand, school heads are all expected to have had the equivalent of two years of teacher training, combined with some part-time training in school management which can last for up to two years. The benchmark figure for school heads was therefore set at two years.
It is Ministry policy that teachers in Mauritius should have been involved in some form of in-service training. The normal expectation is that as a teacher’s career proceeds then he or she will be involved in up to four in-service courses. In order to take account of the younger Grade 6 teachers, who may not have had sufficient time to attend several in-service courses, it was decided to set the benchmark for this area at one in-service course.
The percentages of Grade 6 pupils in schools where their own teacher and the school head had reached the benchmark standards for academic and professional training have been presented in Table 4.4.
53

54

(a) Teacher qualifications
In Table 4.4 it may be seen that, with the exception of Rodrigues and Black River, all Grade 6 pupils were in schools where their teachers had completed both 11 grades of primary and secondary schooling and one year of teacher training. In Rodrigues around 8 percent of Grade 6 pupils were in schools where their teachers had not satisfied the benchmark for academic training, and in Black River a slightly smaller percentage had not satisfied the requirement for professional training. These figures were very pleasing and showed that the Ministry had attended successfully to the question of teacher training even though there had been a major expansion of enrolments at the Grade 6 level over the previous decade.
The situation with teacher in-service training was not quite as positive as it was for academic and professional training. At the national level there were 84.4 percent of Grade 6 pupils being taught by teachers who had satisfied the benchmark for in-service training. That is, around 15 percent of Grade 6 pupils were being taught by teachers who had never attended an in-service course.
From the figures in Table 4.4 it may be seen that there was an immediate need to review the situation concerning in-service training in certain districts. A most unsatisfactory situation has occurred in Pamplemousse, Riviere du Rempart, Flacq, Savanne, and Black River, where around 25 percent of Grade 6 pupils were being taught by teachers who have never attended a single in-service course.
Policy Suggestion 4.6: The Ministry should undertake an audit of teacher academic qualifications in Rodrigues and teacher professional qualifications in Black River and should then establish a strategy for improving the qualifications of teachers in these two districts.
Policy Suggestion 4.7: The Ministry should identify those teachers who have not yet received the required amount of exposure to in-service training and then plan, and implement, a series of in-service programmes to service these needs, with priority being given to districts where a large percentage of the teachers have never attended an in-service course.
(b) School head qualifications
The picture concerning school head academic qualifications was very pleasing - with all but one district having 100 percent of school heads reaching the benchmark. The exception was Rodrigues, where only 48.6 percent of school heads had completed at least 11 years of schooling. The figure for Rodrigues seemed completely out of alignment with the rest of the nation and should be investigated immediately by the Ministry.
Only 82.3 percent of Grade 6 pupils were attending schools where school heads had satisfied the benchmark for professional training. The lack of acceptable school head qualifications reached an alarming level in Port Louis, where only 53 percent of Grade 6 pupils were attending schools where school heads had adequate training.
Policy Suggestion 4.8: The Planning Unit should investigate why there appears to be such a large percentage of Grade 6 pupils attending schools in Rodrigues, where the academic qualifications of school heads do not meet the Ministry’s benchmark standards.
55
..--
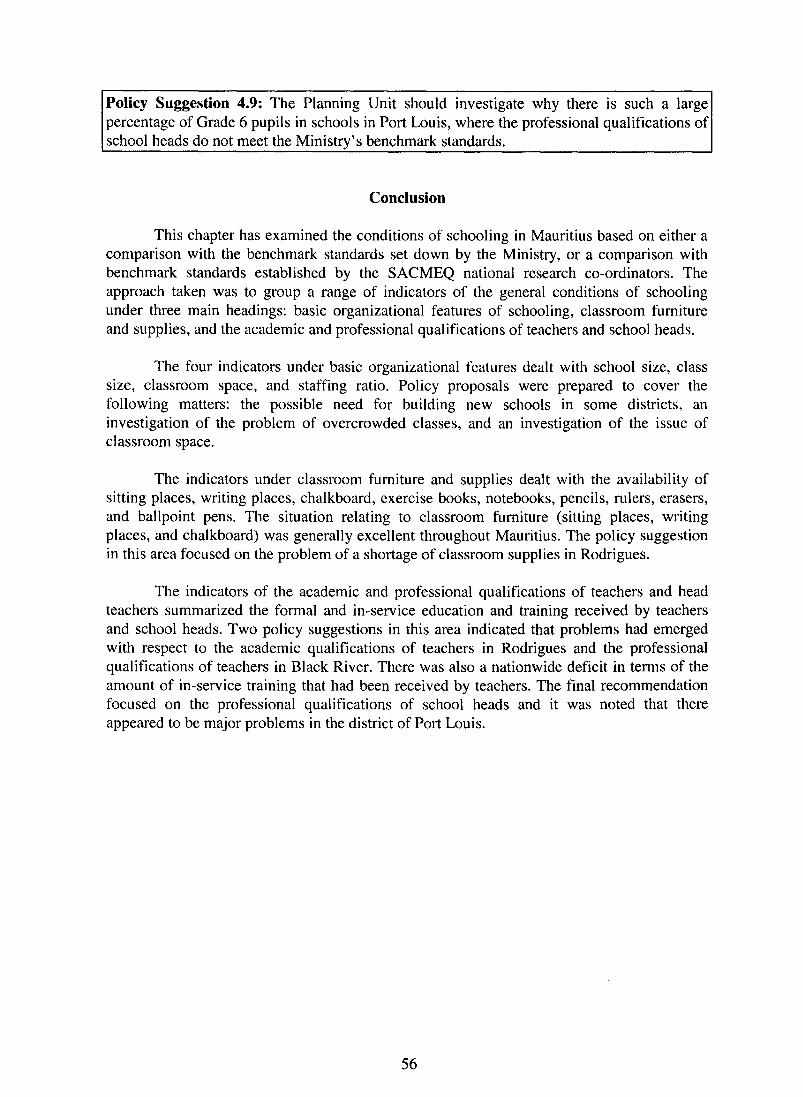
Policy Suggestion 4.9: The Planning Unit should investigate why there is such a large percentage of Grade 6 pupils in schools in Port Louis, where the professional qualifications of school heads do not meet the Ministrv’s benchmark standards.
Conclusion
This chapter has examined the conditions of schooling in Mauritius based on either a comparison with the benchmark standards set down by the Ministry, or a comparison with benchmark standards established by the SACMEQ national research co-ordinators. The approach taken was to group a range of indicators of the general conditions of schooling under three main headings: basic organizational features of schooling, classroom furniture and supplies, and the academic and professional qualifications of teachers and school heads.
The four indicators under basic organizational features dealt with school size, class size, classroom space, and staffing ratio. Policy proposals were prepared to cover the following matters: the possible need for building new schools in some districts, an investigation of the problem of overcrowded classes, and an investigation of the issue of classroom space.
The indicators under classroom furniture and supplies dealt with the availability of sitting places, writing places, chalkboard, exercise books, notebooks, pencils, rulers, erasers, and ballpoint pens. The situation relating to classroom furniture (sitting places, writing places, and chalkboard) was generally excellent throughout Mauritius. The policy suggestion in this area focused on the problem of a shortage of classroom supplies in Rodrigues.
The indicators of the academic and professional qualifications of teachers and head teachers summarized the formal and in-service education and training received by teachers and school heads. Two policy suggestions in this area indicated that problems had emerged with respect to the academic qualifications of teachers in Rodrigues and the professional qualifications of teachers in Black River. There was also a nationwide deficit in terms of the amount of in-service training that had been received by teachers. The final recommendation focused on the professional qualifications of school heads and it was noted that there appeared to be major problems in the district of Port Louis.
56
Chapter 5
Have educational inputs to primary schools in Mauritius been allocated in an equitable fashion?
Introduction
The educational goal of giving equality of educational opportunity to all pupils is an issue that goes far beyond giving every child access to school education. It also involves giving all those pupils who are in school an equal opportunity to learn. One way to do this is to ensure that there is an equitable distribution of educational resources among all schools. In Mauritius, this type of approach to resource allocation has been adopted as an official position in the hope that parents will be prepared to send their children to any school in the country because they accept that all schools will provide an equal chance for children to achieve to the best of their abilities.
In all school systems where the government wishes to take action to address the issue of equity, it is important to know the ‘location’ of differences or variations in resource inputs to schools. For example, it is important to know whether variations in resource inputs are more pronounced among districts, or whether they are larger among schools within districts. An answer to this type of question provides guidance concerning which resources are distributed evenly or unevenly, and at the same time suggests the level at which decisions must be taken (national or district) in order to address any major inequities that are observed.
In exploring questions of equity, it must be recognized that there is a need to examine allocation patterns in association with the actual levels of provision. Such information is necessary because it enables policy-makers to identify which resources require attention, and also to have some feeling for the amounts of supplementary resources that may be needed in order to achieve a more equitable distribution.
This chapter concentrates mainly on an examination of inequities in the distribution of educational resources and not upon absolute resource levels. Consequently the results presented in the chapter should be examined in conjunction with the results from the two previous chapters, which examined baseline and benchmark resource allocations.
Two approaches to the measurement of equity
(a) Variation among districts
A statistic called the coefficient of intraclass correlation (rho) may be used to divide the variation in resource inputs into two components: (a) among districts, and (b) among schools within districts. Rho can range from nearly zero to 1.00. When used in this way, rho is a ratio that measures the percentage of total variation among schools that can be attributed to variation among districts.
To appreciate the meaning of rho it is useful to consider two hypothetical schools systems: system A and system B. In school system A resources are allocated equally, or nearly equally, to all schools and therefore when one calculates average resource levels for
57

districts in the system one finds that these are more or less the same - except perhaps for some minor chance deviations. For such a school system, the value of rho would be close to zero because of the small variation among districts. In this situation most of the variation would be among schools within districts.
On the other hand, consider school system B where, because of administrative decisions, historical factors, or geographical differentiation of social class groups, etc., there are large variations among the districts. In this case the value of rho would be close to unity. The majority of the variation among schools in this case would be due to variations among districts and there would be little variation among schools within districts.
The above examples are two extremes that serve to illustrate the interpretation of rho. In using rho for policy discussion it is common practice to multiply the values of rho by 100 in order to present a more readable discussion about ‘percentage of variance’. For example, a rho of, say, 0.20 means that 80 percent of the variation is among schools within districts and 20 percent among districts. In contrast, a rho of 0.8 would indicate that 80 percent of the variation is among districts and 20 percent among schools within districts.
(b) Variation among schools within districts
It is also possible to quantify the differences among schools within a particular district by making a comparison with the variation among schools at the national level. This can be achieved by using the formula below:
Standard deviation for schools in a district x 100
Standard deviation for schools in the nation
The standard deviation of an indicator for a particular district measures the amount of variation among schools within that district, whereas the standard deviation for the whole country measures the amount of variation among schools for the nation. The ratio of the standard deviation of an indicator for a district to the standard deviation for the nation, expressed as a percentage, provides a measure of the degree of equity within a district compared with the national picture.
To illustrate the interpretation of these ratio values it is helpful to consider two hypothetical districts: District A and District B. Assume that the levels of a resource are measured by an indicator that has a ratio value of 50 percent for District A and 150 percent for District B. This figure would mean that the variation in resource levels among schools in District A is 50 percent less than the variation in resource levels among schools for the whole nation; and the variation in District B is 50 percent higher than for the nation. From these ratio values it can be said that, compared with the national picture, there has been an equitable allocation among schools within District A. In contrast, the Ministry should be concerned about district B because there is clear evidence of major inequities among schools in District B when compared with differences among schools for the whole country.
58

Equity calculations for material resource inputs
In the final column of figures in Table 5. I values of rho (multiplied by 100) have been presented. These figures provide a measure of the variation among districts. For all variables considered in this table, the values of rho were very small - which indicated that there was very little variation (from around 0 to 5 percent) between districts, and that most of the variation (from around 95 to 100 percent) was among schools within districts.
From the previous two chapters we have observed that the general level of the inputs listed in Table 5.1 was, with a few exceptions, mostly quite reasonable. Taking this into consideration with the values of rho in Table 5.1 leads to the conclusion that the Ministry has been successful in establishing reasonably adequate levels of material inputs to schools, and also in ensuring that there has been an equitable distribution of these inputs among districts.
The first 11 columns of figures in Table 5.1 show the standard deviation among schools within each district expressed as a percentage of the standard deviation among schools at the national level. For example, the value of 77.9 percent for Port Louis (district 1) on the Index of classroom furniture showed that the variation among schools in Port Louis on this index was around 22 percent less than the variation among schools for the nation as a whole . In contrast, the value of 126.5 percent for the same index in Rodrigues (district 10) showed that the opposite situation applied - with the variation being around 27 percent higher within Rodrigues than for the national picture.
Only Black River (district 9) fell below 100 percent for all of the material resources in the list. This indicated that, when compared with the national picture, there had been an equitable allocation of the material resources listed in Table 5.1 among schools in Black River. This general pattern of equitable distribution of material resources was also evident in Pamplemousse (district 2) and Grand Port (district 5) where the figures fell below 100 percent for all but one of the material resources.
On the other hand, Flacq (district 4) Moka (district 8) and Rodrigues (district 10) had values of over 100 for five of the material resources. For these three districts the most extreme variations among schools districts was in Moka (district S), where standard deviation ratios far in excess of 120 were obtained for the Classroom furniture index, Classroom supplies index, Classroom space, and Teacher housing quality. Figures in excess of 120 were also identified in Riviere du Rempart (district 3) for Classroom supplies index, Savanne (district 6) for Teacher housing quality, and Rodrigues (district 10) for Classroom furniture index.
These results should be subjected to intensive review by the Ministry. The situation in Moka seems to be quite serious, with a number of major inequities occurring among schools.
Policy Suggestion 5.1: The Planning Unit should undertake an investigation into why the allocation of material resource inputs among schools in the district of Moka is so unequal for so many inputs.
Policy Suggestion 5.2: The Planning Unit should undertake an investigation of the specific instances of unequal allocation of material resource inputs that were identified for Riviere du Rempart, Savanne and Rodrigues.
59

\o d:
9 0 3 ti
0 d: 60

Equity calculations for human resource inputs
In Table 5.2 the results have been presented for the assessment of equity in human resource inputs (a) among schools within districts, and (b) among districts. In the final column of figures in Table 5.2 values of rho (multiplied by 100) have been listed. These figures provided a measure of the variation among districts. In comparison with Table 5.1 the values of rho were much higher, which showed that there was substantial variation among districts with respect to a number of variables describing the distribution of human resources.
For example, the rho values for Teacher experience, School head academic qualifications, and Inspectors’ visits to schools, illustrated that around 25 percent of the variation among schools for these three human resource inputs could be attributed to differences among districts. In addition, when compared with the results for material resource inputs to schools, there were relatively large values in the range of 15 to 19 percent or more recorded for Teacher academic qualifications, School head experience, and Pupil/teacher ratio. The results gave a clear indication that the allocation of human resource inputs among districts was generally much more unequal when taken in comparison with material resource inputs. This general trend was most pronounced with respect to Teacher experience, School head academic qualifications, and Inspectors’ visits to schools.
Policy Suggestion 5.3: The Ministry should undertake an investigation into why the allocation of certain human resource inputs (particularly Teacher experience, School head academic qualifications, and Inspectors’ visits to schools) among districts is so unequal when contrasted with the allocation of material resource inputs.
The most extreme variations among schools within districts were found for the following districts and human resource inputs: Rodrigues (district 10) for School head academic qualifications and School head experience, Moka (district 8) for School head experience, Upper Plaine Wilhems (district 7) for both Teacher and School head professional qualification and Pupil/teacher ratio, Savanne (district 6) for both Teacher and School head professional qualification, Grand Port (district 5) for Teacher professional qualifications, and Flacq (district 4) for Pupil/teacher ratio. Clearly, the Ministry needs to investigate all of these results and to establish mechanisms for addressing the related inequalities within districts.
It is important to remember that when material inputs to schools have reached a satisfactory level and equity among districts has been achieved, then it is the human resources that begin to play a role in influencing pupil learning and achievement. The reallocation of human resources is much more difficult than dealing with material resources - which tend to be a matter of money. For example, it is not easy to persuade teachers with better qualifica- tions and more experience to go to outer islands and distant schools. The same is true in trying to move school heads with more experience. It will require a good deal of ingenuity on the part of the Ministry to deal with this problem and thereby improve the equity situation.
Policy Suggestion 5.4: The Ministry should undertake an investigation of the specific instances of unequal allocation of human resource inputs that were identified within certain districts.
61

62
Conclusion
This chapter has explored the concept of equity of resource allocation for certain material and human resources and along two main dimensions of variation (among districts and among schools within districts). The general picture that emerged for the ‘among districts’ dimension of variation showed that the Ministry had achieved a relatively equitable situation across districts for a range of material resource inputs. In contrast, it was found that there was considerable inequity across districts for a range of human resource inputs. A policy suggestion was therefore put forward to undertake a more detailed investigation into why these two contrasting situations had arisen. It was also pointed out that, whereas money alone could often improve a situation of inequity for material resources, the movement of people in order to obtain a more equitable allocation of human resources was quite difficult.
The analyses undertaken to examine equity along the ‘among schools within districts’ dimension showed a scattered pattern of inequities. That is, different districts showed inequitable allocation for different material and human resource inputs. The one consistent finding here was that the district of Moka stood out, with a large degree of variation among schools for many of the material resource inputs. The policy suggestions in this instance firstly called for an investigation into why this was the case in Moka, and secondly an investigation into the specific instances of unequal allocation of both material and human resources for particular districts.
63

Chapter 6
What is the level of reading for Grade 6 pupils overall and in the three domains of reading literacy?
Introduction
This chapter seeks to answer the following question: what is the level of reading for Grade 6 pupils overall and in the three domains of reading literacy? The question is addressed by initially presenting a brief explanation of the structure and content of the test that was used to assess the reading performance of Grade 6 pupils in Mauritius. This is followed by a description of how the reading specialists of the Ministry of Education, Science, and Technology identified the cut-off scores on the test which corresponded to ‘minimum’ and ‘desirable’ levels of reading achievement. The results for the percentages of pupils achieving the minimum and desirable levels of mastery are then presented. The chapter concludes with an examination of pupil performance in three key domains of reading literacy: narrative, expository and documents.
The structure of the reading test
The reading test was constructed as a team research project by the SACMEQ national research co-ordinators. The test was designed to provide a valid measure of basic literacy skills for Grade 6 pupils - not only in Mauritius but also in the other countries participating in SACMEQ’s initial project. The test items were constructed so as to conform to the reading syllabi for Grade 6 in the different countries. Reading specialists in the different countries also reviewed the items in order to eliminate items that were unsuitable due to content, language, and cultural bias. The items were trial-tested and a final test of 59 items was assembled after a comprehensive analysis of (a) the psychometric characteristics of the items, and (b) the balance of the test across the main reading content and reading skill areas. The 59 items covered the three main domains of reading as described in Chapter 2: narrative (21 items), expository (23 items), and documents (15 items).
In Table 6.2 the structure of the reading test has been summarized. In the first column the names of the topics used for the passages in the reading test have been listed followed by an indication of the dimension in which the topic was located. In the next three columns the passage has been allocated to one of the three dimensions of reading. In the final two columns the total number of questions for each topic and the number of questions that were nominated as being ‘essential’ according to the procedures outlined below have been given. For example, the topic of the first passage in the test was a story about a little boy called Tembo. This was a narrative passage which was linked to a total of five questions of which four were considered essential.
64

The construction of six reading test scores
(a) The total score on the 44 essential items
The first score that was constructed was a total test score on the 44 essential items that composed the test. Pupils were given a score of ‘ 1’ for each correct item and ‘0’ for each incorrect item - the total score was then calculated as the sum of these values.
Table 6.1. The structure of the reading test (topics, dimensions, total questions, and essential questions)
Reading test topics Dimension Total questions Essential questions
N E D
Tembo
Bird
Island
Joseph
Oranges
Maria
Quicksand
Empty bottles
Carrots
Temperature
Maize
Grandpa
Tree
J
J
J
J
J
J
J
J
J
J
J
J
J
5 4
5 2
4 4
5 5
4 4
3 2
3 2
4 3
5 4
4 4
6 4
6 6
5 0
21 23 15 59 44
Note: N = narrative, E = expository, and D = documents.
(b) Two mastery scores based on standards set by the Ministry reading specialists and Grade 6 reading teachers
Two ‘mastery’ scores were constructed from a subset of 44 ‘essential’ items selected from the 59 test items that had been completed by all Grade 6 pupils. The subset of essential 44 items was selected by a panel comprising a group of four experienced Grade 6 teachers,
65

two of the Ministry’s reading specialists (from the Primary Inspectorate), and the Mauritius National Research Co-ordinator. The panel was assigned the task of reading through the passages in the pupil test and the accompanying test items with a view to identifying those items which they deemed to be “essential for Grade 6 pupils in Mauritius to master if they were to commence a successful year of study at secondary school level”.
The panel then agreed on what would be a ‘minimum’ level and a ‘desirable’ level of performance on these 44 essential test items. To achieve the minimum level of performance a pupil was required to obtain correct answers for 24 of the 44 items. To achieve the desirable level of performance a pupil was expected to obtain correct answers for 34 of the 44 items. Thus the first and second test scores were dichotomous designations of mastery at two levels of performance.
It is extremely important to note here that all of this work was completed before the data had been collected and processed. That is, the minimum and desirable performance standards were based on the professional knowledge and experience of Mauritian reading specialists - and not on the (commonly used but somewhat arbitrary) approach of selecting cut-off points after an inspection of the distribution of reading scores.
(c) Three sub-scale scores based on three sub-dimensions of reading
A further three test scores were based on the three sub-dimensions described above. That is, the total pool of 59 items was split into three subsets: Narrative (21 items); Expository (23 items); and Documents (15 items) and pupil scores were calculated for each subset.
Analyses of mastery levels
The mean scores for the 44 essential test items and their sampling errors have been presented for each district and Mauritius overall in Table 6.2. This has been followed by the percentages of pupils reaching the minimum and desirable levels of mastery in reading.
The mean score on the essential items of the reading test for Mauritius was 25.1 out of a maximum possible score of 44. This level of performance was much lower than had been expected because (a) every effort had been made during the test construction procedures to design the test to suit the skills of the average Grade 6 pupil, and (b) the 44 essential items had been selected by Mauritian reading specialists because of their relevance in Mauritius with respect to further study at secondary-school level. The mean scores varied markedly between districts - from very low mean scores of 18.9 in Black River and 19.7 in Rodrigues, up to higher mean scores of 27.2 in Flacq and 28.0 in Upper Plaine Wilhems.
The information presented in Table 6.2 concerning minimum and desirable levels of mastery provided an opportunity to generalize for the population of all Grade 6 pupils with respect to the performance standards set down by the Ministry’s own reading experts. To illustrate, consider the two figures of 52.8 percent and 26.7 percent in Table 6.2 for the overall percentage of Mauritian pupils reaching minimum and desirable levels of mastery.
66

Using these overall figures and their associated standard errors, it was possible to make the following statements about the reading performance of the total population of Grade 6 pupils in Mauritius:
(a) The percentage of the total population of Grade 6 pupils in Mauritius that reached the minimum level of mastery in the reading test was (with 95 percent confidence) located between 52.8 * 2( 1.88) percent. That is, between 49.0 percent and 56.6 percent.
(b) The percentage of the total population of Grade 6 pupils in Mauritius that reached the desirable level of mastery in the reading test was ( with 95 percent confidence) located between 26.7 k 2( 1.71) percent. That is, between 23.3 percent and 30.1 percent.
These figures may be looked at in another way by subtracting the percentages from 100 percent in order to calculate the percentages of pupils who have not reached the minimum or desirable mastery levels. Thus, we may be very confident that between 43.4 percent and 5 1 .O percent of Grade 6 pupils have not reached the minimum level of mastery; and we may be very confident that between 69.9 percent and 76.7 percent of Grade 6 pupils have not reached the desirable levels.
Table 6.2. Mean performance on 44 essential items and percentages of pupils reaching minimum and desirable levels of mastery
District Performance on 44 essential items
Mean SE
Percentage reaching Percentage reaching minimum level of desirable level of mastery mastery
% SE % SE
Port Louis 25.9 1.75 54.6 7.14 30.0 6.25
Pamplemousse 22.5 1.09 41.6 4.73 20.2 3.83
Riviere 24.5 1.18 52.8 5.38 22.7 4.88
Flacq 27.2 1.30 62.0 5.56 33.7 4.29
Grand Port 23.1 0.84 48.7 3.57 20.2 3.91
Savanne 23.0 0.88 42.7 4.62 16.7 2.80
Plaine Upper 28.0 1.06 64.4 4.37 36.6 4.68
Moka 24.6 1.18 51.8 5.92 24.5 4.17
Black River 18.9 0.90 28.1 4.90 5.8 1.97
Rodrigues 19.7 1.03 30.4 4.06 5.5 1.72
Plaine Lower 26.8 1.45 58.0 6.22 34.1 6.00
Mauritius 25.1 0.44 52.8 1.88 26.7 1.71
67
These results presented a very gloomy picture concerning the reading performance of Grade 6 pupils in Mauritius. By converting the percentages into ‘counts’ it was possible to obtain a numerical picture of the problems facing the Mauritian primary education system. To illustrate, since we know that in 1995 there were 27,849 Grade 6 pupils in Mauritius, then we can be quite confident in saying that between 12,086 pupils (43.4 percent) and 14,203 pupils (51 .O percent) had not reached the minimum level of mastery in reading. Further, between 19,466 pupils (69.9 percent) and 21,360 pupils (76.7 percent) had not reached the desirable level of mastery in reading.
These figures highlight the need for a review of Ministry policy concerning the acquisition of literacy skills at the upper end of the primary school system. Many reasons could be advanced to explain why the performance of Grade 6 pupils was so poor. For example, perhaps there were problems with the academic and teaching skills of the teachers, perhaps there have been difficulties in providing the basic inputs to education, or perhaps much of the explanation was linked to the home characteristics of the pupils. In a later chapter of this report an attempt has been made to identify some of the more important of these factors and to bring forward some related policy suggestions.
Policy Suggestion 6.1: The Ministry should establish a Reading Literacy Task Force at the primary school level in order to undertake a comprehensive investigation into why the reading skills of Grade 6 pupils in Mauritius are so poor in comparison with the ‘minimum’ and ‘desirable’ performance standards set down by the Mauritian reading specialists.
The generally disappointing overall performance of Grade 6 pupils was not replicated in the same manner for each district, The best performance came from the pupils in the Upper Plaine Wilhems region, with 64.4 percent of the pupils reaching the minimum mastery level and 36.6 percent reaching the desirable level. The second-best achievement came from pupils in the Flacq district, where 62 percent of pupils reached the minimum level and 33.7 percent reached the desirable level. At the other extreme, the Grade 6 pupils in Black River and Rodrigues performed at levels that can only be considered disastrous. In these two districts around 70 percent of Grade 6 pupils had not reached the minimum level of performance, and 95 percent of pupils had not reached the desirable level.
The differences between districts in performance that have been listed in Table 6.2 need to be interpreted in association with the appropriate values of the standard error of sampling. However, even when taking these values into account, the gaps between Upper Plaine Wilhems, at the top, and the two districts of Black River and Rodrigues were extremely large - at around 30 percent of pupils at both the minimum and desirable mastery levels.
From the results reported above it can be concluded that the reading literacy levels of Grade 6 pupils in Mauritius in 1995 were poor when judged against the mastery standards set down by the Ministry’s own experts. The poor performance of Grade 6 pupils occurred in most districts - with only moderate levels of success being achieved in Upper Plaine Wilhems and Flacq. The performances of Grade 6 pupils in Black River and Rodrigues suggest that an educational crisis point has been reached for which only a major educational intervention would be appropriate.
68

Policy Suggestion 6.2: The Ministry should undertake an investigation into the wide variation among districts with respect to the mastery of basic literacy at the Grade 6 level, taking into account the extremely poor performance of pupils in Black River and Rodrigues.
It is interesting to make a comparison between the performance of Grade 6 pupils in the SACMEQ test and their performance in the Certificate of Primary Education Examination (CPE). In 1995 the pass rate for the CPE was 67 percent. Taking this figure into account along with the research results presented above, suggests that it is quite possible that reasonably large numbers of Grade 6 pupils, who can only be judged to be ‘illiterate’ according to standards set by the Ministry’s own experts, are being awarded pass results in the CPE examination. This, again, is a cause for concern and implies that a rigorous investigation be made into a number of questions concerning the assessment percentages used for the CPE. For example: are the CPE pass marks being set according to some arbitrating process that aims to allow approximately the same percentage of pupils to pass each year? Are the CPE examination items subjected to a comprehensive statistical analysis? Are the CPE ‘pass’ levels being defined (a) b+re the examination scores are available, and (b) according to justifiable standards by recognized subject-matter experts?
Another issue that needs to be addressed by the Ministry is to establish exactly ‘where’ the pupils had problems on the 59-item SACMEQ reading test. This will require the Curriculum Branch to examine the item analysis statistics and to sort the items into three broad groups: those where the students had ‘no problems’, those that the students found ‘rather difficult’, and those that the students found ‘very difficult’. A second analysis is then required of the precise reading skills that are required to address those second two problem areas. This analysis should provide clues as to which area of the reading curriculum is being poorly addressed by the existing teaching programme, and also lead to some suggestions concerning whether the solution to these problems is to be found in improving the teaching materials, the teaching practices, or perhaps both.
Policy Suggestion 6.3: The Curriculum Branch should be asked to examine pupil performance on each of the 59 items of the reading test in order to identify those aspects of the teaching of reading that need to be reviewed and/or improved.
Analysis of mastery levels for sub-groups
In Table 6.3 the results for the minimum and desirable levels of mastery for certain sub-groups of pupils have been presented. The first sub-groups to be examined were boys and girls. Then socio-economic groups (based on a measure of the number of possessions in pupils homes) were considered and, finally, sub-groups defined by school location.
A higher percentage of girls, 56.4 percent, than boys, 49.4 percent, reached the minimum mastery level and the same pattern was true for the desirable level of mastery - although the percentage difference between boys and girls was not as large at the higher level.
This research finding was most interesting and it has encouraged the SACMEQ national research co-ordinators to look at this area in more detail. For example, further data analyses need to be undertaken in order to determine whether the gap in reading performance
69
between boys and girls that has occurred for Mauritius is the same, smaller, or reversed in the other SACMEQ countries.
A list of ‘possessions in the home’, as described in Chapter 3, was used as a surrogate measure of the socio-economic circumstances of the homes from which the pupils came. Each pupil was given a score from 0 to 14 depending upon the number of possessions located in his or her home. A ‘very low’ socio-economic level was defined for those pupils coming from homes having eight or fewer possessions; the ‘low’ level as nine possessions; the ‘moderately low’ level as 10 possessions; the ‘moderately high’ level as 11 possessions; the ‘high’ level as 12 possessions; and the ‘very high’ level as 13 or 14 possessions. It may be seen from the final column of Table 6.3 that this classification divided the total sample of 2,919 pupils into six groups ranging in size from around 370 to 570 pupils.
There was only 32.4 percent of children in the ‘very low’ socio-economic group who reached minimum mastery and very few of them, around 12 percent, reached the desirable level. The percentage of children reaching the minimum mastery level rose dramatically as the socio-economic levels ascended. A particularly striking feature of this table was that the percentage of pupils reaching minimum mastery was more than twice as high for the ‘very high’ socio-economic level as it was for the ‘very low’ socio-economic level. Further, for the desirable mastery results, this difference between the two socio-economic groups rose to a factor of four!
70
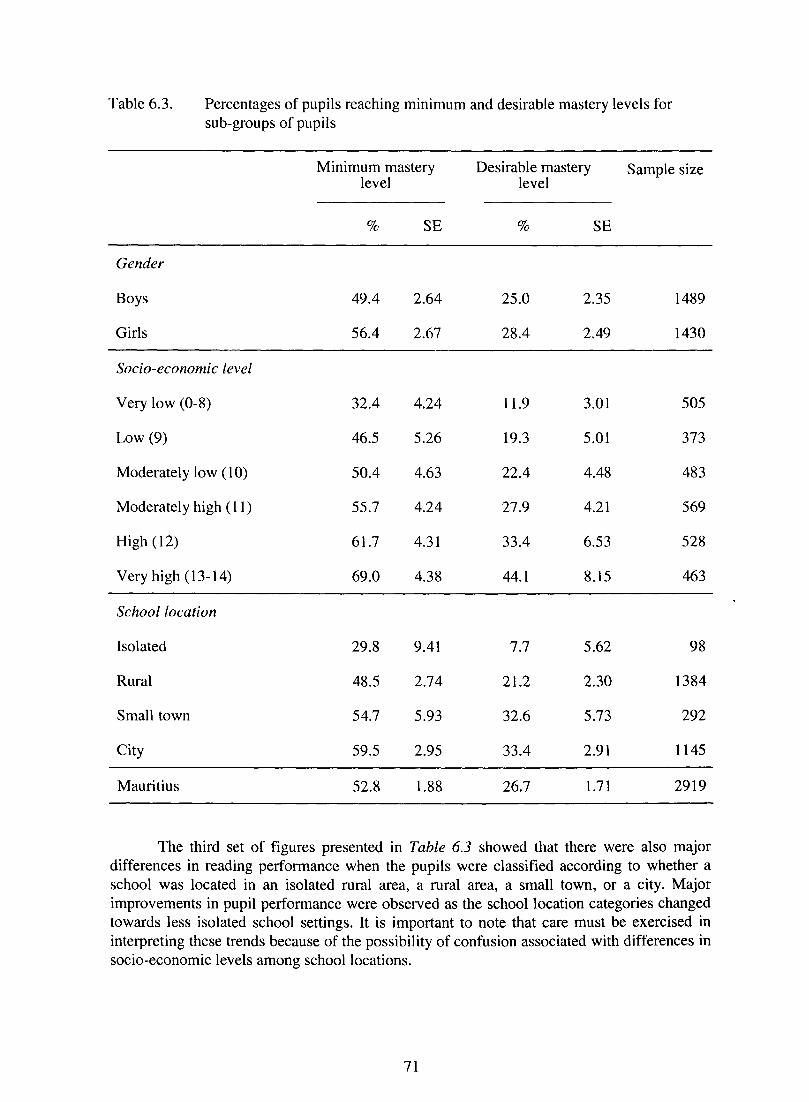
Table 6.3. Percentages of pupils reaching minimum and desirable mastery levels for sub-groups of pupils
Minimum mastery Desirable mastery level level
Sample size
% SE % SE
Gender
Boys
Girls
49.4 2.64 25.0 2.35 1489
56.4 2.67 28.4 2.49 1430
Socio-economic level
Very low (O-8)
Low (9)
Moderately low (10)
Moderately high ( 11)
High (12)
Very high (13- 14)
32.4 4.24 11.9 3.01 505
46.5 5.26 19.3 5.01 373
50.4 4.63 22.4 4.48 483
55.7 4.24 27.9 4.21 569
61.7 4.31 33.4 6.53 528
69.0 4.38 44.1 8.15 463
School location
Isolated
Rural
Small town
City
29.8 9.41 7.7 5.62 98
48.5 2.74 21.2 2.30 1384
54.7 5.93 32.6 5.73 292
59.5 2.95 33.4 2.91 1145
Mauritius 52.8 1.88 26.7 1.71 2919
The third set of figures presented in Table 6.3 showed that there were also major differences in reading performance when the pupils were classified according to whether a school was located in an isolated rural area, a rural area, a small town, or a city. Major improvements in pupil performance were observed as the school location categories changed towards less isolated school settings. It is important to note that care must be exercised in interpreting these trends because of the possibility of confusion associated with differences in socio-economic levels among school locations.
71
- -

Analysis of narrative, expository, and document sub-scales
As described above, there were three sub-scales that made up the literacy test: Narrative (21 items); Expository (23 items); and Documents (15 items). In Table 6.4 the mean scores and sampling errors on each of the three dimensions of reading have been presented.
Table 6.4. The means and sampling errors of pupils on the three dimensions of reading achievement
Narrative Expository Document Total test
(21 items) (23 items) (15 items) (59 items)
Mean SE Mean SE Mean SE Mean SE
Port Louis 12.1 0.66 11.4 0.66 9.0 0.43 32.6 1.64
Pamplemousse 10.8 0.85 9.7 0.79 7.9 0.55 28.3 2.01
Riviere 11.9 0.81 10.5 0.75 8.1 0.53 30.5 1.94
Flacq 13.2 0.76 12.2 0.73 9.4 0.53 34.7 1.88
Grand Port 11.0 0.76 10.0 0.70 8.0 0.54 29.0 1.86
Savanne 10.7 0.96 9.6 0.87 8.2 0.67 28.5 2.28
Plaine Upper 13.9 0.64 12.0 0.63 9.7 0.41 35.5 1.55
Moka 11.9 1.02 10.6 0.93 8.5 0.71 31.0 2.45
Black River 8.8 0.95 7.8 0.99 6.6 0.77 23.2 2.35
Rodrigues 9.3 0.97 8.4 0.79 6.9 0.64 24.6 2.12
Plaine Lower 12.9 0.66 11.6 0.61 9.5 0.43 34.0 1.60
Mauritius 12.1 0.25 10.9 0.23 8.7 0.17 31.6 0.60
Each sub-scale had different numbers of items and therefore a summary overall comparative picture was obtained at the national level by converting the average scores into percentages. The overall situation for Mauritius was as follows: in the Narrative sub-scale 57.6 percent (12.1 out of 21 items) of responses were correct, in the Expository sub-scale 47.4 percent (10.9 out of 23 items) of responses were correct, and in the Document sub-scale 58 percent (8.7 out of 15 items) of responses were correct. Given the lower mean level of pupil performance for expository reading, it might be asked if the time spent on learning to read and comprehend expository prose in the curriculum and textbooks should be increased.
The general pattern of achievement on the sub-scales described in Table 6.4 follow a similar pattern to the results on mastery levels presented in Table 6.2. Grade 6 pupils in the
72

district of Upper Plaine Wilhems fared best on two sub-scales and second best on the other, whereas the districts of Black River and Rodrigues showed the poorest performances for all three sub-scales.
In Table 6.5 the narrative, expository, and document scores have been presented for the sub-groups listed in Tables 6.3 and 6.4. For the sub-scales, the same pattern of results emerged, as was evident from the analysis of minimum and desirable mastery levels.
Table 6.5. Means and sampling errors of different sub-groups of pupils
Sub-groups Narrative Expository Documents
Mean SE Mean SE Mean SE
Gender
Buys
Girls
Socio-economic level
Very low (O-8)
Low (9)
Moderately low (10)
Moderately high (11)
High (12)
Very high (13- 14)
School location
Isolated
Rural
Small town
City
11.7 0.35 10.5 0.33 8.6 0.23
12.4 0.35 11.2 0.33 8.8 0.23
9.6 0.54 8.9 0.48 6.9 0.37
11.3 0.63 10.0 0.60 8.4 0.43
11.6 0.59 10.3 0.53 8.5 0.38
12.3 0.55 11.1 0.53 8.7 0.38
13.1 0.59 12.0 0.57 9.4 0.37
14.2 0.63 12.6 0.64 10.3 0.40
9.6 1.07 8.6 1.01 6.9 0.73
11.3 0.35 10.3 0.32 8.1 0.23
12.8 0.79 11.0 0.71 8.9 0.54
13.0 0.41 11.7 0.40 9.5 0.26
Mauritius 12.1 0.25 10.9 0.23 8.7 0.17
There was a tendency for girls to have a slightly higher score than boys for each of the three reading domains, but given the magnitude of the sampling errors they were not significantly different. The pupils from higher socio-economic backgrounds had much higher scores in each domain than pupils from lower socio-economic backgrounds. Finally, pupils from small towns and cities had similar scores, and these ‘urban’ pupils scored higher than pupils from rural areas who, in turn, scored higher than pupils from isolated areas.
In the above discussion the reading performance of various sub-groups of pupils has been examined. However, a critical question in such an examination is to consider to what extent the patterns of differences among the sub-groups are stable or changing over time?
73

For example: is the superior performance of girls over boys consistent - or is it expanding or contracting with time ? Will the emerging improved economic conditions result in a reduction of performance disparities among socio-economic groups and among various school locations? These are all very important questions as Mauritius seeks to emerge as a stable and economically successful nation in the next century.
In order to have access to the information required to answer these kinds of important questions about the quality of education in Mauritius, it will be necessary for the Ministry to begin planning now for the establishment of a strong and comprehensive database related to literacy levels in primary schools.
Policy Suggestion 6.4: The Ministry should design and implement a continuous system for monitoring literacy levels in primary schools which should feature a detailed analysis of sub- groups of students broken down by variables such as district, gender, socio-economic level, and school location.
Conclusion
This chapter has undertaken a detailed examination of the reading literacy levels of Grade 6 pupils in Mauritius. Two key points concerning this examination need to be restated: (a) the test that was used to assess Grade 6 literacy levels was prepared in a scientific manner so as to ensure its validity for this purpose, and (b) the ‘minimum’ and ‘desirable’ performance levels were specified by Mauritian reading specialists before the data were collected and analyzed.
These two key points, when taken in combination with the overall poor performance of the pupils in Mauritius and the extremely poor performance of certain sub-groups of pupils, suggest that the time has come for a searching review of the quality of the reading curriculum and the quality of the teachers and their teaching methods. Several starting points have already been put forward as policy suggestions in this chapter. However, the magnitude of the challenge suggests that a serious attack on this area will require the Ministry to undertake some serious research in order to identify appropriate solutions, and then to allocate sufficient resources to develop strategies for implementing those solutions.
74
Chapter 7
Which educational inputs to primary schools in Mauritius have most impact on the reading literacy achievement of Grade 6 pupils?
Introduction
This chapter seeks to identify educational inputs related to home, school, and school- system factors that have most impact on the reading literacy levels of Grade 6 pupils. The first section of the chapter summarizes the degree to which these factors, taken individually, are related to pupil literacy levels. The second section presents an analysis of the effects of certain educational input factors after controlling for the simultaneous impact of several important home-context factors. The third section focuses on the implications that these analyses have for educational policy and then offers suggestions for interventions by the Ministry of Education.
Educational inputs and pupil achievement
The search for factors which ‘explain’ pupil performance is a complex process which must be pursued both inside and outside the classroom. Although many factors in the educational environment have some influence on pupils’ achievement, it is widely known that, in most societies, pupils from wealthier homes who have well-educated parents tend to go to schools with pupils from similar home backgrounds, and their schools are usually relatively well resourced. Similarly, children from poorer homes who have less-educated parents tend to go to school with pupils from similar home backgrounds, and their schools usually have limited educational resources. Given these social patterns, the main challenge of studies of the effects of schooling is to make some attempt to disentangle the overlapping effects of home and school factors on educational outcomes. One can commence to explore these issues by applying multivariate statistical procedures in order to assess the impact of single factors after controlling for the simultaneous effects of others. In this way, estimates of the relative contributions of home and school factors on reading achievement can be made.
Bivariate relationships
The initial phase of the data analyses for this chapter involved an examination of the bivariate relationships between pupil reading-literacy levels and variables that described aspects of the home and school environment which, in previous research, have been shown to have a strong impact on reading literacy. These variables and their correlations with pupil reading literacy have been presented in Table 7.1.
The variables listed in Table 7.1 covered three major dimensions. The first dimension involved variables that described various aspects of pupils’ homes such as socio-economic characteristics, location, etc. Variables of this kind have been shown to be important determinants of pupil-literacy levels in most countries of the world. However, for educational planners, these kinds of variables are often of less interest because they operate outside the policy domains where governments (through parents, teachers, and school heads) can take direct action. For example, governments have little or no power to make changes in the socio-
75

economic characteristics, location, and languages spoken in pupils’ homes. Since such variables are not amenable to short-term or even medium-term change by governments or other agencies, they have been referred to in this chapter as non-malleable variables: home context. In later multivariate analyses these variables can be used as ‘control variables’ which provide a means of understanding the effects of other important factors in a manner that adjusts for the circumstances in which pupils live. The second dimension, referred to as malleable variables: home and school context, is of great interest to governments because these variables describe elements of the educational environment of homes and schools that are amenable to change through interventions made by parents, teachers, and school heads. The third dimension, labelled malleable variables: school system context, lists variables that are also of interest to governments because interventions at a school-system level can result in impacts that are felt at school and classroom levels.
It is important to note that some of the malleable variables, such as ‘Parents assist with and check homework’, reflect educational processes which can be altered without major resource implications. In contrast, changes in other malleable variables, such as ‘Index of total school resources’ may only be considered in association with large-scale funding decisions related to a Ministry of Education budget.
The final two malleable dimensions may be seen as depicting two different decision- making levels that impact upon the educational environments of children. At the ‘Home and school context’ level it is the parents, school heads, and teachers who can take specific actions to improve the educational environment. In contrast, at the ‘School system context’ level, action to improve the educational environment needs to be taken at higher levels in two areas: (a) financial action by governments in order to acquire expensive physical and human resources for schools, and (b) administrative action by senior, central, and regional educational administrators in order to change existing resource allocation mechanisms and/or administrative procedures.
Five of the variables in Table 7.1 were indices. These have been identified with an asterisk (*). They were constructed by combining information from two or more sources. The ‘Index of parental education’ was constructed by combining the educational levels of each pupil’s father and mother; the ‘Index of possessions’ was constructed by combining pupils’ responses to a list of possessions that may, or may not, be found in pupils’ homes; the ‘Index of classroom furniture’ and the ‘Index of classroom learning materials’ were constructed by counting the number of classroom furniture items and classroom teaching materials that Grade 6 teachers reported were in their classrooms; and the ‘Index of school resources’ was constructed by counting the number of items of school equipment that school heads reported were in their schools. A detailed discussion of the construction of these indices was presented in an earlier chapter of this report. The bivariate linkages between all candidate variables that could be expected to have strong causal connections with pupil reading-literacy levels were assessed by calculating product-moment correlations between each variable and pupil scores on the 59-item reading test. The variables derived from school head and teacher questionnaires were disaggregated over the pupil data files so that all correlations with pupil test scores were conducted at the between-pupil level.
76

Table 7.1. Bivariate correlations for non-malleable variables: home context and malleable variables: home, school, and school system context
Non-malleable and malleable variables Computer-stored Correlation variable name with reading
Non-malleable variables: home context
1. Index of parental education (*)
2. Index of possessions in the home (*)
3. Total number of books in the home
4. English spoken in pupil’s home 5. Location of pupil’s home
Malleable variables: home context and school context
6. Parents assist with and check homework
7. Pupil attends school on a regular basis
8. Pupil is given regular homework
9. Pupil attends tuition outside school hours
10. Frequency of teacher meetings with parents
Malleable variables: school system context
XPFAMOED 0.36
XPTOTPOS 0.28
XPBOOKSH 0.24
XPENGLIS 0.39
SLOCATIO 0.18
XPHMINT 0.25
PABSENT 0.22
XPHMWKGE 0.27
XPPSENDE 0.38
TMEETPAR 0.19
11. School head years of experience SYRHEADA
12. Teacher years of experience TNUMYRS
13. Index of total school resources (*) XSRESTOT
14. Index of classroom furniture (*) XTCLFURN
15. Index of classroom learning materials (*) XTCLMAT
0.10
0.20
0.12
0.09
0.11
16. Pupil has access to a classroom library TRESCLIB 0.15
The magnitudes of these correlations were examined and variables were selected for further analysis when their correlations exceeded ii0.08 (which represented, approximately, two standard errors of sampling). That is, variables were excluded from further analysis when it was found that their bivariate relationships with pupil reading-literacy levels were within the limits that could be expected to have occurred by chance. A total of 16 variables had correlations with pupil reading-literacy levels which exceeded 0.08 in magnitude. The values of these correlations have been presented in the final column of Table 7.1.
There were three variables which stood out as being quite highly correlated with pupil reading test scores: Index of parental education (0.36), English spoken in the home (0.39), and Pupil attends tuition outside school hours (0.38). These correlations indicated that pupils tended to obtain higher reading scores if they came from homes where the parents were more educated, some English was spoken in the home, and where the pupil attended tuition in school subjects outside school hours.
Six variables, Index of possessions in the home, Total number of books in the home, Parents assist with and check homework, Pupil attends on a regular basis, Pupil is given
77

regular homework, and Teacher years of experience, had moderate correlations (in the range 0.20 to 0.30) with pupil reading scores. Seven other variables had correlations lower than 0.20 with pupil reading scores - but higher than the cut-off value of 0.08, which represented the magnitude of two standard errors of sampling.
The results for variables with moderate correlations showed that pupils tended to obtain higher reading scores if they were given regular homework which was checked by parents, they attended school regularly, their teachers had more years of experience, they came from homes that had many books and possessions, and they attended tuition outside school hours. The results for variables with lower correlations indicated that pupils tended to obtain higher reading scores if they went to schools which had the following features: were located in urban areas, had high levels of school resources, had an experienced school head, had Grade 6 classrooms with higher levels of resources (such as classroom furniture and classroom libraries), and they had teachers who met frequently with parents.
Construct formation
A review of the list of 16 variables in Table 7.1 indicated that some of the variables provided parallel assessments of the same underlying construct. It was therefore decided that, in the interests of parsimony, a clearer and more manageable picture of the relationships among the factors impacting upon pupil reading-literacy levels could be made by combining variables that formed similar clusters. For example, the first three variables in the table (which assessed parent education, possessions in the home, and books in the home) provided three indicators of the socio-economic level of the home environment. It was therefore decided to combine these three variables into a single construct or composite entitled ‘Socio- economic level of pupil’s home’.
A total of four constructs was created by using 10 of the variables listed in Table 7.1. These four constructs were prepared using the procedure of principal components analysis and have been listed along with their constituent variables in Table 7.2. The column headed ‘Loading’ shows the correlations between the variables and the constructs, and the column headed ‘Variance %’ shows the percentage of variance explained by each construct.
The first construct, ‘Socio-economic level of pupil’s home’, was constructed by combining three variables: Index of parental education, Index of possessions in the home, and Number of books in the home. A high score for a pupil on this composite tended to be associated with pupils with well-educated parents who came from homes with many books and possessions. A low score tended to be linked to pupils with less-educated parents and homes with fewer books and possessions. The second construct, ‘Family interest in homework and attendance’, was aimed at making an assessment of the level of interest shown by parents in educational activities undertaken by their children. High scores on this construct were related to pupils with parents that ensured that they attended school and that they completed their homework; and low scores indicated lower levels of parent interest. The third construct, ‘Physical resources in the school’, covered the material provisions that were made for schooling in terms of physical plant and equipment - both inside and outside the classroom. High scores on this construct were obtained by schools with a wide range of resources at school and classroom levels; and low scores indicated lower levels of resources. The fourth construct, ‘Human resources in the school’, examined the degree to which schools
78

were staffed with both experienced school heads and experienced teachers; and low levels indicated lower levels of human resources.
Table 7.2. Principal component loadings for variables within constructs
Composite Variable Loading Variance %
Home constructs
(a) Socio-economic level of pupil’s home
Index of parental education
Index of possessions in the home
0.79 52
0.75
Number of books in home 0.59
(b) Family interest in homework and attendance
Parents help / check homework
Regular attendance by pupil
0.74 55
0.74
School Constructs
(a) Physical resources in the school
Index of total school resources 0.34 54
Index of classroom furniture 0.86
Index of classroom materials 0.86
(b) Human resources in the school
School head years of experience 0.75 56
Teacher years of experience 0.75
The variables related to the third and fourth constructs, ‘Physical resources’ and ‘Human resources’, were examined in detail in an earlier chapter on equity in resource allocation. In this chapter it was noted that while Mauritius had achieved considerable success concerning the equitable distribution of physical resources, a general pattern of inequity was associated with some of the variables describing human resources.
A causal model
The four constructs listed in Table 7.2 and the remaining six ‘singleton’ variables were combined to form a causal model. The aim here was to attempt to summarize the relationships among these 10 factors as a causal network which would provide guidance for educational policy.
The 10 factors and pupil reading-literacy scores have been depicted in diagrammatic form in Figure 7.2. The three factors listed in the first column of the figure represented the ‘non-malleable’ domain discussed previously. These three factors: ‘English spoken in pupil’s home’, ‘Socio-economic level of pupil’s home’, and ‘Location of pupil’s home’, were labelled as non-malleable because they were outside the policy reach of governments.
79

Each of the three non-malleable factors could be thought of as having an impact on pupil reading-literacy levels in two ways. First, these factors could have a ‘direct’ impact. For example, the ‘Socio-economic level of pupil’s home’ factor could be considered to have a direct impact on reading literacy because wealthy homes combined with well-educated parents are able to have greater access to objects and experiences (books, newspapers, educational visits, etc.) that are known to improve the reading-literacy levels of children. Second, these factors could also have an ‘indirect’ impact on reading literacy by working through one or more of the seven ‘mediating factors’ listed in the second column of Figure 1. For example, the ‘Socio-economic level of the pupil’s home’ factor could have an indirect impact on reading because wealthy homes where the parents are well educated are also likely to have a high score on the ‘Family interest in homework and attendance’ factor - which, in turn, would impact positively on the reading-literacy levels. In a similar manner, it was postulated that the two factors of ‘Some English spoken in pupil’s home’ and ‘Location of pupil’s home’ would have both direct and indirect effects on reading-literacy levels.
In broad terms the causal sequence suggested for the model was as follows: non-malleable factors (describing relatively fixed home conditions) -+ malleable factors (describing changeable features of the home, school, school system) + educational outcomes (based on pupil reading-literacy levels). That is, the direction of causation was postulated to move from the left-hand side of the page to the right-hand side - with no reciprocal linkages.
The magnitude of these causal linkages may be estimated in many ways. The method selected for this study was the well-known approach of path analysis, in which causal paths are summarized as a set of equations - whose coefficients are estimated to be equal to the values of standardized regression coefficients. Initially all paths were considered between the three factors in the first column and the seven factors in the second column of Figure 7.1. Then, the paths were examined between the three factors in the first column and pupil scores in the reading test. Finally, the paths were examined between the seven factors in the second column and pupil scores in the reading test.
A first set of path coefficient estimates was generated and certain paths were deleted from the model when their magnitudes did not exceed two standard errors of sampling (M.08). A set of revised path coefficient estimates was then made after non-significant paths had been deleted. The final results of these analyses have been shown in Figure 7.1. Note that in Figure 7.1 the decimal places for all paths have been dropped for the purposes of clarity.
80

Figure 7.1: Path Diagram for Analysis of Factors Affecting Reading Literacy
“NON-MALLEABLE” - “MALLEABLE” b PUPIL HOME CONTEXT HOME, SCHOOL & SYSTEM FACTORS LITERACY
31
Some EI Spoke]
Pupil’s 1 A
v Socioeco
Level Pupil’s
A
‘I Locati’
’ Pupil’s r (rural/u
Family Interest in Homework
and Attendance
y Pupil Score on Reading
/T Homework Literacy Test
on of Home rban)
Physical Resources in
School
Note: The regression equation using all predictors above explained 35 percent of pupil variance in reading scores.
81

Two factors, ‘Physical resources in pupil’s school’ and ‘Pupil access to a classroom library’, were omitted from the model because no causal paths to them, or from them, were statistically significant. In an earlier chapter it was shown that a considerable level of equity had been reached concerning the allocation of physical resources among schools in Mauritius - which prevented this factor from discriminating to any major degree among schools. It was also shown that the impact of the availability of classroom libraries needed to be reviewed in terms of the availability of school libraries and the book borrowing entitlement of pupils. In Mauritius, almost all Grade 6 pupils were in schools with a school library and 85 percent of the reported having the right to make overnight book loans. These features of pupil book access indicated that the differential effect of the availability of classroom libraries was likely to have much less impact. However, the most important explanation of why these two factors were removed from the analysis was simply the fact that when the effects of all other factors were taken into account, the impact of these two factors within the path model was negligible.
The ‘Socio-economic level of pupil’s home’ factor had a strong direct effect (0.21) on pupil reading - but its effect on reading was also mediated through factors related to family interest (0.24), regular homework (0.15), tuition outside school hours (0.22), and, to a lesser extent, human resources in schools (0.08). That is, pupils from families at higher socio- economic levels were gaining an ‘indirect benefit’ on their reading scores with additional positive impacts (0.11,0.09,0.18, and 0.12, respectively) arising from these four factors.
A similar pattern of causation was associated with the ‘Some English spoken in pupil’s home’ factor. The only difference here being that this factor had no mediated impact on reading via the ‘Human resources in school’ factor. The results indicated that the ‘Some English spoken in pupil’s home’ factor had both a direct impact on pupil literacy levels and an indirect mediated impact via factors that assessed family interest, regular homework, and tuition outside school hours.
The ‘Location of the pupil’s home’ factor operated in a rather different manner. It had no direct impact on pupil reading-literacy levels. However, it had an indirect impact by working through two other factors: ‘Human resources in school’, and ‘Frequency of teacher/parent interaction’. The results indicated that, compared with pupils living in rural areas, the pupils living in urban areas tended to go to schools with more experienced teachers and school heads, and that their teachers met more frequently with parents and that these two mediating variables had a positive impact on pupil reading-literacy levels.
Conclusion
The policy implications arising from the path analysis model all emerge from an examination of the five ‘malleable’ factors in the second column of Figure 8.1 that remained within the model after the revised path coefficients had been calculated.
It was clear that the Ministry of Education needed to examine the ways in which pupils from poorer homes where English was not spoken, could be assisted with respect to the first three malleable variables in Figure 7.1. In particular, the Ministry should examine methods by which the parents of pupils from these kinds of homes could be sensitized to the importance of taking more interest in their children’s homework and school attendance
82

patterns. The Ministry could also encourage schools serving these communities to give more regular homework. The issue of regular homework was the subject of a policy suggestion given in Chapter 3 of this report. Both of these actions are relatively low-cost areas of educational policy and could be managed by schools through parent-teacher meetings and by Inspectors explaining the importance of regular homework to teachers.
Policy Suggestion 7.1: The Ministry should emphasize to the school heads in schools serving poorer non-English-speaking communities that parent-teacher meetings should be used to emphasize the importance of parents taking a strong interest in the homework which their children receive, and also stress the need for pupils to attend school on a regular basis.
The results related to the third ‘malleable’ factor in Figure 7.2 present some difficult challenges for the Ministry. It would appear that not only is tuition outside school hours providing a quite strong positive effect on reading - but that it is more likely to be given to pupils from wealthy homes where some English is being spoken. This result raises major issues of equity for the Mauritian school system - which might be tackled in one of two ways: either completely ban extra lessons given by teachers outside school hours, or subsidize extra tuition in poorer communities where less English is spoken in homes. Unfortunately, both of these courses of action represent politically ‘explosive’ options for the Ministry.
In an earlier chapter it was noted that the issue of tuition outside school hours raised issues of a ‘conflict of interest’ among teachers. However, the research findings presented above suggest that the Ministry should move immediately to open this whole area up to a wide-ranging public discussion - with the objectives of explaining both the positive and negative aspects of extra tuition and moving towards a national policy for managing this phenomenon in a productive manner.
Policy Suggestion 7.2: The Ministry should organize an open public debate on the benefits and problems associated with the provision of extra lessons given by teachers to their pupils outside school hours and then should seek to have a Consultative Panel prepare a national policy on this matter.
The results for the fourth and fifth malleable variables suggested that a major imbalance, weighted against rural schools, appears to have arisen in the allocation of experienced teachers and experienced school heads, and also with respect to the frequency with which teachers interact with parents. While the general issue of inequitable distribution of human resources among schools was raised as part of policy suggestions presented in an earlier chapter, it is important to note that the results presented in Figure 7.1 show that this inequitable situation has given rise to differential pupil reading levels in schools - a result that underlines the need for a Ministry investigation into why this situation has occurred. While it may take some years to re-balance the allocation of experienced teachers and school heads across the nation, an immediate start could be made to improve conditions by asking school heads in rural schools to improve the frequency and quality of parent-teacher interaction.
Policy Suggestion 7.3: The Ministry should review the frequency and nature of parent- teacher interaction in schools and should encourage school heads in rural areas to improve the frequency and quality of these activities.
83
Chapter 8
An Agenda for Action
Introduction
This chapter seeks to bring together the many research-based policy suggestions that have been made throughout this report. In undertaking this synthesis every effort has been taken to produce an ‘agenda for action’ for the Government of Mauritius that is both meaningful and feasible. However, it is also important to note that this chapter should not be seen as a final evaluative comment on the Mauritian education system - but rather as a beginning point for constructive discussion of future educational policy options.
Mauritius has a complex pluricultural society and as a result its education system tends to be bounded by unique sets of social, economic, and political environments. All questions of educational reform therefore need to be based on sound information. For this reason all policy suggestions presented in this report were based on a scientific analysis of reliable data - and not on anecdote, myth, or hearsay.
Classification of policy suggestions
There was a total of 38 policy suggestions made in Chapters 3 to 7. These suggestions were prepared on the basis of a careful interpretation of the results of the data analyses, and with the added benefit of consultations with decision-makers at different levels of the Mauritius education system. It would not have been helpful for the Ministry of Education to receive these policy suggestions as a simple list. This approach would not have recognized the different nature of many of the suggestions and would have ignored differences in time and costs related to their implementation. Instead, it was decided to undertake a systematic classification of the suggestions according to their operational implications for the Ministry. It was considered that this form of classification would facilitate a more coherent debate concerning the prioritization of the suggestions and the subsequent selection of realistic avenues of action. Five main groups of policy suggestions emerged from this analysis. The following discussion lists the suggestions according to group membership, provides a short statement of the operational implications associated with each group, and gives three examples of actions required.
Group 1: Consultations with staff, community, and experts. This group contained ten suggestions (3.5, 3.8, 3.13, 3.14, 3.16, 3.18, 6.3, 7.1, 7.2, and 7.3) that called upon the Ministry to have consultations with major stakeholders in the education system. For example, consultations with teacher unions related to the practice of private tuition, discussions with a cross-divisional committee on staffing options, and an Inspectors conference focused on their new role in education, etc.
Group 2: Reviews of existing planning and policy procedures. This group contained seven suggestions (3.4, 3.6, 3.11, 3.12, 4.1, 4.3, and 4.4) that identified established practices in the policy and planning area which needed to be reviewed and evaluated. For example, a revision of priorities with respect to the staffing of schools in isolated and/or disadvantaged districts,
84
an examination of current policies related to homework and the production of an agreed national policy, a review of the availability of learning materials, etc.
Group 3: Data collection for planning purposes. This group consisted of twelve suggestions (3.9, 3.10, 3.17, 4.2, 4.5, 4.6, 4.8, 4.9, 5.1, 5.2, 5.3, and 5.4) that required the Ministry to collect important information that would be useful for planning purposes. For example, a survey of the availability of essential teaching materials in Grade 6 classrooms, an investigation into why students in an isolated district lacked basic learning materials, a national audit of the availability of books, etc.
Group 4: Educational policy research projects. This group contained six suggestions (3.1, 3.2, 3.7, 6.1, 6.2, and 6.4) that identified an educational policy research programme for the Ministry. For example, a follow-up survey of the same target population employed during SACMEQ’s initial project, a research study on the educational and economic effects of grade repetition, a study designed by a Task Force that will investigate reasons for the poor reading levels of Grade 6 pupils in comparison with standards set down by the Ministry’s own experts, etc.
Group 5: Investment in infrastructure and human resources. This group contained three suggestions (3.3, 3.15, and 4.7) that required the Ministry to mobilize and/or reallocate funds for professional development, teaching materials, and buildings. For example, the implementation of strategies to compensate pupils in disadvantaged communities for their limited access to educational resources, the launching of a major school buildings repair programme, and the extension of in-service training opportunities to teachers who have had limited access to them in the past, etc.
In Table 8.1, the 38 policy suggestions have been grouped into the five categories described above. Each suggestion was linked to the relevant department within the Ministry that would be responsible for its implementation. In addition, broad estimates for implementation time and costs were included for each suggestion. The headings used in the table have been explained below.
Relevant department: The name of the department, branch, unit, and special group within the Ministry that should be given responsibility for taking action with respect to each policy suggestion.
Time: A very approximate time estimate for implementing each policy suggestion was developed as a three-point scale: ‘short’ (around three to nine months), ‘medium’ (around one to two years), and ‘long’ (around three to five years).
Cost: A very approximate cost estimate was also made for implementing each policy suggestion according to the following three-point scale: ‘low’ cost - for initiatives that required no increased expenditure and could be accommodated within existing budgets through redeployment of staff, more efficient use of resources, and/or refining data collection procedures that were already in place; ‘moderate’ cost - for activities that required substantial data collection and/or research projects that could not be built into existing arrangements and would therefore need to be funded in addition to current Ministry operations; and ‘high’ cost - for large-scale investments in capital works and human resources.
85
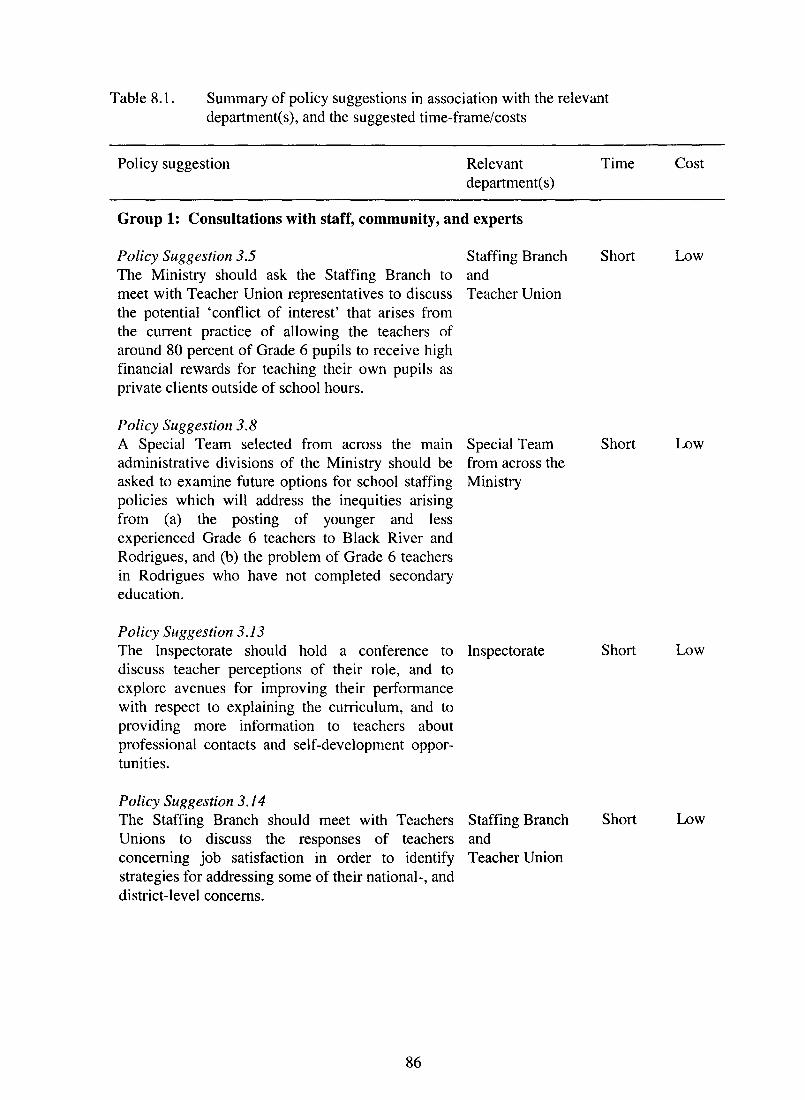
Table 8.1. Summary of policy suggestions in association with the relevant department(s), and the suggested time-frame/costs
Policy suggestion Relevant department(s)
Time cost
Group 1: Consultations with staff, community, and experts
Policy Suggestion 3.5 Staffing Branch The Ministry should ask the Staffing Branch to and meet with Teacher Union representatives to discuss Teacher Union the potential ‘conflict of interest’ that arises from the current practice of allowing the teachers of around 80 percent of Grade 6 pupils to receive high financial rewards for teaching their own pupils as private clients outside of school hours.
Short Low
Policy Suggestion 3.8 A Special Team selected from across the main Special Team administrative divisions of the Ministry should be from across the asked to examine future options for school staffing Ministry policies which will address the inequities arising from (a) the posting of younger and less experienced Grade 6 teachers to Black River and Rodrigues, and (b) the problem of Grade 6 teachers in Rodrigues who have not completed secondary education.
Short Low
Policy Suggestion 3.13 The Inspectorate should hold a conference to Inspectorate discuss teacher perceptions of their role, and to explore avenues for improving their performance with respect to explaining the curriculum, and to providing more information to teachers about professional contacts and self-development oppor- tunities.
Short Low
Policy Suggestion 3. I4 The Staffing Branch should meet with Teachers Staffing Branch Unions to discuss the responses of teachers and concerning job satisfaction in order to identify Teacher Union strategies for addressing some of their national-, and district-level concerns.
Short Low
86
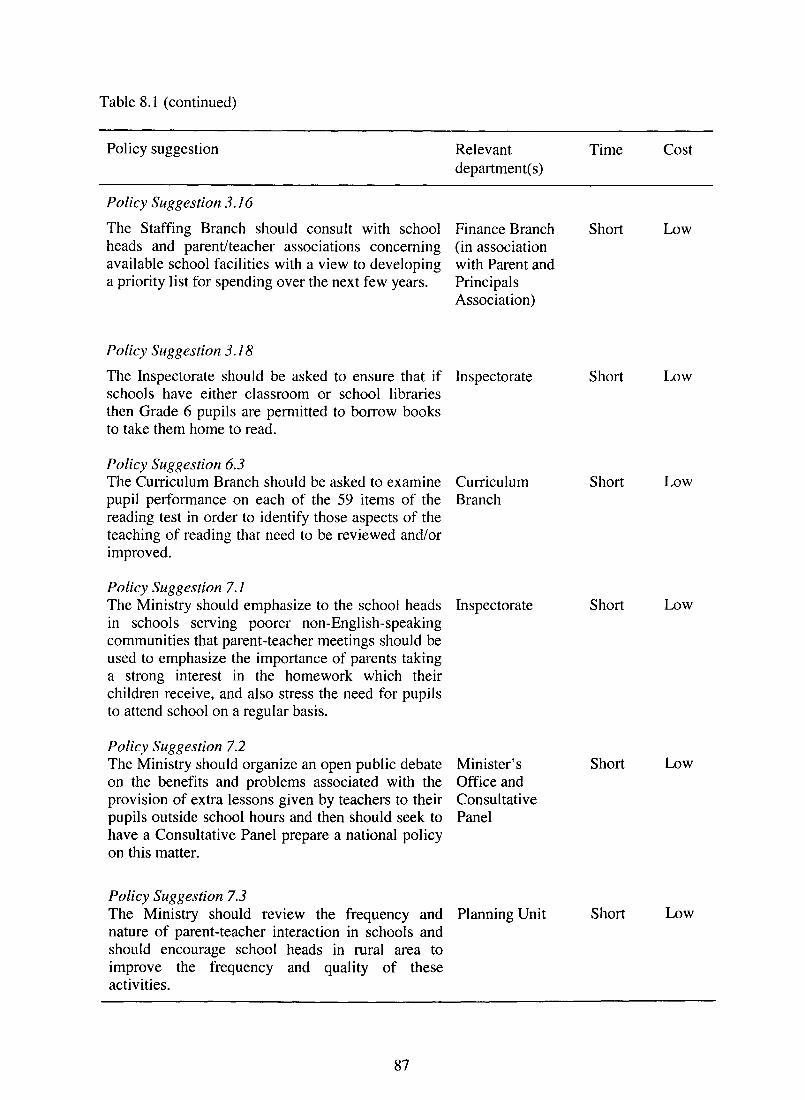
Table 8.1 (continued)
Policy suggestion Relevant department(s)
Time cost
Policy Suggestion 3. I6
The Staffing Branch should consult with school Finance Branch heads and parent/teacher associations concerning (in association available school facilities with a view to developing with Parent and a priority list for spending over the next few years. Principals
Association)
Short Low
Policy Suggestion 3. I8
The Inspectorate should be asked to ensure that if Inspectorate schools have either classroom or school libraries then Grade 6 pupils are permitted to borrow books to take them home to read.
Short LOW
Policy Suggestion 6.3 The Curriculum Branch should be asked to examine Curriculum pupil performance on each of the 59 items of the Branch reading test in order to identify those aspects of the teaching of reading that need to be reviewed and/or improved.
Short Low
Policy Suggestion 7.1 The Ministry should emphasize to the school heads Inspectorate Short Low in schools serving poorer non-English-speaking communities that parent-teacher meetings should be used to emphasize the importance of parents taking a strong interest in the homework which their children receive, and also stress the need for pupils to attend school on a regular basis.
Policy Suggestion 7.2 The Ministry should organize an open public debate Minister’s on the benefits and problems associated with the Office and provision of extra lessons given by teachers to their Consultative pupils outside school hours and then should seek to Panel have a Consultative Panel prepare a national policy on this matter.
Short Low
Policy Suggestion 7.3 The Ministry should review the frequency and Planning Unit nature of parent-teacher interaction in schools and should encourage school heads in rural area to improve the frequency and quality of these activities.
Short Low
87
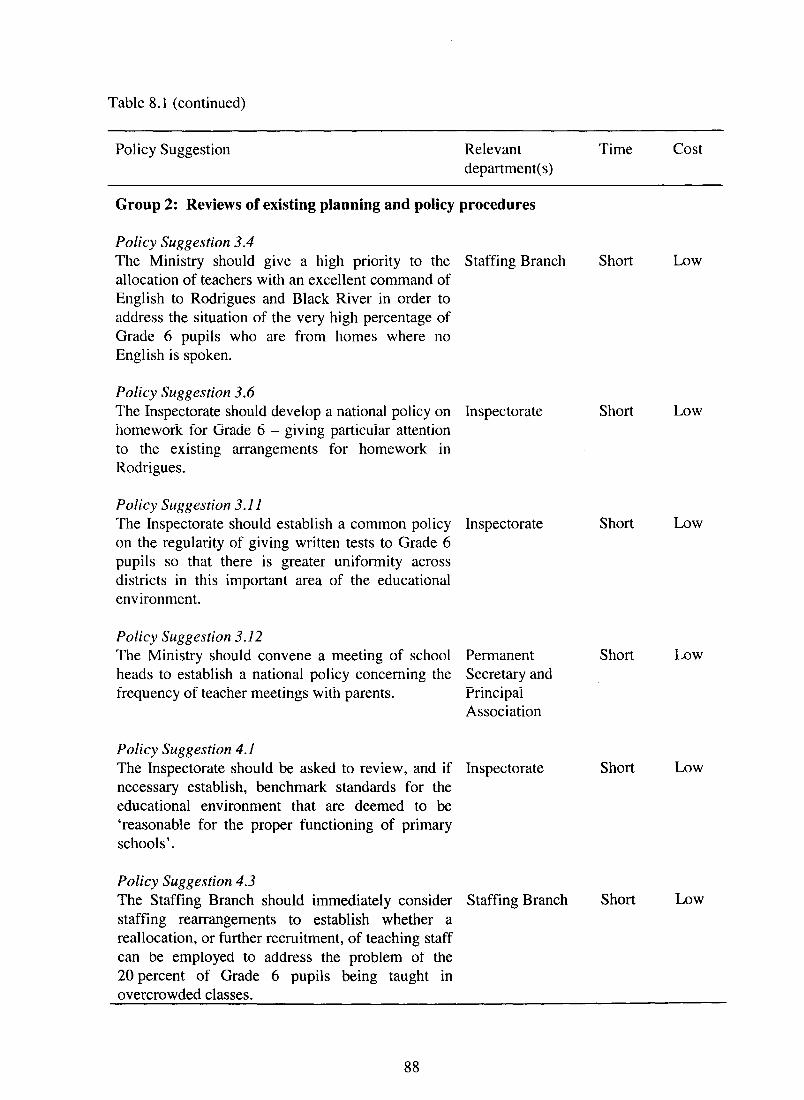
Table 8.1 (continued)
Policy Suggestion Relevant department(s)
Time cost
Group 2: Reviews of existing planning and policy procedures
Policy Suggestion 3.4 The Ministry should give a high priority to the Staffing Branch allocation of teachers with an excellent command of English to Rodrigues and Black River in order to address the situation of the very high percentage of Grade 6 pupils who are from homes where no English is spoken.
Policy Suggestion 3.6 The Inspectorate should develop a national policy on Inspectorate homework for Grade 6 - giving particular attention to the existing arrangements for homework in Rodrigues.
Policy Suggestion 3.11 The Inspectorate should establish a common policy Inspectorate on the regularity of giving written tests to Grade 6 pupils so that there is greater uniformity across districts in this important area of the educational environment.
Policy Suggestion 3.12 The Ministry should convene a meeting of school Permanent heads to establish a national policy concerning the Secretary and frequency of teacher meetings with parents. Principal
Association
Policy Suggestion 4.1 The Inspectorate should be asked to review, and if Inspectorate necessary establish, benchmark standards for the educational environment that are deemed to be ‘reasonable for the proper functioning of primary schools’.
Policy Suggestion 4.3 The Staffing Branch should immediately consider Staffing Branch staffing rearrangements to establish whether a reallocation, or further recruitment, of teaching staff can be employed to address the problem of the 20 percent of Grade 6 pupils being taught in overcrowded classes.
Short Low
Short Low
Short Low
Short Low
Short Low
Short Low
88

Table 8.1 (continued)
Policy Suggestion Relevant department(s)
Time cost
Policy Suggestion 4.4 The Buildings Branch should be asked to undertake an audit of the schools where
Buildings
classroom space does not meet the Ministry Branch
standards and then prepare a long-term plan for the amelioration of this problem.
Group 3: Data collection for planning purposes
Policy Suggestion 3.9 The Inspectorate should be asked to make Inspectorate enquiries into why a number of Grade 6 classes in Mauritius do not have (a) important basic teaching materials such as an atlas, an English dictionary, and a wall chart of any kind, and (b) shelves for the storage of books.
Policy Suggestion 3.10 The Supply Branch of the Ministry should Supply Branch investigate the reasons for the relatively high percentage of Grade 6 pupils in Rodrigues who reported that they lacked basic learning materials.
Policy Suggestion 3.17 The Curriculum Branch should conduct a national Curriculum book audit to assess (a) book availability, and (b) Branch book quality.
Policy Suggestion 4.2 The Planning Unit should examine the situation Planning Unit concerning large schools in Lower Plaine Wilhems and Port Louis - with the aim of establishing whether there is a need to build more schools in these two areas.
Policy Suggestion 4.5 The Inspectorate should undertake an audit of the Inspectorate classroom supplies situation in Rodrigues and suggest a means of addressing basic needs in this area.
Short
Medium
Medium
Medium
Medium
Medium
LOW
LOW
LOW
LOW
LOW
LOW
89

Table 8.1 (continued)
Policy Suggestion Relevant department(s)
Time cost
Policy Suggestion 4.6 The Ministry should undertake an audit of Staffing Branch teacher academic qualifications in Rodrigues and teacher professional qualifications in Black River and should then establish a strategy for impro- ving the qualifications of teachers in these two districts.
Policy Suggestion 4.8 The Planning Unit should investigate why there Planning Unit appears to be such a large percentage of Grade 6 pupils attending schools in Rodrigues, where the academic qualifications of school heads do not meet the Ministry’s benchmark standards.
Policy Suggestion 4.9 The Planning Unit should investigate why there Planning Unit is such a large percentage of Grade 6 pupils in schools in Port Louis where the professional qualifications of school heads do not meet the Ministry’s benchmark standards.
Policy Suggestion 5. I The Planning Unit should undertake an Planning Unit investigation into why the allocation of material resource inputs among schools in the district of Moka is so unequal for so many inputs.
Policy Suggestion 5.2 The Planning Unit should undertake an Planning Unit investigation of the specific instances of unequal allocation of material resource inputs that were identified for Riviere du Rempart, Savanne and Rodrigues.
Policy Suggestion 5.3 The Ministry should undertake an investigation Staffing Unit into why the allocation of certain human resource inputs (particularly Teacher experience, School head academic qualifications, and Inspectors’ visits to schools) among districts is so unequal when contrasted with the allocation of material resource inputs.
Medium
Medium
Medium
Medium
Medium
Medium
LOW
LOW
LOW
LOW
LOW
LOW
90
--.-

Table 8.1 (continued)
Policy Suggestion Relevant department(s)
Time cost
Policy Suggestion 5.4 The Ministry should undertake an investigation Staffing Unit of the specific instances of unequal allocation of human resource inputs that were identified within certain districts.
Medium Low
Group 4: Education policy research projects
Policy Suggestion 3.1 The Ministry should plan to undertake a Planning Unit follow-up survey of the same target population employed during SACMEQ’s initial project in order to examine changes in important educational indicators over time.
Medium Moderate
Policy Suggestion 3.2 The Planning Unit should undertake an Planning Unit investigation into the practice of grade repeating in Mauritius in order to determine whether the extra year of schooling being received by the ‘average Grade 6 pupil’ can be justified on either educational or economic grounds.
Medium Low
Policy Suggestion 3.7 The Planning Unit should undertake a study Planning Unit (a) to examine the procedures used by schools to identify pupils for grade repetition, and (b) to test whether these procedures are being applied in a ‘rational’ manner (in the sense that they are linked to valid measures of pupil performance).
Medium Low
Policy Suggestion 6.1 The Ministry should establish a Reading Literacy Task Force Medium Low Task Force at the primary school level in order to undertake a comprehensive investigation into why the reading skills of Grade 6 pupils in Mauritius are so poor in comparison with the ‘minimum’ and ‘desirable’ performance standards set down by the Mauritian reading specialists.
91
- -
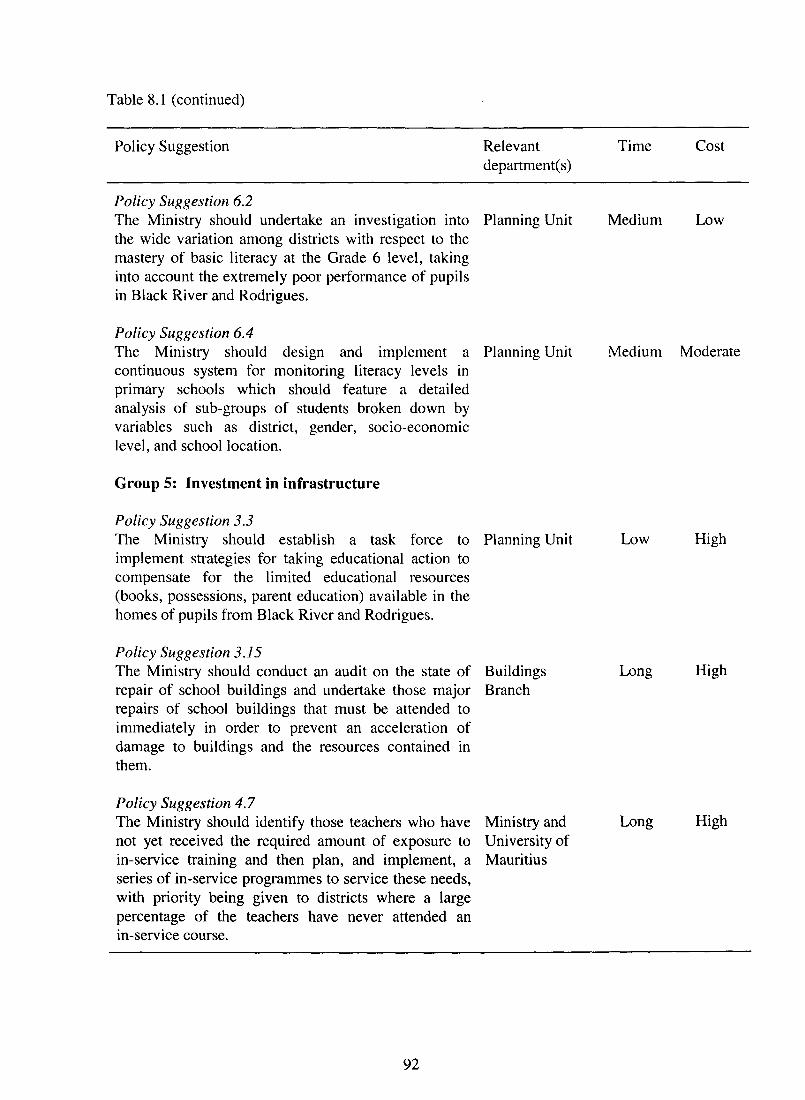
Table 8.1 (continued)
Policy Suggestion Relevant department(s)
Time cost
Policy Suggestion 6.2 The Ministry should undertake an investigation into Planning Unit the wide variation among districts with respect to the mastery of basic literacy at the Grade 6 level, taking into account the extremely poor performance of pupils in Black River and Rodrigues.
Medium Low
Policy Suggestion 6.4 The Ministry should design and implement a Planning Unit continuous system for monitoring literacy levels in primary schools which should feature a detailed analysis of sub-groups of students broken down by variables such as district, gender, socio-economic level, and school location.
Medium Moderate
Group 5: Investment in infrastructure
Policy Suggestion 3.3 The Ministry should establish a task force to Planning Unit implement strategies for taking educational action to compensate for the limited educational resources (books, possessions, parent education) available in the homes of pupils from Black River and Rodrigues.
LOW
Policy Suggestion 3.15 The Ministry should conduct an audit on the state of Buildings repair of school buildings and undertake those major Branch repairs of school buildings that must be attended to immediately in order to prevent an acceleration of damage to buildings and the resources contained in them.
Policy Suggestion 4.7 The Ministry should identify those teachers who have Ministry and not yet received the required amount of exposure to University of in-service training and then plan, and implement, a Mauritius series of in-service programmes to service these needs, with priority being given to districts where a large percentage of the teachers have never attended an in-service course.
High
High
High
92
A four-stage Agenda for Action
All policy reports in the field of education need to recognize the economic realities of the countries in which they are prepared. This report is no exception. It would clearly be unrealistic to expect the Ministry of Education to make an immediate start on all 38 policy suggestions listed in Table 8.1. Even if full funding was available to move forward on all proposals, which it is not, the logistics of organizing and managing such a wide array of projects would not be possible in a small country like Mauritius.
It was therefore important to make some attempt at creating a preliminary priority order for the policy suggestions so as to move towards a feasible schedule of implementation. Following consultations with Ministry staff it was decided that, in the first instance, it would be desirable for the Ministry to tackle the policy suggestions that had ‘short’ time-frames and ‘low’ costs. This approach was preferred in order to ‘get the wheels turning’ and thereby gain some momentum for addressing some of the more complex tasks associated with policy suggestions that required extended time-frames and were more expensive.
An examination of the final columns of Table 8.2 showed two important patterns. First, for most of the suggestions, short time-frames were linked to low costs, medium time- frames were linked to either low or moderate costs, and long time-frames were linked to high costs. Second, the first two groups of suggestions involving ‘consultations’ and ‘reviews’ all featured short time-frames and low costs; the third group, ‘data collection’, had medium time- frames and low costs; the fourth, ‘research projects’, had mostly medium time-frames and moderate costs; and the fifth group of ‘investment’ suggestions had long time-frames and high costs.
With this information in mind, the following four-stage priority listing of the suggestions was prepared. The first stage lists the suggestions that should be addressed immediately by the Ministry. The second stage is recommended for action after the first stage is well under way. The third stage demands further information to be used as input before a reconsideration of priorities and the selection of a manageable subset of suggestions. The final stage suggests no action by the Ministry until suitable resource levels are in place.
Stage 1: For immediate action by the Ministry. The time-frame and cost patterns discussed above showed that the Ministry’s first actions in response to the list of suggestions given in Table 8.1 should be concentrated on those that were listed under Group 1 (‘consultations’) and Group 2 (‘reviews’). All of these had relatively short time-frames and required no major extra expenditures by the Ministry.
Stage 2: For second-phase action by the Ministry. The suggestions in Group 3 (‘data collection’) all had medium time-frames - but their costs mostly tended to be low. These suggestions should therefore be considered as the focus for a second stage of action to be undertaken when the ‘immediate action’ designated for Stage 1 has been completed.
Stage 3: For further review before action is taken by the Ministry. There were five suggestions listed in Group 4 (‘research projects’) that had medium time-frames and either low or moderate costs. It would not be possible for the Ministry to address all of these immediately. What is required is an examination of these so as to identify two or three of the most important suggestions for which some preliminary planning could take place. Work in this area could be facilitated by seeking advice from other countries and agencies that have tackled similar issues.
93

A set of literature reviews could also be commissioned to check the present ‘state of knowledge’ in relevant fields and to identify talented researchers in Mauritius and elsewhere that might be called upon to work with Ministry counterparts on the more technical aspects of the projects.
Stage 4: For long-term uction by the Ministry. The three suggestions listed in Group 5 (‘investments’) have relatively long time-frames and will probably lead to the need for substantial resource inputs. It will be difficult in the current economic climate for the Ministry to immediately begin work on them - however, they are all important and therefore they should be included as part of the orderly long-term strategic plan of the Ministry - unless some of the required resources can be obtained through a donor agency. These six suggestions should therefore be seen as a list that can be used in discussions with agencies such as the World Bank, United Nations Development Programme, non-governmental agencies, etc.
Co-ordination of Ministry responses to the Agenda for Action
The Ministry’s response to the four-stage agenda for action presented above will demand major inputs from many different groups of people inside and outside the Ministry. This mobilization of effort and resources will require close co-ordination to ensure that (a) decisions taken at the senior level of the Ministry concerning the policy suggestions are implemented, and (b) a mechanism is established to monitor and evaluate the progress and impact of these decisions.
The author of this report believes that this co-ordination should be undertaken by the Planning Unit of the Ministry under the direct responsibility of the Permanent Secretary. Arrangements will need to be made to ensure that the Planning Unit staff involved in this work are given sufficient time, resources, and support to ensure that important decisions are followed up and to guarantee that the Ministry’s senior decision-makers are given constant briefings on progress and achievements.
The future
This educational policy report grew out of a series of IIEP research and training activities that were aimed at improving the capacity of educational planners to monitor the quality of education. The collaborative ‘SACMEQ-style’ of approach used to produce the report represents a genuine breakthrough for the conduct of educational policy research in Africa. It is extremely rare, in any part of the world, for a group of educational planners from many countries to join forces in this way in order to assist with the design, analysis, interpretation, and reporting of data derived from an educational survey research project based on common objectives and common instrumentation.
In early 1998 the SACMEQ group of countries will commence work on designing the research and training programmes related to SACMEQ’s next educational policy research project. This will certainly be an exciting and important enterprise because by that time SACMEQ will be registered as an official non-governmental organization that is ‘owned and operated’ by ministries of education in the Southern Africa sub-region. With a small amount of luck and an enormous amount of hard work, there is every likelihood that SACMEQ will begin the next millennium as Africa’s strongest and most important cross-national educational research initiative.
94

References
Elley, W. (1992). How in the world do students read? The Hague: International Association for the Evaluation of Educational Achievement.
Fuller, W.A. et al. (1986). PCCARP. Statistical Laboratory, Iowa State University, Ames, Iowa.
Kish, L. (1965). Survey Sampling. New York: Wiley.
Ministry of Education, Arts and Culture. (1991). Education Master Plan for the Year 2000. Ministry of Education, Arts and Culture: Mauritius.
Moyo, G. et al. (1993). A Southern Africa Proposal for Monitoring progress towards attaining the goals of the EFA Jomtien Conference concerning the Quality of Education. Confidential draft proposal. Paris: UNESCODIEP.
Murimba, S. et al. (Eds.) (1994). The analysis of educational research data for policy development: An example from Zimbabwe. Paris: UNESCODIEP.
Pollitt, E. (1990). Malnutrition and infection in the classroom. Paris: UNESCO.
Postlethwaite, T.N. ; Ross, K.N. (1992). Effective schools in reading: implications for educational planners. The Hague: International Association for the Evaluation of Educational Achievement.
Ross, K.N.( 1987). Sample design. International Journal of Education Research, I1 (I), 57-75.
Ross, K.N. (1991). Sampling Manual for the IEA International Study of Reading Literacy. Hamburg: International Association for the Evaluation of Educational Achievement.
Ross, K.N. ; Postlethwaite, T.N. (1992). Zndicators of the quality of education: A summary of a National Study of Primary schools in Zimbabwe. Paris: UNESCODIEP.
Ross, K.N. ; Wilson, M. (1994). Sampling errors in survey research. In : T. Husen and T.N. Postlethwaite (Ms.), The International Encyclopedia of Education (pp. 5 13 l-5 142). Oxford: Pergamon.
Ross, K.N. (Ed.) (1995). ‘From educational research to educational policy: an example from Zimbabwe’. International Journal of Educational Research 23(4), pp. 301-403.
Schleicher, A. (1995). Data Entry Manager (DEM) User’s Guide. Paris: UNESCO/REP.
95

IIEP Publications and Documents
More than 1,200 titles on all aspects of educational planning have been published by the International Institute for Educational Planning. A comprehensive catalogue, giving details of their availability, includes research reports, case studies, seminar documents, training materials, occasional papers and reference books in the following subject categories:
Economics of educution, costs and financing.
Manpower and employment.
Demographic studies.
Location of schools (school map) and micro-planning.
Administration and management.
Curriculum development and evaluation.
Educational technology.
Primary, secondary and higher education.
Vocational and technical education.
Non-formal, out-of-school, adult and rural education.
Disadvantaged groups.
Copies of the catalogue may be obtained from ZZEP Publications on request.

The International Institute for Educational Planning
The International Institute for Educational Planning (IIEP) is an international centre for advanced training and research in the field of educational planning. It was established by UNESCO in 1963 and is financed by UNESCO and by voluntary contributions from Member States. In recent years the following Member States have provided voluntary contributions to the Institute: Denmark, Germany, Iceland, India, Ireland, Norway, Sweden, Switzerland and Venezuela.
The Institute& aim is to contribute to the development of education throughout the world, by expanding both knowledge and the supply of competent professionals in the field of educational planning. In this endeavour the Institute co-operates with interested training and research organizations in Member States. The Governing Board of the IIEP, which approves the Instituteus programme and budget, consists of a maximum of eight elected members and four members designated by the United Nations Organization and certain of its specialized agencies and institutes.
Chairman:
Lennart Wohlgemuth (Sweden), Director, The Nordic Africa Institute, Uppsala, Sweden.
Designated Members:
Carlos Fortin, Deputy to the Secretary-General, United Nations Conference on Trade and Development (UNCTAD), Geneva, Switzerland.
David de Ferranti, Director, Human Development Department (HDD), The World Bank, Washington, D.C., USA.
Miriam J. Hirschfeld, Director, Division of Human Resources Development and Capacity Building, World Health Organization (WHO), Geneva, Switzerland.
Jeggan C. Senghor, Director, United Nations African Institute for Economic Development and Planning (IDEP), Dakar, Senegal.
Elected Members:
Datokiah bt. Abu Samah (Malaysia), Corporate Advisor, Lang Education, Land and General Berhad, Kuala Lumpur, Malaysia.
Klaus Hiifner (Germany), Professor, Freie Universitat Berlin, Berlin, Germany.
Faiia Kef (Tunisia), President, National Union of Tunisian Women, Tunis, Tunisia.
Tamas Kozma (Hungary), Director-General, Hungarian Institute for Educational Research, Budapest, Hungary.
Teboho Moja (South Africa), Special Adviser to the Minister of Education, Pretoria, South Africa.
Yolanda M. Rojas (Costa Rica), Professor, University of Costa Rica, San Jose, Costa Rica.
Michel Verni&-es (France), Professor, University of Paris I, Pantheon-Sorbonne, Paris, France.
Enquiries about the Institute should be addressed to:
The Office of the Director, International Institute for Educational Planning,
7-9 rue Eugene-Delacroix, 75 1 16 Paris, France.