the quantitative evaluation of anode thickness change for
TRANSCRIPT

Furukawa Review, No. 46 2015 30
*1 Telecommunication & Energy Laboratories, R&D Division *2 Planning & Administration Department, R&D Division.
The Quantitative Evaluation of Anode Thickness Change for Lithium-ion Batteries
Hiroko Takahashi*1, Masanobu Aragaki*1, Toshiya Hikami*2
The measurement technique of the electrode thickness to measure the expan-sion and the contraction of the electrode containing active material as height
information during charge and discharge has been established. The behavior that the electrode thickness expands continuously as the number of charge and discharge cycles increases is clar-ified by a quantitative evaluation of the graphite based electrode and the silicon based electrode thickness and it was confirmed that from the observation of Scanning Electron Microscope (SEM), an accurate electrode thickness measurement after the charge and discharge test has been carried out. It is assumed that the volume expansion continues due to not only the expan-sion and the contraction behavior of the active material, but also due to the penetration of the electrolyte and the deposition of Solid Electron Interface (SEI) and etc. By observing the elec-trode change checking the thickness measurement result against the charge and discharge characteristics, the electrode behavior can be clarified and the information for the optimum selection of copper foil can be obtained.
ABSTRACT
1. INTRODUCTION
The application of the lithium-ion secondary battery (LiB) has been expanding as a high-output and a high-capacity battery for the applications of portable devices, electric vehicles and etc. The schematic view of LiB is shown in Figure 1. It is configured by the electrode consisting of an active material and a current collector foil, a separator and an electrolyte. In recent years, the higher capacity of the anode electrode active material has been achieved, but the demand of the current collector thickness reduc-tion for further densification has been increasing. Especially, to reduce the thickness of the negative elec-trode current collector copper foil, the mechanical proper-ty is important to withstand the stress due to the expan-sion and the contraction of the active material during the charge and the discharge. For example, the theoretical capacity of the widely used
graphite based active material is 372 mAh/g1) and the vol-ume expands up to 110% at maximum by the lithium intercalation and de-intercalation between the graphite layers. In contrast, an elemental Silicon (Si) which is a high capacity active material, has the capacity of 4200 mAh/g by alloying reaction with lithium, but the volume expansion is also large up to 400% at maximum2). The SiOx based active material developed for the purpose of suppressing the volume expansion of Si has about 1200 mAh/g and it has been already commercialized. The vol-ume expansion is suppressed in comparison to Si based simple substance, but the volume expansion larger than the graphite has been reported3). In this manner, in the
1. INTRODUCTION
Figure 1 The Schematic View of a Lithium-ion Battery.
Cathode(Aluminum foil)
Anode(Copper foil)
Separator
Electrolyte
Furukawa Review, No. 46 2015 31
The Quantitative Evaluation of Anode Thickness Change for Lithium-ion Batteries
case of anode which uses a high capacity active material, the change during the expansion and the contraction is substantial. Therefore, not only the study to suppress the volume expansion of high capacity active material, but also the quantitative method to evaluate the volume change due to the electrode expansion and the contrac-tion have been sought.
Regarding the lithium-ion battery, there are many bat-tery shapes such as prismatic type, cylindrical type, lami-nate type and etc. It is considered that in any shapes, the main factors that deform the entire electrode including the anode electrode current collector due to the charge and the discharge are the expansion and the contraction of the active material described before and the SEI from the electrolyte decomposed material. It is known that because of overlapping of these two factors, the expan-sion, the contraction and the deformation of the coating film occur and because of the anode electrode degrada-tion, the capacity reduction occurs4). To date, various type of measurement methods such as the AC impedance method5) and the current pause method6) as methods to analyze the degradation due to the volume expansion during the charge and the discharge, in-situ XRD mea-surement and measurement using emitted light7) such as the method to analyze the crystalline form and others have been developed. However, because these methods are indirect to evaluate the expansion and the contraction of the active material which is the direct factor of the deg-radation and the deformation of current collector and because the volume change cannot be obtained as a number, the quantitative long term measurement tech-nique by the time when electrode degradation occurs in the shape of a simplified battery while maintaining the actual battery structure has been sought.
Some of the documents that have been reported to date as a technique for measuring the electrode thick-ness are explained. P. Novak8) et al. conducted a thick-ness measurement using a powdered electrode. Under the condition which can eliminate the effect of the counter electrode, the electrode expands by 1 cycle and the thick-ness increase was observed according to the graphite stage structure at less than 0.3 V vs. Li/Li+. Sakai et al.9)
also shows the measurement result of electrode thick-ness in the paper about Si based electrode and the thick-ness measurement for graphite, Si and also SiOx based active material during the charge and the discharge was performed, but only the result by 2 cycles is shown in the paper. Although the precise measurement succeeded, the measurement result remains only by 1 cycle and the behavior of the long term thickness change is unknown. Therefore, according to the existing knowledge, the con-tinuous and highly precise measurement of only anode electrode has not been reported and the measurement which can be mentioned about the copper foil deforma-tion behavior has not been reported. Therefore, by estab-lishing the evaluation technique which uses the film thick-ness measurement equipment during the charge and the
discharge, the trials to clarify the behavior during the dis-charge quantitatively and to get beneficial information about the deformation of copper foil anode current collec-tor due to the active material expansion and contraction during the charge and the discharge have been made.
In this paper, the result which the expansion and con-traction behavior of the graphite based anode active material widely used for existing lithium-ion battery, fur-thermore, of the next generation Si based active material and also the deformation of current collector due to these expansion and contraction were clarified quantitatively by using film thickness measurement equipment during the charge and the discharge, will be discussed.
2. EXPERIMENTAL PROCEDURE
As mentioned in the previous chapters, while maintaining the structure close to the real battery in the form of simpli-fied battery shape, the trial to measure the expansion behavior of the anode electrode as height information has been done for long term quantitative measurement tech-nique when the electrode degradation occurs.
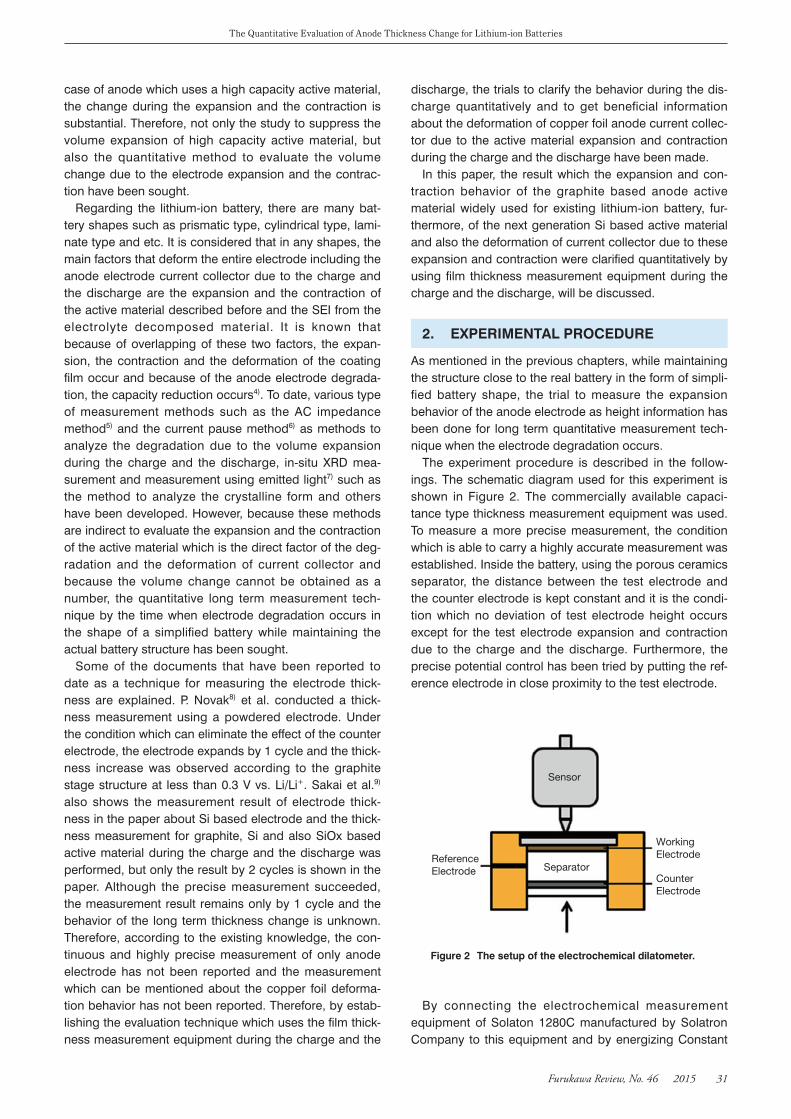
The experiment procedure is described in the follow-ings. The schematic diagram used for this experiment is shown in Figure 2. The commercially available capaci-tance type thickness measurement equipment was used. To measure a more precise measurement, the condition which is able to carry a highly accurate measurement was established. Inside the battery, using the porous ceramics separator, the distance between the test electrode and the counter electrode is kept constant and it is the condi-tion which no deviation of test electrode height occurs except for the test electrode expansion and contraction due to the charge and the discharge. Furthermore, the precise potential control has been tried by putting the ref-erence electrode in close proximity to the test electrode.
By connecting the electrochemical measurement equipment of Solaton 1280C manufactured by Solatron Company to this equipment and by energizing Constant
WorkingElectrode
CounterElectrode
Sensor
SeparatorReferenceElectrode
Figure 2 The setup of the electrochemical dilatometer.
2. EXPERIMENTAL PROCEDURE

Furukawa Review, No. 46 2015 32
The Quantitative Evaluation of Anode Thickness Change for Lithium-ion Batteries
Current (CC) or Constant Voltage (CV), the charge and discharge test has been performed. Note that the rate of the charge and the discharge test is kept low constantly and it was confirmed that a uniform charge and discharge is performed on the entire electrode.
3. The EXPERIMENTAL RESULT AND CONSIDERATION
3.1 The Long-term Thickness Measurement Using Graphite Electrode.
The cell configuration is shown in Table 1. At first, an artifi-cial graphite as a standard LiB anode was used for the active material.
Figure 3 shows the relationship between the amount of measured electrode thickness change and the electric potential. In accordance with the switches of the direction from the charge to the discharge, the saw-tooth type expansion and contraction behavior was observed. Because this behavior was observed more than 10 cycles continuously, the result that the continuous expansion and contraction behavior can be measured was obtained.
Focusing only on the first charge and discharge, the expansion behavior was observed during CC charge and also CV charge. On the other hand, the contraction behavior was observed only during CC charge. At the full charge, the thickness of electrode was increased by 11% compared to the value before charge. In contrast of this, the electrode thickness kept increasing by 6.8% at the end of discharge and it was confirmed that the expanded electrode will not shrink to the thickness before the charge and the discharge. The same behavior was con-tinuously observed after 2nd cycles also and a certain expansion behavior was observed up to 10 cycles.
As a result of the repeated charge and discharge up to 10 cycles, while maintaining a 94% Coulombic efficiency, the electrode thickness is continuously expanding as the number of cycles is increased and the behavior that the volume changes beyond the theoretical value was contin-uously observed. This result has suggested the possibility that the factor other than the intercalation of lithium-ion to graphite relates to the increase of thickness.
Furthermore, in order to confirm that the thickness change corresponding to the graphite specific potential during the charge and the discharge is measured accu-rately, the film thickness change was compared to the stage structure theory value which is known in the graphite electrode. The schematic diagram is shown in Figure 4.
The graphite based active material is charged by inter-calation of lithium-ion between graphite crystalline layers. At that time, according to the amount of lithium-ion inter-calation, it is known that 4 stage structures are taken to change the distance between layers to c axis direction10)
and the volume expansion due to this is observed. Also, when the stage structure changes, a current response is confirmed11), 12) and the current response is obtained by differentiating the quantity of electricity Q (Coulomb) which is charged or discharged by the electrode at the potential V (Voltage vs. Li/Li+).
It is assumed that the same stage structure change, the current response and the film thickness change due to these in the film thickness measurement result can be
3. THE EXPERIMENTAL RESULT AND CON-SIDERATION
Table 1 The list of charge and discharge condition.
Cell configuration
Test electrode : active material composition… artificial graphite/SBR binder/CMC=97 : 2 : 1 (weight ratio) one side coating
electrode…NC-WS foil (thickness 10 µm)Counter electrode : Lithium foilReference electrode : Lithium foil is filled in the configuration of
reference electrode.Electrolyte : Lithium salt is added to EC/DEC. Temperature: 25℃
Charge and discharge test condition
Potential range : 0.0 to 1.5 V, cutoff 0.05 C 1st cycle: 0.1 C, from 2nd cycle: 0.2 C
0
10
20
30
Hei
ght
chan
ge [%
]
0
0.5
1
1.5
Volta
ge [V
vs
Li/L
i+]
Time[min]
(b)
(a)
0 1000
1 cyc 2 cyc 3 cyc 4 cyc 5 cyc 6 cyc 7 cyc 8 cyc 9 cyc 10 cyc
2000 3000 4000 5000 6000 7000
Figure 3 The measurement result of graphite electrode height using thickness measurement method.
(a) Height change vs. charge/discharge cycles. (b) Potential change vs. time.
Intercalate layer
Graphite sheet
Stage1 Stage2 Stage3 Stage4
Figure 4 The schematic diagram of the graphite stage structure11).

Furukawa Review, No. 46 2015 33
The Quantitative Evaluation of Anode Thickness Change for Lithium-ion Batteries
observed. Therefore, the actually observed current response at 1st charge cycle is shown in Figure 5.
As shown in Figure 5, a strong current response was observed at the potential which is estimated when the stage structure changes and the slope of the thickness change behavior have changed. It is considered that the specific stage structure change same as previous report11) occurs in the lithium intercalation to graphite. Although the equivalent current response was observed in the dis-charge side, the response at the time of charge was par-ticularly remarkable. Moreover, comparing the theoretical expansion rate calculated by the electrode thickness change and the stage change potential to the value of paper12), the measured values agree well with the theoreti-cal expansion values at each stage structure.
Because the electrode composition used in this charge and discharge test is almost occupied by the graphite and also the graphite active material13), 14) is oriented to C axis direction is used, it is assumed that the measured value which is comparatively agreeable with the theoreti-cal value was obtained. On the other hand, with regards to the film thickness expansion, in addition to the volume change of active material, the void existing in anode itself and the additives such as binder contained in the elec-trode and etc. contribute largely15). It is considered that this result agrees with the theoretical value because the coating film itself containing the active material is a rela-tively high density equivalent to the consumer electrode.
To confirm that the actual film thickness agrees with the theoretical value regarding the measurement after finish-ing the measurement, the SEM pictures of the electrode cross section before and after the charge and the dis-charge, in conjunction with the measurement result of the electrode thickness after 10 and several cycles were shown in Figure 6, respectively. Point A is the electrode thickness before the charge and point B is the one after finishing the charge. About 24% electrode thickness
expansion in average was observed after charge accord-ing to the SEM pictures which measures the active mate-rial thickness in the multiple points from the electrode center.
Because the SEM observation agreed with the result at the end of the measurement, it is proven that this elec-trode thickness measurement is carried out accurately.
By investigating each of the result during the charge and the discharge and after the charge and the dis-charge, the reasonable result about film thickness mea-surement was obtained. From this result, it is thought that the measurement technique to measures the long-term (The electrode degradation occurs.) and the qualitative electrode height information as the thickness has been established.
The factor of the continuous electrode thickness increase of graphite based electrode will be discussed. Regarding the film thickness observed this time, 2 factors of the increase other than the lithium intercalation and de-intercalation will be discussed. At first, the anode film thickness increase due to the expansion of the electrode itself will be discussed. The configuration is that even the electrolyte is filled in the cell, the electrode is not immersed completely. Therefore, it is assumed that the penetration of the electrolyte is largely depending on the reaction of the charge and the discharge. Since the charge and discharge efficiency of 2nd cycles are signifi-cantly improved against the 1st cycle, it is thought that the expansion due to the penetration of the electrolyte to the active material is involving in the charge and the dis-charge of 1st cycle.
Next, the deposition of the electrolyte decomposed material from the electrolyte and the formation of SEI will be discussed. In the lithium-ion battery, it is known that the decomposition reaction of the electrolyte occurs. Moreover, as described before, it is known that ion-con-ducting film derived from the electrolyte decomposition material is formed1) and, it is known that the reaction of the lithium-ion intercalation and de-intercalation to the graphite is accelerated because SEI is formed on the sur-face of the electrode1) and the charge and discharge effi-
0
6
12
-1000
-500
0.05
0
0 0.1 0.15 0.2 0.25 0.3
dQ
/ d
V
Voltage[V vs Li/Li+]
(b)
(a)
Hei
ght
chan
ge [%
]
Figure 5 The measurement result of graphite electrode after 1 cycle.
(a) Height change (%) (b) dQ/dV vs. Voltage (V vs. Li/Li+)
0 2000 4000 60000
10
20
30
A
A
24%
~~
~~ Cu-foil
active material
B
Hei
ght
chan
ge [%
]
Time [min]
8000
B
Figure 6 The graphite electrode measurement result and the SEM image after charge and discharge cycles.
(A) original (B) after the charge and the discharge cycles.

Furukawa Review, No. 46 2015 34
The Quantitative Evaluation of Anode Thickness Change for Lithium-ion Batteries
ciency of anode electrode is improved. In this measurement result also, it is assumed that the
SEI formed material and the reaction deposition material due to the decomposition of the electrolyte are generally observed as the thickness increases. Because the charge and discharge efficiency is improved at 2nd cycles and it was maintained at subsequence cycles, it is assumed that SEI formation is a dominant reaction at 1st cycle. Further, since the tendency for the film thickness expan-sion to saturate was seen after 2nd cycles, it is assumed that the SEI formation or the electrolyte decomposition occurs after 2nd cycles also. It is thought that these fac-tors contribute in a complex manner so that the battery degradation is accelerated.3.2 The Electrode Thickness Measurement Using
Si-based Electrode.Based on the result of the previous chapters, because the techniques to measure the electrode height information due to the graphite electrode degradation in terms of the thickness quantitatively, the result of the Si based elec-trode thickness measurement using the current collection copper foil having different mechanical property will be discussed next.
When the charge and discharge test is carried out using different kind of copper foil, it was clarified that the difference occurs in the film retention capability and the difference of volume retention ratio of active material also occur. In the report of Sakai et al.8) also, the result that the charge and discharge test using the Si based active material differs according to the copper foil strength is shown and it is reported that in the charge and discharge test using the high strength metal of the SUS foil as an anode current collector, a high charge and discharge effi-ciency compared to the conventional copper foil is main-tained even after the long-term cycles.
It is thought that the difference in the deformation degree due to the current collector foil samples is because the different deformation behavior occurs against the active material expansion by the mechanical characteristic value of the current collector strength and elongation. Especially, in the case where the copper foil adheres to the electrode tightly using organic binder such as polyimide and others, it is considered that the direct stress due to the expansion and contraction is applied to the copper foil and it is plastically deformed. Therefore, aiming to measure, not only the expansion and the con-traction of the high capacity material, but also the defor-mation behavior during the charge and discharge test, the electrode thickness measurement has been per-formed using the technique established in chapter 3.1.
By mixing the Si based active material and the artificial graphite, the electrode of about 800 mAh/g was designed and the electrode was fabricated by coating it to the one side of the current collector copper foil. To compare the deformation behavior, 2 kinds of copper foils were used. One is a conventional foil with 10 um thickness and the other is a high strength foil. The condition other than elec-
trode information is equivalent to Table 1 and the charge and discharge test of 10 cycles has been carried out.
At first, the test result of the thickness change behavior using the conventional foil is shown in Figure 7. The thick-ness change behavior during the charge and the dis-charge and the discharge capacity are also shown in this figure.
The saw-tooth type expansion and contraction behavior due to the charge and the discharge same as the graph-ite based electrode described in the previous chapter was observed. During CC charge and CV charge the elec-trode was expanding and during CC discharge, the elec-trode was contracting. The amount of charge for the first time was 976 mAh/g and the capacity of discharge was 733 mAh/g. The efficiency of the charge and the dis-charge was 75%. It is assumed that because sub-reaction such as SEI formation occurs, the overcharge occurs. However, the result was that the charge and discharge capacity is reduced continuously after 2nd cycles and the discharge capacity was reduced to about 20% at 10 cycles. With the decrease of the discharge capacity, the phenomenon, where the peak of the saw-tooth type expansion and contraction behavior becomes smaller, was observed. As a cause, it is assumed that because the anode current collector copper foil cannot support the severe expansion and contraction behavior of the Si based active material, the electrode delamination occurs and the discharge capacity is decreased. Also, as described in chapter 3.1, it is clarified that the expansion due to the penetration of the electrolyte, furthermore, the deposition of the electrolyte decomposed material and the SEI formation contribute to the electrode expansion and contraction in conjunction with the expansion and contraction behavior of the active material, respectively, but it is assumed that the copper foil deformation is accel-erated because these factors contribute in a complex manner.
From this result, the thickness measurement during
01020304050607080
-1000
-500
0
500
1000
Hei
ght
chan
ge [%
]Time [min]
Cap
acity
[mA
h/g]
0 1000 2000 3000 4000 5000 6000
(a)
(b)
Figure 7 The result of the electrode height measurement by the thickness measurement technique using a conventional foil.
(a) Height change (b) Potential change

Furukawa Review, No. 46 2015 35
The Quantitative Evaluation of Anode Thickness Change for Lithium-ion Batteries
continuous 10 cycles of charge and discharge of the Si based active material was successful for the first time. However, the capacity reduction was severe and the result was difficult to say that the thickness increase behavior due to the sufficient charge and discharge reac-tion was observed.
Here, if the thickness change behavior is observed very carefully, the discontinuous height variation different from the expansion due to the charge was observed at 2nd cycles of discharge and at 4th cycles of charge in the charge and discharge test of conventional copper foil. The enlarged figure of its discontinuous variation is shown in Figure 8.
From this figure, because the discontinuous contraction was observed during the charge that the only expansion behavior shall be observed, it was suggested that there was a possibility where the deformation and contraction of the current collector copper foil occurred at this point.
Next, with regards to the test result using the high strength foil, the thickness change behavior and the dis-charge capacity during the charge and the discharge are shown in Figure 9.
With regards to the expansion amount of the electrode, the discharge capacity of about 800 mAh/g was achieved at 1st cycle and the charge and discharge efficiency for
the first time was 76.5%. It was confirmed that while main-taining the discharge amount of about 90% against the first discharge amount after 2nd cycles, the charge and discharge continued up to 10 cycles. The fact that the electrode thickness was expanding by 87% at the end of 10 cycles was clarified.
In the case that the high strength foil is used against the conventional foil mentioned before, the discharge amount of about 90% is maintained against the first discharge amount and by using the high strength foil, it was con-firmed that there is an effect that the retention of the capacity is improved. It is considered that the delamina-tion and the drop out of the coating film are reduced because the deformation of the current collector is sup-pressed by using the high strength foil.
Next, in order to compare the degree of deformation of the current collector copper foil after the charge and dis-charge test, the picture of the electrode after the charge and discharge test was taken from the side of the current collector copper foil. They look as in photographs shown in Figure 10. In the case of the high strength foil, although there are irregularities on the surface slightly, the phe-nomenon where the entire current collector is deformed was not observed. Moreover, almost no delamination was observed in the active material coated on the copper foil. In contrast, in the case of the conventional foil, the copper foil warped inside and the electrode deformed largely in the form of a downwardly convex. Also, the coated active material is delaminated largely and very few active materi-als were adhering to the current collector. From these results of thickness measurement and charge and dis-charge test, it was confirmed the predicted deformation of copper foil occurs actually.
After measurement, in order to confirm that the film thickness measurement result agrees with the actual film thickness, the observation of the cross sectional thick-ness by SEM was performed for the high strength foil in which the active material remained on the surface. The SEM picture before and after the charge and discharge test is shown in Figure 11. From the SEM image, when the electrode in the SEM image is observed, the elec-trode is expanded by 87% in average and the measured height also agreed so it was confirmed that the electrode
01020304050607080
5
10
15
0 200 400 600Hei
ght
chan
ge [%
]
Hei
ght
chan
ge [%
]
Time [min]elapsed time for 4cyc [min]0 1000 2000 3000 4000 5000 6000
Figure 8 The enlarged view of the discontinuous height change in Figure 7 (a).
020406080
100120
-1200
-700
-200
300
800 (b)
(a)
Time [min]
Hei
ght
chan
ge [%
]C
apac
ity [m
Ah/
g]
0 1000 2000 3000 4000 5000 6000 7000
Figure 9 The measurement result of the Si based electrode height by the thickness measurement technique using the high strength copper foil.
(a) Height change (b) Potential change
Conventional High strength
Figure 10 The appearance of the electrode after 10 cycles.

Furukawa Review, No. 46 2015 36
The Quantitative Evaluation of Anode Thickness Change for Lithium-ion Batteries
thickness which contains active material was measured accurately.
From this result, it was confirmed that with respect to the electrode thickness expansion and the copper foil deformation behavior, those combined results can be measured as the height information.
4. CONCLUSION
(1) The quantitative and continuous measurement tech-nique of the electrode thickness change has been established.
(2) The behavior that the graphite based active material and the Si based electrode thickness expands con-tinuously has been clarified.
(3) It has been clarified that factors other than the expansion and the contraction of the active material will affect largely the actual electrode deformation. As factors, the expansion of the active material layer, the deposition of the electrolyte sub-reaction prod-uct and the SEI formation are considered.
(4) By using the high strength copper foil, the suppres-sion of copper foil deformation and the improve-ment of the charge and discharge efficiency of the Si based active material have been successful.
(5) The observation of the deformation behavior of the coating film and the copper foil during the charge and the discharge has been successful.
5. AT THE END
In accordance with the expansion of the lithium-ion bat-tery application such as in mobile equipment and others, it is assumed that the roles and the characteristics of the copper foil to play as a component of the battery will be diversified. In the future, by investigating the comprehen-sive understanding of the phenomena that occur during the charge and the discharge, we will intensify the knowl-edge of the anode current collector copper foil through the establishment of the charge and discharge evaluation technique for the next generation battery components.
REFERENCES
1) C. Daniel and J. O. Besenhard (Editors), Hand Book of Battery Materials, 70-75 WILEY-VCH Verlag GmbH & Co.KGaA
2) M. N. Obvovac et al., J. Elec. Chem. Soc., 154(9), 849-855 (2007) 3) Hun-Joon Sohna et. al., J. Power. Source., 222, 129-134 (2013) 4) R. J Staniewicz et al., J. Power. Source., 97-98, 13-21 (2001) 5) Y. Y. Wang et al., J. Elec. Chem. Soc., 151(4), A542-A547 (2004) 6) S. Yada et al., Practical Evaluation Technology for Lithium Ion
Battery and Capacitor, Japan Association for International Chemical Information, (2009)
7) R. Okuyama et al., GS Yuasa Technical Report, 9 (1) 7-13 (2012) 8) R. Kötz et al., Electrochem. Solid-State Lett., 11 (9), A151-A154
(2008) 9) T. Sakai et al., Electrochemistry, 80 (6), 405-408 (2013) 10) T. Ohsaki, et al., Solid State Ionics, 80, 291-298 (1995) 11) Y. Maeda, Z. Takehara et al., The third edition, Battery handbook
260-26 (2001) 12) Kenji Fukuda et al., Material Integration 17(-1) 45-50 (2004) 13) Z. Okumi, The second edition, Lithium Secondary Battery, Ohmsha
(2010) 14) J. O. Besenhard et al., J. Power. Source, Soc., 54, 228-231 (1995) 15) Y. Ishida et al., Hitachi Kasei Technical Report, 36, 27-36 (2001)
0
50
100
A
B
BA
87%
Hei
ght
chan
ge [%
]
Time [min]
Cu-foil
active material
0 2000 4000 6000
Figure 11 The graphite electrode measurement result by the thickness measurement technique and the SEM image after the charge and discharge cycles.
4. CONCLUSION
5. AT THE END