the randomized complete block design (rcbd) · • the objective of this tutorial is to give a...
TRANSCRIPT

The Randomized Complete Block Design (RCBD)
Trudi Grant Department of Horticulture and Crop Science
OARDC, The Ohio State University 2010

• The objective of this tutorial is to give a brief introduction to the design of a randomized complete block design (RCBD) and the basics of how to analyze the RCBD using SAS.

The RCBD is the standard design for agricultural experiments where similar experimental units are grouped into blocks or replicates.
It is used to control variation in an experiment by accounting for spatial effects in field or greenhouse.
e.g. variation in fertility or drainage differences in a field

The field or space is divided into uniform units to account for any variation so that observed differences are largely due to true differences between treatments.
Treatments are then assigned at random to the subjects in the blocks-once in each block
The defining feature of the Randomized Complete Block Design is that each block sees each treatment exactly once

Advantages of the RCBD
Generally more precise than the completely randomized design (CRD).
No restriction on the number of treatments or replicates.
Some treatments may be replicated more times than others.
Missing plots are easily estimated.

Disadvantages of the RCBD
Error degrees of freedom is smaller than that for the CRD (problem with a small number of treatments).
Large variation between experimental units within a block may result in a large error term If there are missing data, a RCBD experiment may be less efficient than a CRD
NOTE: The most important item to consider when choosing a design is the uniformity of the experimental units.

The Layout of the Experiment
• Choose the number of blocks (minimum 2)
– e.g. 4
• Choose treatments (assign numbers or letters for each)
– e.g. 6 trt – A,B, C, D, E, F

1
F
E
D
C
B
A
2 3 4 Blocks
Treatments
The number of blocks is the number of
replications
Any treatment can be adjacent to any other treatment, but not to the same treatment within the block
Treatments are assigned at random within blocks of adjacent subjects, each treatment once per block.
Image credit: Francis Lab, The Ohio State University

Excel randomization
To generate random numbers
Use =RAND () ctrl enter
Randomize blocks
[DATA, SORT by column w/ =rand()]
• Randomize treatments in each block independently
The first step is to randomize the treatments and blocks. This can be done in excel using the RAND function

1. Column A –
list of blocks
2. Column B
Enter =rand()
to generate a
random
number
3. Copy and paste command
in remaining cells

4. Select cells
5. Select data then select sort 6. Then sort by column
with random numbers
Output in excel showing randomized blocks in first column. This is repeated for each block to randomize the treatments

proc factex; factors block / nlev=4; output out=blocks block nvals=(1 2 3 4); run; factors trt / nlev=6; output out=rcbd designrep=blocks randomize (101) trt cvals=('A' 'B' 'C' 'D' 'E' 'F'); run; proc print data=rcbd; run;
Randomization for both blocks and treatments can be
done using a SAS code

The SAS System 14:30 Monday, August 4, 2008 3 Obs block trt 1 2 B 2 2 C 3 2 A 4 2 D 5 2 E 6 2 F 7 1 B 8 1 C 9 1 E 10 1 A 11 1 F 12 1 D 13 3 D 14 3 A 15 3 C 16 3 F 17 3 B 18 3 E 19 4 A 20 4 F 21 4 B 22 4 C 23 4 D 24 4 E
SAS output showing randomized blocks and treatments

1
F
E
D
C
A
2 3 4
B
E
B
C
A
D
D
F
A
E
F
E
D
C C
A B
F
B
Experimental design showing randomized blocks and treatments
Image credit: Francis Lab, The Ohio State University

Have data in a format that can be
directly imported into SAS or you can
copy and paste your data into SAS
If importing data:
Have 1st line for variable names and
data must start on line 2
Make sure you have variable names
consistent with SAS, use only letters,
numbers and _, and avoid spaces.
Analysis using SAS

Model for RCBD
• Yij - any observation for which i is the treatment factor
j is the blocking factor
• μ - the mean
• Ti - the effect for being in treatment i
• Bj is the effect for being in block j

ANOVA table
Source Degrees of Freedom
Sums of squares (SS)
Mean squares F
Blocks b-1 Block SS BMS=BSS/b-1 BMS/ RMS
Treatment t-1 Treatment
SS TMS=TSS/t-1
TMS/ RMS
Residual (t-1)(b-1) Residual SS RMS=RSS/ (t-1)(b-1)
Total tb-1 SS Total
t=number of treatments, b=number of blocks GM = grand mean, BM = block mean and TM= treatment mean
BSS = Sum (BM-GM)2 TSS = Sum (TM-GM)2 RSS = Sum (V-BM-TM+GM)2

SAS Editor
Data step: Creates a SAS
system data file
Proc steps: Perform
operations using the files
created.
Always end with ‘;’
Programs for RCBD analysis
Proc GLM
Proc Mixed

SAS Editor
The program steps are
determined by the
experimental design,
how you collected your
samples and how you
want your data
presented.

SAS code for Analysis of RCBD
Sample SAS GLM statements:
PROC GLM;
CLASS BLOCKS TREATS;
MODEL WC = BLOCKS TREATS;
RUN;
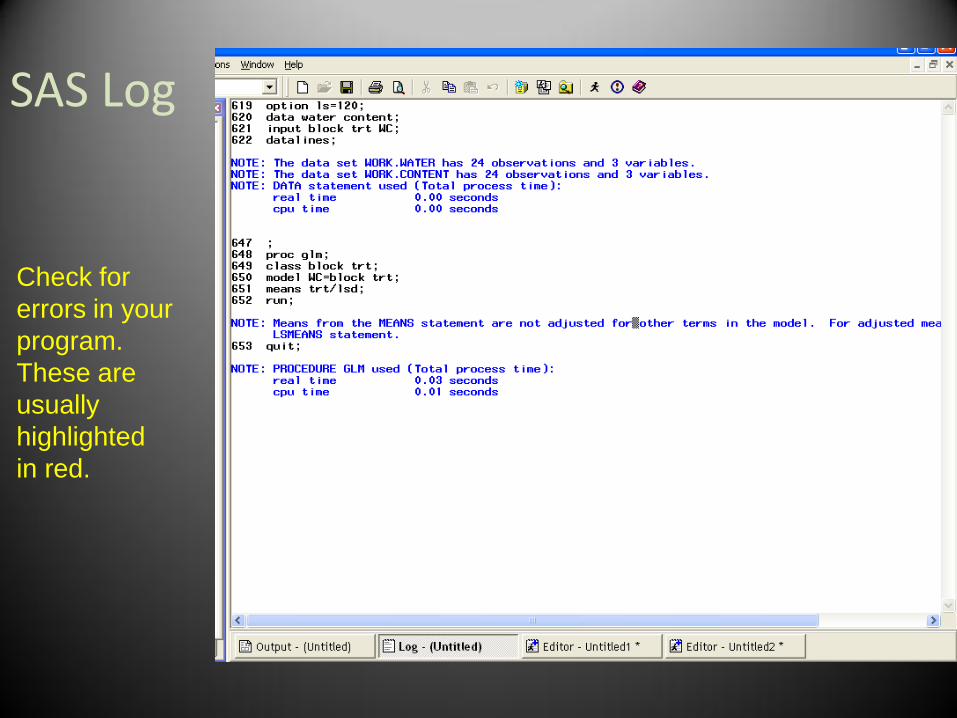
SAS Log
Check for
errors in your
program.
These are
usually
highlighted
in red.

SAS Output
Check your Class
Level information
e.g. Check for correct
number of blocks
and treatments

SAS Output
Provides degrees
of freedom, sums of
squares, F values
and probabilities

SAS Output
If the probabilities
indicate significant
differences, a
comparison between
means can be done
using the Least
Significant Difference
(LSD)
Written in your SAS
code as:
means trt/lsd

Treatments with
different letters
have significant
differences
between them
SAS Output

External Link
SAS [Online]. SAS Institute. Available at: www.sas.com/ (verified 5 Jan
2011).

Additional Resource
Clewer, A. G., and D. H. Scarisbrick. 2001. Practical statistics and experimental design for plant and crop science. John Wiley & Sons Ltd., New York. 001. Practical statistics and experimental design for plant and crop science. John Wiley & Sons Ltd., New York.