the rapidminer gui manual - huihoodocs.huihoo.com/rapidminer/rapidminer-4.3-guimanual.pdf · the...
TRANSCRIPT
The RapidMiner GUI Manual
November 22, 2008
Abstract
This document describes the usage of the graphical user interface (GUI) of the datamining software package RapidMiner. Since the interface was intended to ease the usageof RapidMiner avoiding handling of XML configuration files, there should be almostnothing to explain. Hence this document describes the very basic ideas of RapidMinerand their representations in the GUI. We suggest that you first make the online tutorialand read this document. After that, you will find it much easier to read the RapidMinerTutorial and skip a lot of its contents.
Contents
1 General Information 1
2 Setting up a Process 22.1 The online tutorial . . . . . . . . . . . . . . . . . . . . . . . . . . . . . . . 22.2 The Wizard . . . . . . . . . . . . . . . . . . . . . . . . . . . . . . . . . . . 22.3 Operator Configuration Wizards . . . . . . . . . . . . . . . . . . . . . . . 42.4 The tree view and other process views . . . . . . . . . . . . . . . . . . . . 4
2.4.1 Editing parameters . . . . . . . . . . . . . . . . . . . . . . . . . . . 52.5 Creating, deleting, moving and replacing operators . . . . . . . . . . . . . 52.6 Operator info . . . . . . . . . . . . . . . . . . . . . . . . . . . . . . . . . . 72.7 The attribute editor . . . . . . . . . . . . . . . . . . . . . . . . . . . . . . 7
3 Validating your process definition 9
4 Running your process 9
5 Evaluating the results 105.1 Plotter . . . . . . . . . . . . . . . . . . . . . . . . . . . . . . . . . . . . . . 11
5.1.1 Zooming . . . . . . . . . . . . . . . . . . . . . . . . . . . . . . . . . 12
6 Settings 12
1 General Information
Although the RapidMiner tutorial and this GUI manual contain a huge amount ofinformation about RapidMiner and all of its parts, it is often very convenient to get thedesired information during work. Therefore, we added an online help function to almostall parts of RapidMiner. Each parameter, operator and GUI item displays informationas tool tip text, which appears after holding the mouse cursor a few moments above theobject at hand.
1

2 Setting up a Process
When RapidMiner starts up, it presents you a welcome screen that lets you choosebetween five possibilities
• Start with a blank process setup
• Open one of the recently used process definitions
• Open an existing process definition
• Start the Process Creation Wizard
• Start the RapidMiner online tutorial
2.1 The online tutorial
When you start RapidMiner the first time, you should probably make the online tutorial.It explains the main concepts, the GUI usage and shows many of the operators providedby RapidMiner.
2.2 The Wizard
We assume that you have chosen to start the Wizard (figure 1). The Wizard is alsoavailable from the File menu. The Wizard guides you during the process of creating a newprocess. You start by selecting a template process from a list. This template serves as akind of skeleton for your process.
Figure 1: The RapidMiner Process Creation Wizard is a simple way to create basic processdefinitions.
2

Processes in RapidMiner are made up from a set of nested operators. An operatorconsumes a set of input objects and produces some output objects. These objects canbe data files, models, performance criteria, and more. Simple operators like learnersconsume an example set and produce a model that can be used by an applier for prediction.Moreover, some operators can have inner operators. For example, a k-fold cross-validationsplits up an example set into training set and test set and applies its inner operators, whichare a learner and an applier. Each time a disjoint test set is used.
If you click on the radio button next to the ”SVM with XValidation” template, thestructure of the sample process is depicted on the right. You see an operator chainconsisting of an ExampleSource that reads data from a file. This data is then passed tothe cross-validation, which itself has inner operators, in this case learner and applier fora support vector machine (SVM). See the RapidMiner Tutorial for more information onSVMs and the individual operators.
Now that you have chosen the template, click on next. In this step you can enter someof the most important parameters (figure 2). In case of a cross-validation this is e. g. thenumber of validations.
Figure 2: The parameter editing step of the Wizard.
A lot of process setups in RapidMiner need a data file as input which is known insupervised learning as an example set. The example sets have to be in a special formatand require that the attributes are described in a seperate XML file. In other words, thefile in special format is the set of examples where each example is a vector and the XMLfile describes the semantics of every value in the vector.
In order to create such an XML file now, you can press the small Edit button next toan attribute description file property. The dialog popping up is described in section 2.7and is called Attribute Editor. The files generated with help of the Attribute Editor canalso be used as input for the ExampleSource operator, which is the standard data inputoperator for RapidMiner.
3
2.3 Operator Configuration Wizards
An even more convenient way of loading almost arbitrary data files into RapidMinerand to define attribute description files for your data, is to use the Example Sourceconfiguration wizard. Just press the Start Configuration Wizard. . . button at the top ofthe parameter table of the operator. Configuration wizards are also available for otheroperators which are hard to define, e.g. for the DatabaseExampleSource operator.
2.4 The tree view and other process views
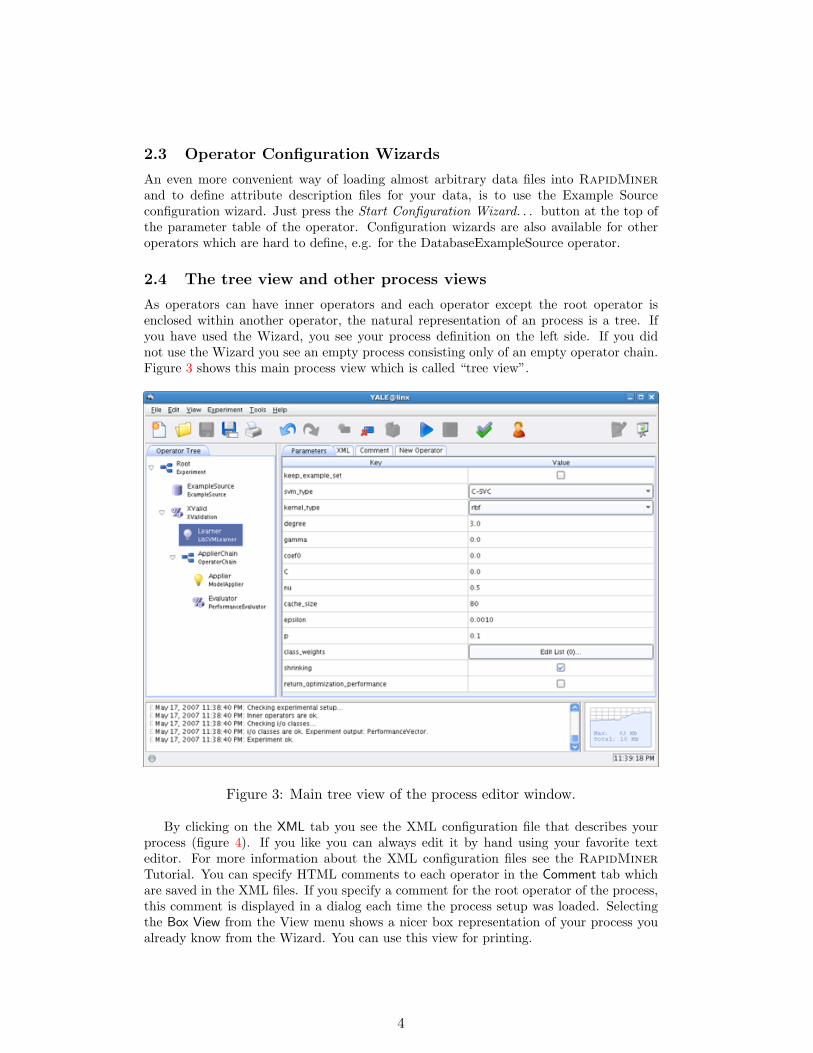
As operators can have inner operators and each operator except the root operator isenclosed within another operator, the natural representation of an process is a tree. Ifyou have used the Wizard, you see your process definition on the left side. If you didnot use the Wizard you see an empty process consisting only of an empty operator chain.Figure 3 shows this main process view which is called “tree view”.
Figure 3: Main tree view of the process editor window.
By clicking on the XML tab you see the XML configuration file that describes yourprocess (figure 4). If you like you can always edit it by hand using your favorite texteditor. For more information about the XML configuration files see the RapidMinerTutorial. You can specify HTML comments to each operator in the Comment tab whichare saved in the XML files. If you specify a comment for the root operator of the process,this comment is displayed in a dialog each time the process setup was loaded. Selectingthe Box View from the View menu shows a nicer box representation of your process youalready know from the Wizard. You can use this view for printing.
4
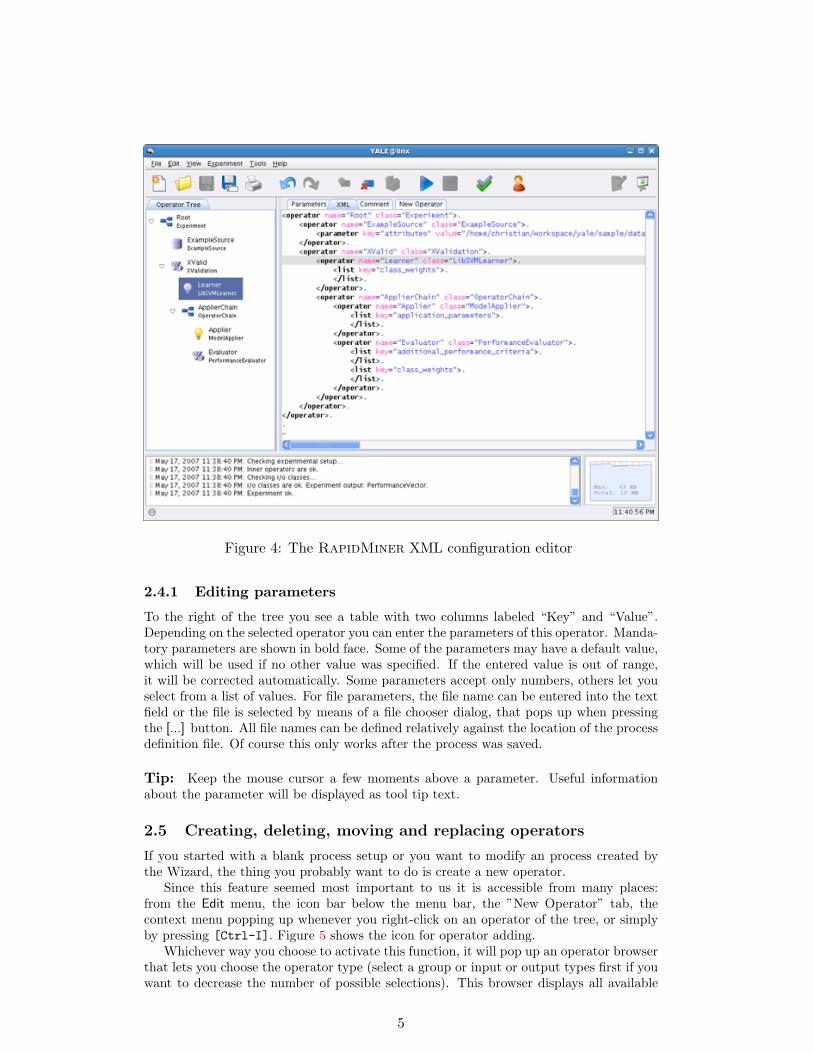
Figure 4: The RapidMiner XML configuration editor
2.4.1 Editing parameters
To the right of the tree you see a table with two columns labeled “Key” and “Value”.Depending on the selected operator you can enter the parameters of this operator. Manda-tory parameters are shown in bold face. Some of the parameters may have a default value,which will be used if no other value was specified. If the entered value is out of range,it will be corrected automatically. Some parameters accept only numbers, others let youselect from a list of values. For file parameters, the file name can be entered into the textfield or the file is selected by means of a file chooser dialog, that pops up when pressingthe [...] button. All file names can be defined relatively against the location of the processdefinition file. Of course this only works after the process was saved.
Tip: Keep the mouse cursor a few moments above a parameter. Useful informationabout the parameter will be displayed as tool tip text.
2.5 Creating, deleting, moving and replacing operators
If you started with a blank process setup or you want to modify an process created bythe Wizard, the thing you probably want to do is create a new operator.
Since this feature seemed most important to us it is accessible from many places:from the Edit menu, the icon bar below the menu bar, the ”New Operator” tab, thecontext menu popping up whenever you right-click on an operator of the tree, or simplyby pressing [Ctrl-I]. Figure 5 shows the icon for operator adding.
Whichever way you choose to activate this function, it will pop up an operator browserthat lets you choose the operator type (select a group or input or output types first if youwant to decrease the number of possible selections). This browser displays all available
5

Figure 5: The new operator icon.
information about the currently selected operator. You should name the operator beforeyou add it into your process. You can always rename an operator by pressing [F2] ortriple clicking it in the tree view. Figure 6 shows the operator browser.
Figure 6: The Operator Browser for information and operator adding.
Another way to add an operator is to right click on the parent operator and selectthe operator from the New operator submenu. Adding operators directly from the contextmenu is a very fast way of process design. Both ways of adding are only possible if anoperator chain is selected, i.e. an operator which can have children.
Tip: Keep the mouse cursor a few moments above an operator in the submenus. Usefulinformation about the operator will be appear as tool tip text.
You can replace an operator by selecting the new operator from the submenu Replaceoperator of the context menu. This is similar to adding a new operator from the contextmenu instead of using the operator browser. When you replace an operator chain theinner operators will remain. Therefore, operator chains containing any children can onlybe replaced by other operator chains.
6
Removing the operator is even easier. Just press [Delete] or select the correspondingmenu item from the context menu or the Edit menu. Figure 10 shows the icon for operatordeleting.
Figure 7: The remove operator icon.
You can use the “Drag & Drop” functionality to move an operator up or down withinthe tree.
2.6 Operator info
Pressing [F1] brings up a dialog with useful information about the currently selectedoperator. This option is also available from the context menu of each operator or theTools menu. This operator info dialog displays:
• a short description• which input the operator demands• which output the operator delivers• the minimum number of inner operators, if the selected operator can have children• the maximum number of inner operators, if the selected operator can have children• errors in process setup (if errors exist)• a description or comment text field
2.7 The attribute editor
Example sets or instance sets in RapidMiner are described by using a separate XMLdocument. This attribute description file contains information about the type of data andits source. Data sets can be distributed over several files. This may be particularly usefulif the label is stored within a file of its own. The RapidMiner Tutorial will give help incase you want to edit this file yourself.
The GUI displays a small Edit button next to an attribute description file property(e. g. the parameter attributes of an ExampleSource) in the property editor. A dialog calledAttribute Editor will pop up containing a table with one column for each attribute (figure9). If the property does not yet reference a proper attribute description file, the dialogwill be empty. If you want to follow the instructions below, which describe how to createthe XML description file, you can clear the table by clicking on the corresponding buttonabove the table, or selecting ”Clear” from the ”Table” menu, to start from scratch.
Figure 8: The clear button.
Assume, you have a data file containing 50 rows of whitespace or comma separatedattribute values, five each row. Click on load data to open that file. After that you shouldsee five columns with some headers each and the data in the table cells. Question marks(“?”) indicate missing values. The following enumeration explains the meanings of thetable headers:
7

Figure 9: The Attribute Editor dialog for data loading and attribute description file creation.
1. The first header row contains the source file and column index. This is not editablebut just for your information.
2. The second rowshows the name of each column. You can edit the name by clickinginto the text field.
3. The third row indicates, what the data is used for. For example, it can be anordinary attribute, a label for classification or regression tasks, or a weight that canbe used with certain algorithms. There can be at most one label and one weightattribute.
4. The fourth row is the value type. Most interesting are the choices real / integer andnominal. RapidMiner should have automatically detected these correctly.
5. The last header row is the block type. Most interesting are single value (default)and value series. For some processes, value series are treated in a special way. Donot forget to assign value series start and value series end to the first and last columnrespectively.
You can change the values according to your needs and load an arbitrary number of datafiles. Finally click on Save attribute description file, which you can find in the file menu,to write the XML file to disk, or just click on the ”Save” button.
Figure 10: The button for saving an attribute description file.
8
Tip: If you do not want to use this RapidMiner standard data format, you can useone of the provided special format operators which can read Arff files, comma separatedvalue files (csv), bibtex files, dBase files, C4.5 files, and more.
Tip: An even more convenient way of loading almost arbitrary data files into Rapid-Miner and to define attribute description files for your data is to use the Example Sourceconfiguration wizard. Just press the Start Configuration Wizard. . . button at the top ofthe parameter table of the operator. Configuration wizards are also available for otheroperators which are hard to define, e.g. for the DatabaseExampleSource operator. Thewizards are self explaining, just follow the steps and read the instructions.
3 Validating your process definition
Before you run your process you should validate it. You can click on Validate Process inorder to check if all operators are nested correctly, provided with their necessary inputand mandatory properties are set (figure 11). Although this might be useful, you do notneed to do it manually, since these checks are performed automatically before the processis started.
Figure 11: The validate process icon.
The result of the validation including all error messages is printed into the messageviewer at the bottom of the main frame. Additionally, they are indicated by an exclama-tion mark next to the operator in the tree view. An example is shown in figure 12. Youcan display these messages and more information about the operator by pressing [F1] orselecting the Operator info menu item from the context menu or from the Tools menu.
Process validation is very important in order to create proper process definitions andcan help to understand the concepts of RapidMiner. We therefore recommend to useprocess validation as often as possible, at least once before you start your process. To-gether with the breakpoints from the operator context menu, it is usually much easier todesign new or complex processes.
4 Running your process
Running your process is quite easy. Select Run from the Process menu or click the corre-sponding play button, which is shown in figure 13.
You may follow the progress of your process by observing the output which is displayedin the Message Viewer. Note, that in GUI mode, the output does not need to be written toa log file. If you did not specify a log file, you can always save the message viewer contentsto a file by selecting the corresponding menu item in the Message Viewer’s context menu.You can also perform a search in the Message Viewer. This option is also accessible fromthe context menu of the viewer.
Tip: The amount of logging messages can be defined by the parameter log verbosity ofthe Process operator (the root of the process tree). This operator also provides otherparameters useful for the complete process.
9

Figure 12: Error Messages in the Message Viewer (lower part) highlighting the errors in theprocess.
Figure 13: The process run icon.
5 Evaluating the results
When your process is finished, the results will be automatically presented, i. e. all outputreturned by the outermost operator. This can be performance statistics, a decision treeor anything else. RapidMiner automatically selects the Results Mode. You can switchbetween the Edit Mode and the Results Mode by clicking on the two buttons in the topright corner, or by selecting the mode in the View menu. Pressing the hotkey [F9] isanother possibilityto toggle between both modes.
When your process was conducted successfully, the view automatically switches to theResults Mode. As far as your process chain produces an output, this mode shows you avisualization or a text describing the output. Figure 14 shows a decision tree learned fromthe golf data set.
At any time you can stop or pause (and resume) the process using the appropriatebuttons or menu items in the Process menu. In any case the operator currently beingexecuted will finish its execution in the background. Since this might take some time (e.g.if the current operator was a learner) this might lead to a delay for the actual processtermination. Please be patient. You can, however, directly start and perform changes tothe current process setup and even restart the process.
10
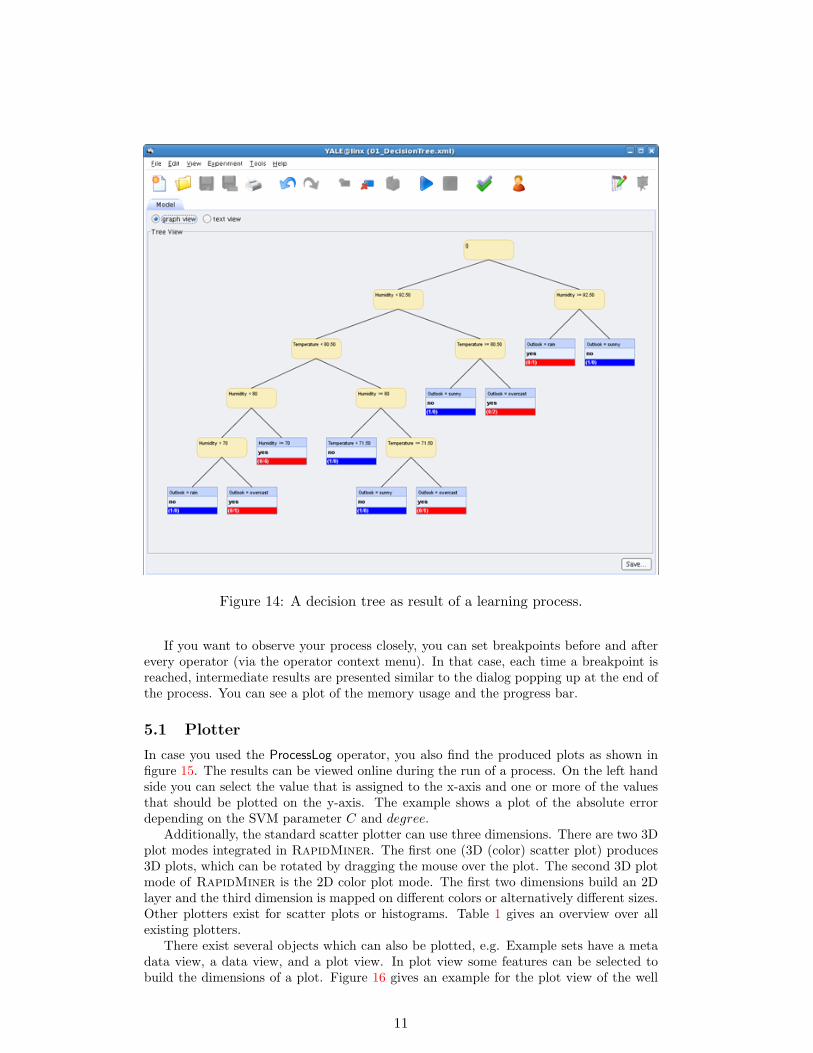
Figure 14: A decision tree as result of a learning process.
If you want to observe your process closely, you can set breakpoints before and afterevery operator (via the operator context menu). In that case, each time a breakpoint isreached, intermediate results are presented similar to the dialog popping up at the end ofthe process. You can see a plot of the memory usage and the progress bar.
5.1 Plotter
In case you used the ProcessLog operator, you also find the produced plots as shown infigure 15. The results can be viewed online during the run of a process. On the left handside you can select the value that is assigned to the x-axis and one or more of the valuesthat should be plotted on the y-axis. The example shows a plot of the absolute errordepending on the SVM parameter C and degree.
Additionally, the standard scatter plotter can use three dimensions. There are two 3Dplot modes integrated in RapidMiner. The first one (3D (color) scatter plot) produces3D plots, which can be rotated by dragging the mouse over the plot. The second 3D plotmode of RapidMiner is the 2D color plot mode. The first two dimensions build an 2Dlayer and the third dimension is mapped on different colors or alternatively different sizes.Other plotters exist for scatter plots or histograms. Table 1 gives an overview over allexisting plotters.
There exist several objects which can also be plotted, e.g. Example sets have a metadata view, a data view, and a plot view. In plot view some features can be selected tobuild the dimensions of a plot. Figure 16 gives an example for the plot view of the well
11

known Iris dataset.
5.1.1 Zooming
Drag a rectangle to zoom into the selected range. Right click sets the view back tomaximal range. This type of zooming is only supported for the 2D scatter plots. Forsome of the other plotters zooming might be implemented during a slider in the optionspane on the left or even by simply turning the mouse wheel.
Figure 15: A plot of a parameter optimization run.
6 Settings
You can open a dialog for global settings(Preferences) from the Tools menu. These settingsspecify the behavior of RapidMiner for different tasks, e.g. if the system should beepat the end of an process or how many examples (data points) are displayed in the resultviewer. The settings dialog allows to set all global properties described in the Rapid-Miner tutorial, including the path to the executables of external programs. You canapply the changed settings only for the current session or save them for future sessions.
12

Plotter DescriptionScatter A 2D scatter plot which is also capable of plotting lines
and a third dimension by colorizing the third dimensionScatter Matrix A matrix plot of scatter plottersScatter 3D A 3D scatter plotScatter 3D Color A 3D scatter plot colorizing a 4th dimensionBubble A 2D plot using the size of each bubble to represent
a third dimensionParallel Each dimension is plotted on parallel coordinatesSurvey A survey plot plotting sorted histograms in parallelSOM A Self-Organizing Map plot using a Kohonen net for
dimensionality reductionDensity A 2D plotter using two dimensions as axis, one dimension
as density color, and one dimension for point colorsPie A 2D pie chart (allows group by aggregation average)Pie 3D A 3D pie chart, like 2D but with depth and transparencyRing A ring plot, like the 2D pie chartAndrews Curves Parallel coordinates after a sort of Fourier transformHistrogram A histogram plot for one of the dimensionsHistrogram Color A histogram plot for one of the dimensions where the
values are binned according to another dimensionHistrogram Matrix A histogram plot for all dimensionsHistrogram Color Matrix A color histogram plot for all dimensions binned
by one (nominal) dimension beforehandQuartile A quartile plot (aka box plot) for one of the dimensionsQuartile Color A quartile plot for one of the dimensions where the
values are binned according to another dimensionQuartile Color Matrix A color quartile plot for all dimensions binned
by one (nominal) dimension beforehandSticks A stick plot, similar to the bars plotSticks 3D A 3D stick plotBars A 2D bar chart (allows group by aggregation average)Bars 3D A 3D bar chart, like 2D but with depthBox A 2D scatter plot where another dimension can define a
box around the points (often used for variance)Box 3D A 3D scatter plot where another dimension can define a
box around the points (often used for variance)RadViz A plotter with radial visualisation anchorsGridViz A plotter with grid visualisation anchorsSurface 3D A 3D surface plot (only available for less data points)
Table 1: A collection of all RapidMiner plotters.
13
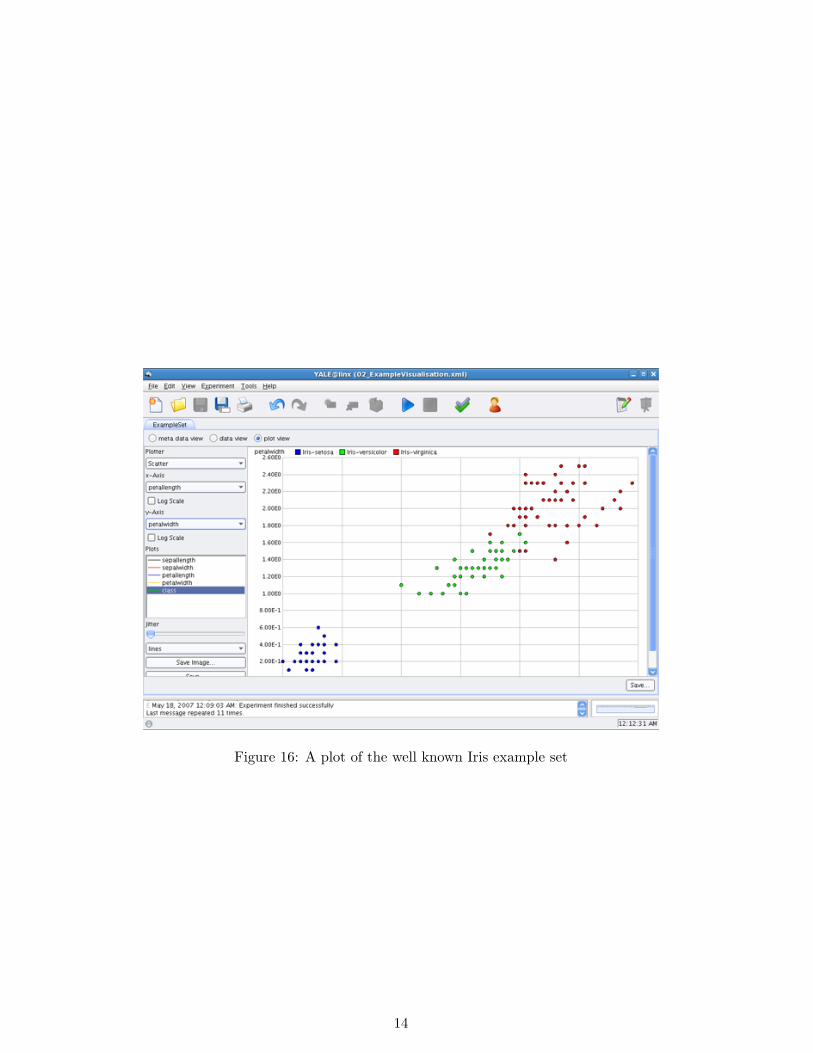
Figure 16: A plot of the well known Iris example set
14