the razors edge: distortions and incremental reform in the … · 2018-05-15 · i introduction...
TRANSCRIPT
The Razor's Edge:Distortions and Incremental Reformin the People' s Republic of China
"Sages say the path [to salvation]is narrow and difficult to tread,narrow as the edge of a razor."*
Alwyn Young"This version: March 1997.
(*) From the Katha-Upanishad, as translated by Mascaro (1965). A similar message appears in the NewTestament: "Enter ye in at the strait gate: for wide is the gate, and broad is the way, that leadeth to destruction, andmany there be which go in thereat: Because strait is the gate, and narrow is the way, which leadeth unto life, andfew there be that find it." St. Matthew, 7, 13-14.
(**) Department of Economics, Boston University. This research was supported by the Canadian Institutefor Advanced Research and a Sloan Foundation Fellowship. I am grateful for the valuable comments I havereceived from countless seminar participants, as well as the editors and referees of the WE. Mary Ann Connollyand Him Chung provided long suffering research assistance. As always, my greatest debt is to Ho Veng-Si, whosecomments and criticism shaped this project from its inception.
I Introduction
Analyses of the transition to market in centrally planned economies have identified two
potential pitfalls in the process of incremental economic reform. First, the removal of govern-
ment mandated controls in one part of the economy, in the context of continued distortions else-
where, can, for standard second best reasons, lead to a fall in output (Murphy, Shleifer and
Vishny 1992). Second, political opposition may develop along the path of reform, stalling the
reform process or reversing it altogether (Dewatripont & Roland 1995, Martinelli & Tommasi
1994). In this paper I use the reform experience of the People's Republic of China to highlight a
third potential pitfall. Incremental reform leads to the creation of rental opportunities which, due
to the gradual nature of the reform process, are fairly long lasting. This allows for a prolonged
battle to capture, and then protect, these rents, leading to the creation of new distortions in the
economy. In this sense, the reform process can be derailed; while some distortions are elimi-
nated, moving the "train" of the economy to market, others are added, drawing it off on unex-
pected tangents.
As early as 1986, the government of Zhejiang province began to restrict the sale of silk
cocoons to other parts of China. Each harvest season the government bureaucracy, from the pro-
vincial level all the way down to village units, and including police and militia forces, was mobi-
lized to ensure that Zhejiang's silk farmers sold their silk cocoons locally, for local processing or
direct export. Under the plan, the prices of raw materials such as silk were kept artificially low
while the prices of final goods, such as silk fabric, were kept high. During the 1980s, with the
relaxation of central controls on rural industry, locally controlled silk processing industries
developed rapidly in Zhejiang, a traditional producer of silk cocoons, to capture the rents implied
by the artificial price wedge. The trade embargos of the mid 1980s onwards appeared as other
provinces tried to purchase silk cocoons, at above planned procurement prices, directly from
Zhejiang farmers, bidding away the rents the Zhejiang government could acquire from local pro-
1
cessing or direct export.' In the first half of 1988 silk factories in Shanghai, located next door to
Zhejiang and Jiangsu, the principal domestic producers of silk, received only 40 tonnes of their
planned allocation of 2000 tonnes of raw silk. In a country which, all by itself, accounted for
60% of world production and 90% of world exports of raw silk, Shanghai found itself in the sur-
prising position of using valuable foreign exchange to import silk for its factories?
The "silkworm cocoon war" described above was just one of the many interregional trade
conflicts, in both raw materials and finished manufactured goods, which appeared in the People's
Republic during the 1980s and 1990s. While a full description of the factors behind this interre-
gional conflict will be given further below, it is worth outlining the main features of the argu-
ment at this stage. Under the central plan raw material prices were kept low and final goods
prices high, generating substantial surpluses in manufacturing and processing industries, which
funded the government budget. As central controls over factor and material allocations were
relaxed, local governments throughout the country moved to develop manufacturing industries
and restrict the outward movement of raw materials, in an attempt to capture the rents implicit in
centrally mandated price wedges. Growing overcapacity in a number of industries, combined
with the elimination of central controls over prices and the growth of interregional free market-
ing, threatened industrial profit margins and led to burgeoning trade conflicts as local govern-
ments tried to control prices and limit "foreign" competition using a variety of administrative and
physical bathers to interregional trade. Having developed financial and political interests in a
particular industrial and price structure, local governments continued to defend those interests,
even after the original motivating factors (i.e. centrally mandated distortions) had largely disap-
peared. The removal of these new distortions posed an additional challenge to reformers intent
upon moving the economy toward free market institutions.
' See Chen (1994), preface pp. 1-2 and text pp. 7-8.
2 Far Eastern Economic Review (hereafter, FEER), "In a spin" (23 March 1989).
2
This paper proceeds as follows: Section II below, "Stories," provides a fuller description
of how incremental reforms in the People's Republic devolved power to local governments and
led to the development of competitive local industrial policies and interregional barriers to trade.
According to this account, in the reform era local governments throughout the Chinese economy
entered high margin industries to capture the implicit monopsony and monopoly rents these
enjoyed. As interregional competition developed, barriers to trade were used to defend other-
wise untenable industrial structures. Empirically, this story suggests that one should observe
convergence in the interregional structure of production during the reform era, one which can
credibly be described as a movement against the patterns of specialization implied by compara-
tive advantage. To this end, section III, "Data", presents data on the interregional dispersion of
production. Unlike the Soviet Union, which sought to achieve economies of scale through
industrial concentration, under the central plan the People's Republic pursued a policy of forced
industrial duplication, regardless of the dictates of comparative advantage, as it sought to pro-
mote economic self sufficiency in the different regions of the economy. Despite this legacy, I
find that the dominant trend during the reform period was for further convergence, as provinces
and cities continued to duplicate each other's industries.
Section IV, "Explanations", examines alternative explanations of these aggregate trends,
considering, in particular, their relation to patterns of comparative advantage. I begin with the
simplest possible analysis, asking whether the observed convergence in the structure of produc-
tion might not simply be described as the consequence of a convergence in levels of income. In
the presence of transport costs, patterns of local demand will influence the structure of local
production. Further, to the degree that the interregional dispersion of comparative advantage
(e.g. capital-labour ratios) is related to the interregional dispersion of income, changes in the
income distribution proxy for the influence of comparative advantage on the dispersion of pro-
duction. I find that while, historically, the dispersion of income is significantly related to the
dispersion of production in the People's Republic, changes in the moments of the interregional
3
income distribution during the reform period are too small to account for anything but a small
fraction of the observed convergence in the structure of production. Put differently, in the rela-
tion between the dispersion of production and the dispersion of income there is a statistically sig-
nificant, and dominant, negative time trend; for any level of income dispersion the dispersion of
production falls rapidly, both during the period in which the plan pursued forced diversification
and during the period of economic reform.
Next, I turn to a more direct consideration of the influence of changes in trade barriers and
comparative advantage on patterns of production and factor allocation. Free trade tends to hide
the underlying determinants of comparative advantage, transforming factor abundance and
autarky price advantages into traded quantities of production. As trade barriers increase, how-
ever, comparative advantage is revealed. One can show, in particular, that, across a wide variety
of models, a rise in trade barriers reveals patterns of comparative advantage by raising the
average product of labour in industries in which the economy has a comparative advantage
while, simultaneously, lowering the allocation of labour to those sectors. In contrast, for given
levels of trade barriers, if an economy's comparative advantage converges to that of its neigh-
bours, the relative average product of labour in the sectors in which it (formerly) had a compara-
tive advantage will come to resemble that of its trading partners. Decomposing the interregional
variation in the structure of production into the variance of relative labour productivities, the
variance of relative labour allocations, and the covariance between the two, I find that both the
interregional variation in average products and labour allocations rose during the reform period,
while the covariance between the two deteriorated rapidly. The correlation between labour allo-
cations and labour productivities, about zero in 1978, had fallen to -.8 by 1992, as regions
increasingly concentrated labour in sectors in which its average product was, perversely, lower.
These changes, while incompatible with a convergence in patterns of comparative advantage, are
precisely what is predicted by a rise of interregional barriers to trade.
Finally, I consider the role of transport constraints. While a movement to autarky might be
4
caused by an increase in trade barriers, it could just as easily be driven by a rise in the relative
cost of internal transport. Anecdotal accounts of an overstrained transport structure (particularly
railways) and a rapid fall in the domestic movement of goods relative to GDP during the reform
period support this hypothesis. However, there has been a substantial improvement in the quality
of transport infrastructure and, perhaps more importantly, there is little statistical evidence of
increasing transport delays, which one would expect in an environment with worsening capacity
constraints. Most fundamentally, however, I find that the decline in internal transport has been
greatest in the coastal areas, which have access to coastal shipping but have nevertheless chosen
to use a rising fraction of port capacity for international trade. These data suggest that the falloff
in internal transport is less driven by supply constraints than by a falloff in demand. Overall, the
data of Section IV are consistent with the view of an economy that has expanded its international
linkages while raising barriers, and reducing the degree of interregional specialization, in its own
internal market. Section V concludes the paper.
5
II Stories
Any review of the reform period must, perforce, take as its starting point the legacies of 30
years of central planning. Three aspects of the planning system, in particular, had a profound
influence on the development of local policy during the 1980s. First, as shown in Table I, reve-
nue collection under the plan was concentrated in the industrial sector which, by the mid-1960s,
accounted for three quarters of the consolidated budgetary revenue of the central and local
governments? With the prices of raw materials kept artificially low relative to the prices of final
industrial goods, industrial processing enterprises reaped unusually high returns, which were
then handed over to the government, either in the form of turnover (indirect) taxes or through the
direct remittance of profits. Wong (1992) explains that this system was patterned after the Soviet
'Government revenue by sector is computed net of enterprise losses. In addition, histori-cally price subsidies were counted as negative revenue, while debt issues and payments werecounted as part of revenue and expenditure, respectively. Price subsidies were shifted fromrevenue to expenditure in 1986. Beginning in 1994, debt and interest was no longer includedunder revenue and expenditure. Further, beginning in that year, all capital construction financedby foreign borrowing was removed from expenditure. Using the data on various budgetary itemsin the China Statistical Yearbook (hereafter, CSY) and the China Public Finance Yearbook Ihave been able to construct a consistent historical series, which forms the basis of the data pres-ented in Table I and Figure I below, using the following methodology: (1) Price subsidies arecounted as part of expenditure, not as negative revenue; (2) Debt issues and interest payments areexcluded from revenue and expenditure (I could not separate out interest payments alone); (3)Capital formation financed by foreign borrowing is included in expenditure; and (4) Revenue bysector continues to be computed net of enterprise losses.
An important issue is the treatment of "extra-budgetary" revenue, which grew from 31% ofrevenue (using my series, which matches the most recent official definition of revenue) in 1978to 111% in 1992. Until 1992 the definition of extra-budgetary revenue included the various sur-charges and levies raised by governmental departments as well as the many funds retained byenterprises but earmarked for specific use, e.g. welfare, bonus, and capital construction andtechnical updating funds. While it is true that local governments tap the extra-budgetary funds ofenterprises (Wong 1991a), it seems excessive to consider the full value of these funds as beingunder government budgetary control (this is almost equivalent to considering the depreciationallowances or investment tax credits of U.S. firms as being part of the U.S. government budget).In 1993 Chinese statistics stopped counting the funds of state-owned enterprises and agencies aspart of extra-budgetary revenue, lowering extra-budgetary revenue to 33% of the value of bud-getary revenue in that year. If one similarly excludes state enterprises from the 1978 data, thevalue of extra-budgetary revenue as a percent of budgetary revenue falls to 8%. With regards tothis paper, since extra-budgetary funds are not reported by sector of origin and, furthermore,since there is no historical breakdown of non-state enterprise extra-budgetary funds into localand central categories, I cannot adjust the earlier data and, hence, do not include extra-budgetaryrevenue in the data reported below.
6
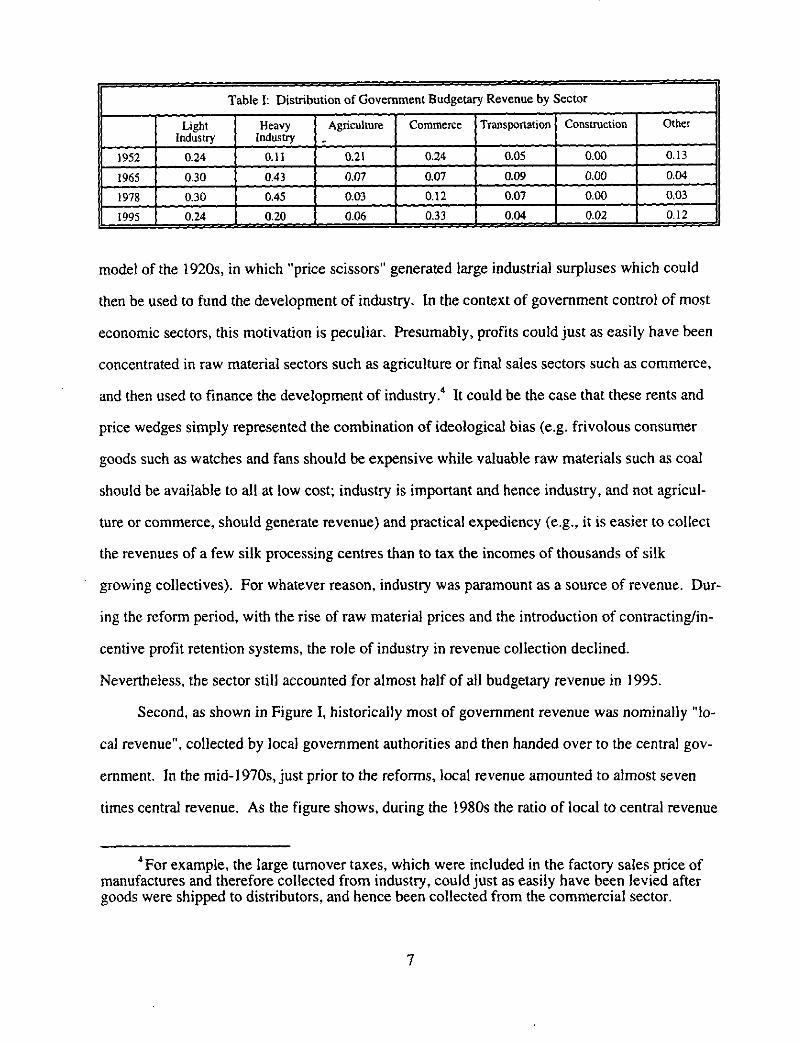
Table I: Distribution of Government Budgetary Revenue by Sector
LightIndustry
HeavyIndustry
Agriculture Commerce Transportation Construction Other
1952 0.24 0.11 0.21 0.24 0.05 0.00 0.13
1965 0.30 0.43 0.07 0.07 0.09 0.00 0.04
1978 0.30 0.45 0.03 0.12 0.07 0.00 0.03
1995 0.24 0.20 0.06 0.33 0.04 0.02 0.12
model of the 1920s, in which "price scissors" generated large industrial surpluses which could
then be used to fund the development of industry. In the context of government control of most
economic sectors, this motivation is peculiar. Presumably, profits could just as easily have been
concentrated in raw material sectors such as agriculture or final sales sectors such as commerce,
and then used to finance the development of industry. 4 It could be the case that these rents and
price wedges simply represented the combination of ideological bias (e.g. frivolous consumer
goods such as watches and fans should be expensive while valuable raw materials such as coal
should be available to all at low cost; industry is important and hence industry, and not agricul-
ture or commerce, should generate revenue) and practical expediency (e.g., it is easier to collect
the revenues of a few silk processing centres than to tax the incomes of thousands of silk
growing collectives). For whatever reason, industry was paramount as a source of revenue. Dur-
ing the reform period, with the rise of raw material prices and the introduction of contracting/in-
centive profit retention systems, the role of industry in revenue collection declined.
Nevertheless, the sector still accounted for almost half of all budgetary revenue in 1995.
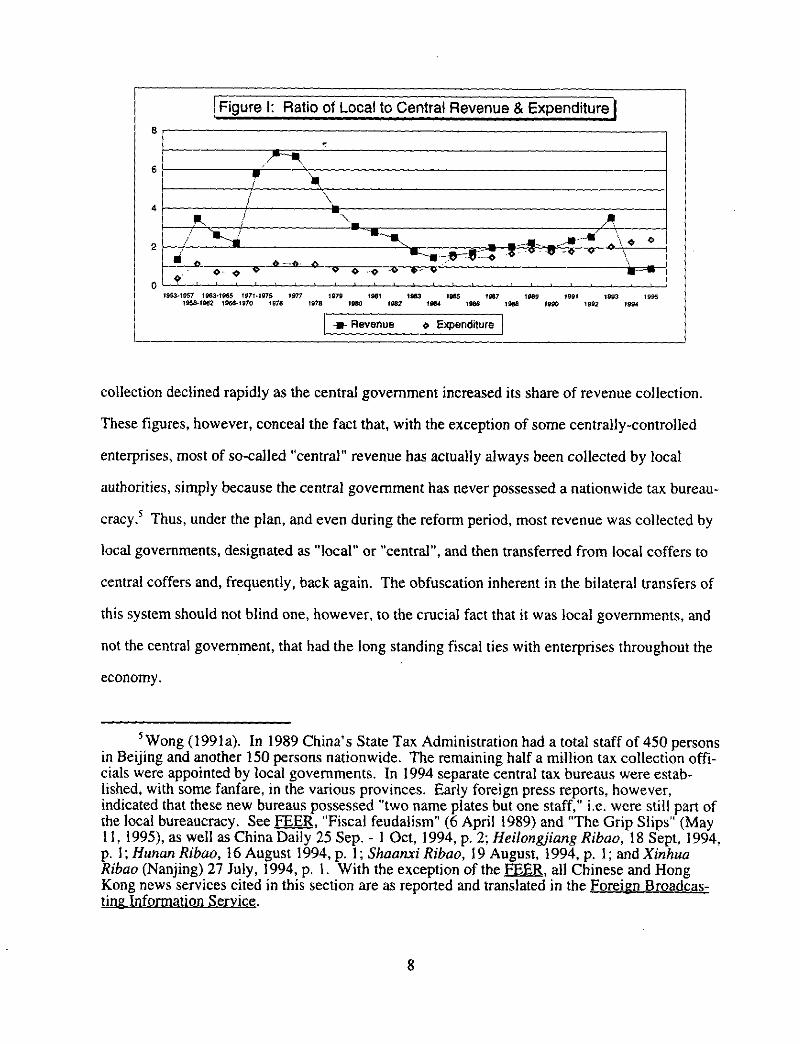
Second, as shown in Figure I, historically most of government revenue was nominally "lo-
cal revenue", collected by local government authorities and then handed over to the central gov-
ernment. In the mid-1970s, just prior to the reforms, local revenue amounted to almost seven
times central revenue. As the figure shows, during the 1980s the ratio of local to central revenue
For example, the large turnover taxes, which were included in the factory sales price ofmanufactures and therefore collected from industry, could just as easily have been levied aftergoods were shipped to distributors, and hence been collected from the commercial sector.
7
B
6
4
2
0
Figure I: Ratio of Local to Central Revenue & Expenditure I
*
P.. I1 4i
Il•—.N. 4. •
',tr._111_-_110 O9
1. „ , ,,,,,, ,1953.1957 19831985 1971.1975
19511-1082 1966-1970 19781977
107111970 1981 1063
moo 10811995 1907
19114 1906 19801989
10901991
19921903 1995
1994
-ii- Revenue o Expenditure
collection declined rapidly as the central government increased its share of revenue collection.
These figures, however, conceal the fact that, with the exception of some centrally-controlled
enterprises, most of so-called "central" revenue has actually always been collected by local
authorities, simply because the central government has never possessed a nationwide tax bureau-
cracy.' Thus, under the plan, and even during the reform period, most revenue was collected by
local governments, designated as "local" or "central", and then transferred from local coffers to
central coffers and, frequently, back again. The obfuscation inherent in the bilateral transfers of
this system should not blind one, however, to the crucial fact that it was local governments, and
not the central government, that had the long standing fiscal ties with enterprises throughout the
economy.
'Wong (1991a). In 1989 China's State Tax Administration had a total staff of 450 personsin Beijing and another 150 persons nationwide. The remaining half a million tax collection offi-cials were appointed by local governments. In 1994 separate central tax bureaus were estab-lished, with some fanfare, in the various provinces. Early foreign press reports, however,indicated that these new bureaus possessed "two name plates but one staff," i.e. were still part ofthe local bureaucracy. See FEER, "Fiscal feudalism" (6 April 1989) and "The Grip Slips" (May11, 1995), as well as China Daily 25 Sep. - 1 Oct, 1994, p. 2; Heilongjiang Ribao, 18 Sept, 1994,p. 1; Hunan Ribao, 16 August 1994, p. 1; Shaanxi Ribao, 19 August, 1994, p. 1; and XinhuaRibao (Nanjing) 27 July, 1994, p. 1. With the exception of the FEER, all Chinese and HongKong news services cited in this section are as reported and translated in the Foreign Broadcas-ting Information Service.
8
A third legacy of the pre-reform era was the duplication of industries across provinces and
the active involvement of provincial and local authorities in economic planning. Enjoying, by
the mid-1960s, hostile relations with its neighbours in almost every direction, the People's
Republic began a conscious attempt to develop duplicate sets of industries in each region and
province, so as to be better able to sustain economic activity in the event of a foreign invasion.
This policy extended beyond the duplication of key military industries to a general programme of
promoting local self-sufficiency in most areas of industrial production. Pressed by the complex-
ity of directing the growing number of small local enterprises, and probably dislocated by the
political events of the time, the central planning apparatus during the Cultural Revolution
(1966-1976) increasingly relinquished control of detailed planning to provincial authorities,
focusing, instead, on managing the interprovincial transfer of key materials and products .° With
material supplies only ensured when one actually produced them oneself, and with the central
regime actively encouraging and funding the local development of industries, each province,
county, city and locality tried to develop its own duplicate set of industries.' It is important to
note, however, that despite the widespread industrial diversification, central controls over entry
into high margin industrial sectors were maintained (Wong 1988) and, consequently, industrial
6 See Naughton (1991) and Wong (1985, 1991 b). The description above sounds morecoherent than the system actually was. For example, almost all enterprises were decentralized tolocal control but, when their management proved too complex for provincial authorities, putunder the planning of central ministries (while remaining locally "controlled" enterprises). Atthe same time, the staff of the central planning agencies (material supply, statistics, etc.) was liq-uidated, falling to a total of 610 employees in 1970. In the words of no less an expert than Per-kins (1988): 'By some mechanism, inputs and outputs and their allocation between enterpriseswere coordinated in a way that avoided the chaos of the Great Leap Forward, and thiscoordination was in no sense achieved through a revived market mechanism...It is not clear justwho in the bureaucracy did much of the planning and control of enterprises, but planning andcontrol through the bureaucracy did take place."
' Wong (1985) recounts how in Huangshi city (Hubei) there were four iron and steel mills:one setup by and beholden to the central government, one established by the provincial authori-ties to meet their needs, one setup (near the other two mills) by the municipal government tomeet its requirements, and one established by the suburban county, which, needing only 3000tons of pig iron a year, could not get its requirements satisfied by allocations from other produc-ers.
9
rents remained concentrated in a few select regions. Thus, in 1981, Shanghai, with its important
processing industries, earned budgetary revenues equal to 10 times total expenditures and, while
producing only 7% of GDP, accounted for 45% of the total net local to centre transfer of budget-
ary funds in the economy.8
With this background in mind, I now turn to a review of developments during the reform
period. From almost the very beginning, the central government sought to improve the effi-
ciency of industrial production and public administration by hardening the budget constraints of
both state enterprises and local governments. Beginning in 1979, the historical system of full
remission of enterprise surpluses (and central coverage of losses) was replaced with contracts
specifying the division of profits between the government and enterprises, with incentives for
exceeding historical values. Unfortunately, each enterprise, in each locality, operated under
unique historical circumstances. Some enterprises had unusually large or small capital stocks,
others produced goods where profits were high or low because of distortions in state prices,
whereas still others were engaged in the difficult production of goods in unusual locations (as
mandated by the pre-reform policy of industrial diversification). Consequently, contracts had to
be negotiated on an enterprise by enterprise basis, with opportunities for renegotation and
renegement (by both sides). 9 Similarly, beginning in 1980, under the policy of fenzao chifan
("eating in different kitchens"), the central government attempted to separate the central and
local budgets by establishing revenue contracts with the local authorities. As in the case of
8 I calculate Shanghai's net transfer as the difference between its revenues and expendituressince the provinces are not supposed to engage in debt finance and, with the exception of therollover of small surpluses and deficits, appear to maintain budget balance on an annual basis.Estimated from China's Government Finance Statistics 1950-1985 Hsueh, Li and Liu (1993)and CSY 1993.
9 The li gai shui (tax-for-profit) system, advanced in 1982-1985, sought to limit the needfor detailed bargaining by introducing a complex set of interlocking and compensating universaltax rates which, varying by product, assets, etc., would compensate for all of the pre and post-plan distortions. However, the li gai shui initiative met with strong opposition and by 1986 wasabandoned in favour of a return to enterprise by enterprise contracting, which persists to this day.
10
industrial enterprises, each province's circumstances were unique, requiring a different contract-
ing system. Thus, some provinces remitted a lump sum tax, others remitted a proportion of total
revenue, while, in still other cases, revenue sources were divided between central, local, shared
and "adjustment" (subject to yet another formula for sharing). Budgetary contracts, while often
"established" for five year periods, were, again much like enterprise contracts, subject to frequent
renegotiation as circumstances and policies changed.
For all its imperfections, the contracting system undoubtably hardened local and enterprise
budget constraints and improved fiscal and industrial efficiency by providing an objective func-
tion (albeit moving) with marginal rates of central taxation well below 100%. In the process,
however, it inadvertently devolved power to local authorities and strengthened the ties between
local governments and state enterprises. Enterprise contracting shifted power from the centre to
local governments since these, with their historical tax and administrative ties with enterprises
and detailed knowledge of local circumstances, were best positioned to negotiate and monitor
contracts for themselves and the central government. The hardening of local budgets increased
the interest of local authorities in industrial enterprises, where the main revenue surpluses were
to be found. Local governments could control input prices and costs, minimizing reported "prof-
its" (which might have to be shared with the centre), while still maximizing the surpluses avail-
able for local coffers. While local governments could draw revenue from industry, their broader
interest centred around the financial well-being of state enterprises as these traditionally provided
housing and a wide variety of social services (e.g. health, retirement, disability, burial, recre-
ation, etc.) to their workers. In sum, in attempting to harden budget constraints, in the context of
continued price distortions and no attempt to clarify the residual ownership of enterprises or
separate their social from their industrial functions, the central government merely transferred
enterprise control, and the responsibility for sustaining enterprise well-being, down to the local
1 1
level.I°
A second, critical, reform initiative focused on the development of rural industry as a
means of absorbing surplus resources (i.e. labour) in the countryside. Beginning in 1977, the
decline in central procurement of farm products and capital equipment and the introduction of
rural labour responsibility systems freed material, capital and labour resources for use by rural
enterprises. While rural industry, as it developed during the Cultural Revolution, had previously
been restricted to sectors with small margins, such as agricultural machinery repair and farm
tools, these restrictions were now removed. Further, the central government actively encouraged
the development of rural industry by instructing the Agricultural Bank of China to provide low-
interest loans, requiring that half of state budgetary allocations to communes be used for rural
enterprise development, and instructing central and local authorities to incorporate the supply of
rural enterprises into their plans." Most importantly, three year tax holidays were granted to par-
ticular industries (e.g. cement plants) and to all enterprises which might have some initial diffi-
culty in paying taxes, which, in practice, ended up granting exemption, on all income and
turnover taxes, to all new enterprises. With turnover/indirect taxes as high as 66% in some
sectors, tax exemptions were crucial, allowing rural enterprises, even inefficient rural enterprises,
to capture the rents implicit in the margins enjoyed by firms in the urban processing centres.
Local governments, spurred on by central initiatives aimed at hardening their budget constraints,
naturally suported this shifting of rents which, in the absence of well developed private capital
markets to support investment, was mostly undertaken by collective organizations. While tax
'°For a history of reforms in enterprise taxation and how these enlarged local power, seeNaughton (1985) and Wong (1987, 1992). FEER "The Grip Slips" (May 11, 1995) provides arecent review of the degree to which central government control over finance has devolved intothe hands of local authorities. Song (1992) and Wong (1992) review the different types ofcentral-local contracting systems.
"As with all Chinese policies, there were zigs and zags. In 1981-1982 rural entry intosome sectors was restricted and some rural enterprises were forcibly shut down. By 1984, how-ever, these policies had been reversed in favour of further bank lending and the removal of mostrestrictions on entry.
12
exemptions denied the central government any share of the captured rents, informal local levies
could determine their distribution between the collective organizations and local government
coffers. In 1984 contributions for local social expenditure and other levies amounted to 44% of
the nationwide after-tax profits of rural enterprises (Wong 1988).
The growth of rural industry as the arbitrager of artificial price wedges inevitably led to the
development of interregional trade barriers. Local governments in regions which traditionally
produced raw materials moved downstream into processing, diverting outward bound raw mate-
rial shipments, at low planned prices, to their own factories. Traditional processors, starved of
material inputs, responded by sending buyers to raw material districts, offering above plan prices
directly to raw material producers such as farmers. Since their financial interests were linked to
processing, and not raw material production, governments in raw material producing districts
moved to prevent these sales, using trade barriers to turn themselves into monopsony buyers of
raw materials at low prices. This led to the development of "wars" over coal, cotton, jute, silk-
worm cocoons, and tobacco, among other materials.' 2 In the area of finished goods, such as high
margin light industrial consumer products, the duplication of production throughout the country
led, reportedly, to growing overcapacity. As central controls over prices were relaxed and pri-
vate marketing channels developed, rural producers found themselves in competition with each
other and with the traditional, more efficient, producers of finished products. To protect their
industrial interests, provincial, county and, even, city governments found it expedient to erect
barriers to trade so as to maintain high local final industrial goods prices. Aside from tariff bath-
12 111 the Chinese press, coverage of the battles to control resources, the diversion ofplanned allocations to local industry, the interpretation of local motivations as an attempt to cap-ture the rents implicit in price wedges, and the role the hardening of local budget constraintsplayed in spurring official intervention can be found in: Jingjixue Zhoubao, 30 April 1989, p. I;Zhongguo Tongxun She broadcast, 355 GMT 11 Aug. 1989; Jingji Ribao (Beijing) 11 Nov.1989, p. 2; Jingji Guanli (Beijing) No. 12, Dec. 1989, pp. 18-21; Renmin Ribao 11 June 1990, p.6; Jingji Cankao (Beijing) 4 June 1990 p. 1, 27 April 1990 p. 1, 24 June 1990 p. 1, 20 July 1990p.1; and China Daily (Beijing, Business Weekly) 10 Dec. 1990, p. 4. For this draft of the paper,I have focused on citations for the 1989-1991 period in this and the following two footnotes.
13
ers (i.e. special charges levied at road blocks), non-tariff methods such as physical barriers, out-
right prohibition, low interest loans and other financial benefits for commercial establishments
marketing local goods, fines for commercial establishments marketing non-local goods, legal
restrictions on price differences between local and non-local goods sold in commercial establish-
ments, local purchasing quotas, and administrative trivia (e.g. medical, sanitation, epidemic pre-
vention, product quality, measurement and other such licences and certificates) were used to
hamper trade in products as varied as textiles, automobiles, trucks, perfumes, beverages, plastics,
matches, household electrical appliances, electrical machinery, bicycles, pens, alcohol, washing
powders and soaps, tires, tractors, engines, processed foods, and food flavourings.° The legal
system was also subverted, as enterprises were encouraged not to pay non-local bills, the courts
ignored non-local pleas, rulings and fines were issued against non-local producers, and judges
who ruled in favour of non-local firms were punished.14
While the central regime railed, in a number of circulars, against interprovincial trade
wars, sent down task forces to mediate conflicts at provincial borders and even went so far as
establishing a separate ministry, the Ministry of Internal Trade, whose main purpose was to
enliven "circulation" and distribution, its other policies inadvertently encouraged interregional
°For coverage of the trade barriers, reference to the growing overcapacity of a number ofindustries brought about by excessive duplication, and interpretation of the interventions of localgovernments as stemming from their financial relations with industrial enterprises, see Liaowang(Beijing) No. 45, 6 Nov. 1989, pp. 18-20; Wen Wei Po (Hong Kong) 24 Jan. 1991, p. 6;Hangzhou-Zhejiang Provincial Broadcast Service 1000 GMT 21 Dec. 1990; Guangming Ribao 3Nov. 1990, p. 3; Tangtai (Hong Kong) No. 41, 8 Sep. 1990, pp. 13-14; Jingji Ribao (Beijing) 14July 1990, p. 2; Renmin Ribao 30 July 1990 p. 2, 5 June 1990 p. 5; Jingji Cankao (Beijing) 24June 1990 p. 1, 4 June 1990 p. 1; Ta Kung Pao (Hong Kong) 22 June 1990, p. 2; China Daily(Beijing) 9 June 1990, p. 1; Xinhua Domestic Service 0815 GMT 8 May 1990, 1031 GMT 10April 1990; Ching Chi Tao Pao (Hong Kong) No. 9, 5 March 1990, pp. 8-9; Zhongguo TongxunShe (Hong Kong) 0909 GMT 11 Feb. 1990; Harbin Heilongjiang Provincial Service 2100 GMT31 May 1990, and Qunyan (Beijing) No. 2, 7 Feb. 1991, pp. 22-23. For a recent foreign pressarticle on overcapacity in textiles and the diversion of raw material supplies to less efficientfirms, see FEER "Protection Has a Price" (29 August 1996).
14 On the use of the legal system, see Tangtai (Hong Kong) No. 41, 8 Sep. 1990, pp.13-14; Renmin Ribao 10 Dec. 1991, p. 5; Shanghai City Service 2300 GMT 5 Dec. 1990; andJingji Cankao (Beijing) 1 April 1990, p. 4.
14
conflict. 15 Thus, for example, the allocation of special trading rights on a regional basis, in par-
ticular to the Special Economic Zones and Guangdong province, led to conflict as other regions
tried to prevent the loss of export earnings brought about by the diversion of their exports to
these gateways to the international market. 16 Perhaps the most destructive element, however,
was the central regime's policy on price controls. During the Cultural Revolution, in recognition
of the fact that the policy of forced industrial diversification led to inefficient production, the
central regime allowed localities to set their own, higher, final goods prices (Wong 1987). This
policy was maintained, and apparently expanded, during the reform period. With each round of
price liberalization, while the central government reduced the number of centrally mandated
price controls it simultaneously acquiesced to, explicitly allowed or, in some cases, even vig-
orously mandated, the local maintenance of price controls." In a planned economy, where state
15 Chen (1994, pp. 2, 33-36) indicates that central task forces were sent down, on an annualbasis, to mediate disputes at Zhejiang's borders. He also notes that circulars and directivesagainst interregional trade barriers were issued by the State Council, Party Congress, People'sCongress, etc. in 1980, 1981, 1982, 1984, 1985, 1987, 1988, 1989, and 1990. The establishmentof the Ministry of Internal Trade and its mission are highlighted in Beijing Central TelevisionProgram One Network, 1100 GMT 10 April 1993, Xinhua Domestic Service 0339 GMT, 28 July1993, China Daily 29 July 1993, p. 1 and Renmin Ribao, 2 August 1993, p. 2.
16 While most regions were only allowed to retain about a quarter of the foreign exchangegenerated by their exports, Shenzhen SEZ (in Guangdong) was allowed to retain 100%. In 1988,Hunan and Guangxi were reported to be patrolling their border with Guangdong province,restricting the movement of goods to their neighbour. Senior officials in both provinces com-plained that goods shipped to Guangdong for subsequent export as "Guangdong" goods robbedthem of valuable foreign exchange. FEER "Beggar thy neighbour" (12 January 1989).
"The nationwide decontrol of grain prices in 1992-1993 provides a wonderful example ofpolicies working at cross purposes. While the price of grain was supposed to move to marketlevels, government pronouncements, at both the national and local level, stressed the importanceof provinces, prefectures and even localities keeping adequate grain reserves so as to manage theprice of grain in their jurisdiction. Similarly, localities were urged to improve "price inspection"(for what purpose?) and to switch from mandatory grain procurement "quotas" to voluntary pur-chase "contracts", which would ensure that prices did not rise too high or fall too low. One won-ders how any of this could be accomplished without barriers to trade. See Liaowang OverseasEdition (Chinese, Beijing), No. 51, 21 Dec. 1992, p. 2; Xinhua Domestic Service, 0734 GMT 2April 1993, 2102 GMT 22 April 1993; Jiangsu People's Radio Network, 1015 GMT 23 March1993; and Zhongguo Xinwen She (in English) 0844 GMT 3 Oct. 1992.
Explicit reference to the rights of local authorities (even below the provincial level) to settheir own prices is made in Xinhua (in English), 1435 GMT 2 Sep. 1989; Zhongguo Xinwen She
15
organs controlled the interregional movement of goods, price differentials could easily be
maintained. In a market economy, however, with atomistic private arbitragers hard at work,
large interregional differentials in the prices of traded goods could only be maintained with bath-
ers to trade. Thus, in the area of prices and the interregional movement of goods, the central
regime's "reforms" ultimately degenerated, as they did in so many other areas, into a general
devolution of power into the hands of provincial and sub-provincial governmental authorities.
By 1991, according to some estimates, somewhat less than one-third of enterprise transac-
tions took place at centrally fixed prices (Gelb, Jefferson & Singh 1993). Since centrally man-
dated price distortions are gradually disappearing, what force, one might wonder, serves to
prevent local governments from reverting to free market principles? The answer to this question
is as old as the history of protectionism itself: local governments now find their financial and
political interests embeded in a particular industrial structure. These interests can be defended
using a variety of mechanisms. In raw material producing areas, export barriers convert process-
ing factories into monopsony buyers and, thereby, maintain the price distortions of the pre-
reform era. Elsewhere, import bathers, while impoverishing the local economy as a whole, can
induce artificially high returns in particular industrial sectors (just as in the import substitution
industries of so many other countries). Finally, when all else fails, and trade barriers cannot be
fruitfully enforced, there always exists the central banking system which can be repeatedly pres-
0915 GMT 4 Sep. 1993; Jingji Ribao (Beijing) 8 June 1990, p. 3; and Xinhua Domestic Service,0830 GMT 24 Feb. 1993. General reports on provincial price controls and subsidies are given inChangsha Hunan Provincial Service, 2300 GMT 24 Jan 1990; Renmin Ribao 6 Oct. 1990, pp. 1& 4; Xinhua (in English), 1103 GMT 30 Dec. 1988, 1507 GMT 20 Jan. 1990, 1039 GMT 2 Nov.1992, 0755 GMT 14 Nov. 1992, 0946 GMT 30 Nov. 1992; Shanghai City Service, 0900 GMT13 Sep. 1989; Hefei Anhui Provincial Service, 1100 GMT 30 Dec. 1988; Nanfang Ribao(Guangzhou), 19 March 1991, p. 1; Jinan Shandong People's Radio Network (Mandarin), 2300GMT 9 Jan. 1993; China Daily (Business Weekly), 10 Jan. 1993, p. 3; and Jiangsu People'sRadio Network, 2300 GMT 23 July 1993. The FEER ("The power of the purse," 18 June 1987)reports that central attempts to free (and rationalize) the prices faced by industrial enterpriseswere often undermined by localities and government departments, which simply imposed newcontrols.
16
sured into extending additional credit to enterprises, providing local revenue and employment at
the expense of national inflation. Thus, while it is probably the case that efficiency
considerations, the demands of other social and political groups, and interregional competition
for factors of production all place constraints on the distortionary activities of local governments,
it is also not unreasonable to argue that there is considerable hysterisis in public finance and
political relations. As the data in the next section show, the early part of the reform period wit-
nessed a tremendous convergence in the structure of production, as different regions of the econ-
omy duplicated each other's industries. By the early 1990s this process appears to have slowed
and, by some measures, even stopped. It shows little tendency, however, to reverse itself.
17
III Data
While colorful anecdotes about interregional trade wars and complex descriptions of the
precise pattern of arbitrage opportunities created by central policies make for interesting reading,
in the context of China's economy, where policy switches back and forth, where contradictory
policies coexist side-by-side and where, to confound everything, almost every policy is "ad-
justed" to suit local circumstances, they are hardly compelling. For every anecdote on interre-
gional conflict, one can bring out five on growing interregional cooperation, and of course vice
versa. Similarly, accounts of the distorted objectives and motivations of local governments
easily become, when viewed through different lenses, fine examples of beneficial local interven-
tion, helping entrepreneurial collective enterprises use their inate skills and resources to develop
efficient and competitive industrial enterprises.' 8 In this section I move beyond anecdotes and
stories to the analysis of aggregate data. documenting how, despite widespread diversification
under the policies of the plan, the dominant trend during the reform period was continued con-
vergence, as different regions continued to copy each other's industries. In later sections I con-
sider competing analytical explanations of these aggregate trends.°
LE As strange as it may seem to readers, it is not uncommon for different observers to holdcompletely opposite views on the meaning of almost any Chinese policy initiative, and even thegeneral thrust of government policy. For example, Jefferson and Rawski (1994) describe the1992 State Council Regulations on Transforming Economic Mechanisms of State Owned Enter-prises as part of "an unprecedented and virtually unrestrained push toward the market" during the1990s. In contrast, some Chinese economists (anonymous paper) view the 1990-1993 period asone in which government control was reasserted, seeing the Regulations, in particular, as part ofa government attempt to "consolidate their strategic rights over enterprises."
19 In considering trends, one is inevitably drawn to the question of levels. A World Bankstudy led by Kumar (1994), and similarly concerned with issues of interregional conflict, com-pared the degree of industrial dispersion in China, the United States and the European Commu-nity, breaking each political unit into 12 regions, and found that China's production structure wassubstantially more diversified. This, however, might not be a reasonable comparison, given thatthe average Chinese region would have had a population of 100 million people. In general, withthe possible exception of India, it is difficult to think of many comparators on the planet for apoor, predominantly agrarian economy of 1.2 billion people. Hence, my approach in this paper,which is to consider intertemporal trends within the People's Republic and test these againstexplanations centred around the link between factor allocations and comparative advantage.
18
I begin my statistical analysis by examining interregional convergence in the structure of
aggregate output. Figure II below presents the sum across 28 of China's 30 provinces of the
absolute values of the deviations of the output shares of different economic sectors from the
national average 20 The longer time series, based upon the socialist measure of "national
income", which excludes non-material sectors such as finance and government administration,
divides output into five sectors: agriculture, industry, construction, transport and commerce,
This series indicates a fairly stable degree of dispersion during the 1950s and 1960s, with a secu-
lar downward trend appearing around 1969 (i.e. during the Cultural Revolution, when the central
government promoted industrial diversification). Between 1969 and 1978 the sum of absolute
deviations fell 21%. Surprisingly, during the reform period convergence continued apace, with
the sum of absolute deviations falling an additional 16% from 1978 to 1992. The more conven-
tional GDP series, which divides output into primary, secondary, and tertiary sectors, shows
somewhat more convergence, with the sum of absolute deviations falling 25% by 1992 and a
20 Specifically, the absolute and weighted deviations equal
X / I sesgil
respectively, where S ii denotes the share of sector j in province i's output, gj the share of sector jin national output, Ali the share of province i in national output and 1, equal to the number ofprovinces, simply adjusts for the fact that the average weight is 1/I. Since this measure isinfluenced by the number of sectors and provinces used in its construction, the reader should notmake too much of the differences between the levels of the different series shown in this section.
China is divided administratively into 30 provinces and provincial level cities and autono-mous territories. I exclude Tibet and Hainan, however, because my data on national income inthese two provinces do not extend back before 1979. Together these two provinces accountedfor only 0.7% of national income in 1992 (CSY 1994, tables 2-11 & 2-15). In this, and otherfigures below, I take as my measure of "national" output the sum of the output of the remaining(28) provinces. While the Figure presents the results using current prices, I have also computedthe national income measures using provincial income in constant 1952 prices. The results arevery similar.
The data used in this section of the paper were compiled from A Compilation of HistoricalStatistical1949-1989 (hereafter, Historical Statistics) Hsueh, Li and Liu (1993), the annual issues of thestatistical yearbooks put out by each province, and the annual issues of the CU. I combined thedifferent sources, reconciling discrepancies and correcting obvious misprints. These data areavailable, upon request, from the author.
19
0 0.1 0.2 0.31978
0.3 0.4 0.51978
060.4 0 5 03 0.4 0.5 0.61978
0.7 08 01 0.2
Figure III: Shares of GDP(28 Provinces)
(a) Primary Sector' (b) Secondary Sector' (a) Tertiary Sector!
0.5
0.4
0.3Lncr)
0.2
0.1
0
0.8
0.7
0.6in
0.5
0.4
0.3
0.8
0.5
0.4tnco0,
0.3
0.2
0.1
•0••.oo oo o
°8*01p rt,
OOO
O
12
10
6
•
20
Figure II: Convergence in the Structure of Output(28 Provinces - Current Prices)
• •• • • • a• • • • A A firl.4444
..A40 4. ... A,
ntrazkier
00ltht.
–Sett
■ , 111t111111111111■Iil1 l$11111■5111 I1IMIki_1952 1954
1053 19551956 1958 1060 1062 1964 1986 1968 1970 1072 1074 1078 1078 1060 1082 1084 1088 /966 1990
1957 1050 1961 1963 1985 1967 1960 1971 1973 1975 1977 1979 1981 1983 1985 1987 1980 19911092 1094
1903 1095
-re National Income - Absolute Deviation Air GDP - Absolute Deviationa National Income - Weighted Deviation .0. GDP - Weighted Deviation
20
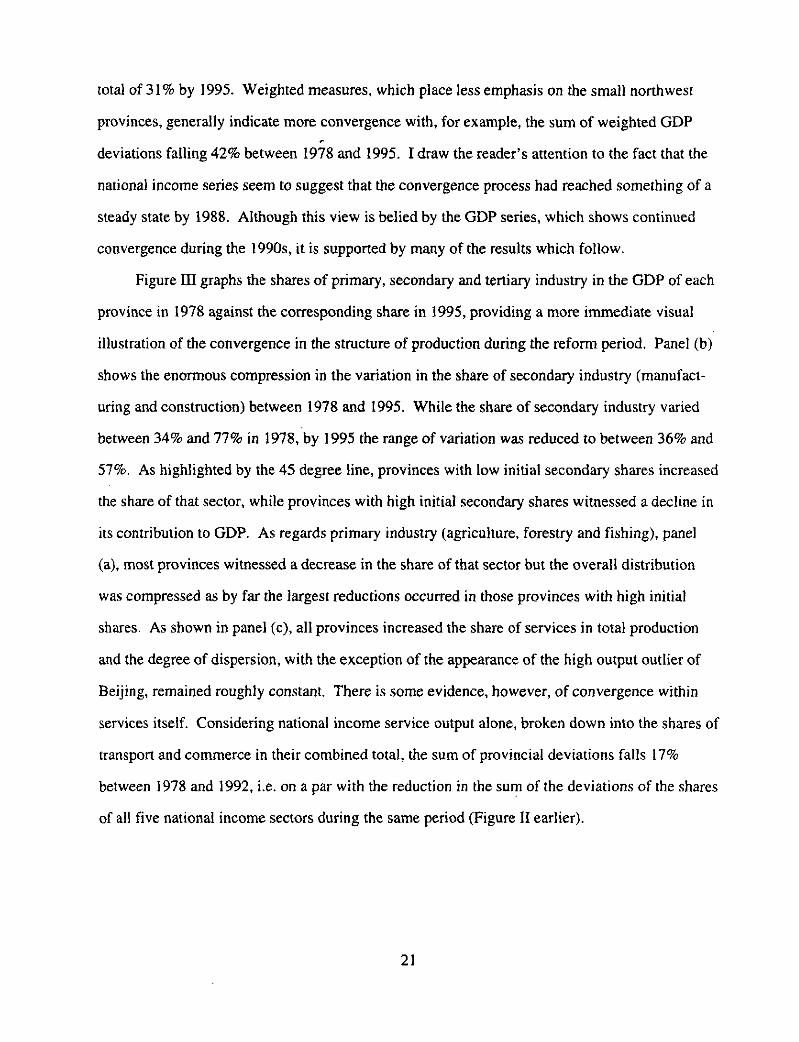
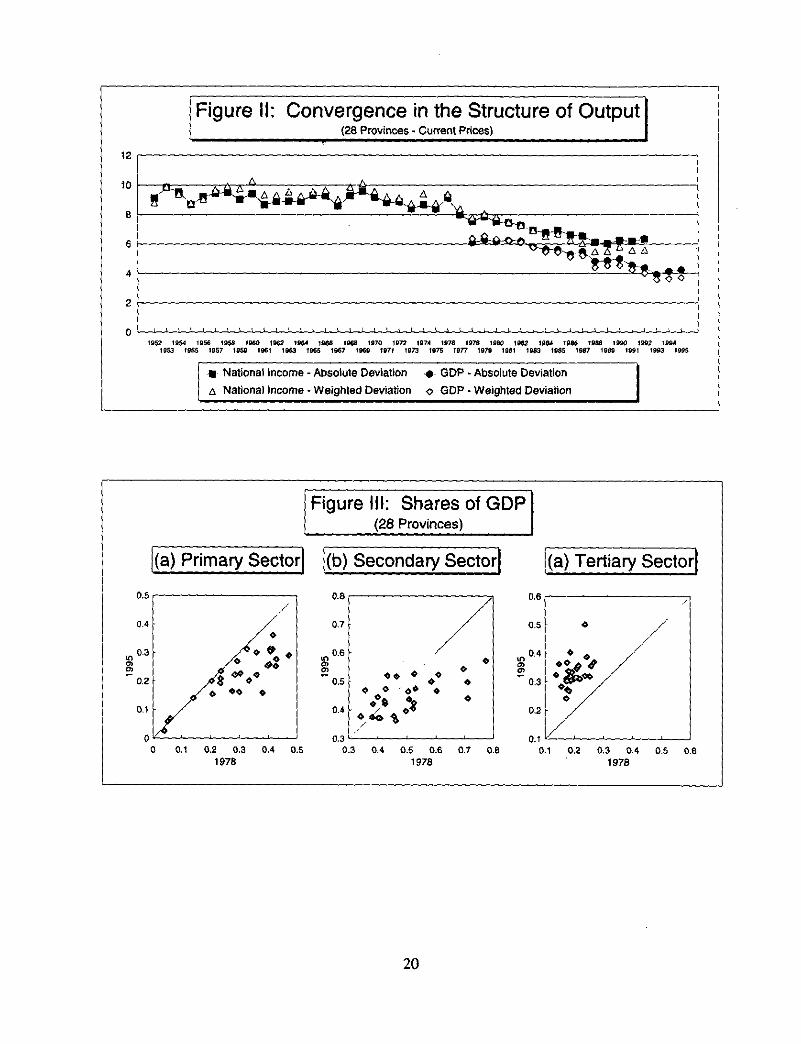
total of 31% by 1995. Weighted measures, which place less emphasis on the small northwest
provinces, generally indicate more convergence with, for example, the sum of weighted GDP
deviations falling 42% between 1978 and 1995. I draw the reader's attention to the fact that the
national income series seem to suggest that the convergence process had reached something of a
steady state by 1988. Although this view is belied by the GDP series, which shows continued
convergence during the 1990s, it is supported by many of the results which follow.
Figure III graphs the shares of primary, secondary and tertiary industry in the GDP of each
province in 1978 against the corresponding share in 1995, providing a more immediate visual
illustration of the convergence in the structure of production during the reform period. Panel (b)
shows the enormous compression in the variation in the share of secondary industry (manufact-
uring and construction) between 1978 and 1995. While the share of secondary industry varied
between 34% and 77% in 1978, by 1995 the range of variation was reduced to between 36% and
57%. As highlighted by the 45 degree line, provinces with low initial secondary shares increased
the share of that sector, while provinces with high initial secondary shares witnessed a decline in
its contribution to GDP. As regards primary industry (agriculture, forestry and fishing), panel
(a), most provinces witnessed a decrease in the share of that sector but the overall distribution
was compressed as by far the largest reductions occurred in those provinces with high initial
shares. As shown in panel (c), all provinces increased the share of services in total production
and the degree of dispersion, with the exception of the appearance of the high output outlier of
Beijing, remained roughly constant. There is some evidence, however, of convergence within
services itself. Considering national income service output alone, broken down into the shares of
transport and commerce in their combined total, the sum of provincial deviations falls 17%
between 1978 and 1992, i.e. on a par with the reduction in the sum of the deviations of the shares
of all five national income sectors during the same period (Figure II earlier).
21
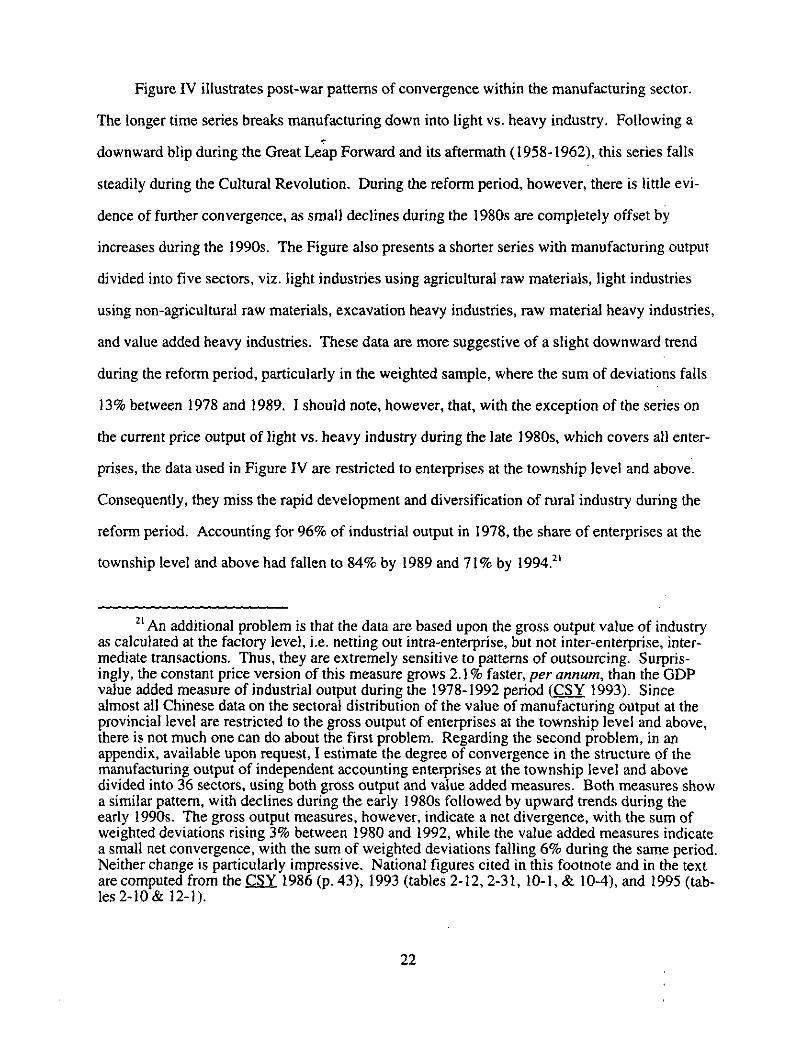
Figure IV illustrates post-war patterns of convergence within the manufacturing sector.
The longer time series breaks manufacturing down into light vs. heavy industry. Following a
downward blip during the Great Leap Forward and its aftermath (1958-1962), this series falls
steadily during the Cultural Revolution. During the reform period, however, there is little evi-
dence of further convergence, as small declines during the 1980s are completely offset by
increases during the 1990s. The Figure also presents a shorter series with manufacturing output
divided into five sectors, viz, light industries using agricultural raw materials, light industries
using non-agricultural raw materials, excavation heavy industries, raw material heavy industries,
and value added heavy industries. These data are more suggestive of a slight downward trend
during the reform period, particularly in the weighted sample, where the sum of deviations falls
13% between 1978 and 1989. I should note, however, that, with the exception of the series on
the current price output of light vs. heavy industry during the late 1980s, which covers all enter-
prises, the data used in Figure IV are restricted to enterprises at the township level and above.
Consequently, they miss the rapid development and diversification of rural industry during the
reform period. Accounting for 96% of industrial output in 1978, the share of enterprises at the
township level and above had fallen to 84% by 1989 and 71% by 1994.2'
at An additional problem is that the data are based upon the gross output value of industryas calculated at the factory level, i.e. netting out intra-enterprise, but not inter-enterprise, inter-mediate transactions. Thus, they are extremely sensitive to patterns of outsourcing. Surpris-ingly, the constant price version of this measure grows 2.1% faster, per annum, than the GDPvalue added measure of industrial output during the 1978-1992 period (CSY 1993). Sincealmost all Chinese data on the sectoral distribution of the value of manufacturing output at theprovincial level are restricted to the gross output of enterprises at the township level and above,there is not much one can do about the first problem. Regarding the second problem, in anappendix, available upon request, I estimate the degree of convergence in the structure of themanufacturing output of independent accounting enterprises at the township level and abovedivided into 36 sectors, using both gross output and value added measures. Both measures showa similar pattern, with declines during the early 1980s followed by upward trends during theearly 1990s. The gross output measures, however, indicate a net divergence, with the sum ofweighted deviations rising 3% between 1980 and 1992, while the value added measures indicatea small net convergence, with the sum of weighted deviations falling 6% during the same period.Neither change is particularly impressive. National figures cited in this footnote and in the textare computed from the CSY 1986 (p. 43), 1993 (tables 2-12, 2-31, 10-1, & 10-4), and 1995 (tab-les 2-10 & 12-1).
22
10
86420
Figure IV: Variation within Manufacturing(24 Provinces, Constant 1980 Prices)
:._,F,EV2E€)1.-11—Eh 1 ---;' t1312tern:ar-%at IN
L l 1 L 1 1 11111111111111111JIM1 1I
1950 1954 1958 1962 1966 1970 1974 1978 1982 1986 1990
* Lt. vs. Hvy. - Absolute . 5 Sectors - Absolute A Lt. vs Hvy. - Absolutert.} Lt. vs. Hvy. - Weighted -0, 5 Sectors - Weighted n. Lt. vs.Hvy. - Weighted
24 Provinces = Ail but Inner Mongolia, Guangdong. Hainan, Yuman, Tibet 8 Qinghai.19864993 Light vs. Heavy is at current prices.
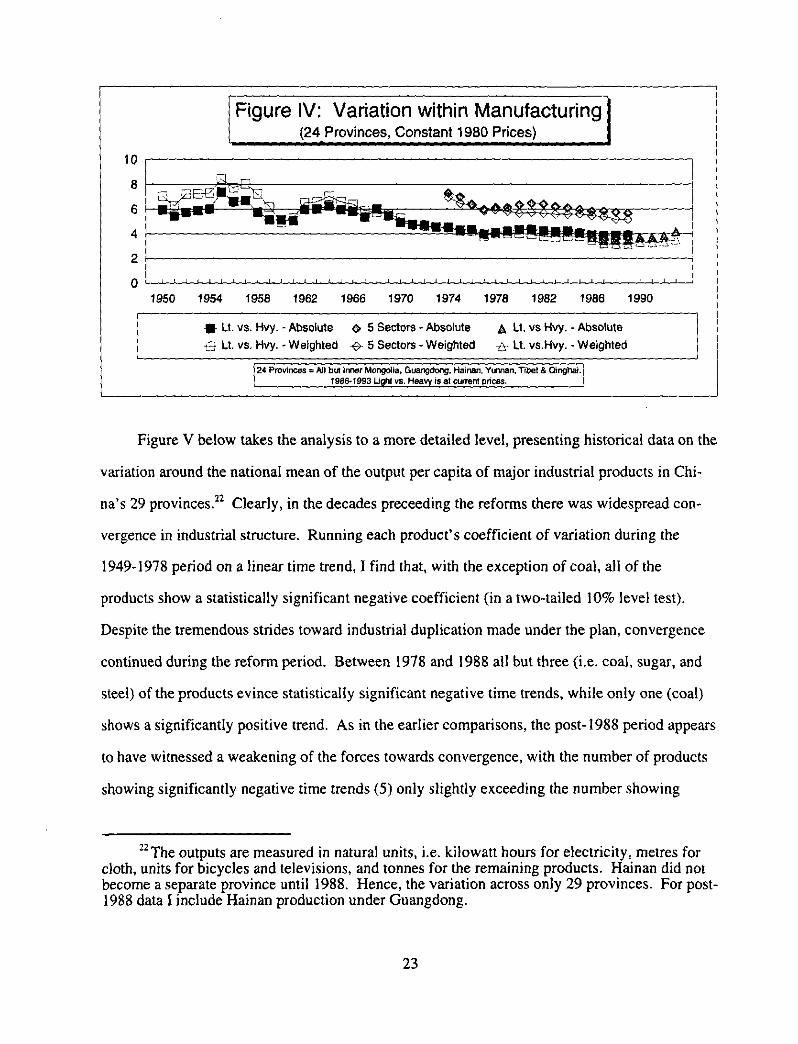
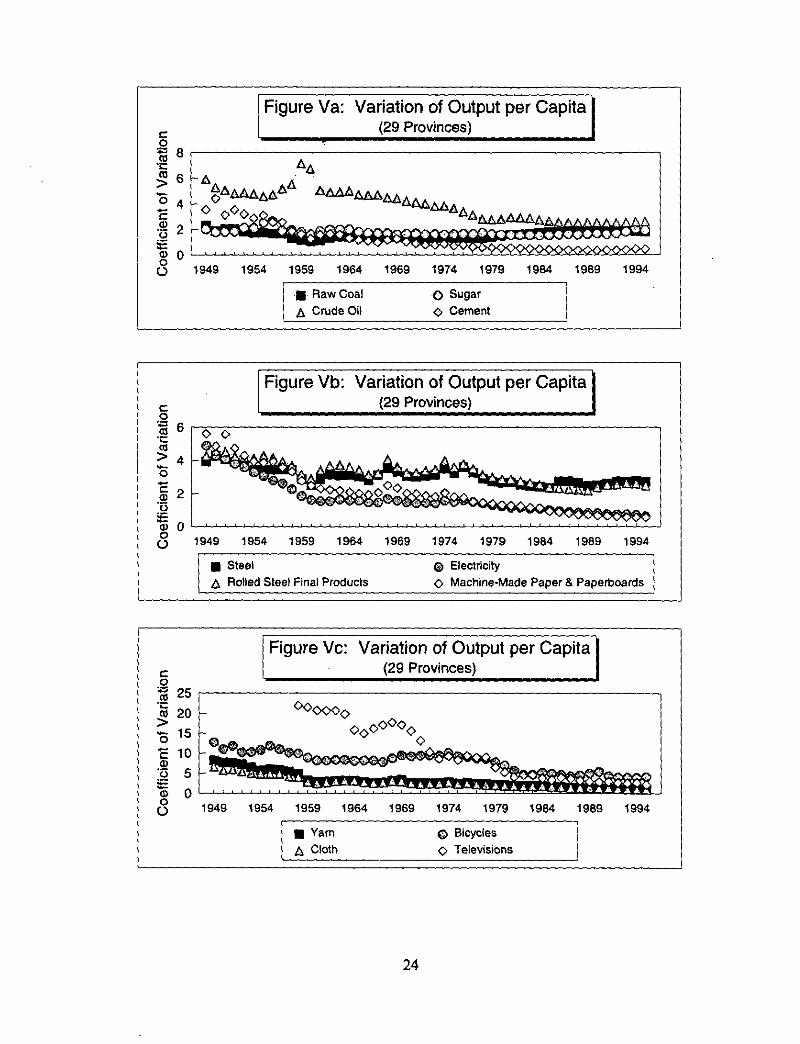
Figure V below takes the analysis to a more detailed level, presenting historical data on the
variation around the national mean of the output per capita of major industrial products in Chi-
na's 29 provinces.22 Clearly, in the decades preceeding the reforms there was widespread con-
vergence in industrial structure. Running each product's coefficient of variation during the
1949-1978 period on a linear time trend, I find that, with the exception of coal, all of the
products show a statistically significant negative coefficient (in a two-tailed 10% level test).
Despite the tremendous strides toward industrial duplication made under the plan, convergence
continued during the reform period. Between 1978 and 1988 all but three (i.e. coal, sugar, and
steel) of the products evince statistically significant negative time trends, while only one (coal)
shows a significantly positive trend. As in the earlier comparisons, the post-1988 period appears
to have witnessed a weakening of the forces towards convergence, with the number of products
showing significantly negative time trends (5) only slightly exceeding the number showing
22 The outputs are measured in natural units, i.e. kilowatt hours for electricity, metres forcloth, units for bicycles and televisions, and tonnes for the remaining products. Hainan did notbecome a separate province until 1988. Hence, the variation across only 29 provinces. For post-1988 data I include Hainan production under Guangdong.
23
-AAFASAAAA
-0 00• ..4.•
AA
AAALAtIAAAAA40.AttaAAusztAAAeAssAAAt•
titt..4.•.•••••••••••••••••••••■••■•••■••******* .•• •••••••••.'4•4.4
Figure Va: Variation of Output per Capita(29 Provinces)
1964 1969 1974 1979 1984 1989
1994
Raw Coal
o Sugar
A Crude Oil .0 Cement
11)O
rj 1949 1954 1959
c0al 6.-ccs> 415
N2ii
15 000
Figure Vb: Variation of Output per Capita(29 Provinces)
0 0
*al.* •,....•-•
AAAA A A anvonn A A.A A.A A- . * Prt * • *** • °IL**. •aa
Af. 4 -• *14 17 4- ' • • ct • • *•••••••40441.
1949 1954 1959 1964 1969 1974 1979 1984 1989 1994
8 Steel 0 ElectricityA Rolled Steel Final Products 0. Machine•Made Paper & Paperboards
0t; 25c.co 20> 15—o"E 1
'5 5U0 00C.)
Figure Vc: Variation of Output per Capita(29 Provinces)
- 000000oo0o000
.•* - 1-, 4i •• •. -1'0,L AV/ .4, 444voi 1,4 •Sti41,,,,,inntra ±A AAAAAAAAsinAAAAAAAAAAAAAA Ao: -.-. .0
1949 1954 1959 1964 1969 1974 1979 1984 1989 1994
• Yarn o BicyclesA Cloth 0. Televisions
24
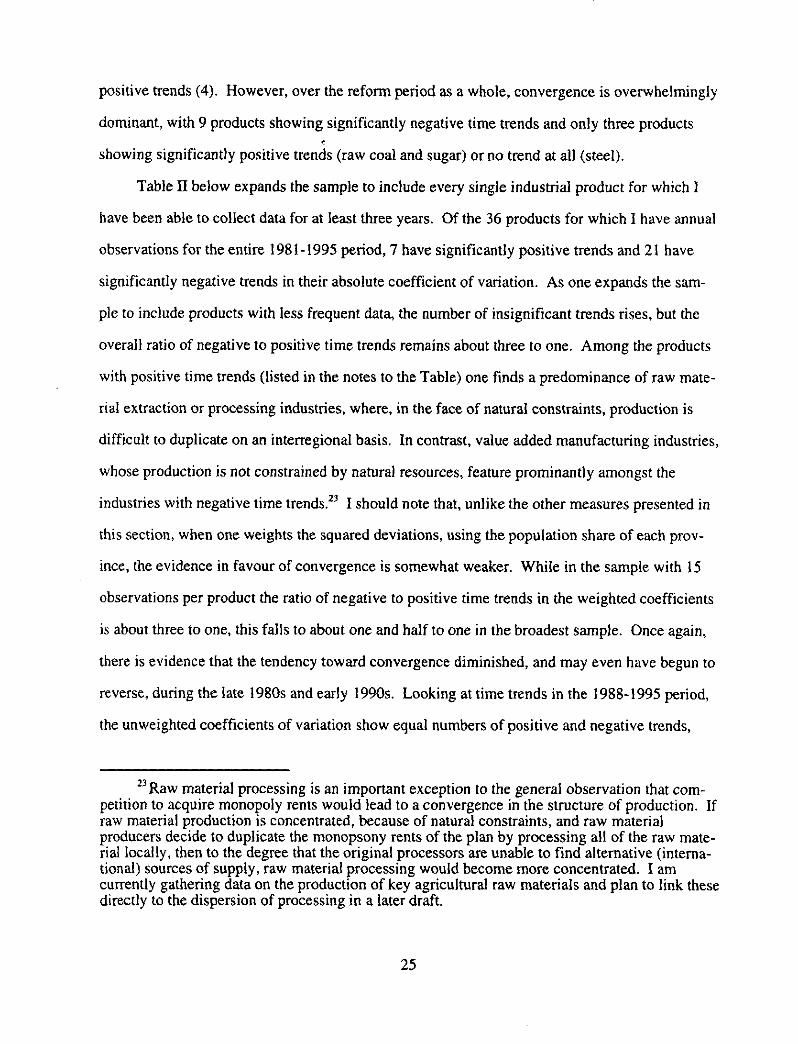
positive trends (4). However, over the reform period as a whole, convergence is overwhelmingly
dominant, with 9 products showing significantly negative time trends and only three products•
showing significantly positive trends (raw coal and sugar) or no trend at all (steel).
Table II below expands the sample to include every single industrial product for which I
have been able to collect data for at least three years. Of the 36 products for which I have annual
observations for the entire 1981-1995 period, 7 have significantly positive trends and 21 have
significantly negative trends in their absolute coefficient of variation. As one expands the sam-
ple to include products with less frequent data, the number of insignificant trends rises, but the
overall ratio of negative to positive time trends remains about three to one. Among the products
with positive time trends (listed in the notes to the Table) one finds a predominance of raw mate-
rial extraction or processing industries, where, in the face of natural constraints, production is
difficult to duplicate on an interregional basis. In contrast, value added manufacturing industries,
whose production is not constrained by natural resources, feature prominantly amongst the
industries with negative time trends.23 I should note that, unlike the other measures presented in
this section, when one weights the squared deviations, using the population share of each prov-
ince, the evidence in favour of convergence is somewhat weaker. While in the sample with 15
observations per product the ratio of negative to positive time trends in the weighted coefficients
is about three to one, this falls to about one and half to one in the broadest sample. Once again,
there is evidence that the tendency toward convergence diminished, and may even have begun to
reverse, during the late 1980s and early 1990s. Looking at time trends in the 1988-1995 period,
the unweighted coefficients of variation show equal numbers of positive and negative trends,
23 Raw material processing is an important exception to the general observation that com-petition to acquire monopoly rents would lead to a convergence in the structure of production. Ifraw material production is concentrated, because of natural constraints, and raw materialproducers decide to duplicate the monopsony rents of the plan by processing all of the raw mate-rial locally, then to the degree that the original processors are unable to find alternative (interna-tional) sources of supply, raw material processing would become more concentrated. I amcurrently gathering data on the production of key agricultural raw materials and plan to link thesedirectly to the dispersion of processing in a later draft.
25
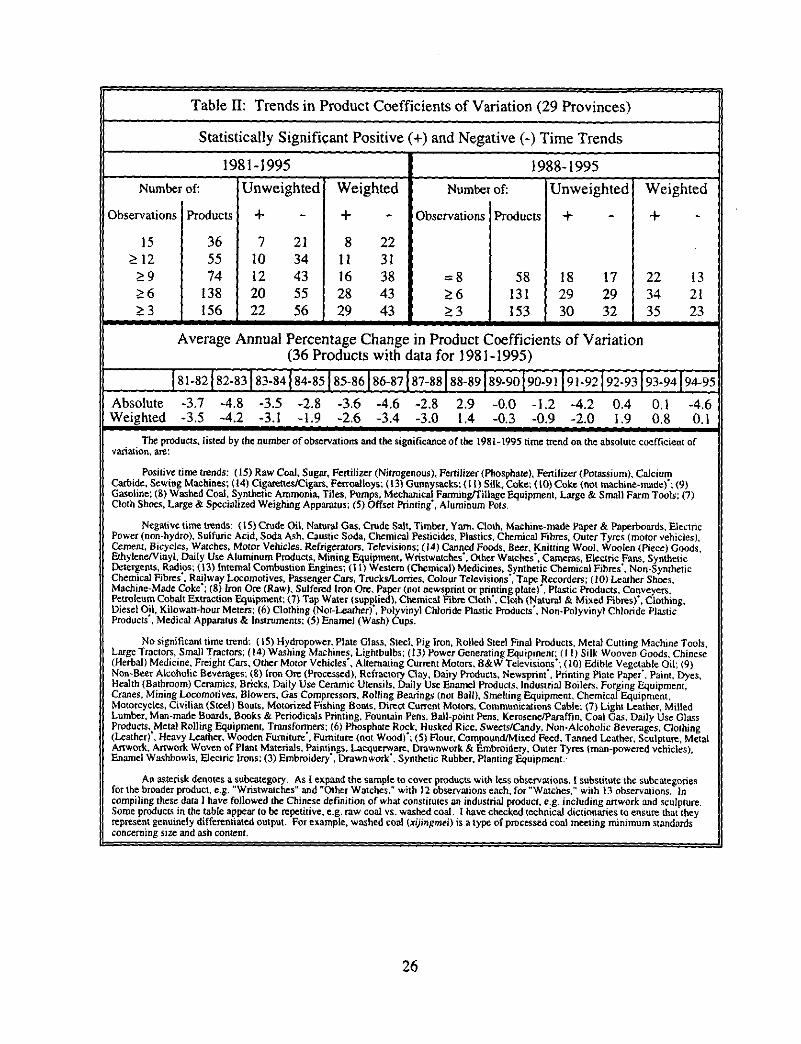
Table H: Trends in Product Coefficients of Variation (29 Provinces)
Statistically Significant Positive (+) and Negative (-) Time Trends
1981-1995 1988-1995Number of: Unweighted Weighted Numbe of: Unweighted Weighted
Observations Products + - 4- - Observations Products + - + -
15 36 7 21 8 22> 12 55 10 34 11 31
> 9 74 12 43 16 38 =-- 8 58 18 17 22 136 138 20 55 28 43 > 6 131 29 29 34 21
> 3 156 22 56 29 43 > 3 153 30 32 35 23
Average Annual Percentage Change in Product Coefficients of Variation(36 Products with data for 1981-1995)
I M-82182-83183-84184-85 I 85-86186-87187-88 I 88-89189-90190-91191-92192-93193-94194-95
Absolute -3.7 -4.8 -3.5 -2.8 -3.6 -4.6 -2.8 2.9 -0,0 -1.2 -4.2 0.4 0.1 -4,6Weighted -3.5 -4.2 -3.1 -1.9 -2.6 -3.4 -3.0 1,4 -0.3 -0.9 -2.0 1.9 0.8 0.1
The products, listed by the number of observations and the significance of the 19814995 time trend on the absolute coefficient ofvariation, are:
Positive time trends: (15) Raw Coal, Sugar, Fertilizer (Nitrogenous), Fertilizer (Phosphate), Fertilizer (Potassium), CalciumCarbide, Sewing Machines: (14) Cigarettes/Cigars, Ferroalloys: (13) Gunnysacks; (I I) Silk, Coke; (10) Coke (not machine-made) ; (9)Gasoline; (8) Washed Coal, Synthetic Ammonia, Tiles, Pumps, Mechanical Fanning/Tillage Equipment, Large & Small Farm Tools; (7)Cloth Shoes, Large & Specialized Weighing Apparatus; (5) Offset Printing", Aluminum Pots.
Negative time trends: (I 5) Crude Oil, Natural Gas, Crude Salt, Timber, Yam, Cloth, Machine-made Paper & Paperboards, ElectricPower (non-hydro), Sulfuric Acid, Soda Ash, Caustic Soda, Chemical Pesticides, Plastics, Chemical Fibres, Outer Tyres (motor vehicles),Cement, Bicycles, Watches, Motor Vehicles, Refrigerators, Televisions; (14) Canned Foods, Beer, Knitting Wool, Woolen (Piece) Goods,Ethylene/Vinyl, Daily Use Aluminum Products, Mining Equipment. Wristwatches , Other Watches, Cameras, Electric Fans, SyntheticDetergents, Radios; (13) Internal Combustion Engines; (I I) Western (Chemical) Medicines, Synthetic Chemical Fibres . , Non-SyntheticChemical Fibres', Railway Locomotives, Passenger Cars, Trucks/Lorries, Colour Televisions , Tape Recorders; (10) Leather Shoes,Machine-Made Coke ; (8) Iron Ore (Raw), Sulfered Iron Ore, Paper (not newsprint or printing plate) . Plastic Products, Conveyers,Petroleum Cobalt Extraction Equipment; (7) Tap Water (supplied), Chemical Fibre Cloth . Cloth (Natural & Mixed Fibres), Clothing,Diesel Oil, Kilowatt-hour Meters; (6) Clothing (Not-Leather), Polyvinyl Chloride Plastic Products , Non-Polyvinyl Chloride PlasticProducts, Medical Apparatus & Instruments; (5) Enamel (Wash) Cups.
No significant time trend: (15) Hydropower. Plate Glass, Steel, Pig Iron, Rolled Steel Final Products, Metal Cutting Machine Tools,Large Tractors, Small Tractors; (14) Washing Machines, Lightbulbs; (13) Power Generating Equipment; (II) Silk Wooven Goods, Chinese(Herbal) Medicine, Freight Cars, Other Motor Vehicles , Alternating Current Motors. B&W Televisions . ; (10) Edible Vegetable Oil; (9)Non-Beer Alcoholic Beverages; (8) Iron Ore (Processed), Refractory Clay, Dairy Products, Newsprint , Printing Plate Paper'. Paint, Dyes,Health (Bathroom) Ceramics, Bricks, Daily Use Ceramic Utensils, Daily Use Enamel Products, Industrial Boilers, Forging Equipment,Cranes, Mining Locomotives, Blowers, Gas Compressors, Rolling Bearings (not Ball), Smelting Equipment, Chemical Equipment.Motorcycles, Civilian (Steel) Boats, Motorized Fishing Boats, Direct Current Motors, Communications Cable; (7) Light Leather, MilledLumber, Man-made Boards. Books & Periodicals Printing. Fountain Pens. Ball-point Pens, Kerosene/Paraffin, Coal Gas, Daily Use GlassProducts, Metal Rolling Equipment, Transformers; (6) Phosphate Rock, Husked Rice. Sweets/Candy, Non-Alcoholic Beverages, Clothing(Leather), Heavy Leather, Wooden Furniture . , Furniture (not Wood) . ; (5) flour, Compound/Mixed Feed, Tanned Leather, Sculpture, MetalArtwork, Artwork Woven of Plant Materials, Paintings, Lacquerware, Drawnwork & Embroidery. Outer Tyres (man-powered vehicles),Enamel Washbowls, Electric Irons; (3) Embroidery , Drawnwork s . Synthetic Rubber, Planting Equipment..
An asterisk denotes a subcategory. As I expand the sample to cover products with less observations. I substitute the subcategoriesfor the broader product, e.g. "Wristwatches" and "Other Watches." with 12 observations each, for "Watches," with 13 observations. Incompiling these data I have followed the Chinese definition of what constitutes an industrial product, e.g. including artwork and sculpture.Some products in the table appear to be repetitive. e.g. raw coal vs. washed coal. I have checked technical dictionaries to ensure that theyrepresent genuinely differentiated output. For example, washed coal (xijingmei) is a type of processed coal meeting minimum standardsconcerning size and ash content.
26
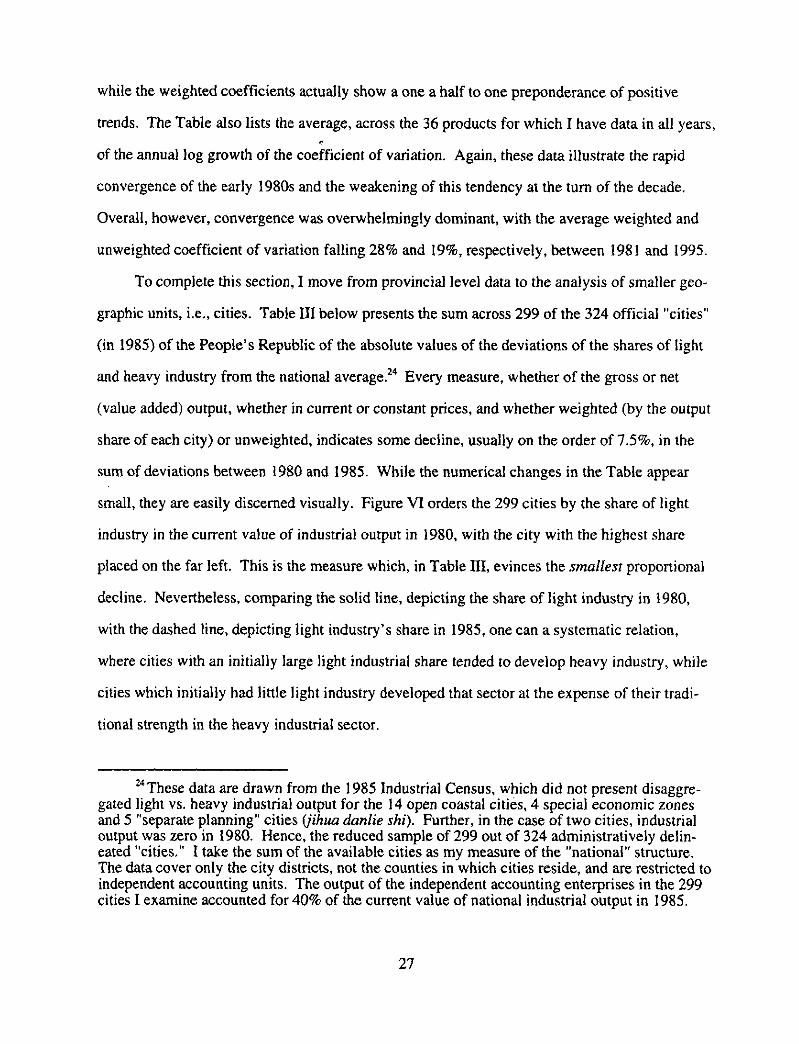
while the weighted coefficients actually show a one a half to one preponderance of positive
trends. The Table also lists the average, across the 36 products for which I have data in all years,
of the annual log growth of the coefficient of variation. Again, these data illustrate the rapid
convergence of the early 1980s and the weakening of this tendency at the turn of the decade.
Overall, however, convergence was overwhelmingly dominant, with the average weighted and
unweighted coefficient of variation falling 28% and 19%, respectively, between 1981 and 1995.
To complete this section, I move from provincial level data to the analysis of smaller geo-
graphic units, i.e., cities. Table III below presents the sum across 299 of the 324 official "cities"
(in 1985) of the People's Republic of the absolute values of the deviations of the shares of light
and heavy industry from the national average. 24 Every measure, whether of the gross or net
(value added) output, whether in current or constant prices, and whether weighted (by the output
share of each city) or unweighted, indicates some decline, usually on the order of 7.5%, in the
sum of deviations between 1980 and 1985. While the numerical changes in the Table appear
small, they are easily discerned visually. Figure VI orders the 299 cities by the share of light
industry in the current value of industrial output in 1980, with the city with the highest share
placed on the far left. This is the measure which, in Table III, evinces the smallest proportional
decline. Nevertheless, comparing the solid line, depicting the share of light industry in 1980,
with the dashed line, depicting light industry's share in 1985, one can a systematic relation,
where cities with an initially large light industrial share tended to develop heavy industry, while
cities which initially had little light industry developed that sector at the expense of their tradi-
tional strength in the heavy industrial sector.
24 These data are drawn from the 1985 Industrial Census, which did not present disaggre-gated light vs. heavy industrial output for the 14 open coastal cities, 4 special economic zonesand 5 "separate planning" cities (jihua danlie shi). Further, in the case of two cities, industrialoutput was zero in 1980. Hence, the reduced sample of 299 out of 324 administratively delin-eated "cities." I take the sum of the available cities as my measure of the "national" structure.The data cover only the city districts, not the counties in which cities reside, and are restricted toindependent accounting units. The output of the independent accounting enterprises in the 299cities I examine accounted for 40% of the current value of national industrial output in 1985.
27
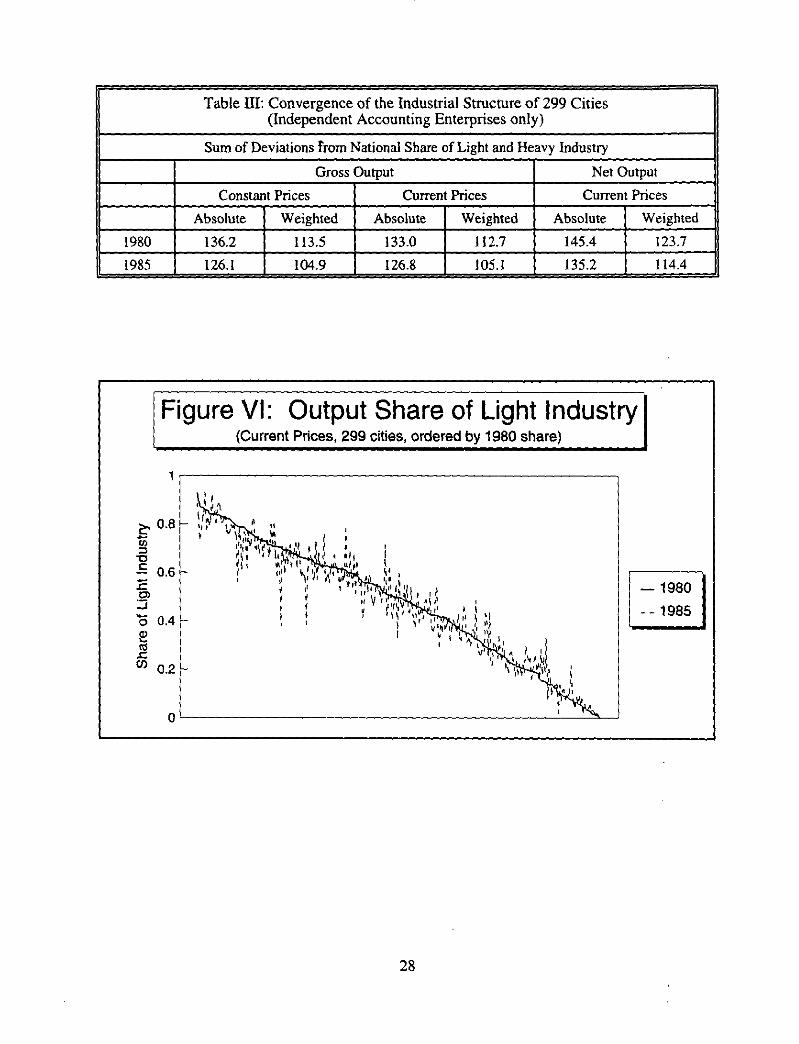
Table DI: Convergence of the Industrial Structure of 299 Cities(Independent Accounting Enterprises only)
Sum of Deviations from National Share of Light and Heavy Industry
Gross Output Net Output
Constant Prices Curren Prices Current Prices
Absolute Weighted Absolute Weighted Absolute Weighted
1980 136.2 113.5 133.0 112.7 145.4 123.7
1985 126.1 104,9 126.8 105.1 135.2 114.4
Figure VI: Output Share of Light Industry I(Current Prices, 299 cities, ordered by 1980 share)
1
0 '8
S 0.6ran"5 0.42
14 0.2
0
— 1980
- - 1985
28
IV Explanations
A) Convergence of income
One might argue that the convergence in structure chronicled earlier in section III is
merely an outcome of convergence in income levels. Perhaps as poorer provinces have caught
up with their richer neighbours their factor endowments, productivity levels and, by extension,
patterns of comparative advantage and production have come to resemble those of their wealthier
compatriots. Alternatively, putting aside changes in comparative advantage, as relative income
levels have converged the structure of demand within provinces might similarly have converged
which, in the presence of transport costs which increase with the volume of trade, would have led
to a convergence in the structure of production. Thus, for reasons of both demand and supply, a
convergence of income levels would naturally lead to a convergence in the structure of produc-
tion.
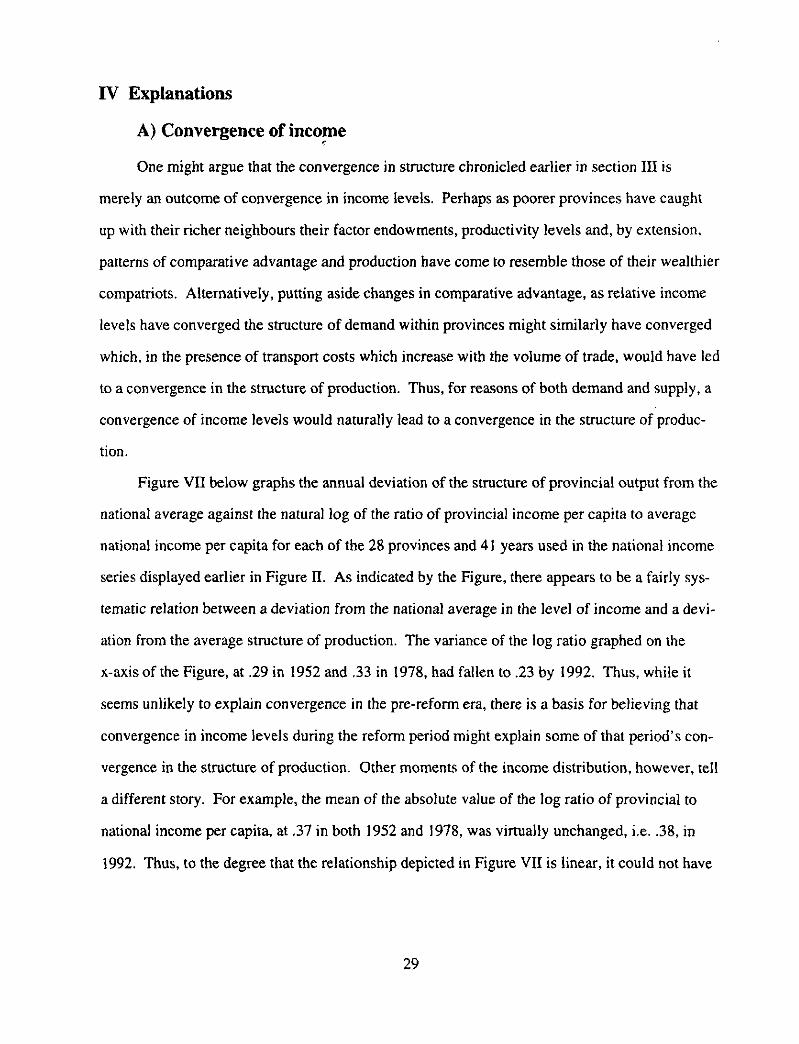
Figure VII below graphs the annual deviation of the structure of provincial output from the
national average against the natural log of the ratio of provincial income per capita to average
national income per capita for each of the 28 provinces and 41 years used in the national income
series displayed earlier in Figure II. As indicated by the Figure, there appears to be a fairly sys-
tematic relation between a deviation from the national average in the level of income and a devi-
ation from the average structure of production. The variance of the log ratio graphed on the
x-axis of the Figure, at .29 in 1952 and .33 in 1978, had fallen to .23 by 1992. Thus, while it
seems unlikely to explain convergence in the pre-reform era, there is a basis for believing that
convergence in income levels during the reform period might explain some of that period's con-
vergence in the structure of production. Other moments of the income distribution, however, tell
a different story. For example, the mean of the absolute value of the log ratio of provincial to
national income per capita, at .37 in both 1952 and 1978, was virtually unchanged, i.e. .38, in
1992. Thus, to the degree that the relationship depicted in Figure VII is linear, it could not have
29
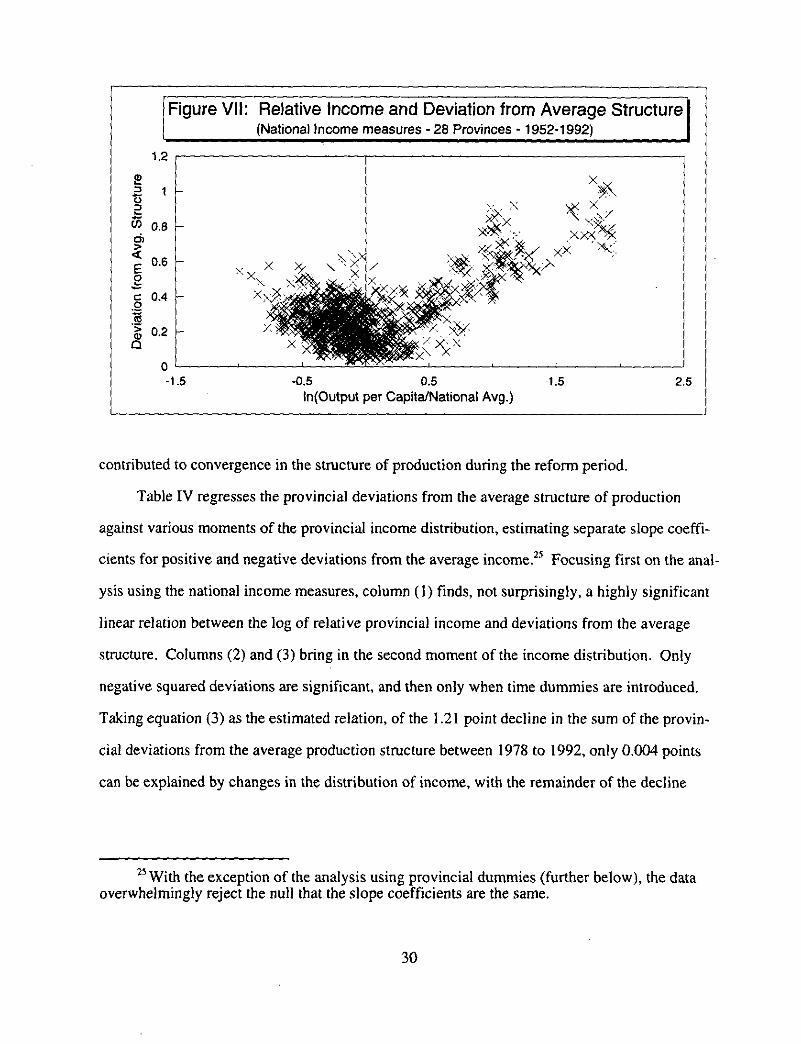
Figure VII: Relative Income and Deviation from Average Structure(National Income measures - 28 Provinces - 1952-1992)
1.2
P.1
65 0.8ci)
E 0.62a 0.40
8 0.2C
0 -1.5 -0.5 0.5 1.5
25
In(Output per Capita/National Avg.)
contributed to convergence in the structure of production during the reform period.
Table IV regresses the provincial deviations from the average structure of production
against various moments of the provincial income distribution, estimating separate slope coeffi-
cients for positive and negative deviations from the average income? Focusing first on the anal-
ysis using the national income measures, column (1) finds, not surprisingly, a highly significant
linear relation between the log of relative provincial income and deviations from the average
structure. Columns (2) and (3) bring in the second moment of the income distribution. Only
negative squared deviations are significant, and then only when time dummies are introduced.
Taking equation (3) as the estimated relation, of the 1.21 point decline in the sum of the provin-
cial deviations from the average production structure between 1978 to 1992, only 0.004 points
can be explained by changes in the distribution of income, with the remainder of the decline
25 With the exception of the analysis using provincial dummies (further below), the dataoverwhelmingly reject the null that the slope coefficients are the same.
30
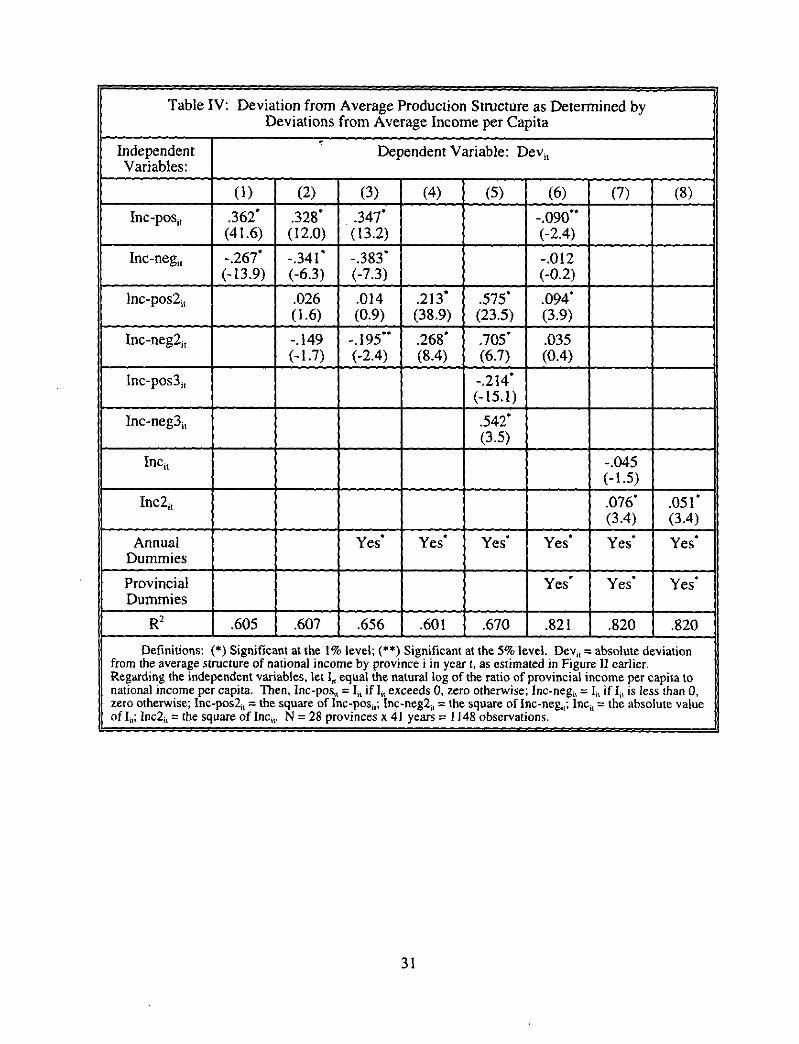
Table IV: Deviation from Average Production Structure as Determined byDeviations from Average Income per Capita
IndependentVariables:
Dependent Variable: Dev„
(I) (2) (3) (4) (5) (6) (7) (8)Inc-pos„ .362*
(41.6).328 *(12.0)
.347 *(13.2)
-.090**(-2.4)
Inc-nega -.267*(-13.9)
-.341 *(-6.3)
-.383 *(-7.3)
-.012(-0.2)
Inc-pos2 i, .026(1.6)
.014(0.9)
.213*(38.9)
.575 *(23.5)
.094*(3.9)
Inc-negZ, -.149(-1.7)
-.195 **(-2.4)
.268 *(8.4)
.705 *(6.7)
.035(0.4)
Inc-pos3 i , -.214*(-15.1)
Inc-neg3 i , .542*(3.5)
Inc, -.045(-1.5)
Inc2i , .076*(3.4)
.051*(3.4)
AnnualDummies
Yes* Yes. Yes* Yes* Yes* Yes.
ProvincialDummies
Yes Yes* Yes.
R2 .605 .607 .656 .601 .670 .821 .820 .820
Definitions: *) Significant at the I% level; (**) Significant at the 5% level. Dev„ = absolute deviationfrom the average structure of national income by province i in year t, as estimated in Figure II earlier.Regarding the independent variables, let I„ equal the natural log of the ratio of provincial income per capita tonational income per capita. Then, Inc-pos,, = In if 1„ exceeds 0, zero otherwise; Inc-negn = In if I, is less than 0,zero otherwise; Inc-post;, = the square of Inc-pos h ; Inc-neg2, = the square of Inc-neg„; Inc, = the absolute valueof I„; Inc2„ = the square of Inc„. N = 28 provinces x 41 years = 1148 observations.
31

accounted for by the time dummies. 26 To heighten the impact of income distribution, column (4)
removes the linear terms from the regression. Doing so allows the coefficients on income to
account for slightly under half (0.57 points) of the decline between 1978 and 1992. Introducing
cubic terms, however, as in column (5), reduces the estimated impact of changes in income dis-
tribution to -.12 points, as the regression uses the cubic terms to linearize the relation. Thus, up
to this point, the overwhelming evidence is in favour of a linear relation with changes in the
distribution of income accounting for only a small fraction of the convergence in the structure of
production.
Column (6) of Table IV introduces provincial dummies, which essentially turn the regres-
sion from one of levels into one of differences. In differences, the elegant relationship depicted
in Figure VII is destroyed, as the coefficients on the income terms become insignificant or
nonsensical, e.g. implying that, at least initially, an increase in income relative to the average
leads to a production structure more similar to the average. With the provincial dummies, how-
ever, one cannot reject the null that the slope coefficients in different orthants are the same
(mostly because the standard errors on terms from the negative orthant are now so large).
Further, with the coefficients in different orthants constrained to be the same, one finds that lin-
ear deviations are far less significant that squared deviations (column 7). Thus, in the interest of
maximizing the explanatory power of changes in the income distribution, one could settle on
column (8), which relates the deviation in structure to the second moment of the income distribu-
tion. Even based upon this equation, however, one would conclude that only 12% (.14 points) of
the 1.2 point decline in the sum of deviations from the average production structure between
26 Put differently, there is a highly significant negative time trend.
32
1978 and 1992 was explained by changes in the distribution of income.27
In sum, while there appears to be a fairly significant relation between income distribution
and deviations from the average structure, the data strongly suggest that changes in the income
distribution account, at best, for only a small fraction of the changes in the dispersion of produc-
tion. One might wonder, however, whether endogeneity bias limits the type of conclusions one
can draw from regressions such as those in Table W. Clearly, relative income is determined by
relative productivities and relative factor allocations, which also determine patterns of compara-
tive advantage and, by extension, deviations from the average production structure. Thus, rela-
tive income is an endogenous variable which is correlated with the error term. It is precisely this
endogeneity, however, that the regressions seek to capture, and hope is maximized. To the
degree that changes in patterns of comparative advantage are orthogonal to changes in the disper-
sion of income, but nevertheless result in changes in the dispersion of production, the regressions
fail to capture the influence of these important variables. In the next section I address, more
directly, issues of comparative advantage.
27 Regarding GDP measures of income and structure, the estimated relations are fairly simi-lar. However, while the square of the natural log of the ratio of provincial GDP per capita to thenational average fell from .33 to .26 between 1978 and 1995, during the same period the mean ofthe absolute value of the log ratio actually rose, from .37 to .43. Thus, running regressions usingGDP measures of income and deviations from the average structure (as estimated in Figure IIearlier), I find, that the linear and and squared income distribution terms together, in the equiva-lent of column (3) above, actually imply a .24 point increase in the sum of provincial deviationsfrom the average production structure between 1978 and 1995. Even when using only squaredterms, the equivalent of column (4) above, changes in the income distribution still only accountfor .24 points of the 1.86 point decline in the sum of provincial deviations from the averagestructure between 1978 and 1995. Allowing for cubic terms, as in column (5), once again line-arizes the relation and indicates that changes in the distribution contributed to a .22 pointincrease in the deviation from the average structure. Finally, with provincial dummies, andconstraining the relation to be symmetric around the y-axis, squared terms dominate the regres-sion. Even so changes in income distribution, in the equivalent to column (8) above, account foronly .22 points of the 1.86 point decline in the sum of deviations between 1978 and 1995. Ishould note that the GDP regressions are restricted to the post-1978 period. Thus, they helpaddress the issue of whether a restricted estimate of the relationship between income dispersionand the deviation from the average, using data outside of the plan period, does better in explain-ing the convergence in the structure of production. It does not.
33
B) Specialization and Comparative advantage
A simple variance decomposition provides some insight into the forces driving conver-
gence in the structure of production in the People's Republic. Consider the variation in the log
of the ratio of the output of two sectors, i and j. This variation can naturally be decomposed into
the variance of relative labour productivities, the variance of relative labour allocations, and the
covariance between the two, i.e.
QI4 .((1) Var[14-1 = Var[1ni + Varilit(di + 2 Cov[In(
i574) 0
n
Thus, to provide some interpretation, convergence in structure might reflect a convergence in
patterns of comparative advantage, a convergence in factor allocations or a weakening of the
trade-induced link between patterns of comparative advantage and factor allocations. Before
applying this decomposition, it is worth exploring the theoretical basis for its interpretation in
some detail.
As first noted by Ford (1967), and later generalized by Falvey (1981), the link between
patterns of comparative advantage and the average product of labour is by no means restricted to
the Classical (Ricardian) model alone. Consider a Heckscher-Ohlin world with two sectors and
capital and labour as the two factors of production. Absent technologicial change, an increase in
labour productivity in sector i can only be brought about by an increase in the capital-labour ratio
which, in turn, is related, by the elasticity of substitution, to changes in the wage-rental ratio:
(2) 4r = o'Kki k,=0,0+ 11)
where hats denote proportional changes and Oxi the sectoral share of capital. If the elasticity of
substitution is the same across sectors (or, more precisely, is not higher in labour intensive sec-
tors), intersectoral differences in output per worker will be systematically related to changes in
the wage-rental ratio:
(3) 4 — 4 , = (0( — a (FP – t)
34
If factor price equalization holds, all economies share the same relative labour productivities. If,
however, there are trade barriers or transport costs, and these are increasing in the volume of
trade, then economies endowed with more capital will have higher wage-rental ratios. It follows,
from (3), that if sector i produces the capital intensive good, the average product of labour in
sector i relative to sector j will be higher in economies in which capital is abundant, i.e. econo-
mies whose comparative advantage lies in capital intensive goods.
The extension of this analysis to the decomposition presented above is fairly simple.
Consider two exercises, one in which trade barriers are increased and another in which, for given
levels of trade barriers, the variation of capital-labour ratios (i.e. dispersion of comparative
advantage) is reduced. To begin with the first, as trade barriers increase the elasticity of demand
in each economy (initially, with free trade, infinite) falls. Economies which are capital (labour)
abundant will, at any given price ratio, have greater relative supplies of the capital (labour) inten-
sive good. As the elasticity of demand falls, the relative price of this good within the economy
falls, reducing its output relative to the output of the good in which the economy does not have a
comparative advantage. Thus:
(A) An increase in trade barriers leads to a convergence in the structure of production,reducing the variance (across the sample) of relative outputs.
As the relative price of capital intensive goods falls in capital abundant economies and rises in
labour abundant economies, it raises the wage-rental ratio in the former and lowers it in the lat-
ter. It follows, from (3), that:
(B) An increase in trade barriers raises the relative productivity of labour in the sectorin which economies have a comparative advantage, increasing the overall variance(across the sample) of relative labour productivities.
The economy-wide capital labour ratio equals the sum of the capital-labour ratios of each sector,
weighted by their shares of the total labour force:
(4) KIL = (K,IL,)(LIL)+ (KILO (LA)
35
As the wage-rental ratio rises (falls) in capital (labour) abundant economies, the capital-labour
ratio in each sector rises (falls). From (4), one can see that this systematically reduces the alloca-
tion of labour to the sector in which the economy has a comparative advantage. In the limit, if
the effective elasticity of demand falls below the elasticity of substitution in production, labour
allocations can become perverse, with more of this factor allocated to the sector in which the
economy does not have a comparative advantage, Thus:
(C) An increase in trade barriers reduces the allocation of labour to the sector in whichan economy has a comparative advantage, reducing the variance of labour allocationswhen these are biased in favour of comparative advantage and increasing it when labourallocations have become perverse. The covariance between labour allocations and rela-tive productivities initially increases (from zero), as the variance of relative productivitiesrises, but then begins a monotonic deterioration, becoming negative once factorallocations are perverse.
Consider now a second exercise, reducing, for given levels of trade barriers, the interregio-
nal dispersion of capital-labour ratios (the dispersion of comparative advantage). As the
economy-wide capital-labour ratio falls in capital abundant economies, the output of the capital
intensive good falls, raising its relative price. The rise of the relative price of the capital inten-
sive good increases its production, but, unless demand is completely inelastic, this increase does
not completely offset the initial supply response. Applying similar reasoning to labour abundant
economies which experience a rise in the capital-labour ratio, it follows that:
(a) A reduction in the dispersion of comparative advantage leads to a convergence inthe structure of production, reducing the variance (across the sample) of relative outputs.
As the price of the capital intensive good rises in capital intensive economies and falls in labour
intensive economies, the wage-rental ratio falls in the former and rises in the latter. From (3),
this tends to lower the relative productivity of labour in the capital intensive sector (where it is
initially higher) in capital abundant economies and raise it in labour abundant economies (where
it is initially lower). Consequently:
(b) A reduction in the dispersion of comparative advantage systematically reduces therelative productivity of labour in sectors in which it was already relatively high, loweringthe overall variance (across the sample) of relative labour productivities.
36
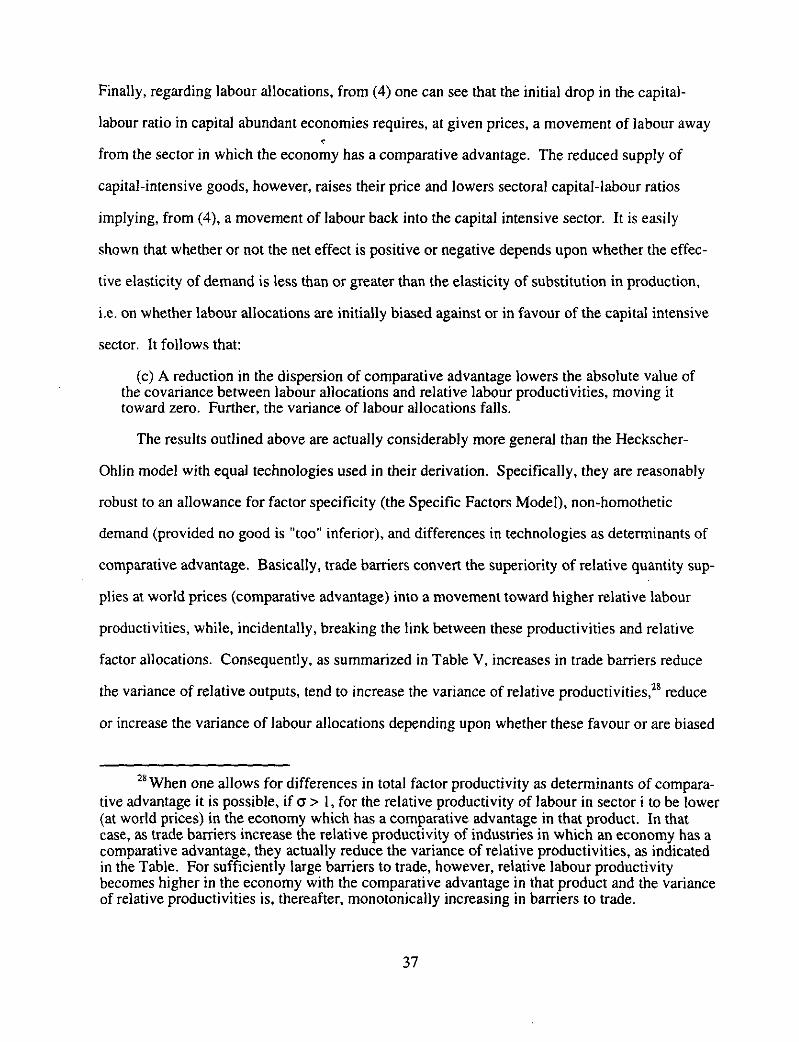
Finally, regarding labour allocations, from (4) one can see that the initial drop in the capital-
labour ratio in capital abundant economies requires, at given prices, a movement of labour away
from the sector in which the economy has a comparative advantage. The reduced supply of
capital-intensive goods, however, raises their price and lowers sectoral capital-labour ratios
implying, from (4), a movement of labour back into the capital intensive sector. It is easily
shown that whether or not the net effect is positive or negative depends upon whether the effec-
tive elasticity of demand is less than or greater than the elasticity of substitution in production,
Le. on whether labour allocations are initially biased against or in favour of the capital intensive
sector. It follows that:
(c) A reduction in the dispersion of comparative advantage lowers the absolute value ofthe covariance between labour allocations and relative labour productivities, moving ittoward zero. Further, the variance of labour allocations falls.
The results outlined above are actually considerably more general than the Heckscher-
Ohlin model with equal technologies used in their derivation. Specifically, they are reasonably
robust to an allowance for factor specificity (the Specific Factors Model), non-homothetic
demand (provided no good is "too" inferior), and differences in technologies as determinants of
comparative advantage. Basically, trade barriers convert the superiority of relative quantity sup-
plies at world prices (comparative advantage) into a movement toward higher relative labour
productivities, while, incidentally, breaking the link between these productivities and relative
factor allocations. Consequently, as summarized in Table V, increases in trade barriers reduce
the variance of relative outputs, tend to increase the variance of relative productivities,u reduce
or increase the variance of labour allocations depending upon whether these favour or are biased
28 When one allows for differences in total factor productivity as determinants of compara-tive advantage it is possible, if a> 1, for the relative productivity of labour in sector i to be lower(at world prices) in the economy which has a comparative advantage in that product. In thatcase, as trade barriers increase the relative productivity of industries in which an economy has acomparative advantage, they actually reduce the variance of relative productivities, as indicatedin the Table. For sufficiently large barriers to trade, however, relative labour productivitybecomes higher in the economy with the comparative advantage in that product and the varianceof relative productivities is, thereafter, monotonically increasing in barriers to trade.
37
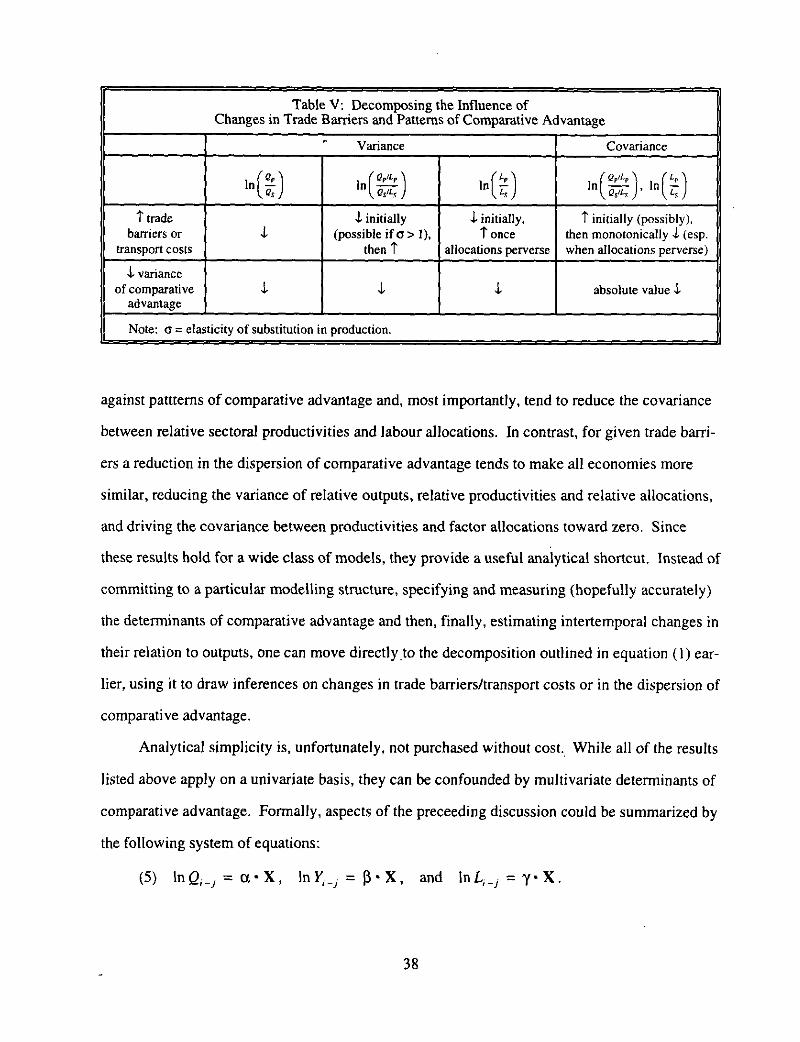
Table V: Decomposing the Influence ofChanges in Trade Barriers and Patterns of Comparative Advantage
Variance Covariance
In (&)Qs
In (-±c2 )esIls
In ( ILLs)
n (2,/lp 1,
Qs1In (-LT)
T tradebarriers or
transport costs1
i initially(possible if a> 1),
then T
i initially,T once
allocations perverse
T initially (possibly),then monotonically .l. (esp.when allocations perverse)
4. varianceof comparative
advantage1 1 1 absolute value 1
Note: a = elasticity of substitution in production.
against pattterns of comparative advantage and, most importantly, tend to reduce the covariance
between relative sectoral productivities and labour allocations. In contrast, for given trade barri-
ers a reduction in the dispersion of comparative advantage tends to make all economies more
similar, reducing the variance of relative outputs, relative productivities and relative allocations,
and driving the covariance between productivities and factor allocations toward zero. Since
these results hold for a wide class of models, they provide a useful analytical shortcut. Instead of
committing to a particular modelling structure, specifying and measuring (hopefully accurately)
the determinants of comparative advantage and then, finally, estimating intertemporal changes in
their relation to outputs, one can move directly to the decomposition outlined in equation (1) ear-
lier, using it to draw inferences on changes in trade barriers/transport costs or in the dispersion of
comparative advantage.
Analytical simplicity is, unfortunately, not purchased without cost. While all of the results
listed above apply on a univariate basis, they can be confounded by multivariate determinants of
comparative advantage. Formally, aspects of the preceeding discussion could be summarized by
the following system of equations:
(5) In Q, j a • X , In Y,_ j = 13 • X , and In L, _j y • X .
38
where X is a vector of exogenous determinants of comparative advantage (plus a constant), the
greek letters denote coefficient vectors, and Q, , Y,_J , and L,_, are an economy's output, labour
productivity and labour allocation, respectively, in sector i relative to sector j. The preceeding
discussion, and more formal analytics, easily establishes results such as aniaE < o, apthE > 0, and
ay/k < 0 where e is a measure of trade barriers or transport costs. Similarly, it is not hard to see,
looking at (5), why the variance of each endogenous variable is decreasing in the variance of
each of the x/s. The multivariate framework, however, allows one to destroy the clarity of the
univariate results. For example, if the variance of x, rose, while the variance of x 2 declined, it
would be possible for the variance of relative outputs to fall, while the variance of relative pro-
ductivities rose. This would constitute a case where changes in comparative advantage produced
results that, as per Table V, I would ascribe to changes in trade barriers. Although one can rule
out some perverse possibilities in some analytical structures, one cannot exclude these outcomes
for all models and all parameter values. Generally, however, perverse results require an
extremely strong negative covariance between the determinants of comparative advantage (or in
their changes) so that while one factor pulls the endogenous variables in one direction, the other
pulls in the opposite (but not equal) direction.29
Table VI below performs the variance decomposition for the output of primary vs. second-
ary industry (two predominantly tradeable sectors) in 26 provinces during the reform period.
The Table uses both 1978 and 1992 prices as weights in the analysis and, with the exception of
the variance of relative outputs, which falls less at earlier prices, the qualitative nature of
29 1 should note, further, that all of the results outlined in the text concern real outputs.Consequently, in Table VI further below I focus on changes in outputs and productivities at con-stant prices. This still leaves the problem of initial prices and their covariance with subsequentoutput changes. To work around this, I present the results using different base years. The modeldescribed above also has implications for movements in relative prices, which I hope to explorefurther in a later draft. I am still working out the analytics of these, and other, issues. It is myintent to prepare an appendix providing a full analytical description of the models discussed inthe text above, allowing for sector specific or mobile factors, non-homothetic demand and differ-ences in sectoral total factor productivities.
39
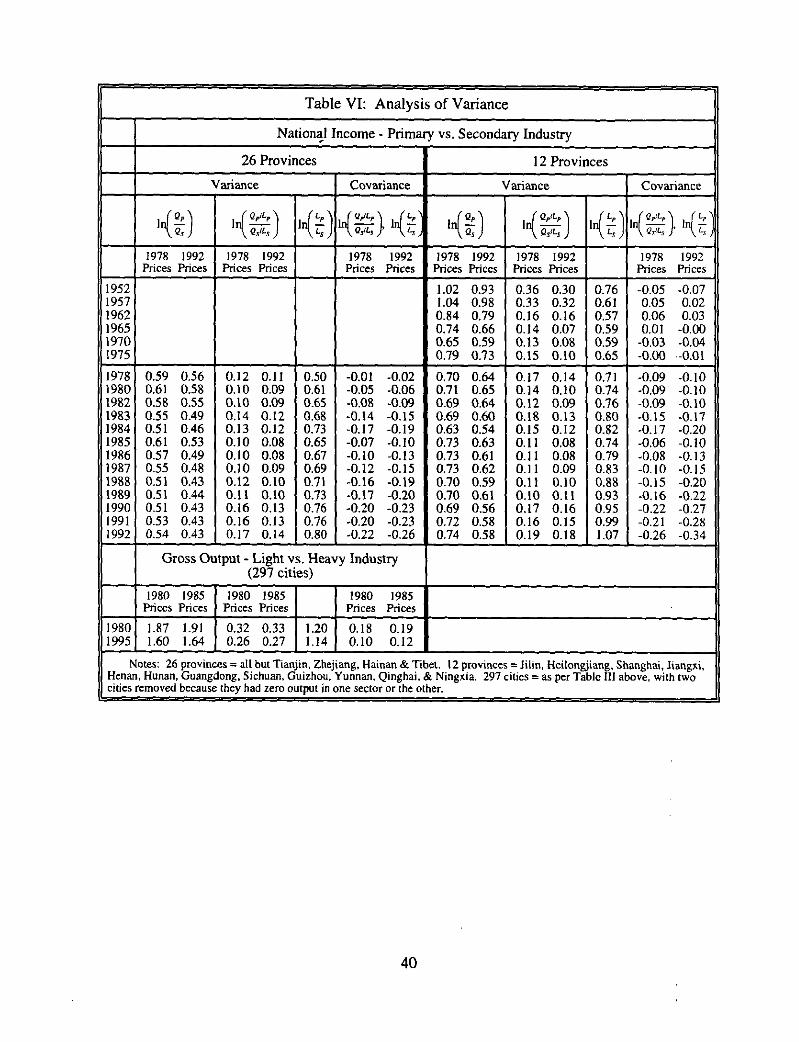
Table VI: Analysis of Variance
National Income - Primary vs. Secondary Industry
26 Provinces 12 Provinces
Variance Covariance Variance Covariance
lelQsIIQ-PiL1)
42111I n( LZ )
LsIr( &ilt ), InC2:\
Qsay Ls )In(c2f)
Qs It(n) ,n(Z) In(;.:), In( L, )
1978 1992 1978 1992 1978 1992 1978 1992 1978 1992 1978 1992Prices Prices Prices Prices Prices Prices Prices Prices Prices Prices Prices Prices
1952 1.02 0.93 0.36 0.30 0.76 -0.05 -0.071957 1.04 0.98 0.33 0.32 0.61 0.05 0.021962 0.84 0.79 0.16 0.16 0.57 0.06 0.031965 0.74 0.66 0.14 0.07 0.59 0.01 -0.001970 0.65 0.59 0.13 0.08 0.59 -0.03 -0.041975 0.79 0.73 0.15 0.10 0.65 -0.00 -0.01
1978 0.59 0.56 0.12 0.11 0.50 -0.01 -0.02 0.70 0.64 0.17 0.14 0.71 -0.09 -0.101980 0.61 0.58 am 0.09 0.61 -0.05 -0.06 0.71 0.65 0.14 0.10 0.74 -0.09 -0.101982 0.58 0.55 0.10 0.09 0.65 -0.08 -0.09 0.69 0.64 0.12 0.09 0.76 -0.09 -0.101983 0.55 0.49 0.14 0.12 0.68 -0.14 -0.15 0.69 0.60 0.18 0.13 0.80 -0.15 -0.171984 0.51 0.46 0.13 0.12 0.73 -0.17 -0.19 0.63 0.54 0.15 0.12 0.82 -0.17 -0.201985 0.61 0.53 0.10 0.08 0.65 -0.07 -0.10 0.73 0.63 0.11 0.08 0.74 -0.06 -0.101986 0.57 0.49 0.10 0.08 0.67 -0.10 -0.13 0.73 0.61 0.11 0.08 0.79 -0.08 -0.131987 0.55 0.48 0.10 0.09 0.69 -0.12 -0.15 0.73 0.62 0.11 0.09 0.83 -0.10 -0.151988 0.51 0.43 0.12 0.10 0.71 -0.16 -0.19 0.70 0.59 0.11 0.10 0.88 -0.15 -0.201989 0.51 0.44 0.11 0.10 0.73 -0.17 -0.20 0.70 0.61 0.10 0.11 0.93 -0.16 -0.221990 0.51 0.43 0A6 0.13 0.76 -0.20 -0.23 0.69 0.56 0.17 0.16 0.95 -0.22 -0.271991 0.53 0.43 0.16 0.13 0.76 -0.20 -0.23 0.72 0.58 0.16 0.15 0.99 -0.21 -0.281992 0.54 0.43 0.17 0.14 0.80 -0.22 -0.26 0.74 0.58 0.19 0.18 1.07 -0.26 -0.34
Gross Output - Light vs. Heavy Industry(297 cif es)
1980 1985 1980 1985 1980 1985Prices Prices Prices Prices Prices Prices
1980 1.87 1.91 0.32 0.33 1.20 0.18 0.191995 1.60 1.64 0.26 0.27 1.14 0.10 0.12
Notes: 26 provinces = all but Tian in, Zhej ang, Hainan & Tibet. 12 provinces = Jilin, Heilongjiang, Shanghai, Jiangxi,Henan, Hunan, Guangdong, Sichuan, Guizhou, Yunnan, Qinghai, & Ningxia. 297 cities = as per Table III above, with twocities removed because they had zero output in one sector or the other.
40
the results is unaffected by the choice of weights. As the reader can see, both the variance of
relative productivities and the variance of labour allocations rose during the sample period, while
the covariance of productivities and allocations fell dramatically. These results are not compat-
ible with a decreasing dispersion of patterns of comparative advantage, or even an increasing dis-
persion, since this would imply a rapidly rising variance of relative outputs. They are, however,
precisely what is implied by a rise in transport costs or trade barriers. A smaller sample of 12
provinces provides a longer historical perspective. Here, we see that up until 1962 convergence
in the structure of output seems to have been associated with a declining variance of relative pro-
ductivities and factor allocations, and an improving covariance, results that might be driven by a
falling dispersion of comparative advantage coupled, perhaps, with some fall in transport costs.
Beginning in 1962, however, we see, as in so many cases in this paper, the beginning of trends
which carry through into the reform period: a rising variance of relative productivities and factor
allocations and a deteriorating covariance between the two. Thus, the changes that occurred in
the economy during a period of forced industrial diversification paradoxically seem to have con-
tinued during its "movement to market". At 1992 prices, the correlation between relative pro-
ductivities and factor allocations in the 26 province sample, -.08 in 1978, had fallen to -.78 by
1992.
Table VI also presents the variance decomposition for the gross output of light and heavy
industries in the 297 cities examined earlier in Table III. Here we see that convergence in the
structure of production has been associated with a fall in the variance of relative productivities
and factor allocations and a weakening of the covariance between the two. These results are
generally incompatible with rising trade barriers and are much more plausibly related to simple
convergence in patterns of comparative advantage. If one regresses the growth of output per
worker in light or heavy industry on its initial value, one finds a significant negative coefficient.
While trade barriers may have risen across this sample, their effect is clearly dominated by the
convergence in patterns of comparative advantage. This sample, however, excludes rural indus-
41
try. Thus, as a test of patterns of factor allocation, it excludes the main body of entrants (i.e.
industrial rent seekers) during the reform period.
The preceeding paragraph touches on an important issue: the interpretation of the variance
decomposition performed in Table VI is very specific to the universe of economies and sample
of products. In particular, the results, indicating rising interprovincial trade barriers in agricul-
ture vs. manufacturing, are completely compatible with an overall opening of the economy and
an overall movement of comparative advantage toward manufactures. Thus, to explore the first
issue, imagine that there is a domestic relative price P°/P° which, initially, is distorted away
from the world price Ppw/Psw by national tariff barriers. Later, national tariff barriers are removed
and PpD/Ps° goes to the world relative price. Interprovincial barriers, however, rise, so that pro-
vincial prices now deviate more from P° /P°. While the overall specialization of the economy,
vis-a-vis the world, improves, its internal specialization deteriorates, producing results such as
those chronicled in Table VI.
C) Transport constraints
The deteriorating covariance between labour allocations and labour productivities chroni-
cled in the previous section suggests that China's provinces are becoming, at least vis-a-vis each
other, increasingly autarkic. The collapse of specialization, ascribed in this paper to the
industrial arbitrage of the reform period and the trade wars it engendered, could, however, just as
easily be explained by rising internal transport costs. A recurrent theme in popular press articles
on China is the argument that the People's Republic is woefully short of transport infrastructure.
It is possible that the extraordinary growth of output during the reform period has placed impos-
sible demands on the nation's infrastructure, leading to a rising relative price of transport.
42
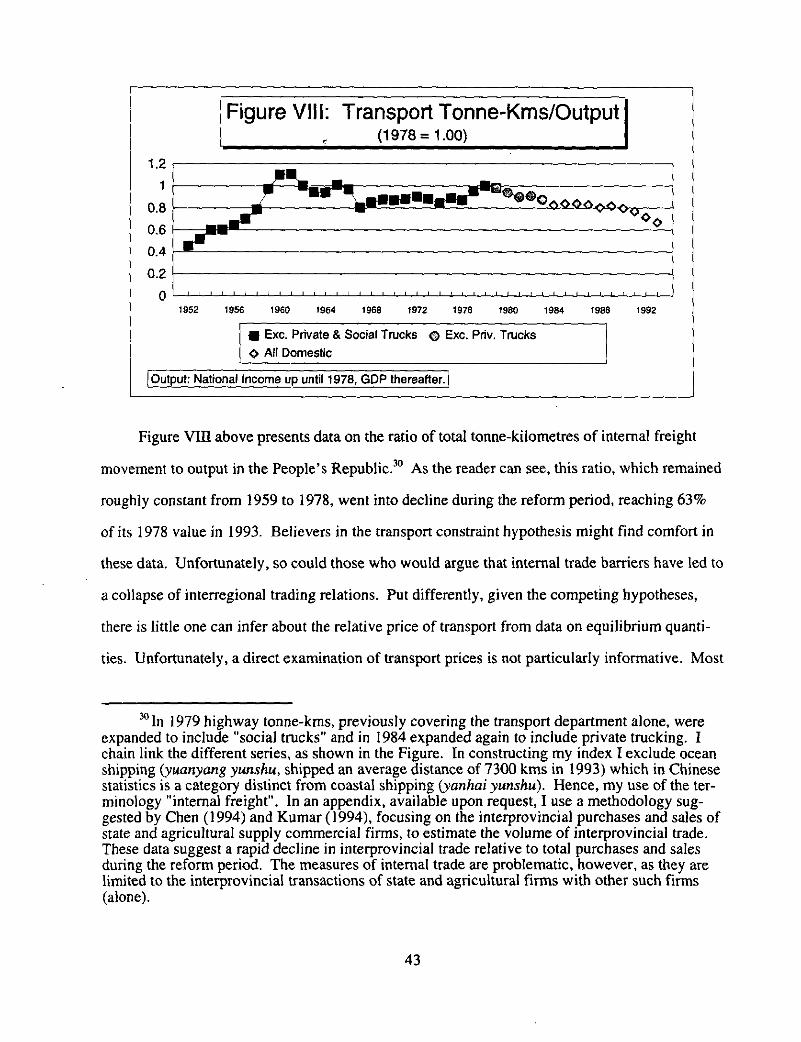
Figure VIII: Transport Tonne-Kms/Output(1978 =1.00)
1.2ths1 i Mg
0.8 • • * *
*O0.6
0.4
0.2
01952 1956 1960 1964 1968 1972 1978 1980 1984 1988 1992
■ Exc. Private & Social Trucks 0 Exc. Priv. Trucks* All Domestic
Output: National Income up until 1978, GDP thereafter.i
Figure VIII above presents data on the ratio of total tonne-kilometres of internal freight
movement to output in the People's Republic." As the reader can see, this ratio, which remained
roughly constant from 1959 to 1978, went into decline during the reform period, reaching 63%
of its 1978 value in 1993. Believers in the transport constraint hypothesis might find comfort in
these data. Unfortunately, so could those who would argue that internal trade barriers have led to
a collapse of interregional trading relations. Put differently, given the competing hypotheses,
there is little one can infer about the relative price of transport from data on equilibrium quanti-
ties. Unfortunately, a direct examination of transport prices is not particularly informative. Most
"In 1979 highway tonne-kms, previously covering the transport department alone, wereexpanded to include "social trucks" and in 1984 expanded again to include private trucking. Ichain link the different series, as shown in the Figure. In constructing my index I exclude oceanshipping (yuanyang yunshu, shipped an average distance of 7300 kms in 1993) which in Chinesestatistics is a category distinct from coastal shipping (yanhai yunshu). Hence, my use of the ter-minology "internal freight". In an appendix, available upon request, I use a methodology sug-gested by Chen (1994) and Kumar (1994), focusing on the interprovincial purchases and sales ofstate and agricultural supply commercial firms, to estimate the volume of interprovincial trade.These data suggest a rapid decline in interprovincial trade relative to total purchases and salesduring the reform period. The measures of internal trade are problematic, however, as they arelimited to the interprovincial transactions of state and agricultural firms with other such firms(alone).
43
transport in the People's Republic is mn by government authorities and their prices are not likely
to reflect the true cost of using transport facilities, given a shadow price for shipping delays and
negotiations with government agencies. 3 ' Consequently, to address the issue of transport con-
straints, I will rely on a heuristic examination of transport capacity and the composition of trans-
port demand.
Table VII below presents data on Chinese railway and waterway traffic and system assets.
While trucking grew rapidly during the reform period, as late as 1993 these two modes of tran-
port still accounted for 56% and 22%, respectively, of total tonne-kilometres of internal freight
movement. As the reader can readily see, the growth of both tonne and passenger kilometres in
railways and waterways far exceeds that of simple measures of transport capacity, such as kilo-
metres of operational railways or inland waterways. The quality of infrastructure, however, has
improved dramatically with the number of electrified stations and length of electric track, diesel
engine routes and automatic switching rising as fast, if not frequently faster, than total cargo
shipped. Similarly, while the growth of the total number of locomotives was moderate, its com-
position has shifted away from steam to diesel and electric locomotives which, in 1993, on aver-
age moved twice as many tonne-kilometres of freight per day. In waterways, we see a rapid rise
in total haulage capacity, with a substantial shift away from sail boats and barges to motorized
vessels.
If demand has dramatically outpaced the growth of transport capacity, one would expect to
find evidence of increasing delays in the shipment of goods. To this end, Table VIII presents
indicators of delays in railway transport. As the Table shows, there has been no significant
"For what its worth, between 1984 and 1994 railway freight revenue per tonne-km offreight movement rose 4.2% per annum, while passenger revenue per passenger-km of passengertransport rose 9.8% per annum. During the same period the overall GDP deflator rose 9.0% perannum. Between 1978 and 1995 the implicit GDP deflator for transportation, postal and tele-communications services rose 7.9% per annum, more than the overall GDP deflator (6.9%) andthe deflator for industry (4.6%), but less than the deflator for construction (9.0%) and primaryindustry (9.5%) and on a par with the deflator for commerce (7.7%). CSC( 1986 (p. 393) and1995 (pp. 32, 468-469, and 478).
44
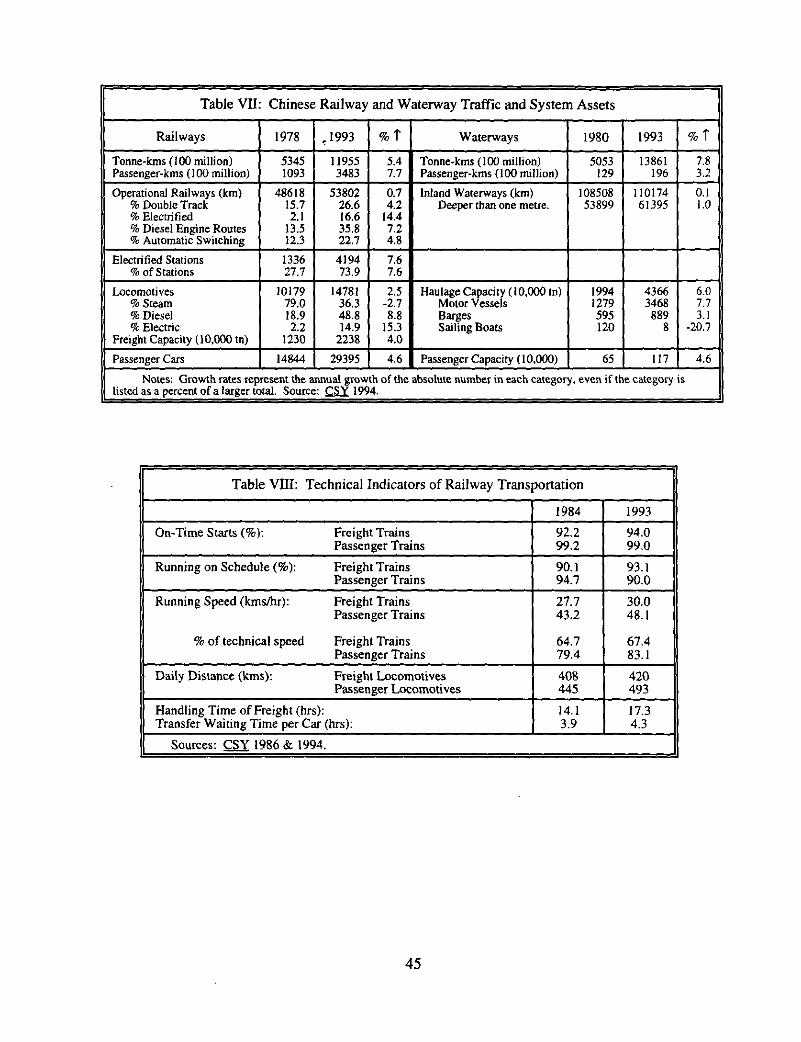
Table VII: Chinese Railway and Waterway Traffic and System Assets
Railways 1978 ,1993 % T Waterways 1980 1993 % T
Tonne-kms (100 million) 5345 11955 5.4 Tonne-kms (100 million) 5053 13861 7.8Passenger-kms (100 million) 1093 3483 7.7 Passenger-kms (100 million) 129 196 3.2
Operational Railways (km) 48618 53802 0.7 Inland Waterways (km) 108508 110174 0.1% Double Track 15.7 26.6 4.2 Deeper than one metre. 53899 61395 1.0% Electrified 2.1 16.6 14.4% Diesel Engine Routes 13.5 35.8 7.2% Automatic Switching 12.3 22.7 4.8
Electrified Stations 1336 4194 7.6% of Stations 27.7 73.9 7.6
Locomotives 10179 14781 2.5 Haulage Capacity (10,000 tn) 1994 4366 6.0% Steam 79.0 36.3 -2.7 Motor Vessels 1279 3468 7.7% Diesel 18.9 48.8 8.8 Barges 595 889 3.1% Electric 2.2 14.9 15.3 Sailing Boats 120 8 -20.7
Freight Capacity (10,000 tn) 1230 2238 4.0
Passenger Cars 14844 29395 4.6 _ Passenger Capacity (10,000) 65 117 4.6
Notes: Growth rates rep esent the annual growth of the absolute number in each category, even if the category islisted as a percent of a larger total. Source: CSY 1994.
Table VIII: Technical Indicators of Railway Transportation
1984 1993
On-Time Starts (%): Freight Trains 92.2 94.0Passenger Trains 99.2 99.0
Running on Schedule (%): Freight Trains 90.1 93.1Passenger Trains 94.7 90.0
Running Speed (kms/hr): Freight Trains 27.7 30.0Passenger Trains 43.2 48.1
% of technical speed Freight Trains 64.7 67.4Passenger Trains 79.4 83.1
Daily Distance (kms): Freight Locomotives 408 420Passenger Locomotives 445 493
Handling Time of Freight (hrs): 14.1 17.3Transfer Waiting Time per Car (hrs): 3.9 4.3
Sources: CSY 1986 & 1994.
45
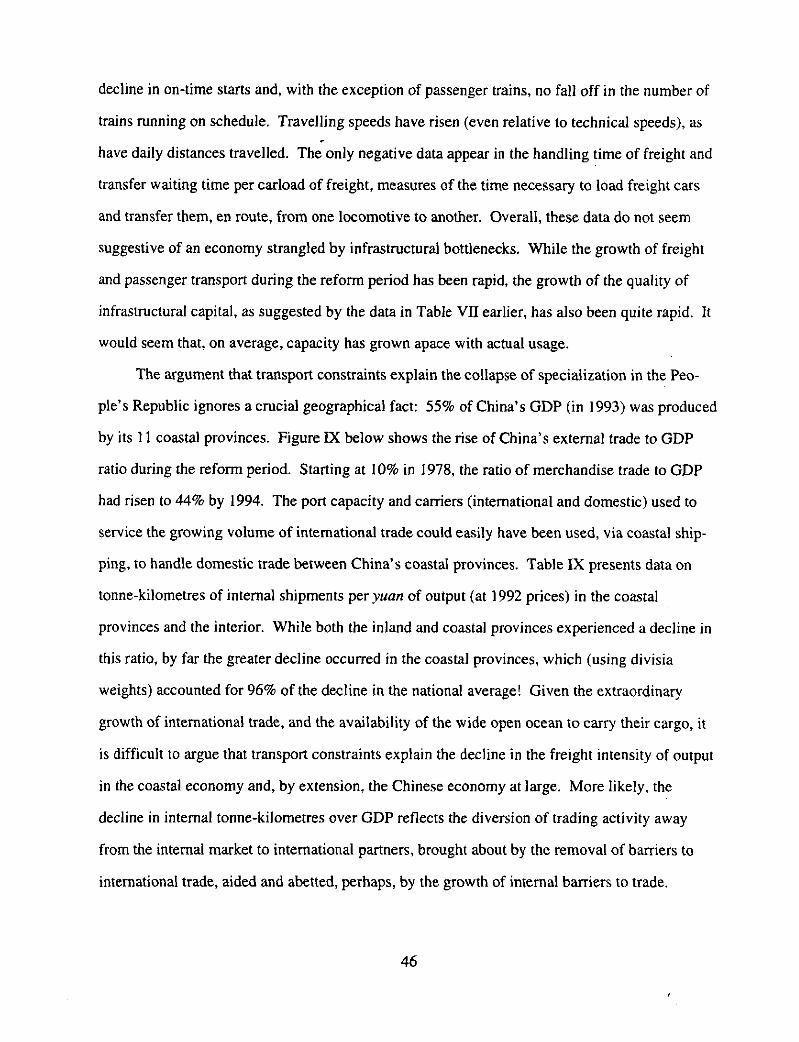
decline in on-time starts and, with the exception of passenger trains, no fall off in the number of
trains running on schedule. Travelling speeds have risen (even relative to technical speeds), as
have daily distances travelled. The only negative data appear in the handling time of freight and
transfer waiting time per carload of freight, measures of the time necessary to load freight cars
and transfer them, en route, from one locomotive to another. Overall, these data do not seem
suggestive of an economy strangled by infrastructural bottlenecks, While the growth of freight
and passenger transport during the reform period has been rapid, the growth of the quality of
infrastructural capital, as suggested by the data in Table VII earlier, has also been quite rapid. It
would seem that, on average, capacity has grown apace with actual usage.
The argument that transport constraints explain the collapse of specialization in the Peo-
ple's Republic ignores a crucial geographical fact: 55% of China's GDP (in 1993) was produced
by its 11 coastal provinces. Figure IX below shows the rise of China's external trade to GDP
ratio during the reform period. Starting at 10% in 1978, the ratio of merchandise trade to GDP
had risen to 44% by 1994. The port capacity and carriers (international and domestic) used to
service the growing volume of international trade could easily have been used, via coastal ship-
ping, to handle domestic trade between China's coastal provinces. Table IX presents data on
tonne-kilometres of internal shipments per yuan of output (at 1992 prices) in the coastal
provinces and the interior. While both the inland and coastal provinces experienced a decline in
this ratio, by far the greater decline occurred in the coastal provinces, which (using divisia
weights) accounted for 96% of the decline in the national average! Given the extraordinary
growth of international trade, and the availability of the wide open ocean to carry their cargo, it
is difficult to argue that transport constraints explain the decline in the freight intensity of output
in the coastal economy and, by extension, the Chinese economy at large. More likely, the
decline in internal tonne-kilometres over GDP reflects the diversion of trading activity away
from the internal market to international partners, brought about by the removal of barriers to
international trade, aided and abetted, perhaps, by the growth of internal barriers to trade.
46
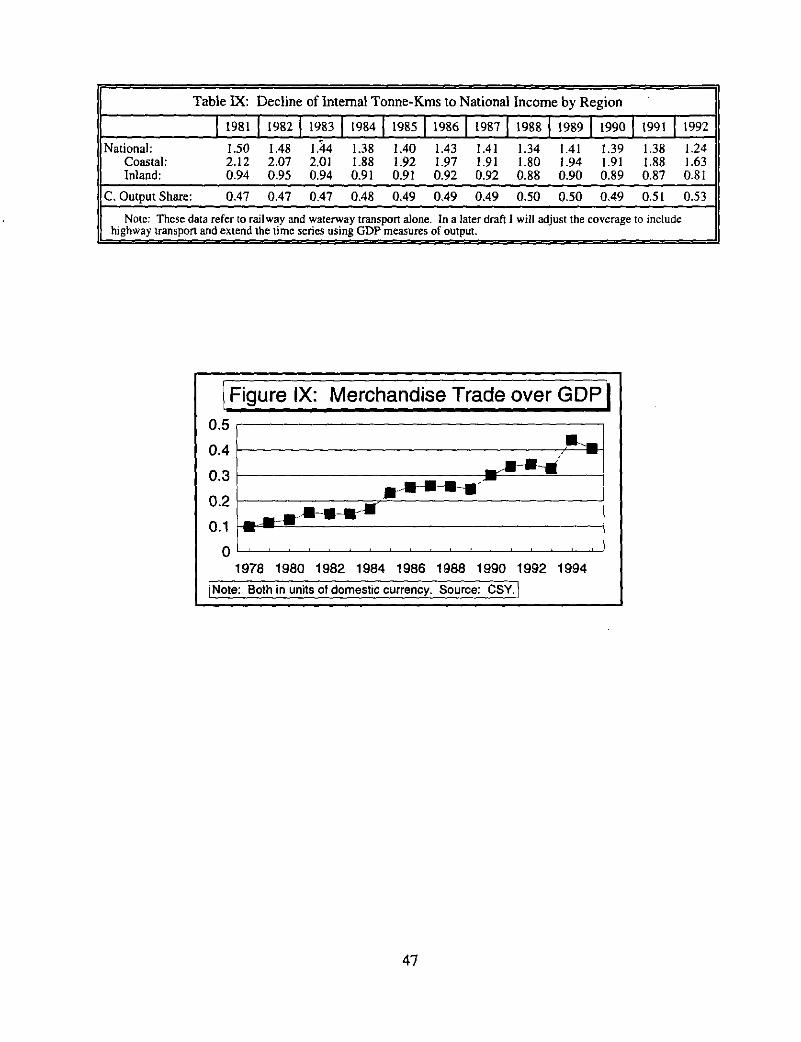
Table IX: Decline of Internal Tonne-Kms to National Income by Region
1 1981 1 1982 1 1983 1 1984 1 1985 1 1986 1 1987 1 1988 1 1989 1 1990 1 1991 1 1992
National: 1.50 1.48 1.44 1.38 1.40 1.43 1.41 1.34 1.41 1.39 1.38 1.24Coastal: 2.12 2.07 2.01 1.88 1.92 1.97 1.91 1.80 1.94 1.91 1.88 1.63Inland: 0.94 0.95 0.94 0.91 0.91 0.92 0.92 0.88 0.90 0.89 0.87 0.81
C. Output Share: 0.47 0.47 0.47 0.48 0.49 0.49 0.49 0.50 0.50 0.49 0.51 0.53
Note: These data refer to railway and waterway transport alone. In a later draft I will adjust the coverage to includehighway transport and extend the time series using GDP measures of output.
0.5
0.4
0.3
0.2
0.1
1Figure IX: Merchandise Trade over GDP
0
1-11-4JrRI--IN-11--.
E-Wall
ir
1978 1980 1982 1984 1986 1988 1990 1992 1994Note: Both in units of domestic currency. Source: CSY.
47
V Conclusion
If one wishes to argue that one of the perils of gradualist reform is the possibility that it
will give rise to new distortions, the removal of which poses new challenges to would-be reform-
ers, one must present evidence of the appearance, in the aggregate, of a new distortion whose
birth can credibly be ascribed to the endogenous response of actors to the rental opportunities
created by gradualist reform and whose lifespan far exceeds that of the rents which originally
motivated its arrival. In its focus on the interregional distribution of production in the People's
Republic of China, this paper has sought such evidence. Despite widespread, and presumably
excess, diversification under the plan, the overwhelmingly dominant trend of the reform period
has been toward further diversification, as different regions of the economy duplicated each
other's industrial structure in an attempt to capture centrally mandated industrial rents. Although
centrally mandated price wedges have now all but disappeared, the process of industrial duplica-
tion, having slowed and perhaps even stopped, nevertheless shows little tendency to reverse
itself.
This paper also considers alternative explanations and decompositions of the "anomaly" it
chronicles. Historically, in the People's Republic, the interregional dispersion of levels of
income has been significantly related to the dispersion of patterns of production, but changes in
the dispersion of income during the reform period have been far too small to explain anything
but a small fraction of the rapid convergence in the structure of production. A simple variance
decomposition indicates that, in aggregate data, convergence in the structure of production has
not been driven by a reduction in the variance of relative sectoral labour productivities or the
variance of relative labour allocations, but rather by a rapid deterioration in the covariance
between these two endogenous variables. Using an analytical framework derived from standard
trade theory, I argue that these results are incompatible with convergence in patterns of compara-
tive advantage and are, instead, indicative of growing interregional barriers to trade. Finally,
48
data on internal freight movements indicate that these have declined relative to GDP, which
provides circumstantial evidence in favour of the notion of rising interregional transport costs. A
decomposition of transport movements into the coastal and interior regions of the economy,
however, shows that declines in internal freight movements have been greatest in the coastal
provinces, which have access to coastal shipping. In conjunction with the evidence on the
covariance of labour allocations and relative productivities, these data paint a picture of an econ-
omy which, while becoming more and more open internationally, has become more and more
fragmented internally.
Fundamentally, the central theme of this paper is that the so-called "liberalization" and
"transformation" of the People's Republic over the past 20 years is perhaps best characterized as
a process of devolution. Although the central government has released control over prices, out-
puts and enterprise budgets, these functions have been taken up, albeit in a less systematic fash-
ion, by local governments. Thus, China has moved from having one central plan to having
many, mutually competitive, central plans. It is not hard to believe that the control and incentive
problems that plague planning are more easily managed at the provincial and county level than
they are at the continental level.32 Consequently, whatever the welfare costs of the new distor-
tions, it is not surprising that on net the devolution of power has greatly increased welfare, as
32 Surprisingly, it is actually possible to argue that overall improvements in efficiency dur-ing the reform period have not been that high. My TFP estimates (available upon request) indi-cate that productivity growth in the non-agricultural economy during the 1978-1994 periodaveraged 1.1% per annum, only slightly better than the 0.7% per annum attained during theCultural Revolution. Rising participation rates, improved educational levels and the transfer oflabour out of agriculture explain most of the pre and post reform growth in the non-agriculturalsector. The moderate reform period TFP growth would suggest that, while expediting a move-ment of (possibly slack) resources out of agriculture and continuing to encourage valuableinvestment in physical and human capital, the reforms, and local government control, have notbeen that successful in raising the efficiency with which resources are used in the non-agricultural sector. This conclusion, however, requires that the reader accept an adjustment Imake (using other Chinese price statistics) to the Chinese output deflators. If one accepts theofficially reported deflators, then the post reform TFP growth is truly spectacular, i.e. on theorder of 3.7% per annum.
49
witnessed by the extraordinary growth of the past two decades. An economic system
characterized by government control, even local government control, over prices, output and
investment is not, however, typically viewed as being conducive to long term prosperity. It
remains to be seen whether the central government of the People's Republic can wrest back
enough power from its regions, enforcing the moral equivalent of the interstate commerce clause
of the U.S. Constitution, restricting the power of local governments to control the interregional
movement of goods and factors, without, however, reestablishing inefficient central control over
the same. This would allow it to bring out the most virtuous aspects of interregional local gov-
ernment competition, while restricting its more pernicious manifestations.
50
VI Bibliography
Chen, Dong and Zhili Niu. Practical Manual on Economic Statistics of China (Zhongguo JingjiTamen Shivong Daquan). Beijing: China People's University Publishers, 1989.
Chen, Yong Jun. A Study of Interregional Market Blockades in China (Zhongguo Diqu jian Shi-chang Fekgsuo Wenn Yanjiu). Fuzhou: Fujian People's Publishers, 1994.
Dewatripont, Mathias and Roland, Gerard. "The Design of Reform Packages under Uncer-tainty." American Economic Review 85, No. 5 (December 1995): 1207-1223.
Falvey, Rodney E. "Comparative Advantage in a multi-factor world." International EconomicReview 22 (June 1981): 401413.
Far Eastern Economic Review various issues.
Ford, J.L. "On the equivalence of the classical and the factor models in explaining internationaltrade patterns." The Manchester School 35 (May 1967): 185-198.
Foreign Broadcasting Information Service, Daily Reports, People's Republic of China.
Gelb, Alan; Jefferson, Gary and Singh, Inderjit. "Can Communist Economies Transform Incre-mentally? The Experience of China." In Olivier Jean Blanchard and Stanley Fischer, eds.NBER Macroeconomics Annual 1993. Cambridge, MA: MIT Press, 1993.
Hsueh, Tien-tung; Qiang Li and Shucheng Liu. China's Provincial Statistics. 1949-1989. Boul-der: Westview Press, 1993.
Jefferson, Gary H. and Rawski, Thomas G. "Enterprise Reform in Chinese Industry." Journal ofEconomic Perspectives 8, No. 2 (Spring 1994): 47-70.
Kumar, Anjali. ClikigLInternalMarl__.wilDevSpa and Reu at'o . Washington, D.C.: TheWorld Bank, 1994.
Martinelli, Cesar and Tommasi, Mariano. "Sequencing of Economic Reforms in the Presence ofPolitical Constraints." Working Paper No. 100. University of Maryland, Center for Insti-tutional Reform and the Informal Sector, 1994.
Mascaro, Juan. The Upanishads: Translations from the Sanskrit. England: Penguin Books,1965.
Murphy, Kevin, Andrei Shleifer and Robert W. Vishny. "The Transition to a Market Economy:Pitfalls of Partial Reform." Ouarterl y Journal of Economics (August 1992): 889-906.
Naughton, Barry. "False Starts and Second Wind: Financial Reforms in China's Industrial Sys-tem." In Elizabeth J. Perry and Christine Wong, eds. The Political Economy of Reform inPost-Mao China. Cambridge: Council on East Asian Studies, Harvard University, 1985.
51
Naughton, Barry. "Industrial Policy during the Cultural Revolution: Military Preparation,Decentralization and Leaps Forward." In William A. Joseph, Christine P.W. Wong andDavid Zweig, eds. New Perspectives on_the Cultural Revolution. Cambridge: Council onEast Asian Studies, Harvard University (1991).
People's Republic of China, Public Finance Bureau, Comprehensive Planning Department. Chi-na's Public Finance Statistics (Zhongguo CalMen Tongii) 1950-1985. China PublicFinance Economics Publishing House.
People's Republic of China, State Statistical Bureau.hina Indu trial onalhook (Zhongguo Gongve Jingii Tongii Nianiian). Beijing: China Statistical PublishingHouse, annual issues.
People's Republic of China, State Statistical Bureau. China Statistical Yearbook ghon.eguoTongii Nianiian). Beijing: China Statistical Publishing House, annual issues.
People's Republic of China, State Statistical Bureau. A Compilation of Historical Statistical Material for the Provinces, Autonomous Territories and Directly Administered Cities191ILL128±(Quarsatheni,22aZLLi. hi hixia hi i,ykDui Huibian). Beijing:China Statistical Publishing House, 1990.
Perkins, Dwight Heald. "Reforming China's Economic System." Journal of Economic Litera-ture Vol. 26, No. 2 (June 1988): 601-645.
Song, Xinzhong, ed. Study of the Reform of China's Public Finance System (Zhongguo Caiz-heng Yan'i . Beijing: Zhongguo Caizheng Jingji Chuban She, 1992.
Wong, Christine P.W. "Material Allocation and Decentralization: Impact of the Local Sector onIndustrial Reform." In Elizabeth J. Perry and Christine Wong, eds. The Political Economyof Reform in Post-Mao China. Cambridge: Council on East Asian Studies, Harvard Uni-versity, 1985.
Wong, Christine P.W. "Between Plan and Market: The Role of the Local Sector in Post-MaoChina." Journal of Comparative Economics 11 (1987): 385-398.
Wong, Christine P.W. "Interpreting Rural Industrial Growth in the Post-Mao Period." ModemChina Vol. 14, No. 1 (Jaunary 1988): 3-30.
Wong, Christine P.W. "Central-Local Relations in an Era of Fiscal Decline: The Paradox ofFiscal Decentralization in Post-Mao China." China Ouarterly 128 (December 1991a):691-715.
Wong, Christine P.W. "The Maoist 'Model' Reconsidered: Local Self-Reliance and its Financ-ing of Rural Industrialization." In William A. Joseph, Christine P.W. Wong and DavidZweig, eds. New Perspectives on the Cultural Revolution. Cambridge: Council on EastAsian Studies, Harvard University (1991b).
Wong, Christine P.W. "Fiscal Reform and Local Industrialization." Modern China Vol. 18, No.2 (April 1992): 197-227.
52