the real e ects of sovereign rating downgrades real effects of... · the real e ects of sovereign...
TRANSCRIPT

The Real Effects of Sovereign Rating Downgrades1
Heitor AlmeidaUniversity of Illinois at Urbana Champaign
Igor CunhaNova School of Business and Economics
Miguel A. FerreiraNova School of Business and Economics
Felipe RestrepoBoston [email protected]
January 22, 2014
1We thank Viral Acharya, Murillo Campello, Sergey Chernenko, Paolo Colla, Clifford Holder-ness, Darren Kisgen, Mitchell Petersen, Jun Qian, Rui Silva, Phil Strahan, Jerome Taillard, DavidThesmar, and Mike Weisbach for helpful comments.

Abstract
We study the effect of sovereign credit risk on firm investment and financial policy. We usethe differential effect of sovereign downgrades on on the ratings of firms at the sovereignbound versus firms below the bound due to sovereign ceiling policies followed by credit ratingagencies. We find that sovereign downgrades lead to greater increases in the cost of debt andgreater decreases in investment and leverage of firms that are at the sovereign bound relativeto similar firms that are below the bound. Our findings suggest that public debt managementgenerates negative externalities for the private sector and real economic activity.
JEL classification: G24, G28, G31, G32, H63Keywords: Credit rating, Sovereign bond, Sovereign ceiling, Rating downgrade, Cost ofcapital, Investment, Leverage

1 Introduction
Sovereign credit risk has become a significant problem for developed countries in the aftermath
of the 2007-2009 global financial crisis. An important question is how changes in sovereign
credit risk affect the private sector and real corporate outcomes. However, identifying em-
pirically the causal impact of sovereign credit risk on firm financial and investment policy
is difficult, because changes in sovereign credit risk are correlated with changes in firm fun-
damentals. We employ a novel identification strategy that relies on sovereign downgrades
and the sovereign ceiling policy followed by rating agencies to study the effects of sovereign
credit risk on firm policies. The ceiling policy implies that firms generally cannot have rat-
ings above the sovereign rating of the country where they are domiciled. (?) summarized
the key implication of the sovereign ceiling as follows: “If a company is a better credit risk
than its home country, it might still have trouble getting a credit rating agency to recognize
that fact”. Following a sovereign rating downgrade, firms that are at the sovereign bound are
generally downgraded, while firms below the sovereign bound are not necessarily downgraded.
Moreover, bound firms are downgraded not because of a deterioration of their fundamentals,
but simply because of the sovereign ceiling policy.1
In this paper, we show that sovereign credit risk has an important effect on firm’s cost
of debt, investment and leverage through the sovereign ceiling channel. Our benchmark
empirical specification employs the Abadie and Imbens (2011) matching estimator of the
average effect of the treatment on the treated (ATT). We isolate firms at the sovereign bound
(treated firm) and then, from the population of other firms (non-treated firms), look for
control firms that best match the treated firm in multiple dimensions (country, industry, size,
investment, Tobin’s Q, cash flow, cash, leverage, and foreign sales). Using a difference-in-
differences estimator, we find that the treated firms face an increase in the cost of debt and
cut investment and leverage in the aftermath of a sovereign downgrade, when benchmarked
1While credit rating agencies have been gradually moving away from a policy of never rating a firmabove the sovereign, sovereign ratings still represent a strong upper bound of credit rating assigned to firms(Borensztein, Cowan, and Valenzuela (2013)).
1

against control firms.
Credit ratings are among corporate managers’ major concerns due to the discrete costs
and benefits associated with different ratings levels (Kisgen (2006, 2007, 2009) and Kisgen and
Strahan (2010)). First, a decline in credit ratings can affect a firm’s access to the bond and
commercial paper markets because of regulations on institutional investors. Some investors
such as pension funds often follow guidelines that restrict investments to investment-grade
bonds (Boot, Milbourn, and Schmeits (2006)). Second, credit ratings affect the capital re-
quirements that banks and insurance companies are subject to when investing in specific
firms.2 Third, credit ratings can convey information to the market about a firm’s credit
quality. Credit ratings can reduce the total certification cost supported by borrowers, who
gain access to the capital of less-informed investors, and are therefore able to raise more debt
financing (Faulkender and Petersen (2006)). Fourth, downgrades can trigger events such as
bond covenant violations, increases in bond coupon rates or loan interest rates, and forced
bond repurchases. Finally, ratings can impact customer and employees relationships and
business operations such as the ability to enter or maintain long-term supply and financial
contracts. Merger deals can also be contingent on the maintenance of rating levels.
We first establish the validity of the identification strategy using the sovereign downgrade
and ceiling as instrument. We show that the distribution of corporate ratings across sovereign
rating levels is systematically concentrated exactly at each country’s sovereign rating. Thus,
sovereign ratings are a strong upper bound for the ratings of corporate borrowers. More
importantly, we show that the effect of sovereign downgrades is asymmetric between treatment
and control groups. While ratings decrease nearly one-to-one for the treatment group at the
time of a sovereign rating downgrade, ratings for the control group decrease significantly
less. Similarly, the probability of a firm suffering a rating downgrade following a sovereign
downgrade is 1.5 times higher for treated firms than for control firms. We also show the
sovereign ceiling policy is associated with ratings that tend to be more pessimistic for treated
2Basel rules rely on external agency ratings to determine risk weights for the purpose of banks capitalrequirements for credit risk and such risk-weighting can affect the supply of bank capital to firms.
2

firms relative to control firms and lower probability of default (five-year window) for treated
firms. We exploit the discontinuity in credit ratings changes between the treatment and
control group in our analysis.
Next, we show that rating downgrades affect the cost of debt. We find that in the month
following a sovereign rating downgrade, yield spreads of treated firms increase by approx-
imately 54 basis points more relative to control firms. This differential effect is even more
pronounced as the post-event window widens, and remain statistically significant. Thus, firms
that are downgraded as a consequence of the sovereign downgrade find it more expensive to
raise debt in the aftermath of a sovereign downgrade.
This increase in the cost of debt appears to have real consequences. We find that treated
firms decrease investment in the year of the sovereign downgrade significantly more than
control firms. Treated firms investment goes from 28.7% to 18.5% of capital, implying a 10.2
percentage points decrease. This decrease in investment is much larger than that observed
for the control firms, which is only 2.8 percentage points and statistically insignificant. The
ATT is -16.8 percentage points, which is highly statistically and economically significant. We
also show that this relative decrease in investment for the treatment group happens only in
the year of the downgrade and that, prior to the downgrade, investment grows at about the
same rate for both treatment and control groups.
A lower supply of debt capital for treated firms after a sovereign downgrade would naturally
imply a decrease in the use of debt. We show that treated firms decrease long-term debt
following the sovereign downgrade significantly more than control firms. Treated firms long-
term debt goes from 25.3% to 23.7% of assets, implying a 1.6 percentage points decrease.
The control group actually shows an increase in their long-term debt of 1.2 percentage points.
The ATT is -3.8 percentage points, which is statistically and economically significant. The
decrease in total debt is lower than the decrease in long-term debt, which indicates that
treated firms substitute between long-term and short-term debt following a sovereign-related
downgrade. We only observe changes in leverage in the year after the sovereign downgrade,
which is consistent with the idea that leverage takes longer to adjust than investment (Leary
3

and Roberts (2005) and Lemmon, Roberts, and Zender (2008)). Additionally, there is an
immediate reaction in corporate liquidity as we find that treated firms cash holdings decrease
significantly more than control firms in the year of the sovereign downgrade.
The key assumption of our identification strategy is that sovereign downgrades must not
be related to the differences in cost of capital, investment and leverage across treatment and
control groups, through channels other than changes in credit ratings. A potential concern
with this identification assumption is that country-level variables may affect both firm policies
and sovereign ratings, thereby contaminating the results. For example, a deterioration of
macroeconomic fundamentals can cause sovereign downgrades, and also increase the cost of
external finance for firms. However, this possibility is unlikely to contaminate our results
because the treatment group contains firms with higher credit quality than those in the
control group. If anything, treated firms should be less sensitive to macroeconomic shocks
that are associated with sovereign downgrades when compared to control firms.
To further validate our exclusion restriction, we also conduct two placebo tests that can de-
tect the existence of differential effects of macroeconomic shocks not associated with sovereign
downgrades. First, we examine the relative change in investment for treatment and control
groups around recessions that are not accompanied by sovereign rating downgrades. This
placebo test can detect whether treated firms are more sensitive to macroeconomic shocks
than control firms, which may confound our main results. We find a relatively small decrease
in investment for both treated and control firms in recession years, and no difference across
the two groups. Second, we examine the consequences of sovereign upgrades for investment.
Sovereign ceiling policies should not matter as much in the case of sovereign upgrades.3 Con-
sistent with this idea, we find no differences in investment behavior between treated and
control firms following sovereign upgrades. In summary, the placebo tests support a causal
interpretation for our results.
An additional concern is that rating agencies may only downgrade firms with poor funda-
3Firms with rating at the sovereign bound are not necessarily upgraded following a sovereign upgrade.Additionally, the market reaction to upgrades is typically insignificant (e.g. Brooks et al., 2004; Gande andParsley, 2005; Ferreira and Gama, 2007).
4

mentals following a sovereign downgrade, and exempt higher-quality firms from the sovereign
ceiling rule. We believe this “selective downgrade” hypothesis does not explain our results.
The control group should pick up the effect of weaker fundamentals on cost of debt, investment
and leverage. Thus, a stronger sensitivity of the treated firms to the sovereign downgrade is
likely to be due to the lower sovereign ceiling and not to firm fundamentals.
There are other papers that examine the effects of credit ratings. Sufi (2009) finds that
the introduction of loan ratings by Moody’s in 1995 leads to an increase in investment and
debt for firms that obtain a rating, in particular those with lower credit quality and no rating
prior to 1995. Lemmon and Roberts (2010) find that as a consequence of the junk bond crisis
of 1989, junk-rated firms decrease investment and net debt more than unrated firms. Tang
(2009) finds that the Moody’s credit rating refinement in 1982 leads to an increase in debt
and investment of upgraded firms versus downgraded firms. Chernenko and Sunderam (2012)
show that the investment rate of firms with rating right below the investment-grade cutoff
is more sensitive to flows into high-yield mutual funds, when compared to a matched sample
of firms with rating right above the cutoff. Harford and Uysal (2013) find that firms with a
credit rating are more likely to make acquisitions than a matched sample of non-rated firms.
Some papers empirically study the effects of the transmission of sovereign risk to corporate
risk (Durbin and Ng (2005), Arteta and Hale (2008), Borensztein, Cowan, and Valenzuela
(2013), and Bedendo and Colla (2013)).4
This paper makes two contributions. First, it provides a causal estimate of the effect of
credit rating downgrades on firms’ cost of capital and investment and financial policy. More
specifically, rating downgrades lead to an increase in the cost of capital, causing firms to cut
investment and deleverage. Second, we provide the exact channel through which sovereign
credit risk produce real effects. Sovereign downgrades have important real effects through the
sovereign ceiling, and not only through fundamentals such as interest rates and crowding-out
effects. When the sovereign has a credit rating that is not at the high end of the scale, credit
4Researchers have also studied the stock and bond market reaction to credit rating downgrades (Hand,Holthausen, and Leftwich (1992), Goh and Ederington (1993) among others).
5

ratings for firms from that country will tend to suffer, regardless of their financial soundness.
Governments need to be aware of the potential adverse effects of rating downgrades on the
private sector and they should factor these negative externalities into public debt management
decisions.
2 Methodology and data
In this section we first describe our experimental design as well as the matching estimator
that we employ. We exploit the fact that sovereign ratings downgrades can create exogenous
variation in corporate credit ratings because of sovereign ceilings as a way to identify the
effect of credit rating on firms’ cost of capital and investment and financial policy. We then
describe the data and present summary statistics.
2.1 Sovereign downgrades and ceilings: Institutional backgroud
Credit rating agencies play a crucial role in providing information about the ability and
willingness of issuers, including governments and private firms, to meet their financial obliga-
tions. The three major agencies – Standard and Poor’s (S&P), Moody’s and Fitch – assign
different types or ratings depending on the maturity (short term or long term) and currency
denomination of an issuance (foreign currency or local currency). This study focuses on the
foreign-currency, long-term issuer ratings, where agencies use a sovereign’s rating as a strong
upper bound on the credit ratings of firms that operate within each country. We prefer the
S&P foreign currency long-term rating history over other agencies’ rating history because
S&P tends to be more active in making rating revisions, and tends to lead other agencies
in re-rating (Kaminsky and Schmukler, 2002; Brooks et al., 2004; Gande and Parsley, 2005).
Foreign currency rating announcements by S&P also seem to convey a greater own-country
stock market impact and seem not to be fully anticipated by the market (Reisen and von
Maltzan, 1999; Brooks et al., 2004). S&P is also the agency least likely to assign corporate
ratings above the sovereign rating.
6

Until 1997, rating agencies strictly followed the policy of not granting a private company a
rating higher than the sovereign rating. In April of that year, S&P first relaxed its sovereign
ceiling rule in three dollarized economies: Argentina, Panama, and Uruguay.5 Although
rating agencies have moved away from strictly enforcing the sovereign ceiling over the last
two decades, corporate ratings that “pierce” the ceiling are still not common. For example,
S&P reports that there are only 54 non-financial corporations worldwide with rating that
exceeds the sovereign as of October 2012. Consistent with this policy, Borensztein, Cowan,
and Valenzuela (2013) show that sovereign ratings remain an important determinant of the
credit rating assigned to corporations.
Why do rating agencies use sovereign’ rating as a strong upper bound when rating cor-
porate issuers? There are two key factors rating agencies use when rating foreign-currency
corporate issues: the issuer’s inherent likelihood of repayment (which is the same as local
ratings); and the issuer profile after taking into account the risk of exchange controls being
imposed by the government that would hinder the ability of non-sovereign issuers to con-
vert local currency into foreign currency to meet their financial obligations. Thus, firms that
“pierce” the ceiling are particularly strong corporates whose exposure to the risk of not been
able to meet their foreign currency obligations in the case of a sovereign default is clearly
very limited. Firms with foreign assets, high export earnings and foreign parents tend to have
a higher probability of being rated above their corresponding sovereign. In general, rating
agencies only grant an issuer a rating above the sovereign if it is able to demonstrate a strong
resilience and low default dependence with the sovereign, as well as a degree of insulation from
the domestic economic and financial disruptions that are typically associated with sovereign
defaults. Additionally, rating agencies follows an implicit rule that corporations generally
cannot be rated more than two notches above the sovereign.
Even though the sovereign ceiling has typically represented a more important constraint for
firms in developing countries where sovereign’ ratings tend to be lower, the relation between
the credit risk of a sovereign and private sector borrowers has received increased attention
5Fitch and Moody’s followed suit in 1998 and 2001 respectively.
7

following the recent downgrade of the United States, and the European sovereign debt crisis,
where several developed countries including Greece, Italy, Ireland, France, the Netherlands,
Portugal and Spain, experienced sovereign rating downgrades.
2.2 Identification strategy
The main challenge when tracing the effect of sovereign ceiling contractions or relaxations on
corporate outcomes is the inherent endogeneity between a sovereign’s credit quality and the
creditworthiness of firms in that country. We explicitly address this concern in our empirical
strategy by examining the differential effect stemming from sovereign rating changes on firms
that are bound by the sovereign ceiling, relative to other firms in the same country that are
not bound by it. We do this by exploiting two important empirical regularities associated
with the sovereign ceiling.
First, Figure 1 shows that the distribution of corporate ratings across sovereign rating
levels is strongly bound by each country’s sovereign rating. This is the direct implication of
the sovereign ceiling on corporate ratings. The sample includes 3,586 different firms (31,022
observations) with credit ratings from 80 countries for the 1990-2012 period (see data section
below for more details). The figure shows the relation between credit ratings granted to firms
and their government. The figure shows that only a few corporations’ ratings overcome the
sovereign ceiling and only by a limited degree. In our sample of rated firms, 89% of the firms
receive a rating lower than the sovereign, 6% receive the same rating, and just 5% receive a
rating higher than the sovereign. This confirms that even though rating agencies have moved
away from fully enforcing the sovereign ceiling over the last two decades, sovereign ratings
still represent a meaningful upper bound for corporate borrowers in international markets.
Second, as Figure 2 shows, the probability of a corporate issuer obtaining a rating down-
grade in the same magnitude as its sovereign within the month of a sovereign rating downgrade
is also discontinuous exactly at the sovereign rating bound (where a firm’s “distance-from-
sovereign”, the difference between a firm’s rating and its corresponding sovereign, is equal to
8

zero). More precisely, the middle panel in Figure 2 shows that conditional on the event of a
sovereign rating downgrade, firms that are at the bound have a probability of approximately
69% of obtaining the same rating adjustment as the sovereign within a month, compared
to 13%, 10% and 5% for firms that are respectively one, two and three notches below the
sovereign rating. The left and right panels in Figure 2 also show that this disparity in the
response of corporate of ratings is not observed either the month before or the month after
the sovereign change.
As a result, the key identifying assumption in our empirical strategy is that sovereign rating
changes do not provide additional firm-specific information, and thus the differential effect
on corporate outcomes between bound and non-bound firms in the event of a contraction
of the sovereign ceiling should be stemming from an increased probability of obtaining a
corporate rating change in the same direction as the sovereign for those firms that are exactly
at the ceiling bound. The identification strategy requires that there is enough variation in
credit rating across firms. In particular, there must exist a significant group of firms that
have a spike (or discontinuity) in their credit rating right after the sovereign downgrade.
In our framework, the real effects of credit ratings (due to the exogenous variation created
by sovereign downgrades and ceilings) are not confounded with common macro effects. The
macroeconomic effects associated with sovereign rating downgrade should affect firms equally.
If there were any macro differential effects, better quality firms (our treatment group) should
be less affected than lower quality firms (our control group).
2.3 Matching approach
We test whether firms that are downgraded as consequence of a sovereign downgrade and
ceiling change investment and financial decisions in a significant way, as a consequence of an
increase in their cost of capital. If credit ratings were randomly assigned across firms, then it
would suffice to compare the outcomes of bound firms (i.e., with pre-downgrade credit rating
equal or above the sovereign rating) with those of non-bound firms (i.e., with pre-downgrade
9

credit rating below the sovereign rating) around the time of the sovereign downgrade. Our
analysis, however, needs to account for the fact that we are relying on non-experimental data.
One way to tackle this issue is to estimate differences between plausibly counterfactual out-
comes and those that are observed in the data. A standard method is to use a parametric
regression where the outcome difference for the group of interest versus other observations is
estimated by the coefficient on the group dummy. The regression model is specified according
a linear representation of the outcome variable and controls may be added to the specifica-
tion to capture additional sources of firm heterogeneity. Estimation of group differences can
be improved by allowing for nonlinear and nonparametric methods when the groups being
compared have very different characteristics and control variables have poor distributional
overlap (Heckman, Ichimura, Smith, and Todd (1998), Roberts and Whited (2010)).
The strategy that we apply in our main tests is nonparametric. We conduct our anal-
ysis combining a natural experiment with the use of matching estimators. The idea of this
estimator is to first isolate treated observations (in our application, bound firms) and then,
from the population of non-treated (non-bound firms) observations, find observations that
best match the treated ones in multiple dimensions (covariates). In this framework, the set
of counterfactuals are restricted to the matched controls. In other words, it is assumed that
in the absence of the treatment (in our application, sovereign downgrades), the treatment
group would behave similarly to the control group. The matches are made so that treated
and control observations have distributions for the covariates that are as similar as possible to
each other, in the pre-treatment period. Inferences about the treatment of interest are based
on differences in the post-treatment outcomes between the treatment and control groups.
We employ the Abadie and Imbens (2011) estimator, as implemented by Abadie, Drukker,
Herr, and Imbens (2004). The Abadie-Imbens matching estimator minimizes the distance (the
Mahalanobis distance) between a vector of observed covariates across treated and non-treated
firms, finding control firms based on matches for which the distance between vectors is the
smallest. The estimator allows control firms to serve as matches more than once, which
compared to matching without replacement, lowers the estimation bias but can increase the
10

variance. In our estimations we select one matched control observation for each treated
observation. The Abadie-Imbens estimator produces exact matches on categorical variables.
Naturally, the matches on continuous variables will not be exact (though they should be
close). The procedure recognizes this difficulty and applies a bias-correction component to
the estimates of interest.
Among the list of categorical variables that we include in our estimations are year, country,
industry, and whether a firm has a credit rating. Our non-categorical variables include firms’
size, investment, Tobin’s Q, cash flow, cash, leverage, and foreign sales. The estimation
implicitly account for all possible interactions between the included covariates.
We estimate the average effect of the treatment on the treated (ATT). We model the
outcomes in our experiments in differenced form by performing difference-in-differences es-
timations. Specifically, rather than comparing the levels of investment, leverage and cash
(outcome variables) of the treatment and control groups, we compare the changes in the out-
come variables between the groups around the sovereign downgrade. We do so because the
outcome levels of the treated and controls could be different prior to the event defining the
experiment, and continue to be different after that event, in which case our inferences could
be potentially biased by these uncontrolled firm-specific differences.
2.4 Sample and variable construction
Our sample of firms is taken from the WRDS-Factset Fundamentals Annual Fiscal (North
America and International) database and contains firms from 80 countries for the 1990-2012
period. We exclude financial firms (SIC codes 6000-6999) because these firms tend to have
significantly different investment and financial policies due to regulation. We drop any ob-
servation with negative total assets. We obtain firm accounting and market variables from
Factset and sovereign and corporate credit ratings from Bloomberg. We match firms in Fact-
set to Bloomberg using ISIN, SEDOL, CUSIP or company name. The sample includes 546,957
firm-year observations and 54,893 different firms. Only a small fraction of these firms have a
11

credit rating (31,022 firm-year observations and 3,586 different firms).
In our experiments, the outcome variables are the annual change in firm investment, debt
and cash around a sovereign downgrade. Investment is defined as the ratio of annual capital
expenditures (Factset item FF CAPEX FIX) to the lag of net property, plant and equipment
(Factset item FF PPE NET). Long-Term Leverage is defined as the ratio of long-term debt
(Factset item FF DEBT LT) to total assets (Factset item FF ASSETS). Total Leverage is
defined as the ratio of total debt (Factset item FF DEBT) to total assets. Cash is defined as
the ratio of cash and short-term investments (Factset item FF CASH ST) to total assets.
The treatment group includes bound firms (those with a credit rating equal or above the
sovereign credit rating of the country where the firm is domiciled in the year prior to the
sovereign downgrade). Table 1 reports the number of treated firm-year observations by coun-
try and year. There are 66 observations in the treatment group in 12 different countries, which
have been downgraded a total of 22 times during the sample period. Of course, there have
been many more sovereign downgrades during our sample period but we just rely on those
for which we identify bound firms in the downgraded country. The list of countries includes
both developed markets (Ireland, Italy, Japan, Portugal, Spain and the United States) and
emerging markets (Argentina, Brazil, Indonesia, Mexico, Philippines and Thailand). There
are countries with multiples downgrades over the sample period such as Italy with four down-
grades, Argentina and Japan with three downgrades, and Indonesia, Portugal, Thailand with
two downgrades. The median sovereign rating downgrade is one-notch and the average is
two-notches. Finally, there are 11 downgrades during the post-2007 period corresponding to
the global financial crisis and euro-zone sovereign debt crises, but there are also a sizable
number of downgrades in earlier periods.
As discussed before, we match firms based on several covariates: size, investment, Tobin’s
Q, cash flow, cash, total leverage and foreign sales. Size is defined as the log of total as-
sets. Tobin’s Q is defined as the ratio of total assets plus market capitalization (Factset item
FF MKT VAL) minus common equity (Factset item FF COM EQ) to total assets. Cash flow
is defined as the ratio of annual operating income (Factset item FF OPER INC) plus depre-
12

ciation and amortization (Factset item FF DEP AMORT EXP) to the lag of net property,
plant and equipment. Foreign sales is the ratio of foreign sales to total sales (Factset item
FF FOR SALES PCT). Investment, Leverage and Cash are defined as before. The matching
estimator uses the pre-treatment (year prior to the sovereign downgrade) value of the covari-
ates. In some tests, we also use return on assets (ROA), defined as the ratio of operating
income (Facset item FF OPER INC) to total assets. To minimize the impact of outliers on
these comparisons, we winsorize variables at the top and bottom 1% level.
In addition, we match firms on year and firms’ country of domicile and industry (two-digit
SIC codes). So we impose that the control firm should match exactly the country and year
of the treated firm such that we are effectively comparing outcomes within firms in the same
country and year. We also impose that control firms should have a credit rating as treated
firms are necessarily rated. Although we include the industry as a covariate in the matching,
we do not impose an exact match because in smaller countries would be difficult to find an
exact match. We are able to find an exact match by industry in about 50% of the cases. The
results are robust when we use alternative matching methods that impose an exact match by
industry but aggregate countries into geographic regions to find a matched control firm.6
2.5 Summary statistics
Table 2 compares summary statistics of the covariates between the 66 treated firm-years and
the remaining 24,851 non-treated firm-years (i.e., firms that are not assigned to the treatment
group) in treated years (i.e., years with sovereign downgrades). Since we require an exact
match of country and year (and existence of a credit rating), we restrict the group of non-
treated to countries that have least a treated firm over the sample period. The treated firms
are bigger and have higher investment, Tobin’s Q, cash flow and leverage than non-treated
firms. These differences are expected given that we are relying on observational data rather
than running a true experiment. The goal of the matching estimator techniques is to control
for these distributional differences, which could affect both the selection into the treatment
6We drop treated firms for which we were unable to find a match within the same country (15 cases).
13

and the post-treatment outcomes.
Table 2 also shows summary statistics of the covariates for the matched control firms. The
Abadie-Imbens matching estimator identifies a match for each firm in the treatment group. We
have 66 firm-year observations in both groups, but since matching is done with replacement,
we have only 44 unique firms in the control group.7 The Pearson chi-square statistic tests
for differences in the medians of the variables of interest between the treatment and control
groups. After the matching procedure, there are no statistically significant differences in the
pre-downgrade median values of the covariates across treatment and control groups, with the
exception of Q and cash flow. The median Q and cash flow is higher for firms in the treatment
versus the control group. This difference cannot explain our findings since we expect firms
with higher Q or cash flow to be less affected, rather than more affected by the sovereign
downgrade.
Table 2 also compares the entire distributions of the various matching covariates (pre-
downgrade) across the three groups of firms. The Kolmogorov-Smirnov test of distributional
differences in the variables of interest between the treatment and control groups. These
statistics support the assertion that the matching estimator moves our experiment closer to
a test in which treatment and control groups differ only with respect to their post-treatment
outcomes (investment, leverage, and cash). Treated firms differ significantly from non-treated
firms. These differences disappear when we compare the treated firms to the group of matched
control firms, with the exception of Q and cash flow. Similarly to the median tests, treated
firms have higher Q and cash flow than control firm.
3 Effect on corporate ratings
In this section we study the link between corporate ratings and sovereign rating downgrades.
7We implement the matching with replacement to allow for the best possible match for each treatedobservation.
14
3.1 Do sovereign rating ceilings lead to pessimistic ratings?
We test whether firms that are bounded by the sovereign ceiling (i.e., that their rating is equal
or above to the sovereign rating) have a more “pessimistic” rating relative to firms that are
not bounded by it. If the sovereign ceiling represents a meaningful friction and not just an
unbiased and accurate assessment of a firm’s creditworthiness, then this rating practice should
be systematically associated with ratings that are more pessimistic for bound firms relative to
other firms with the same actual ratings but that are not bound by the sovereign ceiling. Thus,
we examine whether the sovereign ceiling policy is consistent with rating agencies providing
an unbiased assessment on the creditworthiness of borrowers by comparing the differential
effect of being bound on a firm’s predicted rating.
We explore whether bound firms tend to be pessimistically rated using a two-step pro-
cedure. First, we use as a benchmark annual financial data on rated firms that issue USD-
denominated debt in AAA countries (where this friction does not matter) to predict the
corporate ratings of firms in non-AAA countries, where the sovereign ceiling rule potentially
matters.8 Using this sample of firms in countries with a AAA sovereign rating we estimate
a regression using a set of explanatory variables used in previous studies predicting credit
ratings (see Kisgen (2006) for a similar implementation). The dependent variable is a firm’s
credit rating converted into twenty-two numerical values, with 22 corresponding to the highest
rating (AAA) and one to the lowest (default). We estimate the following firm credit rating
regression:
Ratingi,t = β1ROAi,t + β2Leveragei,t + β3 Si zei,t (1)
+β4ROA2i,t + β5Leverage
2i,t + β Si ze2i,t + αt + αd + εi,t
where Ratingi,t is the credit rating (numerical value) for firm i in year t. The regression
8We do not include data for U.S. firms, as the ratings for USD-denominated debt are in that case local-currency, and not foreign-currency as they are elsewhere in our data.
15

includes year fixed effects to control for time specific shocks common to all firms (αt) and
industry fixed effects (αd). We estimate the model above for firms in AAA countries and then
we use the estimated coefficients to calculate the predicted credit ratings for the sample of
firms in non-AAA countries (which we denote as Rating), where the sovereign rating ceiling
potentially represent a meaningful institutional friction.9
In the second step, we compare, for each actual corporate rating level, whether predicted
rating are systematically higher for firms that are bounded relative to other firms with the
same actual rating but that are not bounded by the sovereign ceiling. We estimate the
following regression:
Ratingi,t = β1(RatingDum)i,t + β2(RatingDum)i,t × (Bound)i,t
+β3(SovRatingDum)i,t + αt + εi,t (2)
where RatingDum is a set of corporate rating dummies for each rating level, Bound is a
dummy variable that takes a value of one for bound firms and zero otherwise, and SovRatingDum
is a set of sovereign rating dummies to control for differences in corporate ratings that vary
dependent on the overall level of creditworthiness of a sovereign. We include year fixed effects
(αt) to account for variations in corporate ratings through the business cycle. β2 is a vector
of coefficients that captures the differential effect, for each corporate rating level, of being
bounded by the sovereign ceiling on a firm’s predicted rating. If firms that are bound are
rated fairly relative to firms that are not at the ceiling bound, then predicted ratings should
not systematically differ based on whether firms are below or at the sovereign bound. On
the other hand, if firms that are bound tend to be pessimistically rated, then their predicted
rating should be higher relative to other firms with the same actual corporate rating but that
are not bound by the sovereign rating).
9Estimating the model in equation (1) for the sample of firms in AAA countries results in an adjusted R2
of 0.51. Table A.1 in the appendix shows the estimated coefficients obtained from this regression.
16

Table 3 shows the estimates of the comparison of predicted ratings for bound versus non-
bound firms in equation (2). We find that bound firms tend to have a predicted rating that is
above the predicted rating of a non-bound firm with the same rating. For example, a bounded
firm with a B+ rating has a predicted rating that is 1.1 notches higher than a firm that is
also rated B+ but that is not bounded by the sovereign ceiling. The difference between the
predicted ratings of bound vs. below bound firms is positive and statistically significant in
12 of the 14 actual rating levels evaluated. The only exceptions are two of the highest rating
levels (AA- and AA) where the sovereign ceiling rule represents a less meaningful restriction.
An alternative test to evaluate whether a firm’s “bound status” leads to a systematically
pessimistic rating is to examine whether bound firms are associated with a lower default rate
than non-bound firms, for the same actual rating. We examine if a firm’s bound status affects
its probability of being close to default, after controlling for its credit rating by estimating a
logit model where the dependent variable is a dummy variable that indicates whether a firm
had been “close to default” during the last five years. Table A.2 in the Internet Appendix
show the results from estimating the logit model, which indicate that bound firms tend to
have a lower probability of transitioning into default, for a given rating, than non-bound firms.
3.2 Corporate ratings
We examine whether the effect of sovereign rating downgrades on corporate ratings differ be-
tween bound firms (treatment group) and non-bound (control group). We expect that treated
firms are more affected than otherwise similar firms at the time of a sovereign downgrade. In
contrast, spillovers or common macro shocks associated with the sovereign rating downgrade
should equally affect treated and control firms or, if anything, they should affect more the
control group than the treatment group.
Table 4 presents the results of difference-in-differences matching estimator for corporate
credit ratings. To perform this test we map the credit ratings into twenty-two numerical values
as before. The table shows the firm’s rating value in the year before the sovereign downgrade
17
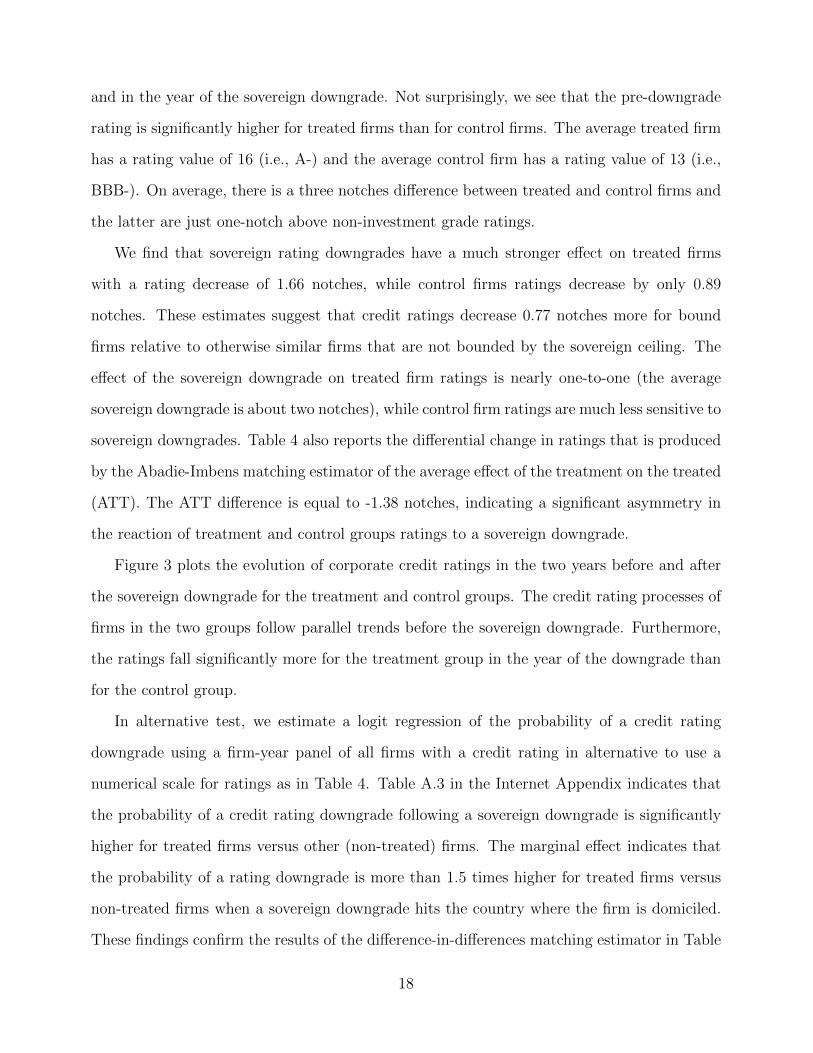
and in the year of the sovereign downgrade. Not surprisingly, we see that the pre-downgrade
rating is significantly higher for treated firms than for control firms. The average treated firm
has a rating value of 16 (i.e., A-) and the average control firm has a rating value of 13 (i.e.,
BBB-). On average, there is a three notches difference between treated and control firms and
the latter are just one-notch above non-investment grade ratings.
We find that sovereign rating downgrades have a much stronger effect on treated firms
with a rating decrease of 1.66 notches, while control firms ratings decrease by only 0.89
notches. These estimates suggest that credit ratings decrease 0.77 notches more for bound
firms relative to otherwise similar firms that are not bounded by the sovereign ceiling. The
effect of the sovereign downgrade on treated firm ratings is nearly one-to-one (the average
sovereign downgrade is about two notches), while control firm ratings are much less sensitive to
sovereign downgrades. Table 4 also reports the differential change in ratings that is produced
by the Abadie-Imbens matching estimator of the average effect of the treatment on the treated
(ATT). The ATT difference is equal to -1.38 notches, indicating a significant asymmetry in
the reaction of treatment and control groups ratings to a sovereign downgrade.
Figure 3 plots the evolution of corporate credit ratings in the two years before and after
the sovereign downgrade for the treatment and control groups. The credit rating processes of
firms in the two groups follow parallel trends before the sovereign downgrade. Furthermore,
the ratings fall significantly more for the treatment group in the year of the downgrade than
for the control group.
In alternative test, we estimate a logit regression of the probability of a credit rating
downgrade using a firm-year panel of all firms with a credit rating in alternative to use a
numerical scale for ratings as in Table 4. Table A.3 in the Internet Appendix indicates that
the probability of a credit rating downgrade following a sovereign downgrade is significantly
higher for treated firms versus other (non-treated) firms. The marginal effect indicates that
the probability of a rating downgrade is more than 1.5 times higher for treated firms versus
non-treated firms when a sovereign downgrade hits the country where the firm is domiciled.
These findings confirm the results of the difference-in-differences matching estimator in Table
18

4.
4 Effect on investment and financial policy
In this section, we provide empirical evidence on the effect of credit rating downgrades on
firm investment and financial policy.
4.1 Investment
We examine the investment behavior of the treated and matched control firms around sovereign
downgrades. Table 5 presents the results of difference-in-differences matching estimator for in-
vestment as measured by annual capital expenditures as a percentage of capital (Investment).
The table shows the investment rates in the year before the sovereign downgrade and in the
year of the sovereign downgrade. Firms in the treatment groups are compared with closer
counterfactuals (matched controls). Not surprisingly, we see that the pre-downgrade invest-
ment levels of treatment and control firms are economically similar and statistically indistin-
guishable.
We find that the investment rates of the treated and control firms become significantly
different after a sovereign downgrade. For firms in the treatment group, the average invest-
ment drops to 18.53% of capital, a fall of 10.20 percentage points. In contrast, for control
firms, the investment falls only slightly to 19.22% of capital, a fall of 2.84 percentage points.
These estimates suggest that investment decreases by 7.35 percentage points more for firms
with pre-downgrade rating equal (or above) the sovereign rating, relative to otherwise similar
firms with rating below the sovereign rating. Table 5 also reports the differential change in
investment that is produced by the Abadie-Imbens matching estimator of the ATT. The ATT
difference is equal to -16.78 percentage points. It indicates that investment for the treated
firms following a sovereign downgrade fell by about half of its pre-downgrade investment
levels.
More generally, the estimates in Table 5 imply that credit rating downgrades lead to lower
19

investment. Given the similarity between firms in the treatment and control groups, the
evidence supports a causal effect of credit ratings on investment. Notice that treated firms
are of higher quality than control firms and therefore we expect them, if anything, to be
less affected by the sovereign downgrade. Contrary to this intuition, we find that treated
firms cut investment significantly more than control firms following a sovereign downgrade,
which cannot be explained by any firm-specific differences between the two groups. Thus, our
findings provide casual evidence that credit ratings matter and affect investment policy in an
important way.
A concern about inferences from the treatment-effects framework is whether the processes
generating the treatment and control group outcomes followed parallel trends prior to the
treatment. Differences in the post-treatment period can only be attributed to the treatment
when this assumption holds. The outcome variable of our study is the within-firm change in
investment. The best way to address this concern is to look at the evolution of the outcome
variable (changes in investment rates) in the years leading to the treatment separately for the
treatment and control groups.
Figure 4 plots the evolution of investment rates in the two years before and after the
sovereign downgrade. It is hard to argue that the investment processes of firms in the two
groups follow different trends before the downgrade. Furthermore, we can see that investment
falls dramatically for the treatment group in the year of the downgrade and only slightly for
the control group. In the two years following the downgrade, the investment processes again
follow similar dynamics. Thus, we identify an unique effect on investment at the time of the
sovereign downgrade.
4.2 Placebo test: Effect of recessions and sovereign upgrades on
investment
Another potential concern regarding our difference-in-differences approach is whether macro
factors other than sovereign downgrades affecting both treatment and control firms can ex-
20

plain the differential behavior in the post-treatment period (irrespective of any effects arising
from sovereign downgrades). This concern is valid when there are reasons to believe that
there are important, latent differences between treatment and control firms and that these
differences trigger sharp contrasts in the post-treatment period because of other changes in
the environment. An appealing feature of our identification strategy is that it is difficult to
find a story in which higher quality firms are more affected than lower quality firms.
In order to strengthen the interpretation of the results, we replicate exactly the same
experiment that we run for sovereign downgrades but using a placebo period. That is, we
use corporate and sovereign credit ratings information to sort firms into treatment and non-
treated groups and covariates to produce a matched control group of firms. We then compare
treated versus control firms investment behavior during periods without sovereign downgrades.
We consider two experiments: (1) recession periods without downgrades; and (2) sovereign
upgrades. These falsification tests can help to rule out alternative explanations for the results
reported in Table 7. For example, there could be unobservable firm characteristics that predict
both a higher credit rating and a drop in investment (characteristics that are not captured
by the matching estimator procedure).
Panel A of Table 6 presents the results of the placebo test using recession periods without
downgrades. This placebo addresses the concern that some macroeconomic shocks (e.g., a
demand shock) not associated with sovereign downgrades affects differently the treatment
and countrol groups. If this is the case, we should find differential investment effects be-
tween treatment and control groups during periods of recessions that are not accompanied by
sovereign downgrades. We identify recession periods using the OECD recession indicators for
each country drawn from the Federal Reserve Economic Data (FRED) database. The reces-
sion indicator is available for 38 countries with monthly frequency and we adopt the “From
the Period following the Peak through the Trough” definition. We aggregate the monthly
series into an annual series and classify a country as being in a recession in a given year if it
has more than six months of recession. For each country, we exclude recessions years in which
the country is downgraded.
21

We have 48 treated and control firms in this placebo test. Treated and control firms have
virtually identical investment dynamics before recessions. Treated firms display an investment
rate of 22.89% of capital in the year before the recession, while their control counterparts
investment rate is 19.37%. More important, there is no difference in investment behavior
between the two groups of firms in the post-treatment period. Both groups invest about
20% in the first recession year without sovereign downgrade and the difference-in-differences
estimator is -1.86 percentage points and statistically insignificant. The ATT effect in this
case is -0.74 percentage points, and is statistically insignificant. Simply put, our treatment-
control differences do not appear in recession periods that are not accompanied by sovereign
downgrades. Panel A of Figure 5 plots the evolution of investment rates in the two years
before and after recessions. As expected, investment rates for treated firms are higher than
those for control firms, but the investment processes follow similar dynamics around recessions
that are not accompanied by sovereign downgrades.
Panel B of Table 6 presents the results of the second placebo test. Sovereign ceiling
policies should not matter as much in the case of sovereign upgrades. Firms with rating at
the sovereign bound are not necessarily upgraded following a sovereign upgrade. Additionally,
the market reaction to upgrades is typically insignificant (e.g. Brooks et al., 2004; Gande and
Parsley, 2005; Ferreira and Gama, 2007). We identify years of sovereign upgrades and then
construct the treatment and control groups in a similar way to that in Table 5. We find no
difference in the investment behavior of the two groups following a sovereign upgrade. For
firms in the treatment group, the average investment increases by 0.83 percentage points of
capital, while for control firms the investment rate increases by 1.68 percentage points. These
estimates suggest that the investment rate increases by 0.85 percentage points less for treated
firms relative to control firms. This difference is economically and statistically insignificant.
The ATT gives consistent results with a statistically insignificant estimate of -0.57 percentage
points. Panel B of Figure 5 plots the evolution of investment rates in the two years before
and after sovereign upgrades. As expected, investment rates for treated firms are higher than
those for control firms, but the investment processes follow similar dynamics around sovereign
22

upgrades.
4.3 Financial policy
We also examine whether credit ratings affect differently the financial policy of the treated and
matched control firms around sovereign downgrades. We expect treated firms to deleverage
as they may face an increase in the cost of capital, while control firms are not affected.
Table 7 presents the results of difference-in-differences matching estimator for the long-term
debt-to-assets ratio (Long − Term Leverage) in Panel A and the total debt-to-assets ratio
(Total Leverage) in Panel B. Firms cannot adjust leverage immediately following a sovereign
downgrade so we examine the change in leverage in the subsequent year versus the year of
the downgrade.
We find that the capital structures of the treated and control firms become significantly
different after a sovereign downgrade. For firms in the treatment group, the average long-term
leverage drops to 23.68% of assets, a fall of 1.65 percentage points. In contrast, for control
firms, the long-term leverage increases to 26.68% of capital, an increase of 1.22 percentage
points. These estimates suggest that long-term leverage decreases by 2.87 percentage points
more for firms with a pre-downgrade rating equal (or above) to the sovereign rating relative
to otherwise similar firms with rating below the sovereign rating. The table also reports the
differential change in investment that is produced by the Abadie-Imbens matching estimator
of the ATT, which is equal to -3.78 percentage points. The effect is statistically significant.
Panel B of Table 7 presents the difference-in-differences matching estimator for total lever-
age. Interestingly, the differential effect between treated and control firms is smaller than the
one observed for long-term leverage. The ATT difference is equal to -2.74 percentage points.
This result suggests that treated firms substitute short-term debt to long-term debt following
a sovereign downgrade.
Finally, we analyze the effect of sovereign downgrades on the ratio of cash holdings-to-
assets ratio (Cash). In contrast to leverage, which reacts slowly to the downgrade, treated
23

firms immediately react decreasing cash in the year of the sovereign downgrade relative to
the previous year. Moreover, there is a differential reaction between treated and control firms
with a statistically significant ATT estimate of -2.14 percentage points.
Figure 6 plots the evolution of long-term and total leverage in the two years before and
after the sovereign downgrade for treatment and control firms. The leverage processes of
firms in the two groups follow similar trends before the downgrade. Furthermore, long-term
leverage falls for the treatment group in the year of the downgrade and actually increases for
the control group. Figure 8 also shows the evolution of cash in the two years before and after
the sovereign downgrade for treatment and control firms. Cash after the decrease in the year
of the sovereign downgrade, which is consistent with firms using internal cash to attenuate
the effect on investment, seems to increase in the following years. This behavior is consistent
with firms building up cash reserves for precautionary motives.
Overall, the evidence suggests that credit rating downgrades generate an increase in the
cost of capital, which leads to lower investment rates, less use of debt, and lower cash holdings
among affected firms. Given the similarity between firms in the treatment and control groups,
the evidence supports a causal effect of credit ratings on firm investment and financial policy.
4.4 Linear regression model
While the nonparametric matching approach is well-suited for our test strategy, it is useful
to show that our results also hold when we use a linear regression model. We first implement
reduced form regressions to examine whether firms’ investment rate decrease for those firms
that are bound by the sovereign ceiling following a contraction in the ceiling. The dependent
variable is the annual changes in the investment rate (∆Investment) in year t. The main
explanatory variables are a dummy variable that takes the value of one if a firm has a rating
equal to (or above) the sovereign rating in a year t − 1 (Bound), a dummy variable that
takes the value of one if a firm’s country rating is downgraded in year t (SovDown), and the
interaction term Bound × SovDown. The interaction term coefficient captures the difference
24

in the reaction of investment between firms with rating equal (or above) to the sovereign
rating (treated) versus other (non-treated) firms following a sovereign downgrade. We run a
pooled OLS regression using the sample of all firms in the 1990-2012 period.
Column (1) of Table 8 shows that treated firms cut their investment by 9.6 percent-
age points more than other firms as indicated by the interaction term coefficient Bound ×
SovDown. The group difference estimate is significant at the 5% level. Outside the sovereign
downgrade periods the difference between the two groups of firms is only 3 percentage points.
Interestingly, the SovDown coefficient is positive, indicating that firms with rating below the
sovereign increase investment but only slightly following a sovereign downgrade.
In column (2), we estimate the investment rate change regressions including the covariates
used in Table 5 (size, investment, Tobin’s Q, cash flow, cash holdings, leverage and foreign
sales). While these controls predict changes in investment in their own right, their inclusion
does not materially alter the coefficient on the interaction term. The estimated group-mean
difference increases slightly to 11.4 percentage points (significant at the 1% level) after we add
the controls. Columns (3)-(5) present additional estimates using combinations of year, indus-
try, country, and firm fixed effects. Column (6) presents estimates using firm and country-year
fixed effects so the effects are driven only by within-firm and within country-year variation.
The magnitude of the group difference estimates are similar at about 11 percentage points
and significant in all specifications. Furthermore, the difference between the two groups of
firms outside the sovereign downgrade period becomes statistically insignificant when we in-
clude country or firm fixed effects. The effect of the sovereign downgrade on investment also
becomes insignificant. Overall, the linear model regression estimates are fully consistent with
those reported under the matching estimator approach.
Next we estimate the effect of credit ratings on investment using instrumental variables
methods. The sample includes all rated firms in the 1990-2012 period. Table 9 presents
the results. Column (1) shows the estimates of an OLS regression of the annual changes
in investment rate on annual changes in firm’s credit ratings (using a numerical scale with
upgrades having a positive sign and downgrades having a negative sign). The regression also
25

includes control variables as well as year and firm fixed effects. We find that the credit rating
changes (∆Ratings) coefficient is positive and significant, which indicates that upgrades are
associated with increases in investment, while downgrades are associated with decreases in
investment. Of course, this coefficient is biased as rating changes are in general correlated
with changes in firm’s fundamentals. To correct for the endogeneity of rating changes, we use
an instrumental variables estimation method.
In the first stage, we run a regression of ∆Ratings on the instruments: Bound, SovDown,
and Bound × SovDown. The first stage regression estimates in column (2) show that the
interaction term coefficient is negative and significant. The interpretation is that treated firms
ratings decrease significantly more (nearly two notches more) than other firms ratings at the
time of a sovereign downgrade. This result using a linear model of ratings is consistent with
our evidence based on the matching estimator in Table 4.
In the second stage regression, the dependent variable is the annual change in investment
rate and the main explanatory variable is the predicted ∆Ratings estimated in the first stage.
In column (2) we find that the ∆Ratings coefficient is positive and significant. The point
estimate indicates that treated firms cut investment by 4.3 percentage point more than other
firms. Columns (3)-(6) show estimates of similar regressions including control variables, and
combinations of year, industry, country, and firm fixed effects. Column (7) presents estimates
using country-year fixed effects so the effects are driven only by within country-year variation.
The differential effect of sovereign downgrades on treated versus other firms is similar in all
specifications.
5 Effect on corporate yields
So far the evidence indicates that bound firms tend to be more unfavorably rated by rating
agencies and their ratings are more affected by sovereign downgrades. Thus, a natural question
is whether investors in the corporate bond market “follow the ratings”, or do they see past
them and recognize bound firms’ relatively higher credit quality. More precisely, it is possible
26

that contractions in the sovereign ceiling result in even a more pronounced increase in the
bond yields of firms bound by the sovereign rating. This increase in bonds yield, which proxy
for the cost of debt, can explain the documented impact in firms’ investment and financial
policy.
We collect data on long-term foreign-currency sovereign and bond (issue) ratings for USD-
denominated bonds, as well as its end of the month yield to maturity from Bloomberg. We also
collect issue specific information (issuance and maturity dates, amount issued, coupon pay-
ment and frequency and collateral type). Since bond pricing data is available from Bloomberg
starting in 1999, we construct the sample of sovereign ratings, corporate ratings and corporate
bond yields from 1999 to 2012.10
The fact that we use USD denominated bonds implies that spreads above US treasury
yields represent default risk, rather than currency risk ((?); (?)). Thus, we calculate corporate
yield spreads by subtracting the equivalent maturity US Treasury yield for each issue.11 We
eliminate a small number of observations with negative spreads, we require that yields for
consecutive months are not equal, and I winsorize at the 1% level to reduce the influence of
outliers. Since my empirical strategy exploits sovereign rating changes for identification, we
exclude from my sample countries and firms where sovereign ratings were unchanged between
1999 and 2012.
Table A.4 in the Internet Appendix, Panel A shows the number of bonds (CUSIPs), firms
and countries each year in the sample. Panel B displays the composition of firms by industry,
using the Dow Jones’s Industry Classification Benchmark (ICB). The final matched sample
consists of rating history data for 51 countries, 566 firms and 1,935 distinct issues. Table
A.5 in the Internet Appendix provides corporate yield spreads summary statistics by rating
category, and shows that conditional on a firm’s corporate rating, yield spreads tend to be
on average 90 bp lower if the firm is bound by the sovereign ceiling. The table also shows
10The bond yield tests use issue ratings rather than issuer ratings as the analysis is performed at the bondlevel.
11I obtain constant maturity U.S. treasury rates data from the Federal Reserve Economic Data (FRED)website: http://research.stlouisfed.org/fred2/
27

that this difference is generally more pronounced for lower ratings (e.g. the bound vs. below
bound difference is -1.7% for B+ firms) and less important for higher ratings (e.g. for A+
firms the difference is +0.2%, although it is statistically no different to zero). Table A.6 in the
Internet Appendix summarizes the coverage of the data as well as the number of sovereign
rating changes by country.
We first implement reduced form regressions to examine whether bonds yield increase for
those firms that are bound by the ceiling following a contraction in the sovereign ceiling. We
examine the change in bond spreads around sovereign rating downgrades for treated firms
relative to non-treated firms. That is, we use a firm’s bound status as an instrument to
estimate the effect of a contraction in the sovereign ceiling on corporate spreads. We estimate
a reduced form pooled regression where the dependent variable is the change in spread around
sovereign rating changes, i.e., the spread on a firm’s i bond j measured t months after each
sovereign event minus its spread s months prior to the event (∆Spreadi,j,t−s). The main
explanatory variables are a dummy variable that takes the value of one if a firm has a rating
equal to (or above) the sovereign rating in a month t − 1 (Bound), a dummy variable that
takes the value of one if a firm’s country rating is downgraded in month t (SovDown), and
the interaction term Bound × SovDown. The interaction term captures the differential effect
on bond yield of bound firms relative to firms that are near but not bound by the sovereign
ceiling.
We face a trade-off between using as controls firms that are not bound by the sovereign
rating but that are not too far away from it, and having enough firms as controls. Thus, we
constrain non-bound firms to be three rating notches or less below the sovereign. We also
limit my analysis to firms that have a rating of B- or higher.12 Because rating changes can
be anticipated, we perform event studies with different values of t around the time of the
sovereign rating announcements to capture the response of financial markets. Since firms can
have two or more bonds at any given point, we weight observations based on the number of
bonds observed for each firm at each point in time, and we cluster standard errors by each
12Only 0.1% of the observations in the sample have a corporate rating in the CCC, CC or D categories.
28

country event (sovereign downgrade).
Figure 7 shows the evolution of corporate spreads around sovereign rating changes. Panel
A of Table 10 in reports the results for event windows starting three months prior to a
sovereign rating change. When looking at the spread one month after the event, the average
spread for firms that are bound by the sovereign ceiling increases by 103 bp more than for
non-bounded firms. As the event windows widens to three months after a sovereign downgrade
the differential effect increases to 117 bp.
We extend the specification to include country-event specific fixed effects (i.e., fixed effects
for each sovereign rating downgrade for each country). Including country-event fixed effects
equates to estimating the differential impact of the sovereign ceiling on the bond yield of
firms that are bound by the sovereign ceiling, relative to firms in the same country that
are not bound by the constraint. However, this approach reduces considerably the sample
size. Panel A of Table 10 also shows these estimates. Although including country-event fixed
effects dampens the overall magnitudes compared to the pooled OLS, the coefficients for the
interaction term remain statistically and economically significant. For example, the spread for
firms that are bounded by the sovereign ceiling increases by 54 bp more than for non-bounded
firms using the spread one month after the event.
Next we use a fuzzy regression discontinuity design (RDD) to instrument corporate rat-
ing changes directly related to the sovereign ceiling, using as an instrument the interaction
between a firm’s bound status with the sovereign rating downgrade. More precisely, we imple-
ment a fuzzy RDD where the effect evaluated is the impact on a firm’s yield spread resulting
from a corporate credit rating change directly related to a sovereign downgrade or upgrade.
As it has been noted, rating agencies do not strictly follow the sovereign ceiling policy and
thus a sovereign rating change does not lead with a 100% probability to the same rating
change for bounded firms. Thus, the jump in the relationship between ∆Spread and Bound
can only be interpreted as the average treatment effect of a corporate rating change stemming
from the sovereign ceiling channel if Bound does not affect ∆Spread outside of its influence
through treatment receipt.
29

The fuzzy RD design is described by the following equations:
∆ CorpDowni,j = γ1(∆SovDown)i,j × (Bound)i,j + αi (3)
∆Spreadi,j,t−s = β1(∆ CorpDown)i,j + αi + εi,j (4)
where αi is a country-event specific fixed effect. The first equation corresponds to the first
stage where the change in corporate ratings are estimated after a sovereign downgrade. These
are then used in the second stage regression. Panel B of Table 10 shows the estimation results
of the RDD setting obtained using 2SLS. The results from this set of regressions are consistent
with previous results from the reduced form regressions, but more precisely identify the effect
of a one-notch corporate rating change directly related to the sovereign ceiling channel. For
example, the effect of a one-notch corporate rating downgrade directly stemming from the
sovereign ceiling channel is 88 bp using a one month post vs. three month pre-event window.
As before, the effect of downgrades remains economically and statistically significant as the
event window widens.
We perform a falsification test to addresses concerns for pre-event trends driving the
differential effects on spreads. We estimate the same model with country-event fixed effects
as in Panel A of Table 10, with the only difference that we focus on the differential effect
of bound versus non-bound firms one year before the actual event. We report the results
of this test in Table A.7 in the Internet Appendix. Consistent with the hypothesis that the
contractions and relaxations in the sovereign ceiling are the main drivers behind the identified
differential changes in corporate spreads, we find that none of the coefficients reported are
statistically significant.
30

6 Robustness
In this section, we perform several robust checks of our primary findings on the effect of
sovereign downgrades on corporate investment. The results of these robustness tests are
shown in the Internet Appendix.
A first robustness consists in excluding firms with ratings above the sovereign from the
treatment group as these firms may be systematically different from firms exactly at the
bound even though including these firms works against finding a drop in investment for the
treatment group. Table A.8 in the Internet Appendix reports the results of the difference-in-
differences estimator of investment using this alternative treatment group. Not suprisingly,
the effect is even stronger than in Table 5. The differential change in investment produced by
the matching estimator of the ATT is -21.07 percentage points and is statistically significant.
A second robustness is related to the matching procedure used to create the control group.
We impose that control firms should be from the same country as treated firms. This creates a
difficulty in finding exact matches in the same industry, especially in smaller countries. In our
main results, we give priority to find an exact match by country as we are examining the effects
of sovereign downgrades (a country-level event). In alternative, we impose that a control firm
should be from the same industry (Fama-French ten industry classification) as the treated firm
but require only that the control firm is located in the same geographic region (Africa, Asia,
Eastern Europe, Japan, Latin America, North America, Northern Europe, Oceania, Southern
Europe, United Kingdom and Western Europe) as the treated firm, rather than in the same
country. We also include the other covariates used in Table 7. Using this alternative matching
specification, we construct a control group that matches exactly the industry of treated firms.
Table A.9 in the Internet Appendix reports the results of the difference-in-differences estimator
using this alternative matching specification. The results are consistent with those in Table
7. The differential change in investment produced by the matching estimator of the ATT is
equal to -7.46 percentage points and is statistically significant.
31

7 Conclusion
We provide causal evidence that credit ratings affect firm investment and financial policy using
sovereign rating downgrades as a natural experiment. Sovereign downgrades create exogenous
and asymmetric variation across corporate credit ratings because of rating agencies’ sovereign
ceiling policy that prevents firms from having ratings above the sovereign rating. We explore
this variation to show that firms with ratings equal to the sovereign ratings (treatment group)
face an increase in cost of debt, and cut investment and leverage more than otherwise similar
firms with rating below the sovereign rating following a sovereign downgrade. One important
feature of our identification strategy is that higher-quality firms are more affected than lower-
quality firms, which rules out several alternative explanations of the results.
Our study makes three contributions to the literature on credit ratings. First, we develop
a new strategy to identify the effects of credit ratings on firms’ cost of capital, investment
and financial policy. Our results show that credit ratings have causal effects on firm policies,
which are not confounded by variation in unobservable firm characteristics or macroeconomic
conditions. Second, we establish that sovereign rating downgrades and ceilings is a channel
through which public debt management has important real consequences for a country’s
economy, in addition to interest rate changes and crowding out effects. Finally, we identify
unintended consequence for real economic activity of sovereign rating ceiling policies that are
typically followed by credit rating agencies.
Our study is subject to the standard limitations associated with quasi-natural experiments.
We can only hope to measure the causal effect of ratings downgrades if we focus on firms
for which rating-ceiling policies are likely to bind following a sovereign downgrade. This
restriction forces us to focus on firms that had credit ratings equal to the sovereign rating
prior to the downgrade. As usual, this restriction limits the sample size. In addition, the
effect of the downgrade on treated firms may not directly translate to an average firm that
has different characteristics from treated firms.
In addition, our results cannot establish whether the investment cuts that follow ratings
32

downgrades are good or bad for the treated firms. Because of this, it may be interesting
to explore the consequences of ratings downgrades for firm performance. One can examine
the relative change in future profitability for treated and control firms (subject to the usual
caveats with long-term event studies). It may also be possible to conduct a short-term event
study around the dates of sovereign downgrades, provided that the actual downgrade is not
fully anticipated by investors.
33

References
Abadie, Alberto, David Drukker, Jane Leber Herr, and Guido W. Imbens, 2004, Implementing
matching estimators for average treatment effects in stata, Stata Journal 4, 290–311.
Abadie, Alberto, and Guido W. Imbens, 2011, Bias-corrected matching estimators for average
treatment effects, Journal of Business & Economic Statistics 29, 1–11.
Arteta, Carlos, and Galina Hale, 2008, Sovereign debt crises and credit to the private sector,
Journal of International Economics 74, 53–69.
Bedendo, Mascia, and Paolo Colla, 2013, Sovereign and corporate credit risk: Spillover effects
in the eurozone, Working paper.
Boot, Arnoud W. A., Todd T. Milbourn, and Anjolein Schmeits, 2006, Credit ratings as
coordination mechanisms, Review of Financial Studies 19, 81–118.
Borensztein, Eduardo, Kevin Cowan, and Patricio Valenzuela, 2013, Sovereign ceilings lite?
the impact of sovereign ratings on corporate ratings, Discussion paper.
Chernenko, Sergey, and Adi Sunderam, 2012, The real consequences of market segmentation,
Review of Financial Studies 25, 2041–2069.
Durbin, Erik, and David Ng, 2005, The sovereign ceiling and emerging market corporate bond
spreads, Journal of International Money and Finance 24, 631–649.
Faulkender, Michael, and Mitchell A. Petersen, 2006, Does the source of capital affect capital
structure?, Review of Financial Studies 19, 45–79.
Goh, Jeremy C, and Louis H Ederington, 1993, Is a bond rating downgrade bad news, good
news, or no news for stockholders?, Journal of Finance 48, 2001–08.
Hand, John R M, Robert W Holthausen, and Richard W Leftwich, 1992, The effect of bond
rating agency announcements on bond and stock prices, Journal of Finance 47, 733–52.
34

Harford, Jarrad, and Vahap Uysal, 2013, Bond market access and investment, Journal of
Financial Economics forthcoming.
Heckman, James, Hidehiko Ichimura, Jeffrey Smith, and Petra Todd, 1998, Characterizing
selection bias using experimental data, Econometrica 66, 1017–1098.
Kisgen, Darren J., 2006, Credit ratings and capital structure, Journal of Finance 61, 1035–
1072.
, 2007, The influence of credit ratings on corporate capital structure decisions, Journal
of Applied Corporate Finance 19, 65–73.
, 2009, Do firms target credit ratings or leverage levels?, Journal of Financial and
Quantitative Analysis 44, 1323–1344.
, and Philip E. Strahan, 2010, Do regulations based on credit ratings affect a firm’s
cost of capital?, Review of Financial Studies 23, 4324–4347.
Leary, Mark T., and Michael R. Roberts, 2005, Do firms rebalance their capital structures?,
Journal of Finance 60, 2575–2619.
Lemmon, Michael, and Michael R. Roberts, 2010, The response of corporate financing and in-
vestment to changes in the supply of credit, Journal of Financial and Quantitative Analysis
45, 555–587.
Lemmon, Michael L., Michael R. Roberts, and Jaime F. Zender, 2008, Back to the beginning:
Persistence and the cross-section of corporate capital structure, Journal of Finance 63,
1575–1608.
Roberts, Michael, and Toni Whited, 2010, Endogeneity in empirical corporate finance, Hand-
book of the Economics of Finance 2.
Sufi, Amir, 2009, The real effects of debt certification: Evidence from the introduction of
bank loan ratings, Review of Financial Studies 22, 1659–1691.
35

Tang, Tony T., 2009, Information asymmetry and firms’ credit market access: Evidence from
moody’s credit rating format refinement, Journal of Financial Economics 93, 325–351.
36

Figure 1: Sovereign Ceiling Rule
This figure presents the relationship between sovereign and corporate ratings. Panel A depicts the frequency
distribution of long-term foreign-currency (LT FC) corporate ratings by the LT FC sovereign rating of the
corresponding country of domicile. Observations for countries with AAA ratings are excluded as, by definition,
the sovereign ceiling policy does not represent a constraint for corporates when the sovereign has the maximum
attainable rating. The figure includes ratings from S&P, Moody’s and Fitch which are homogeneized using the
numerical conversion in the Appendix. The bars in dark blue in the diagonal represent the sovereign rating
ceiling (i.e. where corporate and sovereign ratings equate). Panel B plots the distribution of the difference
between long-term foreign-currency (LT FC) corporate ratings and LT FC sovereign ratings for S&P, Moody’s
and Fitch. Observations for countries with a AAA rating are excluded from the graph, as well as for countries
where no sovereign rating changes are observed from any credit rating agency between 1999 and 2012.
CCC
CCC+
B-
B
B+
BB-
BB
BB+
BBB-
BBB
BBB+
A-
A
A+
AA-
AA
AA+
AAA
S&
P C
orpo
rate
Rat
ing
- F
C L
T
CCCCCC+ B- B B+
BB-BB
BB+BBB-
BBBBBB+ A- A A+
AA-AA
AA+
S&P Sovereign Rating - FC LT
Frequency of Corporate Ratings by Sovereign Rating
0.0
5.1
.15
.2D
ensi
ty
-16 -12 -8 -4 0 4 8S&P Corporate Rating minus Sovereign Rating

Figure 2: Proportion of corporate rating changes around sovereign rating changes by“distance-from-sovereign”
This figure plots the fraction of corporate rating changes the month before, the month of, and the month after a sovereign rating change. Observations
are grouped according to each corporate’s “distance-from-sovereign” (the difference between the corporate rating and its corresponding sovereign). For
example, a “distance-from-sovereign” of zero means that the corporate rating is equal to the sovereign rating. The value of each bar indicates the fraction
of corporate issues in that group whose rating changes in the same direction and magnitude as the sovereign change. Values of “distance-from-sovereign”
lower than -6 and greater than +2 are grouped at the “<= −6” and “>= +2” bins respectively due to limited observations beyond these values.
1.0 2.3 1.13.0 2.8
0.73.2 4.4 5.9
0
10
20
30
40
50
60
70
80
(%)
<= -6 -5 -4 -3 -2 -1 0 +1 >= +2Distance-from-Sovereign
One Month Before a Sovereign Downgrade
0.94.0
12.2
4.2 5.4
12.6
63.0
46.3
22.7
0
10
20
30
40
50
60
70
80
(%)
<= -6 -5 -4 -3 -2 -1 0 +1 >= +2Distance-from-Sovereign
The Month of a Sovereign Downgrade
1.1 0.5 1.1 1.5
7.3 6.58.8
19.0
14.2
0
10
20
30
40
50
60
70
80
(%)
<= -6 -5 -4 -3 -2 -1 0 +1 >= +2Distance-from-Sovereign
One Month After a Sovereign Downgrade
Percentage of Corporate Rating Changes Around Sovereign Downgradesby Distance-from-Sovereign
38

Figure 3: Corporate Ratings Parallel Trends around SovereignDowngrade
This figure presents the parallel trends of corporate ratings of treatment and control groups around the
sovereign downgrade. Treated firms are firms with credit rating equal to the sovereign rating in the year
before a sovereign downgrade. Control firms are matched firms using the Abadie and Imbens matching
estimator. Corporate rating are converted to a numerical scale with 22 corresponding to the highest rating
(AAA) and one to the lowest (default).
1012
1416
18C
orpo
rate
Rat
ings
-2 -1 0 1 2Years from Sovereign Downgrade
Treatment Control
39

Figure 4: Investment Parallel Trends around Sovereign Downgrade
This figure presents the parallel trends of investment of treatment and control groups around the sovereign
downgrade. Treated firms are firms with credit rating equal to the sovereign rating in the year before a
sovereign downgrade. Control firms are matched firms using the Abadie and Imbens matching estimator.
Investment is defined as the ratio of annual capital expenditure to lag net property, plant and equipment..1
5.2
.25
.3In
vest
men
t Rat
e
-2 -1 0 1 2Years from Sovereign Downgrade
Treatment Control
40

Figure 5: Investment Parallel Trends Recession without Downgrade
This figure presents the parallel trends of investment of treatment and control groups around a recession in
which the sovereign rating is not downgraded. Treated firms are firms with credit rating equal to the sovereign
rating in the year before a sovereign downgrade. Control firms are matched firms using the Abadie and Imbens
matching estimator. Investment is defined as the ratio of annual capital expenditure to lag net property, plant
and equipment.
.14
.16
.18
.2.2
2In
vest
men
t Rat
e
-2 -1 0 1 2Years from Recession without Downgrade
Treatment Control
.14
.16
.18
.2.2
2In
vest
men
t Rat
e
-2 -1 0 1 2Years from Sovereign Upgrade
Treatment Control
.15
.2.2
5.3
.35
Inve
stm
ent R
ate
-2 -1 0 1 2Years from Currency Crisis without Downgrade
Treatment Control
41

Figure 6: Financial Policy Parallel Trends around Sovereign Down-grade
This figure presents the parallel trends of leverage and cash of treatment and control groups around the
sovereign downgrade. Treated firms are firms with credit rating equal to the sovereign rating in the year
before a sovereign downgrade. Control firms are matched firms using the Abadie and Imbens matching
estimator. Total leverage is defined as the ratio of total debt to total assets. Long-term leverage is defined as
the ratio of long-term debt to total assets. Cash is defined as the ratio of cash and short-term investments to
total assets..2
.22
.24
.26
.28
Long
-Ter
m L
ever
age
-2 -1 0 1 2Years from Sovereign Downgrade
Treatment Control
.3.3
5.4
.45
Leve
rage
-2 -1 0 1 2Years from Sovereign Downgrade
Treatment Control
.09
.1.1
1.1
2.1
3C
ash
-2 -1 0 1 2Years from Sovereign Downgrade
Treatment Control
42

Figure 7: Corporate spreads around sovereign rating changes
This figure depicts the regression coefficients of corporate spreads on monthly time dummies around
sovereign downgrades (left panel) and upgrades (right panel) for two groups: firms that at the time of the
sovereign event are exactly at the sovereign ceiling (“Bound Firms”) and firms that are three notches or less
below the sovereign ceiling (“Below Bound Firms”). The dependent variable is the corporate bond spread,
regressed on event-time dummies (months relative to the sovereign rating change), a dummy variable for
each country-event (i.e. each sovereign rating change), and bond fixed effects. Thus, the plotted coefficients
can be interpreted as the change in bond spreads through time around sovereign rating changes. The vertical
dotted line between zero and one represents the event occurrence, which happens after the end of the month
at t=-1 and before t=0. The base period for each group’s corporate rate changes is 10 months prior to each
event. We require that a bond has at least one observation in the pre-event period and one in the post-event
period. The regression estimated is:
Spreadi,j,t = β1EventT imeFE + β2 [EventT imeFE ∗Boundi,j,t] + Firm&EventFE + εi,j,t
where the estimated coefficient vectors β1 and β2 are used to plot the changes in spreads in event
time. Standard errors clustered by country-event are used to calculate the 95% confidence interval of the
difference between the two groups.
-2.0
0.0
2.0
4.0(%
)
-1.0
-0.5
0.0
0.5
1.0
1.5
2.0
2.5
(%)
-10 -9 -8 -7 -6 -5 -4 -3 -2 -1 0 1 2 3 4 5 6 7 8 9Event Time (months)
Bound Firms Bounds vs. Below Bound Difference
Below Bound Firms 95% Conf. Interval
Sovereign Downgrades
43

Table 1: List of Sovereign Downgrades
This table presents the sample of sovereign downgrades, and the number of treated firm-years observations
(i.e., firm-year observations with credit rating equal to the sovereign rating) using S&P long-term foreign
currency credit ratings.
Country Downgrade year Sovereign RatingNumber of treated
firm-yearsBefore
DowngradeAfter
Downgrade
Argentina 2001 BB- SD 42008 B+ B- 32012 B B- 1
Brazil 2002 BB- B+ 5Indonesia 1997 BBB BB+ 1
1998 BB+ CCC+ 5Ireland 2011 A BBB+ 4Italy 2004 AA AA- 1
2006 AA- A+ 22011 A+ A 22012 A BBB+ 2
Japan 2001 AAA AA 12002 AA AA- 42011 AA AA- 13
Mexico 2009 BBB+ BBB 4Philippines 2005 BB BB- 2Portugal 2010 A+ A- 1
2011 A- BBB- 2Spain 2012 AA- BBB- 2Thailand 1997 A BBB 1
1998 BBB BBB- 2United States 2011 AAA AA+ 4
Total 66
44

Table 2: Summary Statistics - Median and Mean Tests
This table presents the pre-treatment statistics comparison of non-treated, treated and control groups. Panel
A presents sample medians, and Panel B presents sample means. Treated firms are firms with credit rating
equal or above to the sovereign rating in the year before a sovereign downgrade. Non-treated firms are all
other firms in the sample. Control firms are matched firms using the Abadie and Imbens matching estimator.
There are 66 treated, 24,873 non-treated, and 66 control firm-year observations in treated years from countries
with at least one treated firm over the sample period. Pearson’s χ2 statistic test the difference in medians
between treated and control firms. Kolmogorov-Smirnov statistic test the difference in means of treated and
control firms. *, **, *** indicates significance at the 1%, 5% and 10% level respectively.
Panel A: MedianPearson χ2
p-valuePanel B: Mean
Kolmogorov-Smirnovp-value
Non-treated Treated Control Non-treated Treated Control
Size 5.30 9.43 9.20 0.60 5.32 8.91 8.71 0.65(0.013) (0.157) (0.170)
Investments 11.46 16.13 12.17 0.12 26.25 28.73 22.07 0.31(0.414) (5.523) (3.420)
Q 1.00 1.31 1.02 0.06* 2.06 1.50 1.15 0.00***(0.045) (0.097) (0.046)
CashF low 7.53 14.80 10.53 0.00*** 1.33 17.36 11.09 0.00***(0.362) (1.218) (0.768)
Cash 10.00 8.47 6.94 0.86 15.20 11.62 9.17 0.36(0.103) (1.317) (0.963)
Leverage 23.32 33.31 34.19 0.22 28.60 32.86 38.11 0.36(0.212) (2.284) (2.152)
Foreign Sales 0.00 0.00 2.00 0.6 11.48 19.19 21.84 0.65(0.148) (3.360) (3.067)
Gov. Ownership 0.00 0.00 0.00 0.66 0.23 1.55 1.55 1.00(0.022) (1.084) (0.785)
45

Table 3: Predicted Rating by Sovereign Bound Status
This table reports the estimated coefficients of the effect of being bound by the sovereign ceiling on a firm’spredicted rating, using the following regression model:
Rgi,t = β1(RgDummy)i,t + β2(RgDummy)i,t × (Bound)i,t + β3(SovRgDummy)i,t + αt + εi,twhere β2 is a coefficients vector that captures the differential effect, for each rating level, of being boundby the sovereign ceiling on a firm’s predicted rating. We weigh observations based on the number of bondsobserved each year for each firm. Standard errors clustered by firm.
Predicted Rating by Bound Status
Below Bound BoundDifference between ”Bound”and
”Below Bound” Firms(1) (2) (3) = (1) - (2) P-value
AA 14.49 14.98 -0.49 0.263AA- 13.90 14.36 -0.46 0.101A+ 14.30 14.19 0.11 0.852A 14.47 14.02 0.45 0.153A- 13.89 13.64 0.25 0.430BBB+ 14.04 13.39 0.64* 0.051BBB 14.14 13.04 1.10*** 0.000BBB- 13.69 12.96 0.73*** 0.002BB+ 13.40 12.58 0.82*** 0.003BB 12.55 12.15 0.39 0.234BB- 12.57 11.44 1.13*** 0.006B+ 12.64 10.86 1.78*** 0.002B 11.20 10.00 1.21*** 0.003B- 11.40 9.97 1.43*** 0.003CCC+ 11.91 9.92 2.00*** 0.001
46

Table 4: Differences-in-Differences of Corporate Ratings around aSovereign Downgrade
This table presents the results of the credit ratings differences-in-differences and the Abadie and Imbens
matching estimator around the sovereign downgrade. Treated firms are firms with credit rating equal or
above to the sovereign rating in the year before a sovereign downgrade. There are 66 treated and 66 control
firm-year observations. Corporate rating are converted to a numerical scale with 22 corresponding to the
highest rating (AAA) and one to the lowest (default). Robust standard errors are reported in parentheses.*,
**, *** indicates significance at the 1%, 5% and 10% level respectively.
BeforeDowngrade
Year ofDowngrade
Difference
Treated Firms 16.41*** 14.75*** -1.66***(0.515) (0.665) (0.336)
Control Firms 13.09*** 12.20*** -0.89***(0.505) (0.652) (0.3125)
Difference 3.32*** 2.55***(0.273) (0.361)
Differences in Differences -0.77***(0.303)
Matching Estimator (ATT) -1.38***(0.309)
47

Table 5: Differences-in-Differences of Investment around aSovereign Downgrade
This table presents the results of the investment differences-in-differences and the Abadie and Imbens matching
estimator around the sovereign downgrade. Treated firms are firms with credit rating equal or above to the
sovereign rating in the year before a sovereign downgrade. There are 66 treated and 66 control firm-year
observations. Robust standard errors are reported in parentheses. *, **, *** indicates significance at the 1%,
5% and 10% level respectively.
BeforeDowngrade
Year ofDowngrade
Difference
Treated Firms 28.73*** 18.53*** -10.20**(5.523) (1.676) (5.104)
Control Firms 22.07*** 19.22*** -2.84(3.420) (3.127) (3.074)
Difference 6.66 -0.69(4.542) (2.943)
Differences in Differences -7.35*(4.424)
Matching Estimator (ATT) -16.78***(5.368)
48

Table 6: Placebo test: Differences-in-Differences of Investment around a Reces-sion without Downgrade
This table presents the results of the investment differences-in-differences and the Abadie and Imbens matching estimator for
investment rate. Panel A presents the estimates around the first year of recession without downgrade. In Panel A there are 51
treated and 51 control firm-year observations. Panel B presents the estimates around a sovereign upgrade. In Panel B there
are 48 treated and 48 control firm-year observations. Panel C presents the estimates around a currency crisis without sovereign
downgrade. Currency crisis is defined using the Reinhard and Rogoff currency crisis indicator. In Panel C there are 53 treated
and 53 control firm-year observations. Treated firms are firms with credit rating equal or above to the sovereign rating in the
year before a sovereign downgrade. Robust standard errors are reported in parentheses. *, **, *** indicates significance at the
1%, 5% and 10% level respectively.
Panel A: Recession without DowngradeBefore Recession
without DowngradeYear of Recession
without DowngradeDifference
Treated Firms 22.89*** 21.81*** -1.08(2.039) (1.794) (1.698)
Control Firms 19.37*** 20.15*** 0.78(1.585) (2.196) (2.060)
Difference 3.52* 1.66(1.991) (2.567)
Differences in Differences -1.86(2.428)
Matching Estimator (ATT) -0.74(2.700)
Panel B: UpgradeBefore Upgrade Year of Upgrade Difference
Treated Firms 21.11*** 21.90*** 0.83(1.277) (1.208) (0.745)
Control Firms 13.95*** 15.66*** 1.68(0.945) (1.144) (0.913)
Difference 7.16*** 6.23***(1.340) (1.368)
Differences in Differences -0.85(1.093)
Matching Estimator (ATT) -0.57(1.266)
Panel C: Currency CrisisBefore CurrencyCrisis without
Downgrade
First Year ofCurrency Crisis
without DowngradeDifference
Treated Firms 23.15*** 23.78*** 0.63**(2.078) (2.188) (1.360)
Control Firms 27.27*** 31.36*** 4.09(27.132) (6.203) (0.534)
Difference -4.12*** -7.58(2.841) (6.799)
Differences in Differences -3.46(6.497)
Matching Estimator -5.25(7.782)

Table 7: Differences-in-Differences of Financial Policy around aSovereign Downgrade
This table presents the results of the firms financial policy differences-in-differences and the Abadie and Imbens
matching estimator around the sovereign downgrade. Panel A presents long-term leverage estimates, Panel B
presents total leverage estimates and Panel C presents cash holdings estimates. Treated firms are firms with
credit rating equal or above to the sovereign rating in the year before a sovereign downgrade. There are 66
treated and 66 control firm-year observations. Robust standard errors are rreported in parentheses. *, **,
*** indicates significance at the 1%, 5% and 10% level respectively.
Panel A: Long-Term LeverageYear of
DowngradeYear afterDowngrade
Difference
Treated Firms 25.33*** 23.68*** -1.65*(2.346) (2.299) (0.943)
Control Firms 25.54*** 26.68*** 1.22(1.910) (2.225) (0.966)
Difference -0.20 -3.00(2.163) (2.479)
Differences in Differences -2.79*(1.497)
Matching Estimator (ATT) -3.78**(1.90)
Panel B: Total LeverageTreated Firms 34.99*** 34.21*** -0.78
(1.621) (2.926) (1.333)Control Firms 36.70*** 38.48*** 1.78
(2.426) (3.023) (1.446)Difference -1.71 -4.27
(2.167) (2.637)
Differences in Differences -2.54*(1.337)
Matching Estimator (ATT) -2.74*(1.601)
Panel C: CashBefore
DowngradeYear of
DowngradeDifference
Treated Firms 11.62*** 10.89*** -0.73(1.317) (1.304) (0.691)
Control Firms 9.43*** 9.63*** 0.20(0.963) (1.026) (0.634)
Difference ‘2.19** 1.26(0.979) (0.108)
Differences in Differences -0.925(0.735)
Matching Estimator (ATT) -2.14**(1.145)

Table 8: Linear Regressions of Investment
This table presents the results of the linear regression model of investment. The dependent variable is the
annual change in investment rate. Treated is a dummy variable that takes the value of one if a firm has a
credit rating equal to the sovereign rating in a year t− 1, and Sovereign Downgrade is a dummy variable that
takes the value of one if a firm’s country rating is downgraded in year t. Robust standard errors clustered
by firm, industry or country are reported in parentheses. *, **, *** indicates significance at the 1%, 5% and
10% level respectively.
Dependent Variable: ∆Investment(1) (2) (3) (4) (5) (6)
Treated x Sovereign Downgrade -0.096** -0.114*** -0.116** -0.107* -0.117*** -0.073*(0.038) (0.043) (0.050) (0.058) (0.032) (0.039)
Treated 0.030*** 0.021*** 0.020** -0.016 -0.020 0.005(0.005) (0.007) (0.008) (0.011) (0.015) (0.016)
Sovereign Downgrade 0.016*** 0.029*** 0.041*** 0.021 0.006(0.005) (0.005) (0.014) (0.016) (0.007)
Controls No Yes Yes Yes Yes YesYear FE No No Yes Yes Yes NoIndustry FE No No Yes No No NoCountry FE No No No Yes No NoFirm FE No No No No Yes YesCountry x Year FE No No No No No YesCluster Firm Firm Ind Country Firm Firm
Observations 391,702 357,229 355,670 357,229 357,229 357,229R2 0.00 0.01 0.02 0.02 0.04 0.01
51

Table 9: Instrumental Variable Regression of Investment
This table presents the results of the instrumental variable regression of investment. The dependent variable
is the annual change in investment rate. The endogenous variable is the change in credit ratings. Treated is a
dummy variable that takes the value of one if a firm has a credit raring equal to the sovereign rating in a year
t− 1, and Sovereign Downgrade is a dummy variable that takes the value of one if a firm’s country rating is
downgraded in year t. Robust standard errors are reported in parentheses. *, **, *** indicates significance
at the 1%, 5% and 10% level respectively.
Dependent Variable: ∆Investment(1) (2) (3) (4) (5) (6) (7)
OLS IV IV IV IV IV IVSecond Stage∆Rating 0.007*** 0.043** 0.051** 0.050** 0.049*** 0.050** 0.089**
(0.002) (0.019) (0.023) (0.022) (0.017) (0.023) (0.037)
First Stage
Treated x Sovereign Downgrade -1.920*** -1.631*** -1.529*** -1.472*** -1.374*** -0.735***(0.111) (0.111) (0.110) (0.111) (0.117) (0.138)
Treated -0.038 -0.064* -0.038 -0.099*** -0.305*** -0.146***(0.037) (0.036) (0.031) (0.034) (0.052) (0.036)
Sovereign Downgrade 0.035 0.039 -0.095*** -0.085** -0.086**(0.026) (0.026) (0.035) (0.037) (0.038)
Controls Yes No Yes Yes Yes Yes YesYear FE Yes No No Yes Yes Yes NoIndustry FE No No No Yes No No NoCountry FE No No No No Yes No NoFirm FE Yes No No No No Yes NoCountry x Year FE No No No No No No Yes
Observations 24,511 26,114 24,511 24,508 24,511 24,511 24,511R2 0.00 0.00 0.00 0.01 0.43 0.00 0.40
52

Table 10: Effect of sovereign rating downgrades on corporate spreadchanges
This table reports the estimation results of the effects of sovereign downgrade on corporate spreads. The
dependent variable is the yield spread change of a corporate bond around the time window specified in each
column. Treated is a dummy variable that takes a value of one if a corporate issue has the same rating as
the corresponding sovereign prior to a sovereign rating downgrade. Standard errors are clustered by firm.
t-statistics are reported in parentheses below coefficients estimates; * indicates significance at the 10% level,
** at the 5% level, and *** at the 1% level.Panel A. OLS with Country-Event Fixed Effects
(1) (2) (3) (4)1mPost−-3mPre 2mPost−-3mPre 3mPost−-3mPre 6mPost−-3mPre
Treated 0.531* 0.544* 0.847** 1.034(1.95) (1.83) (2.48) (1.68)
Country-Event FE Yes Yes Yes Yes
Observations 603 594 572 519r2 0.777 0.728 0.811 0.582
Panel B. 2SLS using bound status as an instrument
(1) (2) (3) (4)1mPost−-3mPre 2mPost−-3mPre 3mPost−-3mPre 6mPost−-3mPre∆Corp.Dwg (2SLS) 0.908** 0.961* 1.473** 1.710
(2.33) (1.98) (2.31) (1.46)Country-Event FE Yes Yes Yes Yes
Observations 603 594 572 519r2 0.776 0.727 0.809 0.577
53
The Real Effects of Sovereign Credit Risk
Heitor AlmeidaUniversity of Illinois at Urbana Champaign
Igor CunhaNova School of Business and Economics
Miguel A. FerreiraNova School of Business and Economics
Felipe RestrepoBoston [email protected]
January 22, 2014
A Default Analysis
An alternative test to evaluate whether a firm’s “bound status” leads to a systematicallypessimistic rating is to examine whether bound firms are associated with a lower default ratethan non-bound firms, for the same actual rating. The power of any default based test isconstrained by the fact that actual defaults do not occur frequently. Out of the 566 firmsin the full sample of non-AAA countries, only 15 had at any time a default rating (“D”).Thus, to perform this particular test we extend this sample to include firms with a rating ofCCC+ and below, which more precisely proxy for being “close to default”. These firms arecharacterized by S&P as having “significant speculative characteristics, currently vulnerable”.The number of close-to-default firms in the sample is 64. We estimate a logit regression wherethe dependent variable is a dummy variable that indicates whether a firm had been “close todefault” during the last five years (Default). We examine if a firm’s bound status affects itsprobability of being close to default, after controlling for its credit rating by estimating thefollowing model:
Defaulti,t = β1(RatingDum)i,t + β2(RatingDum)i,t × (Bound)i,t
+β3(SovRatingDum)i,t + αt + εi,t (1)
where RatingDum is a set of corporate rating dummies for each rating level, Bound is adummy variable that takes a value of one for bound firms and zero otherwise, and SovRatingDumis a set of sovereign rating dummies. The β2 coefficient captures, for each corporate ratinglevel, whether being bound by the sovereign rating is associated with a lower default.
Table A.7 in the Internet Appendix show the results from estimating the logit model, whichrespectively report the estimated coefficients and the marginal effects. Note that there are noestimated coefficients for firms with ratings above A, as there are no firms with these higherratings that transition into “close-to-default” in the sample. The predicted probabilities inTable A.7 indicate that bound firms tend to have a lower probability of transitioning intodefault, for a given rating, than non-bound firms. For instance, the probability of a non-bounded firm with a B+ rating transitioning into “close-to-default” in a 5-year window is7.1%. This is significantly higher than the 4.3% probability of a firm also with a B+ ratingbut bounded by the sovereign ceiling of transitioning into “close-to-default”. The differencebetween bounded and non-bounded firms is more pronounced for firms in lower rating levels.
B Probability of downgrade
We present supporting evidence that the reaction of corporate ratings to sovereign ratingsdowngrades is asymmetric for firms in the treatment and control groups. We estimate a logitregression of the probability of a credit rating downgrade using a firm-year panel of all firmswith a credit rating in alternative to use a numerical scale for ratings as in Table 4. Themain explanatory variables are a dummy variable that takes the value of one if a firm has arating equal to (or above) the sovereign rating in a year t − 1 (Bound), a dummy variablethat takes the value of one if a firm’s country rating is downgraded in year t (SovDown),and the interaction term Bound × SovDown. The interaction term coefficient measures the
1

difference in the probability of a credit rating downgrade between treated and other firmswhen a sovereign downgrade hits the country where the firm is located.
Table A.8 in the Internet Appendix, column (1), shows that the interaction term Bound× SovDown coefficient is positive and significant, which indicates that the probability ofa credit rating downgrade following a sovereign downgrade is significantly higher for treatedfirms versus other (non-treated) firms. The marginal effect (shown at the bottom of the table)indicates that the probability of a rating downgrade is more than 1.5 times higher for treatedfirms versus non-treated firms when a sovereign downgrade hits the country where the firmis domiciled. As expected, the Bound coefficient is positive and significant as higher qualityfirms are less likely to be downgraded unconditionally. The SovDown coefficient is negativeand significant, which consistent with the idea that corporate ratings are negatively affectedby sovereign downgrades. The next columns of Table A.8 show additional specifications thatcontrol for firm characteristics. Columns (2)-(4) include control variables (size, investment,Tobin’s Q, cash flow, cash holdings, leverage and foreign sales), and combinations of year,industry, country, and firm fixed effects. The firm fixed effects estimate in column (4) is drivenonly by within-firm variation in credit ratings and therefore controls for any source of time-invariant unobserved heterogeneity. Column (5) presents estimates including country-yearfixed effects that controls for any country-specific macro shock. The results are consistentin all specifications. In short, the results of the logit regression confirm the results of thedifference-in-differences matching estimator in Table 4 that the reaction of corporate ratingsto sovereign downgrades is strongly asymmetric between treated and control firms.
C Example
One of the firms in our treatment group comes from the energy business: EDP Energias dePortugal. Portugal sovereign rating was downgraded on March 25, 2011 by S&P from A- toBBB and then on March 28, 2011 to BBB-. As a consequence, EDP was downgraded onMarch 28, 2011 from A- to BBB. The effect of sovereign downgrades on the firm credit ratingwas explained by Miguel Viana, Head of Investor Relations Office, in the 2011 year-end resultsconference call on March 9, 2012:
“In terms of credit ratings, EDP recently suffered with downgrades by S&P andMoody’s, penalized by the maximum notch differential allowed between EDP andPortugal Sovereign, so right now EDP is one notch above Portugal by S&P andtwo notches above Portugal by Moody’s. Nevertheless, we consider that these by-the-book credit agencies methodologies are unable to reflect EDPs distinct creditprofile, namely the geographical diversification, the high quality of our generationfleet, our resilient EBITDA, and the fact that our operations in Portugal have lowsensitivity to the economic cycle”.
The effect of the sovereign rating downgrade on the firm investment and financial policywas explained by the chief executive officer, Antonio Mexia, in the 2011 and 2012 year-endresults conference call:
“We are reducing CAPEX not only because of the evolution of the energy marketbut also to improve financials. The CAPEX fell 19% to less than 2.2 billion
2
euros, especially because of the lower additions in the US market. In the disposalsprogram we reached 440 millions euros in cash proceeds... I would also like tomention the fact that CAPEX were 2 billion euros, 7% lower on year-on-yearbasis, namely due to fewer expansion projects in wind power especially in the USmarket, and by the fact that we went down the road once again in what concernsthe deleveraging through disposals.”
The corporate managers quotes support that the link between the corporate and sovereignratings was due to ceiling policies and unrelated to firm fundamentals, as well as how the ratingdowngrade affected the firm’s investment and financial policy.
3

Table A.1: Variables Distribution Support
This table presents the distribution support of the main variables considered in the paper
5% 25% 50% 75% 95%Panel B: Treated vs Non-treated Groups
Size Treated 6.60 7.71 9.43 10.08 10.08Non-treated 2.02 4.14 5.30 6.57 8.76
Investment Treated 3.91 12.26 16.13 25.40 82.32Non-treated 0.43 4.49 11.46 24.22 83.58
Q Treated 0.85 1.03 1.31 1.59 2.78Non-treated 0.57 0.82 1.00 1.36 3.75
CashF low Treated 7.68 11.00 14.80 21.11 33.10Non-treated -18.79 2.90 7.53 13.43 27.60
Cash Treated 0.94 2.86 8.47 15.20 34.11Non-treated 0.54 4.18 10.00 20.31 48.73
Leverage Treated 0.72 19.03 33.31 46.98 62.41Non-treated 0.00 6.46 23.32 40.50 69.20
Panel B: Treated vs Control Groups
Size Treat 6.60 7.71 9.43 10.08 10.08Control 6.75 7.33 9.20 10.08 10.08
Investment Treat 3.91 12.26 16.13 25.40 82.32Control 4.20 8.01 12.17 23.75 106.09
Q Treat 0.85 1.03 1.31 1.59 2.78Control 0.75 0.90 1.01 1.27 1.64
CashF low Treat 7.68 11.00 14.80 21.11 33.10Control 1.83 6.98 10.53 14.55 23.35
Cash Treat 0.94 2.86 8.47 15.20 34.11Control 1.47 3.14 6.94 11.52 20.88
Leverage Treat 0.72 19.03 33.31 46.98 62.41Control 15.45 24.50 34.19 49.62 62.75
4

Table A.2: Estimation of coefficients from firms in AAA countriesto predict firm ratings in non-AAA countries
This table reports the estimated coefficients from firms in AAA countries that are used to predict ratings on
non-AAA countries. t-statistics are reported in parentheses below coefficients estimates; * indicates signifi-
cance at the 10% level, ** at the 5% level, and *** at the 1% level.Pooled OLS downgrades and upgrades
(1)Corp. Rating
ROA 6.798***(18.62)
Size 1.240***(4.01)
Leverage -7.525***(-20.14)
Square of ROA 1.097***(9.84)
Square of Size 0.010(0.49)
Square of Leverage 2.288***(10.33)
Year FE YesIndustry FE Yes
Observations 22005r2 0.596
5

Table A.3: Default and Bound Status: Logit Regression of “Close-to-Default” by Rating and Bound Status
This table reports the estimated coefficients from a logit model, which measure the effect of being bound by
the sovereign ceiling on a firm’s probability of transitioning into a “Close-to-Default” status:
Close-to-defaulti,j,[t,t+T ] = β0 + β1RtgFEi,j,t + β2(RtgFEi,j,t ∗Boundi,j,t) +SovRatFEi,t +TimeFEt + εi,j,t
where β2 is a coefficients vector that captures the differential effect, for each rating level, of being
bound by the sovereign ceiling on a firm’s predicted rating. I weigh observations based on the number of
bonds observed each year for each firm. Standard errors clustered by firm.
Outcome: Close-to-Default(5-year realization window)
Coeff. S.E. p-valueA+ 2.953 0.759 0.000A -0.609 0.860 0.479A- 2.168 1.131 0.055BBB+ 3.525 0.736 0.000BBB 3.137 0.628 0.000BBB- 3.321 0.678 0.000BB+ 4.038 0.714 0.000BB 5.350 0.634 0.000BB- 5.519 0.621 0.000B+ 6.032 0.626 0.000B 6.322 0.621 0.000B- 7.584 0.624 0.000
Bound * A+ 0.000 . .Bound * A 4.319 0.772 0.000Bound * A- -0.327 0.991 0.741Bound * BBB+ -3.113 0.796 0.000Bound * BBB -1.143 0.517 0.027Bound * BBB- -1.523 0.488 0.002Bound * BB+ 0.104 0.620 0.866Bound * BB -0.368 0.463 0.427Bound * BB- -1.212 0.646 0.061Bound * B+ -0.525 0.439 0.232Bound * B -0.916 0.493 0.063Bound * B- -2.250 0.703 0.001
Sovereign Rating FE Yes
Observations 16 459Number of firms 556Pseudo R2 0.2895
6

Table A3 (Panel B): Default and Bound Status: Marginal Effectsfrom Logit Regression of “Close-to-Default” by Rating and BoundStatus
This table reports the predicted probabilities (marginal effects) from the logit model, whose estimated coeffi-
cients are reported in table A.3. The marginal effects indicate the predicted probability of a firm with a given
rating transitioning into “Close-to-Default” in a 5-year window, depending on whether the firm is bound or
not by the sovereign ceiling.
Predicted Probability of Close-to-Default (5-year window)Non-Bound Bound Difference
(1) (2) (3) = (1) - (2) p-valueA+ . 0.35% . .A 0.01% 0.74% -0.73% 0.030A- 0.16% 0.11% 0.04% 0.775BBB+ 0.61% 0.03% 0.59% 0.020BBB 0.42% 0.13% 0.28% 0.012BBB- 0.50% 0.11% 0.39% 0.035BB+ 1.02% 1.13% -0.11% 0.867BB 3.69% 2.59% 1.11% 0.376BB- 4.34% 1.33% 3.01% 0.004B+ 7.05% 4.29% 2.75% 0.168B 9.21% 3.90% 5.31% 0.015B- 26.37% 3.64% 22.73% 0.000
7

Table A.4: Probability of Corporate Downgrade FollowingSovereign Downgrade
This table presents the results of the logit regression of the probability of a credit rating downgrade. The
dependent variable is a dummy that takes the value of one if a firm credit rating is downgraded in a given
year. Treated firms are firms with credit rating equal to the sovereign rating in the year before a sovereign
downgrade. Robust standard errors are reported in parentheses. *, **, *** indicated significance at the 1%,
5% and 10% level respectively.
Dependent Variable: Corporate Downgrade(1) (2) (3) (4) (5)
Treated x Sovereign Downgrade 2.156*** 2.219*** 2.644*** 2.407*** 1.906***(0.297) (0.325) (0.291) (0.347) (0.405)
Treated -0.628*** -0.349** -0.446*** 0.192 -0.191(0.130) (0.144) (0.136) (0.210) (0.175)
Sovereign Downgrade 0.807*** 0.683*** 0.445*** 0.417***(0.167) (0.172) (0.115) (0.134)
Controls No Yes Yes Yes YesYear FE No No Yes Yes NoIndustry FE No No Yes No NoCountry FE No No No No NoFirm FE No No No Yes NoCountry x Year FE No No No No Yes
Observations 27,268 24,627 24,609 17,486 23,114
Marginal Effects
∂ Pr(CorporateDowngrade)∂Treated |SovereignDowngrade=1,X=X 1.528*** 1.870***
(0.267) (0.292)
8

Table A.5: Corporate Yields Sample Description
This table reports in panel A the number of observations over time included in the sample. Panel B shows
the distribution of firms in the sample by industry, using the Dow Jones’s Industry Classification Benchmark
(ICB). The sample includes USD denominated bonds issued by non-US firms with at least one credit rating
and located in countries with at least one sovereign rating change between 1999 and 2012.
Panel A. Number of Bonds, Firms and Countries in the Sample by YearYear Number of Observations Number of Bonds Number of Issuers Number of Countries
1999 1 369 176 92 142000 1 967 197 110 182001 1 613 226 128 182002 2 161 225 126 202003 1 617 211 115 192004 2 463 271 145 172005 2 942 237 114 162006 2 111 220 119 182007 2 191 194 101 162008 1 893 221 109 222009 2 731 378 133 222010 6 150 567 203 272011 10 041 865 255 322012 12 529 932 265 34
Number of distinct bonds: 1 935Number of distinct issuers: 566Number of distinct countries: 51
Panel B. Number of Firms by IndustryNumber of issuers by ICB industry
Oil & Gas 45Basic Materials 37Industrials 56Consumer Goods 46Health Care 5Consumer Services 24Telecommunications 40Utilities 64Financials 243Technology 6
Total 566
9

Table A.6: Corporate yield spread summary statistics by rating
This table reports sample statistics on yield spreads for the sample of corporate bonds. The sample includes monthly data on all USD-denominated
bonds issued by non-US firms located in countries with at least one sovereign rating change between 1999 and 2012.
Yield spread: Summary Statistics by Corporate Rating and Bound StatusCorporate Rating Mean Std. Deviation Number of observations
Below Bound Bound Difference Below Bound Bound Below Bound Bound(1) (2) (3) = (2) - (1) p-value (4) (5) (6) (7)
AA+ 2.1% 1.7% -0.4% 0.257 1.4% 1.5% 202 519AA 1.5% 1.7% 0.2% 0.636 1.0% 1.4% 936 271AA- 1.2% 1.4% 0.2% 0.465 0.9% 1.2% 822 522A+ 1.5% 1.8% 0.3%*** 0.007 0.9% 0.7% 1 317 2 380A 2.1% 1.6% -0.5%*** 0.003 1.0% 1.0% 1 111 1 713A- 1.9% 1.5% -0.4%** 0.043 1.2% 1.2% 2 088 1 140
BBB+ 2.3% 2.0% -0.3% 0.210 1.4% 1.3% 3 157 1 303BBB 2.6% 2.3% -0.3% 0.196 1.3% 1.7% 2 677 1 688BBB- 2.8% 2.9% 0.1% 0.842 1.4% 1.9% 1 292 1 653BB+ 4.2% 3.2% -1.0%** 0.028 2.7% 2.2% 964 970BB 5.3% 3.3% -2.0%*** 0.000 3.4% 1.6% 1 590 644BB- 5.9% 3.9% -2.0%*** 0.001 3.3% 3.3% 1 833 598B+ 6.8% 5.1% -1.7%** 0.027 3.7% 3.4% 1 027 633B 8.8% 7.0% -1.8%** 0.021 3.8% 3.8% 714 528B- 7.6% 5.6% -2.0%** 0.014 3.8% 3.5% 254 175
<= CCC+ 9.6% 5.7% -3.9%*** 0.003 4.7% 4.2% 215 200
All 3.5% 2.5% -0.9%*** 0.000 3.0% 2.3% 20 211 14 938
10

Table A.7: Corporate Yields Country coverage
The first two columns in this table show the number of unique corporate bonds and firms by country used
in the sample. Columns 4, 5 and 6 report the number of total long-term foreign-currency (LT FC) sovereign
rating changes by credit rating agency in each country.
CountryNumber of
Corporate BondsNumber of Firms
Number of LTFC Sovereign
RatingChanges
Argentina 64 28 12Australia 197 28 2Austria 14 3 1Azerbaijan 1 1 1Bahrain 3 3 1Belgium 3 1 1Bermuda 59 19 1Bolivia 1 1 3Brazil 194 71 7Canada 56 36 1Chile 128 25 3Hong Kong 30 17 4Colombia 7 3 4Croatia 4 2 1Cyprus 9 5 9Czech Republic 6 2 2Denmark 3 3 1Dominican Republic 2 1 3El Salvador 2 1 1Finland 8 3 2France 178 30 1Georgia 1 1 2Greece 2 2 4India 20 11 2Indonesia 15 6 12Ireland 115 34 6Israel 17 1 2Italy 16 4 4Jamaica 3 2 5Japan 70 29 5Kazakhstan 48 12 8Lebanon 1 1 6Malaysia 25 8 3Malta 2 1 2Mexico 166 47 5New Zealand 13 5 1Panama 7 4 4Peru 10 5 5Philippines 36 10 4Republic of Korea 278 44 5Russian Federation 7 7 8Singapore 13 4 0Slovakia 1 1 0South Africa 10 5 2Spain 27 9 8Sweden 24 9 1Thailand 14 9 2Turkey 10 5 7Ukraine 2 2 7Venezuela 11 4 10Viet Nam 2 1 1
Total 1 935 566 192
11

Table A.8: Falsification test: Effect of the sovereign ceiling on corporate spread changes oneyear before the actual event
This table reports falsification tests for the regressions in table ??. Specifically, the same regressions are estimated one year before each actual sovereign
downgrade or upgrade. The dependent variable is the yield spread change of a corporate bond around the time window specified in each column. Treated
is a dummy variable that takes a value of one if a corporate issue has the same rating as the corresponding sovereign prior to a sovereign rating change.
Standard errors are clustered by firm. t-statistics are reported in parentheses below coefficients estimates; * indicates significance at the 10% level, ** at
the 5% level, and *** at the 1% level.
(1) (2) (3) (4)1mPost−-3mPre 2mPost−-3mPre 3mPost−-3mPre 6mPost−-3mPre
Treated -0.766 -0.243 -0.382 -0.848(-0.87) (-0.37) (-0.65) (-1.05)
Country-Event FE Yes Yes Yes Yes
Observations 390 384 353 307r2 0.630 0.608 0.649 0.630
12

Table A.9: Differences-in-Differences of Investment around aSovereign Downgrade - Bounded Firms
This table presents the results of the investment differences-in-differences and the Abadie and Imbens matching
estimator around the sovereign downgrade restring our treated sample to bounded firms. Treated firms are
firms with credit rating equal or above to the sovereign rating in the year before a sovereign downgrade. There
are 66 treated and 66 control firm-year observations. Robust standard errors are reported in parentheses. *,
**, *** indicates significance at the 1%, 5% and 10% level respectively.
BeforeDowngrade
Year ofDowngrade
Difference
Treated Firms 30.47*** 18.56*** -11.91**(6.451) (1.751) (5.931)
Control Firms 19.82*** 20.94*** 1.12(3.159) (3.905) (3.725)
Difference 10.66 -0.24(4.934) (3.547)
Differences in Differences -13.03**(5.462)
Matching Estimator -21.07***(7.029)
13

Table A.10: Differences-in-Differences of Investment around aSovereign Downgrade using Regions
This table presents the results of the investment differences-in-differences and the Abadie and Imbens matching
estimator around the sovereign downgrade. Treated firms are firms with credit rating equal or above to the
sovereign rating in the year before a sovereign downgrade. There are 81 treated and 81 control firm-year
observations. Robust standard errors are reported in parentheses. *, **, *** indicates significance at the 1%,
5% and 10% level respectively.
BeforeDowngrade
Year ofDowngrade
Difference
Treated Firms 25.72*** 17.26*** -8.46**(4.570) (1.446) (4.181)
Control Firms 21.40*** 19.39*** -2.01(3.374) (2.219) (2.299)
Difference 4.32 -2.13(3.228) (2.167)
Differences in Differences -6.44*(3.849)
Matching Estimator -7.46***(2.796)
14
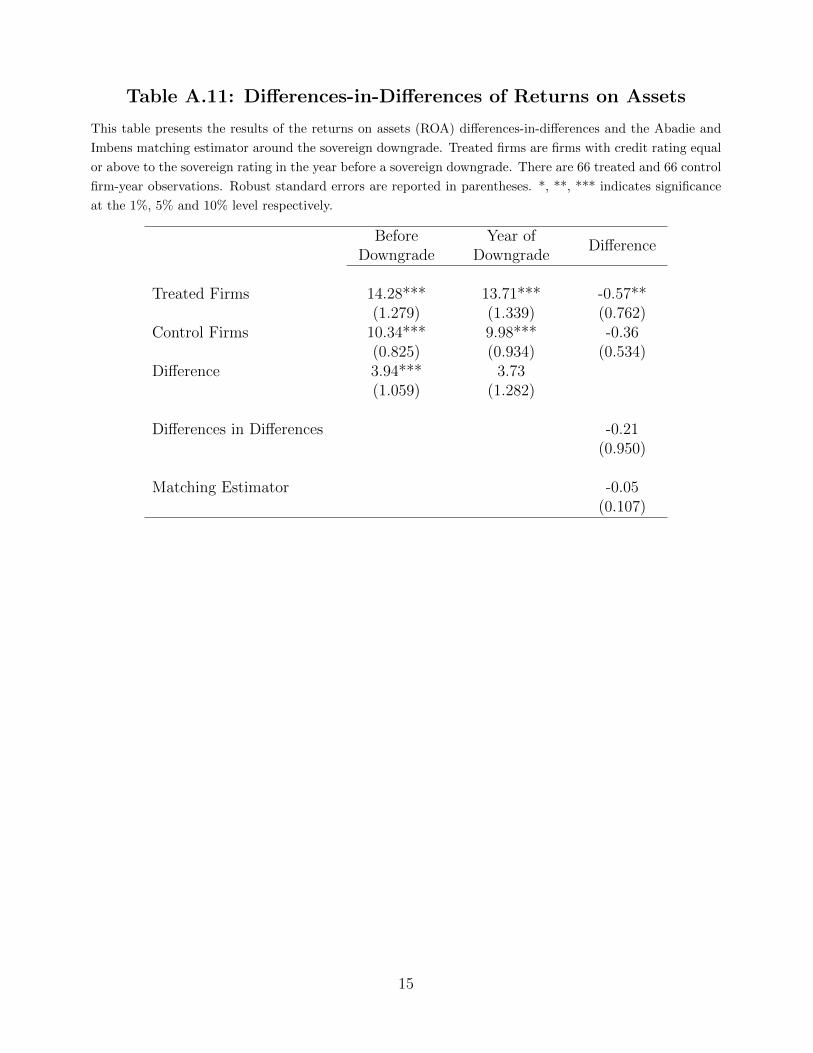
Table A.11: Differences-in-Differences of Returns on Assets
This table presents the results of the returns on assets (ROA) differences-in-differences and the Abadie and
Imbens matching estimator around the sovereign downgrade. Treated firms are firms with credit rating equal
or above to the sovereign rating in the year before a sovereign downgrade. There are 66 treated and 66 control
firm-year observations. Robust standard errors are reported in parentheses. *, **, *** indicates significance
at the 1%, 5% and 10% level respectively.
BeforeDowngrade
Year ofDowngrade
Difference
Treated Firms 14.28*** 13.71*** -0.57**(1.279) (1.339) (0.762)
Control Firms 10.34*** 9.98*** -0.36(0.825) (0.934) (0.534)
Difference 3.94*** 3.73(1.059) (1.282)
Differences in Differences -0.21(0.950)
Matching Estimator -0.05(0.107)
15

Table A.12: List o Treated Firms
Company Name Country Year
MetroGas SA Argentina 2001Telecom Argentina SA Argentina 2001Transportadora de Gas del Sur SA Argentina 2001YPF SA Argentina 2001Telecom Argentina SA Argentina 2008Transportadora de Gas del Sur SA Argentina 2008YPF SA Argentina 2008Transportadora de Gas del Sur SA Argentina 2012Aracruz Celulose SA Brazil 2002Centrais Eltricas Brasileiras SA Brazil 2002Cia Bebidas das Amricas - AMBEV Brazil 2002Klabin SA Brazil 2002Tele Norte Leste Participaes SA Brazil 2002PT Hanjaya Mandala Sampoerna Tbk Indonesia 1997PT Asia Pacific Fibers Tbk Indonesia 1998PT Barito Pacific Tbk Indonesia 1998PT Citra Marga Nusaphala Persada Tbk Indonesia 1998PT Daya Guna Samudera Indonesia 1998PT Hanjaya Mandala Sampoerna Tbk Indonesia 1998Accenture Plc Ireland 2011Cooper Industries Plc Ireland 2011Covidien Plc Ireland 2011Eaton Corp. Plc Ireland 2011Eni SpA Italy 2004Eni SpA Italy 2006TERNA Rete Elettrica Nazionale SpA Italy 2006Eni SpA Italy 2011TERNA Rete Elettrica Nazionale SpA Italy 2011Eni SpA Italy 2012TERNA Rete Elettrica Nazionale SpA Italy 2012Toyota Motor Corp. Japan 2001DENSO Corp. Japan 2002FUJIFILM Holdings Corp. Japan 2002Ito-Yokado Co. Ltd. Japan 2002Toyota Motor Corp. Japan 2002Canon, Inc. Japan 2011Chubu Electric Power Co., Inc. Japan 2011DENSO Corp. Japan 2011Electric Power Development Co., Ltd. Japan 2011NTT DoCoMo, Inc. Japan 2011Nippon Telegraph & Telephone Corp. Japan 2011Okinawa Electric Power Co., Inc. Japan 2011Osaka Gas Co., Ltd. Japan 2011Shikoku Electric Power Co., Inc. Japan 2011Takeda Pharmaceutical Co., Ltd. Japan 2011Tokyo Electric Power Co., Inc. Japan 2011Tokyo Gas Co., Ltd. Japan 2011Toyota Motor Corp. Japan 2011Coca-Cola FEMSA SAB de CV Mexico 2009Grupo Bimbo SAB de CV Mexico 2009Grupo Televisa SAB de CV Mexico 2009Kimberly-Clark de Mxico SAB de CV Mexico 2009Globe Telecom, Inc. Philippines 2005Universal Robina Corp. Philippines 2005Redes Energeticas Nacionais SA Portugal 2010EDP - Energias de Portugal SA Portugal 2011Redes Energeticas Nacionais SA Portugal 2011Enags SA Spain 2012Red Elctrica Corp. SA Spain 2012PTT Exploration & Production Plc Thailand 1997Advanced Info Service Public Co., Ltd. Thailand 1998PTT Exploration & Production Plc Thailand 1998Automatic Data Processing, Inc. United States 2011Exxon Mobil Corp. United States 2011Johnson & Johnson United States 2011Microsoft Corp. United States 2011
16

Table A.13: Firm Data Country Coverage
Country Number of Firm Years Country Number of Firm Years
Argentina 215 Lebanon 2Belgium 85 Sri Lanka 148Bulgaria 46 Lithuania 48Bahrain 14 Latvia 57Brazil 340 Macedonia 2Canada 275 Malta 8China 122 Mexico 139Colombia 29 Malaysia 465Cyprus 156 Nigeria 63Czech Republic 34 New Zealand 115Ecuador 1 Peru 45Estonia 12 Philippines 232Egypt 229 Pakistan 221Spain 451 Portugal 209Finland 109 Romania 30France 451 Serbia 9Greece 817 Russian Federation 186Hong Kong 220 Sweden 94Croatia 189 Slovenia 64Hungary 124 Slovakia 11Indonesia 473 Thailand 378Ireland 197 Tunisia 62India 255 Turkey 160Iceland 20 Taiwan 1336Italy 865 Ukraine 338Jamaica 16 United States 4081Japan 9712 Venezuela 54Kenya 23 Vietnam 475South Korea 251 South Africa 174Kazakhstan 2
Total 24939
17
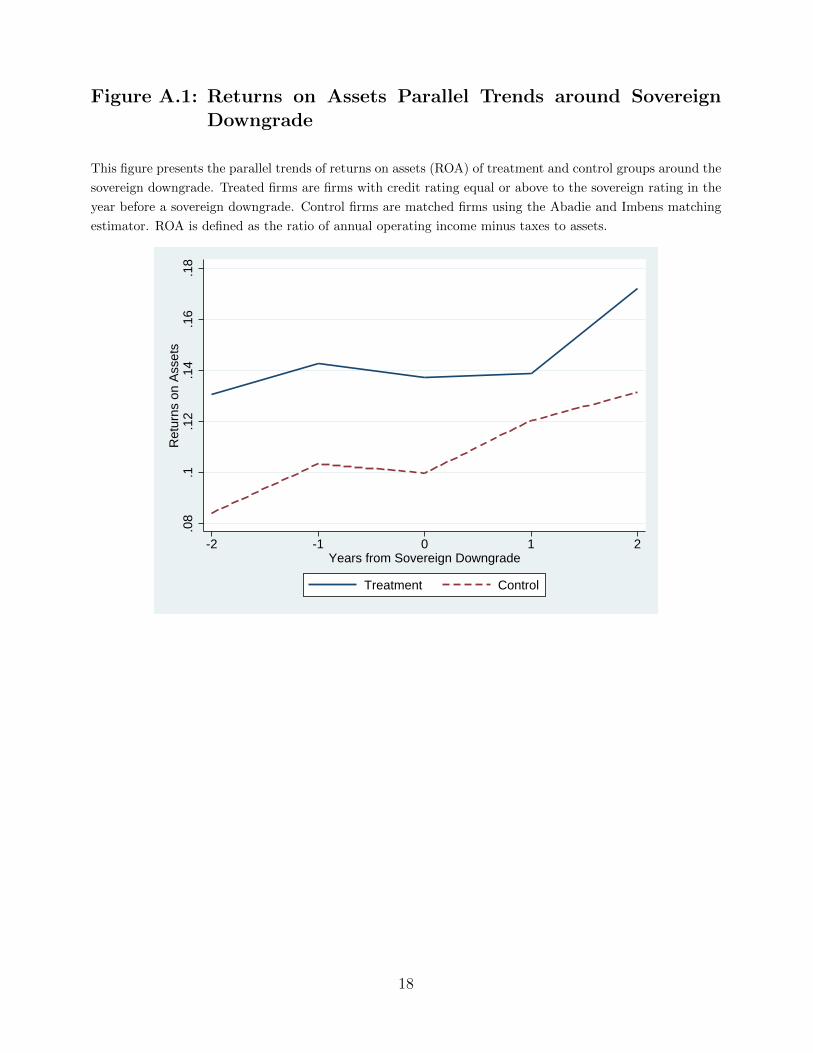
Figure A.1: Returns on Assets Parallel Trends around SovereignDowngrade
This figure presents the parallel trends of returns on assets (ROA) of treatment and control groups around the
sovereign downgrade. Treated firms are firms with credit rating equal or above to the sovereign rating in the
year before a sovereign downgrade. Control firms are matched firms using the Abadie and Imbens matching
estimator. ROA is defined as the ratio of annual operating income minus taxes to assets.
.08
.1.1
2.1
4.1
6.1
8R
etur
ns o
n A
sset
s
-2 -1 0 1 2Years from Sovereign Downgrade
Treatment Control
18

Figure A.2: Distribution of sovereign ratings by rating category.
The figures in Panel A and B depict the distribution of long-term foreign-currency (LT FC) sovereign ratings
and rating changes for the countries and period in the sample for S&P, Moody’s and Fitch.
0.0
5.1
.15
.2D
ensi
ty
D/C CC
CC
C-
CC
C
CC
C+ B- B
B+
BB
-
BB
BB
+
BB
B-
BB
B
BB
B+ A- A
A+
AA
-
AA
AA
+
AA
A
S&P Sovereign FC LT Rating0
.05
.1.1
5.2
Den
sity
D/C CC
CC
C-
CC
C
CC
C+ B- B
B+
BB
-
BB
BB
+
BB
B-
BB
B
BB
B+ A- A
A+
AA
-
AA
AA
+
AA
A
Moody's Sovereign FC LT Rating
0.0
5.1
.15
.2D
ensi
ty
D/C CC
CC
C-
CC
C
CC
C+ B- B
B+
BB
-
BB
BB
+
BB
B-
BB
B
BB
B+ A- A
A+
AA
-
AA
AA
+
AA
A
Fitch Sovereign FC LT Rating
19

Figure A.3: Distribution of sovereign rating changes by year.
The figure depicts the distribution of long-term foreign-currency (LT FC) sovereign ratings and rating changes
for the countries and period in the sample for S&P, Moody’s and Fitch.
0
4
8
12
16
20
Fre
quen
cy
1992 1994 1996 1998 2000 2002 2004 2006 2008 2010 2012
S&P Sovereign Downgrades per Year
20