the regulation of human pai-1 levels in blood · the regulation of human pai-1 levels in blood...
TRANSCRIPT

The Regulation of Human PAI-1
Levels in Blood
Thesis submitted for the degree of
Doctor of Philosophy
at the University of Leicester
by
Danny Chung Fan Chan
Department of Cardiovascular Sciences
University of Leicester
March 2009

Acknowledgments
1
Acknowledgments
This work has been preformed in the Cardiovascular Science Department, at the
University of Leicester. I would like to express my sincere gratitude to the following
people who have contributed to this thesis.
First of all, my deep gratitude to my principal supervisor Alison Goodall for introducing
me to haemostasis and thrombosis research and for being an excellent supervisor. Thank
you for believing in me from the start, for your encouragement and friendship, for
making it possible for me to accomplish this thesis, for always having your door open,
and for providing a pleasant research environment.
I am also deeply grateful to my co-supervisor Nelson Chong. Thank you for sharing
with me your knowledge in the circadian clock and sharing interesting ideas, and for
taking great pains to assist me when needed.
Joy Wright and Jacky Appleby, my colleagues, thank you for providing skilful help, and
your valuable insight in monocyte isolation procedures. Tina James, my colleague,
thank you for your assistance in the flow cytometry assays. Unni Krishnan, my
colleague, thank you for taking blood from the donors.
Veryan Codd, my colleague, thank you for all your assistance in the molecular
techniques and the sharing of your samples. Samir Ounzain, my fellow PhD student,
thank you for your valuable insights, your encouraging words, your captivating
enthusiasm regarding research and for being a good friend.
Joanne Singletary, Andrea Koekemoer, Jasbir Moore and Helen ‘Rigor’ Collins, my
colleagues, thank you for your interest and valuable comments. Also, thank all of you
for the entertaining night outs.
My close friends and family, thank you for all your support through the good and bad
times, and all the volunteers, thank you for making this research possible.

2
DCF ChanUniversity of Leicester
The Regulation of Human PAI-1 levels in Blood
Abstract
Plasminogen activator inhibitor type 1 (PAI-1) is the major inhibitor of fibrinolysis. Plasma PAI-1 levels show clear circadian oscillation, peaking in the morning. Expression of the PAI-1 gene may be directly influenced by the –675 4G/5Gpolymorphism in the PAI-1 promoter. The aim of the present study was to investigate the regulation of PAI-1, using monocytes and platelets as cell models, under conditions that would simulate events occurring within a forming thrombus.
Blood from donors genotyped for the 4G/5G polymorphism was used. Direct stimulation of monocyte with lipopolysaccharide (LPS), induced a small increase in Pai-1 expression (710-fold) above baseline, however, monocyte Pai-1 expression was markedly increased (4700-fold) by interaction with platelets activated by cross-linked collagen related peptide (XL-CRP). Furthermore, the induction of monocyte PAI-1 expression by platelets was not dependent upon cell-cell contact, but appeared to be mediated by both exogenous and endogenous release of TGF-β1. The induction of monocyte Pai-1 expression by either LPS or CRP-XL was not associated with the 4G/5G polymorphism, but the amount of PAI-1 released into plasma following stimulation was influenced by the polymorphism.
Five peripheral clock genes examined were expressed in monocytes under resting conditions. LPS induced the expression of Dec1 and Bmal2 but rapidly switched off the expression of mPer2 and clock in monocytes, whereas the stimulation of monocytes by CRP-XL did not affect the expression of clock genes, apart from the down-regulation of Clock and up-regulation of mPer2. Therefore, the acute induction of PAI-1 in blood cells does not appear to be dependent on the circadian clock.
Platelet count significantly increased during the afternoon compared to the morning. But platelet Pai-1 mRNA abundance did not exhibit significant diurnal variation nor was it influenced by the 4G/5G polymorphism. Although anucleate, platelets appear to retain the ability to synthesise PAI-1, which could be partially inhibited by cycloheximide, both the synthesis of PAI-1, and release from α-granules of activated platelets, was related to the 4G/5G polymorphism, with the highest level of PAI-1 synthesised and released by platelets from 4G homozygous subjects.
In conclusion, PAI-1 in circulatory cells is regulated by circadian factors under resting conditions, but circadian influences may be masked following stimulation. The 4G/5Gpolymorphism regulates the amount of PAI-1 released by both stimulated monocytes and platelets, and may therefore play a role in the formation or resolution of a thrombus.

Content
3
Content
1 Introduction 81.1 Cardiovascular disease 81.2 PAI-1 in thrombosis and fibrinolysis 91.3 Circadian variations in fibrinolysis 121.4 Structure of PAI-1 131.5 Cellular Origin of PAI-1 131.6 Regulation of PAI-1 161.6.1 PAI-1 Gene Polymorphism and association with CVD 161.6.2 Circadian clock 191.6.2.1 Circadian variations in PAI-1 211.6.2.2 Non circadian factors affecting oscillations in PAI-1 221.6.3 Regulatory elements in PAI-1 promoter 241.6.3.1 Putative TGF-β1 regulatory elements in the PAI-1 promoter 261.6.3.2 Regulatory elements adjacent to the 4G/5G polymorphism 301.7 Hypothesis 311.8 Aim 31
2 Materials and methods 332.1 Monocyte isolation 332.2 Analysis of monocyte-platelet aggregates 342.3 Studies of Platelet-Monocyte Interaction 352.4 Platelet Isolation and plasma collection 362.5 mRNA extraction 382.6 Extraction of RNA from whole blood 382.7 Reverse trasnscriptase PCR 392.8 Semi-quantitative PCR 402.9 Quantitative (real time) PCR 422.10 Genotyping 432.11 Enzyme-Linked Immunosorbent Assay (ELISA) 452.12 Preparation of Thrombi in Vitro 462.12.1 Chandler Loop 472.12.1.1 Preparation of FITC-fibrinogen 482.12.2 Thromboelasography 492.13 Statistical analysis 51
3 Regulation of monocyte Pai-1 mRNA and protein expression 523.1 Introduction 523.2 Results 523.2.1 Activated platelets induce PAI-1 expression in monocyte 523.2.2 Platelet-induced PAI-1 in monocytes does not require cell-cell
contact 553.2.3 Platelet releasate stimulates monocyte Pai-1 573.2.4 Role of TGF-β1 secreted by platelets in monocyte Pai-1 induction 57

Content
4
3.2.5 P-selectin directly induces Pai-1 expression mediated by the release of TGF-β1 59
3.2.6 Incubation of isolated monocytes for 4 h was sufficient to attenuate Tgf-β1 gene expression 62
3.2.7 Genotyping of the PAI-1 promoter 643.2.8 Influence of the polymorphism in whole blood stimulation 643.2.9 Diurnal variation in plasma PAI-1 703.2.10 Evidence for circadian variation of Pai-1 mRNA in whole blood 703.3 Discussion 743.3.1 Induction of monocyte Pai-1 expression following platelet
activation 743.3.2 Role of TGF-β1 and P-selectin in the regulation of monocyte
PAI-1 by platelets 753.3.3 Regulation of monocyte PAI-1 by the 4G/5G polymorphism 783.3.4 Regulation of monocyte PAI-1 by the circadian clock 813.4 Conclusion 823.5 Future Work 83
4 Peripheral circadian clock in resting and stimulated monocyte 86
4.1 Introduction 864.2 Results 864.2.1 The expression of clock genes in monocytes under basal
conditions 864.2.2 The effect of CRP-XL and LPS on the clock gene Bmal2
expression over time 884.2.3 Influence of CRP-XL and LPS on Clock gene expression 904.2.4 Platelet releasate stimulates monocyte Per2 944.2.5 Role of TGF-β1 secreted by platelets in monocyte Per2 induction 944.3 Discussion 964.3.1 The regulation of circadian clock in monocytes 964.4 Conclusion 994.5 Future work 100
5 Regulation of platelet Pai-1 mRNA and protein expression 1035.1 Introduction 1035.2 Results 1055.2.1 Demonstration that platelets could be isolated free from
leukocyte contamination 1055.2.2 Diurnal variation in platelet count but not Pai-1 mRNA expression 1055.2.3 Release of PAI-1 by activated platelets 1085.2.4 PAI-1 synthesis by activated platelets 1125.3 Discussion 1205.3.1 Leukocyte contamination in platelet preparations 1205.3.2 The role of the circadian clock in the regulation of platelet
Pai-1 expression 1215.3.3 Influence of the 4G/5G polymorphism on the release of PAI-1
from activated platelets 122
Content
5
5.3.4 Influence of the 4G/5G polymorphism on the synthesis of PAI-1 from activated platelets 125
5.4 Conclusion 1285.5 Future Work 129
6 Clot formation and lysis 1336.1 Introduction 1336.2 Results 1336.1.2 Chandler loop thrombi 1336.2.2 Thromboelastometry 1366.3 Discussion 1426.4 Conclusion 144
7 General Discussion 1457.1 Major findings in the thesis 1457.2 Limitations of the study 1467.3 Regulation of monocytes PAI-1 by activated platelets 1477.4 Regulation of monocyte PAI-1 is independent of peripheral
circadian clock 1517.5 Monocyte peripheral circadian clock 153
8 References 155
9 Appendix 1959.1 Optimisation of semi-quantitative PCR 1959.1.1 Optimising cycle number for 18S and PAI-1 1959.1.2 Optimising PAI-1 primer pairs 1989.1.3 Optimising template DNA concentration 2009.2 Optimisation of real-time PCR 2019.2.1 SYBR-Green method 2019.2.2 TaqMan method 2059.3 Optimisation of PCR conditions 207

Abbreviations
6
List of Abbreviations
ACE Angiotensin converting enzymeADP Adenosine diphosphateAngII AngiotensinIIANOVA Analysis of varianceAT AntithrombinAT1 AngiotensinII type 1 receptorBAECs Bovine aortic endothelial cells Bcl3 B cell lymphoma 3bHLH Basic helix-loop-helixbHLHZIP Basic helix-loop-helix/leucine ziperCAD Coronary artery diseaseCAT Chloramphenicol acetyltransferaseCFT Clot formation timeChIP Chromatin immunoprecipitation assay COX-1 Cyclo-oxygenase-1 COX-2 Cyclo-oxygenase-2 CRP-XL Cross-linked collagen-related peptideCRY CryptochromeCT Clotting timeCt Cycle thresholdCVD Cardiovascular diseaseDEC Differentially Expressed in ChondrocytesECLT Euglobulin clot lysis timeELISA Enzyme-linked Immunosorbant assayEMSA Electromobility shift assayERE Estrogen response elementERα Estrogen receptor alpha GPIX Glycoprotein-IXGPVI Glycoprotein-VIGRE Glucocorticoid response elementHRE Hypoxia-response elementHUVEC Endothelial cells IL-1 Interleukin-1ITP Idiopathic thrombocytopenic purpuraLPS LipopolysaccharideMCF Maximal clot firmnessMI Myocardial infarctionmiRNA microRNAMNCs Human mononuclear cells

Abbreviations
7
MPC Magnetic Particle ConcentratorPA Plasminogen activatorsPAI-1 Plasminogen activator inhibitor type-1PAS PER-ARNT-SIMPBS Phosphate buffered salinePER Period PGE-2 Prostaglandin E2 PKA Protein kinase A PNACL Protein and Nucleic Acid Chemistry LaboratoryPPP Platelet poor plasmaPRP Platelet-rich plasmaPSGL-1 P-selectin glycoprotein ligand-1RAS Rennin-angiotensin systemREV-ERBα Nuclear receptor reverse strand c-ERBαROR Retinoid–related Orphan ReceptorRPE R-phycoerythrinrP-Selectin Recombinant P-selectinrTGF-β1 Recombinant TGF-β1 SBE Smad binding element SCN Suprachiasmatic nucleusTEG ThromboelastographyTEM Thromboelastometry TF Tissue factorTFPI Tissue factor pathway inhibitorTGF-β Transforming growth factor-beta TLR4 Toll-like receptor 4TNFα Tumor necrosis factor-alpha tPA Tissue-type plasminogen activatorTRAP Thrombin receptor-activating peptideTSP-1 Thrombospondin-1TVO Thrombotic vascular occlusionuPA Urokinase-type plasminogen activatorUSF Upstream stimulating factorVLDLRE Very-low-density lipoprotein response elementVn Vitronectin

Chapter 1
Introduction

Introduction
8
1.1 –Cardiovascular disease
Cardiovascular disease (CVD) is the main cause of death worldwide and in the UK
alone, diseases of the heart and arteries account for just under 238,000 deaths a year
(around 39% of all deaths; reviewed in Petersen et al. 2004), which is more than all
forms of cancer combined. Coronary artery disease (CAD) is a common form of CVD,
and it is disease of the arteries that supply the myocardium with blood. The most
common cause of CAD is atherosclerosis. Atherosclerosis is a chronic and progressive
disease of the arteries, and in the advanced stages of the disease process, atherosclerotic
plaque develop. At first, the cross-sectional area of the lumen will be maintained
through compensatory remodeling by the coronary arteries (Glagov et al. 1987). The
progression of the disease might therefore be clinically silent for years. However, in the
long run, these plaques cause narrowing of the lumen of the coronary arteries, making
the blood flow through these arteries more difficult. In addition, disruption of the
atherosclerotic plaque can occur at any time, resulting in thrombosis. The production of
the thrombi from ruptured plaques can cause total occlusion of the coronary artery
causing damage to the myocardium, termed heart attack or myocardial infarction (MI).
The occlusive thrombus also causes ischemia, and the longer term effects of ischemia,
such as necrosis can lead to heart failure over time.
The frequency of atherothrombotic events, including MI, ischemic stroke and
pulmonary thromboembolism displays significant circadian variation with peak
incidence in the early morning, between 6 AM and 12 noon (Muller et al. 1985;
Tsementzis et al. 1985; Colantonio et al. 1989). This morning excess in cardiovascular

Introduction
9
events may result in part from antiphase circadian variation in fibrinolytic activity,
resulting from circadian oscillations of various factors including plasminogen activator
inhibitor type-1 (PAI-1).
1.2 – PAI-1 in thrombosis and fibrinolysis
PAI-1 is an inhibitor of plasminogen activation, and is considered to be an important
regulator of fibrinolysis. The mechanisms of the coagulation/fibrinolytic system are
complex and interlinked. The extrinsic coagulation pathway is initiated when blood is
exposed to cell-bound tissue factor (TF). TF binds to activated factor VII (FVIIa), and
the TF-activated factor VIIa complex activates factor X and IX to form Xa and IXa.
Factor IXa in turn activates additional factor X. Factor Xa converts prothrombin (FII) to
thrombin (FIIa). Thrombin activates platelets through protease-activated receptors 1 and
4, and also cleaves fibrinogen to generate fibrin monomers, which then polymerise into
stable cross-linked fibrin. Once stable cross-linked fibrin is established, the fibrinolytic
system can act.
Fibrinolysis is dependent on the balance between plasminogen activators (PA)
[urokinase-type PA (uPA) and tissue-type PA (tPA)], and PAI-1, which is the major
physiological inhibitor of PA in plasma (Saksela and Rifkin 1998). Plasminogen is
converted by PAs to the active enzyme, plasmin, which is a protease that lyses fibrin
clots. One important mechanism for regulating plasmin production involves the
formation of complexes between PAI-1 and PAs, which prevents the conversion of
plasminogen to plasmin (Sprengers and Kluft 1987).

Introduction
10
Figure 1.1 – Diagram of the coagulation and fibrinolytic systemCoagulation (depicted in black) is initiated by contact between plasma-borne clotting factors and tissue factor (TF or thromboplastin). TF binds to activated FVII (FVIIa) and this complex activates FX to FXa. TF also activates FIX to FIXa which, with the cofactor FVIIIa (known as the tenase complex) increases the rate of conversion of FX to FXa. FXa binds to the cofactor FVa on a negatively charged lipid surface. The complex, known as the prothrombinase complex, activated prothrombin (FII) to thrombin (FIIa).Thrombin cleaves fibrinogen into fibrin. The fibrin molecules cross-link to form a clot. The clearance of the fibrin clot (termed fibrinolysis, depicted in blue) is carried out by the protease plasmin, which is converted from plasminogen through the action of plasminogen activators (PA). Fibrinolysis is attenuated by a number of inhibitors including PAI-1, which acts by binding to PA.
Xa.Va
TF.VIIaIX
XI
XI
thrombinprothrombin
V
VIII.vWF
X
fibrinogen
TF.VII
VIIIa.IXa
fibrin
plasmin plasminogen
Fibrin-degradation products
tPA or uPA
PAI-1
(tenase)
(Prothrombinase)

Introduction
11
Under physiological conditions, plasminogen, t-PA, and fibrin form a ternary complex
that promotes the development of plasmin and the subsequent lysis of fibrin. This
allows plasmin and tPA to be protected from inactivation by their respective inhibitors.
However, PAI-1 is still able to suppress both tPA and uPA as it can also bind to fibrin.
The binding of tPA to fibrin may in part explain the inhibitory effect of PAI-1 on
fibrinoylsis. The addition of polyclonal antibodies against PAI-1 in a developing
thrombus increases the rate of fibrinoylsis and reduces the extension of the clot,
suggesting that PAI-1 promotes the stability and extension of the thrombus (Chandler et
al.1958). After it has been activated in platelets, PAI-1 is fixed within the clot by
binding to fibrin and retains its capacity to inhibit uPA and tPA, increasing the
thrombus resistance to lysis. In the circulation, most tPA is bound to PAI-1, but also a
small proportion is either free or bound to fibrin.
Under pathological conditions, a decrease in fibrinolysis due to high plasma PAI-1
concentrations might be expected to result in a decrease in thrombolysis rate, and
therefore increase the rate of thrombus formation. High plasma PAI-1 concentrations
are indeed associated with various thrombotic disorders and disease states. Numerous
studies have demonstrated a relationship between plasma PAI-1 levels and thrombotic
status. Increased levels of PAI-1 have a robust correlation with increased risk of MI and
ischemic stroke (Held et al. 1997; Thogersen et al. 1998; Johansson et al. 2000). PAI-1
appears to be the major determinant of tPA activity in the blood because it has the
highest affinity for tPA and is the only inhibitor found complexed with tPA in plasma
(reviewed in Kruithof 1988). Current data suggest that substantial increases in tissue
PAI-1 expression contribute to increased thrombus formation and vascular injury
(reviewed in Vaughan 2005).

Introduction
12
1.3 – Circadian variations in fibrinolysis
During basal conditions, tPA is produced in a circadian rhythmic pattern (Andreotti et
al. 1988; 1991), and PAI-1 also displays circadian oscillations in the plasma, thus
fibrinolytic activity should display circadian variation. Indeed clinically, the circadian
rhythm in fibrinolysis has been shown for a long time (Fearnley et al. 1957). Rosing et
al. (1970) reported a circadian rhythm in global fibrinolytic activity examined by the
fibrin plate assay in blood samples obtained from clinically healthy, diurnally active,
non-fasting subjects, with peak fibrinolytic activity measured in the afternoon.
Activation of fibrinolysis was also demonstrated by the euglobulin clot lysis time
(ECLT) when subjects assumed an upright position. The extent of this activation
response varies in a circadian manner, with maximum effect in the morning and
minimum effect in the afternoon (Kofoed et al. 1994). Multiple exogenous factors that
activate fibrinolysis interact with or mask the expression of this endogenous circadian
rhythm. For example, increase in fibrinolysis is observed after physical exercise, the
increase being highest in the afternoon (Rosing et al. 1970).
The relative hypercoagulability as a result of the large amplitude of the circadian
rhythm in fibrinolysis may also lead to a relative hypocaoagulability of the blood in the
evening and early night, which is predisposing for hemorrhagic accidents. In patients
with cirrhosis of the liver and esophageal varices, variceal bleeding displays a circadian
rhythm with two peaks, a major one in the evening between 7 and 11 pm and one minor
one in the morning, between 7 and 9 am (Garcia-Pagán et al. 1994; Siringo et al. 1996;
Mann et al. 1999). Piscaglia et al. (2000 and 2002) found patients with cirrhosis of the

Introduction
13
liver to be in a hyperfibrinolytic state, but still demonstrating a circadian rhythm in
fibrinolysis, with the timing of peak and trough activity being comparable to that of
clinically healthy subjects. The peak in total fibrinolytic activity and in tPA activity in
the cirrhotic patients occurred between 6 and 10 pm, respectively, corresponding to the
major peak in the occurrence of variceal haemorrhages.
1.4 – Structure of PAI-1
PAI-1, a member of the serpin superfamily, is a single-chain glycoprotein with a
molecular weight of 47,000 daltons. It consists of 379 amino acids and a 23 amino acid
signal peptide indicating that it is a secreted protein. It lacks cysteine but contains
multiple methionines (Gils et al. 2003). PAI-1 is synthesised and secreted in an active
form, but it can decay to a “latent form” through conformational changes that mask the
reactive site, making it inactive as an inhibitor. This instability of active PAI-1 maybe
due to the lack of cysteine residues, and although the biosynthesis rate is high, this
property of PAI-1 produces a short biological half life of only 8-10 minutes, which
yields a relatively low plasma concentration of effective PAI-1 (about 20ng/ml; 400pM).
In plasma, PAI-1 is stabilised in the active conformation by binding to vitronectin (Vn),
which prolongs its activity by >10 times (Declerck et al. 1988).
1.5 – Cellular Origin of PAI-1
PAI-1 was first isolated from rabbit and bovine endothelial cells (Loskutoff et al. 1983),
and rat hepatoma cells (Coleman et al. 1982). Subsequent studies demonstrate

Introduction
14
endothelial cells, hepatocytes, adipocytes and platelets are the major source of plasma
PAI-1 (Declerck et al. 1988; Chomiki et al. 1994; Samad and Loskutoff 1996).
Endothelial cells in culture synthesize PAI-1 at relatively high rates (Schleef and
Loskutoff 1988), but only under stimulation. Cultured human heptocytes, on the other
hand, constitutively secrete PAI-1 (Busso et al. 1994), and furthermore, normal human
liver cells have been demonstrated to express Pai-1 (Chomiki et al. 1994). Hence,
heptocyte and not the vascular endothelium is likely to be a major contributor to
circulating PAI-1 levels.
PAI-1 is found in the alpha-granules of platelets and is released upon activation and
degranulation. The patho-physiologic importance of the platelet PAI-1 pool for
inhibition of the fibrinolytic system has been difficult to reconcile with the fact that the
majority of PAI-1 in platelets exists in a predominantly inactive or latent form. Previous
studies have shown that only 5% to 10% of the PAI-1 present in the platelets is in an
active configuration that could complex-bind and thereby inhibit tPA (Schleef et al.
1985; Booth et al. 1988). However, other reports suggest that PAI-1 release by platelets
following activation binds to Vn in the fibrin clot and become active. Morgenstern et al.
(2001) demonstrated that protein kinase A (PKA), Vn and PAI-1 translocated onto the
fibrin fibers following platelet activation. Together with the group’s finding that PKA
phosphorylation of Vn reduces its grip of PAI-1, this suggests that platelets can release
PAI-1 in its active state. In addition Podor’s group (Podor et al. 2002), using confocal
microscopy, found that Vn:PAI-1 complexes produced by activated platelets co-localize
with platelet vimentin cytoskeleton on the surface of platelets in platelet rich plasma

Introduction
15
clots. These findings suggest Vn may play a role in the regulation of platelet PAI-1
activity.
Although platelets lack nuclear DNA they retain mRNA from the megakaryocyte,
(Booyse and Rafelson 1967a; Newman et al. 1988). It has been shown that platelets
retain the ability for protein synthesis and can synthesize at least some proteins
(Warshaw et al. 1967; Kieffer et al.1987). Work by Brogren and colleagues (2004),
have provided direct experimental evidence that platelets contain significant amounts of
PAI-1 mRNA that is translationally active. Because the major part of the newly
synthesized PAI-1 was found to be active, the relative PAI-1 content in platelet rich
clots could influence their resistance to thrombolysis (Potter van Loon et al. 1992). This
hypothesis, that PAI-1 released from platelets is an important determinant of
thrombolysis resistance, is supported by in vitro clot lysis studies on platelets from a
patient with complete loss of PAI-1 expression (Fay et al. 1994), as well as studies on
thrombus generated in the Chandler loop (Stringer et al. 1994).
Under pathological conditions, however, several other cell types secrete a fairly large
amount of PAI-1, including monocytes (Hamilton et al. 1993a; Lundgren et al. 1994).
The monocyte has the ability to affect both coagulation and fibrinolytic systems, as
peripheral blood monocytes can express PAI-1. It has been showed that blockade of the
renin–angiotensin system by an angiotensin-converting enzyme inhibitor reduces the
synthesis of PAI-1 in cultured human monocytes (Nagata et al. 2001). Thus, controlling
PAI-1 production by monocytes and macrophages may be a target for treating coronary
artery disease.
Introduction
16
It has been proposed that adipose tissue may contribute directly to the elevated PAI-1
levels in obesity (Alessi et al. 1997; Loskutoff and Samad 1998). The expression of
PAI-1 has been demonstrated in cultured adipose cell line (Lundgren et al. 1996) and in
adipose tissue from rodents (Samad et al. 1996; Loskutoff and Samad 1998) and
humans (Alessi et al. 1997; Eriksson et al. 1998a). In addition, it was demonstrated that
adipose tissue PAI-1 gene expression and release of PAI-1 were increased in obesity
(Eriksson et al. 1998a).
1.6 – Regulation of PAI-1
Regulation of plasma PAI-1 has been well studied, and appears to be a complicated
process. This thesis will focus on the genetic determinants of plasma PAI-1, its
regulation by the peripheral clock, and regulatory factors that have been identified to
play a role in PAI-1 transcription.
1.6.1 – PAI-1 Gene Polymorphism and association with CVD
Rallidis’s group has demonstrated that increased PAI-1 levels are seen in the offspring
of men who experienced MI before the age of 55 (Rallidis et al. 1996). This finding
supports the hypothesis of a familial predisposition to coronary artery disease, based on
a defective fibrinolytic system. Indeed, PAI-1 levels partly depend on genetic factors.
Three polymorphisms in the PAI-1 gene seem to associate with different levels of PAI-1:
firstly an eight-allele (CA)n repeat polymorphism in intron 3 (Dawson et al. 1991), and
secondly a two-allele HindIII restriction fragment length polymorphism of the 3’

Introduction
17
flanking region (Dawson et al. 1993). An additional polymorphism, situated 675-bp
upstream of the transcription start site, contains a single guanine insertion/deletion
variation appropriately termed 4G or 5G (Fig. 1.2). Individuals homozygous for the 4G
allele shows the highest PAI-1 plasma levels (Margaglione et al. 1998), and also have
higher levels of PAI-1 activity and antigen in platelets, indicating a possible increased
resistance against endogenous and external plasminogen activation (Nordenhem and
Wiman 1997). In vitro studies have recognised differential binding of transcription
regulating proteins at this site. Elevated gene transcription is associated with four
guanine bases (the 4G allele), and in the binding of a common transcriptional activator
alone, whereas DNA with five guanine bases (the 5G allele), there is also binding of an
as yet unidentified protein that decreases the binding of the activator (Dawson et al.
1993; Eriksson et al. 1995). The 4G/5G promoter polymorphism has been shown to be
related not only to increased PAI-1 levels in healthy individuals but also in patients with
arterial and venous thromboembolic disorders (Eriksson et al. 1995; Ossei-Gerning et al.
1997). However, conflicting data exists in the association of 4G/5G polymorphism with
an increased risk of cardiovascular diseases such as CAD and stroke.
In a large meta-analysis of 37 studies, Ye et al. (2006) demonstrated that the 4G variant
of the PAI-1 gene has relatively little effect on coronary disease with per-allele relative
risk of 1.06 (1.02-1.10). In another meta-analysis of 9 mainly case-control studies a
modestly increased risk of myocardial infarction was observed for the 4G homozygous
genotype with per-allele relative risk of 1.20 (1.04-1.39) (Boekholdt et al. 2001). In
another study conducted in Japan, 112 polymorphisms were studied simultaneously, and
concluded that the 4G/5G polymorphism was one of the two polymorphisms that were

Introduction
18
associated with MI in women (Yamada et al. 2002). However in a large case-control
study the 4G/5G polymorphism was not associated with risk of an acute MI at young
age (Italian Study Group 2003). Iwai’s group demonstrated that the 4G/5G
polymorphism was associated with a faster progression to acute coronary syndrome
after first anginal pain (Iwai et al. 1998). In postmenopausal women (Roest and Banga
2000) and in the elderly (Heijmans et al. 1999), the 4G/5G polymorphism was not
predictive for fatal MI. In another Study, the 4G/5G polymorphism was not predictive
for future MI in men initially free of cardiovascular disease (Ridker et al. 1997).
In stroke patients, increased PAI-1 levels have been shown compared to healthy
controls, both in the acute-phase, and even several months after the event (Margaglione
et al. 1994; Lindgren et al. 1996; Catto et al. 1997). However, Johansson’s group (2000)
found that plasma PAI-1 levels were not significantly associated with increased
incidence of stroke in a population-based cohort. A tendency for a protective effect of
the PAI-1 4G homozygous genotype in stroke has been demonstrated in various studies
(Roest and Banga 2003; Hoekstra et al. 2003), although in only one study was the effect
statistically significant (Roest et al. 2000). The involvement of PAI-1 in stroke appears
to be more complicated, as a case-control study carried out in Korea, demonstrated that
the 4G allele was associated with an increased risk of ischemic stroke (Band et al. 2001).
The genetic background of the study population may possibly explain this inconsistent
finding. A protective role of the 4G allele in stroke, as opposed to an increased in risk of
MI, may indicate a difference in pathogenesis of these diseases.

Introduction
19
1.6.2 – Circadian clock
Plasma PAI-1 demonstrates a circadian pattern with peak levels observed in the
morning. To appreciate the molecular mechanism behind the regulation of PAI-1 by the
circadian clock, the control of the circadian clock must first be examined. It is now
recognized that mammalian circadian rhythms are controlled by a master circadian
pacemaker located in the suprachiasmatic nucleus (SCN) of the anterior hypothalamus,
as well as by peripheral oscillators located in most tissues (Buijs and Kalsbeek 2001).
These circadian clocks are entrained by periodic environmental cues, with the central
clock most potently affected by photic stimulation of the retinohypothalamic tract and
peripheral clocks synchronized by neurohumoral signals under either direct or indirect
control of the central clock (Foster 1998; Balsalobre et al. 2000; McNamara et al. 2001).
At the molecular level, both central and peripheral clocks mark time with an
autoregulatory feedback loop consisting of positive and negative limbs (Reppert and
Weaver 2001) (Fig. 1.2). The positive limb of this feedback loop includes at least four
basic helix-loop-helix (bHLH) proteins containing PER-ARNT-SIM (PAS) domains,
namely two α-class proteins, CLOCK and MOP4, and two β-class proteins, BMAL1
and BMAL2. Heterodimers formed between these α- and β-class proteins bind E-box
enhancers (CACGTG) to activate the transcription of genes encoding the negative limb
of this autoregulatory feedback loop, as well as genes encoding outputs from the clock.
Components of the negative limb are encoded by the Period genes (mPer1, mPer2, and
possibly mPer3) and the Cryptochrome genes (Cry1 and Cry2).

Introduction
20
Figure 1.2 – A Model of the circadian clock mechanism CLOCK (yellow) and BMAL1 (purple) proteins drive the expression of Per, Cry, Rev-erbα and Rorα genes in the nucleus. After dimerisation of PER (red) and CRY (light green) proteins and translocation back into the nucleus, CRY inhibits CLOCK/BMAL1 action and thereby down-regulate their own expression and that of Rev-Erbα (dark green) and Rorα (light blue). When REV-ERBα protein is absent, Bmal1 genes are derepressed and activated by RORα to produce new CLOCK/BMAL1 transcription factors that reinitiate a new circadian cycle. CLOCK proteins are post-translationally modified; CKI, for example, phosphorylates mPER2. Adapted from Albrecht and Eichele, 2003.

Introduction
21
Following translation of PER and CRY proteins, PER:CRY heterodimers translocate to
the nucleus, where they inhibit gene expression driven by α:β heterodimers from the
positive limb by interfering with the activation by CLOCK:BMAL1/BMAL2
heterodimers (Kume et al. 1999; Griffin et al. 1999).
Two additional negative loops of the mammalian circadian clock involve the bHLH
transcription factor Differentially Expressed in Chondrocytes (DEC, of which two
isoforms have been identified, DEC1 and DEC2) and the nuclear receptor reverse strand
c-ERBα (REV-ERBα) (Honma et al. 2002; Preitner et al. 2002). Both the dec1/2 and
rev-erbα genes are under direct transcriptional control by the α:β heterodimers. After
translation of the corresponding proteins and translocation into the nucleus, both
DEC1/2 and REV-ERBα attenuate α:β heterodimers-mediated transcription; DEC1/2
appear to associate with the α:β heterodimers, impairing transcriptional capacity,
whereas REV-ERBα specifically represses Bmal1 transcription, potentially through
recruitment of the N-CoR/histone deacetylase 3 co-repressor (Sato et al. 2004; Yin and
Lazar 2005). Retinoid–related Orphan Receptor (ROR) in the nucleus competes with
REV-ERBα to bind to the orphan nuclear receptor target sequence termed RORE
sequence (AAAGTAGGTCA), in the Bmal1 promoter. Their opposing effects produce a
rhythmic level of BMAL1 and hence CLOCK:BMAL1.
1.6.2.1 – Circadian variations in PAI-1
Laboratory studies have directly linked the body’s endogenous circadian clock to PAI-1
rhythmicity. The CLOCK:BMAL1 heterodimer appears to regulate mouse PAI-1, where

Introduction
22
Oishi et al. (2007) reported the deletion of a putative E-box (located -174 to -179) in the
mouse PAI-1 gene resulted in complete inhibition of CLOCK:BMAL1 transactivation
of the mouse PAI-1 promoter activity in mouse NIH3T3 cells. Maemura et al. (2000)
and Schoenhard et al. (2003), as well as our group (Chong et al. 2006), have recently
demonstrated that clock genes can modulate the human Pai-1 promoter in vitro. It was
reported that the transfection of either BMAL1 and CLOCK, or BMAL2 and CLOCK
expression plasmids up-regulated Pai-1 promoter activity, with the CLOCK:BMAL2
heterodimer the more potent activator (Schoenhard et al. 2003; Chong et al. 2006).
Furthermore, mutation of either of the two E-boxes in the Pai-1 promoter fragments
drastically attenuated CLOCK:BMAL2 responsiveness, where mutation of the second
E-box exerted greater inhibitory effect (Chong et al. 2006). The CLOCK:BMAL2
heterodimer transactivates the Pai-1 promoter by directly binding to the E-boxes,
demonstrated with gel shift assays using in vitro translated CLOCK and BMAL2, and a
32 bp double-stranded oligonucleotide (5'-CTGGACACGTGGGGAGACAATCACGTG
G CTGG-3') probe containing the two E-boxes (Maemura et al. 2000).
1.6.2.2 – Non circadian factors affecting oscillations in PAI-1
A number of other factors had been shown to affect the circadian expression of PAI-1 in
mice. These include diet (Minami et al. 2002; Kudo et al. 2004a), the rennin-
angiotensin system (RAS; Naito et al. 2003; Tsujino et al. 2005) and hormones
regulating diabetes and obesity (Oishi et al. 2004; 2006).

Introduction
23
In humans, angiotensin converting enzyme (ACE) inhibition has been reported to alter
circadian expression of circulating PAI-1 levels. Brown et al. (1998) measured PAI-1
antigen and activity in nine normotensive subjects treated with either a high or low salt
diet. Brown and colleagues demonstrated activation of RAS through low salt intake
increased PAI-1 antigen during the morning period (8 AM through 2 PM) compared
with high salt intake. Furthermore, the interruption of the RAS with the ACE inhibitor
quinapril significantly attenuated this diurnal variation in PAI-1 antigen and activity.
Sleep disruption has also been implicated to influence PAI-1 oscillations in humans.
Irokawa’s group (1998) measured PAI-1 activity in 10 healthy male subjects for two
consecutive days. On day one, subjects remained awake all day and night, and slept
during the daytime on day two (8:30 AM to 5:30 PM). The overnight wakefulness
appear to have significantly blunted the morning peak PAI-1 activity, suggesting that
the subjects activities during the night, awake and sleep, substantially affect 24 h
oscillations of circulating PAI-1.
Recently, Schoenhard et al. (2007), examined whether the entrainment status of the
central circadian clock influences PAI-1 rhythmicity. The author detected plasma PAI-1
levels in four blind subjects, two of who were entrained with melatonin and the other
two were free-running. It was observed that PAI-1’s oscillations were most robust in the
two entrained subjects, with peak concentration at 8:17 am. Surprisingly, significant
circadian variation in PAI-1 was also observed in the two free-running subjects, with
peak concentration at 11:20 am. These results indicate that circadian variation in PAI-1
is independent of both light perception and the body’s central circadian clock.
Introduction
24
1.6.3 – Regulatory elements in Pai-1 promoter
The transcriptional regulation of the Pai-1 gene is complex, and is reflected by the
numerous transcription factor regulatory sites characterised so far (Fig. 1.4). van
Zonneveld and colleagues (1988) identified a perfect TATA box at positions -28 to -23
through sequence analysis, and a glucocorticoid response element (GRE) between the
regions -305 and +75 by promoter deletion mapping experiments and studies involving
the fusion of Pai-1 promoter fragments to chloramphenicol acetyltransferase (CAT)
gene. The author concluded that a sequence at positions -64 to -59 (5' -GGAACA- 3')
resembles one half of a GRE (consensus sequence 5'-
GGT(A/T)CA(A/C)NNTGT(C/T)CT-3'), maybe responsible for glucocorticoid induction.
This was later not only confirmed by Brown et al. (2000) as mutations in this region
abolished the effect of steroid on PAI-1 expression, but demonstrated that the same
element was also involved in mediating aldosterone responsiveness. Utilizing
techniques such as Methylation interference and DNase I footprinting, Eriksson et al.
(1998b) demonstrated a very-low-density lipoprotein response element (VLDLRE)
within the PAI-1 gene promoter located at -672 to -657. Analysis of the VLDLRE (5'-
TCAGCCGTGTATC-3') by the author show some homology to the peroxisome
proliferator activator response element (consensus sequence 5'-
(A/T)(C/G)A(C/A)CT(A/T)T(G/T)NCC(C/T) -3'), and this transcription factor may be
involved in mediating the induction of Pai-1 by VLDL. Chen and colleagues (1998)
reported two adjacent Sp1 sites (consensus sequence 5'-
(G/T)GGGCGG(G/A)(G/A)(C/T)-3') located at -73 and -42 that mediates the glucose
response in the Pai-1 gene, as mutations in either of the Sp1 sites resulted in a 50%

Introduction
25
decrease of glucose responsiveness in transient transfections of rat aortic muscle cells.
Furthermore mutations in both Sp1 sites abolished glucose responsiveness of the Pai-1
luciferase reporter constructs. To confirm that transcription factor Sp1 was responsible
for PAI-1 response to glucose, the author carried out electromobility shift assays
(EMSA) and demonstrated electrophoretic mobility shifts of the oligonucleotides
comprised of the Sp1 regions was altered by increased glucose concentrations. A
hypoxia-response element (HRE) was characterised by Fink et al., (2002) where
reporter gene assays demonstrated this HRE (sequence 5'-CACATG-3') located at
positions -194 to -187 upstream of the transcriptional start site was necessary, as well as
sufficient, for hypoxia-mediated activation of the PAI-1 promoter. Further analysis by
EMSA revealed that a hypoxia-inducible protein complex containing HIF-1α and
ARNT interacted with the HRE element. Smith et al. (2004) later identified a putative
estrogen response element (ERE) located at position -427 in the PAI-1 proximal
promoter. This element was examined by site-directed mutagenesis which altered the 3'
half-site of the ERE (from 5'-ACTCCACAGTGACC-3' to 5'-ACTCCACAAAGCTT-3').
Transfections of either wild-type or the mutant promoter in bovine aortic endothelial
cells (BAECs) demonstrated that the half-site mutation was sufficient to abolish the
estrogen receptor alpha (ERα) dependent stimulation of Pai-1 luciferase activity. The
transcriptional responsive elements so far described focus on the proximal Pai-1
promoter, Hou et al. (2004) demonstrated a 5' distal tumor necrosis factor-alpha
(TNFα)-responsive enhancer of the Pai-1 gene located 15kb upstream of the
transcriptional start site. This TNFα-responsive element was identified using a
combination of DNAse I-hypersensitive site analysis and bioinformatics software such
as MatInspector and rVISTA. Furthermore the author also shows that the TNFα-

Introduction
26
responsive element contained a conserved NFκB site (5'-TGGAATTTCT-3'). EMSA
using 32P-labelled oligonucleotide probe containing the NFκB site resulted in a single
new specific band, subsequent studies demonstrated the binding of NFκB subunits p50
and p65 to this enhancer element.
1.6.3.1 – Putative TGF-β1 regulatory elements in the Pai-1 promoter
The regulation of the human Pai-1 promoter by Transforming growth factor-beta (TGF-
β) has been studied extensively (Fig. 1.5). Keeton et al. (1991) incorporated an 800-base
pair fragment from the Pai-1 promoter into a luciferase reporter construct and
transfected into Hep3B human heptoma cells. Initial truncation approaches identified
two sequences that were important in mediating the response to TGF-β. The first
sequence was located in the proximal promoter (-49 to -87), while the second in a more
distal region (-636 to -740). Datta and colleagues (2000) discovered that the proximal
sequence of the Pai-1 promoter contains two Sp1 binding sites, and was required for
TGF-β-induced transcriptional activation, since an engineered four-base-pair mutation
(GGGTGGGG to GAATTCGG and CCTGCCC to CTAGATC) in both Sp1 sites
abolished Pai-1 promoter activity in response to TGF-β. These same Sp1 sites also
mediated glucose response as discussed earlier in this section, and therefore appear to
have more than one physiological role in regulating Pai-1 transcription. The distal
region of Pai-1 promoter was further characterized by Song et al. (1998), who found
that a 12-base pair sequence from -721 to -732 (AGACAAGGTTGT) was capable of
conferring TGF-β responsiveness to a minimal promoter construct. The authors also
reported, using EMSA, that SMAD3 and SMAD4 was associated with this element, and

Introduction
27
that SMAD4 specifically binds to this region of the Pai-1 promoter. Dennler and
colleagues (1998) further reported that three copies of sequence AG(C/A)CAGACA
located -730, -580 and -280 in the human Pai-1 promoter mediate TGF-β transcriptional
induction. As mutation of these three sequences (AG(C/A)CAGACA to
AG(C/A)TACATA) was found to attenuate Pai-1 promoter activity in response to TGF-β
stimulation in HepG2, Mv1Lu and NIH 3T3 cells. However, these sequences in the
human Pai-1 promoter were not sufficient to explain the specificity of TGF-β-induced
transcription. Another prominent TGF-β response element is the hexanucleotide E-box
(5'-CACGTG -3'), where Hua et al. (1999) reported two copies of this E-box sequence
in a Pai-1 promoter segment (-532 to -794) which was sufficient to confer Pai-1
promoter response to TGF-β in human HT1080 cells. It was also demonstrated that
mutation of the first E-box located at -675 did not diminish promoter activity, but
mutation of the second E-box in the region of -559 dramatically reduced promoter
activity, hence the second E-box was essential for the activity of Pai-1 promoter in
conferring TGF-β induced transcription. The author then further reported three AGAC
Smad binding element (SBE) in between the two E-box sequence. Mutation of either
the first (-581) or the third (-566) in luciferase reporter constructs (AGAC to CTTG)
markedly reduced TGF-β-induced transcription, in contrast mutation of the second SBE
(-577) slightly enhanced TGF-β-induced transcription. These results were confirmed in
gel shift assays, where mutation of the first and third SBE dramatically diminished its
binding to GST-Smad3, thus demonstrating the first and third SBEs were essential for
TGF-β-induced transcription. These data was later supported by Grinberg et al. (2003).
Interestingly, Hua and colleagues also deleted or added 3, 2 or 1 bp to a 3-bp spacer
between the third SBE and second E-box, and found that perturbation in the spacer

Introduction
28
impaired TGF-β-induced transcription. It therefore appears that the combination of the
E-box, multiple SBE, and a requirement for a fixed spacer between the two binding
sites increases the specificity of TGF-β-induced transcription of the Pai-1 gene.
The transcription factors identified so far that recognize the second E-box and play a
role in TGF-β-induced Pai-1 expression are the basic helix-loop-helix/leucine ziper
(bHLHZIP) transcription factors of MYC family including; MYC, MAX, TFE3,
upstream stimulating factor (USF1 and USF2). Grinberg et al. (2003) reported opposite
effects if TFE3 and Max on SMAD3 activation of the Pai-1 promoter showing that
interactions involving the same contact interface can both stimulate and inhibit
transcriptional activity. It thus appears that the E-box element likely function as a
platform for recruitment of both positive and negative regulators of Pai-1 expression.
UV cross-linking and tethered DNA affinity chromatographic analyses identified USF-1
as a major Pai-1 E-box recognition factor (Providence et al. 2002). Specific E-box
mutations that ablate USF-1 binding to a PAI-1 target deoxyoliogonuclucleotide probe
(CACGTG to TCCGTG) effectively attenuated TGF-β1-stimulated, Pai-1 promoter-
driven CAT reporter activity (White et al. 2000).
Since SMAD proteins interact with many diverse transcription regulatory proteins, and
as mentioned earlier the CLOCK:BMAL2 heterodimer act on the E-box in the Pai-1
promoter, it is plausible that SMAD may interact with the CLOCK:BMAL2
heterodimer at the SBE and the E-box sites, and create a circadian-dependent PAI-1
response to TGF-β family cytokines.

Introduction
29
Figure 1.3 – Schematic diagram of the promoter region of the human PAI-1 gene Some of the important regulatory elements that has been documented and depicted (A) in the schematic diagram include a glucocorticoid response element (GRE) that also mediates aldosterone responsiveness (Aldo), a very-low-density lipoprotein response element (VLDLRE) adjacent to the 4G/5G polymorphism, and two Sp1 sites that appear to mediate glucose and glucosamine responsiveness, tumour necrosis factor (TNF)-responsive element at location approximately 15 kb upstream of the transcription start site, Hypoxia responsive element (HRE), and a putative estrogen response element (ERE). Focusing on the putative elements that are responsive to TGF-β and regions that are adjacent to the 4G/5G polymorphism (B). The human PAI-1 promoter contains two conical E-box (CACGTG), the first is adjacent to the 4G/5G polymorphism site, and the second is situated near Smad binding elements (SBE). It has been reported that TGF-β induced PAI-1 transcription is mediated through the second E-box, and two of the three SBEs. 4G/5G polymorphism dependent PAI-1 transcription has been found for very-low-density lipoprotein (VLDL) and interlukin-1 (IL-1), and CLOCK:BMAL2 heterodimer stimulation. Recently a putative tumour necrosis factor (TNF)-α response element has been reported to be located adjacent to the 4G/5G polymorphism site. The approximate location of the putative elements described is situated on the bottom of the diagram.
TNF
-15 kb
4G/5G
TGF-β
Molecular Clock E-box
VLDLRE
-675 -559
TATA box
-427
Ang-response site
Glucose response site
Sp1(1) AldoERE
-73 -64 -42 -28
Sp1(2)HRE
4G/5G
-675 -559-657 -581
E-Box
IL-1
TNFα
SBEVLDLRE
-566
SBE SBE E-Box
A
B
Introduction
30
1.6.3.2 – Regulatory elements adjacent to the 4G/5G polymorphism
Several transcriptional elements in the Pai-1 promoter have been reported to be
influenced by the 4G/5G polymorphism (Fig. 1.3). The location of VLDLRE is
upstream of the 4G/5G polymorphism and may influence VLDL driven Pai-1 promoter
activity. Indeed Eriksson et al. (1998b) reported in transient tranfections of Pai-1
promoter fragments in human umbilical vein endothelial cells (HUVEC), that the 4G
allele showed a higher promoter activity in response to VLDL than the 5G allele. They
also went on to show with EMSA that the 5G allele-specific repressor can compete for
binding to the Pai-1 promoter with both the common transcriptional activator and the
VLDL-induced factor. Swiatkowska et al. (2005) demonstrated that TNFα induced
expression and gene transcription of Pai-1 involves the regulatory region between -664
and -680. This was demonstrated in EMSA experiments containing oligonuleotide of
the putative κB-binding site in the PAI-1 promoter binding to transcriptional factor
subunits p50 and p65, which could be abolished with mutation of oligonuleotide.
Additionally, mutation of the putative regulatory element attenuated Pai-1 promoter
responsiveness to TNFα. Since the putative regulatory element is situated next to the
4G/5G polymorphism, the author hypothesised that the polymorphism may also
influence Pai-1 promoter activity to TNF-α. However, additional experiments were not
carried out to confirm this hypothesis. The induction of Pai-1 gene by IL-1 also appears
to be influenced by the polymorphism, since IL-1 induced Pai-1 promoter activity in the
Pai-1 construct containing the 4G allele, but not in the 5G carrying construct (Dawson
et al. 1993). We have also reported that the 4G/5G polymorphism is a critical element in
Introduction
31
regulating Pai-1 circadian expression (Chong et al. 2006). It was observed that the 4G
polymorphism enhanced the expression of Pai-1; luciferase promoter constructs more
than the 5G, when activated by CLOCK/BMAL2 heterodimer. Since these experiments
were carried out using COS7 cells, it is not known whether this hypothesis would be
physiological relevant in other cell types such as monocytes and platelets.
1.7 – Hypothesis
Previous data has shown CLOCK:BMAL2 heterodimer is capable of inducing PAI-1
gene expression in endothelial cells and simian kidney cells. We propose that clock
genes also regulate PAI-1 expression in monocytes and platelets, and furthermore the
interaction of clock genes with the 4G/5G region of the PAI-1 promoter is a key
regulator of PAI-1 synthesis in these cell types. This would contribute to variability
demonstrated in the resistance to fibrinolysis and thrombolysis.
1.8 – Aim
The aim of the thesis was to determine whether the production of PAI-1 by blood cells
that are physiological relevant in haemostasis and thrombosis, is regulated through the
4G/5G promoter polymorphism and/or the peripheral clock. This aim is further divided
into different areas of investigations as described below:
- to investigate if the interaction of platelets with monocytes resulted in
monocyte PAI-1 expression, and to evaluate the role of direct cell to cell

Introduction
32
contact compared to soluble mediators in provoking this response, and
explore whether this is influenced by the peripheral circadian clock and/or
the 4G/5G polymorphism.
- to examine whether a peripheral circadian clock exists in monocytes, and
how it may be affected during inflammatory or thrombotic stimulus.
- to assess if platelets can synthesise PAI-1, and whether this synthesise or
release of PAI-1 following activation is dependent on the 4G/5G
polymorphism.
- to evaluate the influence of the circadian clock and 4G/5G polymorphism on
thrombolysis in two model systems.

Chapter 2
Materials and methods

Materials and methods
33
2.1 – Monocyte isolation
Peripheral blood was collected from 10 healthy volunteers with their informed consent,
and was used throughout this study. Blood was drawn into a 4.5 ml volume of 3.2%
wt/vol sodium citrate tube (BD Vacutainer, Oxford, United Kingdom). Aliquots of 1 ml
of the blood were incubated at 37˚C for 0, 1.5, 4, 6, and 24 h, either without stimulant,
or with 200 ng/ml Lipopolysaccharide (LPS, Escherichia coli 0111B:4, Sigma-Aldrich,
Dorset, UK), or 500 ng/ml cross-linked collagen-related peptide (XL-CRP from Dr
Richard Farndale, University of Cambridge).
At each time point, monocytes were isolated by positive selection on CD14 magnetic
beads (Dynal, Wirral, United Kingdom) and mRNA was extracted using Oligo(dT)25
beads (Dynal). The 1ml blood samples were transferred to tubes containing 100 μl
CD14 beads (4 x 10⁷ beads) and mixed thoroughly by pipetting. Next the blood was
incubated for 10 min at 4˚C with rotation. The tube containing the blood was then
placed on a Dynal Magnetic Particle Concentrator (MPC, Dynal) for 4 min to separate
the CD14 beads. The blood was removed, and the CD14 beads were washed twice with
500 μl cold phosphate buffered saline (PBS, Sigma-Aldrich). After washing, 1 ml of
lysis/binding buffer (100 mM tris-HCL, pH 7.5, 500 mM LiCl, 10 mM EDTA, 1%
LiDS, 5 mM dithiothreitol) was added to the CD14 beads with monocytes attached, and
placed in the magnet for 5 min at room temperature to allow lysis to occur. The lysate
was then transferred to a new, sterile vial and the extraction of mRNA proceeded as
described in section 2.5.

Materials and methods
34
2.2 – Analysis of monocyte-platelet aggregates
Blood was drawn into citrated tubes, and placed into microtubes, followed by activation
with 500 ng/ml (final concentration) of CRP-XL. Unstimulated controls were incubated
in parallel. The P-selectin blocking antibody 9E1 (R&D systems, Abingdon UK) were
added at 25 µg/ml final concentration. Blood was incubated at 37ºC for 1.5 h and 4 h.
At each time point, 5 µl aliquots were removed and added to HBS (10mM HEPES;
150mM NaCl; 1 mM MgSO4; 5 mM KCl; pH 7.4) containing mouse IgG1 to block non-
specific fc bridge (MOPC31C, Sigma-Aldrich), an R-phycoerythrin (RPE)-Cy-5-
conjugated antibody against monocyte marker CD14 (Dakopatts AB, Stockholm,
Sweden), and RPE-CD42b (Dakopatts AB). After 30 min incubation, the reaction was
stopped with 500 µl 0.2% formaldehyde saline and the samples analysed in the flow
cytometer. The flow cytometer was triggered by forward and side scatter and the
fluorescent signal (RPE-Cy5) of the monocyte marker (CD14) were analysed in a 2
colour histogram. To prevent analysis of irrelevant signals, a discriminator on FL4
events was set at 6 arbitrary units. Marker-positive events were allocated to monocyte
on the basis of forward and side scatter. Monocyte-platelet aggregates were identified as
those events positive for both the monocyte marker CD14 and the platelets marker
CD42b-RPE, whilst free monocytes were events positive only for the monocyte marker.
Materials and methods
35
2.3 – Studies of Platelet-Monocyte Interaction
Human mononuclear cells (MNCs) were isolated using Lymphoprep (Axis-Shield, Oslo,
Norway). Blood was drawn into a 4.5 ml volume of 3.2% wt/vol sodium citrate tube.
Whole blood (2.5 ml) was mixed with 2.5 ml of PBS. The mixture was then underlayed
with 3.5 ml Lymphoprep. After centrifugation of 30 min at 3000 rpm, the interface layer
was removed and transferred into another centrifuge tube. Equal amounts of PBS were
mixed with the plasma, and then centrifuged for 15 min at 1600 rpm. The supernatant
was then removed, to leave an isolated mononuclear cell preparation.
Platelets were isolated by centrifugation of whole blood for 20 min at 900 rpm, to
produce platelet-rich plasma (PRP). Platelet releasates were prepared by exposing 1 ml
PRP to CRP-XL for 10 min at 37°C. The platelet-rich plasma was then centrifuged for
15 min at 3000 rpm, and aliquots (500µl) of purified platelet releasates were added to
the isolated mononuclear cells in the presence or absence of blocking antibodies to 100
µg/ml TGF-β1 (R&D systems, Minneapolis, USA), 1 µg/ml IL-1(R&D systems), or
both. Stimulation of MNCs by rP-selectin (20 µg/ml; R&D systems), and rTGF-β1 (0.4
ng/ml; R&D systems), was also carried out. Samples left unstimulated were incubated
in plasma for 4 h at 37°C, After the incubation, monocytes were isolated with CD14
magnetic beads as described in section 2.1. The extraction of mRNA and the process of
reverse-transcription were followed as described in sections 2.5 and 2.7.
Materials and methods
36
2.4 – Platelet Isolation and plasma collection
Blood was collected into a 4.5 ml volume CTAD tubes (BD Vacutainer), containing
buffered sodium citrate (3.2%), theophylline, adenosine, dipyridamole (0.3 mL). The
CTAD tubes were centrifuged at either 900 rpm for 20 min to produce PRP, or 10,000
rpm for 15 min to collect platelet poor plasma (PPP). Platelet and plasma was isolated at
two different time points; for morning samples it was approximately 9 am (±20mins)
and for afternoon samples at 4 pm (±20mins). At each of the two time points, plasma
were collected into 1.5 ml microtubes after centrifugation and PAI-1 antigen was
measured by ELISA as described in section 2.11. The isolation of platelets was carried
out by negative selection using pan Mouse IgG beads (Dynal) in combination with a
CD11a mAb antibody (to remove lymphoid and myeloid cells), and CD14 magentic
beads (to deplete any residual monocytes).
To coat the IgG beads with CD11a mAb antibody, 100 µl of IgG beads and 1 ml PBS
were pipetted into a vial and mixed. The vial was placed on the MPC and the
supernatant was discarded. The IgG beads was then resuspened in 100 µl of PBS,
followed by the addition of 10 µl CD11a mAb. The mixture was incubated for 30 min at
room temperature on a rotary mixer. The mixture was placed on the MPC and the
supernatant was discarded. The IgG beads coated with CD11a mAb antibody was
resuspened with 100 µl of PBS.
To negatively isolate platelets, 1 ml of PRP was transferred into a sterile vial with 50 µl
of pre-coated IgG beads with CD11a mAb antibody. After incubating at room

Materials and methods
37
temperature for 20 min, the vial was placed on the MPC and supernatant was transferred
into a new clean vial with the addition of 100 µl CD14 beads. The vial was left to
incubate 15 min at room temperature on a rotary mixer, and then placed on the MPC
and supernatant was transferred into a new clean vial. The vial was then centrifuged for
20 min at 3,000 rpm to pellet platelets, with the supernatant discarded afterwards. 1 ml
lysis/binding buffer was then pipetted onto the platelet pellet, and incubated at room
temperature for 5 min. The extraction of mRNA is described in section 2.5. For platelet
stimulation, the platelet pellet was resuspended with HGC buffer (HBS plus 5 mM
glucose, CaCl2 2 mM) and adjusted to a count of 200 x103/µl. Hirudin 10 U/ml (Sigma-
Aldrich) was added to the platelet suspension.
Aliquots (1 ml) of platelet suspension were exposed to the final concentration of either
CRP-XL 100 µg/ml, TRAP 1x10⁻³M (Bachem, Weil am Rhein, Germany) or ADP
1x10⁻³M (Sigma-Aldrich), with the TRAP stimulation in the presence and absence of
Cycloheximide 100 µg/ml (Sigma-Aldrich), for 10 min, 1 h, 2 h, 4 h and 8 h. After
incubation, the PRP was centrifuged for 15 min at 3000 rpm, and the platelet poor
plasma was removed and analysed for PAI-1 antigen using an ELISA as described in
section 2.11. Additionally 1 ml lysis/binding buffer was pipetted onto the platelet pellet,
and incubated at room temperature for 5 min to examine Pai-1 mRNA transcript. The
extraction of mRNA was carried out as described in section 2.5.

Materials and methods
38
2.5 – mRNA extraction
For extraction of both monocyte and platelet mRNA, 100 μl of washed Oligo(dT)25
beads were added to monocyte or platelet lysates. This mixture was incubated for 5 min,
with rotation, at room temperature. The vial was then placed on the magnet and the
supernatant removed. The Oligo(dT)25 beads were washed twice with 250 μl washing
buffer A (100 mM tris-HCL, pH 7.5, 500 mM LiCl, 10 mM EDTA, 1% LiDS), then
twice with 250μl washing buffer B (100 mM tris-HCL, pH 7.5, 500 mM LiCl, 10 mM
EDTA). The Oligo(dT)25 beads were then resuspened in 20 μl of water, and reverse
trasnscriptase PCR was performed immediately, as described in section 2.7.
2.6 – Extraction of RNA from whole blood
RNA was isolated from whole blood at two different time points; for morning samples
it was approximately 9 am (±20 min) and for afternoon samples at about 9 pm (±20
min). Blood from 7 donors was collected into 2.5 ml volume PAXgene blood RNA tube
(QIAGEN, USA) and incubated at room temperature for 2 h. Purification of the RNA
began with a centrifugation step of 9,300 rpm for 10 min to pellet nucleic acids in the
PAXgene blood RNA tube. The pellet was washed with 4 ml RNase-free water and
resuspended with 350 μl resuspension buffer, 300 μl binding buffer and 40 μl proteinase
K for protein digestion. The mixture was incubated for 10 min at 55°C in a shaker-
incubator at 1000 rpm. After incubation, the lysate was centrifuged through a Shredder
spin column for 3 min at 10,000 rpm, which homogenized the cell lysate and removed
residual cell debris. The supernatant of the flow fraction was transferred to another 1.5

Materials and methods
39
ml tube. 350 μl ethanol was added to adjust binding conditions and pipetted into an
RNA spin column. The column was centrifuged for 1 min at 9,300 rpm to allow the
RNA to bind on the silica membrane, and contaminants to pass through. The remaining
contaminants were removed with the addition of 500 μl wash buffer followed by a
centrifugation step of 9,300 rpm for 1 min. This washing step was repeated four times.
Between the first and second wash steps, 10 μl DNase I stock solution and 70 μl DNA
digestion buffer was added to the membrane, and incubated for 15 mins at room
temperature to removed bound DNA. After the wash steps, the RNA was eluted from
the column with 40 μl of elution buffer and a centrifugation step of 9,300 rpm for 1 min.
The RNA yielded was then used as template for Reverse trasnscriptase PCR, which was
preformed as described in section 2.7.
2.7 – Reverse transcription PCR
First-strand cDNA preparations were obtained using SuperScript II Reverse
Transcriptase (Invitrogen, Paisley, UK). Firstly a mix was prepared containing 1μl
mRNA (approx. 2 ng), 10 mM Oligo(dT) (Invitrogen), 10 mM dNTP (Eppendorf,
Hamburg, Germany), and double distilled water to make a final volume of 20 μl. The
reaction was heated to 65˚C for 5 min and then chilled on ice with 4 μl 5X first strand
buffer (Invitrogen, 250 mM Tris pH 8.3, 375 mM KCl, 15 mM MgCl2), and 2μl
dithiothreitol DTT (Invitrogen, 0.1 M) added. After gentle mixing, 1 μl Superscript II
reverse transcriptase (Invitrogen, 200 U/μl) was added. The mixture was then incubated
at 42˚C for 50 min, and finally heated to 70˚C for 15 min.

Materials and methods
40
2.8 – Semi-quantitative PCR
From these templates, cDNA encoding hPAI-1 and various human clock genes was
amplified using the conditions given below. A master mix was made containing: 10 ng
template DNA, 0.8 mM dNTP mix, 0.5 μM of each primer (Invitrogen), 10 μl Reaction
buffer (ABgene, Epsom, UK), 75 mM Tris-HCl pH 8.8, 20 mM (NH4)2 SO4, 0.01% v/v
Tween 20), 1.5 mM MgCl2 (ABgene), 0.05 U/μl Taq polymerase (ABgene), water to a
final volume of 20 μl.
Each cycle consisted of:
94˚C for 1 min
59˚C for 1 min
72˚C for 2 min
The number of cycles used for each gene and with the different samples is discussed in
the results section 3.2.1.1, and details of each set of primers are given in table 1.1. The
PCR products were loaded on to a 2% agarose gel (MP Biomedicals, London, UK)
made with 1x Tris-Acetate-EDTA (TAE, 40 mM Tris/Acetate, 1 mM Na2EDTA), and
then subjected to electrophoresis at 80V for 45 min, after which the image of each band
was recorded using the Genesnap imaging system and programme (Syngene,
Cambridge, UK). The intensity of the PCR products on the gel was determined using
the Genetool programme (Syngene). The mRNA level for each target gene was
calculated relative to the 18S housekeeping gene, and then standardized to the 0 h
samples.

Materials and methods
41
GeneRegion
amplified Primers (5΄ to 3΄)
GC Content
(%)
Melting Tempertaure
(˚C)
18s +1349 to +1548 GTGGAGCCATTTGTTTGGTTa 50 55.5
CGCTGAGCCAGTCAGTGTAGb 60 57.5
Pai-1 Set 1 +627 to +1081 TGCCCTCTACTTCAACGGCC a 60 60.7
Pai-1 Set 2 +657 to +1081 CAACGGCCAGTGGAAGACTCa 60 58.3
CTTGGTCTGAAAGACTCGTGAAGb 47.8 55.4
Dec1 +575 to +1037 GCTGGTGAGCTGTCAGGGAa 63.2 59.7
CTTGCTTAATTGCGCCGATb 47.4 54
Bmal2 +489 to +801 GAGATCTTTAAAAGGCTTGACAa 36.4 50.7
CAAACCAGTTTTGGCATCTATTb 36.4 51.8
Bmal1 +511 to +853 CCACTGACTACCAAGAAAGCATa 45.5 54.9
CCATCTGCTGCCCTGAGAb 61.1 57.1
mPer2 +950 to +1246 CCGGAAAAGCCACGAGAATGa 55 56.5
CTGTCACTAGGGTGGAGCTGb 60 57.1
Clock +1103 to +1421 CATGCTTCCTGGTAATGCTAa 45 52.3
CTCTGAATGTTCCCCTTCTGb 50 52.7
Table1.1 – Primer sequence used to amplify Pai-1 and various clock genes in semi-quantivative PCR.The regions amplified with a positive number show downstream sequences with respect to transcription start site. Where aSense and bAnti-sense strands. Pai-1 primer sets 1 and 2 share the same anti-sense primer.

Materials and methods
42
2.9 – Quantitative (real time) PCR
Pai-1 mRNA expression was also measured by quantitative real-time PCR to validate
the results obtained from semi-quantitative PCR, using a light cycler machine (Applied
Biosystems, California, USA). Two types of chemistry were used to detect PCR
products.
TaqMan (also known as fluorogenic 5΄ nuclease activity),
SYBR Green I dye.
The TaqMan chemistry uses a fluorogenic probe to enable the detection of a specific
PCR product as it accumulates during PCR cycles. The SYBR green chemistry uses
SYBR Green I dye, a highly specific, double-stranded DNA binding dye, to detect PCR
products as they accumulate during PCR cycles. The most important difference between
the TaqMan and SYBR green I dye chemistries is that SYBR green I dye will detect all
double-stranded DNA, including non-specific reaction products, where the Taqman
probe are gene-specific.
PCR amplification for the SYBR green method was performed with PCR MasterMix
(Applied Biosystems) containing the target primers for 18s and Pai-1 details are given
in table 1.2), Hot Star Taq DNA polymerase, SYBR Green and PCR buffer. Samples
using SYBR green chemistry were subjected to an initial denaturation step at 50°C for 2
min then at 95°C for 10 min, followed by 40 PCR cycles each, comprised 95°C for 45 s,

Materials and methods
43
59°C for 45 s and 72°C for 45 s, finally a dissociation step of 95°C for 15 s, 60°C for 15
s and 95°C for 15 s was added to allow any non-specific products to be detected.
The TaqMan method was performed using a PCR MasterMix (Applied Biosystems)
containing the target probes (18S and PAI-1), Hot Start Taq DNA polymerase, TaqMan
and PCR buffer. The 18S TaqMan probe was derived from GenBank ID X03205 and
the TaqMan probe for Pai-1 was produced from GenBank ID M16006 binding onto
exons 2 and 3. All samples were analysed in triplicate. The TaqMan method also
involved an initial denaturation step at 50°C for 2 min then 95°C for 10 min, followed
by 40 PCR cycles each compromising of 95°C for 15 s, 60°C for 1 min.
As Pai-1 and 18s mRNA were amplified, the increase in fluorescence was measured in
real time. The threshold cycle, which is defined as the cycle number at which the
fluorescence reaches 10 x the standard deviation of the baseline, was calculated and the
relative gene expression of Pai-1 was calculated in comparison to 18s. A similar set-up
was used for the controls except that the reverse transcriptase was omitted and no PCR
products were detected under these conditions.
2.10 – Genotyping
To determine the polymorphism in the promoter of the gene for Pai-1, blood samples
were taken from the same healthy volunteers used for monocyte isolation. Genomic
DNA was isolated from blood cells using FlexiGene method (Qiagen, Crawley, United
Kingdoms). The process firstly involved mixing 10 ml buffer FG1 (lysis buffer) with 4

Materials and methods
44
ml of whole blood in a 50 ml centrifuge tube, which was then centrifuged for 5 min at
3000 rpm. The supernatant was discarded, and 2 ml buffer FG2 (denaturation buffer)
and protease were added into the tube. The sample was then incubated in a water bath at
65˚C for 10 min. After the incubation step, 5 ml isopropanol (100%) was mixed in the
tube for DNA precipitation. The mixture was then centrifuged for 3 min at 3000 rpm,
the supernatant discarded, and 5 ml ethanol (70%) was added to wash the DNA. Again,
the mixture was centrifuged for 3 min at 3000 rpm, and the supernatant discarded.
Finally, 1 ml buffer FG3 (hydration buffer) was pipetted into the tube, and the DNA
was dissolved for 1h at 65˚C in a water bath.
Using the genomic DNA as template, PCR reactions were set up to amplify the region –
534 to –811 in the Pai-1 promoter using a combination of forward primer (5΄-
ATACGCGTAAGCTTTTACCATGGTAAC-3΄) and reverse primer (5΄-
CCCAACAGCCACAGGGCATGC-3΄). The PCR conditions used in these reactions were
as described in section 2.8 with 30 cycles. A master mix was made containing: 100 ng
template DNA, 0. 8mM dNTP mix, 0.5 μM of each primer, 10 μl Reaction buffer (7
5mM Tris-HCl pH 8.8, 2 0mM (NH4)2 SO4, 0.01% v/v Tween 20), 1.5 mM MgCl2, 0.05
U/μl Taq polymerase, water to a final volume of 100 μl.
The resulting amplicons were subjected to gel electrophoresis for verification, and then
extracted using QIAquick Gel Extraction Kit (Qiagen). The DNA fragment from the gel
was excised, and weighed. The slice of gel was incubated with buffer QG
(solubilization and binding buffer, 3 volumes to 1volume of gel) at 50˚C for 10 min.
Once the gel slice was completely dissolved, 1 gel volume of isopropanol was added to
Materials and methods
45
the sample. The DNA was applied to the QIAquick column, and centrifuged for 1 min.
The flow-through was discarded, and another 0.5 ml of buffer QG was added to the
column, and centrifuged for 1 min. The DNA was washed by adding 0.75 ml of buffer
PE (ethanol), and centrifuged for 1 min. The flow-through was discarded, and the
column was then centrifuged for an additional 1 min at 13,000 rpm. The DNA was
eluted by placing the column in a clean 1.5 ml microcentrifuge tube with the addition of
50 of buffer EB (10 mM Tris-HCl, pH 8.5), and centrifuged for 1 min.
The identities of all resulting purified PCR products were sequenced using the
automated sequencing facility at the Protein and Nucleic Acid Chemistry Laboratory
(PNACL) located in the University of Leicester.
2.11 – Enzyme-Linked Immunosorbent Assay (ELISA)
To prepare plasma samples, CTAD tubes containing whole blood from healthy donors
were centrifuged at 3000 rpm at 20°C for 30 min. The plasma was then transferred into
a new 1.5 ml microtube and a second centrifugation was applied at 10,000 rpm for 15
min. The plasma was pipetted into a clean 1.5 ml microtube and stored at -80ºC until
analysed by enzyme-linked immunosorbent assay (ELISA).
In these experiments, ELISA (Hyphen BioMed, Neuville-sur-Oise, France) is used to
detect the level of PAI-1 in a sample of plasma. It utilises two antibodies, which are
specific to PAI-1, one on the solid phase and the other coupled to an enzyme (horse
radish peroxidise). The ELISA procedure consisted of firstly, restoring PAI-1 standard

Materials and methods
46
with 2 ml of F-sample diluent (SD) and PAI-1 control I + II in 1ml water. These
samples were then diluted with SD; where the PAI-1 control I + II was diluted 1:5, and
the PAI-1 standards were diluted to produce a set a control of known concentration
from 0 ng/ml to 10 ng/ml. Simulated samples were diluted 1:10 with SD, so that the
PAI-1 concentrations were in the optimal range of detection by the ELISA kit.
After preparing the dilutions, 100 μl SD was pipetted into each well, along with either
100 μl of the control, standards or sample on the plate. The mixture was then placed on
a plate shaker for 2 min. The plate was left to incubate for 2 h at room temperature
followed by 5 successive washings with washing buffer. Next, 200 μl immunoconjugate
(IC) added into each well and left to incubate for a further hour, which was again
followed by 5 successive washings. 200 μl TMB (peroxidise substrate, 3,3',5,5' -
tetramethylbenzidine) was then added to each well and left to incubate for 5 min. To
stop the reaction, 50 μl sulphuric acid (0.45 M) was pipetted into each well with a
further incubation at room temperature for 10 min. The absorbance was then measured
on a plate reader at 450 nm.
2.12 – Preparation of Thrombi in Vitro
Two systems were used to produce thrombi in vitro, the Chandler loop and
Thromboelastometry (TEM).

Materials and methods
47
2.12.1 – Chandler Loop
The Chandler Loop system (Chandler, 1958) consists of a cylinder that is rotated at an
angle 30° to the horizontal at 12 revolutions per minute. The cylinder has a diameter of
10 cm and a length of 5cm. The cylinder base is 12 cm in diameter as to give a lip of 1
cm around the base onto which the Chandler loops can be mounted.
Figure 2.1 – Setup of Chandler loop modelThrombi formed in Chandler loop mimics human arterial thrombi. This is achieved through the movement of the blood, which is rotated in non-sterile tubing at 10 rpm for 2 h.
Thrombus
Whole blood with FITC-Fibrinogen
Loop rotating at 10rpm
Tubing

Materials and methods
48
The non-sterile tubing (internal diameter of 3.0 mm, external diameter of 4.2 mm;
Protex Limited) was prepared by cutting into 45 cm in length. Blood was taken into
citrated tubes from the same volunteers as used in the previous studies. 900 µl of this
citrated blood was then recalcified with 100 µl of 0.25 M CaCl2, and mixed together
with 150 µl 0.9% saline, 50 µl FITC-Fibrinogen (preparation of FITC-Fibrinogen
explained later in section 2.12.1.1). This mixture was then gently added to the tubing, to
avoid the introduction of air bubbles, the two ends of the tube were joined to form an
enclosed loop using a short section of tubing (4.2 mm diameter) to form a cuff. The
loop was then mounted onto a cylinder and rotated for 2 h at 10 r.p.m, at room
temperature. After this time the clot was removed from the tube and washed with Hanks
Buffer, it was then blotted and weighed, and then placed in 1.5 ml of Hanks buffer in a
microtube (warmed to 37°C). The clot was then left to incubate for 24 h at 37°C and
then weighed. To measure fibrinolysis, 1 ml of supernatant from the microtube was
transferred into a cuvette and analysed on the spectroflurophotometer. The detection of
FITC-fibrinogen was carried out using the wavelengths 495 nm (excitation) and 525 nm
(emission).
2.12.1.1 – Preparation of FITC-fibrinogen
A column was prepared by pre-swelling Sephadex (Sigma-Aldrich) in water for 24 h at
4°C. It was then layered gently into the column so not to form bubbles, and washed with
phosphate buffered saline (PBS, Sigma-Aldrich). Fibrinogen (Sigma-Aldrich) was
diluted to 1 mg/ml with 0.1 M sodium carbonate and dialysed for 24 h, at 4°C. FITC
(Sigma-Aldrich) was then prepared to a concentration of 10 mg/ml with dimethyl
Materials and methods
49
sulphoxide (DMSO). To conjugate fibrinogen with FITC 1 mg/ml of fibrinogen was
added to a bijou, along with 10 ng/ml of FITC solution. The FITC/fibrinogen mixture
was then wrapped in aluminium foil and placed on a rotary stirrer for 2 h at room
temperature. To separate the bound and free FITC, the FITC/fibrinogen mixture was
layered onto the sephadex Gb column with the addition of PBS. The first yellow band
was collected (FITC-fibrinogen), leaving behind a brighter yellow band which was
unbound FITC. FITC-fibrinogen ratio was measured on spectrophotometer.
2.12.2 – Thromboelastography
Thromboelastography (TEG) is a technique used to assess the haemostatic properties of
whole blood. TEG measures the forces within a blood sample as it clots. As clotting
initiates, fibrin strands form, binding platelets and blood cells together. Physically, this
alters the elastic shear and torque forces of the blood sample. An alternative version is
the rotation thromboelastometry (designated as TEM in the present study), in which the
sensor shaft rather than the cup which rotates (ROTEM; Pentapharm GmbH, Munich,
Germany).
300 µl of citrated whole blood was taken from the same donors as used in previous
experiments and mixed with 25 µl 0.25M CaCl2 for the initiation of clotting, and 5 µl
0.175 µg tPA to enhance fibrinolysis. A pin (sensor), suspended on torsion wire was
lowered into the sample. The pin is fixed on the tip of a rotating shaft which is guided
by a ball bearing system. The shaft rotates back and forth (+/- 4.75°; cycle time 10/min).
It is connected with a spring for the measurement of elasticity. As blood clots, fibrin

Materials and methods
50
Light Source
DetectorSpring
Rotating axis(+/- 4.75°)
Ball bearing
Fibrin strandsand platelet aggregates
Cuvette with blood
Plastic pin
Heated cuvette holder
strands form between the pin and the clotting blood. The pin is therefore subjected to
the changes in elastic shear experienced in the clot. These changes acting on the pin are
detected by an optical detection system, which transmit the measurements to a computer
for processing. Through TEM, several clot formation parameters were recorded
including clotting time (CT), clot formation time (CFT) and maximal clot firmness
(MCF). Fibrinolysis as measured in TEM represents the size of thrombi after 60
minutes from when the MCF was detected.
Figure 2.2 – Setup of the TEM systemThe rotation of the pin in the cup of blood allows for the detection of both thrombosis and thrombolysis. As the clot forms, the resistance of pin movement increases. However, lysis of the clot results in decreased resistance of pin rotation. The differential resistance on pin rotation is measured through an optical detection system, and ultimately processed by a computer.

Materials and methods
51
2.13 – Statistical analysis
Data in this thesis are expressed as mean±SEM. GraphPad prism was employed for all
the statistical analysis. ANOVAs were used (one and two-way) to analyse the data,
together with appropriate a posteriori tests.

Chapter 3
Regulation of monocyte Pai-1 mRNA
and protein expression

Regulation of monocyte Pai-1 mRNA and protein expression
52
3.1 - Introduction
Monocytes are a major cell type in the initiation and propagation of a developing
thrombus. During thrombosis, monocytes interact with platelets and thereby become
incorporated into a thrombus. Previous studies have demonstrated the production of
PAI-1 by monocytes subjected to an inflammatory stimulus (Hamilton et al. 1993;
Lundgren et al. 1994), however, it is unknown whether monocytes are capable of
synthesising PAI-1 in conditions associated with thrombosis. This section of the report
examines the regulation of monocyte Pai-1 mRNA and protein expression by activated
platelets, and the role of direct cell to cell contact compared to soluble mediators in
provoking this response. Furthermore, this section also investigated whether the 4G/5G
polymorphism was involved in mediating monocyte Pai-1 in response to aggregating
platelets.
3.2 - Results
3.2.1 - Activated platelets induce PAI-1 expression in monocyte
To determine whether the platelets induce Pai-1 expression in monocytes, whole blood
was taken at 9 am (±10 min) and incubated with cross-linked collagen related peptide
(CRP-XL) to stimulate platelets, controls consisted of monocytes with
lipopolysaccharide (LPS) or left untreated at 37°C. Pai-1 mRNA expression was
determined by real-time PCR in extracted monocytes for 1.5-24 h (Fig. 3.1). The
concentration of CRP-XL used was 500ng/mL, which has been shown by others in the

Regulation of monocyte Pai-1 mRNA and protein expression
53
lab to maximally stimulate platelets as measured by monocyte platelet aggregate
formation. Use of the platelet-specific agonist CRP-XL ensured that monocytes
themselves were not directly activated. The mRNA level for Pai-1 was calculated
relative to the 18s housekeeping gene from the same cDNA. The data was standardized
against the 0 h sample and log transformed. Analysis of variance (ANOVA) revealed
significant Agonist (F(2,60) = 27.11, P < 0.001), Time (F(4,60) = 181.22, P < 0.001) effects,
and A x T (F(8,60) = 8.09, P < 0.001) interactions, indicating that the type of agonist and
time points interact in their effect on monocyte Pai-1 mRNA levels. Furthermore,
Bonferroni tests showed that stimulation of monocytes with CRP-XL resulted in a
statistically significant rise in the abundance of Pai-1 mRNA in monocytes compared to
samples at baseline, in all time points, increasing 200-fold at 1.5 h (P < 0.001) and
reaching maximum expression at 4 h (5500-fold, P < 0.001), followed by a modest
reduction at 6 h (4700-fold, P < 0.001), and falling to 1300-fold (P < 0.001) by 24 h. In
contrast, Pai-1 expression only reached statistical significant at 24 h (386-fold, P <0 .01)
in monocytes incubated with LPS. In these tests, the stimulation by CRP-XL or
activated platelets clearly provoked a larger response in monocyte Pai-1 expression as
compared with that of LPS. Consistent with Pai-1 mRNA expression, ANOVA of PAI-
1 antigen data (Fig. 3.1) gave highly significant effects for Agonist (F(2,108) = 38.59, P <
0.001), Time (F(4,108) = 153.99, P < 0.001) and A x T interactions (F(8,108) = 39.96, P <
0.001), demonstrating that the type of agonist and time points interact in their effect on
monocyte PAI-1 protein levels. Bonferroni tests revealed CRP-XL stimulated whole
blood produced significant higher levels of PAI-1 antigen in comparison to monocytes
in resting conditions. Induction of PAI-1 antigen was seen at 1.5 h (55 ng, P < 0.001),
increased further at 4 h at 65 ng (P < 0.001), followed by a modest reduction

Regulation of monocyte Pai-1 mRNA and protein expression
54
Figure 3.1 – Effect of CRP-XL and LPS on Pai-1 mRNA and protein expression in monocytes (n=6).The time course of CRP-XL and LPS induced Pai-1 mRNA (A) and protein (B) expression determined by real time PCR. Values were normalised to 18s, expressed as mean ± SEM fold over baseline (time 0) and log transformed. Both the induction of Pai-1 mRNA and protein is dependent on time and agonist. **P < 0.01 vs. unstimulated monocytes (control). Two-way ANOVA was used for statistical analysis.
0 1.5 4 6 24 0 1.5 4 6 24 0 1.5 4 6 240.0
2.5
5.0
7.5
10.0 ControlCRP-XLLPS
**
** **
****
A
Time (h)
Pa
i-1
mR
NA
ex
pre
ss
ion
log
(fo
ld i
nc
rea
se
)
0 1.5 4 6 24 0 1.5 4 6 24 0 1.5 4 6 240.0
0.5
1.0
1.5
2.0
2.5
3.0
3.5
4.0
4.5 ControlCRP-XLLPS
** ** ** **
B
Time (h)
PA
I-1
anti
gen
lev
ello
g (
ng
/ml)
**

Regulation of monocyte Pai-1 mRNA and protein expression
55
at 6 hrs (60ng, P < 0.001), and slight increase after 24 hrs (67ng, P < 0.001). PAI-1
antigen levels only significantly differed at 6 h (13 ng, P < 0.01) in LPS stimulated
samples.
3.2.2 – Platelet-induced PAI-1 in monocytes does not require cell-cell contact
To investigate if platelets could up-regulate monocyte PAI-1 expression without direct
cell-cell binding, Pai-1 expression was examined in monocyte taken from whole blood
that was stimulated with CRP-XL in the presence or absence of Mab 9E1, which
inhibits P-selectin binding to P-selectin glycoprotein ligand-1 (PSGL1), hence
suppressing the binding between platelets and monocytes. The final concentration of
Mab 9E1 used (25 µg/mL) had been shown to abolish monocyte platelet aggregate and
the 4h time point was chosen because, as demonstrated previously, maximal Pai-1
induction was seen at this time. The percentage of monocytes with adherent platelets
was determined by flow cytometry performed in whole blood. Events positive for both
CD14 and CD42b demonstrated monocyte platelet aggregate and single monocytes
were shown as CD14 positive but CD42b-negative events. For logistical reasons, the
flow cytometry analyses were performed by Tina James (Department of Cardiovascular
Sciences).
Mixing monocytes with platelets activated by CRP-XL resulted in platelets binding to
≥70% of monocytes (Fig. 3.2, ANOVA for Treatment F(2,12) = 29.27, P = 0.0008; for
Time F(2,12) = 28.14, P < 0.0001; for TM x T interaction F(4,12) = 48.66, P < 0.0001).
This tethering of monocytes and platelets was abolished by the addition of Mab

Regulation of monocyte Pai-1 mRNA and protein expression
56
0.0 1.5 4.00
20
40
60
80CONCRP-XLCRP-XL + 9E1
A
****
**
Time (h)
Per
cen
tag
e o
fm
on
ocy
te w
ith
bo
un
dp
late
lets
0.0 1.5 4.00
1
2
3
4
5
6
7
8
9CONCRP-XLCRP-XL+9E1
B
***
Time (h)
Pa
i-1
mR
NA
ex
pre
ss
ion
log
(fo
ld i
nc
rea
se
)
Figure 3.2 – Prevention of platelet-monocyte aggregate resulted in increased up-regulation of Pai-1 expression in monocytes (n=3).Whole blood was incubated with CRP-XL in presence or absence of Mab 9E1 1.5-4 h., which inhibited the interaction of P-selectin and PSGL-1. Mab 9E1 prevented the adherence of platelets to monocytes, as shown by flow cytometery, values are shown as mean ± SEM and arcsin transformed (A). Pai-1 mRNA expression determined by real time PCR, values were normalised with 18s, expressed as mean ± SEM and log transformed (B). *P < 0.05 and **P < 0.001 vs. unstimulated monocytes (control), †P <0.05 vs. CRP-XL alone. Two-way ANOVA was used for statistical analysis.

Regulation of monocyte Pai-1 mRNA and protein expression
57
9E1. As found previously, monocyte Pai-1 expression was induced significantly after 4
h (P < 0.05) stimulation with CRP-XL (Fig. 3.2, Agonist (F(2,12) = 8.58, P = 0.0174),
Time (F(4,12) = 9.14, P = 0.0013). Furthermore, this induction was further enhanced in
the presence of Mab 9E1 (P < 0.01 at 4 h). These results demonstrate that there is a
positive regulation of monocyte PAI-1 by platelets, not requiring cell-cell contact, and
that the PSGL-1 signal may be inhibitory.
3.2.3 – Platelet releasate stimulates monocyte Pai-1
To explore the importance of soluble mediators in the regulation of monocyte Pai-1,
platelets were activated by incubation with 50µg/mL of CRP-XL at 37°C for 10 min.
The activation time of 10 min was chosen because as shown in later chapter, most of
PAI-1 and presumably other soluble mediators, were released by this time. After
incubation, the platelet releasate was collected and used to treat isolated MNC
preparations for 4 h at 37°C. Monocytes were then isolated and measured for Pai-1
expression. As shown in figure 3.3, the platelet releasate promoted significant
accumulation of Pai-1 transcript after 4 h of incubation. This is additional evidence that
products rapidly released by platelet degranulation provide a sufficient signal to up-
regulate monocyte Pai-1 expression.
3.2.4 – Role of TGF-β1 secreted by platelets in monocyte Pai-1 induction
Growth factors and cytokines are stored in considerable amounts in platelet α-granules,
and are released following platelet activation. The contribution of individual mediators

Regulation of monocyte Pai-1 mRNA and protein expression
58
released from granules was assessed by the use of inhibitors that target specific
signalling pathways. Releasates were incubated with neutralising antibodies to TGF-β1
and interleukin-1β (IL-1β) for 10mins at a final concentration of 100 µg/mL and 1
µg/mL respectively. The concentration of both antibodies used had been shown by the
Figure 3.3 – TGF-β1 released by platelets mediates Pai-1 mRNA in monocytes (n=6). Neutralising antibodies to IL-1β and TGF-β1 were incubated with platelets releasates stimulated with CRP-XL. Monocytes were then exposed to this pre-treated platelets releasates. Pai-1 mRNA expression determined by real time PCR Values were normalised with 18s and expressed as mean ± SEM. **P < 0.01 vs. platelet releasate. One-way ANOVA was used for statistical analysis.
0
100
200
300
400
500
CRP-XL-stimulated whole bloodPlatelet releasatePlatelet releasate + antiTGF-1Platelet releasate + antiIL-rTGF-1
**
Pa
i-1
mR
NA
ex
pre
ss
ion
(fo
ld i
nc
rea
se
)

Regulation of monocyte Pai-1 mRNA and protein expression
59
manufacturer to inhibit TGF-β1 and IL-1β at the concentrations present in platelets. The
platelet releasate was then subsequently added to monocytes for 4 h at 37°C (Fig. 3.3).
Blocking mAb to IL-1β did not affect Pai-1 transcript levels.
In contrast, incubation of monocytes with blocking mAb to TGF-β1 significantly
reduced Pai-1 expression by >80% (P < 0.01). These results suggest TGF-β1 is the
principle mediator for platelet-induced monocyte Pai-1 expression.
To determine if TGF-β1 alone is sufficient to induce monocyte Pai-1 expression,
monocytes were exposed to recombinant TGF-β1 (rTGF-β1) for 4h at 37°C (Fig. 3.3).
Final concentration of rTGF-β1 used was 0.4 ng/ml, and the manufacture demonstrated
that this concentration rTGF-β1 exerts is greatest activity. It was found that rTGF-β1
increased Pai-1 expression in monocytes, albeit at a lower level as that seen in
monocytes incubated with platelet releasates.
Taken together, the data suggest that TGF-β1 can alone cause the induction of
monocyte Pai-1 expression, but may act in concert with other mediators released from
activated platelets to exert its full effect.
3.2.5 – P-selectin directly induces Pai-1 expression mediated by the release of TGF-
β1
Although blocking the binding of platelet P-selectin to monocyte PSGL-1 did not
inhibit platelet-induced monocyte Pai-1 expression, whether P-selectin can initiate

Regulation of monocyte Pai-1 mRNA and protein expression
60
monocyte Pai-1 expression was examined. Monocytes were incubated for 4 h with 20
µg/mL recombinant P-selectin fused to the Fc region of human IgG1 (rP-Selectin/Fc
chimera; Fig. 3.4). Peak activity was shown by the manufacture of rP-selectin at this
concentration. P-selectin acts by binding to PSGL-1 expressed on the surface of
monocytes. It was found that Pai-1 expression increased in monocytes exposed to rP-
Selectin/Fc chimera, although, previously seen with rTGF-β1, induction of Pai-1
expression by rP-Selectin, the level was significantly lower than when monocytes with
stimulated with platelet releasate (P < 0.01). These experiments indicate that P-Selectin
alone is sufficient to induce monocyte Pai-1 expression, but the platelet must also
present one or more signalling molecules to elicit the full response.
To investigate the mechanism responsible for the induction of Pai-1 expression in
monocyte by P-Selectin, MNCs were incubated with 20 µg/mL of rP-Selectin together
with the neutralizing antibody to TGF-β1 at a concentration of 100 µg/mL (Fig. 3.4). It
was found that the blocking mAb to TGF-β1 significantly inhibited P-Selectin-induced
monocyte Pai-1 expression (P < 0.01), suggesting that the up-regulation of monocyte
PAI-1 expression by P-selectin is predominantly via TGF-β1, released by the
monocytes via activation through PSGL-1 signalling.
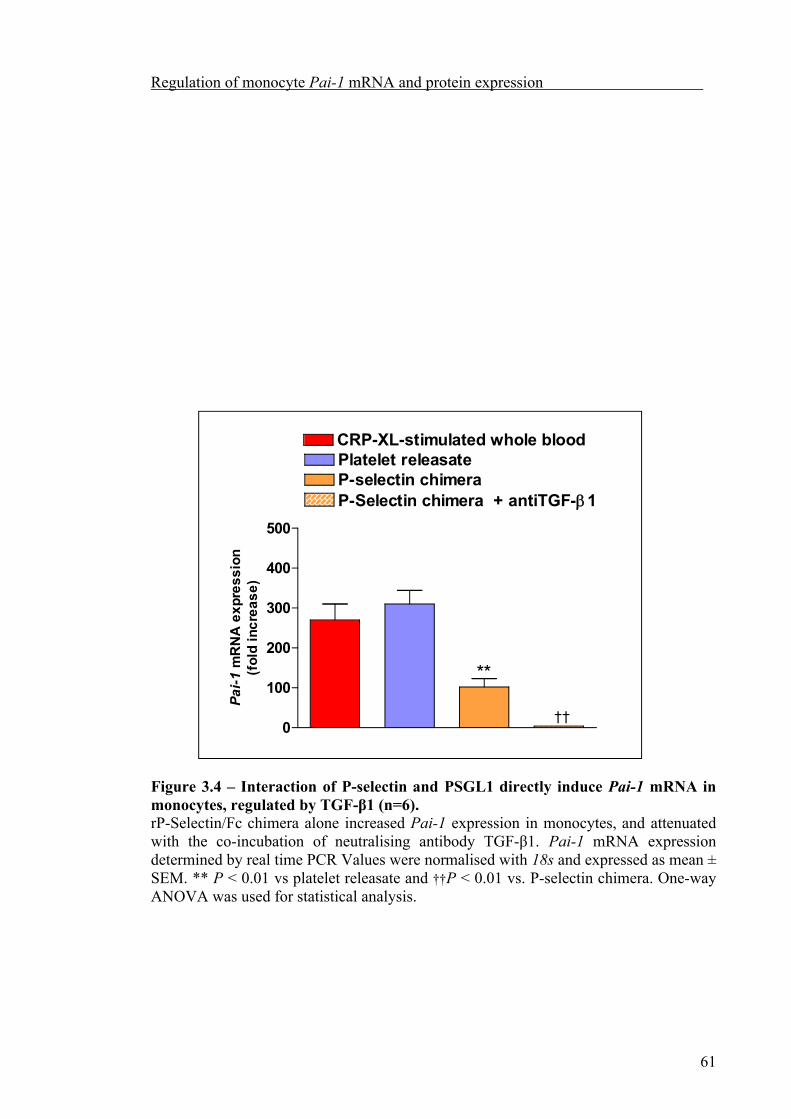
Regulation of monocyte Pai-1 mRNA and protein expression
61
Figure 3.4 – Interaction of P-selectin and PSGL1 directly induce Pai-1 mRNA in monocytes, regulated by TGF-β1 (n=6). rP-Selectin/Fc chimera alone increased Pai-1 expression in monocytes, and attenuated with the co-incubation of neutralising antibody TGF-β1. Pai-1 mRNA expression determined by real time PCR Values were normalised with 18s and expressed as mean ± SEM. ** P < 0.01 vs platelet releasate and ††P < 0.01 vs. P-selectin chimera. One-wayANOVA was used for statistical analysis.
0
100
200
300
400
500
CRP-XL-stimulated whole bloodPlatelet releasateP-selectin chimeraP-Selectin chimera + antiTGF-1
**
††
Pa
i-1
mR
NA
ex
pre
ss
ion
(fo
ld i
nc
rea
se
)

Regulation of monocyte Pai-1 mRNA and protein expression
62
3.2.6 – Incubation of isolated monocytes for 4 h was sufficient to attenuate Tgf-β1
gene expression
To examine if the binding or soluble mediators released by activated platelets induced
monocyte Tgf-β1 mRNA expression, monocytes stimulated by platelet releasates and P-
selectin chimera were utilised (section 3.2.3 and 3.2.5). It was observed that the
incubation of monocytes with PBS alone was sufficient to inhibit Tgf-β1 gene
expression (Fig. 3.5, P < 0.01). Similar down regulation was seen in the presence of
platelet releasates (P < 0.01) or P-selectin chimera (P < 0.01) on the monocyte Tgf-β1
gene. These results suggest that the primary level of control may not be the regulation
of expression of Tgf-β1 mRNA, but in the regulation of both the secretion and activation
on latent forms of TGF-β1.

Regulation of monocyte Pai-1 mRNA and protein expression
63
0
2
4
6
8
10
12
T0
Platelet releasateP-selectin chimera
T4
** **
**
Rel
ativ
eT
gf-1
mR
NA
exp
ress
ion
Figure 3.5 – Incubation of monocytes for 4 h was sufficient to down-regulatemonocyte Tgf-β1 expression (n=6).The incubation of monocyte with PBS buffer for 4 h (T4) was sufficient down-regulate Tgf-β1 expression. Soluble mediators released by CRP-XL activated platelets and P-selectin chimera alone did not influence the suppression of Tgf-β1 expression. Tgf-β1mRNA expression determined by real time PCR Values were normalised with 18s and expressed as mean ± SEM. **P < 0.01 vs. T0 (monocytes at basal conditions). One-wayANOVA was used for statistical analysis.
Regulation of monocyte Pai-1 mRNA and protein expression
64
3.2.7 – Genotyping of the PAI-1 promoter
DNA was isolated from blood cells taken from healthy volunteers. PCR reactions were
set up using the genomic DNA as template to amplify the Pai-1 promoter region. The
PCR products were purified and then sequenced using the automated sequencing facility
at the Protein and Nucleic Acid Chemistry Laboratory located in the University of
Leicester. The resulting chromatogram was then analyzed to determine the genotype of
the healthy volunteers (Fig. 3.6). In the chromatogram, 4G/4G homozygous subjects
were identified when four guanine bases were located in the promoter polymorphism
site. Four guanine bases with an overlapping adenine base at the end, and five guanine
bases were recognized as 4G/5G heterozygotes and 5G/5G homozygous genotype
respectively. Of the 22 people who were genotyped, 10 were 4G/4G homozygous, 11
were heterozygous and 1 was 5G/5G homozygous. Since only one 5G homozygous
individual was found, it was not viable to carry out experiments on this group, hence
further examination in the regulation of Pai-1 by the polymorphism was carried out on
4G homozygous and 4G/5G heterozygous subjects.
3.2.8 – Influence of the polymorphism in whole blood stimulation
The induction of monocyte Pai-1 in whole blood stimulation (as described in section
2.3.1) was analysed for the influence of the 4G/5G polymorphism. The level of PAI-1 in
stimulated whole blood was calculated by taking away the contribution made by plasma.
The expression of Pai-1 mRNA did not differ significantly between the

Regulation of monocyte Pai-1 mRNA and protein expression
65
A
B
C
Figure 3.6 – Chromatograms of genotypingHealthy volunteers were genotyped for the 4G/5G Pai-1 polymorphism. The black arrows indicate the site at which the polymorphism is located. From studying the chromatograms, each volunteer was assigned as either 4G/4G genotype (panel A), 4G/5G genotype (panel B) or 5G/5G genotype (panel C).
Regulation of monocyte Pai-1 mRNA and protein expression
66
genotypes in unstimulated monocytes at any time point (Fig 3.7, Genotype F(1,16) = 0.25,
ns; Time F(4,12) = 8.58, P < 0.0001). This was also true for monocytes stimulated with
CRP-XL (Genotype F(1,16) = 0.11, ns; Time F(4,16) = 99.77, P < 0.0001) or LPS
(Genotype F(1,16) = 0.53, ns; Time F(4,16) = 90.92, P < 0.0001). By contrast, the level of
PAI-1 antigen in the plasma from 4G homozygous subjects was found to be greater then
that seen in heterozygous subjects, (Fig. 3.8, Genotype F(1,32) = 41.48, P = 0.0002; Time
F(4,32) = 18.38, P < 0.0001). This significant genotype difference was also observed in
whole blood stimulated with LPS (Genotype F(1,32) = 8.29, P = 0.0206; Time F(4,32) =
31.34, P < 0.0001) and CRP-XL (Genotype F(1,32) = 5.55, P = 0.0463; Time F(4,32) =
437.91, P < 0.0001). It therefore appears that the 4G/5G polymorphism regulates the
production of PAI-1 by monocytes, but not its mRNA expression.
To test whether the induction of monocyte Pai-1 by the platelet secretome is dependent
of the promoter polymorphism, the experiment performed in section 3.2.3 was
examined in relation to the genotype (Fig. 3.9). Monocytes from 4G/4G heterozygous
subjects expressed higher Pai-1 levels than 4G/5G homozygous subjects (180-fold and
151-fold respectively), however the difference was not statically significant. The
influence of the polymorphism on specific mechanism of induction of monocyte Pai-1
was also investigated. Experiments carried out on the effect of rTGF-β1 and rP-selectin
(as described in section 3.2.4 and 3.2.5 respectively) were also analysed in relation to
the polymorphism. As seen previously for platelet releasate, Pai-1 expression was found
to be elevated in monocytes originating from 4G homozygous volunteers in comparison

Regulation of monocyte Pai-1 mRNA and protein expression
67
Figure 3.7 – Effect of genotype on Pai-1 mRNA expression in whole blood (n=6, 3 of each genotype).The experiments carried out for the induction of whole blood was re-analysed to examine the influence of PAI-1 genotype on monocyte Pai-1 mRNA expression. Nonesignificant difference in Pai-1 transcript level was observed in unstimulated monocytes, monocyte stimulated by either activated platelets, or LPS at all time points between 4Ghomozygous (red) and heterozygous subjects (blue). Two-way ANOVA was used for statistical analysis.
Control
0.0 1.5 4.0 6.0 24.00123456789
1011
4G/4G4G/5G
Time (hrs)
Pa
i-1
mR
NA
ex
pre
ss
ion
log
(fo
ld i
nc
rea
se
)
CRP-XL
0.0 1.5 4.0 6.0 24.00123456789
1011
4G/4G4G/5G
Time (hrs)P
ai-
1 m
RN
A e
xp
res
sio
nlo
g (
fold
in
cre
as
e)
LPS
0.0 1.5 4.0 6.0 24.00123456789
1011
4G/4G4G/5G
Time (hrs)
Pa
i-1
mR
NA
ex
pre
ss
ion
log
(fo
ld i
nc
rea
se
)

Regulation of monocyte Pai-1 mRNA and protein expression
68
Figure 3.8 – Effect of genotype on PAI-1 protein release in whole blood (n=6, 3 of each genotype).The experiments carried out for the induction of whole blood was re-analysed to examine the influence of PAI-1 genotype on monocyte PAI-1 protein expression. Whole blood originating from 4G homozygous subjects (red) expressed statistically higher protein levels than heterozygous subjects (blue) in resting conditions. Significant differences in PAI-1 protein level were also observed in whole blood stimulated by either activated platelets, or LPS. Baseline level of PAI-1 was subtracted from stimulated whole blood. *P < 0.05 and **P < 0.01 vs heterozygous subjects. Two-way ANOVA was used for statistical analysis.
0.0 1.5 4.0 6.0 24.00
1
2
3
4
54G/4G4G/5G
CRP-XL
**
Time (h)P
AI-
1 an
tig
en le
vel
log
(n
g/m
l)
0.0 1.5 4.0 6.0 24.00
1
2
3
4
5 4G/4G4G/5G
Control
** ** ** ** **
Time (h)
PA
I-1
anti
gen
leve
llo
g (
ng
/ml)
0.0 1.5 4.0 6.0 24.00
1
2
3
4
54G/4G4G/5G
LPS
******
*
Time (h)
PA
I-1
anti
gen
leve
llo
g (
ng
/ml)
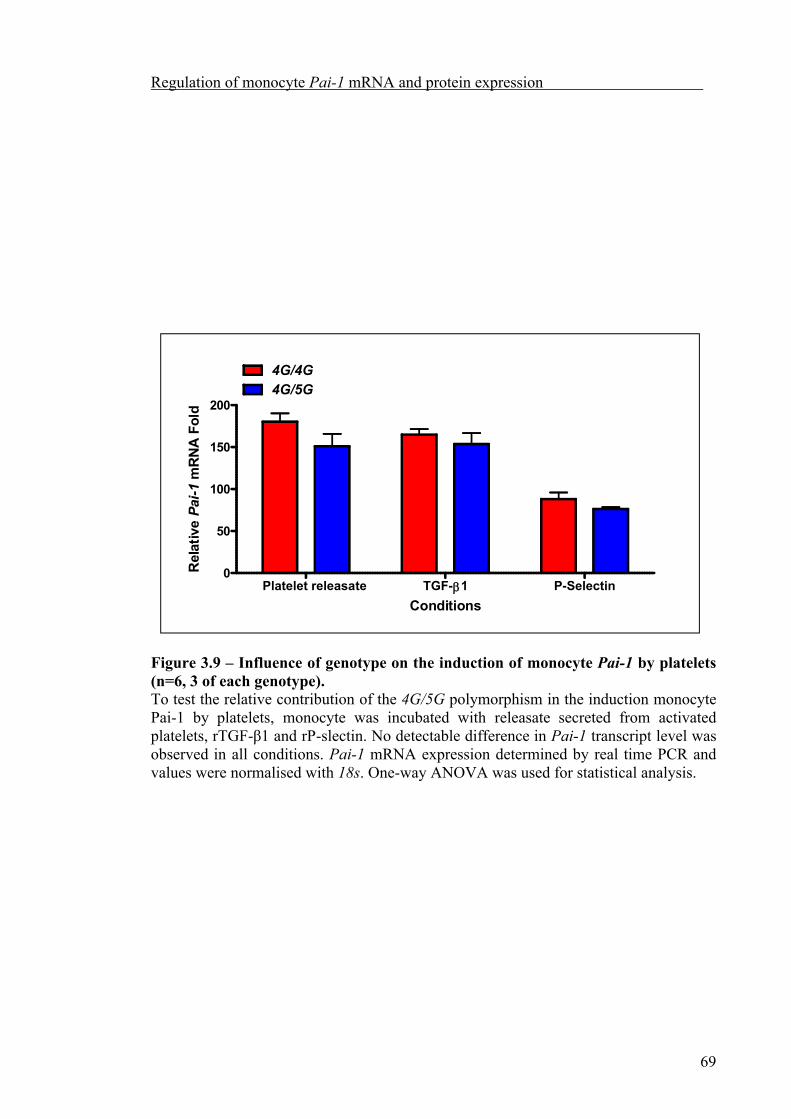
Regulation of monocyte Pai-1 mRNA and protein expression
69
Platelet releasate TGF-1 P-Selectin0
50
100
150
200
4G/4G4G/5G
Conditions
Rel
ativ
eP
ai-1
mR
NA
Fo
ld
Figure 3.9 – Influence of genotype on the induction of monocyte Pai-1 by platelets (n=6, 3 of each genotype).To test the relative contribution of the 4G/5G polymorphism in the induction monocyte Pai-1 by platelets, monocyte was incubated with releasate secreted from activated platelets, rTGF-β1 and rP-slectin. No detectable difference in Pai-1 transcript level was observed in all conditions. Pai-1 mRNA expression determined by real time PCR and values were normalised with 18s. One-way ANOVA was used for statistical analysis.

Regulation of monocyte Pai-1 mRNA and protein expression
70
to heterozygous volunteers (165-fold compared 153-fold and 88-fold against 76-fold
respectively), but not in a statically significant manner. Hence, the promoter
polymorphism does not appear to play a role in the regulation of monocyte PAI-1
induced by either platelets or LPS.
3.2.9 – Diurnal variation in plasma PAI-1
To confirm that plasma PAI-1 displays time and genotype-dependent variation, whole
blood was taken from 10 volunteers (five 4G homozygtes and five heterozygotes) at two
time points; 9 am and 4 pm. The time points were chosen based on previous studies
demonstrating PAI-1 levels oscillates between these two time points (Andreotti and
Kluft 1991). Total PAI-1 antigen levels in plasma were measured by ELISA. ANOVA
of data showed that plasma PAI-1 levels exhibited diurnal variation that was associated
with the 4G/5G polymorphism, (Genotype F(1,8) = 6.39, P = 0.0354; Time F(1,8) = 13.92,
P = 0.0058; T x G interactions F(1,8) = 10.93, P = 0.0108, suggesting that the type of
genotype and time points interact in their effect on monocyte PAI-1 antigen levels),
with statically significant genotype differences observed in the morning time point (Fig.
3.10, P < 0.01). These results confirm that circulating PAI-1 levels in the donors within
the current study displays circadian variation which is related to the 4G/5G
polymorphism.

Regulation of monocyte Pai-1 mRNA and protein expression
71
3.2.10 Evidence for circadian variation of Pai-1 mRNA in whole blood
Whole blood was taken from 7 subjects, (three 4G/4G homozygous and four 4G/5G
heterozygous), at 9 am (morning) and 9 pm (night). The time points were chosen in
accordance to previously published data on the diurnal rhythms of PAI-1 levels found in
plasma. The extraction of blood was carried out on 2 different days to confirm the
consistency of the experiment. At each time point, RNA was extracted from the blood
cells (carried out by Veryan Codd, Department of Cardiovascular Sciences). Expression
of Pai-1 was investigated using a TaqMan probe for PAI-1 in real-time PCR. Since the
circadian oscillations of plasma PAI-1 has been found to be dependent upon the 4G/5G
polymorphism, whole blood data was also examined for the influence of the genotype.
Significant genotype effect on Pai-1 expression in whole blood was detected (Fig. 3.11,
Genotype F(1,4) = 14.69, P = 0.0186; Time F(1,4) = 10.54, P = 0.0315), which was
dependent on time (T x G interactions F(1,4) = 93.84, P = 0.0006). Elevated levels of
Pai-1 expression was observed in 4G/4G homozygous subjects compared to 4G/5G
heterozygous donors in the morning (P < 0.01). The effects of genotype on Pai-1
expression appear to dampen in the evening time point. These data indicate that Pai-1
expression in blood cells under basal conditions is regulated by both the circadian clock
and the 4G/5G polymorphism.

Regulation of monocyte Pai-1 mRNA and protein expression
72
AM PM0
10
20
30
40A
Time of day
PA
I-1
(ng
)
AM PM0
10
20
304G/4G4G/5G
B**
Time of day
PA
I-1
(ng
)
Figure 3.10 – Diurnal variation in plasma PAI-1 (n=10, 5 of each genotype).Whole blood was taken from 10 volunteers at 9 am (AM) and 4 pm (PM), 5 of 4G/4Ghomozygous (red) and 5 of heterozygous origin (blue). (A) Variation in plasma PAI-1 levels between morning and evening time points are shown for each subject, values expressed as mean ± SEM. (B) PAI-1 levels in the plasma display diurnal variation which was dependent upon the 4G/5G polymorphism. ** P < 0.01 vs heterozygous subjects. Two-way ANOVA was used for statistical analysis.

Regulation of monocyte Pai-1 mRNA and protein expression
73
AM PM0.0
0.5
1.0
1.5
2.0
2.5
3.0
3.5
P < 0.34A
Time
Rel
ativ
eP
ai-1
mR
NA
exp
ress
ion
AM PM0.0
0.5
1.0
1.5
2.0
2.5
3.0
3.5
4G/4G4G/5G
B
**
Time
Rel
ativ
eP
ai-1
mR
NA
exp
ress
ion
Figure 3.11 – Expression of Pai-1 in whole blood is influenced by both the circadian clock and promoter polymorphism (n=7, 4G/4G = 3, 4G/5G = 4).Whole blood was taken from three 4G homozygous (red) and four heterozygous subjects (blue) at 9 am (AM) and 9 pm (PM). (A) Variation in Pai-1 expression between morning and evening time points are shown for each subject, with values expressed as mean ± SEM. (B) The abundance of Pai-1 transcript displayed a genotype dependent diurnal variation. Pai-1 mRNA expression determined by real time PCR. Values were normalised with 18s. * P<0.01 vs heterozygous subjects. Two-way ANOVA was used for statistical analysis.

Regulation of monocyte Pai-1 mRNA and protein expression
74
3.3 – Discussion
3.3.1 – Induction of monocyte Pai-1 expression following platelet activation
In respect of the vasculature, previous reports have reported and focused on the up-
regulation of PAI-1 by endothelial cells. To our knowledge, this is the first report to
demonstrate the ability of activated platelets to induce PAI-1 expression in human
monocytes. The present study demonstrated that monocyte PAI-1 expression was only
rapidly induced by activated platelets stimulated by CRP-XL or through GPVI receptors.
The time course of Pai-1 mRNA and protein induction was transient, peaking at 4 h and
declined when incubation time was prolonged to 24 h. These data suggest that the newly
induced inhibitor equips monocytes for an immediate response that is self-limiting in
time. This temporal profile is similar to that reported for Cyclo-oxygenase-2 (Cox-2)
expression in monocytes stimulated by activated platelets (Eligini et al. 2007). CRP-XL
is a synthetic peptide that mimics the triple-helical structure of collagen and, when
stabilized by cross-linking, activate platelets through the glycoprotein VI (GPVI)
receptor (Morton et al. 1995), but does not activate monocytes on its own. LPS
(lipopolysaccharide from gram negative bacteria) on the other hand represents an
inflammatory stimulus (present during infections like sepsis) that acts through a Toll-
like receptor 4 (TLR4) on the monocyte surface. It was shown that Pai-1 expression
was minimally affected by LPS, however protein expression was up-regulated. Previous
reports have shown LPS to negatively regulate PAI-1 both at mRNA and protein levels
(Lungren et al, 1994; Eggesbo et al, 1995; Ritchie et al, 1995). The discrepancy may be
attributed to the advances in the different techniques, as the sensitivity of the methods
Regulation of monocyte Pai-1 mRNA and protein expression
75
has increased over time. In addition, this study examined monocytes in whole blood
rather than in isolated preparations. The data demonstrate that expression of Pai-1
mRNA and PAI-1 protein by monocytes is much more responsive to a thrombotic
stimulus compared to an inflammatory stimulus, which is confirmed by Farruggia et al.
(Farruggia et al., Blood, in press) using the same experimental method but analysis was
carried out using Illumina genome-wide-arrays. These data suggest that the PAI-1
produced by monocytes may play an important role in thrombosis, possibly in
stabilising the developing thrombus.
3.3.2 – Role of TGF-β1 and P-selectin in the regulation of monocyte PAI-1 by
platelets
In this study, a mechanism is described through which platelets regulate monocyte PAI-
1 production. The importance of soluble mediators released by activated platelets in this
induction was highlighted since blocking the attachment of platelets to monocytes via
P-selectin did not inhibit the induction of PAI-1 in monocytes. In fact, blocking platelet-
monocyte aggregation appears to lead to increased Pai-1 expression, which would
suggest that direct interaction has an inhibitory effect. Cell to cell contact has been
shown as essential for chemokine synthesis and Cox-2 expression in platelet-monocyte
aggregates (Weyrich et al. 1996; Dixon et al. 2006). In this report, an increase in PAI-1
expression was observed when monocytes were exposed to releasates of activated
platelets, without the requirement of cell to cell contact. This positive paracrine
regulation, not requiring cell-cell contact, has also been observed in other report for
Cox-2 regulation (Eligini et al. 2007).

Regulation of monocyte Pai-1 mRNA and protein expression
76
Platelet secretome is made up of >300 different type of proteins (Coppinger et al. 2004),
of the possible soluble mediators, two were chosen which have been demonstrated to
regulate PAI-1 levels. Since IL-1β has been shown to induce PAI-1, and this cytokine is
reportedly synthesised by thrombin-activated platelets, it was anticipated that this would
play a role when platelets were activated by CRP-XL. TGF-β1 is present in large
amounts in α-granules of platelets and is the richest source of TGF-β1 in humans
(Assoian et al.1983). PAI-1 has been demonstrated to be up-regulated by TGF-β1 in a
variety of cell types (Fitzpatrick and Graham 1998; Buisson et al. 1998; Dong-Le
Bourhis et al. 1998; Treichel et al. 1998), but most notably in endothelial cells both in
vitro and in vivo (Saksela et al. 1987; Dong et al. 1996) hence may also function to
regulate monocyte PAI-1. Neutralising antibodies to TGF-β1 blocked platelet-induced
Pai-1 expression by >80% (P <0.01), but antibodies to IL-1β had no effect, leading to
the hypothesis that TGF-β1 is the physiologically relevant mediator of PAI-1 induction
by activated platelets. This hypothesis was supported by the finding that rTGF-β1 alone
induced monocyte Pai-1 expression. However, rTGF-β1 induced monocyte Pai-1
expression was less apparent than platelet releasates, suggesting that either the
concentration rTGF-β1 was insufficient or that mechanisms may contribute to increase
Pai-1 expression in monocytes exposed to releasates.
P-selectin presented by platelets not only mediates cell-cell contact but modifies, and
may directly induce, functional responses in monocytes. This was evident when rP-
selectin was observed to directly induced monocyte Pai-1 expression. Here, rP-selectin
may induce the secretion of TGF-β1 by monocytes, which in turn act to up-regulate Pai-
1 expression in an autocrine system. This was demonstrated when monocyte Pai-1

Regulation of monocyte Pai-1 mRNA and protein expression
77
expression was significantly attenuated by the neutralising antibody to TGF-β1, before
the monocytes were exposed to rP-selectin. Nagata and co-workers (1994, 1993)
reported that thrombin-stimulated platelets cause superoxide anion generation by
neutrophils and monocytes, and Yeo et al. (1994) found that neutrophils shed L-selectin,
upregulate MAC-1, and polarize when they adhere to activated platelets. In these reports
the leukocyte responses were inhibited by antibodies directed against P-selectin. This is
the first study to show that blocking the interaction of activated platelets to monocyte
via P-selectin-PSGL1 enhanced monocyte gene expression, suggesting that P-selectin
may inhibit monocyte Pai-1 expression, and therefore have opposite effects to TGF-β1.
The results so far suggest that TGF-β1 is involved in mediating monocyte PAI-1
expression in response to the binding of activated platelets. One possible mechanism of
increasing local TGF-β1 levels is that the binding between stimulated platelets and
monocytes increases the expression of monocyte Tgf-β1. However, the current data
demonstrated the opposite since a down-regulation of Tgf-β1 expression was observed
in monocytes incubated alone. This result may not be as surprising as first thought, in
fact, the down-regulation of monocyte TGF-β1 expression without any stimulation
suggest the sensitivity of this mechanism. In monocytes under basal conditions, TGF-β1
appears to be highly expressed which is consistent with the findings by other groups
(Kitamura et al. 1996; Letterio et al. 1998). High TGF-β1 expression would prepare the
monocytes for an acute response following stimulation. Once the monocytes are
activated, the immediate response is to release available TGF-β1, and inhibits its
production, as suggested by the current study. This system allows the creation of a
mechanism to prevent the over production of TGF-β1. This mechanism is widely used

Regulation of monocyte Pai-1 mRNA and protein expression
78
by key genes which are constitutively expressed such as the cardiac specific gene MyoD
(Montarras, et al. 1989). Since TGF-β1 is stored in the latent, biological inactive form
and released upon stimulation, this leads to the question of how the latent TGF-β1
released by both platelets and monocytes is converted to the active form in the current
model. Analysis of data produced from microarray experiments investigating the gene
expression of monocytes stimulated by CRP-XL (Farruggia et al., Blood, in press)
identified increased expression of Thrombospondin-1 (TSP-1, THBS-1). TSP-1 was
markedly up-regulated in monocytes stimulated by activated platelets compared to
monocyte stimulated by LPS. This molecule can convert latent TGF-β1 (released by
both platelets and monocytes) to its active confirmation (Lawrence 1996; Ribeiro et al.
1999; Schultz et al. 1999). Physiologically, an interesting question emerges in regard to
why this mechanism of converting latent TGF-β1 to its active state exists in this context,
would it not be faster for the monocyte to produce active TGF-β1, and by past this
mechanism? The possible explanation is that TGF-β1 regulates so many different
physiological functions, a tight regulation is necessary to prevent it from acting on
different pathways, and this conformational regulation of TGF-β1 also ensures that
TGF-β1 released by platelets and monocytes only acts upon cells in the local vicinity.
3.3.3 – Regulation of monocyte PAI-1 by the 4G/5G polymorphism
Of the subjects genotyped, a low prevalence of 5G allele was observed, with just a
single volunteer homozygous for the 5G/5G genotyped. Additionally, this only 5G/5G
donor had an irregular sleep pattern, making them relatively unsuitable to investigate
the influence of the 5G/5G genotype on PAI-1 expression. Therefore experiments

Regulation of monocyte Pai-1 mRNA and protein expression
79
compared 4G/4G homozygous subjects against 4G/5G heterozygous subjects. Previous
studies have shown that PAI-1 levels in plasma are higher in 4G homozygous subjects
compared to the other 2 genotypes, which have similar levels, suggesting that donors
carrying only the one 5G allele is sufficient to exert the effect of lowering PAI-1 levels.
Therefore findings from heterozygous subjects should be similar to that of 5G
homozygous subjects. The donors in this study showed a higher bias for the 4G allele
compared to the 5G allele, which is not consistent with previous reports showing equal
prevalence for the 4G and 5G allele in the European population (Matsubara et al. 1999;
Hermans et al. 1999; Loktionov et al. 2003). This can be explained by the small number
in the sample size.
The extent at which the activated platelets induced monocyte Pai-1 expression was the
same for both 4G/4G homozygous and 4G/5G heterozygous subjects in whole blood or
isolated monocyte preparations. Previous reports have shown an effect of 4G/5G
polymorphism on PAI-1 production in stimulated endothelial cells (McCormack et al.
1998; Roncal et al. 2004). As the number of subjects in the investigation was relatively
small, the power of the study may be limited. Another possibility is that the 4G/5G
polymorphism is cell specific and only regulates PAI-1 in certain cell types. In contrast,
the production of PAI-1 antigen in whole blood was associated with the 4G/5G
polymorphism. The differential regulation of monocyte PAI-1 mRNA and protein
expression may be due to the insensitive measure of protein levels in these experiments
because of the presence of plasma and platelets, which can contribute to PAI-1 antigen
levels.

Regulation of monocyte Pai-1 mRNA and protein expression
80
The production of PAI-1 antigen is not exclusive to monocyte alone in whole blood.
Another cell type within this system is also capable of secreting PAI-1, specifically the
platelets. The regulation of platelet PAI-1 will be examined in later chapter (section 5),
but it is worth noting that platelets contain large amount of PAI-1 within their α-
granules, which is released upon activation. Since the platelets are activated in this
model system, it is possible that the PAI-1 protein produced in stimulated whole blood
may originate from platelets. Hence, the influence if the polymorphism on PAI-1
protein may be regulated through platelets rather than monocytes. However, the
secretion of PAI-1 protein by whole blood incubated with LPS would suggest that PAI-
1 protein is dependent upon the 4G/5G polymorphism, as LPS directly stimulates the
monocytes without activating the platelets.
The likely scenario is the expression of PAI-1 protein by stimulated monocytes is
regulated by the 4G/5G polymorphism, and this differential regulation is exacerbated in
whole blood with contribution from platelets in samples incubated with CRP-XL.
Assuming that the release of PAI-1 protein from stimulated monocytes is dependent on
the 4G/5G polymorphism, and monocyte Pai-1 expression is independent of the
genotype, it becomes intriguing to examine the mechanism involved in the differential
regulation of mRNA abundance and protein expression. Analysis of the 3′ UTR of Pai-1
gene reveals conservation that is usually seen in microRNA (miRNA) targets. miRNA
are short, single stranded RNAs (~20 nucleotides) processed from ~70 nucleotides,
genomically encoded primary transcripts that potently inhibit gene expression from
target mRNAs. Although their mechanism of action is unclear, it involves base-pairing
between the mRNA 3′ UTR and miRNA 5′ end, leading to translational inhibition

Regulation of monocyte Pai-1 mRNA and protein expression
81
and/or increased mRNA degradation and/or mRNA sequestration (Nilsen 2007).
Computer programmes such as RNAhybrid (Krüger and Rehmsmeier 2006), measure
the properties of the Pai-1 mRNA structure confirm that it could be a possible target of
miRNA. The 4G/5G polymorphism maybe associated with miRNA gene, so that
miRNA may make mRNA produced by one allele less stable then the other, leading to
more/less protein manufactured.
3.3.4 – Regulation of monocyte PAI-1 by the circadian clock
Previously, circadian expression of PAI-1 antigen was documented in human plasma of
4G/4G homozygous subjects, with higher levels during the day than night (Margaglione
et al. 1998a). Consistent with these observations, the present study demonstrated diurnal
variation in circulating PAI-1 antigen and expression of the Pai-1 gene in unstimulated
leukocytes. Since PAI-1 expression has only been reported in monocytes in a leukocyte
population, these data indicate that monocyte PAI-1 expression is regulated by the
circadian clock. However, whether the expression of monocyte Pai-1 mRNA is directed
by the circadian clock system has not been directly demonstrated. In the present study,
it was observed that one donor from the heterozygous group was found to not fit this
trend, as the Pai-1 expression for this volunteer was higher in the morning compared to
the evening. The reason for this abnormal expression pattern was revealed from data by
others in the lab (Very Codd, personal communication) measuring clock gene
expression in the same subjects. This volunteer showed a reverse mPer2 gene
oscillation in comparison to others in the heterozygous group, which may affect the

Regulation of monocyte Pai-1 mRNA and protein expression
82
circadian expression of Pai-1. These observations support the idea that PAI-1 in
monocytes under resting conditions is under the regulation of the circadian clock system.
3.4 – Conclusion
To conclude, the present study shows that monocytes play a role in thrombosis by the
expression of PAI-1. During the progression of a developing thrombus, platelet
activation would lead to release of a large number of soluble factors including growth
factors and cytokines. These platelet-derived factors can stimulate other blood cells
including monocytes. Specifically, TGF-β1 released by platelets following activation
can stimulate monocytes to release TGF-β1 increasing the local level, and inducing the
expression of monocyte PAI-1. In general, the findings in this section support the view
that the interaction of monocytes with platelets products within the vasculature may
establish a gene expression profile, in order for the cells to co-ordinate response to
injury in terms of thrombosis. As a possible clinical application, altering the level of
TGF-β1 local to the site of thrombosis may be a good avenue to lowering the level of
PAI-1, thus enhancing fibrinolysis.
The present study has provided evidence that Pai-1 mRNA in whole blood, under
physiological conditions, exhibits diurnal variation which is dependent on the promoter
4G/5G polymorphism. Data in this section suggests that the acute induction of whole
blood cells is also regulated by the 4G/5G polymorphism. Since induction monocyte
Pai-1 transcript appear not to be influenced by the polymorphism, other cell types
(especially platelets) in whole blood may contribute the genotype differences observed

Regulation of monocyte Pai-1 mRNA and protein expression
83
for PAI-1 antigen. However, if the differential regulation PAI-1 levels by the
polymorphism were of monocyte origin, miRNA is a possible regulatory mechanism by
affecting the stability of Pai-1 mRNA.
3.5 – Future Work
As a result of the present study, a number of questions has arisen that could be
investigated in future work.
(i) Activity of monocyte PAI-1
In the experiments preformed to measure the level of PAI-1 produced by monocytes, the
ELISA method used detected total PAI-1 antigen. This was to allow for the comparison
of monocyte Pai-1 transcript and PAI-1 protein expression. However, it is
acknowledged that the PAI-1 pool produced by stimulated monocytes, may contain
active and latent (bound to either tPA or Vn) forms. The relative contribution of
monocyte PAI-1 could be further elucidated with the use of an assay that was specific
for active PAI-1.
(ii) Measurement of PAI-1 antigen from isolated monocytes
Data in the present study suggest that PAI-1 produced by monocytes is associated with
the 4G/5G polymorphism. To confirm this finding, monocytes could be isolated from
whole blood and stimulated with various agonists such as platelet releasate and rTGF-
Regulation of monocyte Pai-1 mRNA and protein expression
84
β1. The resulting PAI-1 antigen produced can be detected with ELISA, and analysed for
the influence of the polymorphism.
(iii) Mechanism of induction of monocyte PAI-1 by TGF-β1
Data from this section concluded TGF-β1 is the main mediator of monocyte PAI-1
induction by activated platelets. The detailed mechanism by which TGF-β1 up-regulates
monocyte PAI-1 remains to be explored and a possible signal could be MAP-kinase as
shown previously in another cells. To elucidate the role of MAP-kinase activation in
PAI-1 induction by both platelet releasates and TGF-β1, monocytes could be pre-
incubated with compounds that inhibit ERK1/2, p38 and c-jun N-terminal kinase. These
include PD98059, SB203580 and SP600125 respectively. Other kinase that have been
demonstrated to be involved in the signalling of PAI-1 gene expression include
Rho/Rho-kinase, which could be inhibited with Y-27632.
(iv) TSP-1 levels in the regulation of monocyte PAI-1 expression
The regulation of latent TGF-β1 to the active confirmation may play a role in the
regulation of monocyte PAI-1 expression. As discussed earlier, a possible protein
involved in converting the confirmation of TGF-β1 is TSP-1. Since TSP-1 was found to
be up-regulated in monocytes stimulated by activated platelets, it may play an important
role in the regulation of monocyte PAI-1. This hypothesis could be examined by
measuring monocyte TSP-1 protein to confirm that the protein is up-regulated by

Regulation of monocyte Pai-1 mRNA and protein expression
85
activated platelets. Then incubating neutralising antibodies to TSP-1 with platelets
releasates, and stimulate monocytes with the resulting mixture.
(v) The link between miRNA and 4G/5G polymorphism
It was observed that regulation of monocyte PAI-1 protein expression appears to be
influenced by the polymorphism, but independent for the accumulation of mRNA
abundance. A possibility lies with the stability of the mRNA transcript, and one
mechanism could be miRNA. The first step would be to find out the identity of miRNA
that specifically targets Pai-1 mRNA. Then HapMap could be utilised to further
investigate the possible influence of 4G/5G polymorphism and miRNA on monocyte
PAI-1 expression. HapMap is a haplotype map of the human genome, which describes
the common patterns of human genetic variations. Associations with 4G/5G
polymorphism and haplotype of miRNA gene may be examined using this procedure.

Chapter 4
Peripheral circadian clock in resting
and stimulated monocytes

Peripheral circadian clock in resting and stimulated monocyte
86
4.1 – Introduction
A significant finding from the previous chapter was the importance of activated platelets
in the regulation of monocyte PAI-1 expression. Furthermore, TGF-β1 released upon
platelet degranulation appears to mediate the induction of PAI-1 expression in
monocytes. Pai-1 gene contains three SBE (bound by Smad proteins elements) between
two E-box elements. It was demonstrated by Hua et al. (1999) that the second E-box
(located at -599) was essential for the activity of Pai-1 promoter in conferring TGF-β
induced transcription (discussed in section 1.9.1). Moreover, data from our group
(Chong et al. 2006) has shown that both E-boxes are important in the transactivation of
Pai-1 promoter by CLOCK:BMAL2 heterodimer. Since Smad proteins can interact with
different transcription factors, it is possible that SMADs may interact with the
CLOCK:BMAL2 heterodimer at the SBE and E-box sites, and create a circadian-
dependent PAI-1 response to TGF-β1. This section of the report examined whether
peripheral circadian clock exits in monocytes, and how biological clock may be
influenced in monocytes stimulated through inflammatory or thrombotic stimuli.
4.2 – Results
4.2.1 – The expression of clock genes in monocytes under basal conditions
To examine the mRNA transcript abundance of the core clock genes in unstimulated
monocytes, clock gene mRNA expression was measured by semi-quantitative PCR in
isolated monocytes under resting conditions.

Peripheral circadian clock in resting and stimulated monocyte
87
Bmal2 Dec1 Bmal1 mPer2 Clock0.0
2.5
5.0
7.5
10.0
Rel
ativ
e m
RN
A e
xpre
ssio
n
Figure 4.1 – Expression of core clock genes in monocytes under resting conditions (n=8). The gene expression of Bmal2 (red), Dec1 (green), Bmal1 (blue), mPer2 (purple) and Clock (orange) was measured in isolated monocytes under basal conditions at 9 am, with semi-quantitative PCR. Values were expressed as ratio to 18s transcript abundanceand shown as mean ± SEM.
Peripheral circadian clock in resting and stimulated monocyte
88
The relative abundance of the clock gene transcripts are expressed as a ratio to the 18s
control gene (Fig. 4.1). The expression of all clock genes examined was detected in
monocytes under basal conditions. Bmal1 produced the highest mRNA expression (5.2-
fold), the least measured was Dec1 expression (0.7-fold), and the expression of Clock,
mPer2, Bmal2 fell between these two genes (3.1-fold, 2.2-fold, 1.5-fold respectively).
4.2.2 – The effect of CRP-XL and LPS on the clock gene Bmal2 expression over
time
The expression of Bmal2 was investigated in monocytes extracted from stimulated
whole blood, performed in section 3.2.2 (Fig. 4.2). Bmal2 mRNA abundance was
elevated after 4 h incubation in all samples and declined at 24 h. Levels of expression
were low in controls (maximum 1.6-fold at 4 h). CRP-XL did not appear to induce
Bmal2 expression over and above that seen in the unstimulated sample. In contrast,
Bmal2 expression was markedly increased in LPS treated samples, reaching maximum
expression after 4 h (18-fold). ANOVA revealed significant Time (F(4,48) = 6.76, P =
0.0002) and Agonists effect (F(2,48) = 4.37, P = 0.0375), and T x A interactions (F(8,48) =
4.50, P = 0.0004), indicating that the type of agonist and time points interact in their
effect on monocyte Bmal2 mRNA levels.
The expression of all the clock genes examined except for Bmal2 was investigated by
semi-quantitative PCR. However, Bmal2 mRNA abundance was measured by using
both semi-quantitative and real time PCR to compare the results produced from the two
PCR methods.

Peripheral circadian clock in resting and stimulated monocyte
89
0 1.5 4 6 24 0 1.5 4 6 24 0 1.5 4 6 2402468
1012141618202224
ControlCRP-XLLPS
Time (hrs)
Bm
al2
mR
NA
ex
pre
ss
ion
(fo
ld i
nc
rea
se
)
Figure 4.2 – Effect of CRP-XL and LPS on Bmal2 mRNA expression in monocytes (n=6). The time course of CRP-XL and LPS induced Bmal2 mRNA expression determined by real time PCR. Up-regulation of monocyte Bmal2 expression was seen in LPS stimulated samples (green), whereas CRP-XL (blue) did not appear to have induced Bmal2 expression over and above that seen in the unstimulated sample (red). Values were normalised with 18s and expressed as fold over baseline (time 0) with mean ± SEM. *P < 0.05 vs. unstimulated monocytes. Two-way ANOVA was used for statistical analysis.

Peripheral circadian clock in resting and stimulated monocyte
90
4.2.3 – Influence of CRP-XL and LPS on Clock gene expression
To examine the effect of LPS on the expression of other core clock genes in monocyte,
whole blood was incubated with LPS at 37°C and core clock gene mRNA expression
was determined by semi-quantitative PCR in extracted monocytes at time points 0 h, 1.5
h, 4 h. (Fig. 4.3). Of the genes studied only Dec1 (Agonists F(1,8) = 0.85, ns; Time F(2,8)
= 44.24, P < 0.0001; T x A interactions F(2,8) = 10.36, P = 0.006) and Bmal2 expression
(Agonist F(1,8) = 81.23, P = 0.0008; Time F(2,8) = 124.55, P < 0.0001; T x A interactions
F(2,8) = 67.82, P < 0.0001) were induced by LPS, demonstrating that LPS and time
points interact in their effect on monocyte Dec1 and Bmal2 mRNA levels. This
observation of Bmal2 expression is consistent with that seen in real-time PCR (section
4.2.2), indicating the results of semi-quantitative are valid. LPS stimulation produced a
statistically significant increase in Bmal2 mRNA abundance at maximal expression
after 4 h (13-fold P < 0.01). Dec1 was also elevated by LPS, becoming significant after
4 h (4-fold, P < 0.01). The expressions of mPer2 (Agonist F(1,8) = 64.20, P = 0.0013;
Time F(2,8) = 1.83, ns; T x A interactions F(2,8) = 1.33, ns) and Clock (Agonist F(1,8) =
106.96, P = 0.0005; Time F(2,8) = 7.04, P < 0.0172; T x A interactions F(2,8) = 0.57, ns)
in monocytes were significantly reduced with the treatment of LPS. After treating
monocytes with LPS for 1.5 h, a sharp decrease in Clock and mPer2 mRNA expression
could be observed (0.41-fold and 0.31-fold respectively), and levels remained below
baseline after 4 h. The addition of LPS to monocytes appear to have a insignificant
effect on Bmal1 mRNA expression

Peripheral circadian clock in resting and stimulated monocyte
91
0.0 1.5 4.00
2
4
6
8
10
12
14ControlLPS
Bmal2
**B
ma
l2 m
RN
A e
xp
res
sio
n(f
old
in
cre
as
e)
0.0 1.5 4.00
1
2
3
4
5ControlLPS
Dec1
**
Time (h)
De
c1
mR
NA
ex
pre
ss
ion
(fo
ld in
cre
as
e)
0.0 1.5 4.00
1
2
3
4
5
6ControlLPS
Bmal1
Time (h)
Bm
al1
mR
NA
ex
pre
ss
ion
(fo
ld i
nc
rea
se
)
0.0 1.5 4.00.0
0.2
0.4
0.6
0.8
1.0
1.2
1.4 ControlLPS
mPer2
Time (h)
mP
er2
mR
NA
ex
pre
ss
ion
(fo
ld i
nc
rea
se
)
0.0 1.5 4.00.00
0.25
0.50
0.75
1.00 ControlLPS
Clock
Time (h)
Clo
ck
mR
NA
ex
pre
ssi
on
(fo
ld in
cre
as
e)
Figure 4.3 – Effect of LPS on clock genes mRNA expression in monocytes (n=6).The time course for the expression of monocyte clock gene in response to LPS was determined by semi-quantitative PCR. The abundance of Bmal2 (red) and Dec1 (green) transcript increased in monocytes when incubated with LPS, the expression of mPer2(purple) and Clock (orange) was down-regulated, and Bmal1 (blue) expression was not affected. Values were normalised with 18s and expressed as fold over baseline (time 0)and shown as mean ± SEM. **P < 0.01 vs. unstimulated monocytes (control). Two-way ANOVA was used for statistical analysis.

Peripheral circadian clock in resting and stimulated monocyte
92
0.0 1.5 4.00.0
0.5
1.0
1.5
2.0
2.5
3.0
3.5
4.0
4.5ControlCRP-XL
Bmal2
Time (h)
Bm
al2
mR
NA
ex
pre
ss
ion
(fo
ld i
nc
rea
se
)
0.0 1.5 4.00
1
2
3
4
5
6
7
8ControlCRP-XL
Dec1
Time (h)
De
c1
mR
NA
ex
pre
ss
ion
(fo
ld i
nc
rea
se
)
0.0 1.5 4.00
1
2
3
4
5
6ControlCRP-XL
Bmal1
Time
Bm
al1
mR
NA
ex
pre
ss
ion
(fo
ld i
nc
rea
se
)
0.0 1.5 4.00.0
0.5
1.0
1.5
2.0
2.5ControlCRP-XL
mPer2
*
Time (h)
mP
er2
mR
NA
ex
pre
ss
ion
(fo
ld i
nc
rea
se
)
0.0 1.5 4.00.00
0.25
0.50
0.75
1.00 ControlCRP-XL
Clock
Time (h)
Clo
ck
mR
NA
ex
pres
sion
(fol
d in
cre
ase)
Figure 4.4 – Effect of CRP-XL on monocytes clock genes expression (n=6). The time course for the expression of monocyte clock gene in response to CRP-XL was determined by semi-quantitative PCR. Incubating monocytes with activated platelets resulted in the up-regulation of mPer2 expression (purple), and the down-regulation of Clock (orange). The other clock genes examined Bmal2 (red), Dec1 (green), Bmal1(blue) was unaffected by stimulated platelets. Values were normalised with 18s and expressed as fold over baseline (time 0) and shown as mean ± SEM. *P < 0.05 vs unstimulated monocytes (controls). Two-way ANOVA was used for statistical analysis.

Peripheral circadian clock in resting and stimulated monocyte
93
The mRNA abundance of monocyte Bmal1, Bmal2 and Dec1 appeared to be unaffected
by the stimulation of activated platelets (Fig. 4.4). The activation of monocytes via a
thrombotic stimulus caused a statically significant up-regulation of mPer2 expression
(Agonist F(1,8) = 23.65, P = 0.0083; Time F(2,8) = 2.53, ns; T x A interactions F(2,8) =
2.53, ns) and down-regulation of Clock expression (Agonist F(1,8) = 158.22, P = 0.0002;
Time F(2,8) = 6.30, P = 0.0227; T x A interactions F(2,8) = 0.72, ns). Following
stimulation of activated platelets, monocyte Clock expression acutely declined at 1.5 h
(0.25-fold) and maintained at this level after 4 h (0.25-fold). A summary of clock gene
profile in monocyte in response to LPS or CRP-XL can be found in table 4.1.
LPS CRP-XL
Bmal1
Bmal2
Dec1
mPer2
Clock
Table 4.1 – Summary of the clock gene expression in stimulated monocytesProfile of clock gene examined in monocytes stimulated with LPS or platelets activated by CRP-XL. An arrow pointing up depicts up-regulation, and an arrow pointing down symbolises down-regulation. Arrow pointing to the right in the table refers to no significant change in clock gene expression.

Peripheral circadian clock in resting and stimulated monocyte
94
4.2.4 – Platelet releasate stimulates monocyte mPer2
To test the hypothesis that soluble mediators released by activated platelets are
important in the induction of monocyte mPer2 expression, platelets were activated by
incubation with 50µg/mL of CRP-XL at 37°C for 10 mins. After incubation, platelet
releasate was collected and used to treat isolated lymphocyte preparations for 4 h at
37°C. Monocytes was then separated and measured for mPer2 expression (Fig. 4.5).
Incubation of monocytes with releasate secreted by activated platelets induced a
significant expression of mPer2 (3.2-fold, P <0.01). This data indicates that the release
of soluble mediators upon platelet activation is sufficient for the up-regulation of
monocyte mPer2.
4.2.5 – Role of TGF-β1 secreted by platelets in monocyte mPer2 induction
The mechanism which soluble mediators released by platelets conduct to increase
monocyte mPer2 expression was investigated using inhibitors to target specific
pathways. Releasates were incubated with neutralising antibodies to TGF-β1 and IL-1β.
The platelet releasate was then subsequently added to monocytes for 4 h at 37°C (Fig.
4.5). Antibody directed against TGF-β1 was utilised because TGF-β1 was found to be
an important mediator for the induction of monocyte PAI-1, hence it may play a role in
the induction monocyte mPer2 expression. Blocking mAb to IL-1β did not affect mPer2
levels. In contrast, incubation of monocytes with blocking mAb to TGF-β1 significantly
attenuated mPer2 expression by ~45% (P <0.01).

Peripheral circadian clock in resting and stimulated monocyte
95
Figure 4.5 – Soluble mediators released by activated platelets induce monocyte mper2 expression, partially mediated by TGF-β1 (n=6). Isolated monocytes were incubated with platelet releasates stimulated with CRP-XL. Platelet releasate was sufficient to induce monocyte mPer2 expression. Neuralising antibodies to IL-1β and TGF-β1 were incubated with platelets releasates. Monocytes were then exposed to this pre-treated platelets releasates. Antibody to TGF-β1 attenuated monocyte mPer2 expression. mPer2 mRNA expression determined by real time PCR Values were normalised with 18s and expressed as mean ± SEM. *P < 0.05vs. unstimulated monocytes (control) and †P < 0.05 vs. platelet releasate. One-way ANOVA was used for statistical analysis.
0
1
2
3
4
Unstimulated monocytesUnstimulated monocytes after 4 h incubation
CRP-XL-stimulated whole bloodPlatelet releasate
Platelet releasate antiTGF-1Platelet releasate antiIL-1rTGF-1
Rel
ativ
eP
er2
mR
NA
Fo
ld

Peripheral circadian clock in resting and stimulated monocyte
96
These results suggest TGF-β1 was required for platelet-induced monocyte mPer2
expression, however other mechanisms are also involved in the regulation.
To demonstrate the hypothesis monocytes were exposed to rTGF-β1 for 4 h at 37°C. It
was observed that rTGF-β1 alone was not sufficient to induce monocyte mPer2
expression. The data so far suggests that although TGF-β1 alone is not sufficient for the
induction of monocyte mPer2 expression, it may play a role with other signalling
pathways to regulate mPer2 expression.
4.3 - Discussion
4.3.1 – The regulation of circadian clock in monocytes
Previous studies have demonstrated that a circadian clock exists in leukocytes, showing
diurnal variation in the core clock genes. However, it remains to be elucidated whether a
peripheral clock exist in monocytes, and how it is influenced by inflammatory and
thrombotic stimuli. In the present study, first evidence is provided that clock gene
expression exists in human monocytes. Dec1 and Bmal2 expression was regulated in
monocytes treated with LPS, while mPer2 and Clock expression was down-regulated. It
is unknown whether these clock genes exhibit circadian oscillations in monocytes, and
hence are regulated by the circadian clock. Previous reports have demonstrated the
circadian expression of mPer2, Bmal1 and Dec1 in human peripheral blood cells
(Boivin et al. 2003; Teboul, et al. 2005; Fukuya et al. 2007) but it is unclear whether
Clock is expressed in a circadian manner. Takata et al. (2002) reported Clock mRNA

Peripheral circadian clock in resting and stimulated monocyte
97
exhibited no daily variation, while Takimoto et al. (2005) showing peak Clock
expression around midnight. Nevertheless, these reports indicate that clock genes in
human peripheral blood cells do exhibit at least some degree of circadian expression.
The response shown by monocyte to LPS suggests that inflammatory stimuli may over-
ride the circadian clock mechanism. This hypothesis is supported by a recent study
(Okada et al. 2008), showing LPS injection significantly suppressed the expression
levels of clock genes in both the SCN and liver of rats. Specifically, these authors found
that LPS produced early transient suppression of rPer1 and rPer2 in the liver, and rPer2
in SCN, and normalisation of the expression levels was noted the next day. Interestingly,
data from Murphy et al. (2007) has demonstrated that the administration of LPS results
in significant up-regulation of the core clock genes mPer2 and Bmal1 in equine blood.
However, the authors could not replicate these results when equine peripheral blood
mononuclear cells were treated with LPS. These results suggest that there are other
mechanisms, or cell types, involved in the regulation of the monocyte circadian clock,
and one possibility is platelets. The data in the present study found CRP-XL activated
platelets induced monocyte mPer2 expression, when incubated in whole blood.
Previous studies have demonstrated that the synchronization of the circadian clock in
the SCN is regulated partially by mPer2 expression (Challet et al. 2003). Assuming that
peripheral clocks function in the same manner, this raises the possibility that platelets,
following activation, can synchronize the circadian clock in monocytes. Furthermore,
the regulation of monocyte mPer2 expression appeared not to require cell to cell contact,
evident in the up-regulation of mPer2 expression when isolated monocytes were
exposed to releasates of activated platelets. Similar to the regulation of PAI-1 in the

Peripheral circadian clock in resting and stimulated monocyte
98
previous section, platelets appear to positively regulate mPer2 by a paracrine
mechanism. In contrast to PAI-1, neutralising antibody to TGF-β1 only partially
inhibited platelet-induced Per-2 expression by ~45% (P <0.01), together with the
finding that rTGF-β1 was not sufficient to increase Per-2 expression, indicates activated
platelets must present one of several signals that regulate monocyte mPer2.
In the previous section, the expression of PAI-1 by monocytes was found to be
predominantly through stimulation by activated platelets (mainly mediated by TGF-β1)
as opposed to LPS. TGF-β1 acts through Smad binding element (SBE), three of which
exist in the PAI-1 promoter. Hua et al. (1999) demonstrated that only two of the three
SBE, and more importantly the second E-box (located -566 to -559) are essential for
TGF-β-induced promoter activity. Furthermore, work carried out in this laboratory
showed the same E-box was important in BMAL2/CLOCK-induced transcription, with
90% of the BMAL2/CLOCK activation abolished when this E-box was mutated (Chong
et al. 2006). As a result the hypothesis that interaction may occur between clock genes
and inflammation/thrombotic stimulus in regulating Pai-1 expression has arisen. The
current data in this section suggests that circadian factors do not play a role in the
induction of monocyte PAI-1 by activated platelets. Most of the core clock genes were
found to be either unaffected or, in the case of Clock, down-regulated when monocytes
were stimulated by CRP-XL activated platelets. mPer2 is involved in the negative loop
within the circadian system, and we and others (Schoenhard et al. 2003; Chong et al.
2006) have shown mPER2 to inhibit activation of Pai-1 expression by clock factors,
hence the up-regulation of mPer2 is not directly involved in the acute induction of
monocyte Pai-1. However, the circadian clock cannot fully be discounted in the acute

Peripheral circadian clock in resting and stimulated monocyte
99
induction of monocyte PAI-1 until the same stimulation experiments have been carried
out at different times of day.
4.4 – Conclusion
The important finding in the present section was that monocytes do express genes of the
peripheral clock, which are modulated in response to inflammatory and thrombotic
stimuli. Platelets play important roles in both of these pathways. In thrombosis,
platelets adhere to the exposed subendothelium following injury to the vessel wall.
After tethering, rapid conversion to stable platelet adhesion is required for thrombus
formation. During inflammation, platelets mediate capture of monocytes and
neutrophils through P-selectin. A key molecular mechanism which platelets participate
in and is common to both pathways is the recruitment and interaction of leukocytes into
the thrombus. The regulation of several genes has been studied as a result of this
interaction including PAI-1 in the previous section. This study has found that platelets
have the potential to synchronise the circadian clock in monocytes. The significance of
this finding in respect to thrombus formation and inflammation remains to be elucidated,
however, the data raises the possibility that platelets may be the link between the
circadian clock, thrombosis and inflammation.
The previous section has shown that Pai-1 mRNA in leukocytes displays diurnal
variation under basal conditions which is dependent on the 4G/5G polymorphism. In
contrast, the data in the current section suggests that the acute induction of monocyte
PAI-1 by either inflammatory or thrombotic stimuli involves a more complicated

Peripheral circadian clock in resting and stimulated monocyte
100
mechanism. Under these conditions, the induction of both monocyte Pai-1 transcript
and PAI-1 antigen is independent of the circadian clock.
4.5 – Future work
To explore and validate the studies carried out in this section, a number of
investigations could be carried out.
(i) The study of monocyte peripheral clock over time
As the expression of clock genes in monocytes, in the current section, was only
examined at one time point, to investigate circadian variation in clock genes expression
of monocytes, whole blood could be extracted at different times of the day, with the
isolation of monocyte RNA. Various factors such as diet have been reported to affect
circadian expression, and therefore subjects would need to be maintained in a consistent
environment during experimentation including sleep and diet.
(ii) Increase number of clock genes examined
Besides elevating the time points at which clock gene expression can be examined, the
number of clock genes investigated could also be increased. The present study
examined 5 clock genes; Bmal2, Dec1, Bmal1, mPer2, and Clock. Other clock genes
that could also be examined include period genes (Per1 and Per3), crytochrome genes
(Cry1 and Cry2) and the nuclear receptor reverse strand c-ERBα (Rev-erbα). Microarray
Peripheral circadian clock in resting and stimulated monocyte
101
methods may be utilised to study the expression of all the clock genes mentioned so far.
In addition, it would also give the opportunity to examine other genes that display
circadian oscillations, and hence may be regulated by the peripheral circadian clock.
(iii) PGE-2 as a putative signalling pathway to regulate monocyte mPer2
expression
The present study found that activated platelets up-regulated monocyte mPer2
expression, while TGF-β1 partially mediated this response. A putative signalling
molecule responsible for the induction of monocyte mPer2 expression by activated
platelets is Prostaglandin E2 (PGE-2). Platelets contain cyclo-oxygenase-1 (COX-1)
and it functions to convert arachidonic acid into prostaglandin H2, which in turn is
converted to PGE-2. The hypothesis that PGE-2 may act as a monocyte clock reseting
agent is supported by previous reports demonstrating PGE-2 as a synchronizer of clock
gene expression in a mouse (Tsuchiya et al. 2005) and equine model (Murphy et al.
2007). To examine this hypothesis, specific inhibitors could be used to suppress COX
activity (such as non-steroidal anti-inflammatory drugs, for example aspirin and
ibuprofen), and therefore the convertion to PGE-2 in monocyte stimulated with CRP-
XL. Additionally, purified PGE-2 may be incubated with monocytes to investigate
whether PEG-2 could synchronise the monocyte clock.
Peripheral circadian clock in resting and stimulated monocyte
102
(iv) Transfection of clock factors with PAI-1 promoter
This study has not shown whether the expression for Pai-1 mRNA is directly regulated
by the circadian clock. Previous studies have demonstrated clock deletion blunted
circadian expression of Pai-1 in the heart, lung and liver in mice (Oishi et al. 2006). As
transgenic humans are not possible, in vitro experiments could be setup. Clock
expression plasmids such as BMAL1, BMAL2 and CLOCK could be co-tranfected with
PAI-1 promoter constructs in monocyte cell lines. This would suggest whether clock
factors regulate PAI-1 in monocytes.

Chapter 5
Regulation of platelet Pai-1 mRNA
and protein expression

Regulation of platelet Pai-1 mRNA and protein expression
103
5.1 – Introduction
The incubation of whole blood with CRP-XL dramatically increased both Pai-1 mRNA
transcript and antigen levels compared to LPS stimulation (section 3), highlighting the
importance of platelets in the regulation of monocyte PAI-1 expression. Platelets could
also contribute to the elevated PAI-1 antigen levels released into the plasma following
CRP-XL activation in whole blood. Platelets can increase PAI-1 levels in the local
vicinity by two different mechanisms, firstly high levels of PAI-1 resides in their α-
granules, which can be released upon activation. Secondly, platelets contain mRNA
which can be used to synthesise new proteins. Previously Brogren et al. (2004) have
reported that platelets contain mRNA for Pai-1 and that they can synthesise active PAI-
1. Another important finding in the present study was that the appearance of PAI-1 in
CRP-XL stimulation of whole blood varied according to the 4G/5G polymorphism. If
platelets influence the increased level of PAI-1 antigen in stimulated whole blood, the
release or production of PAI-1 by platelets may also be associated with the 4G/5G
polymorphism. Linked to the polymorphism is the observation that Pai-1 mRNA in
whole blood under basal conditions exhibited diurnal variation, suggesting that Pai-1
mRNA abundance may also display diurnal differences in platelets. This part of the
thesis therefore examined the possible relationship between the 4G/5G polymorphism,
circadian clock, Pai-1 transcript and protein levels of platelets in resting and activated
conditions.

Regulation of platelet Pai-1 mRNA and protein expression
104
Figure 5.1 – Very low level of leukocyte contamination in the platelet preparationsSemi-quantitative PCR was preformed on leukocyte specific marker CD45 on both platelet and monocyte preparations. A very low level of CD45 expression was seen in the platelet preparations, and a high CD45 expression levels in monocyte preparations. In contrast, high expression levels of platelet marker GPIX was detected in platelets isolation, and undetectable in monocyte preparations. Examples 18S and PAI-1 amplicons produced from isolated platelets can also be seen in the figure.
100 bp ladder 18S PAI-1 GPIX CD45 GPIX CD45
Platelet Monocyte

Regulation of platelet Pai-1 mRNA and protein expression
105
5.2 – Results
5.2.1 – Demonstration that platelets could be isolated free from leukocyte
contamination
Platelets were isolated from whole blood, and to ensure that there were no leukocyte
contamination in the platelet preparations, semi- quantitative-PCR was performed for
the leukocyte specific marker CD45 on cDNA produced from negatively isolated
platelets. As shown in figure 5.1, a very weak expression of CD45 could be detected in
the platelet preparations, whereas a bright band was observed in the control monocyte
preparations. In the figure, expression levels of the platelet-specific marker,
glycoprotein-IX (GP-IX) were also measured to demonstrate that the isolated platelet
preparations were indeed of platelet origin. Strong expression of GP-IX was measured
in isolated platelets, but no detectable signal in the monocyte preparations. These results
suggest the isolated platelet preparations contained a very low level of leukocyte
contamination.
5.2.2 – Diurnal variation in platelet count but not Pai-1 mRNA expression
To investigate whether platelet Pai-1 is regulated by the circadian clock, whole blood
was taken from 10 healthy volunteer (4G/4G = 5, 4G/5G = 5) at 9 am (AM) and 4 pm
(PM). The time points were chosen in accordance to previously published data on the
diurnal rhythms of PAI-1 levels found in human plasma.
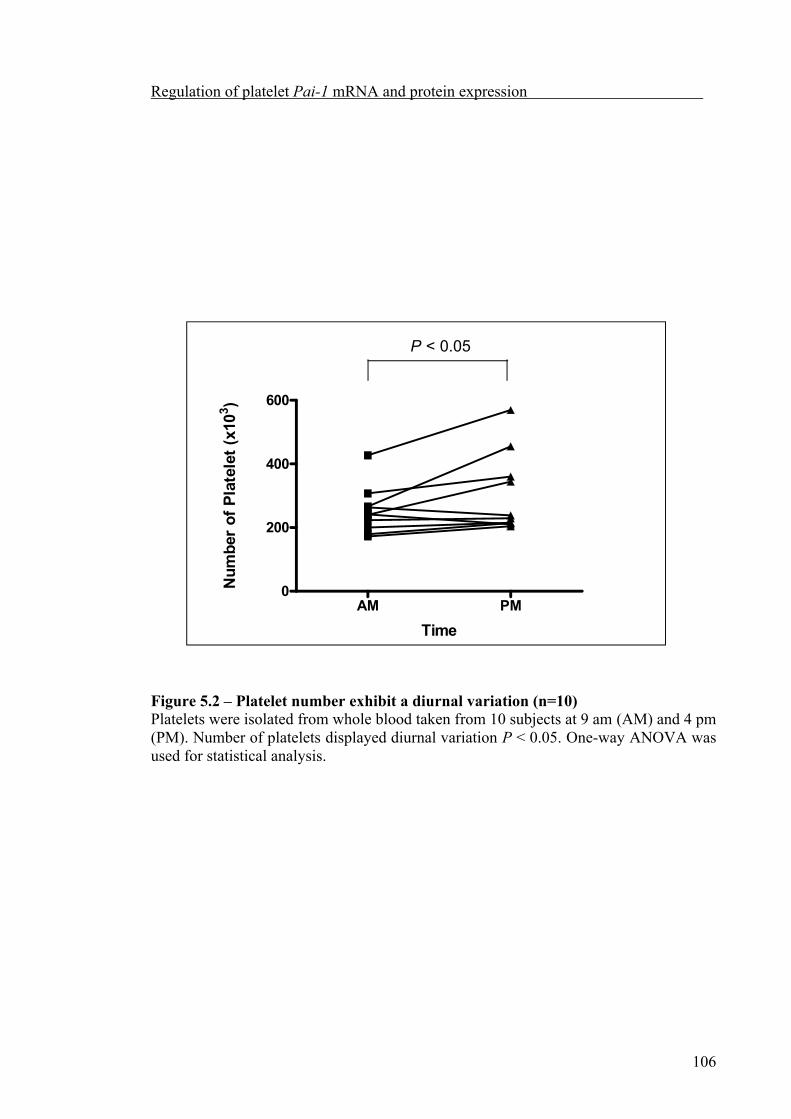
Regulation of platelet Pai-1 mRNA and protein expression
106
AM PM0
200
400
600
P < 0.05
Time
Nu
mb
er o
f P
late
let
(x10
3)
Figure 5.2 – Platelet number exhibit a diurnal variation (n=10)Platelets were isolated from whole blood taken from 10 subjects at 9 am (AM) and 4 pm (PM). Number of platelets displayed diurnal variation P < 0.05. One-way ANOVA was used for statistical analysis.

Regulation of platelet Pai-1 mRNA and protein expression
107
AM PM0.0
0.2
0.4
0.6
0.8
1.0
A
Time
Rel
ativ
eP
ai-1
mR
NA
Exp
ress
ion
AM PM0.0
0.1
0.2
0.3
0.4
0.5
0.6
4G/4G4G/5G
B
Time
Rel
ativ
eP
ai-1
mR
NA
Exp
ress
ion
Figure 5.3 – Regulation of platelet Pai-1 mRNA is independent of circadian clock and polymorphism (n=10, 4G/4G = 5, 4G/5G = 5)Platelets were isolated from whole blood taken from 10 subjects (5 of each genotype) at 9 am (AM) and 4 pm (PM). (A) Variation in Pai-1 expression between morning and evening time points are shown for each subject, with values expressed as mean ± SEM.(B) Time and genotype had no significant influence on the expression of platelet Pai-1expression. Pai-1 mRNA expression determined by real time PCR. Values were normalised with 18s and shown as mean ± SEM. Two-way ANOVA was used for statistical analysis.

Regulation of platelet Pai-1 mRNA and protein expression
108
Platelets were counted and the number of platelets was observed to vary between the
two different time points (P < 0.05, Fig. 5.2), with the highest average count of platelets
being at 4 pm (304±40 x103 cells/ml) and least at 9 am (252±23 x103 cells/ml). Pai-1
mRNA expression was not affected by either time (F(1,18) = 0.33, ns) or genotype (F(1,18)
= 0.40, ns). Therefore it appears relative Pai-1 transcript abundance in platelets is not
associated with the diurnal variation in platelet count, and is independent of both the
circadian clock and the 4G/5G polymorphism.
5.2.3 – Release of PAI-1 by activated platelets
To investigate the possible association between the 4G/5G polymorphism and the level
of PAI-1 that could be released by activated platelets, platelets were extracted from 8
volunteers (4G/4G = 4 and 4G/5G = 4). The isolated platelets were counted and
normalised to 150 x103 /µl for each subject. The extracted platelets were incubated with
or without the agonists adenosine diphosphate (ADP), CRP-XL, and thrombin receptor-
activating peptide (TRAP) at 37°C. The concentration of each agonist used had been
shown by others in the lab to maximally stimulate platelets as measured by flow
cytometry. At 10 min, 1 h, 2 h and 4 h, PAI-1 levels were measured by ELISA. PAI-1
antigen was significantly released at all time points by platelets activated by the agonists
(Agonist F(3,72) = 44.03, P < 0.0001; Time F(4,72) = 131.09, P < 0.0001; T x A
interactions F(12,72) = 17.39, P < 0.0001, showing that the type of agonists and time
points interact in their effect on PAI-1 release from platelets). Most of the PAI-1 was
released by platelets after 10 min incubation with all agonist tested (Fig. 5.4). TRAP
released the most PAI-1 (15.0 ng/ml±1.5) followed by CRP-XL (12.2 ng/ml ±1.0), with

Regulation of platelet Pai-1 mRNA and protein expression
109
0 10 min 1 h 2 h 4 h0
5
10
15
20
CONTROLADPCRP-XLTRAP
Time Point
PA
I-1
An
tig
en l
evel
(n
g/m
l)
P < 0.05
P < 0.05
P < 0.05
Figure 5.4 – Differential level of PAI-1 released from platelets activated by various agonists (n=7).Platelets were isolated from whole blood taken from 7 subjects, and incubated with ADP (blue), CRP-XL (green), TRAP (purple), or without (red). At all time points, activated platelets released significantly higher levels of PAI-1 compared to platelets in basal condition (control). Platelets stimulated by TRAP released the most PAI-1, and ADP stimulated platelets released the least. PAI-1 antigen was determined by ELISA.Data expressed as mean ± SEM. *P <0.05 vs platelets in resting coditions (control). Two-way ANOVA was used for statistical analysis.

Regulation of platelet Pai-1 mRNA and protein expression
110
ADP resulting in the least (6.9 ng/ml±0.6). Further incubation of agonists with platelets
beyond 10 min did not produce significant increase in PAI-1 antigen levels. A slow
release of PAI-1 was seen in unstimulated platelets (2.4 ng/ml±0.4). The results so far
indicate that synthesis of PAI-1 by activated platelets may not contribute significantly to
the level of PAI-1 that can be released.
Platelets originating from donors of 4G homozygous genotype released significantly
higher levels of PAI-1 compared to platelets from heterozygous subjects, following
activation with TRAP (F(3,18) = 7.24, P = 0.0359) CRP-XL (F(1,15) = 10.80, P = 0.0218),
independent of time (Fig. 5.5). The level of PAI-1 released in the 4G homozygotes was
on average 45% higher than in heterozygotes following activation with CRP-XL (15.3
ng/ml±0.8 versus 10.5 ng/ml±0.9, respectively), and 38% under stimulation of TRAP
(18.1 ng/ml±1.3 versus 13.1 ng/ml±1.9, respectively). There was no significant of
genotype on the level of PAI-1 released by platelets stimulated with ADP. It is clear
from the data presented that the release of PAI-1 by activated platelets is regulated by
the 4G/5G polymorphism.

Regulation of platelet Pai-1 mRNA and protein expression
111
Figure 5.5 – Released of PAI-1 by activated platelets is dependent on the promoter polymorphism (n=7, 4G/4G = 4, 4G/5G = 3).Platelets were isolated from whole blood taken from 7 subjects, and incubated with ADP, CRP-XL, TRAP, or without. PAI-1 released upon platelet activation by the different agonist was regulated by the 4G/5G polymorphism besides ADP. PAI-1 antigen was determined by ELISA. *P <0.05 vs 4G/5G heterozygous subjects. Data expressed as mean ± SEM. Two-way ANOVA was used for statistical analysis.
10 min 1 h 2 h 4 h0
10
20
304G/4G4G/5G
Control
** *
*
Time Point
PA
I-1
An
tig
en le
vel (
ng
/ml)
10 min 1 h 2 h 4 h0
10
20
30ADP
Time PointP
AI-
1 A
nti
gen
lev
el (
ng
/ml)
10 min 1 h 2 h 4 h0
10
20
30CRP-XL
* * * *
Time Point
PA
I-1
An
tig
en l
evel
(n
g/m
l)
10 min 1 h 2 h 4 h0
10
20
30TRAP
** * *
Time Point
PA
I-1
An
tig
en l
evel
(n
g/m
l)

Regulation of platelet Pai-1 mRNA and protein expression
112
5.2.4 – PAI-1 synthesis by activated platelets
To see if the expression of Pai-1 was up-regulated in platelets following stimulation,
whole blood was taken from 6 healthy donors, and platelets were negatively isolated
from PRP. The isolated platelets were counted and normalised to 150 x103 /µl for each
subject. The extracted platelets were incubated with TRAP, with or without
cycloheximide, or were left untreated at 37°C and Pai-1 mRNA expression was
determined by real-time PCR at 0.5, 1 and 4 h. The mRNA level for Pai-1 was
calculated relative to the 18S housekeeping gene from the same cDNA. The
concentration of TRAP used was 1 x10⁻³ M, which has been shown by others in the
laboratory to maximally stimulate platelets as measured by monocyte platelet aggregate
formation and P-selectin expression. The protein synthesis inhibitor cycloheximide was
used at 100µg/ml to potentially suppress PAI-1 synthesis.
Significant Time effect (F(3,36) = 6.92, P = 0.0009) was detected but treatment with
TRAP or cycloheximide were insignificant (F(5,36) = 0.29, ns) on the relative abundance
of Pai-1 transcript in platelets (Fig. 5.6). However, Bonferroni tests showed that
platelets activated by TRAP after 4 h caused a significant reduction in Pai-1 expression
(P < 0.05). The lowering of Pai-1 expression was inhibited in the presence of
cycloheximide. The data indicate that activation of platelets results in degradation of
Pai-1 transcript which is potentially used to synthesise new PAI-1 protein.

Regulation of platelet Pai-1 mRNA and protein expression
113
Figure 5.6 – Expression of Pai-1 mRNA in activated platelets (n=6)Platelets were isolated from whole blood taken from 6 subjects, and incubated with either TRAP (green) or TRAP and cycloheximide (purple), or without (red). Activation of platelets by TRAP produced rapid Pai-1 mRNA degradation. Pai-1 mRNA expression determined by real time PCR. Values were normalised to 18s. *P <0.05 vs unstimulated platelets and in the presence of cycloheximide. Data expressed as mean ± SEM. Two-way ANOVA was used for statistical analysis.
0 1 2 3 4 50.00
0.25
0.50
0.75
1.00
1.25
1.50
ControlTRAPCycloheximide
Time (h)
Rel
ativ
eP
ai-1
mR
NA
exp
ress
ion

Regulation of platelet Pai-1 mRNA and protein expression
114
0.0 0.5 1.0 4.00.0
0.5
1.0
1.5
2.04G/4G
4G/5G
Control
Time (h)
Rel
ativ
eP
ai-1
mR
NA
Fo
ld
0.0 0.5 1.0 4.00.0
0.5
1.0
1.5
2.0
TRAP
Time (h)
Rel
ativ
eP
ai-1
mR
NA
Fo
ld
0.0 0.5 1.0 4.00.0
0.5
1.0
1.5
2.0
TRAP and Cycloheximide
Time (h)
Rel
ativ
eP
ai-1
mR
NA
Fo
ld
Figure 5.7 – Effect of genotype on Pai-1 mRNA expression in activated platelets(n=6, 4G/4G = 3, 4G/5G = 3).Platelets were isolated from whole blood taken from 6 subjects, and incubated without any agonist (A), or with either TRAP (B) or TRAP and cylcoheximide (C). Degradation of Pai-1 transcript was faster in activated platelets from 4G homozygous subjects than heterozygous subjects P<0.05. Pai-1 mRNA expression determined by real time PCR. Values were normalised with 18s. *P <0.05 vs 4G/4G homozygous subjects. All data expressed as mean ± SEM. Two-way ANOVA was used for statistical analysis.

Regulation of platelet Pai-1 mRNA and protein expression
115
No effect of genotype on Pai-1 mRNA abundance was observed in platelets under basal
conditions (Genotype F(1,12) = 0.34, ns; Time F(3,12) = 2.16, ns). This was also true for
platelets stimulated with TRAP (Genotype F(1,12) = 0.31, ns; Time F(3,12) = 3.22, P = ns).
However, significant effect of genotype was observed when cycloheximide was
incubated along with TRAP on platelet Pai-1 expression (Genotype F(1,12) = 13.86, P =
0.0204; Time F(3,12) = 3.45, P = 0.0515). Furthermore, the rate of degradation in Pai-1
mRNA was 50% faster in platelets from 4G homozygotes compared to heterozygotes (P
< 0.05) after 4 h incubation with TRAP (0.7±0.03 versus 0.5±0.13). This genotype
difference was reversed with the co-incubation of cycloheximide, where Pai-1 transcript
in platelets isolated from 4G homozygotes degraded 65% slower than Pai-1 mRNA in
platelets from heterozygous origin (P < 0.05; 0.4±0.06 versus 0.7±0.08). The data so far
suggest platelets from 4G homozygous genotype may be able to synthesise more PAI-1
than platelets of heterozygous origin. Furthermore the polymorphism may exert its
effect through the stabilisation of the Pai-1 transcript.
It was observed from section 4.2.3 that activation of platelets resulted in the release of
pre-formed PAI-1 from their α-granules. To measure PAI-1 antigen in the platelet
cytoplasm extracted platelets were incubated with TRAP, or TRAP and cycloheximide,
or were left untreated at 37°C. At time points 0, 0.5, 1 and 4 h, the platelets were lysed,
and total PAI-1 antigen was measured. It was evident PAI-1 was acutely released by
activated platelets, as a dramatic reduction of PAI-1 protein was observed between 0
and 0.5 h in platelets activated by TRAP with or without the co-incubation of
cycloheximide (Fig. 5.8). The activation of platelets with TRAP increased the level of

Regulation of platelet Pai-1 mRNA and protein expression
116
Figure 5.8 – Cycloheximide partially suppressed the production of PAI-1 by activated platelets (n=7).Platelets were isolated from whole blood taken from 7 subjects, and incubated with either TRAP or TRAP and cycloheximide, or without. Platelets activated by TRAP synthesize PAI-1, inhibited by cycloheximide. PAI-1 antigen was determined by ELISA.*P <0.05 vs 0.5 h. All data expressed as mean ± SEM. One-way ANOVA was used for statistical analysis.
0.0 0.5 1.0 4.00.0
2.5
5.0
7.5
10.0
12.5
15.0
17.5Control
Time (h)
PA
I-1
An
tig
en l
evel
(n
g/m
l)
0.5 1.0 4.00.0
0.5
1.0
1.5
2.0
2.5TRAP
Time (h)
PA
I-1
An
tig
en l
evel
(n
g/m
l)
0.5 1.0 4.00.0
0.5
1.0
1.5
2.0
2.5TRAP and Cycloheximide
Time (h)
PA
I-1
An
tig
en l
evel
(n
g/m
l)
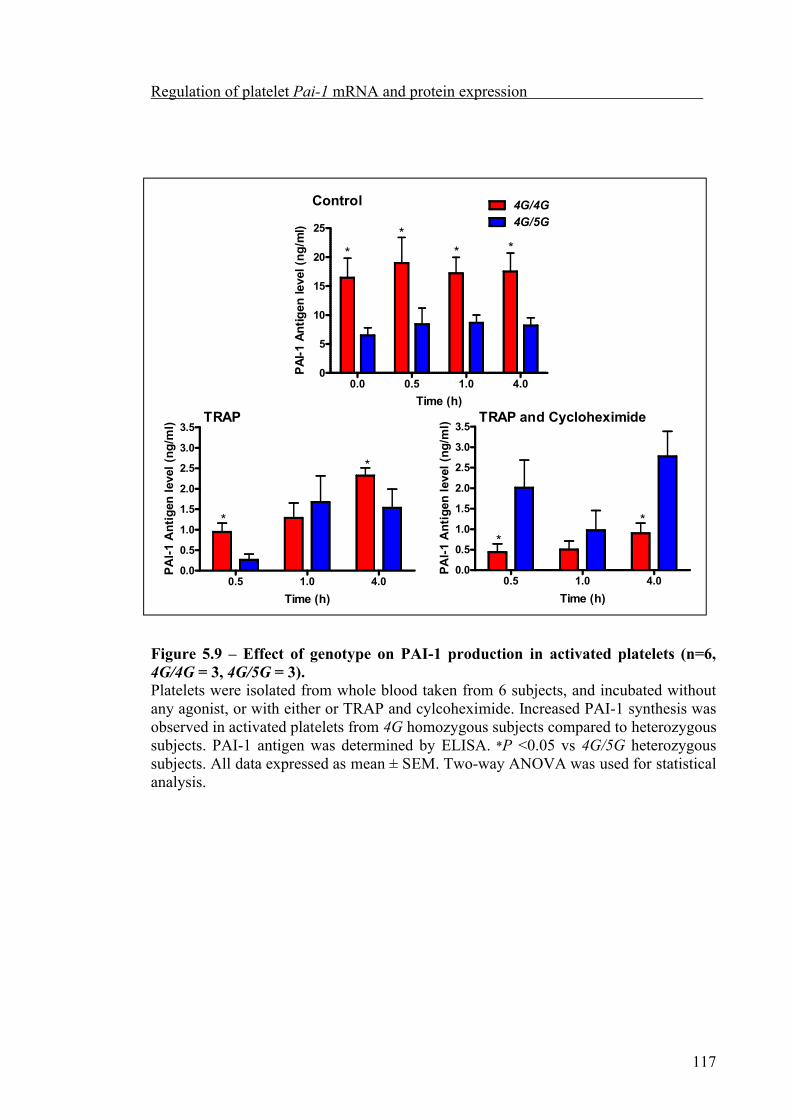
Regulation of platelet Pai-1 mRNA and protein expression
117
Figure 5.9 – Effect of genotype on PAI-1 production in activated platelets (n=6, 4G/4G = 3, 4G/5G = 3).Platelets were isolated from whole blood taken from 6 subjects, and incubated without any agonist, or with either or TRAP and cylcoheximide. Increased PAI-1 synthesis was observed in activated platelets from 4G homozygous subjects compared to heterozygous subjects. PAI-1 antigen was determined by ELISA. *P <0.05 vs 4G/5G heterozygoussubjects. All data expressed as mean ± SEM. Two-way ANOVA was used for statistical analysis.
0.0 0.5 1.0 4.00
5
10
15
20
25
4G/4G4G/5G
Control
** **
Time (h)
PA
I-1
An
tig
en le
vel (
ng
/ml)
0.5 1.0 4.00.0
0.5
1.0
1.5
2.0
2.5
3.0
3.5TRAP
*
*
Time (h)
PA
I-1
An
tig
en l
evel
(n
g/m
l)
0.5 1.0 4.00.0
0.5
1.0
1.5
2.0
2.5
3.0
3.5TRAP and Cycloheximide
*
*
Time (h)
PA
I-1
An
tig
en l
evel
(n
g/m
l)

Regulation of platelet Pai-1 mRNA and protein expression
118
PAI-1 in platelets from 0.5-4 h but only significant between 0.5 and 1 h (0.6 ng/ml±0.2
and 1.5 ng/ml±0.3 respectively). The abundance of PAI-1 in platelets was found not to
vary significantly from 0.5-4 h by the addition of cycloheximide. These observations
indicate platelets can synthesise PAI-1, which maybe released after a threshold
following stimulation.
ANOVA revealed a significant effects in PAI-1 levels as predicted from the results in
section 5.2.3 (Genotype F(1,12) = 10.86, P = 0.0301; Time F(3,12) = 1.48, ns) resulting in
average 47% higher PAI-1 levels in platelets 4G homozygous subjects compared to
heterozygotes (Fig. 5.9). In TRAP stimulated platelets, significant Time effect only was
observed (F(2,8) = 18.43, P = 0.001, Genotype F(1,8) = 0.60, ns). However, Bonferroni
tests indicates platelets from 4G homozygotes synthesised significantly higher levels of
PAI-1 compared to heterozygotes (P < 0.05) at 0.5 and 4 h. Significant Time, Genotype
and T x G interaction effects on platelet PAI-1 synthesis were also observed (Time F(2,8)
= 12.09, P = 0.0038, genotype F(1,8) = 5.12, P = 0.00864, T x G F(2,8) = 5.43, P =
0.0323). Consistent with data on Pai-1 transcript abundance, the co-incubation of
cycloheximide with TRAP resulted in 39% increase of PAI-1 protein in platelets
originating from heterozygous genotype when compared to 4G homozygous genotype.
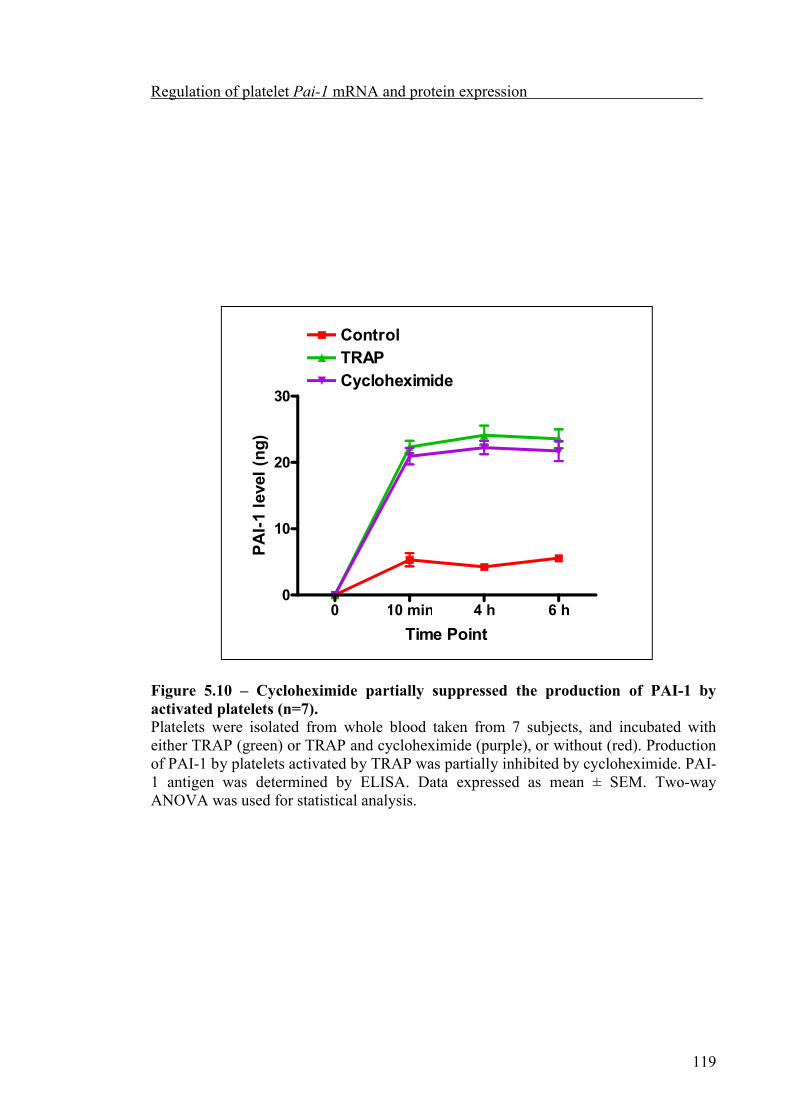
Regulation of platelet Pai-1 mRNA and protein expression
119
Figure 5.10 – Cycloheximide partially suppressed the production of PAI-1 by activated platelets (n=7).Platelets were isolated from whole blood taken from 7 subjects, and incubated with either TRAP (green) or TRAP and cycloheximide (purple), or without (red). Production of PAI-1 by platelets activated by TRAP was partially inhibited by cycloheximide. PAI-1 antigen was determined by ELISA. Data expressed as mean ± SEM. Two-way ANOVA was used for statistical analysis.
0 10 min 4 h 6 h0
10
20
30
ControlTRAPCycloheximide
Time Point
PA
I-1
leve
l (n
g)

Regulation of platelet Pai-1 mRNA and protein expression
120
The data presented supports the idea that the synthesis of PAI-1 in platelets is dependent
on the 4G/5G polymorphism.
To investigate the contribution of synthesised PAI-1 on the level of PAI-1 produced by
activated platelets, isolated platelets were incubated with TRAP, or TRAP and
cycloheximide, or were left untreated at 37°C and total amount of PAI-1 antigen was
analysed by ELISA at 10 min, 4 h and 6 h. Most of the PAI-1 was released by platelets
after 10 min of incubation with TRAP, as shown in the previous section 4.2.3 (Fig.
5.10). The co-incubation of TRAP with cycloheximide resulted in an insignificant
suppression of PAI-1 in activated platelets. The average inhibition caused by
cycloheximide was only 10% (22.3 ng±0.9 with TRAP versus 20.9 ng±1.24 with
cycloheximide), hence casting doubt on the relative contribution of PAI-1 synthesised
by activated platelets to the acutely released local level of PAI-1 at the site of injury.
However, the delay of PAI-1 synthesis may be a way of stabilising the clot after a few
hours.
5.3 – Discussion
5.3.1 – Leukocyte contamination in platelet preparations
The identification of platelet-specific mRNA is often limited by contamination of
platelet preparations with leukocytes. Since the amount of mRNA in single leukocytes
(approximately 25 fg mRNA/leukocyte) is much higher than in platelets (approximately
0.002 fg mRNA/platelet), a small number of leukocytes can significantly distort the

Regulation of platelet Pai-1 mRNA and protein expression
121
profile of platelet gene expression. To overcome this problem, the present study
negatively isolated platelets by selectively removing leukocyte contamination using
specific antibody coated magnetic beads. This technique of leukocyte depletion is a
reliable tool for the study of platelet mRNA transcript, as evidenced by the very low
expression of the leukocyte marker CD45 in the platelet preparations. Hence, this
negative platelet isolation method was used in the present study to examine Pai-1
mRNA transcript.
5.3.2 – The role of the circadian clock in the regulation of platelet Pai-1 expression
Previous reports have demonstrated that circulating platelets exhibit a circadian
oscillation, with peak platelet count in the late afternoon around 17:00 h (Kanabrocki et
al. 1999; Bremmer et al. 2000). Consistent with these reports, the current study shows a
significant increase in platelet count during the afternoon compared to the morning.
These results together with a recent report by Ohkura’s group (2008) demonstrating the
disruption of clock gene resulted in the loss of day/night fluctuations in platelet
aggregation in mice, lead us to investigate whether platelet Pai-1 mRNA levels may
also display diurnal variation. However, the data presented in this section showed no
significant difference in Pai-1 transcript abundance between morning and afternoon in
platelets under basal conditions, and hence the diurnal variation in the amount of
circulating platelets does not appear to associate with Pai-1 mRNA levels. The
differences between younger and mature platelets may explain the lack of association in
platelet Pai-1 expression and platelet count. The total platelet count does not
differentiate between younger and mature platelets. It would be expected that younger

Regulation of platelet Pai-1 mRNA and protein expression
122
platelets contain more Pai-1 mRNA than mature platelets, as some of the Pai-1 mRNA
would be degraded/translated in the latter. Furthermore, it has been reported that
younger platelets have a higher capability for protein synthesis than mature platelets.
Evidence was first provided by Booyse and Rafelson in 1967, where they investigated
the protein synthetic activity of various platelet populations, and found the strongest
activity detectable in young platelets. Later, Kieffer et al. (1987) showed that newly
formed platelets isolated from splenectomised patients with idiopathic
thrombocytopenic purpura (ITP) incorporated radio-labelled amino-acids at a
significantly higher rate than from normal adult donors. Hence a high platelet count
may not necessarily produce a higher Pai-1 expression. Addressing this issue would
require a method that distinguishes between young and mature platelets.
Consistent with a recent report by Brogren et al. (2008), the present study found a lack
of association between Pai-1 mRNA and genotype, indicating that Pai-1 expression in
platelets under basal condition is independent of both circadian clock and 4G/5G
polymorphism.
5.3.3 – Influence of the 4G/5G polymorphism on the release of PAI-1 from
activated platelets
Large amount of PAI-1 resides in platelet α-granules, and it has been previously
demonstrated the activation of platelets results in the acute release of PAI-1. However,
it is unknown whether the amount released is dependent upon the 4G/5G polymorphism.
In this study, platelets were stimulated by various agonists and it was observed that the

Regulation of platelet Pai-1 mRNA and protein expression
123
highest level of PAI-1 was released by platelets activated with TRAP, the least with
ADP, and the amount of PAI-1 released by CRP-XL stimulated platelets falls between
the other two agonists. This differential platelet activation by a range of agonists has
also been observed in other reports; Janes et al. (1993) demonstrated ADP stimulation
of platelets resulted in partial deregulation, as detected by the expression of P-selectin
and CD63, Klinkhardt et al. (2003) found that activation was increased in platelets
incubated with TRAP compared to ADP stimulation by measuring the expression of
CD62p and the formation of platelet-leukocyte aggregates. The level of PAI-1 released
by stimulated platelets appears to be associated with the level of degranulation caused
by the activation of platelets.
The present study shows an association between the 4G/5G promoter polymorphism
and PAI-1 released from activated platelets. There are two potential mechanisms
platelets can acquire PAI-1 that could account for the genotype difference; endogenous
synthesis by megakaryocytes and endocytosis of exogenous PAI-1 in plasma. Previous
studies have demonstrated that 4G homozygous individuals display highest PAI-1
plasma levels compared to donors of the other two genotype (Margaglione et al. 1998).
Taken together with the results in the current section suggests platelets from 4G
homozygous genotype individuals released higher level of PAI-1 than heterozygous
subjects, indicate platelets obtain PAI-1 mainly by endocytosis of plasma PAI-1.
Platelet secretory proteins that originate from the plasma have similar concentrations to
that seen in plasma, as shown for the in vivo uptake IgG and fibrinogen into the α-
granules of human platelets (Harrison et al. 1989).

Regulation of platelet Pai-1 mRNA and protein expression
124
The correlation between PAI-1 content and plasma levels (measured in chapter 3) was
determined in the present study, and it was observed that the average platelet
concentration (average 20 ng/ml) was far higher than that of plasma concentration
(average 10 ng/ml), which is consistent with the study by Brogren group (2008). These
observations suggest that PAI-1 is mainly acquired through endogenous synthesis either
in the megakarocyte or the platelet, since α-Granule proteins that are synthesised by
megakaryocytes have greater concentrations in platelets relative to plasma, as
demonstrated for β- thromboglobulin, platelet factor 4 (Ryo et al. 1983; Sottile et al.
1989), von Willebrand factor and coagulation factor V (Sporn et al. 1985; Chiu et al.
1985). Studies carried out in cell lines by two different groups further suggest that PAI-
1 in platelet α-granules originate from the production by megakaryocytes. Chuang and
Schleef (2001) using the megakaryocytic cell line MEG-01 demonstrated Semliki
Forest virus (SFV) transfer mediated gene expression enhanced PAI-1 storage by 6-9
fold; furthermore particles from SFV/PAI-1 infected cells displayed a 5-fold enhanced
secretion of PAI-1 following treatment with ADP compared to particles incubated in the
absence of secretagogue. Results from Madoiwa et al. (1999) indicated that both PAI-1
mRNA and de novo synthesis of PAI-1 protein is induced after differentiation of
immature progenitor cells into megakaryocytes. These data were obtained through the
use of differentiating megakaryocytic progenitor cells and CD34+/CD41- cells from cord
blood.
Assuming from the evidence provided that platelet PAI-1 is acquired via endogenous
synthesis in megakaryocytes, questions arise regarding the functionality of the promoter
4G/5G polymorphism in megakaryocytes. As platelets from 4G homozygous subjects

Regulation of platelet Pai-1 mRNA and protein expression
125
released more PAI-1 than heterozygous donors, intuitive speculation leads to the idea
that the polymorphism does play a role in the regulation of PAI-1 in megakaryocytes.
However, further studies are required to test this hypothesis.
5.3.4 – Influence of the 4G/5G polymorphism on the synthesis of PAI-1 from
activated platelets
In addition to the ability of platelets to release PAI-1 on stimulation, activated platelets
may also synthesise PAI-1. Activation-dependent synthesis of proteins is contrary to
conventional expectations because platelets are anucleate. However, early (Roth et al.
1989) and recent (Weyrich et al. 1998; Lindeman et al. 2001; Reviewed in Harrison and
Goodall 2008) observations demonstrate that mature circulating platelets have a
significant complement of mRNA generated by precursor megakaryocytes. Furthermore
platelets translate some of these constitutive transcripts in response to activating signals
(Lindeman et al. 2001). Specifically, Brogren et al. (2004) reported that platelets
contain mRNA for PAI-1 and that there is constitutive de novo synthesis of active PAI-
1 following platelet stimulation. To confirm platelet synthesis of PAI-1, both the levels
of PAI-1 transcript and protein was studied in activated platelets. First, the release if
preformed PAI-1 by degranulated platelets were studied, then PAI-1 antigen which may
reside in the platelet cytoplasm was examined.
The present study demonstrated that activation by TRAP generated a rapid degradation
of Pai-1 transcript in platelets by 4 h. The translation of Pai-1 mRNA into PAI-1
protein may accelerate the rate of transcript degradation, suggesting that platelets can

Regulation of platelet Pai-1 mRNA and protein expression
126
synthesise new PAI-1. Interestingly, the increased rate of Pai-1 mRNA degradation was
attenuated by the protein synthesis blocker cycloheximide. This inhibitor functions by
blocking tRNA binding and release from ribosome (Obrig et al. 1971). The mechanism
involved in the inhibition of transcript degradation is unknown but it may possibly act
by interfering with either the initial endonucleolytic cleavage or in the steps involved in
the breakdown of the mRNA into fragments. Consistent with the Pai-1 transcript data,
PAI-1 protein levels were increased in platelets following TRAP activation. The ability
for platelets to synthesise PAI-1 was further evident when cycloheximide attenuated
TRAP-dependent PAI-1 expression. The amount of PAI-1 synthesised in platelets
appeared to be relatively minor compared to the level of PAI-1 released. These results
together with work carried out by Brogren’s group (2004), which showed that the
increase in the level of PAI-1 released following thrombin stimulation became blunt
after 3 h, indicates that synthesised PAI-1 is likely to be of minor importance to the
level of PAI-1 released by activated platelets.
Following 6 h incubation, the rate of Pai-1 mRNA degradation appeared to be greater in
TRAP activated platelets from 4G homozygous subjects than heterozygous subjects. On
the assumption that the accelerated decay rate of Pai-1 transcript is due to increased
PAI-1 protein synthesis, the data indicate that platelets isolated from 4G homozygous
donors would produce higher level of PAI-1 than their heterozygous counterparts.
Indeed, TRAP activated platelets from 4G homozygous subjects appeared to synthesise
increased level of PAI-1 compared to platelets from heterozygous donors. Interestingly,
the introduction of cycloheximide to TRAP activated platelets was found to reverse this
trend. A possible mechanism for this result is that the addition of cycloheximide may
Regulation of platelet Pai-1 mRNA and protein expression
127
inhibit proteins that affect the stability of Pai-1 transcript, and cause the reversal of
genotype effect on PAI-1 expression through post-transcriptional mechanisms. miRNA
has been demonstrated to be expressed in megakaryocytes (Garzon et al. 2006), and
may possibly be present in platelets. The existence of miRNA in platelets could affect
Pai-1 mRNA stability, and would be a suitable candidate for future investigations.
In the current section, the level of PAI-1 produced by activated platelets was measured
in terms of total PAI-1 antigen, which allows for the comparison between the level of
PAI-1 mRNA and proteins contained and produced by the platelets. However, the
importance of detecting the activity of PAI-1 released/synthesised by activated platelets
is also recognised, for the ability to determine the relative contribution platelets make to
the resistance of clots to fibrinolytic degradation. The conformation of PAI-1 in
platelets is still a debate; early studies have indicated that only 5% to 10% of PAI-1 in
platelets is in the active form (Schleef et al. 1985; Booth et al. 1988), however, other
studies have shown that PAI-1 activity could be as high as 60% (Lang and Schleef 1996;
Nordenhem et al. 1997), and that there is a continuous production of large amounts of
active PAI-1 in platelets (Brogren et al. 2004). Thus, to confirm that the release of PAI-
1 is the mechanism by which platelets contribute to the stabilisation of blood clots, the
activity of PAI-1 released by activated platelets must be determined.

Regulation of platelet Pai-1 mRNA and protein expression
128
5.4 – Conclusion
The present study has demonstrated platelets originating from 4G homozygotes subjects
contained on average 38% more PAI-1 than their heterozygous counterparts which
could be released upon degranulation. Furthermore, the activation of platelets through
the thrombin PARI receptor accelerated the degradation of Pai-1 transcript in 4G
homozygotes compared to heterozygotes. The relative contribution made by synthesis
of PAI-1 to the overall level of PAI-1 in platelets was low. Nevertheless, these
observations suggest that the association between the 4G/5G polymorphism and
thrombotic events could be mediated by an effect on the secretion and/or synthesis of
PAI-1 by platelets in addition to the plasma levels of the inhibitor.
Circulating level of PAI-1 in human plasma display circadian variation that is linked to
the 4G/5G polymorphism. It has been demonstrated that Pai-1 mRNA expression in
platelets under basal conditions is independent of circadian clock and promoter
polymorphism. However, the results showing increased secretion of PAI-1 from
platelets of 4G homozygous subjects suggest that the circadian clock may influence
PAI-1 level in platelets through other mechanisms. Previous studies have shown that
PAI-1 in the α-granule of platelets may originate from endogenous synthesis in
megakaryocytes. Hence, it is possible that time-dependent levels of PAI-1 may be
packed inside platelet α-granule during differentiation of mature megakaryocytes.

Regulation of platelet Pai-1 mRNA and protein expression
129
5.5 – Future Work
To support the hypotheses raised in this section, further experiments needs to be carried
out.
(i) Putative influence of 4G/5G polymorphism on regulation of PAI-1 in
megakaryocytes
Evidence from the previous studies (Madoiwa et al. 1999; Chuang and Schleef 2001)
indicates PAI-1 found in α-granule of platelets originates from the endogenous synthesis
in megakaryocytes, which is supported by the present study. The present study
demonstrated platelets from 4G homozygous subjects released more PAI-1 than
heterozygous subjects, suggesting the promoter 4G/5G polymorphism is regulating the
level of PAI-1 in megakaryocytes. The regulation of PAI-1 by the polymorphism could
be investigated using megakaryocytes from genotyped subjects. Transfection of PAI-1
construct with clock expression plasmid in megakaryocytic cell lines would give the
opportunity to examine both the circadian and the polymorphism regulation of Pai-1 in
this cell type. PAI-1 protein levels could be investigated by lysing mature
megakaryocytes, and detecting PAI-1 antigen by western blot or ELISA.
(ii) Alternative protein synthesis inhibitor
The present study examined the synthesis of platelet PAI-1 by blocking protein
synthesis with cycloheximide. However, only 10% of total PAI-1 antigen secreted by
Regulation of platelet Pai-1 mRNA and protein expression
130
activated platelets was shown to be inhibited, and communication with other groups
(Brogren, Sweden) revealed cycloheximide may not be an appropriate inhibitor. The use
of puromycin to suppress protein synthesis could be a potential alternative, which
inhibits translation by prematurely terminating peptide chains. Brogren et al. 2004,
demonstrated addition of puromysin to platelets resulted in the partial inhibition of PAI-
1 synthesis. Another inhibitor that could be utilized to suppress PAI-1 synthesis in
platelets is rapamycin, which attenuates protein synthesis by blocking the action of
mTOR proteins. Recently (Pontrelli et al. 2008), rapamycin has been shown to inhibit
PAI-1 expression in proximal tubular cells. To further investigate the relative
contribution of synthesis of PAI-1 to the total level of PAI-1 produced by platelets, both
puromysin and rapamycin appears to be appropriate alternatives to cycloheximide.
(iii) Metabolic radiolabeling and immunoprecipitation as an alternative approach
for detecting PAI-1 synthesis
The present study only detected small amount of increase in synthesized PAI-1 by
activated platelets, and it is not clear with the use of cycloheximide, as to whether
platelets under stimulation synthesises PAI-1. Another method to examine the synthesis
of PAI-1 is incorporating metabolic radiolabeling of PAI-1 followed by
immunoprecipitation. Synthesise of PAI-1 by activated platelets would be evident in the
amount of increasing radio active PAI-1.

Regulation of platelet Pai-1 mRNA and protein expression
131
(iv) The regulation of PAI-1 expression by platelet aggregation
The level of increase in PAI-1 expression in TRAP-activated platelets was very low in
the present study. Synthesis of platelet PAI-1 may be regulated by the aggregation of
activated platelets. The current study avoided the formation of platelet aggregates
during activation, and therefore the contribution from binding between platelets to the
synthesis of PAI-1 was not examined. The hypothesis that platelet aggregation is
important in the regulation of PAI-1 synthesis is supported by studies carried out with
Bcl3. Weyrich et al. (1998) demonstrated B cell lymphoma 3 (Bcl3) expression was
enhanced in platelet aggregates in comparison to single cells in suspension. Later the
same group (Pabla et al. 1999) reported that the engagement of integrin αIIbβ3, or an
activating antibody to this antigen induced synthesis of Bcl-3 in the absence of thrombin.
Furthermore antibodies or peptides that block αIIbβ3 engagement and platelet
aggregation attenuated Bcl-3 synthesis in response to thrombin. As the principal
mechanism for the binding between platelets involves binding of fibrinogen αIIb/β3
integrin, to investigate the influence of aggregation of stimulated platelets on PAI-1
synthesis, adherence of platelets to fibrinogen could be examined. Increases in PAI-1
protein after adherence of platelets to fibrinogen would suggest the importance of
aggregation of activated platelets to PAI-1 synthesis.
(v) Activity of platelet PAI-1
The present study detected total PAI-1 antigen released by activated platelets, hence the
activity of PAI-1 was not determined. The activity of PAI-1 has implications of how

Regulation of platelet Pai-1 mRNA and protein expression
132
platelets may contribute the resistance of clots to fibrinolytic lysis. Because the
mechanism involved in the stability of PAI-1 (reaction of PAI-1 and tPA) is rather
complicated, it is difficult to determine the activity of PAI-1. To investigate the active
configuration of PAI-1, a functional assay used in Brogren et al. (2004) could be used.
The basis of this approach is that only active PAI-1 is capable of forming a
stoichiometric 1:1 complex with tPA. By incorporating metabolic radiolabeling of PAI-
1 in the presence of tPA, tPA/PAI-1 complex can be detected as a measure of PAI-1
activity.

Chapter 6
Clot formation and lysis

Clot formation and lysis
133
6.1 – Introduction
In this chapter the effect of both the promoter 4G/5G polymorphism and circadian
factors on thrombolysis, was assessed. The rationale for this view stem from previous
experiments demonstrating that the 4G/5G polymorphism regulates the amount of PAI-
1 produced by monocytes and platelets. From these data, it can be deduced that
activation of platelets and monocytes from a 4G/4G homozygous individual could result
in a higher local PAI-1 concentrations in thrombi than in heterozygous subject,
therefore contributing to an increase in thrombolysis resistance. To study the effects of
circadian and 4G/5G polymorphism on the stability of the clot, two systems were
employed to create artificial thrombi; the Chandler loop and rotation
thromboelastometry (TEM).
6.2 – Results
6.2.1 – Chandler loop thrombi
Whole blood was taken from the same 10 volunteers (five homozygous for 4G and five
heterozygous) at two time points; 9 am and 4 pm. Blood was recalcified with 0.25M
CaCl2, and mixed with 0.9% saline, and FITC-fibrinogen as described previously
(section 2.5.2), and the loop was rotated for 2 hrs at 10 r.p.m. The resulting clot was
washed and blotted, and the weight recorded. ANOVA revealed that Time (F(1,8) = 1.83,
ns) and Genotype (F(1,8) = 1.56, ns) did not appear to have a significant effect on the
weight of the thrombi (Fig. 6.1).

Clot formation and lysis
134
AM PM10
15
20
25
30
A
Time
Th
rom
bu
s w
eig
ht
(mg
)
AM PM0
5
10
15
20
25
4G/4G4G/5G
B
Time
Th
rom
bu
s w
eig
ht
(mg
)
Figure 6.1 –Variation of thrombus weight (n=10, 5 in each genotype). Thrombi were produced from whole blood of 10 volunteers in the Chandler loop at 9am (AM) and 4 pm (PM). (A) Variation in thrombus weight between morning and evening time points are shown for each subject. (B) The weight of the thrombus was not significantly affected by time or genotype. All values expressed as mean ± SEM. Two-way ANOVA was used for statistical analysis.
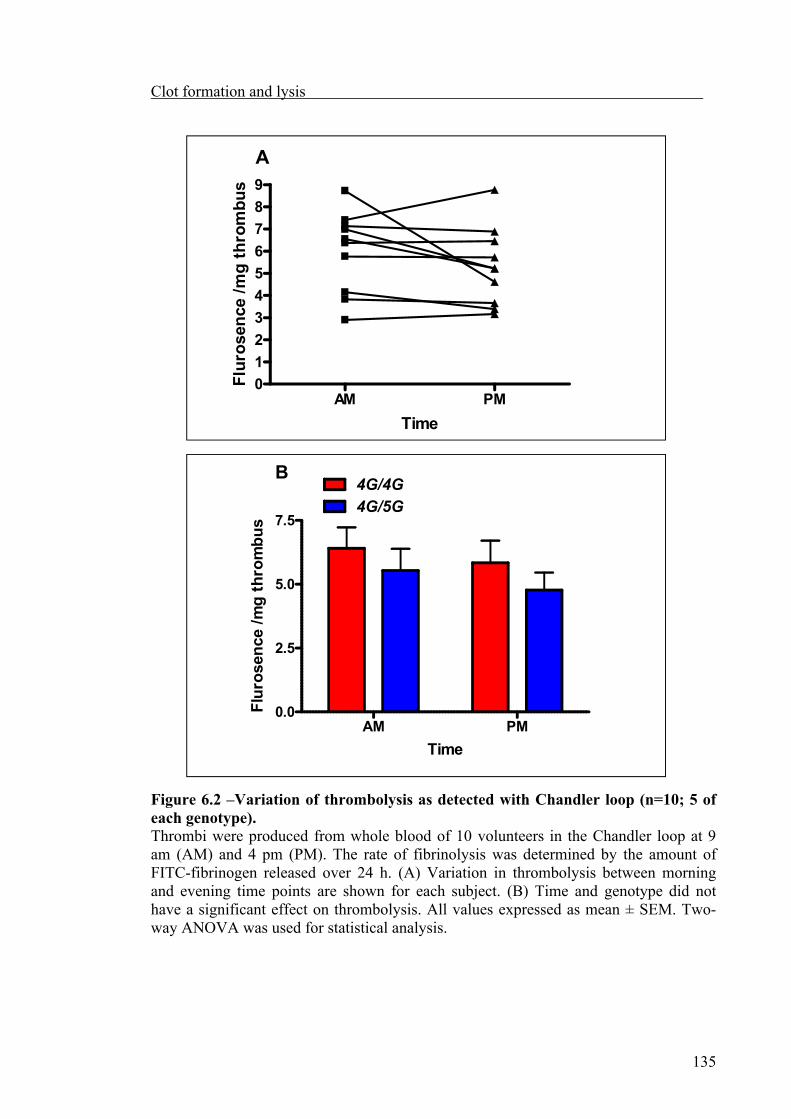
Clot formation and lysis
135
AM PM0
1
2
3
4
5
6
7
8
9
A
Time
Flu
rose
nce
/m
g t
hro
mb
us
AM PM0.0
2.5
5.0
7.5
4G/4G4G/5G
B
Time
Flu
rose
nce
/m
g t
hro
mb
us
Figure 6.2 –Variation of thrombolysis as detected with Chandler loop (n=10; 5 of each genotype).Thrombi were produced from whole blood of 10 volunteers in the Chandler loop at 9am (AM) and 4 pm (PM). The rate of fibrinolysis was determined by the amount of FITC-fibrinogen released over 24 h. (A) Variation in thrombolysis between morning and evening time points are shown for each subject. (B) Time and genotype did not have a significant effect on thrombolysis. All values expressed as mean ± SEM. Two-way ANOVA was used for statistical analysis.

Clot formation and lysis
136
However, T x G (F(1,8) = 7.12, P = 0.0283) interaction did appear to have a significant
effect on the weight of the thrombus, with larger clots produced from heterozygous
donors than of 4G homozygous subjects in both time points. These results indicate the
type of genotype and time points interact in their effect on thrombus weight.
Thrombi were incubated in Hanks buffer for 24 h at 37°C, and the release of FITC-
fibrinogen/fibrin was measured. Thrombolysis was expressed as the amount of FITC
released from the thrombi relative to the weight of the thrombus at the start of the
incubation. Time, Genotype or their interaction had a insiginifcant effect on clot lysis
(Fig. 6.2, genotype F(1,8) = 0.88, ns; for time F(1,8) = 1.81, ns; for T x G interactions F(1,8)
= 0.04, ns).
6.2.2 – Thromboelastometry
Thrombi produced from Chandler loop mimic those formed under arterial flow
conditions (Robbie et al. 1993; Stringer et al. 1994). To investigate the possible effect
of circadian variation of PAI-1 levels on thrombi formed under venous flow conditions,
thromboelastometry was employed. Blood was taken from the same 10 volunteers (five
of each genotype 4G/4G and 4G/5G), at two time points; 9 am and 4 pm. Coagulation
of 300 µl whole blood was initiated with 25µl 0.25M CaCl2 and fibrinolysis enhanced
with 5µl 0.175µg tPA.
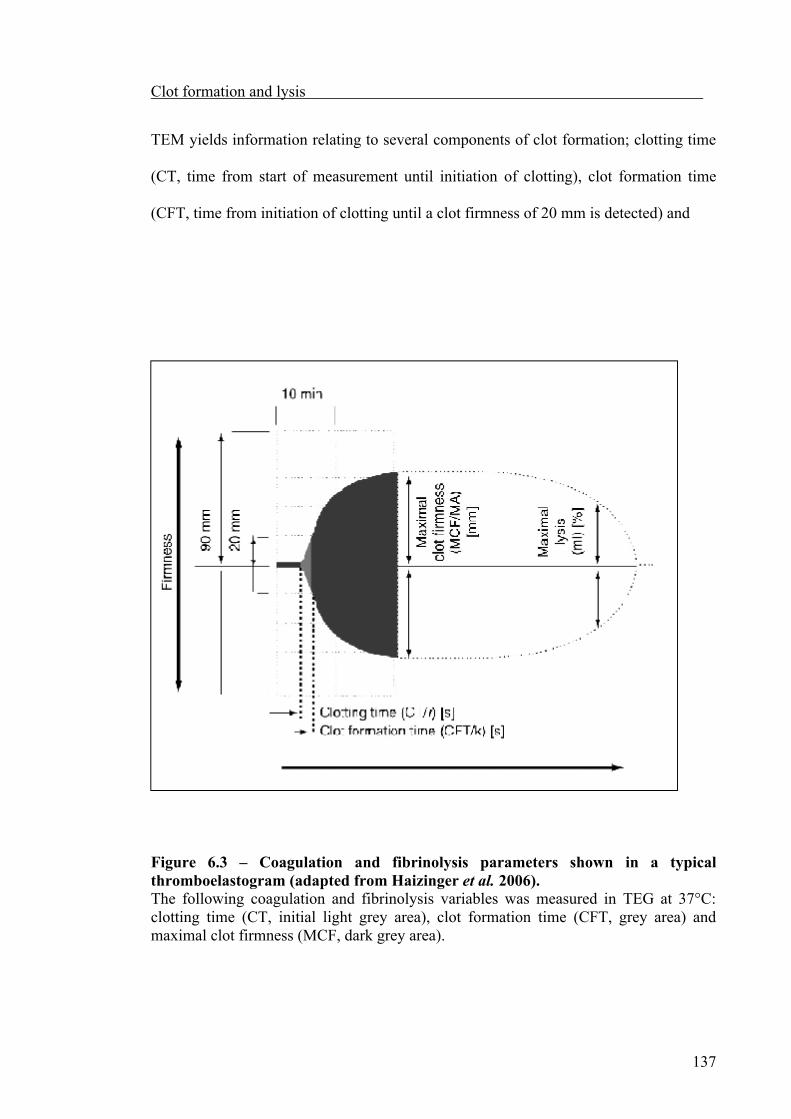
Clot formation and lysis
137
TEM yields information relating to several components of clot formation; clotting time
(CT, time from start of measurement until initiation of clotting), clot formation time
(CFT, time from initiation of clotting until a clot firmness of 20 mm is detected) and
Figure 6.3 – Coagulation and fibrinolysis parameters shown in a typical thromboelastogram (adapted from Haizinger et al. 2006). The following coagulation and fibrinolysis variables was measured in TEG at 37°C: clotting time (CT, initial light grey area), clot formation time (CFT, grey area) and maximal clot firmness (MCF, dark grey area).
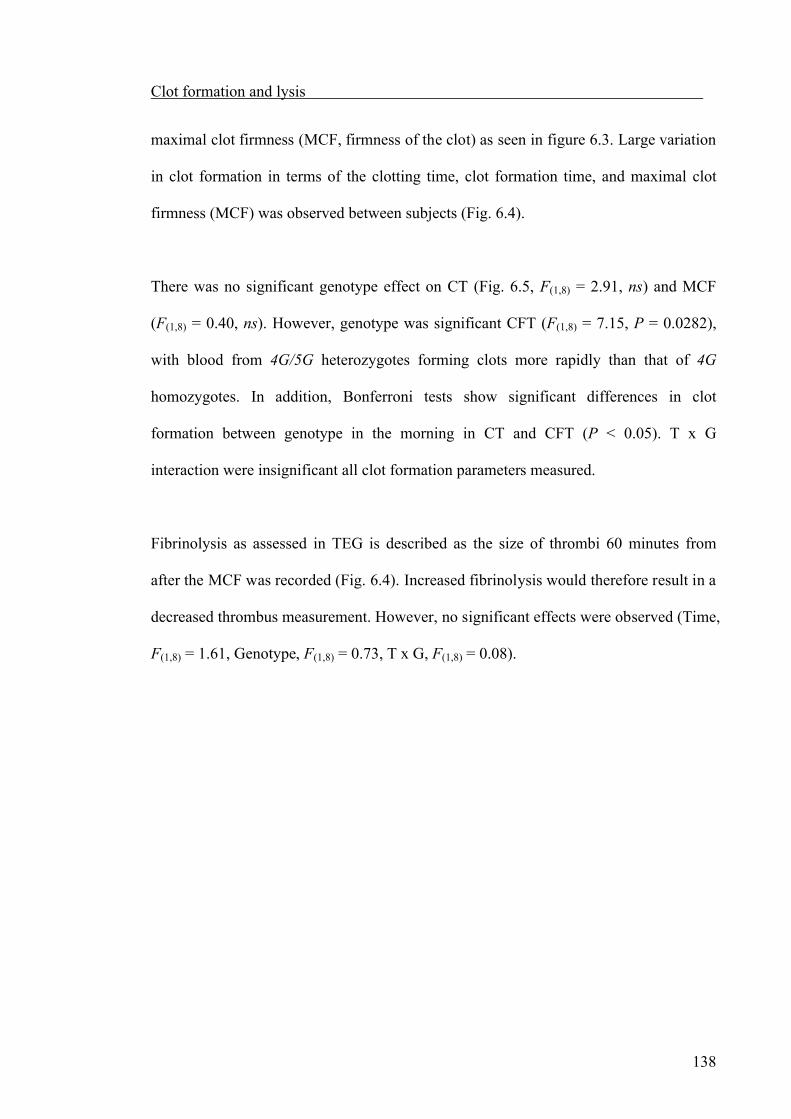
Clot formation and lysis
138
maximal clot firmness (MCF, firmness of the clot) as seen in figure 6.3. Large variation
in clot formation in terms of the clotting time, clot formation time, and maximal clot
firmness (MCF) was observed between subjects (Fig. 6.4).
There was no significant genotype effect on CT (Fig. 6.5, F(1,8) = 2.91, ns) and MCF
(F(1,8) = 0.40, ns). However, genotype was significant CFT (F(1,8) = 7.15, P = 0.0282),
with blood from 4G/5G heterozygotes forming clots more rapidly than that of 4G
homozygotes. In addition, Bonferroni tests show significant differences in clot
formation between genotype in the morning in CT and CFT (P < 0.05). T x G
interaction were insignificant all clot formation parameters measured.
Fibrinolysis as assessed in TEG is described as the size of thrombi 60 minutes from
after the MCF was recorded (Fig. 6.4). Increased fibrinolysis would therefore result in a
decreased thrombus measurement. However, no significant effects were observed (Time,
F(1,8) = 1.61, Genotype, F(1,8) = 0.73, T x G, F(1,8) = 0.08).

Clot formation and lysis
139
Figure 6.4 – Variation of clot formation as detected with TEM (n=10, 5 of each genotype).Whole blood was taken from 10 volunteers at 9 am (AM) and 4 pm (PM) and various coagulation parameters were detected with TEM. Variation in CT (A), CFT (B) andMCF (C) between morning and evening time points are shown for each subject.
AM PM0
100
200
300
400
500
A
Time
Clo
ttin
g T
ime
(sec
)
AM PM30
35
40
45
50
55
60
C
Time
Max
imal
Clo
t F
irm
nes
s
AM PM250
350
450
550
650
750
B
Time
Clo
ttin
g F
orm
atio
n T
ime
(sec
s)

Clot formation and lysis
140
Figure 6.5 – Influence of the genotype with the diurnal variation of coagulation as detected with TEM (n=10, 5 of each genotype).Whole blood was taken from 10 volunteers at 9 am (AM) and 4 pm (PM) and coagulation parameters was analysed for the potential influence with the 4G/5Gpolymorphism. Genotype had a significant effect on CT (A) but not CFT (B) or MCF (C). Time had an insignificant effect on all the coagulation parameters measured. P<0.05 between 4G homozygous and heterozygous during AM time point. All valuesexpressed as mean ± SEM. Two-way ANOVA was used for statistical analysis.
AM PM0
10
20
30
40
50
4G/4G4G/5G
C
Time of day
Max
imal
Clo
t F
irm
nes
s (m
m)
AM PM0
50
100
150
200
250
300
350
A
Time of day
Clo
ttin
g T
ime
(sec
)
AM PM0
100
200
300
400
500
600
700
B
Time of day
Clo
ttin
g F
orm
atio
n T
ime
(sec
s)
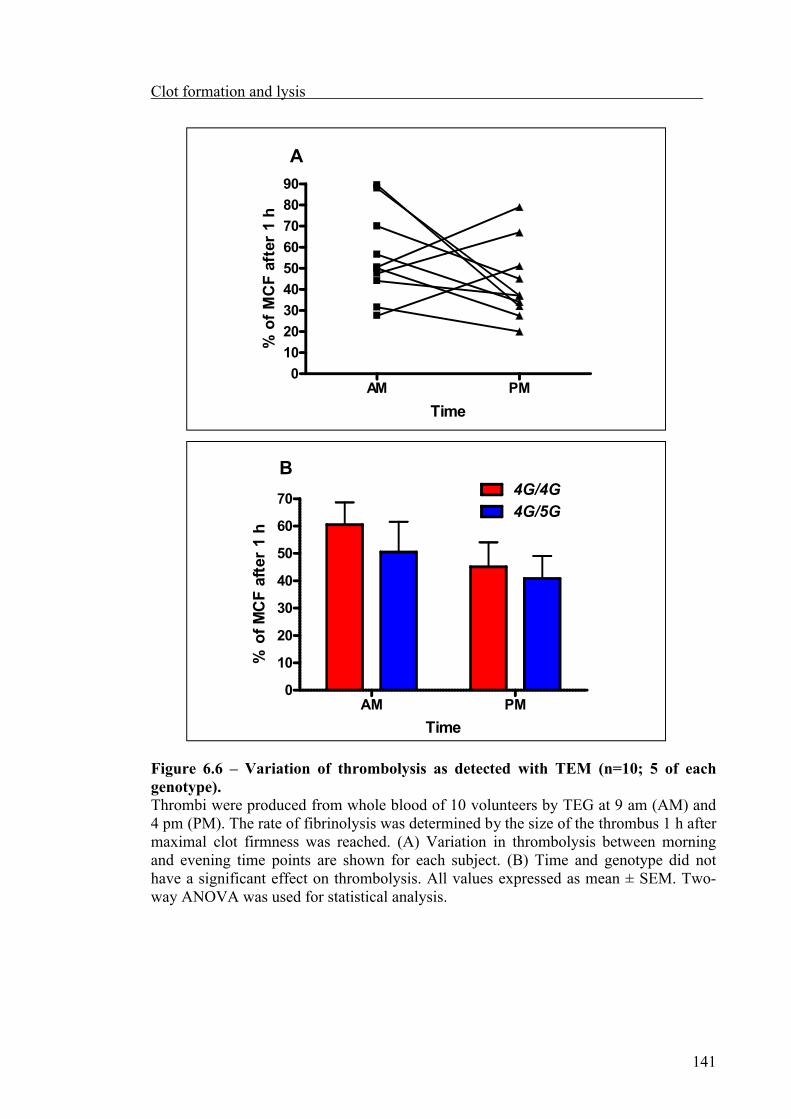
Clot formation and lysis
141
AM PM0
10
20
30
40
50
60
70
80
90
A
Time
% o
f M
CF
aft
er 1
h
AM PM0
10
20
30
40
50
60
704G/4G4G/5G
B
Time
% o
f M
CF
aft
er 1
h
Figure 6.6 – Variation of thrombolysis as detected with TEM (n=10; 5 of each genotype).Thrombi were produced from whole blood of 10 volunteers by TEG at 9 am (AM) and 4 pm (PM). The rate of fibrinolysis was determined by the size of the thrombus 1 h after maximal clot firmness was reached. (A) Variation in thrombolysis between morning and evening time points are shown for each subject. (B) Time and genotype did not have a significant effect on thrombolysis. All values expressed as mean ± SEM. Two-way ANOVA was used for statistical analysis.

Clot formation and lysis
142
6.3 – Discussion
A number of haemostatic parameters has been shown to display circadian oscillations
including; platelet aggregation (Haus et al. 1990; Jovicić and Mandić 1991), protein C
(Undar et al. 1999), antithrombin (AT, Undar et al. 1999), factor VII (Kapiotis et al.
1997), protein S (Undar et al. 1999), tissue factor pathway inhibitor (TFPI, Pinotti et al.
1997), and fibrinogen (Pasqualetti et al. 1997; Kanabrocki et al. 1999). These
observations together with data in chapter 4, showing platelets from 4G homozygous
genotype contains and release significantly higher levels of PAI-1 than their
heterozygous counter-parts, led to the hypothesis that lysis of clots produced from the
same subjects would vary in a circadian manner, which would be also associated with
the 4G/5G polymorphism.
In this study, diurnal variation and possible effect of the 4G/5G polymorphism was
explored using 2 models to measure global fibrinolytic activity; Chandler loop (arterial
model) and TEM (venous model). Thrombolysis as detected by the two methods differs
between subjects, but however, failed to display diurnal variation or an effect of
genotype. Previous reports have documented circadian rhythms in fibrinolytic activity.
Rosing et al. (1970) reported a circadian rhythm in global fibrinolytic activity assessed
by the fibrin plate assay applied to blood samples obtained from clinically healthy, non-
fasting subjects. Recently, Westgate et al. (2008) reported key components of the
molecular clock regulate the response to a thrombogenic stimulus using a mouse model.
With the use of photochemical injury model in the mouse femoral artery, a diurnal
variation in thrombotic vascular occlusion (TVO) was observed in WT mice. However,

Clot formation and lysis
143
mutation of core clock component (CLOCKmut) resulted in loss of the temporal pattern
in the susceptibility to TVO. The small number of volunteers in the current study might
account for the discrepancies, along with the heterogeneity of the donors in terms of age,
gender, BMI and ethnicity. The age range of subjects in the current study was 24-55
years, whereas Rosing et al. (1970) studied 19 to 30 years of age donors, suggesting that
age may have an effect on the circadian variation of PAI-1. Previous studies have
demonstrated gender differences in circulating PAI-1 levels, including the Framingham
Offspring Study that showed lower levels of PAI-1 in females than males (Tofler et al.
1997; Asselbergs et al. 2006). A recent study by Naran and collegue (2008)
demonstrated that PAI-1 concentrations was significantly higher in Indian and White
than African subjects, which was also observed in an earlier study (Festa et al. 2003),
reporting lower plasma PAI-1 concentrations in Afro-American than White subjects.
Obesity, especially central fat, is associated with increased PAI-1 levels (Sartori et al.
2001), and furthermore, two groups have reported the effectiveness of weight reduction
in lowering PAI-1 concentrations (Kockx et al. 1999; Mavri et al. 1999).
The examination of clot formation showed an unexpected association of the 4G
homozygous genotype with longer clotting times and clot formation times. Thrombosis
is a balance between coagulation and fibrinolysis, so this finding was surprising given
that PAI-1 levels were higher in 4G homozygous subjects, which would favour a pro-
thrombotic/antifibrinolytic environment, predicting that clotting time would be shorter
in the 4G homozygous. This unexpected result could be an artefact, due to the small
number studied, and while it is of interest, no hypothesis can be made until other
coagulation parameter such as thrombin generation is studied.

Clot formation and lysis
144
6.4 – Conclusion
In conclusion, it is unclear from the present study whether thrombolysis either in terms
of arterial or venous clot lysis is regulated by the circadian clock or the 4G/5G
polymorphism. This may be due to the small number of subjects or the parameters
which affect circulating PAI-1 levels. Interestingly, it was found that the 4G/5G
polymorphism may play a role in thrombosis only during the morning time point. These
results, together with the observations by Westgate and colleagues (2008) that diurnal
variation in thrombogenesis was attenuated with the disruption in core clock
components, suggest that the molecular clock may influence thrombosis through the
regulation of PAI-1. However, given the high level of variation between subjects and
the effects of components such as age and gender, these studies would need to be
carried out in large cohorts of more defined phenotype.

Chapter 7
General Discussion

General Discussion
145
7.1 – Major findings in the thesis
Cardiovascular events resulting from diseases of the coronary arteries are the major
cause of death and disability in the western world (reviewed in Petersen et al. 2004).
The fibrinolytic system, which is composed of plasmin, the plasminogen activators, and
their inhibitors, represent an important endogenous defence mechanism for the
prevention of intravascular thrombosis. Decreased fibrinolytic activity as a result of
increased PAI-1 concentration may play a role in pathogenesis of cardiovascular events,
and indeed several studies have demonstrated that elevated levels of plasma PAI-1 was
associated with increased risk of MI (Hamsten et al. 1985; 1987). The systemic plasma
concentration of PAI-1 appears to be of limited importance for the regulation of the
local availability of active tPA (Hrafnkelsdottir et al. 2004). This is particularly so
under stimulated conditions when the secretion rate of total tPA by far out weighs the
level of circulating PAI-1 (Hrafnkelsdottir et al. 2004). Therefore, measurement of the
plasma levels of tPA and PAI-1 may not necessarily reflect fibrinolytic activity at the
local level. This thesis investigated the regulation of PAI-1 levels produced by cells of
the circulatory system, specifically monocytes and platelets, and how this may be
influenced by circadian factors and/or 4G/5G polymorphism, and to assess the possible
effect of monocytes and platelet PAI-1 expression on clot lysis in 2 global measures of
haemostasis. The major findings of the present study are: a) the production of Pai-1
mRNA by monocytes is independent of both circadian gene expression and the 4G/5G
polymorphism; b) platelets induce significant amounts of PAI-1 in monocytes to a much
higher level than a inflammatory stimulus such as LPS, and that platelet stimulation of
monocytes is principally through secreted factors, predominantly TGF-β1 (both

General Discussion
146
exogenous and endogenous); c) platelets contain PAI-1 protein that reflect levels in the
plasma with respect to 4G/5G polymorphism; d) platelets contain Pai-1 mRNA, but it is
unclear whether platelets can synthesise PAI-1 protein. The present findings indicate
PAI-1 in circulatory cells is regulated by circadian factors under resting conditions, but
circadian influences may be masked following stimulation, whether inflammatory (LPS)
or thrombotic. The 4G/5G polymorphism appears to regulate the amount of PAI-1
released by stimulated whole blood, with platelets as possibly the main source.
7.2 – Limitations of the study
The present study has some limitations. First, the findings in the thesis excluded the
endothelial response. The interaction between endothelial cells, platelets and monocytes
lead to complex changes that results in atherosclerosis, intimal hyperplasia and acute
thrombosis. Human endothelial cells are the major site of synthesis of PAI-1, and are
one of the potential sources of plasma PAI-1. Furthermore, the 4G/5G polymorphism
appears to play a role in the regulation of PAI-1 in stimulated endothelial cells. This
was evident in previous studies demonstrating that the polymorphism mediated PAI-1
induction by TNFα (Swiatkowska et al. 2005), IL-1 (Ronal et al. 2006) and angiotensin
II (Ronal et al. 2004). Therefore to get the overall picture of the influence of the 4G/5G
polymorphism and circadian clock on thrombolysis, the contribution of endothelial cells
cannot be ignored. Second, the cohort size in the present study (10 donors) was too low
to conclude the effect of the 4G/5G polymorphism on PAI-1 regulation with certainty.
To fully justify the findings in the present study, a larger sample size is essential.
Additionally, a bigger cohort will allow for examination of other factors that may affect

General Discussion
147
PAI-1 levels, such as sex, BMI and ethnicity. Furthermore, this study was carried out on
the assumption that the regulation of PAI-1 in heterozygous genotype is similar to that
of 5G homozygous genotype. Further investigations needs to be carried out on 5G
homozygous subjects to investigate if this assumption is valid. Third, the experiments
carried out to investigate the circadian regulation of PAI-1 were limited by the number
of time points used in this study. To further examine the influence of the circadian clock
on the regulation of PAI-1, increasing the number of time points in terms sample
collection and stimulation experiments is essential. Nevertheless, the main finding of
the present study was the monocyte response to platelets following activation.
7.3 – Regulation of monocytes PAI-1 by activated platelets
Monocytes contribute to inflammation by supplying tissues with macrophages and
dendritic cell precursors (reviewed in Serbina et al. 2008) and play a role in thrombosis
through their interaction with platelets. But which stimuli might elicit Pai-1 gene
expression in monocytes? Resting monocytes express little PAI-1, however, the present
study found that following activation by CRP-XL, platelets potently stimulate Pai-1
gene expression in human monocytes. Furthermore, monocytes did not express
significant levels of Pai-1 mRNA in response to bacterial endotoxin (LPS). The
increased responsiveness of monocyte PAI-1 expression to a thrombotic stimulus
highlights the importance of PAI-1 produced by monocytes in creating a pro-thrombotic
environment.

General Discussion
148
Figure 7.1 – Proposed role of TGF-β1 in the regulation of monocyte PAI-1Platelet activation results in the acute release of PAI-1 from their α-granules. In addition, TGF-β1 is also released and subsequently induces monocyte PAI-1 expression in a paracrine mechanism. Stimulated monocytes can also release TGF-β1 increasing the local level, and inducing the expression of monocyte PAI-1 in an autocrine manner.
α-granule
PAI-1
Pai-1TGF-β1
P-selectin
PSGL-1
Pai-1
Platelet
Monocyte
General Discussion
149
Studies carried out in the current investigation have identified two potential mechanisms
responsible for the induction of monocyte PAI-1 by activated platelets (Fig. 7.1). A
positive, paracrine regulation of PAI-1 was described, which appeared to be primarily
mediated through TGF-β1. Another putative signalling route is a cell surface-based
signalling system; P-selectin binding to its receptor PSGL-1 on the leukocyte, that can
induce Pai-1 expression, mediated again via TGF-β1, but in an autocrine manner.
Because the interaction between platelets and monocytes is essential for thrombosis,
these novel pathways may contribute to monocyte PAI-1 expression in the human
thrombus. The inhibition of PAI-1 maybe a potential therapeutic strategy in the
prevention of thrombus formation, indeed inhibition of PAI-1 activity by monoclonal or
polyclonal antibodies prevents thrombosis (Ahrahamsson et al. 1996; van Giezein et al.
1998). Several small molecule weight compounds have been reported, which inhibit
either PAI-1 production or activity such as compound ZK4044, acting by directly
binding to PAI-1 thus preventing PAI-1 binding to tPA (Liang et al. 2005). However,
the concern of suppressing the action of total PAI-1 is the danger of excessive bleeding
following injury. Data from the present study suggest that it may be possible or even
advantageous to exploit TGF-β1 as a means of lowering PAI-1 levels. Targeting TGF-
β1 would not inhibit the acute release of PAI-1 by activated platelets, but would lower
the amount of PAI-1 produced by monocytes resulting in a net reduction in total level of
PAI-1 within a thrombus. This may present a better alternative in therapeutic design
than directly targeting PAI-1, and may lead to a useful treatment for cardiovascular
events.

General Discussion
150
Several large and small molecule drugs inhibiting TGF-β are being examined which
include mAbs (Lim and Zhu 2006; Liu et al. 2006; reviewed in Biswas et al. 2007),
soluble TGF-β receptors (Breitkopf et al. 2005; Lim and Zhu 2006; reviewed in Liu et
al. 2006), antisense oligonucleotides (ODNs; reviewed in Liu et al. 2006; Wick et al.
2006; Lim and Zhu 2006) and inhibitors of TGF-βRI (de Gouville and Huet 2006;
reviewed in Tsuchida et al. 2006; Liu et al. 2006; Wick et al. 2006). These TGF-β
suppressing drugs are currently being produced primarily to treat either fibrotic disease
or cancer. In terms if cardiovascular disease, antihypertensive drugs that block the RAS
system such as AC inhibitors, and antagonists of the angiotensinII type 1 receptor (AT1)
can inhibit TGF-β production (Wolf 2006; Bujak and Frangogiannis 2007). This may be
due to the fact that angiotensinII (AngII) stimulates TGF-β production (Wolf 2006;
Bujak and Frangogiannis 2007), and also enhances the expression of the TGF-β
receptors through the MAPK pathway (Mehta and Attramadal 2007). Previous studies
also found that AngII up-regulates TSP-1 production and TSP-1 dependent TGF-β
activation in rat cardiac rat fibroblasts (Zhou et al. 2006). TSP-1, as mentioned in
section 3, activates latent TGF-β. The group also demonstrated AngII dependent effects
were blocked by Losartan, an AngII receptor blocker. Another important inhibitor of
TGF-β in relation to cardiovascular system is the anti-inflammatory drug tranilast.
Developed by Kissei Pharma in Japan (Konneh 1998), this has been used clinically in
Japan and South Korea for the treatment of allergic disorders (Okuda et al. 1984;
Konneh 1998) and has potent antifibrotic effects (Konneh 1998; Suzawa et al. 1992),
which may stem from its ability to inhibit both TGF-β secretion and action (Martin et al.
2005; Suzawa et al. 1992). Additionally, transilast have been shown to inhibit both
TGF-β secretion and TGF-β receptor expression in cell culture assays (Munger et al.
General Discussion
151
1999; Ward et al. 1998). These less specific drugs might be more advantageous than
using more specific ones, because they target other aspects of the pathological process
and are generally less toxic.
7.4 – Regulation of monocyte PAI-1 is independent of peripheral circadian clock
Circulating plasma PAI-1 and its parallel activity are characterised by highly
reproducible high-amplitude circadian rhythmicity (Andreotti and Kluft 1991). This
circadian rhythm overrides the circadian variation in circulating tPA activity and
determines the 24-hour variation in overall fibrinolytic activity (Andreotti and Kluft
1991; Angleton et al. 1989; Andreotti et al. 1988). It has been suggested that the source
of plasma PAI-1 originate from various cell types including heptocyte, adipocyte and
endothelial cells. PAI-1 production in vascular endothelial cells in vitro (Schoenhard et
al. 2003; Maemura et al. 2003; Schoenhard et al. 2002), and in vivo (Mohri et al. 2003)
is driven by fundamental circadian clock components. In transfected endothelial cells,
both CLOCK:BMAL1 and CLOCK:BMAL2 heterodimers activate PAI-1 gene
transcription (Chong et al. 2006; Schoenhard et al. 2003). But is PAI-1 expression in
monocytes regulated by a peripheral circadian clock? Pai-1 expression appears to be
regulated by circadian clock in monocytes under basal conditions. However, the
regulation of PAI-1 in monocytes differs substantially in stimulated conditions. The
expressions of most clock genes investigated were either down-regulated or unaffected
in monocytes in response to either an inflammatory or thrombotic stimuli. Hence, the
acute induction of monocyte PAI-1 appears to be independent of the peripheral
circadian clock. To examine this hypothesis further, and to demonstrate whether the

General Discussion
152
circadian clock component directly regulate PAI-1 expression in monocytes, two
methods could be utilised, EMSA or chromatin immunoprecipitation assay (ChIP).
EMSA involves extracting proteins from lysed monocytes and test whether the proteins
binds to a labelled oligonucleotide probe contain the E-boxes from the PAI-1 promoter
(as described in the introduction section). If binding between monocyte proteins and the
probe occurs, the resulting complex would be less mobile than the unbound probe, thus
shifted up on the agarose or polyacrylamide gel. To examine if the clock components
are bound to the complex, an antibody that recognises BMAL1/2 or CLOCK could be
added to the mixture to produce a larger complex resulting in a greater shift, this
method is known as supershift assay. The disadvantage of EMSA is that one can only
study in vitro protein-DNA interactions. However, ChIP assay could be used to study
the in vivo interaction between the clock components and the E-boxes in the PAI-1
promoter. The principle underpinning this assay is that DNA-bound protein
(CLOCK/BMAL1/2-pai-1) can be cross-linked to the chromatin. This is usually
accomplished by gentle formaldehyde fixation. Following fixation, monocytes are lysed
and the DNA is broken into pieces 0.2-1 kb in length by sonication. Once the proteins
are immobilized on the chromatin and the chromatin is fragmented, CLOCK/BMAL1-
pai-1 complexes can be immunoprecipitated using a specific antibody. The DNA from
the isolated protein/DNA fraction can then be purified. The identity of pai-1 fragments
isolated in complex with the CLOCK/BMAL1 can then be determined by PCR using
primers specific for the pai-1 gene. Furthermore by using specific primers for E-box
one or two, enrichment of CLOCK/BMAL1 onto these two E-boxes could be
investigated. The interaction between Smads proteins with the clock heterodimers might

General Discussion
153
occur to regulate stimulated monocyte PAI-1 expression, as the same E-box was
demonstrated to be essential for the activation of Pai-1 promoter (discussed in the
introduction section; Chong et al. 2006; Hua et al. 1999). To test the potential circadian-
dependent PAI-1 response to TGF-β1, protein/DNA complex could be isolated from
monocytes at different times of the day, and the enrichment of SMAD proteins to the
Pai-1 promoter E-boxes determined by using antibodies specific for these proteins.
7.5 – Monocyte peripheral circadian clock
Previous reports have shown the circadian expression of clock genes in both whole
blood and lymphocyte preparations (Boivin et al. 2003; Teboul, et al. 2005; Fukuya et
al. 2007). Consistent with these reports, the present study demonstrated expression of
clock genes in monocytes, suggesting that a peripheral circadian clock does exists in
this cell type. However, the observation of attenuated or unaffected clock gene
expression in stimulated monocytes leads to the question why monocytes contain a
circadian oscillator? A clue to answering this question comes from the data showing
monocyte mPer2 expression being up-regulated by CRP-XL stimulated platelets. The
induction of mPer2 expression has been reported to be involved in the synchronisation
of the circadian clock (Albrecht et al. 2001; Shearman et al. 1997, Shigeyoshi et al.
1997). This raises the possibility that the circadian clock may take part in the regulation
of processes involved during monocyte stimulation in a thrombotic environment. One
method of studying which genes or pathway may be regulated by the circadian clock in
monocytes is use a combination of ChIP and whole-genome DNA microarrays (ChIP on
chip), which yields high-resolution, genome-wide maps of the in vivo interactions

General Discussion
154
between proteins and DNA. The procedure for ChIP is as decribed in the last section
(6.3), except following the reverse cross linking and purification, the isolated DNA is
hybridised to a DNA microarray containing elements that represent the entire genome.
The results of the hybridisation allow one to identify which segments of the genome
were enriched with the CLOCK/BMAL1/2 proteins. Since the precise location of each
arrayed element is known, construction of a genome-wide map of in vivo
CLOCK/BMAL1/2-DNA interactions in monocyte is possible, and thus mapping out
the regulatory pathways regulated by the circadian clock in monocytes.
In summary, monocytes may play a role in thrombosis through the expression of PAI-1.
The data produced in this study emphasize the important of platelets in provoking this
response. In addition, platelets can also contribute in elevating PAI-1 levels by releasing
and synthesising new PAI-1 protein. Furthermore, circadian factors appear to regulate
PAI-1 expression of cells under basal conditions, but independent during stimulated
environment. The 4G/5G polymorphism appears to regulate the amount of PAI-1
released by stimulated whole blood. However, whether circadian factors and/or the
4G/5G polymorphism influence the formation or resolution of a thrombus remains to be
elucidated.
Chapter 8
References

References
155
8.0 – References
Abrahamsson, T., Nerme, V., Strömqvist, M., Akerblom, B., Legnehed, A., Pettersson, K.,
Westin Eriksson, A., (1996), Anti-thrombotic effect of a PAI-1 inhibitor in rats given
endotoxin, Thromb. Haemost., Vol.75, p118-126.
Albercht, U., Eichele, G., (2003), The mammalian circadian clock, Curr. Opin. Genet. Dev.,
Vol.13, p271-277.
Albrecht, U., Zheng, B., Larkin, D., Sun, Z.S., Lee, C.C., (2001), mper1 And mper2 are
essential for normal resetting of the circadian clock, J. Biol. Rhythms., Vol.16, p100-104.
Alessi, M.C., Peiretti, F., Morange, P., Henry, M., Nalbone, G., Juhan-Vague, I., (1997),
Production of plasminogen activator inhibitor-1 by human adipose tissue: possible link
between visceral fat accumulation and vascular disease, Diabetes, Vol:46, p860-867.
Andreotti, F., Kluft, C., (1991), Circadian variation of fibrinolytic activity in blood,
Chronobiol. Int., Vol.8, p336-351.
Andreotti, F., Davies, G.J., Hackett, D.R, Kahn, M.I., De Bart, A.C.W., Haber, W.R.,
Maeseri, A., Kluft, C., (1988), Major circadian fluctuations in fibrinolytic factors and
possible relevance to time of onset of myocardial infarction, sudden death and stroke, Am. J.
Cardiol., Vol.62, p635-637.

References
156
Angleton, P, Chandler, W.L., Schmer, G., (1989), Diurnal variation of tissue-type
plasminogen activator and its rapid inhibitor (PAI-1), Circulation, Vol.79, p101–106.
Asselbergs, F.W., Williams, S.M., Hebert, P.R., Coffey, C.S., Hillege, H.L., Navis, G.,
Vaughan D.E., van Gilst, W.H., Moore, J.H., (2006), The gender-specfic role of
polymorphisms from the fibrinolytic, rennin-angiotensin, and bradykinin systems in
determining plasma t-PA and PAI-1 levels, Thromb. Haemost., Vol.96, p471-477.
Assoian, R.K., Komoriya, A., Meyers, C.A., Miller, D.M., Sporn, M.B., (1983),
Transforming growth factor-beta in human platelets. Identification of a major storage site,
purification, and characterization, J. Biol. Chem., Vol.258, p7155-7160.
Atherosclerosis, Thrombosis, and Vascular Bilogy Italian Study Group, (2003), No
evidence of asscoaition between prothrombotic genes. Polymorphisms and the development
of acute myocardial infarction at a young age, Circulation, Vol.107, p1117-1122.
Balsalobre, A., Brown, S.A., Marcacci, L., Tronche, F., Kellendonk, C., Reichardt, H.M.,
Schütz, G., Schibler, U., (2000), Resetting of circadian time in peripheral tissues by
glucocorticoid signalling, Science, Vol:289, p2344–2347.

References
157
Band, C.O., Park, H.K., Ahn, M.Y., Shin, H.K., Hwang, K.Y., Hong, S.Y., (2001), 4G/5G
polymorphism of the plasminogen activator inhibitor-1 gene and insertion/deletion
polymorphism of the tissue-type plasminogen activator gene in atherothrombotic stroke in
atherothrombotic stroke, Cerebrovasc. Dis., Vol.11, p294-299.
Biswas, S., Guix, M., Rinehart, C., Dugger, T.C., Chytil, A., Moses, H.L., Freeman, M.L.,
Artega, C.L., (2007), Inhibition of TGF-beta with neutralising antibodies prevents
radiation-induced acceleration of metastatic cancer progression, J. Clin. Invest., Vol.117,
p1305-1313.
Boekholdt, S.M., Bijsterveld, N.R., Moons, A.H.M., et al. (2001), Genetic variation in
coagulation and fibrinolytic proteins and their relation with acute myocardial infarction,
Circulation, Vol.104, p3063-3068.
Boivin, D.B., James, F.O., Wu, A., Cho-Park, P.F., Xiong, H., Sun, Z.S., (2003), Circadian
clock genes oscillate in human peripheral blood mononuclear cells, Blood, Vol.102, p4143-
5.
Booth, N.A., Simpson, A.J., Croll, A., et al., (1988), Plasminogen activator inhibitor (PAI-1)
in plasma and platelets, British Journal of Haematology, Vol.70, p327-333.
Booyse, F.M., Rafelson, M.E. Jr., (1967a), Stable messenger RNA in the synthesis of
contractile protein in human platelets, Biochim. Biophys. Acta., Vol.145, p188-190.

References
158
Breitkopf, K., Haas, S., Wiercinska, E., Singer, M.V., Dooley, S., (2005), Anti-TGF-beta
strategies for the treatment of chronic liver disease, Alcohol Clin. Exp. Res., Vol.29, p121S-
131S.
Bremmer, W.F., Sothern, R.B., Kanabrocki E.L., Ryan, M., McCormick, J.B., Dawson, S.,
Connors, E.S., Rothschild, R., Third, J.L., Nemchausky, B.M., Shirazi, P., Olwin, J.H.,
(2000), Relation between circadian patterns in levels of circulating lipoprotein(a),
fibrinogen, platelets, and related lipid variables in men, Am. Heart J., Vol.139, p164-173.
Brogren, H., Wallmark, K., Jern, S., Karlsson, L., (2008), Plasminogen activator inhibitor 1
expression in platelets is not influenced by the 4G/5G promoter polymorphism, Thromb.
Res., Vol.121, p793-797.
Brogren, H., Karlsson, L., Andersson, M., Wang, L., Erlinge, D., Jern, S., (2004), Platelets
synthesize large amounts of active plasminogen activator inhibitor 1, Blood, Vol.104,
p3943-3948.
Brown, N.J., Kim, K.S., Chen, Y.Q., Blevins, L.S., Nadeau, J.H., Meranze, S.G., Vaughan,
D.E., (2000), Synergistic effect of adrenal steroids and angiotensin II on plasminogen
activator inhibitor-1 production, J. Clin. Endocinol. Metab., Vol.85, p336-344.
References
159
Brown, N.J., Agirbasli, M.A., Williams, G,H, Litchfield, W.R., Vaughan, D.E., (1998),
Effect of activation and inhibition of the rennin-angiotensin system on plasma PAI-1,
Hypertension, Vol.32, p965-971.
Buijs, R.M., Kalsbeek, A., (2001), Hypothalamic integration of central and peripheral
clocks, Nat Rev Neurosci, Vol:2, p521–526.
Buisson, A., Nicole, O., Docagne, F., Sartelet, H., Mackenzie, E.T., Vivien, D., (1998), Up-
regulation of a serine protease inhibitor in astrocytes mediates the neuroprotective activity
of transforming growth factor beta1, FASEB J., Vol.12, p1683-1691.
Bujak, M., Frangogiannis, N.G., The role of TGF-beta signalling in myocardial infarction
and cardiac remodelling, Cardovasc. Res., Vol.74, p184-195.
Busso, N., Nicodeme, E., Chesne, C., Guillouzo, A., Belin, D., Hyafil, F., Urokinase and
type 1 plasminogen activator inhibitor production by normal human hepatocytes:
modulation by inflammatory agents, Hepatology, Vol.20, p186-190.
Catto, A.J., Carter, A.M., Stickland, M., Bamford, J.M., Davies, J.A., Grant, P.J., (1997),
Plasminogen activator inhibitor-1 (PAI-1) 4G/5G promoter polymorphism and levels in
subjects with cerebrovscular disease, Thromb. Haemost., Vol.77, p730-734.

References
160
Challet, E., Poirel, V-J., Malan, A., Pevet, P., (2003), Light exposure during daytime
modulates expression of Per1 and Per2 clock genes in the suprachiasmatic nuclei of mice,
J. Neurosci. Res., Vol.72, p629-637.
Chandler, A.B., (1958), In vitro Thrombotic coagulation of the blood. A method for
producing a thrombus, Lab Invest., Vol.7, p110-114.
Chandler, W.L., Trimble, S.L., Loo, S.C, Mornin, D., (1990), Effect of PAI-1 levels on the
molar concentrations of active tissue plasminogen activator (tPA) and tPA/PAI-1 complex
in plasma, Blood, Vol.76, p930-937.
Chen, Y.Q., Su, M., Walia, R.R., Hao, Q., Covington, J.W., and Vaughan, D.E., (1998),
Sp1 sites mediate activation of plasminogen activator inhibitor-1 promoter by glucose in
vascular smooth muscle cells, J. Biol. Chem., Vol:273, p8225-8231.
Chiu, H.C., Schich, P.K., Colman, R.W., (1985), Biosynthesis of factor V in isolated
guinea pig megakaryocytes, J. Clin. Invest., Vol.75, p339.
Chong, N.W., Codd, V., Chan, D., Samani, N.J., (2006), Circadian clock genes activation
of the human PAI-1 gene promoter with 4G/5G allelic preference, FEBS Lett., Vol.7,
p4469-4472.
References
161
Chuang, J.L., Schleef, R.R., (2001), Recombinant Semliki Forest virus enhanced
plasminogen activator inhibitor 1 expression and storage in the megakaryocytic cell line
MEG-01, J. Cell. Biochem., Vol.82, p277-289.
Chomiki, N., Henry, M., Alessi, M.C., Anfosso, F., Juhan-Vague, I., (1994), Plasminogen
activator inhibitor-1 expression in human liver and healthy or atherosclerotic vessel walls,
Thromb. Haemost., Vol.72, p44-53.
Colantonio, D., Casale, R., Abruzzo, B.P., Lorenzetti, G., Pasquaketti, P., (1989), Circadian
distribution in fatal pulmonary thromboemoblism, Am. J. Cardiol., Vol:64, p403-404.
Coleman, P.L., Barouski, P.A., Gelehrter, T.D., (1982), The dexamethasone-induced
inhibitor of fibrinolytic activity in hepatoma cells. A cellular product which specifically
inhibits plasminogen activation, J. Biol. Chem., Vol.257, p4260-4.
Coppinger, J.A., Cagney, G., Toomey, S., Kislinger, T., Belton, O., McRedmond,
J.P., Cahill, D.J., Emili, A., Fitzgerald., D.J., Maguire, P.B., (2004), Characterization of
the proteins released from activated platelets leads to localization of novel platelet proteins
in human atherosclerotic lesions, Blood, Vol.103, p2096-2104.
Datta, P.K., Blake, M.C., Moses, H.L., (2000), Regulation of Plasminogen Activator
Inhibitor-1 Expression by Transforming Growth Factor β-induced Physical and Functional
Interactions between Smads and Sp1, J. Biol. Chem., Vol.275, p40014-40019.

References
162
Dawson, S.J., William, B., Hamsten, A., Green, F., Humphries, S., Henney, A.M., (1993),
The two allele sequences of a common polymorphism in the promoter of the plasminogen
activator-1 (PAI-1) gene respond differently to interleukin-1 in HepG2 cells, J. Biol. Chem.,
Vol.268, p10739-45.
Dawson, S.J, Hamsten, A., Wiman, B., Henney, A., Humphries, S., (1991), Genetic
variation at the plasminogen activator inhibitor-1 locus is associated with altered levels of
plasma plasminogen activator inhibitor-1 activity, Arterioscler. Thromb., Vol.11, p183-190.
Declerck, P.J, De Mol, M., Alessi, M.C., Baudner, S., Paques, E.P., Preissner, K.T.,
Muller-Berghaus, G., Collen, D., (1988), Purification and characterization of a plasminogen
activator inhibitor 1 binding protein from human plasma. Identification as a multimeric
form of S protein (vitronectin), J. Biol. Chem., Vol.263, p15454-61.
Dennler, S., Itoh, S., Vivien, D., ten Dijke, P., Huet, S., Gauthier, J.M., (1998), Direct
binding of Smad3 and Smad4 to critical TGF beta-inducible elements in the promoter of
human plasminogen activator inhibitor-type 1 gene, EMBO J., Vol.17, p3091-3100.
Dixon, D.A., Tolley, N.D., Bemis-Standoli, K., Martinez, M.L., Weyrich, A.S., Morrow,
J.D., Prescott, S.M., Zimmerman, G.A., (2006), Expression of COX-2 in platelet-
monocytes interactions occurs via combinatorial regulation involving adhesion and
cytokine signalling, J. Clin. Invest., Vol.116, p2727-2738.

References
163
Dong, G., Schulick, A.H., DeYoung, M.B., Dichek, D.A., (1996), Identification of a cis-
acting sequence in the human plasminogen activator inhibitor type-1 gene that mediates
transforming growth factor-beta1 responsiveness in endothelium in vivo, J. Bio.l Chem.,
Vol.271, p29969-29977.
Dong-Le Boushis, X., Lambrecht, V., Boilly, B., (1998), Characterization of
morphogenetic and invasive abilities of human mammary epithelial cells: correlation with
variations of urokinase-type plasminogen activator activity and type-1 plasminogen
activator inhibitor level, Biol. Cell., Vol.89, p453-65.
Eggesbø, J.B., Hjermann, I., Ovstebo, R., Joo, G.B., Kierulf, P., (1995), LPS induced
procoagulant activity and plasminogen activator activity in mononuclear cells from persons
with high or low levels of HDL lipoprotein, Thromb. Res., Vol.77, p441-452.
Eligini, S., Barbieri, S.S., Izaskun, A., (2007), Paracrine up-regulation of monocyte
cyclooxygenase-2 by platelets: role of transforming growth factor-β1, Cardiovasc. Res.,
Vol.74, p270-278.
Eriksson, P., Reynisdottir, S., Lonnqvist, F., Stemme, V., Hamsten, A., Arner, P., (1998a),
Adipose tissue secretion of plasminogen activator inhibitor-1 in non-obese and obese
individuals, Diabetologia, Vol.41, p 65-71.

References
164
Eriksson, P., Nilsson, L., Karpe, F., Hamsten, A., (1998b), Very-low-density lipoprotein
response element in the promoter region of the human Plasminogen activator inhibitor –1
gene implicated in the impaired fibrinolysis of hypertriglyceridemia, Arterioscler. Tnromb.
Vasc. Biol., Vol.18, p20-26.
Eriksson, P., Kallin, B., van’t Hooft, F.M., Bavenholm, P., Hamsten, A., (1995), Allele
specific increase in basal transcription of the plasminogen activator inhibitor 1 gene is
associated with myocardial infarction, Proc. Natl. Acad. Sci. USA, Vol.92, p1851-5.
Fay, W.P., Eitzman, D.T., Shapiro, A.D., Madison, E.L., Ginsburg, D., (1994), Platelets
inhibit fibrinolysis in vitro by both plasminogen activator inhibitor-1-dependent and -
independent mechanisms, Blood, Vol.83, p351-356.
Fearnley, G.R., Balmforth, G., Fearnley, E., (1957), Evidence of a diurnal fibrinolytic
rhythm; with a simple method of measuring natural fibrinolysis, Clin. Sci (Lond)., Vol.16,
p645-650.
Festa, D’Agostino, R.Jr., Rich, S.S., Jenny, N.S., Tracy, R.P., Haffner, S.M., (2003),
Promoter (4G/5G) plasminogen activator inhibitor-1 genotype and plasminogen activator
inhibitor-1 levels in blacks, Hispanics, and non-Hispanic whites: the Insulin Resistance
Atherosclerosis Study, Circulation, Vol.107, p2422-7.

References
165
Fink, T., Kazlauskas, A., Poellinger, L., Ebbesen, P., Zachar, V., (2002), Identification of a
tightly regulated hypoxia-response element in the promoter of human plasminogen
activator inhibitor-1, Blood, Vol.99, p2077-2083.
Fitzpatrick, T.E., Graham, C.H., (1998), Stimulation of plasminogen activator inhibitor-1
expression in immortalized human trophoblast cells cultured under low levels of oxygen,
Exp. Cell Res., Vol.245, p155-62.
Foster, R.G., (1998), Shedding light on the biological clock, Neuron, Vol:20, p829–832.
Fukuya. H., Emoto, N., Nonaka, H., Yagita, K., Okamura, H., and Yokoyama, M., (2007),
Circadian expression of clock genes in human peripheral leukocytes, Biochem. Biophys.
Res. Commun., Vol.354, p924-928.
Garcia-Pagán, J.C., Feu, F., Castells, A., Luca, A., Hermida, R.C., Rivera, F., Bosch, J.,
Rodés, J., (1994), Circadian variations of portal pressure and variceal hemorrhage in
patients with cirrhosis, Hepatology, Vol.19, p595-601.
Garzon, R., Pichiorri, F., Palumbo, T., Iuliano, R., Cimmino, A., Aqeilan, R., Volinia, S.,
Bhatt, D., Alder, H., Marcucci, G., Calin, G.A., Liu, C.G., Bloomfield, C.D., Andreff, M.,
Croce, C.M., (2006), MicroRNA fingerprint during human megakaryocytopoiesis, Proc.
Natl. Acad. Sci. USA., Vol.103, p5078-83.

References
166
Gils, A., Pedersen, K.E., Skottrup, P., Christensen, A., Naessens, D., Deinum, J., Enghild,
J.J., Declerck, P.J., Andreasen, P.A., (2003), Biochemical importance of glycosylation of
plasminogen activator inhibitor-1, Thromb Haemost, Vol.90, p206–17.
Glagov, S., Weisenberg, E., Zarins, C.K., Stankuanavicius, R., Kolettis, G.J., (1987),
Compensatory enlargement of human atherosclerotic coronary arteries, N. Engl. J. Med.,
Vol.316, p1371-1375.
de Gouville, A.C., Huet, S., (2006), Inhibition of ALK5 as a new approach to treat liver
fibrotic diseases, Drug News Perspect, Vol.19, p85-90.
Griffin, E.A, Jr,, Staknis, D., Weitz, C.J., (1999), Light-independent role of CRY1 and
CRY2 in the mammalian circadian clock, Science, Vol:286, p768-71.
Grinberg, A.V., Kerppola, T., (2003), Both Max and TFE3 cooperate with Smad proteins to
bind the plasminogen activator inhibitor-1 promoter, but they have opposite effects on
transcriptional activity, J. Biol. Chem., Vol.278, p11227-11236.
Haizinger, B., Gombotz, H., Rehak, P., Geiselseder, G., Mair, R., (2006), Activated
thrombelastogram in neonates and infants with complex congenital heart disease in
comparison with healthy children, Br. J. Anasesth., Vol.97, p545-552.

References
167
Hamilton, J.A., Whitty, G.A., Stanton, H., Wojta, J., Gallichio, M., McGrath, K., Ianches,
G., (1993), Regulation of plasminogen activator inhibitor-1 levels in human monocytes,
Cell Immunol., Vol.152, p7-17.
Hamsten, A., de Faire, U., Walldius, G., Dahlén, G., Landou, C., Blombäck, M., Wiman, B.,
(1987), Plasminogen activator inhibitor in plasma:risk factor for recurrent myocardial
infarction, Lancet., Vol:2, p3-9.
Hamsten, A., Wiman, B., de Faire, U., Blombäck, M., (1985), Increased plasma levels of a
rapid inhibitor of tissue plasminogen activator in young survivors of myocardial infarction,
N. Engl. J. Med., Vol.313, p1557-1563.
Harrison, P., Goodall, A.H., (2008), “Message in the platelet” – more than just vestigial
mRNA! Platelets, Epub ahead of print.
Harrison, P., Wilbourn, B.R., Debili, N., Vainchenker, W., Breton-Gorius, J., Lawrie, A.S.,
Masse, J.M., Savidge, G.F., Cramer, E.M., (1989), Uptake of plasma fibrinogen into the
alpha granules of human megakaryocytes and platelets, J. Clin. Invest., Vol:84, p1320-1324.
Haus, E., Cusulos, M., Sackett-Lundeen, L. and Swoyer, J., (1990), Circadian variations
in blood coagulation parameters, alpha-antitrypsin antigen and platelet aggregation and
retention in clinically healthy subjects, Chronobiol. Int., Vol.7, p203-216.
References
168
Heijmans, B.T., Westendorp, R.G., Knook, D.L., Kluft, C., Slagboom, P.E., (1999),
Angiotensin I-converting enzyme and plasminogen activator inhibitor-1 gene variants: Risk
of mortality and fatal cardiovascular disease in an elderly population-based cohort, J. Am.
Coll. Cardiol., Vol.34, p67-70.
Held, C., Hjemdahl, P., Rehnqvist, N., Wallén, N.H., Björkander, I., Eriksson, S.V.,
Forslund, L., Wiman, B., (1997), Fibrinolytic variables and cardiovascular prognosis in
patients with stable angina pectoris treated with verapamil or metoprolol. Results from the
Angina Prognosis study in Stockholm, Circulation, Vol.95, p2380-2386.
Hermans, P.W., Hibberd, M.L., Booy, R., Daramola, O., Hazelzet, J.A., de Groot, R., Levin,
M., (1999), 4G/5G promoter polymorphism in the plasminogen-activator-inhibitor-1 gene
and outcome of meningococcal disease. Meningococcal Research Group, Lancet, Vol.354,
p556-60.
Hoekstra, T., Geleijnse, J.M., Kluft, C., Giltay E.J., Kok, F.J., Schouten, E.G., (2003),
4G/4G genotype of PAI-1 gene is associated with reduced risk of stroke in elderly, Stroke
Vol.34, p2822-2828.
Honma, S., Kawamoto, T., Takagi, Y., Fujimoto, K., Sato, F., Noshiro, M., Kato, Y., and
Honma, K., (2002), Dec1 and Dec2 are regulators of the mammalian molecular clock,
Nature, Vol:419, p841-844.
References
169
Hou, B., Eren, M., Painter, C.A., Covington, J.W., Dixon, J.D., Schoenhard, J.A., and
Vaughan D.E., (2004), Tumor necrosis factor alpha activates the human plasminogen
activator inhibitor-1 gene through a distal nuclear factor kappaB site, J. Biol. Chem.,
p18127-18136.
Hrafnkelsdottir, T., Gudnason, U., Wall, U., Jern, C., Jern, S., (2004), Regulation of local
availability of active tissue-type plasminogen activator in vivo in man, J. Thromb.
Haemost., Vol.2, p1960-1968.
Hua, X., Miller, Z.A., Wu, G., Shi, Y., Lodish, H.F., (1999), Specificity in transforming
growth factor beta-induced transcription of the plasminogen activator inhibitor-1gene:
interactions of promoter DNA, transcription factor muE3, and Smad proteins, Proc. Natl.
Acad. Sci. USA., Vol.96, p13130-13135.
Irokawa, M., Nishinaga, M., Funayama, H., Ikeda, U., Shimada, K., (1998), Effect of a
change in the sleep/wake cycle on the diural variation of fibrinolytic parameters, J. Thromb.
Thrombolysis, Vol.5, p165-168.
Iwai, N., Shimoike, H., Nakamura, Y., Tamaki, S., Kinoshita, M., (1998), The 4G/5G
polymorphism of the plasminogen activator inhibitor gene is associated with the time purse
of progression to acute coronary syndromes, Atherosclerosis, Vol.136, p109-114.

References
170
Janes, S.L., Wilson, D.J., Cox, A.D., Chronos, N.A., Goodall, A.H., (1994), ADP causes
partial degranulation of platelets in the absence of aggregation, Br. J. Haematol., Vol.86,
p568-573.
Johansson, L., Jansson, J.H., Boman, K., Nilsson, T.K., Stegmayr, B., Hallmans, G., (2000),
Tissue plasminogen activator, plasminogen activator inhibitor-1 and tissue plasminogen
activator/plasminogen activator inhibitor-1 complex as risk factors for the development of a
first stroke, Stroke, Vol.31, p26-32.
Jovicić A, Mandić S, (1991), Circadian variations of platelet aggregability and fibrinolytic
activity in healthy subjects, Thromb. Res., Vol.62, p65-74.
Kanabrocki, E.L., Sothern, R.B., Messmore, H.L., Roitman-Johnson, B., McCormick, J.B.,
Dawson, S., Bremmer, F.W., Third, J.L., Nemchausky, B.A., Shirazi, P., Schebing, L.E.,
(1999) Circadian interrelationships among levels of plasma fibrinogen, blood platelets, and
serum interleukin-6, Clin. Appl. Thromb. Hemost., Vol.5, p37-42.
Kapiotis, S., Jilma, B., Quehenberger, P., Ruzicka, K., Handler, S. and Speiser, W.,
(1997), Morning hypercoagulability and hypofibrinolysis. Diurnal variations in circulating
activated factor VII, prothrombin fragment F1+2, and plasmin-plasmin inhibitor complex,
Circulation, Vol.96, p19-21.

References
171
Keeton, M.R., Curriden, S.A., van Zonneveld, A.J., Loskutoff, D.J., Identification of
regulatory sequences in the type 1 plasminogen activator inhibitor gene responsive to
transforming growth factor beta, J. Biol. Chem., Vol.266, p23048-23052.
Kieffer, N., Guichard, J., Farcet, J.P., et al. (1987), Biosynthesis of major platelet proteins
in human blood platelets, Eur. J. Biochem., Vol.164, p189-95.
Kitamura, M., Sütö, T., Yokoo, T., Shimizu, F., Fine, L.G., (1996), Transforming growth
factor-beta 1 is the predominant paracrine inhibitor of macrophage cytokine synthesis
produced by glomerular mesangial cells, J. Immunol., Vol.156, p2964-2971.
Klinkhardt, U., Kuczka, K., Harder, S., (2003), Effects of the NHE-1 inhibitor cariporide
alone or together with the P2Y12 antagonist AR-C 69331 MX on CD62p expression and
formation of platelet-leukocyte aggregates, Thromb. Res., Vol.111, p251-257.
Kockx, M., Leenen, R., Seidell, J., Princen, H.M.G., Kooistra, T., (1999), Relationship
between visceral fat and PAI-1 in overweight men and women before and after weight loss,
Thromb. Haemost., Vol.82, p1490-1496.
Konneh, M., (1998), Tranilast, Kissei Pharmaceuticals, Idrugs, Vol.1, p141-146.
Kofoed, K.F., Gleerup, G., Hedman, C., Winther, K., (1994), The circadian variation in
fibrinolytic activity is not related to posture, Thromb. Res., Vol.73, p447-450.

References
172
Kruithof, E.K., (1988), Plasminogen activator inhibitors--a review, Enzyme, Vol.40, p113-
121.
Kudo, T., Nakayama, E., Suzuki, S., Akiyama, M., Shibata, S., (2004a), Cholesterol diet
enhances daily rhythm of Pai-1 mRNA in the mouse liver, Am. J. Physiol. Endocinol.
Metab., Vol.287, pE644-651.
Kume, K., Zylka, M.J., Sriram, S., Shearman, L.P., Weaver, D.R, Jin, X., Maywood, E.S.,
Hastings, M.H., Reppert, S.M., (1999), mCRY1 and mCRY2 are essential components of
the negative limb of the circadian clock feedback loop, Cell, Vol:98, p193-205.
Lang, I.M., Schleef, R.R., (1996), Calcium-dependent stabilization of type I plasminogen
activator inhibitor within platelet alpha-granules, J. Biol. Chem., Vol.271, p2754-2761.
Lawrence, D.A., (1996), Transforming growth factor-beta: a general review, Eur. Cytokine
Netw., Vol.7, p363-374.
Letterio, J.J., Roberts, A.B., (1998), Regulation of immune responses by TGF-beta, Annu.
Rev. Immunol., Vol.16, p137-161

References
173
Liang, X., Kanjanabuch, T., Mao, S., Hao, C.M., Tang, T.W., Declerck, P.J., Hasty, A.H.,
Wasserman, D.H., Fogo, A.B., Ma, L.J., (2005), Plasminogen activator inhibitor-1
modulates adipocyte differentiation, Am. J. Physiol. Endocrinol. Metab., Vol.290, E103-
E113.
Lim, H., Zhu, Y.Z., (2006), Role of transforming growth factor-beta in the progression of
heart failure, Cell. Mol. Life Sci., Vol.63, p2584-2596.
Lindemann, S., Tolley, N.D., Dixon, D.A., et al. (2001), Activated platelets mediate
inflammatory signalling by regulated interlukin 1beta synthesis, J. Cell. Bio., Vol.154,
p485-490.
Lindgren, A., Lindoff, C., Norrving, B., Astedt, B., Johansson, B.B., (1996), Tissue
plasminogen activator inhibitor-1 in stroke patients, Stroke, Vol.27, p1066-1071.
Liu, X., Hu, H., Yin, J.Q., (2006), Therapeutic strategies against TGF-beta signalling
pathway in hepatic fibrosis, Liver Int., Vol.26, p8-22.
Loktionov, A., Watson, M.A., Stebbings, W.S., Speakman, C.T., Bingham, S.A., (2003),
Plasminogen activator inhibitor-1 gene polymorphism and colorectal cancer risk and
prognosis, Cancer Lett., Vol.189, p189-96.

References
174
Loskutoff, D.J, van Mourik, J.A, Erickson, L.A., Lawrence, D., (1983), Detection of an
unusually stable fibrinolytic inhibitor produced by bovine endothelial cells, Proc. Natl.
Acad. Sci. U S A., Vol.80, p2956-60.
Loskutoff, D.J, Schleef, R.R., (1988), Plasminogen activators and their inhibitors, Methods
Enzymol., Vol.163, p293-302.
Loskutoff, D.J, Samad. F., (1998), The adipocyte and hemostatic balance in obesity.
Studies of PAI-1, Arterioscler. Thromb. Vasc. Biol., Vol.18, p1-6.
Lund, L.R., Riccio, A., Andreasen, L.S., et al., (1987), Transforming growth factor-beta is a
strong and fast acting positive regulator of the level of type-1 plasminogen activator
inhibitor mRNA in WI-38 human lung fibroblasts, EMBO J., Vol.6, p1281-1286.
Lundgren, C.H., Brown, S.L., Nordt, T.D., Sobel, B.E., Fijii, S., (1996), Elaboration of type
1 plasminogen activator inhibitor from adipocytes. A potential link between obesity and
cardiovascular disease, Circulation, Vol.93, p106-110.
Lundgren, C.H., Sawa, H., Sobel, B.E., Fujii., S., (1994), Modulation of expression of
monocyte/macrophage plasminogen activator activity and its implications for attenuation of
vasculopathy, Circulation, Vol:90, p1927–1934.

References
175
Madoiwa, S., Komatsu, N., Mimuro, J., Kimura, K., Matsuda, M., Sakata, Y., (1999),
Developmental expression of plasminogen activator inhibitor-1 associated with
thrombopoietin-dependent megakaryocytic differentiation, Blood, Vol.94, p465-482.
Maemura, K., de la Monte, S.M., Chin, M.T. et al., (2000), CLIF, a novel cycle-like factor,
regulates the circadian oscillation of plasminogen activator inhibitor-1 gene expression, J.
Biol. Chem., Vol:275, p36847–36851.
Mann, N.S., Hillis, A., Mann, S.K., Buerk, C.A., Prasad, V.M., (1999), In cirrhotic patients
variceal bleeding is more frequent in the evening and correlates with severity of liver
disease, Hepatogastroenterology, Vol.46, p391-394.
Margaglione, M., DiMinno, G., Grandone, E., Vecchione, G., Celentano, E., Cappucci, G.,
Grilli, M., Simone, P., Panico, S., Mancini, M., (1994), Abnormally high circulation levels
of tissue plasminogen activator and plasminogen activator inihibitor-1 in patients with a
history of ischemic stroke, Arterioscler. Thromb., Vol.14, p1741-1745.
Margaglione, M., Cappucci, G., Colaizzo, D., Pirro, L., Vecchione, G., Grandone, E.,
DiMinno, G., (1998), Fibrinogen plasma levels in an apparently healthy general population-
relation to environmental and genetic determinants, Thromb. Haemost., Vol.80, p805-810.

References
176
Martin, J., Kelly, D.J., Mifsud, S.A., Zhang, Y., Cox, A.J., See, F., Krum, H., Willkinson-
Berka, J., Gilbert, R.F., (2005), Tranilast attenuates cardiac matrix deposition in
experimental diabetes: role of transforming growth factor-beta, Cardiovasc. Res., Vol.65,
p694-701.
Matsubara, Y., Murata, M., Isshiki, I., Watanabe, R., et al. (1999), Genotype frequency of
plasminogen activator inhibitor-1 (PAI-1) 4G/5G polymorphism in healthy Japanese males
and its relation to PAI-1 levels, Int. J. Hematol., Vol.69, p43-47.
Mavri, A., Alessi, M.-C., Juhan-Vague, I., (2004), Hypofibrinolysis in the insulin resistance
syndrome: implication in cardiovascular diseases, Journal of Internal Medicine, Vol:255,
p448-456.
McCormack, L.J., Semple, J.I., Stickland, M.H., Barrett, J.H., Grant, P.J., (1998), The
effect of number of days in culture and plasminogen activator inhibitor-1 (PAI-1) 4G/5G
genotype on PAI-1 antigen release by cultured human umbilical vein endothelial cells,
Thromb. Res., Vol:92, p199-206.
McNamara, P., Seo, S.P., Rudic, R.D., Sehgal, A., Chakravarti, D., FitzGerald, G.A.,
(2001), Regulation of CLOCK and MOP4 by nuclear hormone receptors in the vasculature:
a humoral mechanism to reset a peripheral clock, Cell, Vol:105, p877–889.

References
177
Mehta, J.L., Attramadal, H., (2007), The TGF-beta superfamily in cardiovascular biology,
Cardiovasc. Res., Vol.74, p181-183.
Minami, Y., Horikawa, K., Akiyama, M., Shibata, S., (2002), Restricted feeding induces
daily expression of clock gene and Pai-1 mRNA in the heart of Clock mutant mice, FEBS
Lett., Vol.526, p115-118.
Mohri, T., Emoto, N., Nonaka, H., Fukuya, H., Yagita, Y., Okamura, H., Yokoyama, M.,
(2003), Alterations of circadian expression of clock genes in Dahl salt-sensitive rats fed a
high salt diet, Hypertension, Vol.42, p189-194.
Montarras, D., Pinset, C., Chelly, J., Kahn, A., Gros, F., (1989), Expression of MyoD1
coincides with terminal differentiation in determined but inducible muscle cells, EMBO J.,
Vol.8, p2203-2207.
Morgenstern, E., Gnad, U., Preissner, K.T., Dierichs, R., Belleli, A., Chestukhin, A.,
Schvartz, I., Shaltiel, S., (2001), Localisation of protein kinase A and vitronectin in resting
platelets and their translocation onto fibrin fibers during clot formation, Eur. J. Cell Biol.,
Vol.80, p87-98.

References
178
Morton, L.F., Hargreaves, P.G., Farndale, R.W., Young, R.D., Barnes, M.J., (1995),
Integrin alpha 2 beta 1-independent activation of platelets by simple collagen-like peptides:
collagen tertiary (triple-helical) and quaternary (polymeric) structures are sufficient alone
for alpha 2 beta 1-independent platelet reactivity, Biochem. J., Vol:306, p337–344.
Muller, J.E., Stone, P.H., Turi, Z.G., Rutherford, J.D., Czeisler, C.A., Parker, C., Poole,
W.K., Passamani, E., Roberts, R., Robertson, T., Sobel, B.E., Willerson, J.T., Braunwald,
E., (1985), Circadian variation in the frequency of onset of acute myocardial infarction, N.
Engl. J. Med., Vol:313, p1315-1322.
Munger, J.S., Huang, X., Kawakatsu, H., Griffiths, M.J., Dalton, S.L., Wu, J., Pitter, J.F.,
Kaminski, N., Garat, C., Matthay, M.A., Rifkin, D.B., Sheppard, D., (1999), The inetrgrin
alpha v beta 6 binds and activates latent TGF beta 1: a mechanism for regulating pulmonary
inflammation and fibrosis, Cell, Vol.96, p319-328.
Murphy, B.A., Vick, M.M., Sesions, D.R., Cook, R.F., Fitzgerald, B.P., (2007), Acute
systemic inflammation transiently synchronizes clock gene expression in equine peripheral
blood, Brain Behav. Immun., Vol.21, p467-476
Nagata, K., Ishibashi, T., Sakamoto, T., Nakazato, K,. Seino, Y., Yokoyama, K., Ohkawara,
H., Teramoto, T., Maruyama, Y., (2001), Effects of blockade of the renin-angiotensin
system on tissue factor and plasminogen activator inhibitor-1 synthesis in human cultured
monocytes, J. Hypertens., Vol:19, p775–783.

References
179
Naito, Y., Tsujino, T., Kawasaki, D., Okumura, T., Morimoto, S., Masai, M., Sakoda, T.,
Fujioka, Y., Ohyanagi, M., Iwasaki, T., (2003), Circadian gene expression of clock genes
and plasminogen activator inhibitor-1 in heart and aorta of spontaneously hypertensive and
Wistar-Kyoto rats, J. Hypertens., Vo.21, p1107-1115.
Naran, N.H., Chetty, N., Crowther, N.J., (2008), The influence of metabolic syndrome
components on plasma PAI-1 concentrations is modified by the PAI-1 4G/5G genotype and
ethnicity, Atherosclerosis, Vol.196, p155-163.
Nilsen, T.W., (2007), Mechanisms of microRNA-mediated gene regulation in animal cells,
Trends Genet., Vol.23, p243-249
Newman, P.J., Gorski, J., White, G.C. 2nd, Gidwitz, S., Cretney, C.J., Aster, R.H., (1988),
Enzymatic amplification of platelet-specific messenger RNA using the polymerase chain
reaction, J. Clin. Invest., Vol:82, p739-743
Nordenham, A., Wiman, B., (1997), Plasminogen activator inhibitor-1 (PAI-1) content in
platelets from healthy individuals genotyped for the 4G/5G polymorphism in the PAI-1
gene, Scand. J. Clin. Lab. Invest., Vol.5, p453-461.
Obrig, T.G., Culp, W.J., Mckeehan, W.L., Hardesty, B., (1971), The mechanism by which
cycloheximide and related glutarimide antibiotics inhibit peptide synthesis on reticulocyte
ribosomes, J. Biol. Chem., Vol.246, p174-81.

References
180
Ohkura, N., Oishi, K., Sudo, T., Hayashi, H., Shikata, K., Ishida, N., Matsuda, J., Horie, S.,
(2008), CLOCK regulates circadian platelet activity, Thromb. Res., (head of print).
Oishi, K., Shirai, H., Ishida, N., (2007), Identification of the circadian clock-regulated E-
box element in the mouse plasminogen activator inhibitor-1 gene, J. Thromb. Haemost.,
Vol.5, p428-431.
Oishi, K., Ohkura, N., Wakabayashi, M., Shirai, H., Sato, K., Matsuda, J., Atsumi, G.,
Ishida, N., (2006), CLOCK is involved in obesity-induced disordered fibrinolysis in ob/ob
mice by regulating PAI-1 gene expression, J. Thromb. Haemsot., Vol.4, p1774-1780.
Oishi, K., Ohkura, N., Kasamatsu, M., Fulushima, N., Shirai, H., Matsuda, J., Horie, S.,
Ishida, N., (2004), Tissue-specific augmentation of circadian PAI-1 expression in mice with
streptozotocin-induced diabetes, Thromb. Res., Vol.114, p129-135.
Okada, K., Yano, M., Doki, Y., Azama, T., Iwanaga, H., Miki, H., Nakayama, M., Miyata,
H., Takiguchi, S., Fujiwara, Y., Yasuda, T., Ishida, N., Monden, M., (2008), Injection of
LPS causes transient suppression of biological clock genes in rats, J. Surg. Res., Vol.145,
p5-12.
Okuda, M., Ishikawa, T., Saito, Y., Shimizu, T., Baba, S., (1984). A clinical evaluation of
N-5' with perennial-type allergic-a test by the multipclinic intergroup, double-blind
comparative method, Ann. Allergy, Vol.53, p178-185.
References
181
Ossei-Gerning, N., Mansfield, M.W, Stickland, M.H., Wilson, I.J., Grant, P.J., (1997),
Plasminogen activator inhibitor-1 promoter 4G/5G genotype and plasma levels in relation
to a history of myocardial infarction in patients characterized by coronary angiography,
Arterioscler Thromb Vasc Biol., Vol.17, p33-37.
Pabla, R., Weyrich, A.S., Dixon, D.A., Bray, P.F., McIntyre, T.M., Prescott, S.M.,
Zimmerman, G.A., (1999), Integrin-dependent control of translation: engagement of
integrin alphaIIbbeta3 regulates synthesis of proteins in activated human platelets, J. Cell.
Biol., Vol.144, p175–184.
Pasqualetti, P., Festuccia, V., Acitelli, P., Natali, L., Collacciani, A. and Casale, R.
(1997), Circadian rhythms of fibrinogen antithrombin III and plasminogen in chronic liver
diseases of increasing severity, Haemostasis, Vol.27, p140-148.
Petersen, S., Peto, V., Rayner, M., (2004), Coronary heart disease statistics, BHF: London,
www.bhf.org.uk.
Pinotti, M., Bertolucci, C., Portaluppi, F., Colognesi, I., Frigato, E., Foa, A. and
Bernardi, F., (2005), Daily and circadian rhythms of tissue factor pathway inhibitor and
factor VII activity, Arterioscler. Thromb. Vasc. Biol., Vol.25, p646-649.

References
182
Piscaglia, F., Hermida, R.C., Siringo, S., Legnani, C., Ramadori, G., Bolondi, L., (2002),
Cirrhosis does not shift the circadian phase of plasma fibrinolysis, Am. J. Gastroenterol.,
Vol.97, p1512-1517.
Piscaglia, F., Siringo, S., Hermida, R.C., Legnani, C., Valgimigli, M., Donati, G., Palareti,
G., Gramantieri, L., Gaiani, S., Burroughs, A.K., Bolondi, L., (2000), Diurnal changes of
fibrinolysis in patients with liver cirrhosis and esophageal varices, Hepatology, Vol.31,
p349-357.
Pontrelli, P., Rossini, M., Infante, B., Stallone, G., Schena, A., Loverre, A., Ursi, M.,
Verrienti, R., Maiorano, A., Zaza, G., Ranieri, E., Gesualdo, L., Ditonno, P., Bettocchi, C.,
Schena, F.P., Grandaliano, G., Rapamycin inhibits PAI-1 expression and reduces interstitial
fibrosis and glomerulosclerosis in chronic allograft nephropathy, Transplantation, Vol.85,
Vol.125-134.
Pordor, T.J., Singh, D., Chindemi, P., Foulon, D.M., Mckelvie, R., Weitz, J.I., Austin, R.,
Boudreau, G., Davies, R., (2002), Vimentin exposed on activated platelets and platelet
microparticles localizes vitronectin and plasminogen activator inhibitor complexes on their
surface, J. Biol. Chem., Vol.277, p7529-7539.

References
183
Potter van Loon, B.J, Rijken, D.C., Brommer, E.J., van der Maas, A.P., (1992), The amount
of plasminogen, tissue-type plasminogen activator and plasminogen activator inhibitor type
1 in human thrombi and the relation to ex-vivo lysibility, Thromb. Haemost., Vol:67, p101-
105.
Preitner, N., Damiola, F., Lopez-Molina, L., Zakany, J., Duboule, D., Alburecht, U.,
Schibler, U., (2002), The orphan nuclear receptor REV-ERBα controls circadian
transcription within the positive limb of the mammalian circadian oscillator, Cell, Vol:110,
p251-260.
Providence, K.M, White, L.A., Tang, J., Gonclaves, J., Staiano-Coico, L., Higgins, P.J.,
(2002), Epithelial monolayer wounding stimulates binding of USF-1 to an E-box motif in
the plasminogen activator inhibitor type-1 gene, J. Cell Sci., Vol.115, p3767-3777.
Rallidis, L.S., Megalou, A.A., Papageorgakis, N.H., Trikas, A.G., Chatzidimitriou, G.I.,
Tsitouris, G.K., (1996), Plasminogen activator inhibitor 1 is elevated in the children of men
with premature myocardial infarction, Thromb. Haemost., Vol.76, p417-421.
Reppert, S.M., Weaver, D.R., (2001), Molecular analysis of mammalian circadian rhythms,
Annu. Rev, Physiol., Vol.63, p647–676.

References
184
Ribeiro, S.M., Pocaztek, M., Schultz-Cherry, S., Villain, M., Murphy-Ullrich, J.E., (1999),
The activation sequence of thrombospondin-1 interacts with the latency-associated peptide
to regulate activation of latent transforming growth factor-beta, J. Biol. Chem., Vol.274,
p13586-13593.
Ridker, P.M., Hennekens, C.H., Lindpaintner, K., Stampfer, M.J., Miletich, J.P., (1997),
Arterial and venous thrombosis is not associated with the 4G/5G polymorphism in the
promoter of the plasminogen activator inhibitor gene in a large cohort of US men,
Circulation, Vol.7, p59-62.
Ritchie, H., Jamieson, A., Booth, N.A., (1995), Peripheral blood monocyte synthesis of
plasminogen activator inhibitor 2 in response to native and modified LDL, Thromb.
Haemost., Vol.74, p1521-1527.
Robbie, L.A., Booth, N.A., Croll, A.M., Bennett, B., (1993), Roles of a2-antiplasmin and
plasminogen activator inhibitor I (PAI-1) in the inhibition of clot lysis, Thromb. Haemost,
Vol:70, p301-306.
Roest, M., Banga, J.D., (2003) Editorial comment – genetic make-up for increased PAI-1
expression protects against stroke, Stroke, Vol.34, p2828-2829.

References
185
Roest, M., van der Schouw, Y.T., Banga, J.D., Tempelman, M.J., de Groot, P.G., Sixma,
J.J., Grobbee, D.E., (2000), Plasminogen activator inhibitor 4G polymorphism is associated
with decreased risk of cerebrovascular mortality in older women, Circulation, Vol.101,
p67-70.
Ronal, C., Orbe, J., Belzunce, M., Rodriguez, J.A., Pàramo, J.A., (2006), The 4G/5G PAI-1
polymorphism influences the endothelial response to IL-1 and the modulatory effect of
pravastatin, J. Thromb. Haemost., Vol.4, p1798-1803.
Roncal, C., Orbe, J., Rodriguez, J.A., Belzunce, M., Beloqui, O., Diez, J., Páramo, J.A.,
(2004), Influence of the 4G/5G PAI-1 genotype on angiotensin II-stimulated human
endothelial cells and in patients with hypertension, Cardiovasc. Res., Vol:63, p176-185.
Rosing, D.R., Brakman, P., Redwood, D.R., Goldstein, R.E., Beiser, G.D., Astrup, T.,
Epstein, S.E., (1970), Blood fibrinoltyic activity in man. Diurnal variation and the response
to varying intensities of exercise, Circ. Res., Vol.27, p171-184.
Roth, G.J., Hickey, M.J., Chung, D.W., Hickstein, D.D., (1989), Circulating human blood
platelets retain appreciable amounts of poly (A)+ RNA using the polymerase chain reaction,
J. Clin. Invest., Vol.160, p705-710.

References
186
Ryo, R., Nakoff, A., Huang, S.S., Ginsberg, M., Deuel, T.F., (1983), New synthesis of a
platelet-specific protein: Platelet factor 4 synthesis in a megakaryocyte-enriched rabbit
bone marrow culture system, J. Cell. Biol., Vol:96, p515-520.
Saksela, O., Moscarelli, D., Rifkin, D.B., (1987), The opposing effects of basic fibroblast
growth factor and transforming growth factor beta on the regulation of plasminogen
activator activity in capillary endothelial cells, J. Cell. Biol., Vol.105, p957-963.
Samad, F., Loskutoff, D.J., (1996), Tissue distribution and regulation of plasminogen
activator inhibitor-1 in obese mice, Mol. Med., Vol.2, p568-582.
Samad. F., Yamamoto, K., Lostkutoff, D.J., (1996), Distribution and regulation of
plasminogen activator inhibitor-1 in murine adipose tissue in vivo: induction by tumor
necrosis factor- and lipopolysaccharide, J. Clin. Invest., Vol.97, p37-46.
Sartori, M.T., Vettor, R., De-Pergola, G., De Mitrio, V., Saggiorato, G., Della Mea, P.,
Patrassi, G.M., Lombardi, A.M., Fabris, R., Girolami, A., (2001), Role of the 4G/5G
polymorphism of PAI-1 gene promoter on PAI-1 levels in obese patients – Influence of fat
distrucbution and insulin-resistance, Thromb. Haemost., Vol. 86, p1161-1169.
Sato, F., Kawamoto T., Fujimoto, K., Noshiro, M., Hondo, K.K., Homma, S., Honma, K.,
Kato, Y., (2004), Functional analysis of the basic helix-loop-helix transciption factor DEC1
in circadian regulation. Interaction with BMAL1, Eur. J. Biochem., Vol:271, p4409-4419.

References
187
Schleef, R.R., Sinha, M., Loskutoff, D.J., (1985), Immunoradiometric assay to measure the
binding of a specific inhibitor to tissue-type plasminogen activator, J. Lab. Clin. Med.,
Vol:106, p408-415.
Schoenhard, J.A., Muldowney, J.A. 3rd, Emens, J.S., Lewy, A.J., Vaughan, D.E., (2007),
Plasminogen activator inhibitor-1 has a circadian rhythm in blind individuals, Thromb.
Haemost., Vol.98, p479-481.
Schoenhard, J.A., Smith, L.H., Painter, C.A., Eren, M., Johnson, C.H., Vaughan, D.E.,
(2003), Regulation of the PAI-1 promoter by circadian clock components: differential
activation by BMAL-1 and BMAL-2, J. Mol. Cell Cardiol., Vol.35, p473-481.
Schoenhard, J.A., Eren, M., Johnson, C.H., Vaughan, D.E., (2002), Alternative splicing
yields novel BMAL2 variants: tissue distribution and functional characterization, Am. J.
Physiol. Cell Physiol., Vol:283, p103–114.
Schultz-Cherry, S., Chen, H., Mosher, D.F., Misenheimer, T.M., Krutzsch, H.C., Roberts,
D.D., Murphy-Ullrich, J.E., (1995) Regulation of tranfroming growth factor-beta activation
by discrete sequences of thromnospondin-1, J. Biol. Chem., Vol.270, p7304-7310.
Sottile, J., Mosher, D.F., Fullenweider, J., George, J.N., (1989), Human platelets contain
mRNA transcripts for platelet factor 4and actin, Thromb. Haemost., Vol.62, p1100-1102.

References
188
Serbina, N.V., Jia, T., Hohl, T.M., Parmer, E.G., (2008), Monocyte-mediated defense
against microbial pathogens, Annu. Rev. Immunol., Vol.26, p421-452.
Shearman, L.P., Zylka, M.J., Weaver, D.R., Kolakowski, L.F., Reppert, S.M., (1997), Two
period homologs: circadian expression and photic regulation in the suprachiasmatic nuclei,
Neuron., Vol.19, p1261-1269.
Shigeyoshi, Y., Taguchi, K., Yamamoto, S., Takekida, S., Yan, L., Tei, H., Moriya, T.,
Shibata, S., Loros, J.J., Dunlap, J.C., Okamura, H., (1997), Light-induced resetting of a
mammalian circadian clock is associated with rapid induction of the mPer1 transcript, Cell,
Vol.91, p1043-1053.
Siringo, S., Bolondi, L., Sofia, S., Hermida, R.C., Gramantieri, L., Gaiani, S., Piscaglia, F.,
Carbone, C., Misitnao, B., Corinaldesi, R., (1996), Circadian occurance of variceal
bleeding in patients with liver cirrhosis, J. Gastroenterol. Hepatol., Vol.11, p1115-1120.
Smith, L.H., Coats, S.R., Qin, H., Petrie, M.S., Covington, J.W., Su, M., Eren, M.,
Vaughan, D.E., (2004) Differential and opposing regulation of PAI-1 promoter activity by
estrogen receptor alpha and estrogen receptor beta in endothelial cells, Circ. Res., Vol.95,
p269-275.

References
189
Song, C.Z., Siok, T.E., Gelehrter, T.D., (1998), Smad4/DPC4 and Smad3 mediate
transforming growth factor-beta (TGF-beta) signalling through direct binding to a novel
TGF-beta-responsive element in the human plasminogen activator inhibitor-1 promoter, J.
Biol. Chem., Vol.273, p29287-29290.
Sporn, L.A., Chavin, S.I., Marder, V.J., (1985), Biosynthesis of von Willebrand factor by
human megakaryocytes, J. Clin. Invest., Vol.76, p1102-1106.
Stringer, H.A., van Swieten, P., Heijnen, H.F., Sixma, J.J., Pannekoek, H., (1994),
Plasminogen activator inhibitor-1 released from activated platelets plays a key role in
thrombolysis resistance. Studies with thrombi generated in the Chandler loop, Arterioscler.
Thromb., Vol:14, p1452-1458.
Suzawa, H., Kiuchi, S., Arai, N., Koda, A., (1992), The mechanism involved in the
inhibitory action of tranilast on collagen biosynthesis of keloid fibroblasts, Jpn. J.
Pharmacol., Vol.60, p91-96.
Swiatkowska, M., Szemraj, J., Cierniewski, C.S., (2005), Induction of PAI-1 expression by
tumor necrosis factor alpha in endothelial cells is mediated by its responsive element
located in the 4G/5G site, FEBS J., Vol.272, p5821-5831.
References
190
Takata, M., Burioka, N., Ohdo, S., et al., (2002), Daily expression of mRNAs for the
mammalian Clock genes Per2 and clock in mouse suprachiasmatic nuclei and liver and
human peripheral blood mononuclear cells, Jpn. J. Pharmacol., Vol.90, p263-269.
Takimoto, M., Hamada, A., Tomoda, A., et al., (2005), Daily expression of clock genes in
whole blood cells in healthy subjects and a patient with circadian rhythm sleep disorder,
Am. J. Physiol. Regul. Integr. Comp. Physiol., Vol.289, pR1273-9.
Teboul, M., Barrat-Petit, M.A., Li, X.M., et al., (2005), Atypical patterns of circadian clock
gene expression in human peripheral blood mononuclear cells, J. Mol. Med., Vol.83, p693-
699.
Thögersen, A.M., Jansson, J.H., Boman, K., Nilsson, T.K., Weinehall, L., Huhtasaari, F.,
Hallmans, G., (1998), High plasminogen activator inhibitor and tissue plasminogen
activator levels in plasma precede a first acute myocardial infarction in both mean and
women: evidence for the fibrinolytic system as an independent primary risk factor,
Circulation, Vol.98, p2241-2247.
Tofler, G.H., Massasro, J., Levy, D., Mittleman, M., Sutherland, P., Lipinska, I., Muller,
J.E., D’Agostino, R.B., (2005), Relation of the pro-thrombotic state to increasing age (from
the Framingham Offspring Study), Am. J. Cardiol., Vol.96, p1280-1283.

References
191
Treichel, J.A., Reddington, M., Kreutzberg, G.W., (1998), Regulation of plasminogen
activator inhibitor-1 mRNA accumulation by basic fibroblast growth factor and
transforming growth factor-beta1 in cultured rat astrocytes, J. Neurochem., Vol.71, p1944-
1952.
Tsementzis, S.A., Gill, G.S., Hitchcock, E.R., Gill, S.K., Beevers, D.G., (1985), Diurnal
variation and activity during the onset of strike, Neurosurgery, Vol:17, p901-904.
Tsuchida, K., Sunada, Y., Noji, S., Murakami, T., Uezumi, A., Nakatani, M., Inhibitors of
the TGF-beta superfamily and their clinical applications, Mini Rev. Med. Chem., Vol.6,
p1255-1261.
Tsuchiya, Y., Minami, I., Kadotaini, H., Nishida, E., (2005), Resetting of peripheral
circadian clock by prostaglandin E2, EMBO Rep., Vol.6, p256-261.
Tsujino, T., Naito, Y., Kawasaki, D., Okuda, S., Sakoda, T., Fujioka, Y., Sugaya, T.,
Ohyanagi, M., (2005), Circadian expression of plasminogen activator inhibitor-1 in
angiotensin II type 1a receptor knockout mice, Clin. Exp. Hypertens., Vol.27, p159-168.
Undar, L., Ertugrul, C., Altunbas, H. and Akca, S., (1999), Circadian variations in natural
coagulation inhibitors protein C, protein S and antithrombin in healthy men: a possible
association with interleukin-6, Thromb. Haemost., Vol.81, p571-575.

References
192
van Giezein, J.J., Nerme, V., Abrahamsson, T., (1998), PAI-1 inhibitor enhances the lysis
of the platelet-rich part of arterial-like thrombi formed in vitro. A comparative studying
using thrombi prepared from rat and human blood, Blood Coagul. Fibrinolysis, Vol.9, p11-
18.
van Zonneveld., A.J., Curriden, S.A., Loskutoff, D.J., (1988), Type 1 plasminogen activator
inhibitor gene: Functional analysis and glucocorticoid regulation of its promoter, Proc Natl
Acad Sci USA, Vol:85, p5525-9.
Vaughan, D.E., (2005) PAI-1 and atherothrombosis, J. Thromb. Haemost., Vol.3, p1879-
1883.
Ward, M.R., Sasahara, T., Agrotis, A., Dilley, R.J., Jennings, G.L., Bobik, A., (1998),
Inhibitory effects of tranilast on expression of transforming growth factor-beta isoforms
and receptors in injured arteries, Atherosclerosis, Vol.137, p267-275.
Warshaw, A.L., Laster, L., Shulman, N.R., (1967), Protein synthesis by human platelets, J.
Biol. Chem., Vol.242, p2094-2097.
Westgate, E.J., Cheng, Y., Reilly, D.F., Price, T.S., Walisser, J.A., Bradfield, C.A.,
FitzGerald, G.A., (2008), Genetic components of the circadian clock regulates
thrombogenesis in vivo, Circulation, Vol.117, p2087-2095.
References
193
Weyrich, A.S., Elstad, M.R., McEver, R.P., Mcintyre, T.M., Moore, K.L., Morrissey, J.H.,
Prescott, S.M., Zimmerman, G.A., (1996), Activated platelets signal chemokine synthesis
by human monocytes, J. Clin. Invest., Vol.97, p1525-1534.
Weyrich, A.S., Dixon, D.A., Pabla, R., Elstad, M.R., McIntyre, T.M., Prescott, S.M.,
Zimmerman, G.A., (1998), Signal-dependent translation of a regulatory protein, Bcl-3, in
actuvated human platelets, Proc. Natl. Acad. Sci. U S A, Vol.95, p5556-5561.
Wick, W., Naumann, U., Weller, M., (2006), Transforming growth factor-beta: a molecular
target for the future therapy of glioblastoma, Curr. Pharm. Des., Vol.12, p341-349.
Wolf, G., Renal injury due to rennin-angiotensin-aldosterone system activation of the
transforming growth factor-beta pathway, Kidney Int., Vol.70, p1914-1919.
Yamada, Y., Izawa, H., Ichihara, S., Takatsu, F., Ishihara, H., Hirayama, H., Sone, T.,
Tanaka, M., Yokota, M., (2002), Prediction of the risk of myocardial infarction from
polymorphisms in candidate genes, N. Engl. J. Med., Vol.347, p1916-1923.
Ye, Z., Liu, E.H., Higgins, J.P., Keavney, B.D, Lowe, G.D, Collins, R, Danesh, J., (2006),
Seven haemostatic gene polymorphisms in coronary disease: meta-analysis of 66,155 cases
and 91,307 controls, Lancet, Vol.367, p1729-1730.

References
194
Yeo, E.L., Sheppard, J.I., and Feuerstein, I.A., (1994), Role of P-selectin and leukocyte
activation in polymorphonuclear cell adhesion to surface adherent activated platelets under
physiologic shear conditions, (an injury vessel wall model), Blood, Vol.83, p2498-2507.
Yin. L., and Lazar M.A., (2005), The orhphan nuclear recpetor rev-erbα recruits the N-
CoR/histone deactylase 3 corepressor to regulate the circadian bmal1 gene, Mol.
Endocrinol., Vol:19, p1452-1459.
Zhou, Y., Poczatek, M.H., Berecek, K.H., Murphy-Ullrich, J.E., (2006), Thrombospondin 1
mediates angiotensin II induction of TGF-beta activation by cardiac and renal cells under
both high and low glucose conditions, Biochem. Biophys. Res. Commun., Vol.339, p633-
641.

Chapter 9
Appendix

Appendix
195
9.1 – Optimisation of semi-quantitative PCR
To study the expression of Pai-1 and the core clock genes, various parameters were
examined to produce the optimal PCR condition, including cycle number, primer design
and template concentration. The cDNA used for the optimisation process was prepared
from monocytes that had been stimulated with LPS for 4 h.
9.1.1 – Optimising cycle number for 18s and Pai-1
The number of amplification cycles necessary to produce a band visible on a gel
depends largely on the starting concentration of the target DNA and the gene under
investigation. Additionally, the number of cycles for amplification must not be too high
as to allow the PCR products to become saturated. The opposite is also true, where the
cycle number must not be too low to produce the minimal amount of PCR product that
can only just be seen on a gel.
The intensity of the 18s amplicons could be seen to gradually increase from 24 to 26
cycles (Fig. 9.1). The PCR amplification then increased linearly from 27 to 32 cycles.
For 18s, the most appropriate number of amplification to use was 30 cycles, which fell
in the mid-point of the curve (Fig. 9.1). Choosing the most suitable cycle number for
Pai-1 was more difficult, as the exponential phase occurred over a smaller range (Fig.
9.2). However, 34 cycles was chosen in preference to 35 cycles, because reducing the
cycle number increased the specificity of the PCR reaction. The same procedure was
also preformed for Bmal1, Bmal2, Dec1, mPer2 and Clock and the optimal cycle
number for each gene is shown in table 3.1.

Appendix
196
+1349bp
+1548bp
A Sense
Antisense
200bp
Primer No.Of
Base Pairs
GC Content
(%)
Melting Tempertaure
(˚C)
Sequence (5' to 3')
Sense 20 50 55.5 GTGGAGCCATTTGTTTGGTTAntisense 20 60 57.5 CGCTGAGCCAGTCAGTGTAG
B
0
10000
20000
30000
40000
50000
24 25 26 27 29 30 31 32
Cycle Number
Ge
l In
ten
sit
y o
f A
mp
lic
on
Figure 9.1 – Optimisation of 18s for semi-quantitative PCR.A. Schematic diagram of primers binding on 18s. The PCR amplifies the region +1349bp to +1548bp from the transcriptional start site, resulting in a 200bp product. B. Characteristic of primers, C. Gel intensity of 18s amplicons in relation to cycle number.
Exon
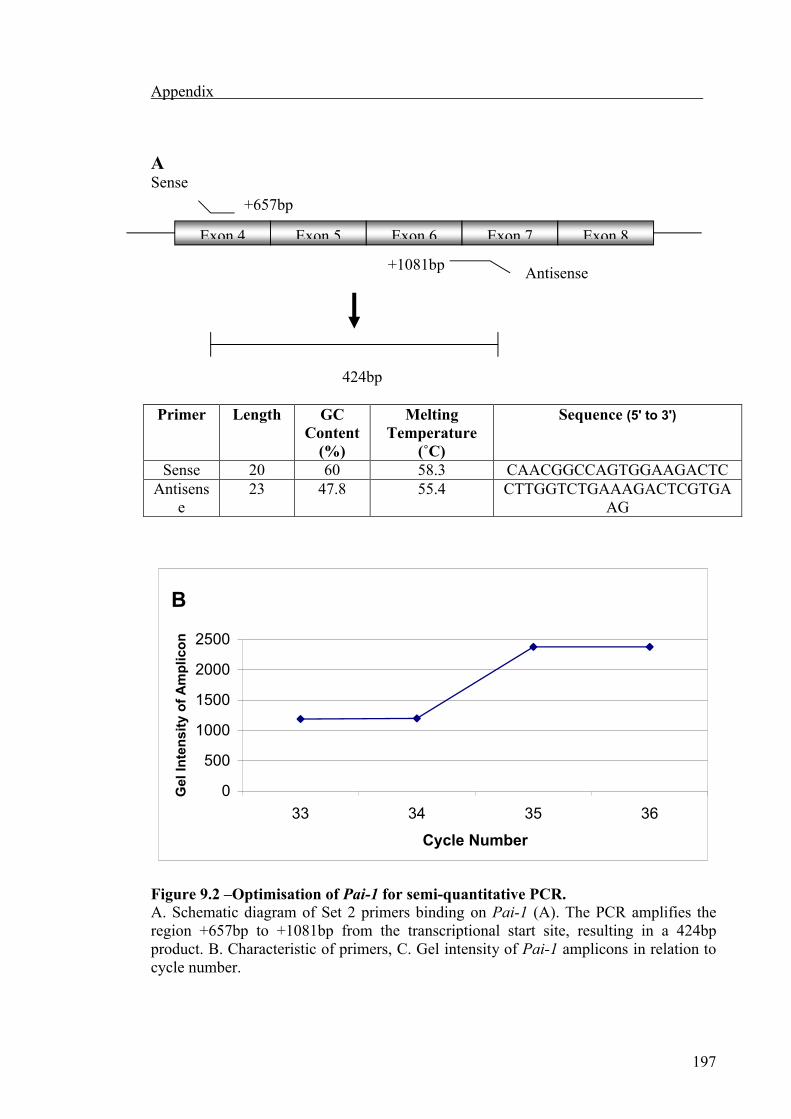
Appendix
197
+657bp
+1081bp
ASense
Antisense
424bp
Primer Length GC Content
(%)
Melting Temperature
(˚C)
Sequence (5' to 3')
Sense 20 60 58.3 CAACGGCCAGTGGAAGACTCAntisens
e23 47.8 55.4 CTTGGTCTGAAAGACTCGTGA
AG
B
0
500
1000
1500
2000
2500
33 34 35 36
Cycle Number
Gel
In
ten
sity
of
Am
pli
con
Figure 9.2 –Optimisation of Pai-1 for semi-quantitative PCR.A. Schematic diagram of Set 2 primers binding on Pai-1 (A). The PCR amplifies the region +657bp to +1081bp from the transcriptional start site, resulting in a 424bp product. B. Characteristic of primers, C. Gel intensity of Pai-1 amplicons in relation to cycle number.
Exon 4 Exon 5 Exon 6 Exon 7 Exon 8

Appendix
198
9.1.2 – Optimising Pai-1 primer pairs
One of the most critical parameters for successful PCR is the design of primers. A
poorly designed primer can result in little or no product due to non-specific
amplification and/or primer-dimer formation, which can become competitive enough to
suppress product formation. It is well established that the 3΄ terminal position in PCR
primers is essential for the control of mis-priming (Kwok et al., 1990). Most of the
primers designed in this study were “stickier” on their 5΄ ends than on their 3΄ ends. A
sticky end was indicated by a high G/C content.
Gene Control CRP-XL LPS
18s 29 29 29
Pai-1 36 30 33
Dec1 27 24 24
Bmal2 31 31 31
Bmal1 29 29 29
mPer2 30 30 30
Clock 30 30 30
Table 9.1 – Optimal cycle numbers used to amplify the various genes.The optimal number of amplification cycles for each gene was found to vary depending on the stimulus, where CRP-XL were monocytes stimulated with cross-linked collagen-related peptide, and LPS were monocytes incubated with lipopolysaccharides. Monocytes were stimulated by both agonists for 4 h at 37˚C.

Appendix
199
500bpUnspecific Product
PAI-1 Product at424bp
100bp Ladder Lane 2 Lane 3 Lane 4
A
B
C
Figure 9.3 – Pai-1 optimisation of Pai-1 primers for semi-quantitative PCR. A. Pai-1 amplified with primer set 1 (10ng template). B. Pai-1 amplified with primer set 2 (10ng template). C. Pai-1 amplified with primer set 2 (20ng template). Lane 1 is 100bp ladder, lane 2 is the amplicon resulting from amplifying mRNA in moncytes that were extracted immediately, lane 3 is the amplicons yielding from mRNA in moncytes that were incubated at 37˚C for 4 h without stimulation, lane 4 is the amplicon from mRNA in moncytes that were incubated at 37˚C for 4 h with LPS.

Appendix
200
The first set of primers designed for Pai-1 had a “sticky” 3΄ end and produced a single
band of 300bp representing the Pai-1 amplicon as can be seen in lane 2 (Fig. 9.3 –
mRNA from monocytes that had not been stimulated). The same PCR product could be
seen in mRNA amplified from monocytes that had been incubated at 37˚C for 4hrs (lane
3), or for 4hrs with LPS (lane 4). However, an extra PCR product was also observed in
these two lanes of approximately 350bp (Fig. 9.3 A). This was due to the primer
annealing at multiple sites on the template DNA. The Pai-1 primers were re-designed to
have a “stickier” 5΄ end, which resulted in a more specific PCR reaction that yielded
only one band of 450bp (Fig. 9.3 B). When possible, a “G” or “C” was included at the
3΄ end (termed GC clamp) to reduce spurious secondary bands (Sheffield et al., 1989).
9.1.3 – Optimising template DNA concentration
The concentration of template DNA can also affect the efficiency and specificity of a
PCR reaction. Inadequate concentration of DNA would result in the PCR especially
prone to PCR induced artefacts. In an effort to improve the efficiency of the PCR, the
template concentration was increased from 10ng to 20ng (1μl to 2μl) in the PCR
reactions and resulted in the smearing of bands when subjected to gel electrophoresis.
This occurred in all three lanes shown in Fig. 9.3 C, where lane 2 is the amplicon
resulting from amplifying mRNA in monocytes that were extracted immediately, lane 3
is the amplicons yielding from amplifying mRNA in monocytes that were incubated at
37˚C for 4hrs, lane 4 is the amplicon produced amplifying mRNA from monocytes that
were stimulated by LPS and incubated at 37˚C for 4hrs. These results may be due to the
primer/template ratio being too high, which results in a higher probability to generate
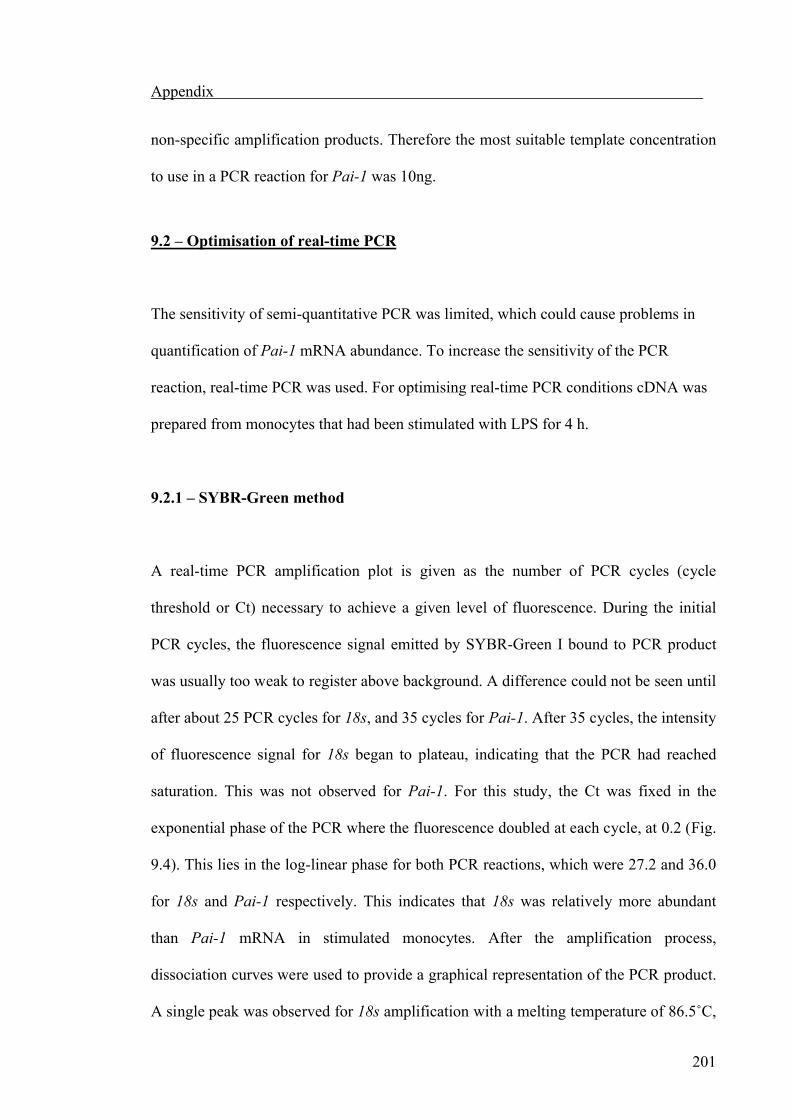
Appendix
201
non-specific amplification products. Therefore the most suitable template concentration
to use in a PCR reaction for Pai-1 was 10ng.
9.2 – Optimisation of real-time PCR
The sensitivity of semi-quantitative PCR was limited, which could cause problems in
quantification of Pai-1 mRNA abundance. To increase the sensitivity of the PCR
reaction, real-time PCR was used. For optimising real-time PCR conditions cDNA was
prepared from monocytes that had been stimulated with LPS for 4 h.
9.2.1 – SYBR-Green method
A real-time PCR amplification plot is given as the number of PCR cycles (cycle
threshold or Ct) necessary to achieve a given level of fluorescence. During the initial
PCR cycles, the fluorescence signal emitted by SYBR-Green I bound to PCR product
was usually too weak to register above background. A difference could not be seen until
after about 25 PCR cycles for 18s, and 35 cycles for Pai-1. After 35 cycles, the intensity
of fluorescence signal for 18s began to plateau, indicating that the PCR had reached
saturation. This was not observed for Pai-1. For this study, the Ct was fixed in the
exponential phase of the PCR where the fluorescence doubled at each cycle, at 0.2 (Fig.
9.4). This lies in the log-linear phase for both PCR reactions, which were 27.2 and 36.0
for 18s and Pai-1 respectively. This indicates that 18s was relatively more abundant
than Pai-1 mRNA in stimulated monocytes. After the amplification process,
dissociation curves were used to provide a graphical representation of the PCR product.
A single peak was observed for 18s amplification with a melting temperature of 86.5˚C,

Appendix
202
however Pai-1 produced several peaks, one main peak at 87˚C, and a few smaller peaks
at 80.5˚C, 77˚C and 74˚C (Fig. 9.4). The PCR products were further confirmed by gel
electrophesis. The 18s PCR reaction produced one 200bp band, whereas Pai-1 product
gave variable appearances in the gel, sometimes resulting in a smear around 450bp (Fig.
9.4).
The optimisation of template concentration is essential, as explained in section 9.1.3. A
range of concentrations of template DNA was used for Pai-1 PCR (table 3.2, Fig. 9.5),
after non-specific products were found in Pai-1 PCR. High template concentration,
resulted in less Pai-1 PCR product formed, and more non-specific products produced.
The lower template concentration resulted in primer-dimers, which was due to the low
abundance of Pai-1 transcripts.
Template Concentration (ng) Pai-1 Average Ct Value
2.5 37.6
5 36.0
10 34.5
20 29.7
30 29.3
Table 9.2 – Ct values for Pai-1 PCR at different template concentrationThe Ct values to reach exponential phase of Pai-1 PCR with various template concentration.
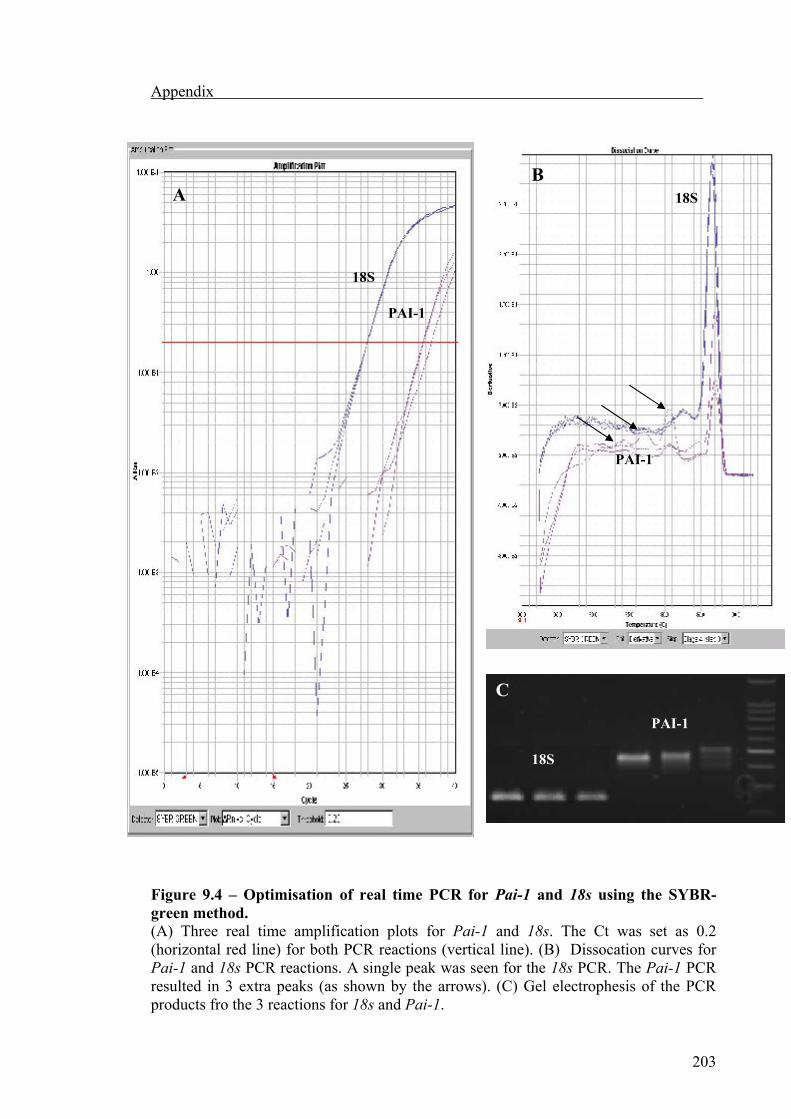
Appendix
203
Figure 9.4 – Optimisation of real time PCR for Pai-1 and 18s using the SYBR-green method.(A) Three real time amplification plots for Pai-1 and 18s. The Ct was set as 0.2 (horizontal red line) for both PCR reactions (vertical line). (B) Dissocation curves for Pai-1 and 18s PCR reactions. A single peak was seen for the 18s PCR. The Pai-1 PCR resulted in 3 extra peaks (as shown by the arrows). (C) Gel electrophesis of the PCR products fro the 3 reactions for 18s and Pai-1.
18S
PAI-1
A
18S
PAI-1
C
18S
PAI-1
18S
PAI-1
B

Appendix
204
Figure 9.5 – Effect of template concentration on Pai-1 dissociation curves using the SYBR-green method. Dissociation curves showing the results of varying template concentrations. (A) Using 2.5 ng template resulted in primer-dimers . (B) Using 20 ng and 30 ng produced non-specific products (arrows).
Primer-dimer
PAI-1 product
20ng
30ng
A B

Appendix
205
9.2.2 – TaqMan method
Taking the results together so far, it appears that the SYBR-Green I method lacked
sensitivity for Pai-1 mRNA in stimulated monocytes; no plateau phase was reached in
the Pai-1 PCR reaction, and the Pai-1 PCR sometimes produced non-specific products.
To increase the level of sensitivity, the TaqMan method was employed. The 5΄ nuclease
activity is based on the specific hybridisation of a dual labelled TaqMan. The detection
method is the same as SYBR-Green I. The exponential phase of the PCR occurred at
22.7 and 37 cycles for 18s and Pai-1 respectively, suggesting again that 18s expression
is higher than Pai-1. The plateau phase was reached after 30 cycles in 18s PCR, and 44
cycles for Pai-1. The Ct value of Pai-1 were simliar in both the TaqMan and SYBR-
Green I methods indicate that the sensitivity of Pai-1 PCR have not increased with the
TaqMan approach. However, the additional level of specificity introduced by the
hybridisation of the PCR product to a specific fluorescent TaqMan probe was evident.
The PCR products were further confirmed by gel electrophesis. The 18s PCR reaction
produced one 200bp band, and Pai-1 yeilded a single 100bp band (Fig. 9.6). No
additional bands can be observed other than the product band, indicating no primer-
dimer nor non-specific product. Due to this additional level of specificity no further
optimisation was required.
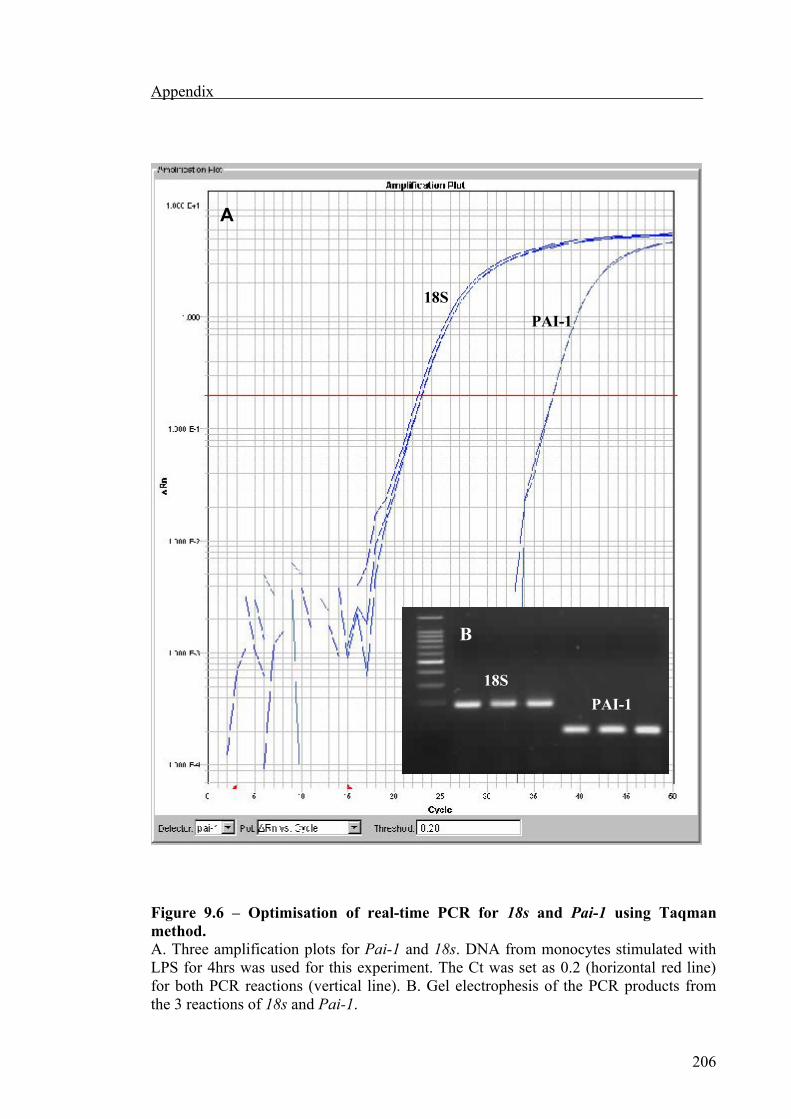
Appendix
206
Figure 9.6 – Optimisation of real-time PCR for 18s and Pai-1 using Taqman method.A. Three amplification plots for Pai-1 and 18s. DNA from monocytes stimulated with LPS for 4hrs was used for this experiment. The Ct was set as 0.2 (horizontal red line) for both PCR reactions (vertical line). B. Gel electrophesis of the PCR products from the 3 reactions of 18s and Pai-1.
18S
PAI-1
A
B
18S
PAI-1

Appendix
207
9.3 – Optimisation of PCR conditions
The induction of monocyte Pai-1 by activated platelets was initially investigated using
semi-quantitative RT-PCR. In terms of quantification of Pai-1 mRNA, this technique
was not appropriate due to its low sensitivity. To increase the sensitivity of the PCR
reaction, real-time PCR was used. Two types of detection methods are available, and the
first examined was SYBR-Green I. Upon binding to double stranded DNA the SYBR-
Green I dye produces a fluorescence to allow detection. In comparison to ethidium
bromide used in semi-quantitative RT-PCR, SYBR-Green I has a higher sensitivity, and
better signal-to-noise ratio. After optimisation of parameters such as design of primers
and template cDNA concentration, it was demonstrated that the SYBR-Green I method
may still lack sensitivity for Pai-1 mRNA in stimulated monocytes, and the Pai-1 PCR
sometimes produced non-specific products evident in the additional bands seen when
the PCR products were visualised on an agrose gel. To address this problem, TaqMan
was employed for the detection of PCR product. The sensitivity of detection was
increased further as the 5΄ nuclease activity is based on the specific hybridisation of a
dual labelled TaqMan. When the resulting PCR products were examined on an agrose
gel, no additional bands were observed other than the product band, indicating no
primer-dimer or non-specific product was yielded. In summary semi-quantitative PCR,
although a cheaper method, required the most optimisation, and was the least specific
and sensitive method. The sensitivity of detection with SYBR-Green I may be
compromised by the formation of primers-dimers, lack of specificity and the formation
of secondary structures in the PCR products. In the experiments discussed in this study,

Appendix
208
real-time PCR (TaqMan) will be utilised to measure Pai-1 due to its low level of
expression.
The internal gene expression control used in these experiments was 18s. Some have
criticised the use of 18s as a house-keeping gene due to the gene containing only one
exon, therefore contamination of DNA would not be detected. There are a host of
alternative control genes that could have been employed such actin and GAPDH.
However, as mRNA was extracted using oligo-dT beads and the buffer contains
DNAase, DNA contamination was not an issue under these experimental conditions.
The expression of cyclophilin was also measured to validate the use of 18s as a control
gene (data not shown). There was no detectable difference between the expression of
various monocyte preparations in 18s and cyclophilin expression.