the relationship between employee benefit satisfaction and
TRANSCRIPT

UNLV Retrospective Theses & Dissertations
1-1-1998
The relationship between employee benefit satisfaction and The relationship between employee benefit satisfaction and
organizational commitment organizational commitment
Rachel Sheli Shinnar University of Nevada, Las Vegas
Follow this and additional works at: https://digitalscholarship.unlv.edu/rtds
Repository Citation Repository Citation Shinnar, Rachel Sheli, "The relationship between employee benefit satisfaction and organizational commitment" (1998). UNLV Retrospective Theses & Dissertations. 942. http://dx.doi.org/10.25669/hbhe-m117
This Thesis is protected by copyright and/or related rights. It has been brought to you by Digital Scholarship@UNLV with permission from the rights-holder(s). You are free to use this Thesis in any way that is permitted by the copyright and related rights legislation that applies to your use. For other uses you need to obtain permission from the rights-holder(s) directly, unless additional rights are indicated by a Creative Commons license in the record and/or on the work itself. This Thesis has been accepted for inclusion in UNLV Retrospective Theses & Dissertations by an authorized administrator of Digital Scholarship@UNLV. For more information, please contact [email protected].

INFORMATION TO USERS
This manuscript has been reproduced from the microfilm master. UMI
films the text directly from the original or copy submitted. Thus, some
thesis and dissertation copies are in typewriter fiice, while others may be
from any type o f computer printer.
The quality of this reproduction is dependent upon the quality of the
copy submitted. Broken or indistinct print, colored or poor quality
illustrations and photographs, print bleedthrough, substandard margins,
and improper alignment can adversely affect reproduction.
In the unlikely event that the author did not send UMI a complete
manuscript and there are missing pages, these will be noted. Also, if
unauthorized copyright material had to be removed, a note will indicate
the deletion.
Oversize materials (e.g., maps, drawings, charts) are reproduced by
sectioning the original, beginning at the upper left-hand comer and
continuing from left to right in equal sections with small overlaps. Each
original is also photographed in one exposure and is irrrluded in reduced
form at the back o f the book.
Photographs included in the original manuscript have been reproduced
xerographically in this copy. Higher quality 6” x 9” black and white
photographic prints are available for any photographs or illustrations
appearing in this copy for an additional charge. Contact UMI directly to
order.
UMIABell &Howdl Infoimation Conq)aiqr
300 North Zed) Road, Ann Aiix>r MI 48106-1346 USA 313/761-4700 800/521-0600
Reproduced with permission of the copyright owner. Further reproduction prohibited without permission.

Reproduced with permission of the copyright owner. Further reproduction prohibited without permission.

NOTE TO USERS
The original document received by UMI contains pages with indistinct print. Pages were microfilmed as received.
This reproduction is the best copy available
UMI
Reproduced with permission of the copyright owner. Further reproduction prohibited without permission.

Reproduced with permission of the copyright owner. Further reproduction prohibited without permission.
THE RELATIONSHIP BETWEEN EMPLOYEE BENEFIT
SATISFACTION AND ORGANIZATIONAL
COMMITMENT
by
Rachel S. Shinnar
Bachelors of Arts Tel Aviv University, Israel
1996
A thesis submitted in partial fulfillment o f the requirement of the degree of
Master of Sciences
in
Hotel Administration
William F. Harrah College of Hotel Administration University of Nevada, Las Vegas
December 1998
Reproduced with permission of the copyright owner. Further reproduction prohibited without permission.

DMI Number: 1393767
UMI Microform 1393767 Copyright 1999, by UMI Company. All rights reserved.
This microform edition is protected against unauthorized copying under Title 17, United States Code.
UMI300 North Zeeb Road Ann Arbor, MI 48103
Reproduced with permission of the copyright owner. Further reproduction prohibited without permission.
UNTV Thesis ApprovalThe Graduate College University of Nevada, Las Vegas
November 17 jg 98
The Thesis prepared by
Rachel S. Shinnar
Entitled
The Relationship Between Employee Benefit Satisfaction and
Organizational Commitment
is approved in partial fulfillment of the requirements for the degree of
M aster o f Sciences in H otel A dm in is tra tio n
Examination Committee Member
\ember
Graduate College Faculty Representative
Examination Committee Chair
Dean of tl tuale College
U
Reproduced with permission of the copyright owner. Further reproduction prohibited without permission.
ABSTRACT
The Relationship Between Employee Benefit Satisfaction and Organizational
Commitment
by
Rachel S. Shinnar
Dr. Gail Sammons, Examination Committee Chair Professor of Hotel Administration University of Nevada, Las Vegas
The purpose of this study was to examine the influence of individual
characteristics, benefit satisfaction, and internal services received on employee job
satisfaction and organizational commitment. Employees from a Las Vegas casino hotel
were surveyed. A total of 201 usable questionnaires were returned for a response rate of
51 percent. The findings showed that benefit satisfaction and organizational commitment
are positively related. Satisfaction with internal services was found to be significantly
related to organizational commitment, and communication received was significantly
related with benefit satisfaction. Only few of the sociodemographic variables were found
to be significantly related to benefit satisfaction, job satisfaction, and organizational
commitment. Based on the research findings practical implications for industry are
discussed and suggestions for future research are offered.
Ill
Reproduced with permission of the copyright owner. Further reproduction prohibited without permission.

TABLE OF CONTENTS
ABSTRACT............................................................................................................................. iii
LIST OF TABLES.................................................................................................................. vi
AKNOWLEDGMENTS........................................................................................................ vii
CHAPTER I INTRODUCTION............................................................................................. 1Background................................................................................................................... 1Purpose of the Research...............................................................................................2Problem Statement....................................................................................................... 4Research Questions...................................................................................................... 4Limitations of the Study..............................................................................................7Definitions of Terms.................................................................................................... 9Summary..................................................................................................................... 11
CHAPTER 2 LITERATURE REVIEW............................................................................... 13Employee Benefit Definition.....................................................................................13History and Development of Employee Benefits.................................................... 14Structure o f Benefit Packages....................................................................................15Factors in Benefit Satisfaction.................................................................................. 16Organizational Commitment Definition...................................................................18Employee Turnover...................................................................................................20Types of Employee Benefits..................................................................................... 23
Short Term Benefits...................................................................................... 23Long Term Benefits...................................................................................... 28
Benefit Communication............................................................................................ 29Internal Service Quality.............................................................................................31Employee Benefit Satisfaction and Organizational Commitment......................... 34Employee Benefit Satisfaction and Turnover.......................................................... 36Summary.....................................................................................................................38
CHAPTER 3 METHODOLOGY......................................................................................... 39Introduction................................................................................................................ 39Research Questions....................................................................................................39Hypothesis.................................................................................................................. 40Overview of Questionnaire Design...........................................................................41Population.................................................................................................................. 48
IV
Reproduced with permission of the copyright owner. Further reproduction prohibited without permission.

Sampling Procedures................................................................................................. 48Data Collection Procedures........................................................................................49Data A nalysis.............................................................................................................51Summary .............................................................................................................52
CHAPTER 4 RESULTS.........................................................................................................53Introduction .............................................................................................................53Demographic Profile o f the Sample..........................................................................53Employment Profile of the Sample........................................................................... 56
Departmental Representation........................................................................56Job Classification...........................................................................................58Tenure.............................................................................................................58Other Employment Issues............................................................................. 60
Benefit Satisfaction with Individual Benefits.......................................................... 61Benefit Satisfaction Union Versus Non Union Employees.................................... 63Computed Scores........................................................................................................65Overall Benefit Satisfaction and Satisfaction With Benefit Coverage andPerceived Value..........................................................................................................66Benefit Communication............................................................................................. 67Hypothesis Testing..................................................................................................... 69
Hypothesis 1................................................................................................... 69Hypothesis 2................................................................................................... 69Hypothesis 3................................................................................................... 71Hypothesis 4 ................................................................................................... 77
Summary......................................................................................................................79
CHAPTER 5 SUMMARY, RECOMMENDATIONS, AND CONCLUSIONS .............80Introduction .............................................................................................................80Discussion of Results................................................................................................. 81
Demographic Data......................................................................................... 81Hypothesis Testing.........................................................................................82
Hypothesis 1.......................................................................................83Hypothesis 2.......................................................................................84Hypothesis 3.......................................................................................85Hypothesis 4.......................................................................................86
Recommendations for Future Research....................................................................91Industry Implications................................................................................................. 93Conclusion...................................................................................................................95
APPENDIX A SURVEY AND LETTER TO PARTICIPANTS....................................... 98
APPENDIX B HUMAN SUBJECTS APPROVAL FORM............................................. 107
REFERENCES...................................................................................................................... 109
VITA.......................................................................................................................................114
Reproduced with permission of the copyright owner. Further reproduction prohibited without permission.

LIST OF TABLES
Table 1 Age Categories................................................................................................ 54Table 2 Demographic Profile of the Sample...............................................................55Table 3 Departmental Representation......................................................................... 57Table 4 Job Classification............................................................................................ 58Table 5 Tenure with the Hotel.....................................................................................59Table 6 Tenure with the Hotel for Employees o f Tenure Longer than One Year... 59Table 7 Tenure in the Hotel, the Position, and the Hospitality Industry.................. 60Table 8 Employment Issues of the Individual........................................................... 61Table 9 Benefit Satisfaction with Individual Benefits for All Employees.............. 62Table 10 Benefit Satisfaction with Individual Benefits o f Union Versus
Non-Union Employees...................................................................................64Table 11 General Scores................................................................................................ 65Table 12 Overall Benefit Satisfaction with Benefit Coverage and Perceived Value
for All Employees.......................................................................................... 66Table 13 Overall Benefit Satisfaction with Benefit Coverage and Perceived Value
for Union Versus Non-Union Employees.................................................... 67Table 14 Benefit Use Frequency....................................................................................68Table 15 Descriptive Statistics and Correlations among Study Variables..................72Table 16 ANOVA Results for Benefit Satisfaction Measures.................................... 73Table 17 Linear Regression for Benefit Satisfaction and Organizational
Commitment...................................................................................................73Table 18 Satisfaction with Internal Services Received................................................ 74Table 19 ANOVA Results for Seven Components of Internal Services and
Organizational Commitment......................................................................... 74Table 20 ANOVA Results for Seven Components of Internal Services and
Job Satisfaction.............................................................................................. 75Table 21 Standardized Regression Coefficients for Individual Measures of Internal
Service components and Organizational Commitment............................... 75Table 22 Standardized Regression Coefficients for Individual Measures of
Internal Service components and Job Satisfaction...................................... 76Table 23 Linear Regression for Communication Received and Benefit
Satisfaction..................................................................................................... 76Table 24 Descriptive Statistics and Correlations among Study Variables..................78Table 25 Organizational Commitment for Salaried Versus Hourly Employee..........79
VI
Reproduced with permission of the copyright owner. Further reproduction prohibited without permission.

ACKNOWLEDGEMENTS
The author wishes to express her sincere appreciation to the following individuals
for their guidance, participation, support and encouragement throughout the study:
To the owners of the Las Vegas casino hotel for providing information and
hospitality, and allowing me to invade their operations during the five days of data
collection;
To the employees, with out whose participation, this study could not have been
possible;
To Dr. Gail Sammons, advisor and chairperson of this research, for her
continuous guidance and support throughout this author’s graduate study and research;
To Dr. John Stefanelli, for guiding me through the hardships of English grammar
and style;
To Dr. Gerald Goll, for his teachings through out my degree and his guidance
through this graduate paper;
To Dr. Anthony Townsend, for serving as the graduate college representative.
vu
Reproduced with permission of the copyright owner. Further reproduction prohibited without permission.

CHAPTER 1
INTRODUCTION
Background
Competitive salaries are no longer a single attracting factor. Employees want to
receive more than just a salary from their job. Pay has become a given - an expected
reward for 'coming to work'. To stimulate and encourage top performance, growth and
loyalty, employees and employers are looking for something more (Davison, 1997). That
'something more' refers to that part of the total compensation package other than pay,
such as fringe benefits and internal services received. The right combination of these two
factors determines the quality of the workplace and the level of employees' satisfaction
with it, which consequently determines the level of organizational commitment.
Increased organizational commitment results in employees who are more willing to
expend effort for the organization, identify with its values, and maintain affiliation with
the organization (Ward & Davis, 1995).
Lane (1993) and Harris and Fink (1994) are only two of the multitude of
researchers who have examined the impact of employees’ satisfaction level with benefit
packages and internal services received on organizational commitment and intent to stay.
Reproduced with permission of the copyright owner. Further reproduction prohibited without permission.

Such research is important for industry professionals because of the rising costs of
benefits and internal services and the financial burden of turnover.
Employee turnover can be financially consuming, not only because of
replacement related costs, but also because loss of employees negatively affects service
quality which may eventually take a toll on customer volume. Managers, especially in the
labor intensive hospitality industry, must try to retain their employees. This has become
even more important since unemployment rates started falling to an all-time low, a
national 4.5 percent in June 1998, according to the Bureau of Labor statistics data
(www.stats.bls.gov). Increased retention will allow organizations to save fimds otherwise
spent on recruiting, hiring, and training new (replacement) employees, and improve
working conditions, internal services, and employee benefits.
Purpose of the Research
Hospitality managers have to cope with high turnover and service quality control.
The literature suggests that employees’ satisfaction with the quality of internal services
and with the offered benefit packages have an affect on their organizational commitment.
Lane (1993) reported significant relationships between measures of benefit satisfaction
and organizational commitment. Hallowell, Schlesinger and Zomitsky (1996) showed a
strong relationship between the quality of internal services and low turnover rates.
Internal services are services employees receive fi’om internal service providers
such as supervisors or co-workers. These consist o f the following seven components: ( 1 )
tools, (2) policies and procedures, (3) teamwork, (4) management, (5) training, (6)
communication, and (7) rewcrds and recognition (Hallowell et al., 1996).
Reproduced with permission of the copyright owner. Further reproduction prohibited without permission.

The need to study employee satisfaction or dissatisfaction with these issues arises
because of their influence on employee behaviors, including absenteeism, organizational
commitment, turnover, and pro-union voting (Harris & Fink, 1994). Internal services are
based on sensitivity to employees' needs and wants, which serves management in its
effort to create a motivational environment. When certain behavior or actions are
recognized and rewarded, employees will be motivated to perform to the best of their
ability, which would consequently lead to improved customer service. High internal
service quality provides employees with the necessary tools to motivate themselves.
Adequate training that prepares employees for their job requirements, clear and concise
communication, and the granting o f rewards and recognition, are only a few of the
internal service components that can positively affect the work environment.
Employees’ level of satisfaction with their benefits package depends on the
components included in the package, their cost (i.e. coverage level), the degree of control
the employee has on the components (i.e. flexibility), and the level of knowledge the
employee has regarding the available components and their actual value. Therefore it is
important for hospitality managers to identify the best method for employee benefit
allocation. This can help organizations maximize the positive results of employee benefit
packages while minimizing expenses.
A study conducted by a third party will allow employees to express their thoughts
and feelings about the organization they work for. Serving as a channel to voice
employee needs and wants, a study can help organizations mold their benefits package
and the internal service quality in a way that will be most beneficial to both parties. By
identifying what is imperative and what is not, organizations can put together more
Reproduced with permission of the copyright owner. Further reproduction prohibited without permission.

efficient and effective benefits packages. These issues have recently become even more
important due to increased cost of offering benefits. According to the U.S. Labor
Department's Employment Cost Index health insurance and pension costs rose 2.1
percent in 1997 (Hansen, 1998). Furthermore, the latest Towers Perrin Health Care
Survey, conducted in November 1997, predicts a 4 percent increase in the 1998 costs of
health plans (Hansen, 1998).
Problem Statement
The purpose of this study is to examine the influence of internal service quality
and benefit satisfaction on organizational commitment and job satisfaction. Harris and
Fink (1994) propose that employee benefit satisfaction may influence worker’s attitudes
such as organizational commitment. Therefore an understanding of benefit satisfaction
may lead to an increased understanding of other employee attitudes and behaviors
(Williams, 1995). The results may help industry professionals in customizing their
benefits package and shaping the internal service quality in their organization to improve
employees' organizational commitment.
Research Questions
The study proposes to investigate the following questions;
1. Is there a relationship between employee benefit satisfaction and employee
organizational commitment?
Harris & Fink (1994) suggest two reasons for the relationship between benefit
satisfaction and organizational commitment:
Reproduced with permission of the copyright owner. Further reproduction prohibited without permission.

a. Benefits represent a reward associated with a job well done.
b. Benefits represent a signal of the organization’s care and concern for
employees' wellbeing, which may trigger organizational support.
Based on these arguments individuals who are more satisfied with their benefits
will be less likely to letve, less likely to join a union, more likely to comply with
supervisors directives, and more likely to be committed to the organization (Harris &
Fink, 1994).
The type and quality of the benefits package has an influence on employee
decisions. In 1991, for example, half o f all labor strikes were a result of conflict over
health care. Therefore organizations concerned with attracting, motivating, satisfying,
and retaining employees need to consider the needs and desires of their workforce and
labor pool when the benefits package is designed (Bergmann, 1994).
2. Is there a relationship between employees’ satisfaction with the seven components of
internal service and employee organizational commitment?
Hallowell, Schlesinger, and Zomitsky (1996) have studied the affect of internal
service quality on employee job satisfaction, customer service quality, and employee
turnover. They suggested that the satisfaction of employees' needs includes economic
(i.e. wages and benefits) and non-economic needs (i.e. internal services). The components
of internal service believed to have an impact on employees' commitment to an
organization are: (1) tools, (2) policies and procedures, (3) teamwork, (4) management,
(5) training, (6) communication, and (7) rewards and recognition (Hallowell et al., 1996).
Reproduced with permission of the copyright owner. Further reproduction prohibited without permission.

3. Is there a relationship between benefit communication received i.e., communication
between the human resources department and the employee regarding the employee's
understanding of the benefits package, and employee benefit satisfaction?
Employees will hold it against the employer if they are confused about benefits.
Such confusion usually has financial consequences for the employee, for which
management takes the blame. This can lead to a very unhappy and unproductive
workforce (Gribble, 1997). Benefits are in place to enhance the employer-employee
relationship. The fact that benefits have become increasingly complex in recent years
should not change that initial purpose. Ensuring that employees recognize the monetary
value of each item included in their benefits package may increase their appreciation of it
and prevent perceived inequities with benefits packages offered by other organizations.
Discrepancies may be brought to employees' attention through referent others, such as
friends or family employed elsewhere.
4. Is there a relationship between respondents' sociodemographic characteristics and
level of satisfaction with benefits?
Past studies examining these relationships have produced inconsistent results. Rabin
(1994) did not observe any significant relationship between gender and overall benefit
satisfaction, whereas Balkin and Griffeth (1993) found that, generally speaking, women
were more satisfied with their benefits than were men. The results concerning the
relationship between age and benefit satisfaction were equally inconsistent. Williams
(1995) found no significant relationship between gender and age and benefit satisfaction.
On the other hand. Judge (1993) and Rabin (1994) observed a negative relationship
between gender and age and benefit satisfaction. For example, Rabin (1994) found that
Reproduced with permission of the copyright owner. Further reproduction prohibited without permission.

younger employees are more satisfied with flexible benefit plans compared to the
traditional plans.
Limitations of the Study
1. Certain personal attributes may affect respondents' attitudes towards organizational
commitment. Previous studies have found that a respondent’s age has a direct
influence on organizational commitment. Mature adults may be 'locked-in' by age,
and are thus more likely to identify more closely with an organization as their age
increases (Martin & Benett, 1996).
2. This study will depend on the respondents’ ability and willingness to reply to the
survey in an accurate manner.
3. Respondents may have limited knowledge of the contents of their benefits package,
which may bias their responses.
4. There may be a discrepancy between the defirtition of benefits used in this study and
the employees’ perception of what a benefit is.
5. Certain types of benefits, such as pension programs or stock options, reward long
term employees. The long-term natui e of the plan serves as an incentive for
employees to remain with a certain organization, a decision that may have less to do
with overall benefit satisfaction or job satisfaction.
6. Employment history may have an effect on the individual's satisfaction with the
benefits package. If a previous position in a different organization included a superior
benefits package (superior in the eyes of the individual), the current benefits package
may be perceived as non-satisfactory. Additionally, employees may express
Reproduced with permission of the copyright owner. Further reproduction prohibited without permission.

8
satisfaction or dissatisfaction with the benefits package based on comparison with
other benefits packages their friends/relatives are receiving from other organizations.
7. Level of use of the benefits package may influence the employees’ attitude towards
the quality of the benefits package. "Individuals who made extensive use of their
benefits indicated that they received more benefits or higher levels of benefits than
did individuals who reported less extensive use" (Williams, 1995, p.l 119).
8. This study surveyed employees of a casino hotel in Las Vegas, which employs union
and non-union employees. There may be a difference in the perception of, and
satisfaction with, benefits between these two sub-groups because union employees
receive part of their benefits from the union.
9. The recent union contract negotiations, completed in June 1997, included issues such
as wage, health insurance, and pension plans (Bach, 1997). It is likely that these
public bargaining negotiations have contributed to union employees' knowledge
about their benefits and their value. This may lead to a discrepancy in benefit
satisfaction between union and non-union employees.
10. The data collection was done at the Las Vegas casino hotel during employee breaks,
which may have affected the employees’ ability to complete the survey thoroughly
because of the time limit on employee breaks.
11. Because the data collector was situated in the employee dining room, the study was
handed out only to employees who came there during their break or before and after
their shifts. Employees who did not come to the employee dining room did not
receive the survey.
Reproduced with permission of the copyright owner. Further reproduction prohibited without permission.

Definitions of Terms
The following terms are defined as they are used in this research project:
Benefits
In this study benefits are that part of the total compensation package other than
pay for time worked provided to employees in whole or in part by employer payments
(Williams, 1995).
Internal Services
Internal services are services received from internal service providers within the
organization (Hallowell et al., 1996). In this study it will include the following seven
components: (1) tools, (2) policies and procedures, (3) teamwork, (4) management,
(5) training, (6) communication, and (7) rewards and recognition.
Modular Plans
These are a series of different benefit bundles or different levels of coverage
designed for different subgroups of the employee population. Employees can select only
one bimdle, and coverage level substitutions are not allowed (Tremblay, Sire, & Pelchat,
1998).
Reproduced with permission of the copyright owner. Further reproduction prohibited without permission.
10
Core-Plus-Qptions Plans
These are a core group of essential benefits together with a wide array of other benefit
options that employees can add to the core. The core is designed to provide a minimum
level of economic security (Tremblay et al., 1998).
Flexible Benefits Plan
Flexible benefits packages, also called ‘cafeteria plans’, allow "employees to pay
for certain categories of eligible benefits that are not included in the plan, using untaxed
dollars. This type of plan is in fact a bank account used to pay claims and managed by the
employer" (Tremblay et al., 1998, p.668).
Organizational Commitment
Ward and Davis (1995) propose the following three-component model to define
and measure organizational commitment:
1. Continuance commitment, which is being committed to an organization due to the
high cost of leaving.
2. Affective commitment, which is commitment based on positive feelings or
emotions towards the organization.
3. Moral/normative commitment, which is based on the employee having
internalized the values and goals o f the organization.
Employees with strong continuance commitment remain with an organization
because they need to, those with strong affective commitment because they want to, and
those with strong normative commitment because they feel they ought to do so.
Reproduced with permission of the copyright owner. Further reproduction prohibited without permission.

11
Employees can experience each of these psychological states to varying degrees,
therefore the net sum' of a person's commitment to an organization reflects each of these
separable psychological states (Allen & Meyer, 1990).
High organizational commitment results in employees who are more willing to
expend effort for the organization, identify with its values, and have a desire to maintain
affiliation with the organization. Low organizational commitment is associated with
perceptions of career stagnation, stress, family strains, absenteeism, turnover, reduced
performance, and poor compliance with supervisor's directives (Ward & Davis, 1995).
Turnover
Turnover refers to the cessation of membership in an organization by an
individual who received monetary compensation from that organization. Turnover is
often categorized as voluntary or involuntary. Voluntary turnover is turnover initiated by
the employee such as quitting or resigning. Involuntary turnover is initiated by the
organization or by circumstances which were beyond the control o f either the employee
or the organization. Involuntary turnover includes dismissal, layoff, retirement, disability,
and death (Rose, 1991).
Summary
The three main purposes for providing benefits packages are: (1) creating a
competitive edge for attracting new employees, (2) increasing employee motivation and
morale, and (3) retaining employees (Haar & Kossack, 1990). Because of the rising costs
Reproduced with permission of the copyright owner. Further reproduction prohibited without permission.

12
of benefit plans it is imperative to find out what employees want and expect so that
unnecessary expenses can be avoided.
This study will examine employees’ satisfaction with benefits regarding three
main issues; satisfaction with specific benefits, satisfaction with the overall package
coverage level, and perception of the benefits’ value. Understanding the factors that
contribute to benefit satisfaction will allow employers to understand employee attitudes
and behaviors. Such an understanding will permit employers to influence workers’
behaviors and attitudes in the effort to increase organizational commitment and job
satisfaction thus reducing turnover and improving customer service (Williams, 1995).
The study will also look at employees' satisfaction with internal service quality in
the hotel by which they are currently employed. This includes (I) tools, (2) policies and
procedures, (3) teamwork, (4) management, (5) training, (6) communication, and (7)
rewards and recognition. The internal service quality theory suggests that the quality of
the work environment consists of economic (i.e. wages and benefits) and non-economic
rewards (i.e. internal services). A work environment that will satisfy employees’ needs is
likely to increase commitment and job satisfaction.
Reproduced with permission of the copyright owner. Further reproduction prohibited without permission.

CHAPTER 2
LITERATURE fJ^VIEW
Employee Benefit Definition
The U.S. Department of Commerce includes in the definition of a benefit only
legally required payments (e.g social security) and private pension and welfare programs
(e.g. health and life insurance). However, the U.S. Chamber of Commerce also includes
pay for time not worked (e.g. vacation) and miscellaneous benefits (e.g. child-care) in its
definition of a benefit (Harris & Fink, 1994). In this study, benefits are defined as that
part of the total compensation package other than pay for time worked provided to
employees in whole or in part by employer payment (Williams, 1995). This includes a
wide array of benefits from health insurance, life insurance, and automobile insurance to
child care and educational assistance programs. Another group of benefits that will be
examined in this study are workplace-related issues referred to as internal services. These
include (1) tools, (2) policies and procedures, (3) teamwork, (4) management, (5)
training, (6) communication, and (7) rewards and recognition.
13
Reproduced with permission of the copyright owner. Further reproduction prohibited without permission.

14
History and Development of Employee Benefits
When benefits were first introduced in 1929, they represented only three percent
o f total compensation. In 1990, benefits constituted approximately 28 percent (38 cents
added to each dollar of wages) of total compensation for the private sector (Bergmann et
al., 1994). This increase can be partially attributed to the rising costs of specific benefits
(e.g. medical care coverage). However, the breadth of benefits coverage has also
increased. While most early plans provided little more than basic health and retirement
coverage, today's plans often offer profit-sharing and stock ownership benefits, legal,
educational, and child care assistance, dental and vision insurance, and life insurance for
employees and their dependents (Barber, Dunham, & Formisano, 1992).
Other factors contributing to the growth of benefits are societal pressure,
favorable tax treatment, employer self interest, favorable rates from group participation,
employer paternalism, employee desire for increased leisure, employee economic
protection, and union pressure (Bergmann et al., 1994).
In the late 1970s a change in the demographic characteristics of the U.S.
workforce led to the development of a new type of benefits package, the 'cafeteria' or
'flexible' benefit plan. The traditional benefit plans were geared towards the traditional
structure of the employed male, head of household, with a non-working spouse and
children at home. However, this type of benefits package failed to accommodate the
interests of the new workforce (Barber et al., 1992), such as single employees or dual
career couples. For example, Rabin (1994) foimd that employees who have no
dependents often attach little value to life insurance and might prefer other benefits or a
cash alternative.
Reproduced with permission of the copyright owner. Further reproduction prohibited without permission.

15
Advocates of flexible benefit plans claim they can increase satisfaction with
benefits, produce higher levels of motivation and productivity, and increase attraction and
retention of employees. Barber, Dunham, and Formisano (1992) also stress the cost-
containing factor of flexible benefits claiming that cost savings can be realized by (1 )
allowing employees to choose personally valued benefits within a cost constraint, and (2)
improving efficiency of benefit use through increased awareness of benefits cost.
Opponents of flexible benefits point out increased administrative costs incurred when
individual benefits choices are processed, and adverse selection where only heavy users
o f a particular benefit opt for that benefit (Barber et al., 1992).
Structure of Benefit Packages
The rapid growth and change of the workforce has promoted a variety o f benefit
packages. The choice between a traditional or more modem, flexible, package is up to the
employers. The following are some of the plans currently used today:
1. Modular Plans: Consist o f a series of different benefit bundles or different levels
of coverage designed for different subgroups o f the employee population.
Employees can select only one bundle and coverage level substitutions are not
allowed (Tremblay et al., 1998).
2. Core-Plus-Options Plans: Consist o f a core group of essential benefits together
with a wide array of other benefit options that employees can add to the core. The
core is designed to provide a minimum level o f economic security (Tremblay et
al., 1998).
Reproduced with permission of the copyright owner. Further reproduction prohibited without permission.

16
3. Flexible Plans: This plan allows employees to pay for certain categories of
eligible benefits that are not included in the plan, using untaxed dollars. This type
of plan is in fact a bank account used to pay claims that is managed by the
employer. Flexible benefits plans carry many potential advantages. They allow
employees (1) to choose the benefits that best satisfy their personal needs; (2) to
understand and appreciate the benefits offered and the related costs; and (3) to
avoid pointless duplication of benefits for couples with two incomes. Such benefit
packages are also beneficial to the employer as they provide a better way of
satisfying the changing needs of salaried employees, permit the introduction of
new, less costly benefits, and help increase employee satisfaction (Tremblay et
al., 1998).
Factors in Benefit Satisfaction
Danehover and Lust (1992) and Ward and Davis (1995) propose various factors,
which have an impact on overall employee benefit satisfaction and satisfaction with
coverage and perceived value of benefit packages.
1. The employee's needs and expectations, i.e. the beliefs employees hold regarding
the functions a benefits package should perform (Danehover & Lust, 1992). For
example, the employee perception of the organization's financial ability to offer
desired benefits (Ward & Davis, 1995).
2. The sociodemographic characteristics of each individual employee such as age,
gender, education level, health, family status, and number of dependents
(Danehover & Lust, 1992). For example, an employee close to retirement is more
Reproduced with permission of the copyright owner. Further reproduction prohibited without permission.

17
likely to put more emphasis on a pension plan than would a young employee just
starting his or her career.
3. Job-related factors such as pay level, tenure, work environment (i.e. nature of the
job, presence of health hazards), and union status. For example, employees with
long tenure may be more knowledgeable about benefits and therefore expect more
(Danehover & Lust, 1992).
4. The experience with benefit packages (the degree to which the employee has
actually used the available components in the benefits package) influences the
level of knowledge the employee has of the package components (Danehover &
Lust, 1992).
5. The availability of benefits, i.e. the actual offering of benefits including level and
type of coverage (Danehover & Lust, 1992) and employees' influence on the
contents of the package (i.e. flexibility) (Ward & Davis, 1995).
6. The cost structure o f the benefit package. This includes not only the dollar amount
that the package costs but also the coverage percentage and level of deductibles
and co-payments for such things as office visits or medication (Danehover &
Lust, 1992).
7. The equity comparisons to other firms. These are the employees’ perceptions of
the value of the benefits package offered by his or her organization compared to
packages offered by other organizations (Ward & Davis, 1995).
8. The amount of employee benefit education, i.e. the level of communication used
to explain benefits programs to employees (Ward & Davis, 1995). The level of
Reproduced with permission of the copyright owner. Further reproduction prohibited without permission.

18
employee knowledge and understanding of the benefits he or she is entitled to and
at what cost.
Organizational Commitment Definition
Organizational commitment is of interest to managers because it determines
employees' attitudes, behaviors, and intentions. Ward and Davis (1995) propose the
following three-component model to define and measure commitment:
1. Continuance commitment, which is being committed to an organization due to the
high cost of leaving.
2. Affective commitment, which is commitment based on positive feelings or
emotions towards the organization. (See Appendix A, question 1.6 "I am proud to
tell others that I am part of this hotel.")
3. Moral/normative commitment, which is based on the employee having
internalized the values and goals of the organization (See Appendix A, question
1.11 "I find that my values and the hotel's values are very similar."). Employees
who are morally committed to an organization have internalized normative
pressures to act in a way which meets the organizational goals and interests, thus
exhibiting specific behavior because they believe it is the 'right' and 'moral' thing
to do (Allen & Meyer, 1990).
Employees with strong continuance commitment remain with an organization
because they need to, those with strong affective commitment because they want to, and
those with strong normative commitment because they feel they ought to do so (Allen &
Meyer, 1990). Employees can experience each of these psychological states to varying
Reproduced with permission of the copyright owner. Further reproduction prohibited without permission.

19
degrees, therefore the 'net sum' of a person's commitment to an organization reflects each
of these separable psychological states (Allen & Meyer, 1990). High organizational
commitment results in employees who are more willing to expend effort for the
organization, identify with its values, and have a desire to maintain affiliation with the
organization. Low organizational commitment is associated with perceptions of career
stagnation, stress, family strains, absenteeism, turnover, reduced performance, and poor
compliance with supervisor's directives (Ward & Davis, 1995).
However, one should not confuse organizational commitment with job
satisfaction. "Job satisfaction results from evaluation of specific parts of a job, while
organizational commitment is a global reaction to the organization as a whole" (Ward &
Davis, 1995, p.36). An employee can be unsatisfied with his or her job but still have
positive feelings about the organization, or vice versa.
In the effort to reduce turnover, management should attempt to increase the
degree of organizational commitment. This may be achieved once the causal factors of
organizational commitment are identified. Ward and Davis (1995) identify employee
benefit packages as a potential correlate o f organizational commitment, basing their
assumption on the exchange theory. The exchange theory's point of view indicates that
workers perceive and evaluate a balance or imbalance of the costs and benefits of
organizational membership. I f workers perceive a favorable balance between the time,
effort, and knowledge they provide to the organization and the rewards provided by the
organization, they are more committed. From this perspective benefits are categorized as
rewards and are offered to encourage employees to remain with the organization.
Reproduced with permission of the copyright owner. Further reproduction prohibited without permission.

20
Consequently, satisfaction with benefits is expected to have an influence on
organizational commitment.
Previously, continuance commitment (e.g. being committed to an organization
due to the high cost of leaving) caused individuals with preexisting medical conditions to
be reluctant to leave their current positions because of the difficulty of receiving coverage
in a new job. The Consolidated Omnibus Budget Reconciliation Act (COBRA) was
passed to assist employees who were terminated or those who lost coverage because of
reduced hours. This federal statute requires certain group health and dental plans to
provide a continuation of coverage to certain individuals who otherwise no longer qualify
for benefits (www.employease.com). Additionally, the Health Insurance Portability and
Accountability Act of 1996 (HIPAA) protects employees even further. It deals with
insurance coverage for preexisting conditions when an employee moves from one firm to
another (Howard, 1997). This legislation will help prevent the continuance commitment,
or 'job-lock'. which may force unmotivated employees to remain with their current
employers only because they need to stay in their health plan (Howard. 1997).
Employee Turnover
Research at Saratoga Institute has shown that the average internal cost of turnover
for exempt personnel is a minimum o f one year’s pay and benefits, or a maximum of two
years pay and benefits (Fitz-Enz, 1997). However, to obtain the full financial impact of
employee turnover, one also needs to look at the external effects on customer retention
and sales. These external effects are (1) loss of customers, as customers may take their
business elsewhere if they constantly have to deal with new, inexperienced employees.
Reproduced with permission of the copyright owner. Further reproduction prohibited without permission.

21
And (2) the expenditure in marketing and sales to win new customers (Fitz-Enz. 1997).
The employee-based cost consists of four internal sources:
1. The termination cost which includes processing and interviewing (exit interview).
These costs are basically staff lime and materials. Additionally, some managers
may choose to spend time with departing employees to try to persuade them to
stay, time that could otherwise be used for other value-adding activities.
2. The average cost o f hiring and training a replacement can be as high as $8,300
according to the Saratoga Institute’s 1995 'Human Resource Financial Report'
(HRFR) (Fitz-Enz, 1997). When there are relocation costs involved the expense
may be even higher.
3. The vacancy costs directly affect service quality because lack of personnel leads
to excessive workload and stressful working conditions. In the long run such
situations, if not corrected, may lead to even more turnover, low service quality,
and eventually loss of customers as well.
4. The loss of productivity when a new person is hired can also be significant as it
can take a new employee up to six months or more to master his or her job
requirements completely.
These significant costs should encourage every organization to re-evaluate its
retention program. A single bonus, or any other 'extra', will not make the necessary
difference to keep employees from leaving. Employers have to create a work place where
employees will find the satisfaction they are looking for in their job. This can be achieved
by balancing benefits and internal service quality issues according to employee needs and
wants.
Reproduced with permission of the copyright owner. Further reproduction prohibited without permission.
22
Turnover occurs in most cases within the first several months. Therefore, some
hospitality managers have begun to focus on the socialization of new employees as a
factor in turnover. A study conducted by Young and Lundberg (1996) at Cornell
University shows that newcomers focus on events that affect them emotionally. The
study suggests that there is a need for a socialization process, in addition to the customary
orientation and training in order to reduce anxiety. In the first few days on the job the
newcomer has to discover what the organization is all about and what is expected of him
or her. To accomplish that, the individual uses formal means, such as orientation and
training programs, and informal means, such as overhearing a conversation between
managers or peers (Yoimg & Limdberg, 1996). By minimizing anxiety the likelihood of
turnover in the early stages o f employment can be reduced.
One Las Vegas-based organization that is applying internal service principles to
control turnover is the Mirage. The turnover in Las Vegas casinos averages 45-percent,
whereas the Mirage maintains an astonishingly low 12-percent (Comeau, 1994). Artie
Nathan, Vice President o f Human Resources at the Mirage at the time, put an emphasis
on employee recognition for one main reason - to reduce employee turnover, thus
improving customer service. This is achieved by paying attention to the little things firom
the day a new employee joins the organization. These little things include a personal
acquaintance with the employee's immediate supervisor, and a guide fi-om the department
to accompany him or her throughout the first week. In addition, employees are
interviewed at the end of their first week providing the human resources department with
feedback about their experience with this integration process.
Reproduced with permission of the copyright owner. Further reproduction prohibited without permission.

23
Types of Employee Benefits
While some benefits are required by law, others are offered at the employer's
discretion in the effort to attract and retain employees. Benefits required by law are
Worker’s Compensation, Family Medical Leave (according to the FMLA, i.e. the Family
Medical Leave Act), and Unemployment Coverage. In five states (New York, New
Jersey, Rhode Island, California, and Hawaii) plus Puerto Rico, mandatory disability
insurance coverage is also required (U.S. Department of Labor. 1995). Worker’s
Compensation was designed to protect an employee who was injured on the job. It is
based on the no fault system meaning that even if the employee is hurt due to negligence
on his or her part, he or she is still compensated. Although this benefit may vary by state,
generally the law provides disability income and medical expenses as well as provide for
surviving family members. Some states may also provide vocational rehabilitation benefit
(www.employease.com).
The variety of benefits currently offered can be divided into two sub groups:
short-term and long-term benefits.
Short Term Benefits
Short-term benefits are benefits an employee can enjoy upon joining the
organization or after a short period o f time (i.e. 3-6 month). These include medical
insurance, dental and vision insurance, and auto, home and legal insurance. Each
organization may choose to offer a different combination of these and/or other benefits,
or change the waiting period for benefit eligibility.
Reproduced with permission of the copyright owner. Further reproduction prohibited without permission.

24
Medical Insurance
Medical insurance was designed to provide employees with significant financial
protection against catastrophic loss. The majority o f medical insurance plans cover
hospitalization, intensive care, surgery, accidental injury expenses, treatment of mental
and nervous disorders, and maternity health care. Common exclusions are treatment by
an imlicensed or unqualified doctor, routine eye exams, cosmetic surgery, experimental
procedures, and dental treatment. Employers are permitted to establish plans that permit
employees to pay for their group coverage on a before-tax basis. This lowers employees'
out-of-pocket cost o f buying group insurance (www.employease.com).
There are two main types of medical plans: indemnity plans and managed health
care plans.
Indemnitv Plans
1. Basic Medical Plan: covers normal expenses associated with hospitalization or
required medical care up to stipulated maximums (www.employease.com).
2. Supplemental Plan: designed to augment basic medical expense coverage by
paying benefits for expenses after the insured has exhausted basic benefits and
paid a deductible (out-of-pocket expense) toward the cost o f medical care
(www.employease.com).
3. Comprehensive Plan: developed to replace the traditional Basic Medical and
Supplemental plans as they are very expensive, invite abuse and are overutilized
for high-price services. Many comprehensive plans today include cost
containment features such as second surgical opinions or preventive care coverage
(www.employease.com).
Reproduced with permission of the copyright owner. Further reproduction prohibited without permission.

25
Managed Health Care Plans
1. Health Maintenance Organization (HMD): HMDs have to be federally qualified
before they can solicit employers. HMOs have more comprehensive coverage
than indemnity plans and practice cost containment by putting an emphasis on
preventive medicine. However, employees must utilize participating physicians
with the HMO (www.employease.com).
2. Preferred Provider Plan (PPG): PPOs allow employees maximum flexibility in
that they can utilize either a participating provider or a non-participating provider
at their discretion. However, there is no deductible or co-insurance if the services
o f the preferred providers are used (www.employease.com).
HMOs Versus PPOs
There is an inherent difference between HMOs and PPOs. PPOs are a type of fee-
for-service plan because care providers are not reimbursed until services are performed.
This is different from the HMOs in which providers are paid a fixed amount for services
before they are performed over a period of time. Several studies have shown that HMO
members express less satisfaction with certain administrative aspects of care than do
members of FFS (Fee-For-Service) patients. This includes continuity of care,
appointment lags, and convenience of location. HMO patients also tend to be less
satisfied with patient-doctor interaction (Rockwell et al., 1992).
Reproduced with permission of the copyright owner. Further reproduction prohibited without permission.

26
Dental Insurance
Dental insurance was designed to provide financial protection against expenses
associated with dental care. Some dental plans are written through an HMO or PPO. In
general, there are two types of coverage:
1. Scheduled: benefits are limited to specified maximums per procedure with first-dollar
coverage (www.employease.com).
2. Comprehensive: provide routine dental care services without deductibles or
coinsurance to encourage preventive care. The employee pays a percentage of non
routine treatment and most plans include a specified maximum dollar amount payable
each year (www.employease.com).
Time Related Benefits
Schedule flexibility is likely to increase employees' quality of life, thus improving
morale and productivity. This is especially so for two-working-parent households or
single-parent households. While working at home is not a viable option for the hospitality
industry, other time-related benefits, such as flex-time, 'floater' holidays, four-day work
weeks, or sabbatical leaves, can be mutually beneficial (Hertzog, 1997).
Auto and Home Insurance
Automobile and homeowner’s insurance purchased through voluntary payroll
deduction is increasing in popularity as an employee benefit. The employee pays 100
percent of the premium costs through regular payroll deductions, thus saving the time and
effort involved in the insurance shopping process, plus avoiding down payments.
Reproduced with permission of the copyright owner. Further reproduction prohibited without permission.

27
monthly bills, and finance charges. Some insurance companies say the efficiencies of the
program (there are no agents, missed payments, cancellations, or re-instatements) allow
them to offer a rate as much as 15 percent lower than the national retail rate (Cole, 1997).
Legal Insurance
Group legal insurance operates similarly to medical insurance offered through a
health maintenance organization. For a monthly premium of 15-20 dollars, plan members
receive free legal advice and consultation and negotiation and trial representation from a
national network of attorneys. Plans may vary covering legal needs like adoption and
divorce, property protection, consumer protection, will preparation, and real estate
transactions (Meinders, 1998).
Dependent Care
Dependent care includes child care and elder care services. Child care services
have been offered since the early 1990s. The need for such services has been on the rise
since the increase in dual-profession parents and single parenthood. Child care benefits
can come in the form o f a set amount for child care or a coupon for the cost of child care
at a licensed center or a company's private center (Haar & Kossack, 1990). Child care and
elder care services in many companies include direction and guidance to help employees
deal with all aspects of dependent care as well as referral lists. This helps relieve
employee concerns and allows workers to focus on their jobs (Mula, 1998).
Reproduced with permission of the copyright owner. Further reproduction prohibited without permission.

28
Long Term Benefits
Long-term benefits are benefits that an employee can start enjoying only after a
certain pre-determined minimal period of time with the organization. These include time
off, stock options, and savings and investment plans.
Time Off
Time off benefits include holidays, vacations, and leave, with or without pay
(www.employease.com).
1. Holidays: companies have designated holidays based on local customs in the
geographical area.
2. Vacations: most companies base the number of vacation days on years of service
and/or the employee's job designation.
3. Paid leave: depending on the situation, many companies will permit an employee
to apply for a paid leave for a short period of time. Some extraordinary situations
are death of a family member, jury duty, or two-week military duty.
4. Unpaid leave: the Family Medical Leave Act (FMLA) requires employers of 20
or more employees to grant, imder certain circumstances, unpaid leave of up to 12
weeks in a 12-months period. Such circumstances include: care for a child after
birth, adoption, or placement in your home for foster care, and care for a seriously
ill spouse, child, or parent (U.S. Department of Labor. 1996).
Reproduced with permission of the copyright owner. Further reproduction prohibited without permission.

29
Stock Options
A stock option gives employees the right to purchase a certain number of shares
in the company, at a fixed price, for a certain number of years. The price at which the
option is provided is called the ‘gran:’ or ‘strike’ price ''"d " ■i:'‘lly ^^e market price at
the time the options were granted. Stock option plans are a flexible way for companies to
share ownership with employees, reward them for performance, and attract and retain
motivated staff. Option plans allow employees to sell their shares at any time
(www.nceo.org).
Savings and Investment Plans
The savings and investment plan (40IK) was designed to give employees the
opportunity to save money in a tax-effective way. A saving plan can be done on a before
tax or after-tax basis up to certain legal limits as mandated by the Internal Revenue
Service. Employers have the option of making a matching contribution, which is usually
50 cents for every dollar the employee saves. The employee has full ownership of his or
her savings and their earnings, but ownership of the company contributions and earnings
only after a period of time (usually after five years). Loans can be requested fi’om the
account and pay out occurs when the employee's employment ends
(www.employease.com).
Benefits Communication
"Benefits packages will fail to attract, enthuse, and retain workers if employees
cannot understand their content" (Haar & Kossack, 1990, p. 186). In a 1990 study, Haar
Reproduced with permission of the copyright owner. Further reproduction prohibited without permission.
30
and Kossack (1990) examined the readability of the benefit package materials of twenty
Fortune 500 corporations and compared it to the reading ability of the average worker.
They foimd that there is a discrepancy between verbal formats of benefit package
materials and the recipient's decoding abilities. Consequently, the investment in benefit
packages does not achieve its goals o f attracting, motivating, or retaining employees.
Benefits are in place to enhance the employer-employee relationship. This initial
purpose should not change in spite of the fact that benefits have become increasingly
complex in recent years (Gribble, 1997). For example, instead of one health insurance
package, many employers now offer four or five options. Additionally, employers have
moved away from conventional pension plans toward employer-sponsored 40IK
packages which require employees to take responsibility and initiative in saving for their
own retirements. "Employees will hold it against the employer if they are confused about
benefits. Such confusion usually has financial consequences for the employee, for which
management takes the blame... [This] can lead to a very unhappy and unproductive
workforce" (Gribble, 1997, p. 16).
Haar and Kossack (1990) and Gribble (1997) suggest that employers be attentive
to the following issues regarding benefits communication:
1. Employees should know and imderstand what benefits they are entitled to.
2. Employees should recognize the monetary value of each item included in their
benefits package.
3. The written material describing benefit packages has to match the reading ability
of the average worker.
Reproduced with permission of the copyright owner. Further reproduction prohibited without permission.

31
Rabin (1994) found that communication usage played a positive role in levels of
benefit satisfaction. Individuals who reported greater usage of communication materials
were more satisfied with the flexible benefit plan on a current basis. Tremblay. Sire, and
Pelchat (1998) also found a strong correlation between communication and benefit
satisfaction. Employees may have a better understanding of benefit packages where an
effective communications program exists, and thus have an increased sense of security
and protection.
A 1995 Life Insurance Marketing and Research Association (LIMRA) study
found that the key to a successful benefits program is communicating clear detailed
information to employees. The communication vehicles that employees prefer include:
(1) printed materials with brief two-to-three-page descriptions of the benefits and
employee 'kits' containing more detailed information, (2) toll-free numbers for questions,
and (3) required group meetings and voluntary meetings (Cole, 1997).
Internal Service Quality
Hallowell, Schlesinger, and Zomitsky (1996) have studied the effect of internal
service quality on employee job satisfaction, customer service quality, and employee
turnover. They suggest that the satisfaction of employees' needs includes economic (i.e.
wages and benefits) and non-economic needs (i.e. internal services). In this study the
internal service components include (1) tools, (2) policies and procedures, (3) teamwork,
(4) management, (5) training, (6) communication, and (7) rewards and recognition. This
definition excludes 'goal alignment' which was included in the original model suggested
by Hallowell, Schlesinger, and Zomitsky (1996). The study results showed a strong
Reproduced with permission of the copyright owner. Further reproduction prohibited without permission.

32
relationship between internal service quality and job satisfaction, which may result in
lower turnover (Hallowell et al., 1996).
Taco Bell, Marriott, and Starbucks Coffee Company are examples of
organizations that place an emphasis on internal service quality. Taco Bell recognized
that its restaurant managers needed to spend more time on training employees and selling
tacos. The company "developed a new tool to remove approximately 16 hours of
paperwork from the general manager’s job" (Hallowell et al., 1996, p. 27). The tool is
TACO, which stands for 'Total Automation of Company Operations’. It provides
computerized employee scheduling, food ordering and communication functions. This
system is a working tool that enhances the manager’s service capability thus enabling him
or her to provide workers with more attention and a better working environment. The tool
was implemented with the goal o f reducing employee turnover and ultimately improving
restaurant service for customers (Hallowell et al.. 1996).
Marriott Corporation incorporated the internal service principle in its 'Work Life'
program. This program is a toll free number manned by social workers offering
counseling and education in 16 languages, 24-hours a day. Topics that can be addressed
are child-care, financial information, school system, transportation, domestic and
substance abuse, elder care, and a variety of other issues. Marriott spent about $2 million
on the resource line but the company estimated it gains five dollars in productivity for
every dollar spent on the program. Marriott found that offering such service to employees
helped cut absenteeism and turnover, improve the image of the organization, and attract
new employees (Jossi, 1997). This is consistent with the internal service elements of
communication, teamwork and tools. Furthermore, Marriott's human resources
Reproduced with permission of the copyright owner. Further reproduction prohibited without permission.

professionals work with managers and employees simultaneously in an effort to measure
and enhance managerial effectiveness. This is achieved by including employee feedback
in managerial appraisals (Hallowell et al., 1996). This helps the company stay in touch
with employees' perceptions of management quality - one of the internal service
elements.
Starbucks Coffee Company uses excellent benefits packages and high internal
service quality to attract and retain workers (Weiss, 1998). The company offers four
internal services to its employees: the Mission Review Forum, the Open Forum, the
Warm Regards Recognition Program, and the Work/Life Program. The Mission Review
Forum is a way for employees to communicate their thoughts and feelings to
management and receive answers to their questions. Open forums are regularly held to
examine performance and recognize achievements. The Warm Regards Recognition
Program was developed to spotlight outstanding achievements. These programs provide
employees with recognition for their efforts and furnish them with a communication
channel. The goal of this initiative is to create a feeling of respect and increase retention.
The Work/Life Program includes on-site fimess services, referral and educational support
for child care and elder care issues, an info-line for convenient information, and the
'partner connection' - a program that links employees with shared interests and hobbies.
“This program ensures that Starbucks employees are happy outside of work, thus
promoting satisfaction during work" (Weiss, 1998, p. 63).
Reproduced with permission of the copyright owner. Further reproduction prohibited without permission.

34
Employee Benefit Satisfaction and
Organizational Commitment
The purpose of offering benefits is. among other things, to increase organizational
commitment, thus minimizing turnover and improving customer service. In a study
focused on service organizations. Lane (1993) reported significant relationships between
a measure of benefit satisfaction and organizational commitment, trust in management,
tumover intention, and job stress. Lane’s results are indicative o f the increased
significance of employee benefits as organizational rewards. They support organizational
investments in benefits by showing a return on investment in the form of higher
commitment levels, higher trust in management, and lower tumover intentions.
Carraher. Hart, Buckley, and Sawyer ( 1992) examined the relationship between
benefit satisfaction and attitude measures such as intention to search for a new job. quit,
be absent from work, and actual tumover. Using ATBS (attitudes towards benefits scale)
these researchers measured individuals’ level of satisfaction with their benefits, the
perceived importance of benefits, the ease of replacement of a benefit package, and the
perceived cost-of-benefits package. They found that attitudes towards benefits are
negatively correlated with attitudes towards absenteeism, intention to quit, and intention
to search for a new job; however they found no correlation with tumover.
Harris and Fink (1994) found that the presence or absence of a pension plan was
significantly related to tumover rate. They suggest two reasons why benefit satisfaction
affects employee attitude and behavior. ( 1 ) Benefits represent a reward associated with a
job well done. "Based on this argument individuals who are more satisfied with their
benefits will be less likely to leave, less likely to join a union, and more likely to be
Reproduced with permission of the copyright owner. Further reproduction prohibited without permission.

35
committed to the organization" (Harris & Fink, 1994, p. 125). (2) Benefits represent a
signal of the organization's care and concern for employees' well being, which may
trigger organizational support. This explanation implies that benefits represent more than
just a part of the compensation package for employees.
One company that has shaped its benefits package around the employees' needs
and wants is Starbucks Coffee Company. The Seattle-based coffee shop chain has
"comparatively low health-care costs, reduced absenteeism, and one of the strongest
retention rates in the industry" (Weiss, 1998, p. 61). Because it relies mostly on part-time
employees the company offers a full benefits package to any parmer who works over 20
hours a week. This package includes medical and dental coverage, vacation days, and
stock options as part of Starbucks BEAN STOCK program. The stock option plan was
established in 1991 as a way to invest in employees and create an ownership across the
company. Flexibility is also a central issue as eligible employees can choose between
health coverage from two managed care plans or a catastrophic plan. They can also select
between two dental plans and a vision plan. Starbucks has found that offering such
benefits, which it started doing in 1987, has improved employee retention and boosted
recruitment efforts. It also helps the company reduce recruiting and training costs (Weiss,
1998).
During the fiscal year that ended in September 30, 1997, Starbucks reported an
employee tumover rate of 60 percent, a low figure compared to the average 200 percent
tumover in the retail food industry (Leming, 1998). In the effort to remain attuned to
employees, Starbucks offers flexible work schedules. "Flexibility i< particularly inherent
in our stores because of our extended hours of operation and the diversity of our
Reproduced with permission of the copyright owner. Further reproduction prohibited without permission.

36
workforce, from students to parents, who need to work alternative hours" (Weiss. 1998.
p. 63) says Joan Moffat, Starbucks Manager of Partner Relations and Work/Life
Program.
For PepsiCo's Pizza Hut, Taco Bell, and KFC, chains highly dependent on entry-
level employees, the stock plan made sense as well - sparking an ownership interest in
providing good customer service (Papiemik, 1997).
Employee Benefit Satisfaction and Tumover
By offering employee benefits, organizations hope to increase organizational
commitment and thus reduce tumover and improve customer service. Boyd and West
(1994) conducted a study with the intention of measuring the effect of fringe benefit
offerings on the tumover o f hourly housekeeping employees in the hospitality industry.
The purpose of the study was to assist hospitality executives in determining whether
certain benefits are cost-effective in facilitating the organization's goals of reducing
tumover. The findings showed that properties offering retirement plans, group vision
insurance, group dental insurance, and group life insurance reported lower tumover
percentages. Other benefit offerings were statistically incapable o f discriminating
between hotels with high and low tumover. This should not be constmed as implying that
the non-significant benefit offerings are not important to retention. They may well be
necessary in that their absence may result in high tumover.
There were some surprising findings in the Boyd and West (1994) study. Child
care was offered by only six properties out o f the 600 that participated in the study, and
yet these properties did not enjoy low tumover rates among their hourly housekeeping
Reproduced with permission of the copyright owner. Further reproduction prohibited without permission.

37
employees. Child care is a very costly benefit to offer. It includes wages for staff,
insurance and liability issues, physical accommodation, and special equipment. Providing
child care should be weighed against the benefits to be gained by such an offering.
Additionally, no significant difference in turnover rate was associated with the
offering of transportation as a benefit, which was offered by 14 properties in the study.
"Like child care this benefit is expensive in terms of operational cost, insurance and
liability costs" (Boyd & West, 1994, p. 331). It would not be cost effective to offer such
a benefit if it does not increase benefit satisfaction. However, as was stated earlier, the
elimination of such a benefit may result in benefit dissatisfaction; therefore managers
need to be attentive to employee’s needs and wants.
The National Restaurant Association backed a recently passed legislation that
includes an important, business-friendly health care 'pooling' provision. The Patient
Protection Act, H.R. 4250 that contains the Association Health Plans (AHP) provision
was passed by the House on July 24,1998. It will allow trade associations like the
National Restaurant Association to provide health insurance to its members and their
employees. The bill would reduce costs and would give smaller restaurant businesses
expanded access to health insurance coverage, thereby helping more employers offer
affordable insurance to their employees (Anonymous, 1998). The AHP plan would help
make it possible for business owners to offer insurance to employees, such as students or
single mothers, who would otherwise not be covered (Anonymous, 1998). By improving
working conditions small business owners will be able to increase commitment among
their employees and tackle tumover.
Reproduced with permission of the copyright owner. Further reproduction prohibited without permission.

38
Summary
The squeeze in the labor market has forced employers to compete with others in
the recruitment of qualified, talented, and loyal employees. One of the basic components
of the retention strategies used by Human Resources executives today to recruit and
retain employees is offering fnnge benefits. In addition to benefits, employers attempt to
create high-quality working conditions. This relates to the seven components of internal
service employees receive from the organization. The intention of this study is to
examine whether satisfaction with benefits and internal services improves job satisfaction
and increases organizational commitment thus helping to reduce tumover and provide
hospitality customers with better service.
Reproduced with permission of the copyright owner. Further reproduction prohibited without permission.

CHAPTERS
METHODOLOGY
Introduction
The purpose of this study is to examine the influence of internal service quality
and benefit satisfaction on organizational commitment and job satisfaction. Harris and
Fink (1994) propose that employee benefit satisfaction may influence attitudes such as
organizational commitment. Therefore an understanding of benefit satisfaction may lead
to an increased understanding of other employee attitudes and behaviors (Williams,
1995). The results may help industry professionals in customizing their benefit packages
and shaping the internal service quality in their organizations to improve employees'
organizational commitment. This chapter will explain the method of questionnaire
design, the survey administration (i.e. data gathering procedures), methods used to
analyze the data, and methods used for hypothesis testing.
Research Questions
The study proposes to investigate the following questions:
1. Is there a relationship between employees’ benefit satisfaction and employees’
organizational commitment?
39
Reproduced with permission of the copyright owner. Further reproduction prohibited without permission.

40
2. Is there a relationship between employees' satisfaction with the seven components
of internal service and employees’ organizational commitment?
3. Is there a relationship between benefit communication received and employee
benefit satisfaction?
4. Is there a relationship between respondents’ sociodemographic characteristics and
level of benefit satisfaction?
Hypothesis
Hypothesis 1
Ho There is a positive relationship between employee benefit satisfaction and
organizational commitment.
Hi There is a negative relationship between employee benefit satisfaction and
organizational commitment.
Hypothesis 2
Ho There is a positive relationship between the seven components of internal service
quality and organizational commitment.
Hi There is a negative relationship between the seven components of internal service
quality and organizational commitment.
Hypothesis 3
Ho There is a positive relationship between communication received by employees
and their level o f benefit satisfaction.
Reproduced with permission of the copyright owner. Further reproduction prohibited without permission.

41
Hi There is a negative relationship between communication received by employees
and their level o f benefit satisfaction
Hypothesis 4
Ho There is a relationship between sociodemographic characteristics of the workforce
and level of benefit satisfaction.
Hi There is no relationship between sociodemographic characteristics of the
workforce and level of benefit satisfaction.
Overview of Questionnaire Design
Survey questions are based on a variety of several instruments proven to be
reliable and valid. The main source for the questions measuring job satisfaction and
organizational commitment was Rose (1991). The majority of the questions on the survey
were designed to be rated on a Likert scale.
Parti
Part one measures job satisfaction and organizational commitment using
statements to which the respondent has to indicate level of agreement using the following
scale:
1-strongly disagree
2-disagree
3-neither agree nor disagree
4-agree
5-strongly agree.
Reproduced with permission of the copyright owner. Further reproduction prohibited without permission.

42
The statements measuring job satisfaction are:
1.1 All in all, I am satisfied with my job.
1.10 In general, I don’t like my job.
1.19 In general, I like working here.
The statements measuring organizational commitment are:
1.1 1 am willing to put in a great deal of effort beyond that normally expected
in order to help this hotel be successful.
1.3 Deciding to work for this hotel was a definite mistake on my part.
1.4 I really care about the future of this hotel.
1.5 I am extremely glad that I chose to work for this hotel over other hotels.
1.8 I usually tell my friends that this is a great hotel to work for.
1.9 I feel very little loyalty to this hotel.
1.11 I find that my values and the hotel's values are very similar.
1.12 It would take very little to cause me to leave this hotel.
1.13 This hotel really inspires the very best in me in the way of job
performance.
1.14 For me, this is the best of all possible hotels to work for.
1.15 There’s not too much to be gained by staying with this hotel indefinitely.
1.16 Often, 1 find it difficult to agree with this hotel’s policies on important
matters relating to its employees.
1.18 I could just as well be working for a different hotel as long as the type of
work was similar.
Reproduced with permission of the copyright owner. Further reproduction prohibited without permission.

43
1.20 I would accept almost any type of job assignment in order to keep working
for this hotel.
Part n
Part two measures satisfaction with the seven components of internal service and
with benefits. The scale in this part is:
1-very dissatisfied
2-dissatisfied
3-neither dissatisfied nor satisfied
4-satisfied
5-very satisfied.
The questions measuring internal service satisfaction are:
1. Tools
2.11 The tools/materials you receive to do your job.
2. Policies and procedures
2.12 The overall policies and practices of your hotel.
3. Teamwork
2.4 Interactions with your coworkers.
4. Management
2.2 Your direct supervisor.
5. Training
2.8 The type of training you receive.
6. Communication
Reproduced with permission of the copyright owner. Further reproduction prohibited without permission.

44
2.6 The amount of information you receive from top management
about what is going on in your hotel.
7. Rewards and recognition
2.1 Advancement opportunities at your company.
2.7 The recognition you receive for doing a good job.
2.9 The reward system in place.
2.10 The way your performance is evaluated.
The questions measuring benefit satisfaction are;
2.13 The dependent care provisions provided by your hotel.
2.14 The health and well being programs.
2.15 The financial benefits from your company.
2.16 The insurance services.
Part III
Part three measures benefit satisfaction and frequency in which certain benefits
are used by the hotel’s employees. Also measured is satisfaction with the communication
provided by the human resources department regarding benefits. The questions in this
part are separated into three different sections with three separate scales.
Reproduced with permission of the copyright owner. Further reproduction prohibited without permission.
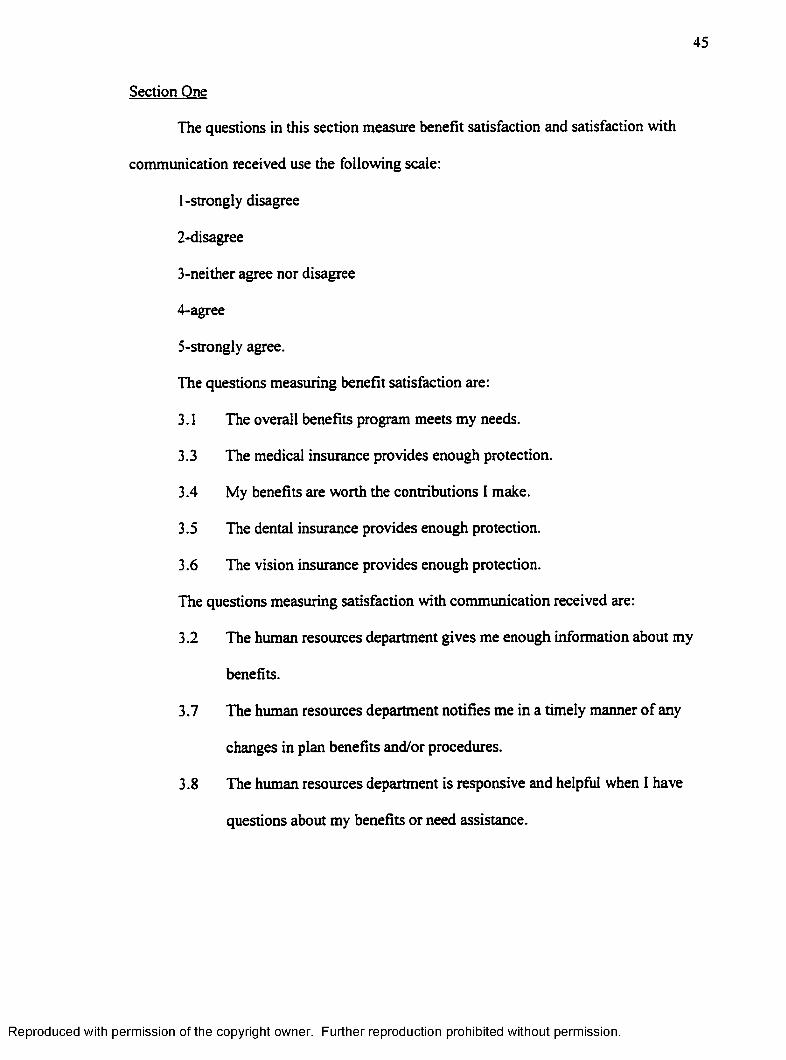
45
Section One
The questions in this section measure benefit satisfaction and satisfaction with
communication received use the following scale:
1-strongly disagree
2-disagree
3-neither agree nor disagree
4-agree
5-strongly agree.
The questions measuring benefit satisfaction are:
3.1 The overall benefits program meets my needs.
3.3 The medical insurance provides enough protection.
3.4 My benefits are worth the contributions I make.
3.5 The dental insurance provides enough protection.
3.6 The vision insurance provides enough protection.
The questions measuring satisfaction with communication received are:
3.2 The human resources department gives me enough information about my
benefits.
3.7 The human resources department notifies me in a timely manner of any
changes in plan benefits and/or procedures.
3.8 The human resources department is responsive and helpful when I have
questions about my benefits or need assistance.
Reproduced with permission of the copyright owner. Further reproduction prohibited without permission.

46
Section Two
The questions in this section measure satisfaction with specific benefits and use
the following scale:
NP-not provided
1-very dissatisfied
2-dissatisfied
3-neither dissatisfied nor satisfied
4-satisfied
5-very satisfied
The questions measuring satisfaction with specific benefits are:
3.9 HMO (Health Maintenance Organization)
3.10 Self-funded (Preferred Provider Plan)
3.11 Dental Plan
3.12 Vision Plan
3.13 Life Insurance
3.14 Cancer care insurance
3.15 Long-term disability
3.16 Medical reimbursement
3.17 Dependent care reimbursement
3.18 Intensive care insurance
3.19 Automobile insurance
3.20 Homeowner’s insurance
3.21 Worker’s compensation insurance
Reproduced with permission of the copyright owner. Further reproduction prohibited without permission.

47
3.22 Unemployment insurance
Section Three
The questions in this section measure frequency of use of specific benefits and are
rated on the following scale:
NP-not provided
1-never
2-occasionally
3-sometimes
4-offen
5-always
The questions measuring frequency of use of specific benefits are:
3.23 On-site concierge or travel agency for employee use.
3.24 On-site dry cleaning.
3.25 On-site elder or child care.
3.26 Matching college alumni donations.
3.27 Time off for community service.
3.28 Company sponsored shuttle to subway, train, or parking lot.
3.29 Nutrition or wellness classes.
3.30 Domestic partner benefits.
3.31 Adoption benefits.
3.32 Health club membership discoimt.
3.33 Educational assistance program.
Reproduced with permission of the copyright owner. Further reproduction prohibited without permission.

48
3.34 Scholarships for dependents of employees.
3.35 Discount tickets.
P artly
Part four gathered sociodemographic data about the respondents as well as
information about their employment record. The sociodemographic data included age,
gender, racial origin, education level, marital status, and number of dependents. The
employment information included department employed in, position, tenure in the hotel
and at the position, job status (full/part time & hourly/salaried), usual shift, and union
membership.
Population
The population of interest for this study is the Las Vegas casino-hotel workforce.
The study was conducted at one of Las Vegas' casino hotels located on Las Vegas
Boulevard. This hotel employs 1,300 union and non-union employees, thus allowing the
researcher to measure attitudes towards benefits and benefit perception and satisfaction of
both these groups.
Sampling procedures
The Las Vegas casino hotel in which the study was administered has
approximately 1,300 employees. The surveys were handed out at the employee dining
room and break area. Four hundred surveys were handed out during the five scheduled
collection days to any employee who walked into the employee dining room and was
willing to complete the survey. There was a concern for bias because not all employees
Reproduced with permission of the copyright owner. Further reproduction prohibited without permission.

49
come to the employee dining room on a regular basis. However, a company
announcement was made prior to the beginning of the study that a UNLV student would
be in the employee dining room administering a survey about benefit satisfaction. Several
workers who usually do not come to the employee dining room during their breaks, came
there to be able to complete the survey. From conversations with participants in the study,
it was the data collector’s impression that workers coming to the employee dining room
were a diverse group. This includes departmental representation and attitude, while some
employees expressed criticism and a negative attitude towards the organization others
manifested positive feelings towards and satisfaction with the organization. This diversity
led the data collector to believe that the sample was not biased in this aspect.
Data Collection Procedures
Hotel employees and supervisors were informed that a study would be conducted
by a UNLV student. The purpose of the study, as it was presented to supervisors and
employees, was 'to take a critical look at employee benefits practices and satisfaction
with them'. Employees were asked to participate in a serious and honest manner and were
insured of the anonymous character of the study. The student, wearing a UNLV nametag,
handed the questionnaire out to employees at the hotel during breaks, in the employee
break area. This student also collected the completed surveys thus eliminating any
contact between the completed questionnaires and the hotel's management team.
Employees were asked to fill out the questionnaire and hand it back the same day or the
following day. Five collection days were scheduled. To insure that the sample would be
representative of the entire workforce. Data collection was administered during all times
Reproduced with permission of the copyright owner. Further reproduction prohibited without permission.

50
of the day including weekdays and weekends; employees from all shifts were surveyed.
The schedule was as follows:
1. Tuesday, September 22, 10:00am to 5:00pm to cover the day shift.
2. Wednesday, September 23 ,3 :00pm to 11:00pm to cover the swing shift.
3. Thursday, September 24 ,6:00am to 2:00pm to cover the graveyard shift.
4. Friday, September 25, 9:00am to 4:00pm to cover the day shift.
5. Saturday, September 26 ,9:OOam to 3:00pm was a special day scheduled for
housekeeping personnel who were able to take longer breaks on that specific day.
The schedule also permitted the study to cover all the following hotel departments:
Accounting
Administration
Banquets/Catering Production
Banquets/Catering Service
Bar/Lounge
Bell Station
Business Center
Casino - Marketing
Casino - Slots
Casino - Keno
Casino - Cage
Casino - Table Games
Concierge/Guest Services
Sales/Marketing
Convention/Conference Services
Engineering/Maintenance.
Front Office
Garage/V alet Parking
Health Club/Spa
Housekeeping/Laimdry
Human Resources
MIS
PBX
Purchasing/Receiving
Reservations
Restaurant Production
Restaurant Service
Safety/Security
Reproduced with permission of the copyright owner. Further reproduction prohibited without permission.

51
Most employees used their scheduled breaks to fill out the survey and some were
able to take it to their stations and return it on later breaks. Due to the length of the
questionnaire (it took approximately 20 minutes to complete) some employees were
granted additional time on their scheduled breaks so that they were able to complete the
survey. The hotel’s management team was supportive and some supervisors had
scheduled additional employees so ?.s to allow sufficient time for the surveys to be filled
out properly. The last scheduled data collection day was specifically arranged for the
housekeeping department. It was coordinated with the department supervisor on a
Saturday. Because a significant part of housekeeping personnel did not speak English at
the level required for the comprehension o f the survey, a Spanish-speaking student
assisted in data collection that day.
Data Analysis
The Statistical Package for Social Sciences (SPSS) (1997) was used for data
analysis. A number o f statistical analysis measures were used; descriptive statistics (i.e.
frequencies and means), bivariate correlations and analysis of variance (ANOVA) were
used to measure correlations between study variables. Multiple regression analysis was
used to assess the predictive capacities of the seven components o f internal service with
regards to organization commitment and job satisfaction.
General scores were computed for (I) overall organizational commitment, (2)
overall job satisfaction, (3) overall benefit satisfaction, (4) overall benefit coverage and
value satisfaction, (5) overall satisfaction with internal services received, (6) and overall
Reproduced with permission of the copyright owner. Further reproduction prohibited without permission.

52
satisfaction with communication received. Cronbach’s Alpha was used to determine
reliability o f each separate measurement.
Several questions had to be re-coded in the reverse coding method so as to allow
the computation of representative scores for ove: all orgarizational commitment (1.9,
1.12,1.15, 1.16, and 1.18) and overall job satisfaction (1.10). These cumulative scores
were correlated to test for significance. Other correlations were computed between
sociodemographic variables and benefit satisfaction. Additionally frequencies of
employment information variables were run to categorize the workforce.
Summary
This chapter discussed the method of questionnaire design, the survey
administration, and methods used to analyze the data and test the hypotheses. The
findings will be presented in chapter four and the conclusions and recommendations in
chapter five.
Reproduced with permission of the copyright owner. Further reproduction prohibited without permission.

CHAPTER 4
RESULTS
Introduction
Employees and managers at one Las Vegas casino hotel property comprised the
convenience sample used in this study. Four hundred surveys were handed out and 206
were returned, out of which 201 were usable, yielding a response rate o f 51 percent.
SPSS, the Statistical Package for the Social Sciences (1997) was used for data analysis.
Initial analysis included descriptive statistics of the sample’s demographics and
employment issues. The analysis also included means, standard deviations, variances, and
frequencies for most of the siuvey questions. Relationships were tested using bivariate
correlations, linear regression, and analysis of variance (ANOVA).
Demographic Profile o f the Sample
The demographics of the sample included age, gender, racial category, marital
status, and education level. The mean age of the sample was 40.69 years with a standard
deviation of 10.76 years (N=181). The age variable was re-coded to three categories: (1)
under 25 years, (2) 25-44 years, and (3) 45 years and above. The purpose of this new
variable was to measure whether there was a significant difference between different age
53
Reproduced with permission of the copyright owner. Further reproduction prohibited without permission.

54
groups in their level of benefit satisfaction, organizational commitment, and job
satisfaction. Approximately two thirds of the work force fell into the second category (i.e.
25-44 years) and one third fell into the third category (i.e. over 45 years) (see table I ).
Table 1
Age Categories
Age Group Frequency Valid Percent
Under 25 12 6.6%
25-44 103 56.9%
45 and above 66 36.5%
Total 100.0%
N=181
The marital status variable was collected in four separate categories: (1) single,
(2) married/partnered, (3) divorced, and (4) widowed (see table 2). This variable was re
coded to only two categories: (I) single and (2) married/partnered. The category 'single'
is the sum of the three variables single, divorced, and widowed. The purpose of the new
variable was to measure whether there is a significant difference in benefit satisfaction
when one is single (including the categories of divorced and widowed) or married
(including the category of partnered). Racial category, marital status, and education level
are also presented in table 2.
Reproduced with permission of the copyright owner. Further reproduction prohibited without permission.

55
Table 2
Demographic Profile of the Sample
Variable Frequency %
Gender N=197
Male 83 42.1%
Female 114 57.9%
Marital Status N=196
Married/Partnered 95 48.5%
Single 101 51.5%
Single 62 31.6%
Divorced 36 18.4%
Widowed 3 1.5%
Race Categorv N=191
Native American 5 2.6%
Asian/Pacific Islander 12 6.3%
Afiican American 25 13.1%
Hispanic 26 13.6%
Caucasian 123 64.4%
Education Level N= 196
Completed elementary school 2 1.0%
Some high school 8 4.1%
Graduated fi om high school 73 37.2%
Some college/technical training 77 39.3%
Completed technical training/associate degree 19 9.7%
Graduated firom college 13 6.6%
Some graduate school 3 1.5%
Graduate degree 1 0.5%
Reproduced with permission of the copyright owner. Further reproduction prohibited without permission.

56
Employment Profile of the Sample
The employment profile of the sample consisted of several variables:
1. The departments represented in the sample.
2. The different job classifications (i.e. front line employee, supervisor, or
manager/assistant manager).
3. Tenure in the hotel, in the current position, and in hospitality in general.
4. Whether the respondent was an hourly (i.e. non-exempt) or a salaried (i.e.
exempt) employee.
5. Whether the respondent worked full or part time.
6. Whether the respondent was a union member or not.
7. Which was the respondents’ most frequently worked shift.
Departmental Representation
The departments represented in the sample are shown in table 3. Most of the
hotel's departments were represented. The 'other' category includes departments that were
not represented at all or were represented by less than 1 percent of the sample.
Reproduced with permission of the copyright owner. Further reproduction prohibited without permission.

57
Table 3
Departmental Representation
Department Valid percent Cumulative Percent
Accounting 6.2% 6.2%
Banquets/catering production 1.5% 7.7%
Banquets/catering service 2.6% 10.3%
Bar/lounge 4.1% 14.4%
Bell station 2.0% 16.4%
Casino - cage 3.6% 20.0%
Casino - marketing 3.1% 23.1%
Casino - slots 10.3% 33.4%
Casino - table games 15.9% 49.3%
Concierge/guest services 1.0% 50.3%
Engineering/maintenance 5.6% 55.9%
Front office 5.6% 61.5%
Garage/valet parking 1.0% 62.5%
Housekeeping/laundry 10.3% 72.8%
MIS 1.0% 73.8%
PBX 2.1% 75.9%
Purchasing/receiving 1.0% 76.9%
Reservations 2.1% 79.0%
Restaurant production 3.1% 82.1%
Restaurant service 5.1% 87.2%
Safety/security 4.6% 91.8%
Other 8.2% 100.0%
Total 100.0%
N=201
Reproduced with permission of the copyright owner. Further reproduction prohibited without permission.
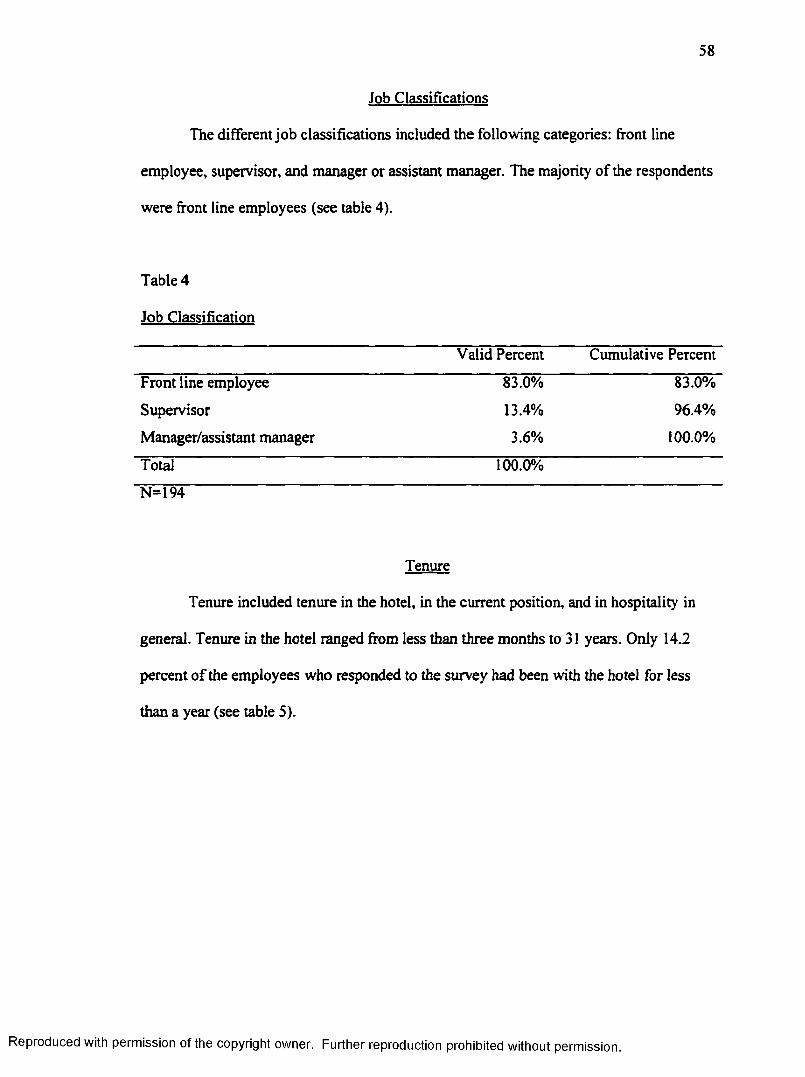
58
Job Classifications
The different job classifications included the following categories: front line
employee, supervisor, and manager or assistant manager. The majority of the respondents
were front line employees (see table 4).
Table 4
Job Classification
Valid Percent Cumulative Percent
Front line employee 83.0% 83.0%
Supervisor 13.4% 96.4%
Manager/assistant manager 3.6% 100.0%
Total 100.0%
N=194
Tenure
Tenure included tenure in the hotel, in the current position, and in hospitality in
general. Tenure in the hotel ranged fi'om less than three months to 31 years. Only 14.2
percent of the employees who responded to the survey had been with the hotel for less
than a year (see table 5).
Reproduced with permission of the copyright owner. Further reproduction prohibited without permission.

59
Table 5
Tenure with the Hotel
Frequency Valid Percent
Under one year 28 14.2%
A year and over 169 85.8%
Total 197 100.0%
N=197
Out of the 85.8 percent of the respondents who have been with the hotel for over a
year the break down is shown in table 6.
Table 6
Tenure with the Hotel for Emolovees of Tenure Higher than One Year
Valid percent Cumulative Percent
I-10 years 77.3% 77.3%
II-20 years 9.2% 86.5%
21-30 years 12.9% 99.4%
31-40 years 0.6% 100.0%
Total 100.0%
N=169
Tenure in current position ranged from under three months to 29 years and tenure
in hospitality in general ranged from less than three months to 34 years. The average for
tenure in the hotel, in the current position, and in hospitality in general for employees o f a
year or longer is shown in table 7.
Reproduced with permission of the copyright owner. Further reproduction prohibited without permission.

60
Table 7
Tenure in the Hotel, the Position and in the Hospitality Industry
Mean SD N
Years with hotel 8.074 8.107 163
Years in current position 7.205 7.028 154
Years in hospitality 10.952 8.897 178
Other Employment Issues
The remaining employment issues included whether the respondent was an hourly
(i.e. non-exempt) or a salaried (i.e. exempt) employee, worked full or part time, was a
union member or not, and what shift the respondents most frequently worked. These
variables are shown in table 8. The variable 'current job status' was collected including
four categories: (1) full time, (2) part time, (3) temporary, and (4) seasonal. This variable
was re-coded to two categories only, which are: (1) full time and (2) part time, the part
time category included 'temporary' and seasonal'. The purpose of this new variable was
to measure whether the job security of full time employees had a significant difference in
benefit satisfaction as opposed to part time employees, who may feel less job security.
The other variables are presented as they were collected. The majority o f the
sample consisted of hourly employees who work full time. Union members consisted of
46 percent of the sample, while the most frequently worked shift was the a.m. shift (see
table 8).
Reproduced with permission of the copyright owner. Further reproduction prohibited without permission.

61
Table 8
Employment Issues of the Individual
Variable Frequency %
Hourly or salaried
hourly 177 90.3%
salaried 19 9.7%
N=196
Full time or part time
full time 189 95.0%
part time (including temporary & seasonal) 10 5.0%
N=199
Most often worked shifts
a.m. shift 119 61.0%
p.m. shift 24 12.3%
swing shift 36 18.5%
graveyard shift 5 2.6%
work different shifts 11 5.6%
N=195
Union membership
union member 91 46.0%
not a union member 105 53.0%
don’t know 2 1.0%
N=198
Benefit Satisfaction with Individual Benefits
Benefit satisfaction was measured for each benefit separately. The mean
satisfaction with individual benefits is shown in Table 9. These benefits were rated on a
five point Likert scale ranging from (1) strongly dissatisfied to (5) very satisfied. This
Reproduced with permission of the copyright owner. Further reproduction prohibited without permission.
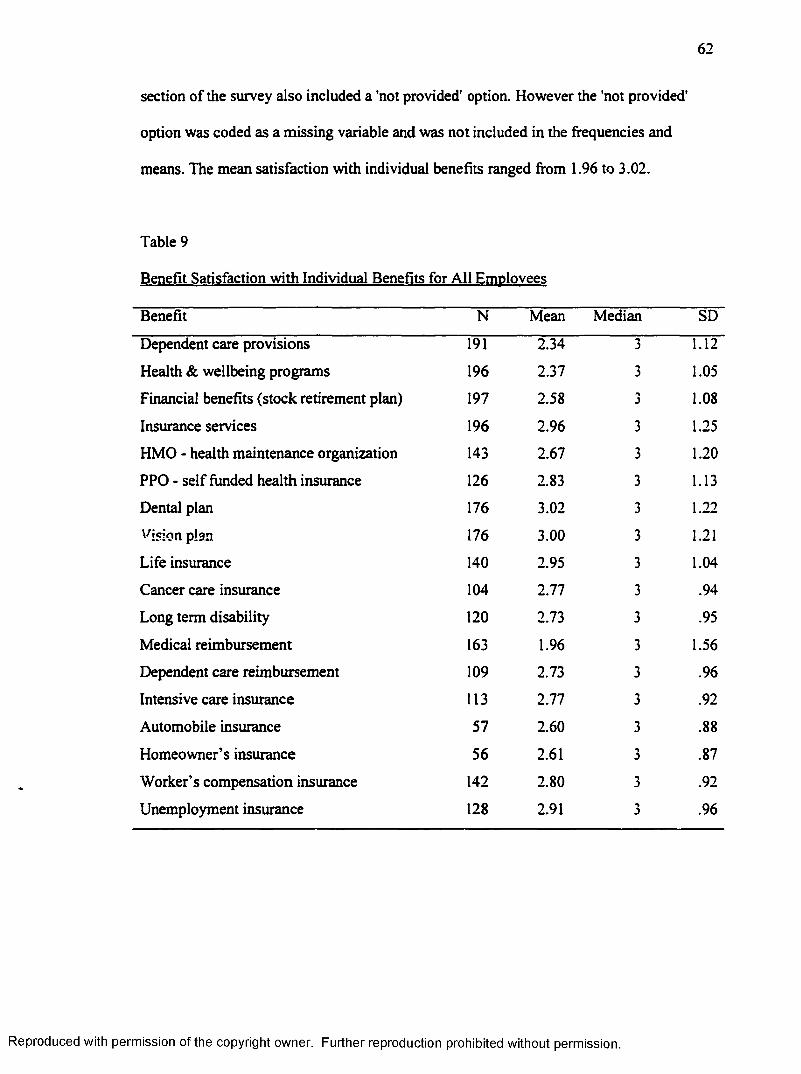
62
section of the survey also included a 'not provided' option. However the 'not provided’
option was coded as a missing variable and was not included in the frequencies and
means. The mean satisfaction with individual benefits ranged from 1.96 to 3.02.
Table 9
Benefit Satisfaction with Individual Benefits for All Employees
Benefit N Mean Median SD
Dependent care provisions 191 2.34 3 1.12
Health & wellbeing programs 196 2.37 3 1.05
Financial benefits (stock retirement plan) 197 2.58 1.08
Insurance services 196 2.96 3 1.25
HMO - health maintenance organization 143 2.67 3 1.20
PPG - self funded health insurance 126 2.83 3 1.13
Dental plan 176 3.02 3 1.22
'^ision plan 176 3.00 3 1.21
Life insurance 140 2.95 3 1.04
Cancer care insurance 104 2.77 3 .94
Long term disability 120 2.73 3 .95
Medical reimbursement 163 1.96 1.56
Dependent care reimbursement 109 2.73 3 .96
Intensive care insurance 113 2.77 3 .92
Automobile insurance 57 2.60 3 .88
Homeowner’s insurance 56 2.61 3 .87
Worker’s compensation insurance 142 2.80 3 .92
Unemployment insurance 128 2.91 3 .96
Reproduced with permission of the copyright owner. Further reproduction prohibited without permission.

63
Benefit Satisfaction Union Versus Non-Union Employees
Union Employees were significantly more satisfied with insurance services,
HMO, PPP, dental plan, vision plan, intensive care insurance, worker's compensation
insurance, and unemployment insurance. However, non-union employees were found to
be significantly more satisfied with medical reimbursement (see table 10).
Reproduced with permission of the copyright owner. Further reproduction prohibited without permission.

64
Table 10
Benefit Satisfaction with Individual Benefits of Union Versus Non-Union Employees
BenefitUnionStatus N Mean Med SD Sig.
Dependent care provisions Union 87 2.40 3 1.18Non 99 2.30 3 1.06
Health & wellbeing programs Union 88 2.35 2 1.06Non 103 2.40 3 1.05
Financial benefits Union 88 2.70 3 1.05(stock retirement plan) Non 104 2.50 3 1.08Insurance services Union** 89 3.52 4 1.10 .000**
Non 102 2.49 3 1.17HMO - health maintenance organization Union** 47 3.17 3 1.17 .001**
Non 92 2.42 2 1.12PPO - self funded health insurance Union** 49 3.24 3 1.05 .002**
Non 74 2.64 3 1.08Dental plan Union** 77 3.65 4 1.09 .000**
Non 95 2.54 3 1.07Vision plan Union** 76 3.57 4 1.05 .000**
Non 96 2.57 3 1.13Life insurance Union 49 3.06 3 1.01
Non 87 2.91 3 1.03Cancer care insurance Union 32 2.81 3 1.06
Non 68 2.76 3 .83Long term disability Union 40 2.90 3 1.01
Non 77 2.69 3 .89Medical reimbursement Union 75 1.61 2 1.69
Non* 86 2.26 3 1.36 .014*Dependent care reimbursement Union 37 2.95 3 1.08
Non 69 2.70 3 .83Intensive care insurance Union* 40 3.03 3 .92 .012*
Non 69 2.64 3 .84Automobile insurance Union 21 2.76 3 .83
Non 33 2.64 3 .82Homeowner’s insurance Union 22 2.77 3 .81
Non 31 2.65 3 .80Worker’s compensation insurance Union* 62 2.94 3 1.01 .046*
Non 76 2.71 3 .78Unemployment insurance Union* 57 3.16 3 .96 .035*
Non 68 2.72 3 .90*p<.05 •*p<.Ol
Reproduced with permission of the copyright owner. Further reproduction prohibited without permission.
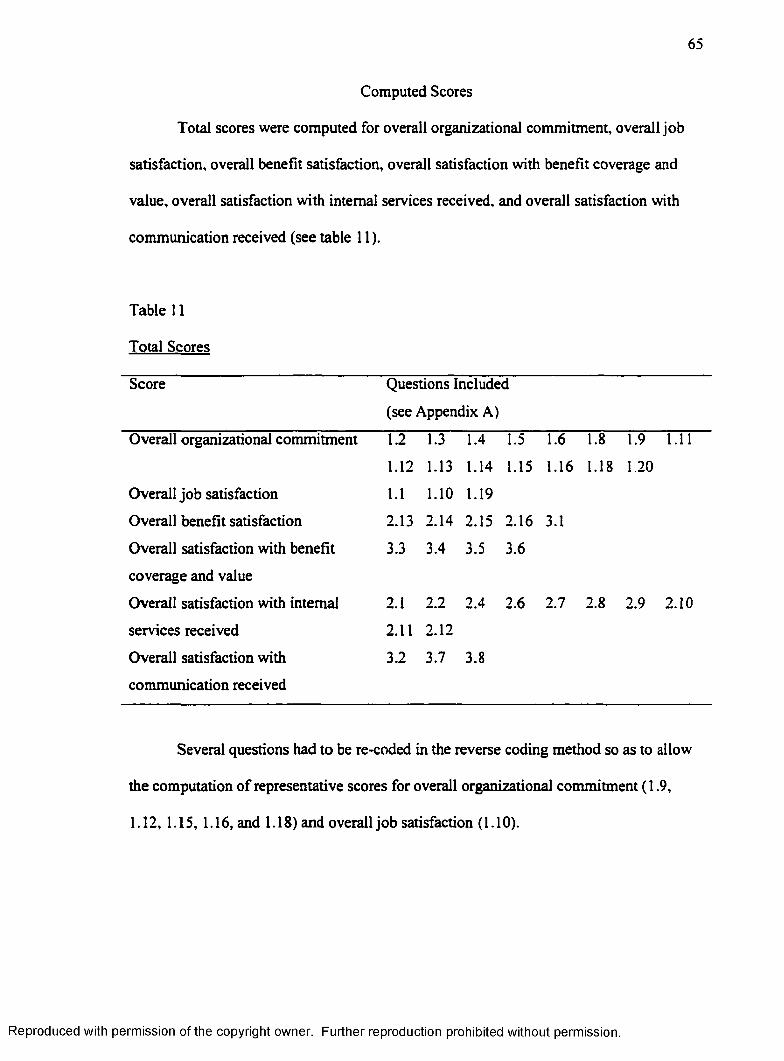
65
Computed Scores
Total scores were computed for overall organizational commitment, overall job
satisfaction, overall benefit satisfaction, overall satisfaction with benefit coverage and
value, overall satisfaction with internal services received, and overall satisfaction with
communication received (see table 11).
Table 11
Total Scores
Score Questions Included
(see Appendix A)
Overall organizational commitment 1.2 1.3 1.4 1.5 1.6 1.8 1.9 1.11
1.12 1.13 1.14 1.15 1.16 1.18 1 20
Overall job satisfaction 1.1 1.10 1.19
Overall benefit satisfaction 2.13 2.14 2.15 2.16 3.1
Overall satisfaction with benefit 3.3 3.4 3.5 3.6
coverage and value
Overall satisfaction with internal 2.1 2.2 2.4 2.6 2.7 2.8 2.9 2.10
services received 2.11 2.12
Overall satisfaction with 3.2 3.7 3.8
communication received
Several questions had to be re-coded in the reverse coding method so as to allow
the computation of representative scores for overall organizational commitment ( 1.9,
1.12, 1.15, 1.16, and 1.18) and overall job satisfaction (1.10).
Reproduced with permission of the copyright owner. Further reproduction prohibited without permission.
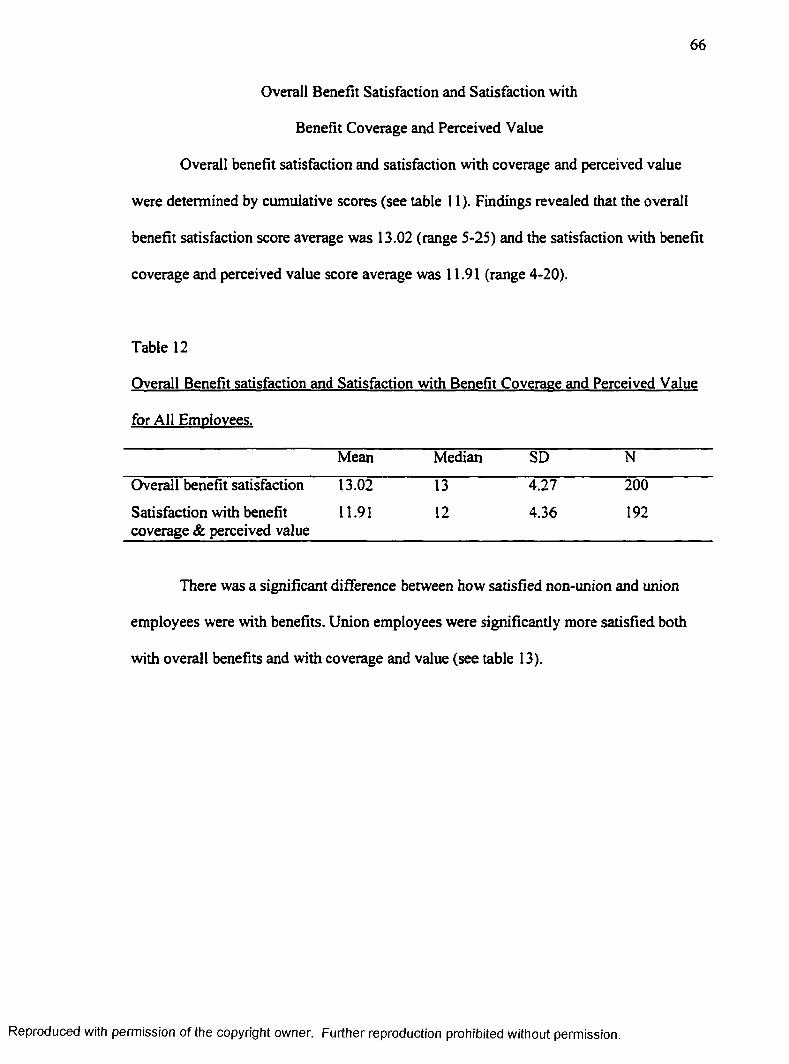
66
Overall Benefit Satisfaction and Satisfaction with
Benefit Coverage and Perceived Value
Overall benefit satisfaction and satisfaction with coverage and perceived value
were determined by cumulative scores (see table 11 ). Findings revealed that the overall
benefit satisfaction score average was 13.02 (range 5-25) and the satisfaction with benefit
coverage and perceived value score average was 11.91 (range 4-20).
Table 12
for All Employees.
Mean Median SD N
Overall benefit satisfaction 13.02 13 4.27 200
Satisfaction with benefit coverage & perceived value
11.91 12 4.36 192
There was a signi^cant difference between how satisfîed non-union and union
employees were with benefits. Union employees were significantly more satisfied both
with overall benefits and with coverage and value (see table 13).
Reproduced with permission of the copyright owner. Further reproduction prohibited without permission.

67
Table 13
for Union Versus Non-Union Emolovees.
Union
Status
Mean Median SD N
Overall benefit satisfaction Union 14.12** 14.50 3.79 90
Non 12.15 13.00 4.41 105
Satisfaction with benefit Union 14.10** 15.00 3.78 84
coverage & perceived value Non 10.19 10.00 3.94 103
♦*p<.01
Benefit Communication
Satisfaction with the communication received &om the human resources
department regarding benefits was also measured. The communication score was
computed by combining the results of three satisfaction statements (see table 11 ). The
average score for communication received from the human resources department was
9.38 (range 3-15).
Section three in part three of the survey (questions 3.23 through 3.35 see
Appendix A) measured frequency of use of independent benefits. These questions were
rated on a five point Likert scale ranging from (1) Never (i.e. 1 never use this benefit), to
(5) always (i.e. 1 always use this benefit). This section also included a not provided’
option. However, this option was coded as a missing variable and not included in the
frequencies and means. The Las Vegas casino hotel offered only two out of the total
thirteen listed: a heaith-club membership discount and discounted tickets (to concerts,
shows etc.). However, 33.4 percent of the respondents did not know that a health club
Reproduced with permission of the copyright owner. Further reproduction prohibited without permission.

68
membership was provided, and 38.4 percent did not know of the possibility of purchasing
discounted tickets. Additionally, between 20.3 and 32.8 percent of the respondents
believed that the other benefits that appeared on the survey were offered although the
hotel does not offer them (see table 14).
Table 14
Benefit Use Freouencv
Benefit Mean Med SD N % of the
sample
On site concierge/travel agency for 1.24 1 .72 66 32.8%
employee use
On site dry cleaning 1.74 1 1.37 72 35.8%
On site elder or child care 1.17 1 .64 47 23.3%
Matching college alumni donations 1.22 I .84 46 22.8%
Time off for community service 1.34 1 .89 64 31.8%
Company sponsored shuttle to subway. 1.73 1 1.34 52 25.8%
train, or parking lot
Nutrition/wellness classes 1.17 1 .68 46 22.8%
Domestic partner benefits 1.23 1 .78 52 25.8%
Adoption benefits 1.10 1 .62 41 20.3%
Health club membership discount* 1.68 1 1.22 134 66.6%
Educational assistance program 1.20 1 .63 60 29.8%
Scholarships for dependents o f employees 1.18 I .66 50 24.8%
Discounted tickets* 1.93 2 1.02 124 61.6%
Note: • Benefits that were offered by the hotel
Reproduced with permission of the copyright owner. Further reproduction prohibited without permission.

69
Hypothesis Testing
The descriptive statistics for the bivariate correlations used to test hypothesis one
through three are depicted in table 15.
Hvpothesis 1
Hypothesis 1 predicted that employee benefit satisfaction and organizational
commitment would be positively correlated. This hypothesis was tested for overall
benefit satisfaction and for satisfaction with benefit coverage and perceived value. The
mean score for overall benefit satisfaction was 13.02 (range 5-25) and the mean score for
satisfaction with benefit coverage and perceived value was 11.91 (range 4-20). The mean
score for organizational commitment was 42.51 (range 15-75). There was a significant
correlation between both variables of benefit satisfaction and organizational commitment
(see table 15). Table 16 shows the ANOVA results for the correlations between benefit
satisfaction (both overall satisfaction and satisfaction with value and coverage) and
organizational commitment. Linear regression revealed that benefit satisfaction (both
overall satisfaction and satisfaction with value and coverage) is a predictor of
organizational commitment (see table 17).
Hvpothesis 2
Hypothesis 2 predicted that the satisfaction with the quality of the seven
components of internal service would be positively correlated with organizational
commitment. The mean score for satisfaction with the seven components of internal
Reproduced with permission of the copyright owner. Further reproduction prohibited without permission.

70
service was 27.46 (range 10-50). There was a significant correlation between the
satisfaction with internal services received and organizational commitment (see table 15).
Satisfaction with the individual components of internal service was measured on a
five point Likert scale ranging from (1) very dissatisfied to (5) very satisfied (see table
18). The mean scores show that employees were most satisfied with their direct
supervisors and with the interactions with co-workers (i.e. team work) (mean scores of
3.48 and 3.82 respectively). Employees were least satisfied with communication received
(i.e. information received) and with their rewards and recognition (see table 18).
ANOVA was used to examine the relation between the individual components of
intemal service and overall organizational commitment and job satisfaction. It was found
that satisfaction with rewards and recognition, training, management (i.e. direct
supervisor), team work, and policies and procedures were significantly correlated with
organizational commitment (see table 19). ANOVA was also used to measure the relation
between the seven intemal service components and job satisfaction. The results showed
that all but one (i.e. team work) of the seven components of internal service were
significantly correlated with job satisfaction (see table 20).
Multiple regression revealed four of the components of intemal service to be
predictors of organizational commitment (see table 21) and job satisfaction (see table 22).
Management (direct supervisor), team work, policies and procedures, and rewards and
recognition were found to be significantly correlated with organizational commitment
and job satisfaction. However, team work was found to be negatively correlated with
organizational commitment and job satisfaction. The standardized beta indicates the
percentage of the results that are explained by each variable. The R-square shows that the
Reproduced with permission of the copyright owner. Further reproduction prohibited without permission.

71
model explains 50.9 percent o f the variability in the dependent variable organizational
commitment (see table 21 ) and 41.9 percent of the variability in the dependent variable
job satisfaction (see table 22).
Hvpothesis 3
Hypothesis 3 predicted that there would be a positive correlation between the
satisfaction with the communication received from the Human Resources department and
benefit satisfaction. Communication includes the amount of information received, the
helpfulness and responsiveness of the human resources team when answering questions,
and the timely notification of plan changes and/or new procedures (see questions 3.2, 3.7,
and 3.8 in Appendix A). The mean score of satisfaction with the communication received
was 9.38 (range 3-15). There was a significant correlation between the satisfaction with
the communication received from the Human Resources department with both overall
benefit satisfaction and satisfaction with benefit coverage and perceived value
(see table 15). Linear regression revealed communication received from the Human
Resources department to be a predictor o f benefit satisfaction (see table 23).
Reproduced with permission of the copyright owner. Further reproduction prohibited without permission.

::dCD■Dâ sÛ.
■ DCD
C/)
o'3
Table 15
Descriptive Statistics and Correlations Among Study Variables "
CD
8T3
C5-IT
i3CD
C3.3"CD
cB■DICaO3
■ D
S
&
Oc
C/)
o'3
Variable Mean SD N 1 2 3 4 5 6
1. Overall benefit 13.02 9.27 200 (.80)
satisfaction
2. Benefit satisfaction 11.91 4.36 192 695** (.91)
value & coverage
3. Organizational 42.51 11.28 201 .329** .195** (.87)
commitment
4. Job 9.28 2.64 200 .276** .190** .782** (.79)
satisfaction
5. Communication 9.38 2.86 193 .473** .406** .376** .343** (.83)
received from HR
6. Seven components of 27.46 7.94 200 .377** 107 .591** .536** .523** (.86)
intemal services
**p<.QI
Note; * The six total scores were tested fur reliability and found to be internally consistent, the coefficient alphas are shown in parentheses on the diagonal.

73
Table 16
ANOVA Results for Benefit Satisfaction Measures
Independent Variable Dependent variable df F Sig.
Overall benefit Organizational 20 2.260** .003
satisfaction commitment
Satisfaction with benefit Organizational 15 1.833* .033
coverage & value commitment
•p<.05 **p<.Ol
Table 17
Linear Regression for Benefit Satisfaction and Organizational Commitment
Independent Variable Dependent variable Standardized
Coefficients
T Value
Overall Benefit satisfaction Organizational .329 4.897***Commitment
R-square: 0.108 Adjusted R-square: 0.104
Satisfaction with value and Organizational .195 2.736**perceived coverage commitmentR-square: 0.38 Adjusted R-square: 0.33
p<.05 •p<.00l
Reproduced with permission of the copyright owner. Further reproduction prohibited without permission.

74
Table 18
Satisfaction with Internal Services Received
Service N Mean Median SD
1. Tools 198 2.90 3 1.2
2. Policies & procedures 197 2.73 3 1.17
3. Team Work 197 3.82 4 .98
4. Management 197 3.48 4 1.36(direct supervisor)
5. Training 195 2.88 3 1.24
6. Communication 197 2.26 2 1.19
7. Rewards & recognition 200 9.68 10 3.57(4 scores combined)
Table 19
ANOVA Results for Seven Comnonents of Intemal service and Organizational
Commitment
Independent Variable Dependent variable df F Sig.1. Tools 4 6.731** .0002. Policies & 4 31.573** .000
procedures3. Team Work Organizational 4 3.202* .0144. Management Commitment 4 17.868** .000
(direct supervisor)5. Training 4 6.119** .0006. Communication 4 10.392** .0007. Rewards & 14 8.020** .000
recognition(4 scores combined)
8. Cumulative score 7 35 4.308** .000service components
• p<.05 *«p<.01
Reproduced with permission of the copyright owner. Further reproduction prohibited without permission.

75
Table 20
ANOVA Results for Seven Components of Intemal service and Job Satisfaction
Independent Variable Dependent variable df F Sig.1. Tools 4 6.841** .0002. Policies & 4 18.730** .000
procedures
3. Team Work Job 4 .721 .5784. Management Satisfaction 4 16.537** .000
(direct supervisor)5. Training 4 4.878** .0016. Communication 4 6.119** .0007. Rewards & 14 5.212** .000
recognition (4 scores combined)
8. Cumulative score 7 35 2.813** .000service components
p<.05 **p<.Ol
Table 21
Standardized Regression Coefficients for Individual Measures of Intemal Service
Components and Organizational Commitment °
Independent Variables Standardized Coefficients T Value
Constant 23.195 8.493***
1. Tools -.058 -.867
2. Policies & procedures .427 6.111***
3. Team Work -.128 -2.197*
4. Management (direct supervisor)
.185 2.637**
5. Training .007 .107
6. Communication .021 .327
7. Rewards & recognition (4 scores combined)
.291 3.585***
R-square: 0.509 Adjusted R-square: 0.490
•p < .0 5 ••p<-01 ••*p<.001
* Dependent Variable
Reproduced with permission of the copyright owner. Further reproduction prohibited without permission.

76
Table 22
Standardized Regression Coefficients for Individual Measures of Intemal Service
Components and Job Satisfaction '
Independent Variables Standardized Coefficients T ValueConstant 5.906 8.789***
1. Tools .031 .424
2. Policies & procedures .262 3.441**
3. Team Work -.209 -3.281**
4. Management (direct supervisor)
.303 3.965***
5. Training -.003 -.039
6. Communication -.051 -.730
7. Rewards & recognition (4 scores combined)
.285 3.234**
R-square: 0.419 Adjusted R-square: 0.396
••p<.01 ••*p<.00l * Dependent Variable
Table 23
Linear Regression for Communication Received and Benefit Satisfaction
Independent Variable Dependent variable Standardized
Coefficients
T Value
Communication received Overall benefit satisfaction
R-square: 0.223 Adjusted R-square: 0.219
.473 7.414***
Communication received Satisfaction with perceivedvalue & coverage
R-square: 0.164 Adjusted R-square: 0.160
.406 6.115***
* * p < .0 5 •••p<.001
Reproduced with permission of the copyright owner. Further reproduction prohibited without permission.

77
Hvpothesis 4
Hypothesis 4 predicted that there would be a significant relationship between
demographic characteristics and benefit satisfaction. Only three significant correlations
were found. Age and organizational commitment and age and job satisfaction were both
positively correlated (see table 24). The number of dependents and overall benefit
satisfaction was found to be negatively correlated (see table 24). Union status and both
variables of benefit satisfaction (overall satisfaction and satisfaction with coverage and
value) were found to be correlated. Union employees were significantly more satisfied
with overall benefits and with the coverage level and perceived value than non-union
employees (see table 13).
Reproduced with permission of the copyright owner. Further reproduction prohibited without permission.

CD■DOÛ.C
8Q.
■DCD
C/)Wo'3O
Table 24
Descriptive Statistics and Correlations among Study Variables”
8■D
i3CD
3.3"CD
CD■DOQ.C
aO3
■DO
CDQ.
■DCD
C/)C/)
Variable Mean SD N 1 2 3 4 5 6 7 8 9 10 II 12
1. Overall benefit 13.02 9.27 200 (.80)
satisfaction
2. Benefit satisfaction 11.91 4.36 192 .695** (.91)
value & coverage
3. Org commitment 42.51 11.28 201 .329** .195** (.87)
4. Job satisfaction 9.28 2.64 200 .276** .190** .782** (.79)
5. Tenure *’ 1.37 .73 163 .065 .146 III .117
6. Age ' 2.30 .59 181 -.073 -.080 .147* .154* .288
7. Hourly/salaried I.IO .30 196 .055 .099 .194** .096 -.012 -.051
8, Gender (M =I;F=2) 1.58 .50 197 Oil .065 .056 -.048 .075 .057 .034
9. Marital status 1.48 .50 196 -.001 .120 .048 - Oi l .025 .052 -.060 .012
(married=2; single=l)
10. Number of .97 1.31 199 -.152* -.115 -.014 -.015 .018 -.144 .056 .077 .345
dependents
11. Job status 1.05 .22 199 .081 .121 .072 .047 .008 .291 .002 .181 -.178 .083
(full tim e=l; part=2)
12. Union status .48 .52 198 .201** .397** .003 -.005 .258 .055 -.302 .041 .103 -.086 .009
(member= 1 ; not=0)
13. Education Level 4.81 1.09 196 -.130 -.125 -.062 -.008 -.110 .043 .088 .219 .088 -.026 -.024 -.183
♦ p<.05 ♦♦p<.OI Note:'’tenure is categorized in groups l-IO, 11-20,21-30,31-40
' Numbers in parentheses on the diagonal are coefficient alphas for scales ‘ Age is categorized in groups: under 25 ,25-44,45 and above 00

79
There was no significant correlation found between benefit satisfaction and the
hourly or salaried variable. However a significant correlation was found between
organizational commitment and salaried employees (see table 24). Salaried employees
were significantly more conunitted than hourly employees (see table 25).
Table 25
Organizational Commitment for Salaried Versus Hourly Employees
Mean Median SD N
Hourly 41.64 41.30 11.02 177
Salaried 49.04** 46.30 12.36 19
•*p<.001
The remaining demographic variables tested for correlations with benefit
satisfaction and organizational commitment were found to be insignificant in this study.
These variables included tenure, gender, marital status, education level and job status.
Summary
This chapter presented the study results in detail. All four hypothesis were tested
and were either fully or partially accepted. The discussion on the findings will be
presented in chapter five. This will include conclusions and recommendations.
Reproduced with permission of the copyright owner. Further reproduction prohibited without permission.

CHAPTER 5
DISCUSSION, RECOMMENDATIONS,
AND CONCLUSIONS
Introduction
The purpose of this study was to examine the influence of intemal service quality
and benefit satisfaction on organizational commitment and job satisfaction. This is
important because employee benefit satisfaction may influence employee attitudes related
to organizational commitment. An understanding of benefit satisfaction may lead to an
increased understanding of other employee attitudes and behaviors such as intent to
turnover and willingness to expand effort for the organization. The results of the study
may help industry professionals in customizing their benefit packages and shaping the
intemal service quality in their organizations to improve employees' organizational
commitment. Consequently this would help hospitality managers provide customers with
the quality service necessary for survival in a competitive market as well as fight costly
turnover.
80
Reproduced with permission of the copyright owner. Further reproduction prohibited without permission.

81
Discussion of Results
Demographic Data
The demographic data found is generally consistent with the national 'Industry of
Choice' report of the Foodservice Research Forum (1997) and with the Current
Population Survey of the Nevada hospitality industry (Waddoups. 1996). The employee
gender breakdown in the study was 57.9 percent female and 42.1 percent male. This is
similar to the Foodservice Industry Report that showed a majority of 51 percent female
workers and 49 percent of male workers. Marital status results were also consistent
showing 51.5 percent o f single employees in this study and 51.8 percent of single
employees in the national Foodservice Industry Report.
Racial categories in the study consisted of a majority of Caucasian (61.4%)
workers and about the same percentage of Hispanic and African American workers
(13.6% and 13.1% respectively). These results are very similar to the Foodservice
Industry Report, showing 74.6 percent o f the workforce to be Caucasian and 13.4 and 12
percent respectively to be Hispanic and African American.
Education level results in the study were slightly different from the findings o f the
national Foodservice Industry Report. The education level o f the hotel’s workforce was
found to be somewhat higher than the education level reported for foodservice employees
on a national level. This study found only 5.1 percent of the hotel's employees to have
less than a high school education compared to the 31.4 percent reported in the
Foodservice Industry Report. High school graduates comprised 37.2 percent of the study,
49 percent had some college education, and 8.6 percent had a college degree of some
Reproduced with permission of the copyright owner. Further reproduction prohibited without permission.

82
level. The national Foodservice Industry Report shows 26.6 percent to have graduated
from high school, 26.6 percent to have a some college education, and 7.4 percent to have
a college degree of some level. This discrepancy may be a result of the voluntary
character of this survey because educated employees are more likely to feel comfortable
with written material and thus were more likely to complete the survey.
The results for union membersnip and age were found to be consistent with the
reported findings of the Current Population Survey (Waddoups, 1996). Average age
found in the study was 40.69 years, which is slightly higher than the average age o f 39.46
years reported in the Current Population Survey for hospitality employees in Nevada.
Union status in the study was 46 percent union and 53 percent non union (1% did not
know union status), which is consistent with the Current Population Survey which
reported 48 percent union and 52 percent non-union, for hospitality workers in Nevada.
Hvpothesis Testing
The results of this study provided support for the stated hypothesis indicating
significant correlations between benefit satisfaction and organizational commitment,
between satisfaction with internal services received and organizational commitment,
between communication received and benefit satisfaction, and between certain
sociodemographic variables and benefit satisfaction and organizational commitment.
An in depth discussion of each individual hypothesis follows, including interpretations of
the satisfaction scores found in the study.
Reproduced with permission of the copyright owner. Further reproduction prohibited without permission.

83
Hvpothesis 1
Hypothesis 1 predicted that employee benefit satisfaction and organizational
commitment would be positively correlated. Satisfaction scores suggested that employees
were mostly dissatisfied with their benefits, the results were consistent when tested for
individual benefit satisfaction, overall benefit satisfaction, and satisfaction with coverage
and perceived value. The correlation results showed that overall benefit satisfaction and
satisfaction with benefit coverage and perceived value were significantly related to
organizational commitment. Lane (1993) and Harris and Fink (1994) also found
significant correlation between benefit satisfaction and organizational commitment.
Martin and Bennett (1996) found only a low correlation between the two variables. These
results suggest that the higher employees’ benefit satisfaction the higher their
organizational commitment. Therefore, employees who are satisfied with the benefits
they receive are more likely to be committed to the organization. The implication for
hospitality managers is that benefit packages should be molded to meet employees’
needs. By offering the right combination of benefits employers will have the possibility
o f influencing employees’ perceptions of, and attitudes toward, the organization.
The linear regression results revealed that benefit satisfaction (both overall
satisfaction and satisfaction with perceived value and coverage) is a predictor of
organizational commitment. The R-square shows that overall benefit satisfaction explains
10.8 percent of the variability in the dependent variable of organizational commitment.
Satisfaction with benefit coverage and perceived value explains 3.8 percent of the
variability in the dependent variable of organizational commitment.
Reproduced with permission of the copyright owner. Further reproduction prohibited without permission.

84
Hvpothesis 2
Hypothesis 2 predicted that the satisfaction with the quality of the seven
components of internal service would be positively related to organizational commitment
and job satisfaction. In this study intemal services included (1) tools, (2) policies and
procedures, (3) teamwork, (4) management, (5) training, (6) communication, and (7)
rewards and recognition. The mean scores for satisfaction with the seven components of
intemal service indicated that employees were mostly dissatisfied with the intemal
services they received at the hotel. The intemal service component employees were least
satisfied with was communication received and rewards and recognition and most
satisfied with their direct supervisors and with interactions with their co-workers.
The correlation results showed that employees’ satisfaction with the seven
components of internal service was significantly related to organizational commitment
and to job satisfaction. These results are consistent with the findings of Hallowell,
Schlesinger, and Zomitsky (1996) who found satisfaction with intemal services to be
significantly correlated with job satisfaction.
Multiple regression revealed four of the components of intemal service to be
predictors of organizational commitment and job satisfaction. Management (direct
supervisor), team work, policies and procedures, and rewards and recognition were found
to be significantly correlated with organizational commitment and job satisfaction.
However, team work was found to be negatively correlated with organizational
commitment and job satisfaction. While statistically meaningful, this finding is opposed
to the researcher’s expectation that satisfaction with team work (i.e. interactions with co
workers) would increase job-satisfaction and if not increase, than not have a negative
Reproduced with permission of the copyright owner. Further reproduction prohibited without permission.

85
impact on organizational commitment. It is possible that the surveyed hotel does not
promote team work and there fore employees rated it poorly. Future research is needed to
confirm or deny the existence of a negative relationship between satisfaction with team
work with organizational commitment and job satisfaction. The R-square shows that the
model explains 50.9 percent of the variability in organizational commitment and 41.9
percent of the variability in job satisfaction.
These findings are important because all seven components of intemal service are
controlled by management and can be influenced by management. Hospitality employers
have the ability to improve the quality of the seven components of intemal services and
in that way increase job satisfaction and organizational commitment. Determining which
of the seven components are most significant in increasing organizational commitment
and improving job satisfaction, allows hospitality managers to target these components
directly.
Hvpothesis 3
Hypothesis 3 predicted that there would be a positive correlation between the
satisfaction with the communication received from the Human Resources department and
employee benefit satisfaction. The mean score for communication received from the
human resources department implies that most employees were neither satisfied nor
dissatisfied with the communication they received. However, when employee knowledge
about benefits was compared to actual benefits provided a discrepancy was discovered.
This suggests that the communication between the Human Resources department and the
workers is deficient.
Reproduced with permission of the copyright owner. Further reproduction prohibited without permission.

86
The correlation results show that the satisfaction with the communication received
from the Human Resources department was significantly correlated with benefit
satisfaction. These findings are consistent with those of Trembley. Sire, and Pelchat
(1998) who found communication received to be a main predictor of benefit satisfaction.
Therefore, the more satisfied employees are with the information they receive the more
likely they are to be satisfied with their benefits and vice versa. Williams (1995) and
Rabin (1994) also found communication to be highly related to benefit satisfaction.
Linear regression revealed that communication received from the Human Resources
department is a predictor o f benefit satisfaction. The R-square shows that satisfaction
with communication received explains 22.3 percent o f the variability in overall benefit
satisfaction and 16.4 percent o f the variability in satisfaction with coverage and value.
Satisfaction with communication received is determined by the quantity and the
quality (ease of undemtanding) o f the information provided and the frequency and ease in
which it is granted. Employees are likely to have a better understanding of benefit
packages where an effective communications program exists. Consequently,
knowledgeable employees are more likely to have an increased sense of security and
protection and thus be more satisfied with their benefits.
Hvtx)thesis 4
Hypothesis 4 stated that there would be significant relationships between
sociodemographic characteristics and benefit satisfaction. This hypothesis was proved for
only three of the sociodemographic variables: age, number o f dependents, and union
status.
Reproduced with permission of the copyright owner. Further reproduction prohibited without permission.

87
Tremblay, Sire, and Pelchat (1998) found no significant correlation between
socio-demographic factors (gender, age, number of dependents, education level, and
tenure) and benefit satisfaction. They suggested that this limited effect was caused by the
introduction of perceptual variables (in benefit satisfaction measures) into the cumulative
scores. They hypothesized that these variables may have a direct effect when specific
benefit elements are studied. However, in this study, when satisfaction with individual
benefits was correlated with sociodemographic variables no significant correlations were
found.
Age
Age and organizational commitment and age and Job satisfaction were found to be
both positively correlated. Lane (1993) also found age and organizational commitment to
be significantly correlated. These results suggest that older workers are more likely to be
satisfied with their jobs and have higher levels of organizational commitment. No
significant correlation was foimd between age and benefit satisfaction. Previous research
has produced inconsistent results in relationships between age and benefit satisfaction.
Lane (1993) fotmd age and benefit satisfaction to be significantly correlated but Balkin
and Griffeth (1993) found moderate support that age was negatively related to benefit
satisfaction, meaning that the older the employee is, the less likely he or she is to be
satisfied with benefits. Finally, Martin and Bermett (1996) and Tremblay, Sire, and
Pelchat (1998) found no correlation between age and benefit satisfaction.
Reproduced with permission of the copyright owner. Further reproduction prohibited without permission.

88
Number of dependents
Number of dependents was found to be negatively correlated with overall benefit
satisfaction. This means that the higher the number of dependents the lower the
employee’s satisfaction with benefits. However, Tremblay, Sire, and Pelchat (1998)
found the number of dependents to be statistically insignificant in the determination of
benefit satisfaction. Specific factors may be the cause for the low satisfaction level for
respondents with several dependents at the hotel property surveyed. This hotel does not
offer on site elder or child care, domestic paitner benefits, or scholarships for dependents
of employees which may have an impact on the benefit satisfaction level of respondents
with several dependants.
Union Status
Union status and benefit satisfaction (overall satisfaction and satisfaction with
coverage and value) were found to be significantly correlated. Union employees were
significantly more satisfied with overall benefits and with the coverage level and
perceived value than non-union employees. When individual benefits were tested for
significant correlations, union employees were found to be significantly more satisfied
with insurance services, HMO, PPP, dental plan, vision plan, intensive care insurance,
worker's compensation insurance, and unemployment insurance. However, non-union
employees were found to be significantly more satisfied with medical reimbursement.
The difference in benefit satisfaction between union and non-union employees
may be a result of the difference in benefit packages offered. The package provided by
the union is different than the one provided by the hotel. Therefore, it is possible that
Reproduced with permission of the copyright owner. Further reproduction prohibited without permission.

89
union members are more satisfied because of the different components provided in their
package as opposed to the benefits package provided by the hotel to non-union
employees. Another possible factor in the disparity of benefit satisfaction between union
and non-union employees is communication (i.e. level of knowledge employees have
concerning the components and value of the package). Union employees may be more
knowledgeable about the components and value of their benefits package because these
are usually agreed on after lengthy public bargaining which are often covered by the
media. The most recent negotiations were completed in June 1997 and included issues
such as wage, health insurance, and pension plans (Bach, 1997). Therefore it is possible
that union employees are more knowledgeable about these recently negotiated benefits.
Union employees may also have a higher sense of security knowing that the union is
working and bargaining for their welfare.
The standard deviations for the non-union employees mean scores (for overall
satisfaction scores) were slightly higher than those of the union employees, suggesting
that union employees, as a group, had more consistent opinions than non-union
employees.
Hourlv / Salaried
This study found no significant correlation between benefit satisfaction and
hourly or salaried employees. Conversely, Sammons and Petrillose (1998) foimd salaried
employees to be significantly more satisfied with benefits than hourly employees. In
addition. Balking and Griffeth (1993) found moderate support that salaried employees
were more likely to be satisfied with benefits than hourly employees were. A significant
Reproduced with permission of the copyright owner. Further reproduction prohibited without permission.

90
correlation was found between organizational commitment and hourly or salaried
variable. Salaried employees were significantly more committed than hourly employees.
This may be due to a feeling of increased sense of job security that salaried employees
feel they have as opposed to hourly employees.
The remaining demographic variables tested for correlations with benefit
satisfaction and organizational commitment were found to be insignificant in this study.
These variables included tenure, gender, marital status, education level, and job status.
Gender
Past studies have presented inconsistent results regarding gender and benefit
satisfaction; Balkin and Griffeth (1993) found some support that females are more
satisfied with benefits than males. Conversely Sammons and Petrillose (1998) found that
men were significantly more satisfied with overall benefit program than women.
However, Tremblay, Sire, and Pelchat (1998) found no significant correlation between
gender and benefit satisfaction.
Education Level
Balkin and Griffeth (1993) and Lust (1990) foimd education level to be negatively
related with benefit satisfaction meaning that the higher the education level the lower the
satisfaction with benefits. However, Tremblay, Sire, and Pelchat found no significant
correlation between education level and benefit satisfaction.
Reproduced with permission of the copyright owner. Further reproduction prohibited without permission.

91
Tenure
Lust (1990) and Lane (1993) found tenure to be positively related to benefit
satisfaction. However Griffith and Balkin (1993), Williams (1995). and Tremblay, Sire,
and Pelchat (1998) found that tenure was not significantly related to benefit satisfaction.
Recommendations for Future Research
This particular study was performed at a casino hotel in Las Vegas. It is common
place at this hotel to keep employee birth-dates on file in order to congratulate them
individually on their birthday. This caused some problem when the employees were
requested to fill out their birth-date on the survey. For future research, it would be
recommended to have employees provide only their age, or the year and month they were
bom, and not the exact date, so that they will not question the confidentiality of the study.
It was the data collector’s impression that several employees were reluctant to fill out the
date o f birth because they did not believe the survey was truly confidential and they
feared being reprimanded by management.
It was the data collector’s impression that the survey was too long for employees
to be able to fill it out accurately during their breaks. Several surveys were returned
uncompleted and were thus unusable. The survey could be shortened by eliminating or
combining repetitive questions. For example, the questions about tenure (questions 4.7 to
4.12 see Appendix A) could have been combined asking the length of employment in the
hotel, the position, and hospitality in general, in three questions instead of six. This could
Reproduced with permission of the copyright owner. Further reproduction prohibited without permission.

92
be done by allowing respondents to fill in the number of years and/or months of their
tenure.
A way to extend this line of research would be to examine the determinants of
benefit satisfaction in other Las Vegas casino hotels. The hotel that participated in this
study was one of Las Vegas’ oldest hotels. It would be interesting to see whether
employees at new properties are more satisfied with their benefits. This would include
comparing the actual benefit packages offered to verify if they are significantly different
and then comparing satisfaction with benefits between old and new properties. It may be
possible that new properties offer more elaborate benefit packages to be able to attract
experienced employees from existing hotels, therefore a comparison of the benefit
packages would be imperative. This also relates to satisfaction with internal services
because these may also be different in new properties. In a new hotel or restaurant the
tools provided (computers, maintenance equipment, kitchen equipment, etc.) are new
according to the most recent technological innovations. Managers and supervisors are
less likely to be burned out and thus maintain a high communication level between
employees and all levels of management. Policies and training manuals are up-to-date
and more attuned to recent human resources practices. These factors are only a few
examples of possible reasons for increased satisfaction with internal services in new
properties as opposed to old ones. A way for older hotels or restaurants to deal with such
issues could be to irmovate, to remain informed about changes and developments in the
industry, and implement them.
An additional issue that could be of interest for future research would be a
comparison between employee benefit satisfaction and satisfaction with internal services
Reproduced with permission of the copyright owner. Further reproduction prohibited without permission.

93
at casino-hotels and non-casino-hotels in Las Vegas and nation wide. It would be of
interest to see whether casino-hotels put the same emphasis on employee benefits and
internal services as do non-casino hotels.
The findings of this study concerning benefit satisfaction and union status raised
interest for future research. It could be beneficial to look at union status in correlation
with specific positions. Benefit satisfaction could be measured using these two variables
(i.e. union status and department) as control variables. Because certain positions are
dominated by union employees this may be a biasing factor in the study.
Industry Implications
The mean scores for employee satisfaction with communication received from the
Human Resources department suggested that employees were neither satisfied nor
dissatisfied with it. However, when employee knowledge about benefits was compared to
actual benefits provided a discrepancy was discovered. About a third of the employees
did not know that a health club discount and discounted tickets for events were available
to them and about a third of the employees believed other benefits that were not actually
offered were available. This suggests that the commimication between the Human
Resources department and the workers is deficient. Ways to solve this discrepancy are by
providing simple information material that would be readily available and prepared
according to the reading level of the average worker. Periodical meetings or a toll free
number for questions could also assist in making information available and promoting
communication.
Reproduced with permission of the copyright owner. Further reproduction prohibited without permission.
94
The component of internal service employees were found to be least satisfied with
was communication. This is a very important factor because informed employees have an
increased sense of security. Because a worker’s financial future depends partially, if not
completely, on the organization’s financial future, being informed about what is going on
is imperative for ones sense of security. Organizations that share information with their
workers provide them with a sense of partnership and a goal to work towards. This also
increases the sense of importance and self-esteem of workers and influences their
organizational commitment. Therefore it is important for top management to share
information with employees at all levels, be it through meetings, memos, or periodical
company news letters.
The multiple regression results showed management (direct supervisor), policies
and procedures, team work, and rewards and recognition to be predictors of
organizational commitment and job satisfaction. However, team work was found to be
negatively correlated with organizational commitment and job satisfaction. While
statistically meaningful, this finding is opposed to the researcher’s expectation that
satisfaction with team work (i.e. interactions with co-workers) would increase job-
satisfaction and if not increase than not have a negative impact on organizational
commitment. It is possible that this hotel does not promote team work and there fore
employees rated it poorly.
These results suggest that employers put an emphasis on these three components
(management (direct supervisor), policies and procedures, and rewards and recognition)
in their effort to increase organizational commitment and job satisfaction. All
components of internal service can be improved by management; Tools have to be
Reproduced with permission of the copyright owner. Further reproduction prohibited without permission.

95
replaced when necessary, so that employees will be able to provide guests with quality
service with out the stress involved in dealing with lacking or faulty equipment. Training
needs to be continued through out the employee’s career. For example, when
technological innovations are introduced employees must be brought up to date on using
the equipment to avoid frustration and low self esteem, which take a toll on service
quality and may even hurt retention. Policies and procedures need to be updated
according to new human resources practices, with the welfare of the employee in mind.
Often policies are written to facilitate the work of managers and supervisors, which
makes serving the guest a difficult task for front line employees. Rewards and recognition
are also very important for motivation and employee self esteem. They need not always
be monetary and can also be valuable in the form of positive feedback.
Conclusion
Benefit packages serve several purposes for both employees and employers.
Benefits affect employees’ quality of life, their health, and their financial future.
Additionally, benefits received effect employees' attitudes towards, and perceptions of,
the organization. In today's competitive hospitality industry, retention has become
extremely important, not only because of the increasing costs of turnover, but also
because of the need to remain competitive by providing customers with high quality
service. The shortage of qualified labor accentuates this issue even further. By remaining
attentive to employees’ needs, managers in the lodging and restaurant business can try to
influence employee attitudes.
Reproduced with permission of the copyright owner. Further reproduction prohibited without permission.

96
This study has shown the relationship between benefit satisfaction and
organizational commitment to be significant. This implies that employees who are
satisfied with their benefits are more likely to expand effort for the organization and have
a desire to maintain affiliation with the organization. However, many employees identify
benefits as part of their whole pay package and expect employers to provide them with
more than financial rewards (i.e. benefits and pay). This refers to internal services
provided to employees within the organization itself, which determine the quality of the
organizational environment. To be able to motivate employees to provide hospitality
customers with high levels of service, organizations need to pay close attention to the
factors that make up a positive and motivating organizational environment. In this study
the components of internal service included (1) tools, (2) policies and procedures, (3)
teamwork, (4) management, (5) training, (6) communication, and (7) rewards and
recognition. The results found that all seven components of internal service were
significant in determining organizational commitment, and all but one (i.e. teamwork) to
be significant in determining job satisfaction. All seven components of internal service
are controllable, meaning employers can improve their quality and thus improve job
satisfaction and organizational commitment.
The importance of communication between the Human Resources department and
the employees has been found to be a predictor of benefit satisfaction in this study as well
as in several past studies. The implications of these findings for hospitality managers are
that providing employees with knowledge about their benefits is almost as important as
providing them with the benefits themselves. An effective communication strategy is
essential to improve attitudes towards benefits and the organization in general.
Reproduced with permission of the copyright owner. Further reproduction prohibited without permission.

97
This study has pointed out basic issues that hospitality managers can and should
control closely. Adequate benefit communication increases benefit satisfaction, which
influences organizational commitment. Satisfaction with internal services also increases
organizational commitment and job satisfaction. By improving communication and
internal services managers have the ability to increase organizational commitment and
job satisfaction. Consequently, turnover can be reduced and employees can be motivated
to expand effort towards the organization thus providing customers with the high quality
service necessary for survival in today’s competitive hospitality industry.
Reproduced with permission of the copyright owner. Further reproduction prohibited without permission.

98
APPENDIX A
Survey and Letter to Participants
Reproduced with permission of the copyright owner. Further reproduction prohibited without permission.

99
UNEDear Casino Hotel Employee.
The following survey is pan of a research study designed to examine your satisfaction with benefits as well as work place issues and your job. Your participation in this study is voluntaiy . Your answers should reflect ytnir true feelings and beliefs about the statements included on the sursey There are no right or wrong answers. This is not a test
It should be emphasized that your individual answers are for research purposes only and they will be kept strictly conJldaatial by the researcher. Uniicr no drctamstamee* will your indiviiiual responses be reported to anyone in the organizadon. Your answers posidve, neutral or neganve will in no way affect you. Remember, that your responses, will remain eoalidratial ml all times
This survey will take approaimately 20 miamtcs to complete. If you have any concerns about the conddentkiity of the process or quesnons in general, please discuss your concents with the meeting proctor. They stouid be able to answer any of your questions. We would prefer to talk further with you about these concerns rather than miss the opportunity for your cooperation. Your responses are important to us. Once you have completed the survey, please enclose in envelope providecL
Thank you in advance for patticipating in this survey. We appreciate you taking time to complete the survey. Your accnratc iafoimatiom will help make the study a success. If you have any quesnons teganiing this study, please contact Michael Petrillose at 702>89S-0802 or Gail Sammons at 702-89S-4462. If you have any questions regarding the rights of research subjects, please contact UNLV’s Office of Sponsoted Propana at 702>89S>13S7.
Sincerely,
Gail Sanunons, Ph.D.Assistant Professor Assistant Professor
Write in the name of the property where you are currently working:
If you are not currently working, where have you applied?
William F Harrah College of Hotel Administration Department of Hotel Management
Box 456021 • 4505 Maryland Parkway • Las Vegas. Nevada 891546021 (7021 895-3230 • FAX (702) 89&4S72
Reproduced with permission of the copyright owner. Further reproduction prohibited without permission.

lOO
Parti About Your Job
Directions:Please read each of the following statements about your job carefully. For each
statement, you are asked to rate your level of agreement on the five-point scale provided. Please circle the one best response to each statement below.
Please rate the foOowtag statements on a scale from strongly dimgrcc to strongly agree.
CXrdir the ratiag that beat describes yonr agrtcmeat with the statement.
1i
1 Î! 1 Ï
Î1.1 AH in ah, 1 am sotislled with my Jeh. 1 2 3 4 5
1.2 I am willing to pat la a great deal sf eifsrt beyond that normally eapectcd in order to help Ihia hotel be sncceasfU.
1 2 3 4 S
IJ Deciding to work for tUs hotel was a deBnite mistake on my part 1 2 3 4 5
1.4 1 really cam abont the Ibtam of this hotfL 1 2 3 4 5
1.5 I am eatreasely glad that 1 chose to work Csrihis botd over other hotels. 1 2 3 4 5
1.6 1 am proad m tsB others that 1 am port of thb hotel. 1 2 3 4 5
1.7 1 often think ahoat qnitting thto Job. 1 2 3 4 5
in 1 asaaBy tsH my ftisnds that thb it a great hotel to work for. 1 2 3 4 5
in 1 feel very UtUe loyalty to thb hotel 1 2 3 4 5
1.10 la general, 1 don’t gke my Job. 1 2 3 4 5
1.11 1 Bad that my vaincs and the hetaTs vabses am very similar. 1 2 3 4 5
1.12 it wonid lake very Httb m caaae me m kovc thb hotel 1 2 3 5
1.13 Thb hotel teaUy iasplrea the very beat la me la the way of Job performance. 1 2 3 4 5
1.14 For me, thb b the best o f sB possiMe hoteb m work ftr. 1 2 3 4 5
1.19 Them’s not too mneh to be gninaU by staying with thia hotel Indeflnitely. 1 2 3 4 5
1.16 Often, I Mad It dUBcnit In agrssseiththls hotel’s psMrln on Important mnttnta rdaUng m Its smployoao.
1 2 3 4 5
1.17 iwUpfobobly look torn new Job in the nest year. 1 2 3 4 9
1.10 I cooldjnst as wsB he working Oses dUUrent hotel as long as the type of work wna similar.
1 2 3 4 9
1.19 In general, I like working here. 1 2 3 4 9
1.20 1 wonUoeeeptohnost any type ofjobossigamant in order m heap working for tUshotsL
1 2 3 4 9
1.21 If 1 bad the chance, Iwonid take a diftbmnt Job trithin thb hotel company. 1 2 3 4 9
Mam commue on 10 oe« page.
Reproduced with permission of the copyright owner. Further reproduction prohibited without permission.

101
Part II Workplace Issues
Directions;Please read each of the following statements about workplace issues carefully. For
each statement, you are asked to rate your level of satisfaction with the workplace issue on the five-point scale provided. Please circle the gge best response to each statement below.
Please rate the followiag statemcois oo a scale from very dissatisficd to very satisfied
O rcU the rating that best describes your satisCictioa with the workplace issue.
11
11 I 1
13
1
2.1 Advancement opportunities at your company. 1 2 3 4 s2.2 Yoor direct supervisor. 1 2 3 4 5
2J Your level of pay. 1 2 3 4 5
2.4 Interactions with your coworkers. 1 2 3 4 S
25 The types of tasks yon have to do on a daily basia. 1 2 3 4 S
2.6 The amount o f information you receive from top management on what is going on in your hotel
1 2 3 4 S
2.7 The recognition you receive for doing a good job. 1 2 3 4 S
25 The type of training yon receive. 1 2 3 4 S
2.9 The reward systems in place. 1 2 3 4 S
2.10 The way yoer performance is evaluated. 1 2 3 4 S
2.11 The toois/maiciials you receive to do yonr Job. 1 2 3 4 S
2.12 The ovcmn pottdm and practices of yonr botal 1 2 3 4 S
2.13 The dependant care prnvhloaa (child or older) provided by yonr hotel 1 2 3 4 S
2.14 The health and wen baiagpngraaa(taplajrecaasiataacc program, fiOMn fadUties, etc).
1 2 3 4 5
2.15 The Baaadalbcacllta from year company (atock,rcdrcmcatplaa, etc.). 1 2 3 4 S
2.16 The insuraaec services. 1 2 3 4 S
2.17 The company’s commanity involvement. 1 2 3 4 S
Please commue on lo next page.
Reproduced with permission of the copyright owner. Further reproduction prohibited without permission.

102
Part III Benefit Satisfaction
D irec tio n s;P lease read each o f the fo llow ing benefit-re lated sta tem ents carefu lly . For each statem ent, you are asked to r a te y o u r level o f a g re e m e n t on the five-po in t sca le from strongly disagree to strongly agree. P lease c irc le the g g e best response to each sta tem ent below .
Rate ihe Ibllowiog statements on a scale from strongly disagree to strongly agree.
Bcacfit Sattofiictioa Stalemcais
1Î 1 1111<f3.1 The overall benefits program meets my needs. 1 2 3 4 5
3.2 The Human Resource department gives me enough information about my benefits.
I 2 3 4 5
3J The medical insurance provides enough protection. 1 2 3 4 5
3.4 My benefits are wotth the contributions I tnust make. 1 2 3 4 5
3.5 The dental insurance provides enough protection. 1 2 3 4 5
3.6 The vision insurance provides enough protection. 1 2 3 4 5
3.7 The Human Resource department notifies meins timely maimer of any changes in plan benefits and/or procedures.
1 2 3 4 5
3.8 The Human Resource department is responsive and helpfW wiien I have questions about my benefits or need assistance.
1 2 3 4 5
Directions;Please indicate your level of satisfaction with each benefit listed below on the five-point
scale from very dissatisfied to very satisfied. If you do not receive the listed benefit at your hotel, circle NP under the **Not Provided” column. Please circle the one best response to each statement below.
Rate the fitUowing benefits on a scale from
Circle the appropriate taiing fry each benefiL If you do not have the benefit, cinlt NP.
Hewsatlafiedareyenwltk the benefits elXhrad ml year hotel?
11NP
i11
112
!3
14
i15
3.9 HMO (Health Maintenance Organization) NP I 2 3 4 5
3.1C Self-funded (Preferred Provider Plan) NP 1 2 3 4 5
3.11 Dental plan NP 1 2 3 4 5
3.12 Vision plan NP 1 2 3 4 5
Pleax coodnue on CO next page.
Reproduced with permission of the copyright owner. Further reproduction prohibited without permission.

103
Rate the following benefits on a scale from very dissatisfied to vety satisfied.
Circle the appropriate rating for each benefit If you do not have the benefit circle NP.
How satisfied are yea with the benefits affercd at your hotel?
11
NP
11f
1
12
13
14
1s31Î>
s
3.13 Life insurance NP 1 2 3 4 5
3.14 Cancer care insurance NP 1 2 4 5
3 15 Long-iem disability NP 1 2 3 4 5
3.16 Medical reimbursement NP 1 2 3 4 5
3.17 Oependem care retmbursement NP 1 2 3 4 5
3.18 Intensive care insurance NP 1 2 3 4 5
3.19 Auionxrbile insurance NP I 2 3 4 5
320 Homeowner's insurance NP I 2 3 4 5
3.21 Worker's cotnpensatitio insurance NP 1 2 3 4 5
3.22 Unemployment insurance NP 1 2 3 4 5
PimtioM?The following list are examples of other benefits offered in the hospitality industry. Please tell us how frequently you use each o f the benefits below. Please circle the one best response to each statement below.
Circle the appropriate rating for each benefit
How fiaquetifiy do yuu use these bemefias?11
1*
11
353 On she Concierge or Travel Agency for empliryee use NP 1 2 3 4 5
354 On site dry dcaning NP 1 2 3 4 5
3.25 On she elder or child day care NP 1 2 3 4 5
356 Matchmg college alumni donations NP 1 3 4 5
357 Time off ftr commmiiQr service NP I 2 3 4 5
358 Company sponsored shuttle to subway, train or parking lot NP 1 2 3 4 5
359 Nutritian / vseUiieai daises NP 1 2 3 4 5
350 Domestic partner benefits NP 1 2 3 4 5
351 Adoption benefit NP 1 2 3 4 5
352 Health dub membership discount NP 1 2 3 4 5
353 Editfstitaial Assistance Program NP 1 2 3 4 5
354 Scbolanhip fbrdependeiiti of employees NP 1 2 3 4 5
355 Discotmted tickets (sporting events, concerts, etc) NP 1 2 3 4 5
Pkwe eoniiniie on to next page.
Reproduced with permission of the copyright owner. Further reproduction prohibited without permission.

104
PART IV ABOUT YOU
I In what month and year were y ou bom?
2. Please write in TODAY'S DATE: ___
. (Please print month, year /
DIRECTIONS:For each question in this section please indicate the ONE best response by filling in (# ) the corresponding bubble.
3. In which department do you currently work?
7.
D Accounting O Engineering / MaintenanceO Adminisiratioa O Front OfficeO Banquets / Catering Production O Garage / Valet Parking
(Kitchen staff) O Health Club / Spao Banquets / Catering Service O Housekeeping / Laundry
(Servers, hosts, etc.) O Human ResourcesD Bar / Lounge O PBXo Bell Station O Purchasing / Receivingo Business Center O Reservationso Casino - Marketing O Restaurant Productiono Casino - Slots (Back of House)o Casino - Table Games O Restaurant Service (Front of House)o Concierge / Guest Services O Sales & Marketingo Convention / Conference Services O Safety/Securityo Other Department (please specify)
Are you a..O Front Line Employee
What is your gender?O Male
O Supervisor
Female
O Manager / Assistant Manager
Which race category do you most closely identify with?O American Indian or American Native O HispanicO Asian or Pacific Islander O White (not of Hispanic origin)O Black (not of Hispanic origin)
How IO less than 3 months (Skip to question §9.)O 6-11 months (Skip to question Ü9.)
O 3-6 months (Skip to question H9.)O at least one year (Answer question US.)
8. If you have been with this hotel for at least one year, please indicate the number of years worked, by filling in the blank: Number of years
9. How long have you been working in vour current ixisition?O less than 3 months (Sibpro question O 3-6 moatiis (Skip to question ail.)O 6-11 months (Skip to question KJl.) O at least one year (Answer question *10.)
10. If you have been in your cunrem position for at least one year, please indicate the number of years you have heldthis position, by filling in the blank: Number of years
Please continue on to next page.
Reproduced with permission of the copyright owner. Further reproduction prohibited without permission.

105
II
1 2 .
How long have you been working in hotels, tn general?3 less than 3 months (Skip to question » J 3 1 DD 6-11 months/5/bp to quejtton ; D
36 months iSkip to question »I3 i at least one year iAns\*er question »/2 ;
If you have been worlùng in hotels for at least one vear. please indicate the total number of vears y ou ha\e worked in hotels, bv filling in the blank: ____ Number of vears
13. What IS the highest level of education you have achieved? D Some eletnentary school0 Completed elementary school0 Some high schoolD Graduated from high school (or received a GED)D Some college (2-year or 4-year) or technical trainingD Completed technical training or Associates DegreeD Graduated college (Bachelors Degree)O Some gr.iduate schoolD Graduate degree (Masters, Ph.D., MD. LLO. etc.)
14. What is the primary language you sneak?o Arabic O German O Russiano Chinese o Italian O Spanish0 Creole o Japanese o Tagalogo English o Korean o Vienuuneseo French o Polish □ Other
(Please specify.)
What second language to you know?O Arabic o German O RussianO Chinese o Italian O SpanishO Creole o Japanese O TagalogO English o Korean O VietnameseO Frermh o Polish O Other
16. Do you read this second language fluently? O Yes O No
(Please specify.)
17. Do you sneak this second language fluently?O Yes O No
18. Are you using your hotel benefits program as your BUUBStMirce of benefits?D Yes O No O In my job, I do not receive benefits.
Please skip to question it 21.
19. Please indicate how many dependetus you claim with your beiufits package. O O O 1 0 2 0 3 0 40 5 0 6 0 7 0 8 0 9
20. Please indicate the age. in years of each dependent you have.
#1#4#7
#2#5#8
#3#6*9
Please continue on to next page.
Reproduced with permission of the copyright owner. Further reproduction prohibited without permission.

106
1 1. What is your birth date?
29.
(Month. Day. Year)
23.
24.
25.
26.
27.
28.
What is your marital status?3 Single D Divorced3 Married ' Partnered D Widowed
.Are you an hourly or salaried employee of this hotel?3 Hourly D Salaned
What is your current job status?3O
Full time Part time
O Temporary O Seasonal
What shift do you work most often?□ a.m. OO p.m. OO I work all different types of shifts.
Are you a member of a union at this hotel? O Yes O No
swing (between ajn. & p m.) "graveyard: (overnight)
Don't know
How long has it been since you were pven a new job classification O Less than 3 months O 6-11 monthsO 36 months O at least one year
How likely is it that you will still be working here two years from now?O Very likely (Answer question *29.)O Somewhat likely (Answer question *29.)O Not sure (Answer question *29.)Q Somewhat unlikely (Thank you, this was your last question.)O Very unlikely (TTuaik you, this was your last question.)
Please indicate all the reasons why you might leave your job within then the next two years? (Fill in (#) the bubbles next to ALL (he responses that apply.)
OOoooo
Better pay CBetter career opportunities Better management Better benefitsBetter human resources practices Other__________________
Better job overall O Better work hours O A promotion O Company values that are more
similar to my own values
Other(Please stale reasotL)
(Please state reason.)
Thank you for participating in our study.Please put the survey in the attached envelope.
Leave it with the survey administrator or turn into the culinary office.
Reproduced with permission of the copyright owner. Further reproduction prohibited without permission.
107
APPENDIX B
Human Subjects Form
Reproduced with permission of the copyright owner. Further reproduction prohibited without permission.

108
U N i yU M v £ P s ‘ T> C) : : . f ' w A [ ) A l a s V t
DATE: March 9, 1998TO: Or. Gail Sammons
Dr. Michael Petrillose M/S 6021 (HTLM)FROM: / ^ w ^ l i a m E. Schulze, Director
^ Office of Sponsored Programs (X1357)RE: Status of Human Subject Protocol Entitled:
"An Empirical Analysis of the Relationship Between Ençloyee Benefits and En^loyee Retention in Las Vegas Casino Hotels*OSP #604f0398-222e
The protocol for the project referenced atbove has been reviewed by the Office of Sponsored Programs and it has been determined that it meets the criteria for exemption from full review by the ÜMLV human subjects Institutional Review Board. This protocol is approved for a period of one year from the date of this notification and work on the project may proceed.Should the use of human subjects described in this protocol continue beyond a year from the date of this notification, it will be necessary to request an extension.If you have any questions regarding this information, please contact Marsha Green in the Office of Sponsored Programs at 895-1357.
cc: OSP File
Office of Sponsored Programs 4505 Maryland Parkway • Box ^1037 • Las Vegas. Nevada 89154-1037
(702] 895-1357 • FAX (702) 895-4242
Reproduced with permission of the copyright owner. Further reproduction prohibited without permission.

REFERENCES
Allen, N. J. & Meyer, J. P. (1990). The measurement and antecedents of affective,
continuance and normative commitment to the organization. Journal of Occupational
Psvchologv. 63.1-18.
Anonymous. (1998). Association health plans provision passes house.
Washington Weekly Newsletter. 18(30), 3.
Bach, L. K. (1997). Union wants to protect job security. Las Vegas Review
Journal.
Balkin, D. & Griffeth, R. (1993). The determinants of employee benefit
satisfaction. Journal of Business and Psychology. 7(3), 323-339.
Barber, A. E., Dunham, R. B., & Formisano, R. A. (1992). The impact of flexible
benefits on employee satisfaction: a Held study. Personnel Psychology. 45(1). 55-75.
Bergmann, T. J., Bergmarm, M. A., & Grahn, J.L. (1994). How important are
employee benefits to public sector employees. Public Personnel Management. 23(3). 397-
406.
Boyd, O. J. & West, J. J. (1993). An analysis of the effect of fringe benefit
offerings on the turnover of hourly housekeeping workers in the hotel industry.
International Journal of Hospitality Management. 12(4), 323-336
109
Reproduced with permission of the copyright owner. Further reproduction prohibited without permission.
110
Carraher, S. M., Hart, D. E., Buckley M. R., & Sawyer, J. E. (1992).
Organizational implications of employee attitudes towards benefits. Presented at the
Academy of Management Annual Meeting. Las Vegas, NV.
Cole, J. (1997). Auto and home insurance: the new employee benefit. HR Focus.
74(12), 9-11.
Comeau, M. (1994). Little things mean a lot. Casino Journal. 59-60.
Danehower, C. & Lust, J. A. (1992). A conceptual model of the determinants of
employee benefit satisfaction. Human Resource Management Review. 2(3), 221-238.
Davison, B. (1997). Special report: strategies for managing retention. HR Focus.
74(10), S3.
Fitz-Enz, J. (1997). It's costly to lose good employees. Workforce. 76(8), 50-51
Gribble, J. (1997). Complicated benefits packages require simple presentation.
The Business Journal - Milwaukee. 15(2). 16-18.
Haar, J. & Kossack, S. (1990). Employee benefit packages: how understandable
are they? The Journal of Business Communication. 27(2). 185-199.
Hallowell, R., Schlesinger, L. A., & Zomitsky, J. (1996). Internal service quality,
customer and job satisfaction: linkages and implications for management. Human
Resource Planning. 19(2), 20-32
Hansen, F. (1998). Current issues in compensation and benefits. Compensation
and Benefits Review. 30(3). 6-16.
Harris, M. M. & Fink, L. S. (1994). Employee benefit programs and attitudinal
and behavioral outcomes: a preliminary model. Human Resources Management Review.
4(2) 117-129.
Reproduced with permission of the copyright owner. Further reproduction prohibited without permission.

I l l
Hertzog, K. C. (1997). Motivate your staff with time-related benefits. San Dieeo
Business Journal. 18(40). 17-18.
Howard, M. (1997). HIPAA: what’s that? Florida Trend. 40(4). 62-64.
Industry of Choice. (1997). Food service research forum. The Educational
Foundation. National Restaurant Association. Chicago Illinois.
Jossi, F. (1997). From welfare to work. Training. 7(4), 71-82.
Judge, T. A. (1993). Validity of the dimensions of the pay satisfaction
questionnaire: evidence of differential prediction. Personnel Psvchologv. 46(2), 331-355.
Lane, M. C. (1993). The effect of employee benefit satisfaction on organizational
consequences. Proceedings of the Fortv-fifth Annual Meeting of the Industrial Relations
Research Association, editor J. Burton, 99-104.
Leming, J. (1998). Workers benefit from tight market; Service industries offer
employees health coverage to lure them aboard. Journal of Commerce and Commercial.
416(29241). 5A.
Lust, J. A. (1990). The determinants of employee fringe benefit satisfaction: a
repiication ind revision. Benefits Ouarterlv. 6(2), 89-95.
Martin, C. L. & Bennett, N. (1996). The role of justice judgements in explaining
the relationship between job satisfaction and organizational commitment. Group and
Organization Management 21(1). 84-105.
Meinders, K. (1998). Group legal insurance: a new frontier. Employee Services
Management. 4J[(3), 29-30.
Mula, R. (1998). Dependent care now: dual issues. Employee Services
Management. 41(9). 11-14.
Reproduced with permission of the copyright owner. Further reproduction prohibited without permission.

112
Papiemick, R. L. (1997). People - the single point of difference - paying them.
Nation's Restaurant News. 31(40). 124-126.
Rabin, B. R. (1994). Assessing employee benefit satisfaction under flexible
benefits. Compensation and Benefits Management. 10(3), 33-44.
Rockwell, S., O'Leary, J., Greenlry, J., & Scheckler, W. (1992). Health
maintenance organizations versus fee for service: patient satisfaction with cost and
quality. Proceedings of the Fiftv-second Annual Meeting of the Academv of
Management. Las Vegas, NV, 91-95.
Rose, R. W. (1991). Comparison of employee turnover in food and beverage and
other departments in hotel properties. Texas Woman s University, Denton Texas.
Sammons, G. & Petrillose, M. (1998) Analysis of benefits offered within the U.S.
Lodging Industry. Manuscript submitted for publication.
Tremblay, M., Sire, B., & Pelchat A. (1998). A Study of the determinants and of
the impact o f flexibility on employee benefit satisfaction. Human Relations. 51(5), 667-
689.
U.S. Department of Labor, Bureau of Labor Statistics. (1995). Employee Benefits
in Medium and Large Private Establishments, Bulletin 2496. Washington D.C.. U.S.
Government Printing Office.
U.S Department of Labor, Employment Standards Administration Wage and
Hour Division. (1996). Compliance guide to the family and medical leave act, WH
Publication 1421. Washington D C., U.S. Government Printing Office.
Reproduced with permission of the copyright owner. Further reproduction prohibited without permission.

113
Waddoups, C. J. ( 1996) Union-nonunion wage differentials in the hotel industry:
the case of Las Vegas and other large hotel markets. University of Nevada Las Vegas,
Department of Economics.
Ward, E. D. & Davis, E. (1995). The effect of benefit satisfaction on
organizational commitment. Compensation and Benefits Management. ii(3 ), 35-40.
Weiss, N. (1998). How Starbucks impassions workers to drive growth.
Workforce. 77(8), 60-60.
Williams, M. L. (1995). Antecedents of employee benefit level satisfaction: a test
model. Journal of Management. 21(6). 1097-1128.
Young, A. C. & Lundberg, C. C. (1996). Creating a good first day on the job:
allaying newcomers' anxiety with positive messages. Cornell Hotel and Restaurant
Administration Ouarterlv. 67(6). 26-33.
WEB REFERENCES
EMPLOYEASE web site
The National Center for Employee ownership
U.S. Department o f Labor Bureau of Labor Statistics
www.employease.com
www.nceo.org
www.stats.bls.gov
Reproduced with permission of the copyright owner. Further reproduction prohibited without permission.
VITA
Graduate College University of Nevada, Las Vegas
Rachel S. Shinnar
Local Address:3911 Cambridge Street #4 Las Vegas, NV 89119
Home Address:36 Ussishkin Street Tel -Aviv 62591 Israel
Degrees:Bachelors of Arts, French Literature & General Studies, 1996 Tel i^viv University, Israel
Publications:Shinnar, R. S. & Montgomery, R. J. “The Impact of Change on the Hong Kong Convention and Exposition Business” in Visions in Leisure and Business. Vol. 16(4).
Thesis Title: The relationship Between Employee Satisfaction and Organizational Commitment.
Thesis Examination Committee:Chairperson, Dr. Gail Sammons, Ph.D.Committee Member, Dr. Gerald GoU, D B A.Committee Member, Dr. John Stefanelli, Ph.D.Graduite Faculty Representative, Dr. Anthony Townsend, Ph.D.
114
Reproduced with permission of the copyright owner. Further reproduction prohibited without permission.

I MAG E EVALUAT! 0 N TEST TARGET (Q A -3 )
A
A
%
1.0
i.i
H i12J ,«2.2
Ü L6I :
1.25 1.4
2.0
1.8
1.6
150mm
/1 P P L IE D A IN/U4GE . Inc1 6 5 3 E a s t M ain s t r e e t R o c h e s te r . NY 1 4 6 0 9 U SA P h o n e : 7 1 6 /4 8 2 -0 3 0 0
- = ~ - = F a te 7 1 6 /2 8 8 -5 9 8 9
0 1993. Applied Image. Inc.. All Rights Reaeived
Reproduced with permission of the copyright owner. Further reproduction prohibited without permission.