the relationship between esg & socially responsible...
TRANSCRIPT

THE RELATIONSHIP BETWEEN ESG & SOCIALLY RESPONSIBLE
INVESTING AND ALPHA GENERATION IN THE LONG-RUN
by
YuXuan (David) Jiang
BMgt in Business Economics, University of Alberta, 2016
and
ChenTao (Tony) Zhu
BA in Economics, Simon Fraser University (SFU), 2018
PROJECT SUBMITTED IN PARTIAL FULFILLMENT OF
THE REQUIREMENTS FOR THE DEGREE OF
MASTER OF SCIENCE IN FINANCE
In the Master of Science in Finance Program
of the
Faculty
of
Business Administration
© YuXuan Jiang and ChenTao Zhu 2019
SIMON FRASER UNIVERSITY
Fall 2019
All rights reserved. However, in accordance with the Copyright Act of Canada, this work
may be reproduced, without authorization, under the conditions for Fair Dealing.
Therefore, limited reproduction of this work for the purposes of private study, research,
criticism, review and news reporting is likely to be in accordance with the law,
particularly if cited appropriately.
1
Approval
Name: YuXuan (David) Jiang, ChenTao (Tony) Zhu
Degree: Master of Science in Finance
Title of Project: THE RELATIONSHIP BETWEEN ESG &
SOCIALLY RESPONSIBLE INVESTING AND
ALPHA GENERATION IN THE LONG-RUN
Supervisory Committee:
___________________________________________
Title and Name Senior Supervisor
Correct Title – (i.e. Associate Professor)
___________________________________________
Title and Name
Second Reader
Correct Title
Date Approved: ___________________________________________
Note (Don’t forget to delete this note before printing): The Approval page must be only one page
long. This is because it MUST be page “ii”, while the Abstract page MUST begin on page “iii”. Finally,
don’t delete this page from your electronic document, if your department’s grad assistant is producing
the “real” approval page for signature. You need to keep the page in your document, so that the
“Approval” heading continues to appear in the Table of Contents.
2
Abstract
The number of ethical investments have increased dramatically over the past few
years due to the rising demands from investors. But do these investments really generate
alpha over the long run? This paper seeks to examine the relationship between long-term
alpha and investment vehicles with either an ESG or an SRI mandate. The analysis is
broken down by both geography and by different time periods. In terms of geography,
investments with either an ESG or SRI mandate are separately analyzed for both U.S. and
Canada; and in terms of times periods, this paper examines historical monthly returns from
both a longer time frame (12/31/2009 – 12/31/2018) and a medium time frame (12/31/2014
– 12/31/2018). The returns of the different investments are then benchmarked against the
overall market index from the country where these investments are located. The alpha of
these investments is calculated by using both the Capital Asset Pricing Model (CAPM) and
a modified Carhart Multifactor Model.
Our analysis indicates that there is no relationship between alpha and the socially
responsible or ESG funds. The majority of time, these funds actually underperform the
market. We present our findings that the ethical investments are less superior to a passive
market index in this paper.
Keywords: Mutual Funds; Socially Responsible Investing (SRI); Environmental, Social
& Governance (ESG); Alpha

3
Acknowledgements
First and foremost, we would like to express our sincere gratitude towards our
supervisor Dr. Christina Atanasova for her generous support and encouragement
throughout our research process. Her patience and insightful comments are greatly
appreciated. It has been an amazing and rewarding experience working with Dr. Christina
Atanasova.
Secondly, we would also like to thank Dr. Victor Song for providing us the
additional valuable advice and assistance in our research and writing process.
Finally, we would like to thank our families, friends and fellow classmates for their
encouragement and help during our research.

4
Table of Contents
Approval ..................................................................................................................................... 1
Abstract ...................................................................................................................................... 2
Acknowledgements ..................................................................................................................... 3
Table of Contents ........................................................................................................................ 4
Glossary ..................................................................................................................................... 5
1: Introduction .......................................................................................................................... 6
2: Literature Review ................................................................................................................. 9
3: Data and Methodology ........................................................................................................ 11
3.1 Data Selection Process...................................................................................................... 11
3.2 Data Analysis Process ...................................................................................................... 12
4: Empirical Findings .............................................................................................................. 15
4.1 Analysis of Indices ........................................................................................................... 15
4.2 Canadian SRI Mutual Funds and Alpha ............................................................................ 16
4.3 U.S. SRI Mutual Funds and Alpha .................................................................................... 17
4.4 Canadian ESG Mutual Funds and Alpha ........................................................................... 17
4.5 U.S. ESG Mutual Funds and Alpha................................................................................... 18
5: Conclusion ........................................................................................................................... 19
Appendix ................................................................................................................................. 21
Bibliography ............................................................................................................................ 49
5
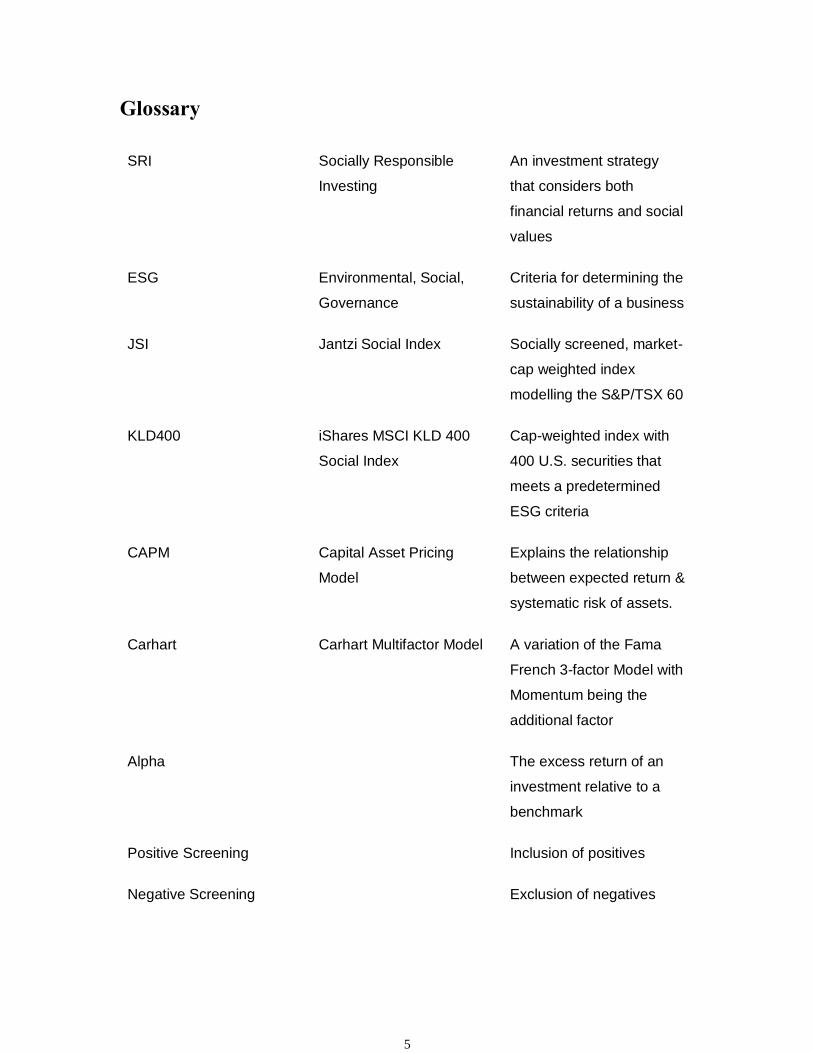
Glossary
SRI Socially Responsible
Investing
An investment strategy
that considers both
financial returns and social
values
ESG Environmental, Social,
Governance
Criteria for determining the
sustainability of a business
JSI Jantzi Social Index Socially screened, market-
cap weighted index
modelling the S&P/TSX 60
KLD400 iShares MSCI KLD 400
Social Index
Cap-weighted index with
400 U.S. securities that
meets a predetermined
ESG criteria
CAPM Capital Asset Pricing
Model
Explains the relationship
between expected return &
systematic risk of assets.
Carhart Carhart Multifactor Model A variation of the Fama
French 3-factor Model with
Momentum being the
additional factor
Alpha The excess return of an
investment relative to a
benchmark
Positive Screening Inclusion of positives
Negative Screening Exclusion of negatives

6
1: Introduction
Socially responsible investing (SRI), also known as ethical and sustainable
investing, refers to an active investment strategy seeks to combine financial results with
social values. Although still small, ethical investing has been a fast-growing segment in
the international finance market. Over the last 19 years, the total number of ethical mutual
funds is nearly doubled, especially for France, which has grown from 14 in 2000 to 232 in
2019, becoming the second most popular ethical investment countries next to United
States.
COMPARING THE ETHICAL MUTUAL FUND MARKETS
# OF ETHICAL MUTUAL FUNDS # OF SRI FUNDS
COUNTRY 2000 2019 2019 BELGIUM 26 46 26 FRANCE 14 232 122 GERMANY 22 72 28 ITALY 5 18 10 SWEDEN 42 75 59 SWITZERLAND 22 82 48 THE NETHERLANDS 11 45 13 UNITED KINGDOM 55 105 63 UNITED STATES 230 260 71
Overview of the ethical mutual fund market in 2019
Country # of Ethical Mutual Funds
# of SRI Mutual Funds
SRI as a % of Total Ethical Mutual Funds
Belgium 46 26 57%
France 232 122 53%
Germany 72 28 39%
Italy 18 10 56%
Sweden 75 59 79%
Switzerland 82 48 59%
The Netherlands 45 13 29%
United Kingdom 105 63 60%
United States 260 71 27%
7
It should be noted that SRI is not interchangeable with ESG investing, although the
latter is also plays an important role in finance. The idea of environmental, social and
governance (ESG) in asset management did not gain much attention until 2005, when the
United Nations hosted the “Who Cares Wins” Conference. While SRI Funds apply
exclusionary screenings to the securities based on specific ethical guidelines, ESG takes a
more positive approach in considering the opportunities and risks associated with
environmental, social and governance factors, and the potential economic values behind it.
This paper will evaluate the performance of the United States MSCI KLD 400
Social index with the benchmark S&P 500 Index, and the Canadian Jantzi Social Index
with the benchmark SPTSX Index. By imposing SRI and ESG screens on investments, this
paper creates 8 portfolios, which are Canadian 4/9 years SRI funds, United States 4/9 years
SRI funds, Canadian 4/9 years ESG funds, and United states 4/9 years ESG funds. All of
the 8 funds are equally weighted and screened using the Bloomberg Terminal. The results
are analyzed using both the single factor CAPM model for Jensen’s Alpha and Carhart’s
(1997) 4 factor model with the first three Fama-French factors and an extra factor to capture
momentum. The complex model can explain more in the fund returns, especially the style
of the fund in a particular period.
The aim of this study is the comparison of the main risk-return characteristics in
the long run of ethical investing by imposing different methods of screenings. The public
are consistently debating whether or not involving in positive screening in selecting stock
can adversely affect the return. There are two screen method, positive screen and negative
screen. Negative screen is excluding the non-ethical factors, and positive screen only
contains positive ethical factors in the fund. This paper is using positive screening method,
8
selecting two types of screening criteria, which is the SRI and ESG, thus the positive screen
can be measured directly and compared with different geography locations.
By examining both the Capital Asset Pricing Model (CAPM) as well as the Carhart
4-Factor (CFF) Model, we found that there is no significant relationship between alpha and
ESG or SRI funds, regardless of their country of domicile and the time periods. However,
style alpha did appear to be significant for both the JSI and KLD 400 indexes. For the JSI,
alpha is small and negative; and for KLD 400, alpha is large but still negative at -2.58%.
We also examine the Sharpe ratio of each of the mutual fund portfolios compared to the
benchmark. The Sharpe ratio for the 9-year S&P 500 is 0.84, where the 4-year is 0.54. For
Canada, the 9-year S&P/TSX has a Sharpe ratio of 0.39, and the 4-year has a Sharpe ratio
of 0.17. For our mutual fund portfolios, the 9-year U.S. ESG portfolio has a Sharpe ratio
of 0.66, and the 4-year portfolio has a Sharpe ratio of 0.48. For the U.S. SRI portfolios, the
9-year portfolio has a Sharpe ratio of 0.76, and the 4-year portfolio has a Sharpe ratio of
0.61, which actually outperformed the benchmark by 7 basis points. In the Canadian
context, the 9-year ESG portfolio has a Sharpe ratio of 0.50, which outperformed the
benchmark by 11 basis points, and the 4-year portfolio has a Sharpe ratio of 0.41, which
significantly outperformed the market by 24 basis points. The SRI portfolio also
outperformed the market when measured by the Sharpe ratio. The 9-year portfolio has a
Sharpe ratio of 0.61, which is 23 basis points higher than that of the market; and the 4-year
portfolio has a Sharpe ratio of 0.31, which is also higher than the benchmark by 14 basis
points.
9
2: Literature Review
Hamilton et al. (1993) suggests three hypotheses on the comparing risk-adjusted
return of SRI fund to the conventional fund. The first is that SRI does not add value or
destroy value since it’s not possible to correctly price corporate social responsibility.
Which is the closest to the traditional financial market framework, where factors are not
proxies for risks will not affect the return.
The second hypothesis is the social responsible fund underperform the conventional
fund, this implies contradiction to the first hypothesis as the market does price the risk for
SRI, the theory of SRI cost is also advanced to explain the underperformance of SRI, the
cost can be divided into two categories, the selection cost to select which stocks belongs to
the SRI fund, and the active management cost, and according to Markowitz’s (1952)
portfolio theory, the selection constraint will not lead to optimal maximization, thus the
SRI will underperform compare with conventional investment due to lack of diversification
benefit, Minor’s (2007) study on financial cost of SRI has mentioned other fundamental
economic principles such as the Supply and Demand theory related to underperformance
of SRI, which implies that the demand of unethical stock will be higher than the ethical
stock, thus increase the return, So the SRI fund that reject the unethical stock suffers lower
performance relative to the benchmark. Minor’s (2007) study has another view of
externalities to explain the lower return, the negative externality on the unethical stock will
only affect the SR investor but not to the conventional investor, thus the SR investor is
going to have a lower return.
The third hypothesis is the expected return of SRI will be higher than the
conventional portfolio, Hamilton mentioned investors tends to underestimate the impact of
10
negative information on non-SR companies. This is also explained by Bauer et al.
(2005,2006) the ‘learning effect’ of SRI, that the SRI will underperform in the short-term,
and closing the gap in the mid-term, then outperform the conventional portfolio in the long
run.
Several studies have given empirical evidence on all three alternative hypotheses
by evaluating the performance on the expected return of SRI, Blanchett (2010) and Bauer
et al. (2007) has found evidence supporting on the first hypothesis that using both single
factor model and Carhart multi factor model include momentum factor has no significant
performance difference between SRI and conventional mutual fund. While Brzeszczynski
(2014) exams the SRI fund returns and British FTSE100 index return and found
significance outperform in all his three comparisons. And yet Bauer et al. (2005) found
negative performance in Germany and US SRI fund. However, such studies are based on
different methodology, dates, filters and geography locations. These factors may explain
the contradicting results, so further studies will need to conduct to justify whether or not
SRI will provide extra value to the traditional investing.
Previous literatures have also improved in performance valuation. Hamilton et al.
(1993) and Statman (2000) is using Jensen’s Alpha, Sharp ratio and Treynor ratio to
compare the risk-adjusted performance between SRI mutual fund to both U.S. S&P 500
index and KLD 400 Social Index. And Bauer et al. (2005) build upon on the Carhart (1997)
four-factor model on performance valuation, which represents the current standard
methodology on mutual fund performance. The first three factors are from Fama-French
(1993) three factor model, and the fourth factor captures momentum effect. More complex
finance performance model can be benefited to understand SR return effectively.
11
3: Data and Methodology
Based on prior literatures, we have decided to separately analyze the long-term
alpha generating abilities of funds with an ESG mandate and also funds with an SRI
mandate. We break down our analysis by countries, where we first compare two country-
specific SRI indices with their respective market benchmarks; we then separately pool
together all SRI and ESG mutual funds of each country, and examine the significance of
their long-term alpha individually.
3.1 Data Selection Process
The data used for analysis in this paper is based on two sources: the Data Library
of Kenneth R. French and Bloomberg. The frequency of the data used is monthly, this is
done to match the previously literatures studied. The datasets for chosen for both a long-
and a medium period of time, so that not only the entire economic cycles are included, but
any changes in the near-term market sentiments are also captured.
The types of investments considered include an index fund, an ETF, and mutual
funds. The index fund used is the Jantzi Social Index (JSI), which models the S&P/TSX
60 and consists of 50 Canadian companies that passes a set ESG criteria. The ETF used is
the MSCI KLD 400 Social Index, which uses both positive and negative screenings to
include U.S. companies with high MSCI ESG ratings and excludes companies with
negative ESG impacts, regardless of the sizes of their market capitalization. For the mutual
funds, we grouped all available mutual funds on Bloomberg with SRI and ESG mandates
into two funds, separated by their country of domiciles, and compared them with their
12
respective market indices. We also separated funds with an SRI mandate from funds with
an ESG mandate.
In terms of factors considered, we obtained all of our factors from the Data Library
of Kenneth R. French. For the Capital Asset Pricing Model (CAPM) and the Carhart 4-
Factor (CFF) model, the (Rm-Rf), SMB, HML, and WML are all North American Proxies,
meaning that they are applicable to use in the analysis of either U.S. or Canadian funds.
We break down our data samples by 4 categories. Geographical locations, the
investment types, the type of mandate and the time periods. For geographical locations, we
consider investments in both United States and Canada. For the type of investments, we
first examine an ESG index for each country, more specifically, the JSI of Canada and the
KLD 400 the U.S. We then select monthly returns of all mutual funds from each country
with SRI and ESG mandates. We separate the funds by their mandates. Finally, we analyze
these monthly returns in two separate time periods: a long-term and a medium-term.
The total returns of mutual funds and the market index of both countries are also
presented. This is done to examine the absolute percentage of alpha attained by these
mutual funds in any particular periods. The beginning returns for both mutual funds and
the market indices of either long- or medium-term periods will be set to zero, and the
performance over time will be analyzed.
3.2 Data Analysis Process
In this paper, two common asset pricing models are used in analysing the datasets.
In particular, the Capital Asset Pricing Model (CAPM) is used to calculate Jensen’s Alpha;
13
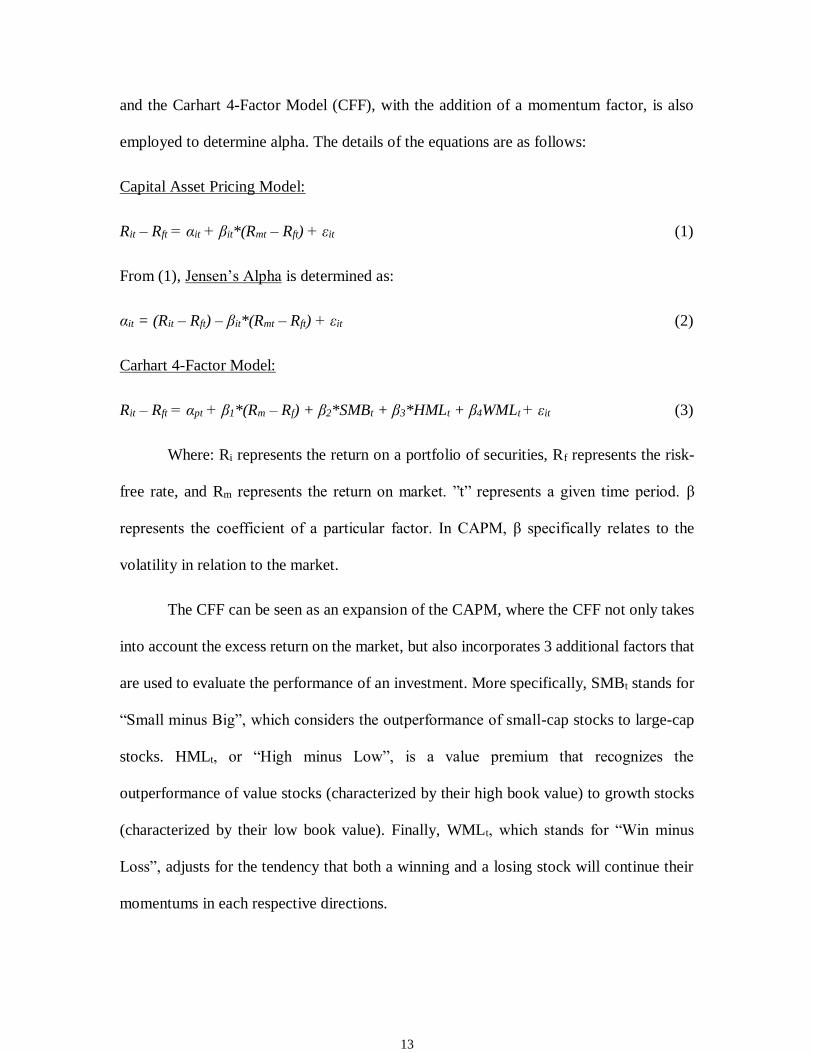
and the Carhart 4-Factor Model (CFF), with the addition of a momentum factor, is also
employed to determine alpha. The details of the equations are as follows:
Capital Asset Pricing Model:
Rit – Rft = αit + βit*(Rmt – Rft) + εit (1)
From (1), Jensen’s Alpha is determined as:
αit = (Rit – Rft) – βit*(Rmt – Rft) + εit (2)
Carhart 4-Factor Model:
Rit – Rft = αpt + β1*(Rm – Rf) + β2*SMBt + β3*HMLt + β4WMLt + εit (3)
Where: Ri represents the return on a portfolio of securities, Rf represents the risk-
free rate, and Rm represents the return on market. ”t” represents a given time period. β
represents the coefficient of a particular factor. In CAPM, β specifically relates to the
volatility in relation to the market.
The CFF can be seen as an expansion of the CAPM, where the CFF not only takes
into account the excess return on the market, but also incorporates 3 additional factors that
are used to evaluate the performance of an investment. More specifically, SMBt stands for
“Small minus Big”, which considers the outperformance of small-cap stocks to large-cap
stocks. HMLt, or “High minus Low”, is a value premium that recognizes the
outperformance of value stocks (characterized by their high book value) to growth stocks
(characterized by their low book value). Finally, WMLt, which stands for “Win minus
Loss”, adjusts for the tendency that both a winning and a losing stock will continue their
momentums in each respective directions.

14
The alpha for a given period, denoted by αit, is obtained by subtracting the returns
of the investment, net of the risk free return, and the returns predicted either by the market
(under CAPM), or by the factors used (under CFF). We also analyzed the total alphas
generated by the mutual funds over the market indices of their respective countries in
different periods of time.

15
4: Empirical Findings
We present our findings in the following five subsections. In the first section, we
examine the alphas of country-specific ESG Indices (JSI and KLD400) using both the
CAPM and the CFF. In the sections two to five, we analyze the alpha-generating abilities
of both SRI and ESG Mutual Funds for Canada and the U.S. using the CAPM and the CFF.
We will also compare these funds against the market indices in their respective countries
to see the changes in alpha over time.
4.1 Analysis of Indices
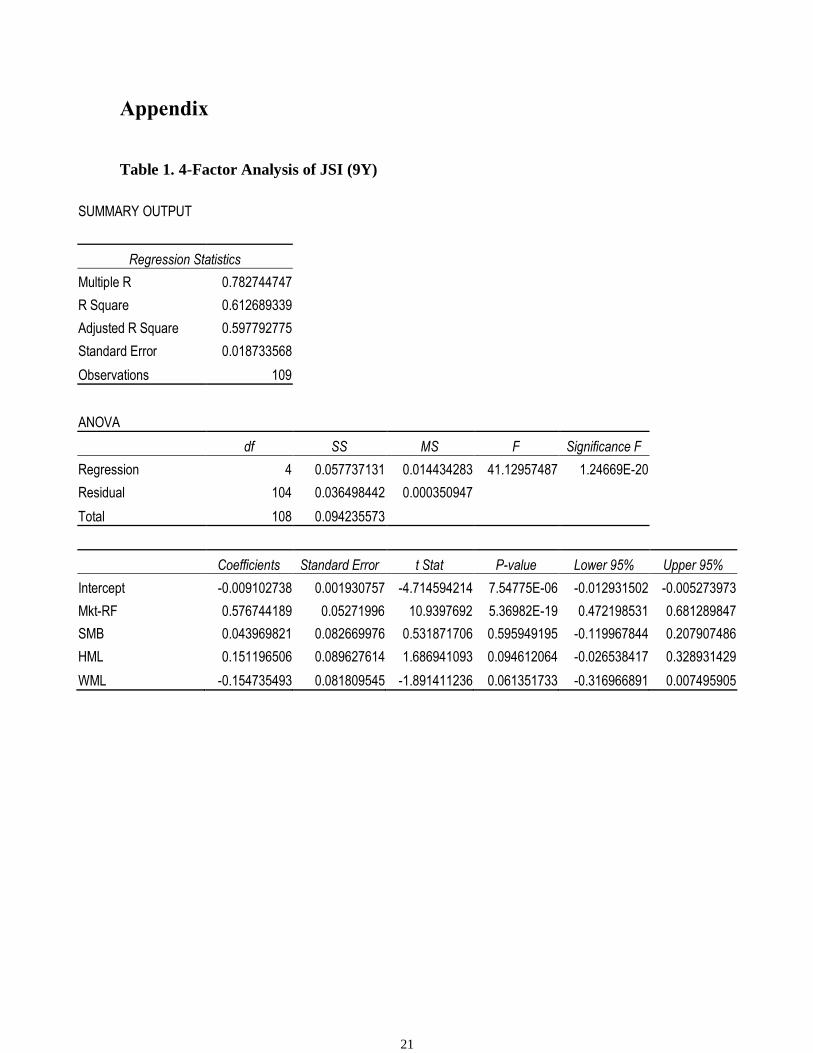
Looking at the regression results from Table 1, the relatively low adjusted R-square
indicates low explanatory power, since the CFF uses a North American proxy, with most
securities coming from the U.S., it might not fit the Canadian data as well. The negative
intercept entails a negative alpha of JSI when comparing to the SPTSX, however this alpha
is not significant. In addition, besides the factor on market returns, all other 3 Carhart
factors are not significant, showing that most of JSI’s return os explained by the market.
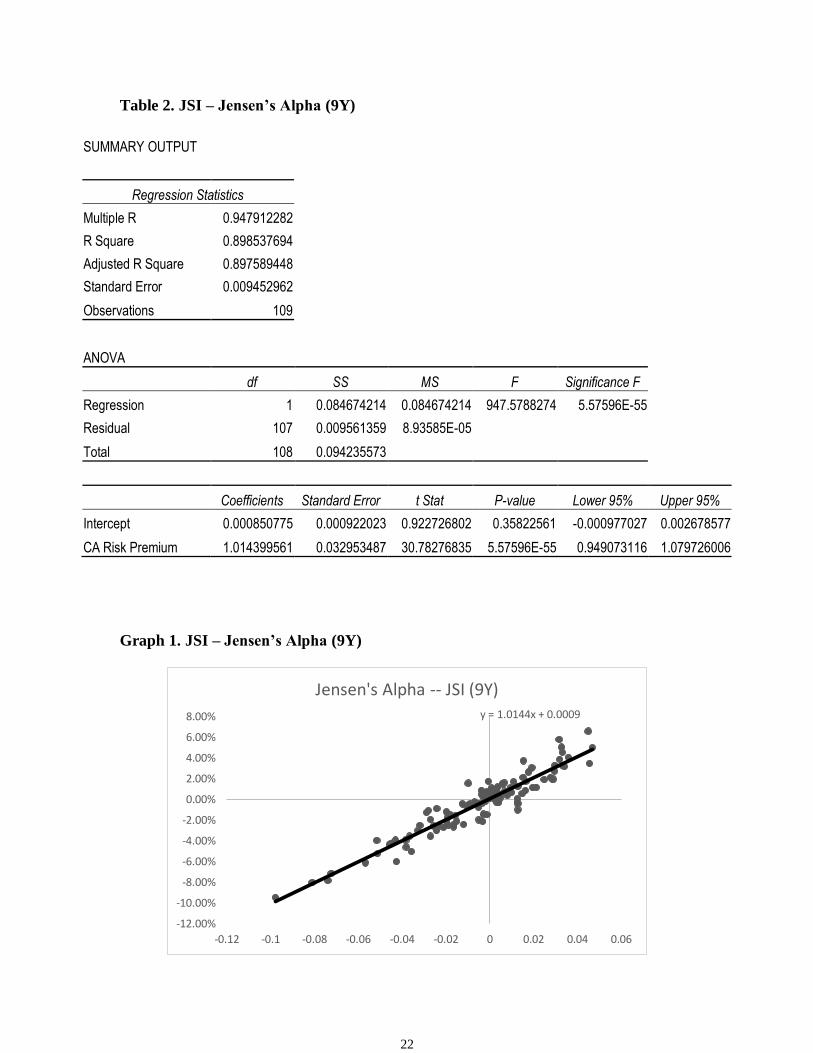
When examining the regression for Jensen’s Alpha of JSI in Table 2, the high R-
square of 0.898 indicates a significant explanatory power, the regression results indicates
that the JSI is slightly risky than the SPTSX by having beta equals to 1.014. The intercept
which represent alpha is only 0.08%, and it is again not significant.
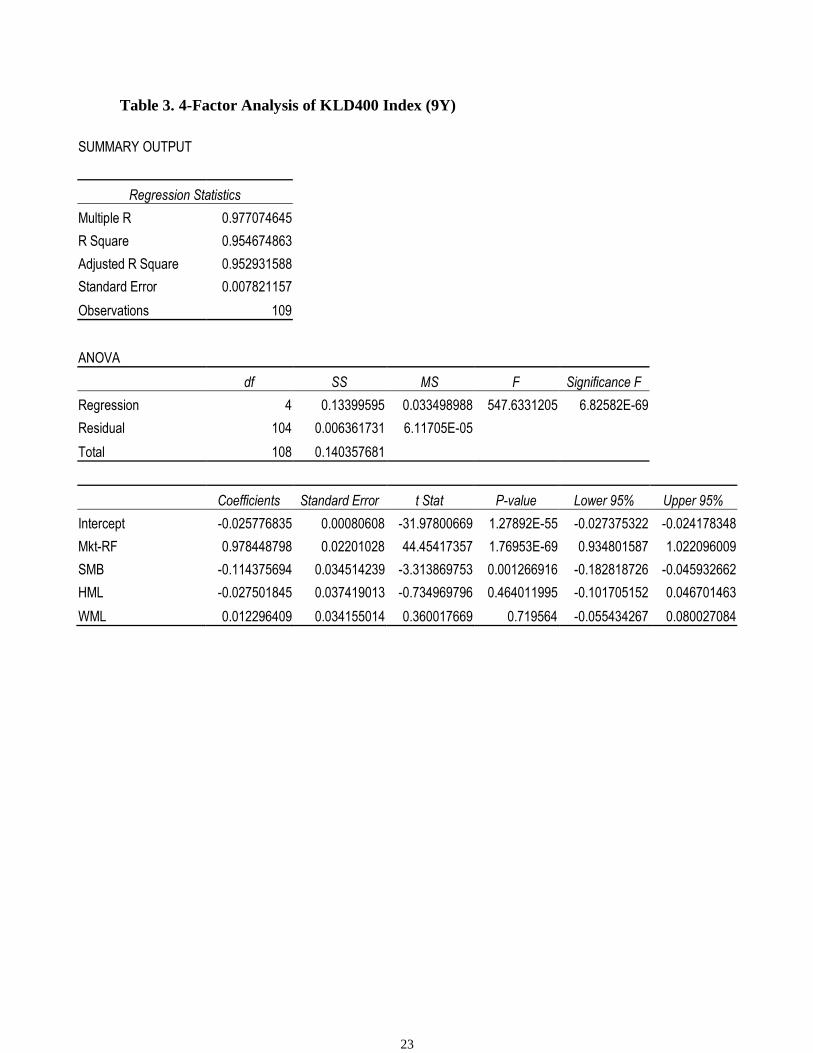
The explanatory power of CFF is superior in the KLD 400 Index, it is surprising to
find that the KLD400 has significantly underperformed the S&P 500 by 2.5%. The
significance in the negative SMB factor also indicates that the KLD400 contains more
large-cap companies.
16
The single-factor model in estimating Jensen’s Alpha for KLD 400 has superior
explanatory power than the CFF. However, the alpha is almost zero and insignificant
compares to the previous model.
4.2 Canadian SRI Mutual Funds and Alpha
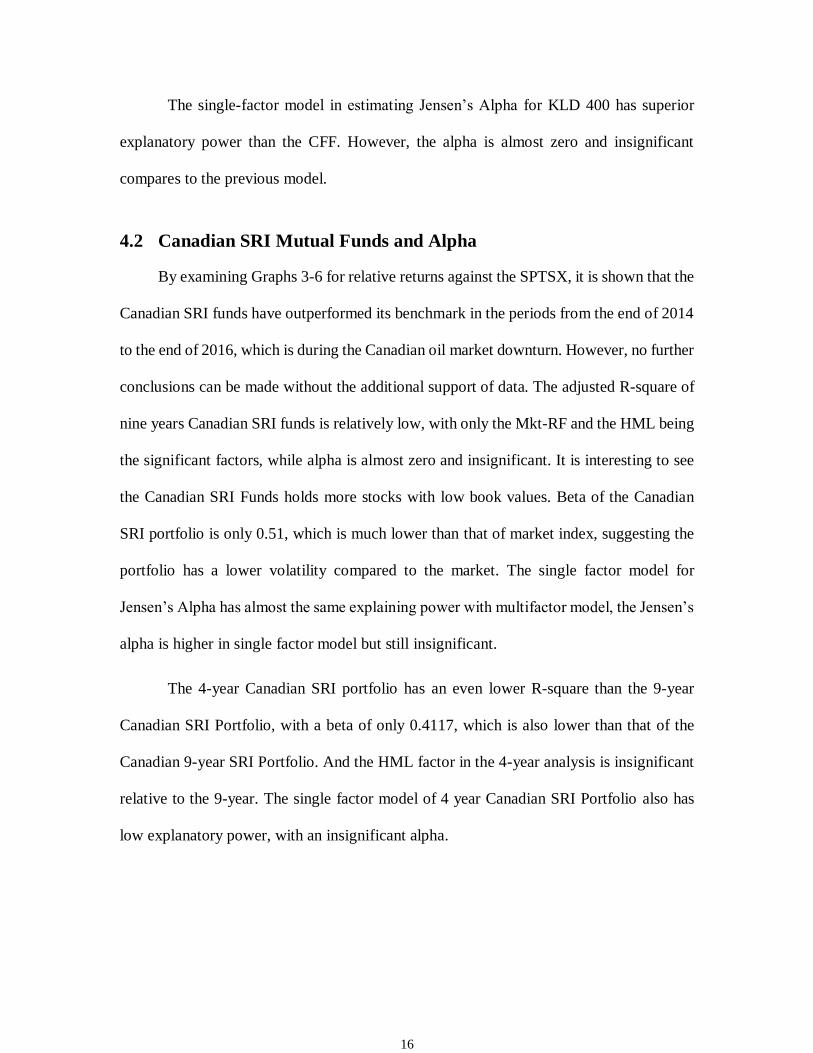
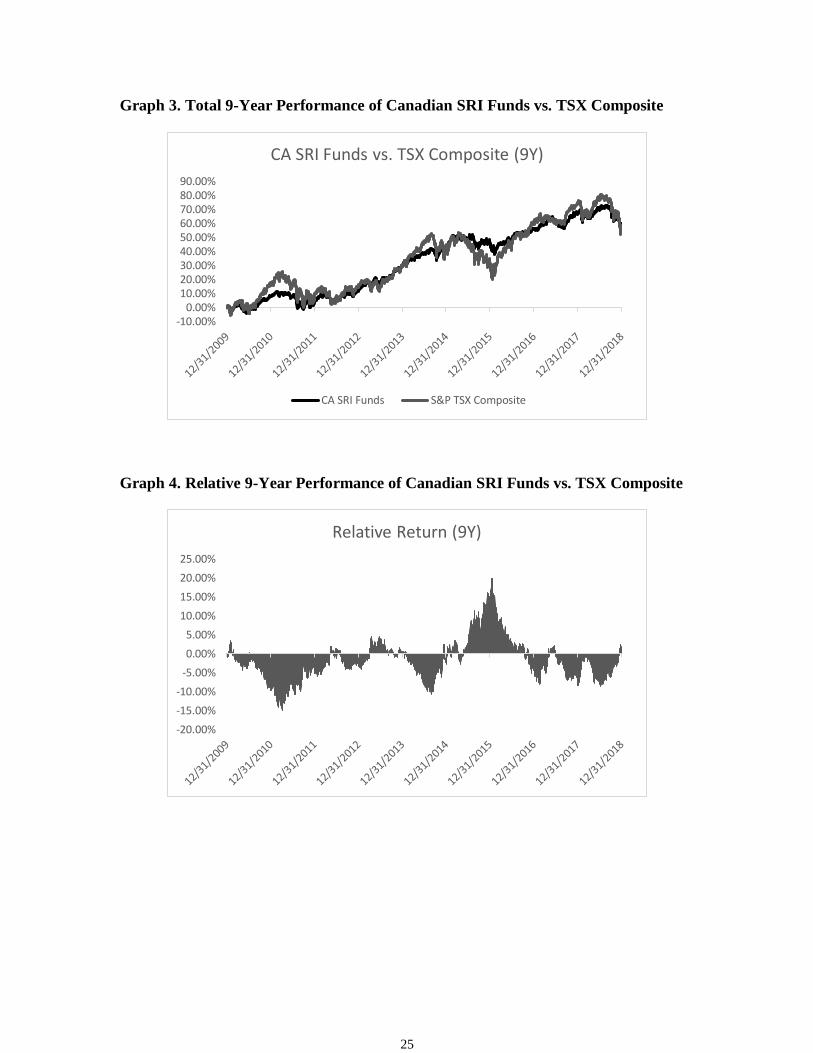
By examining Graphs 3-6 for relative returns against the SPTSX, it is shown that the
Canadian SRI funds have outperformed its benchmark in the periods from the end of 2014
to the end of 2016, which is during the Canadian oil market downturn. However, no further
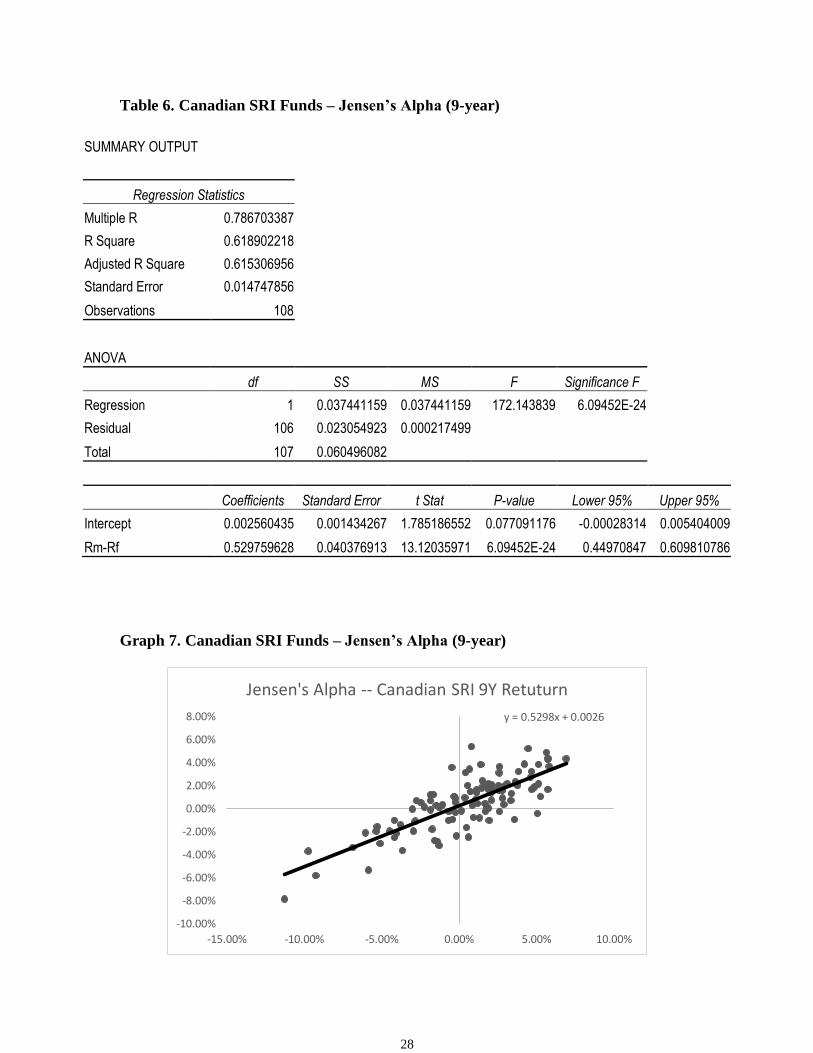
conclusions can be made without the additional support of data. The adjusted R-square of
nine years Canadian SRI funds is relatively low, with only the Mkt-RF and the HML being
the significant factors, while alpha is almost zero and insignificant. It is interesting to see
the Canadian SRI Funds holds more stocks with low book values. Beta of the Canadian
SRI portfolio is only 0.51, which is much lower than that of market index, suggesting the
portfolio has a lower volatility compared to the market. The single factor model for
Jensen’s Alpha has almost the same explaining power with multifactor model, the Jensen’s
alpha is higher in single factor model but still insignificant.
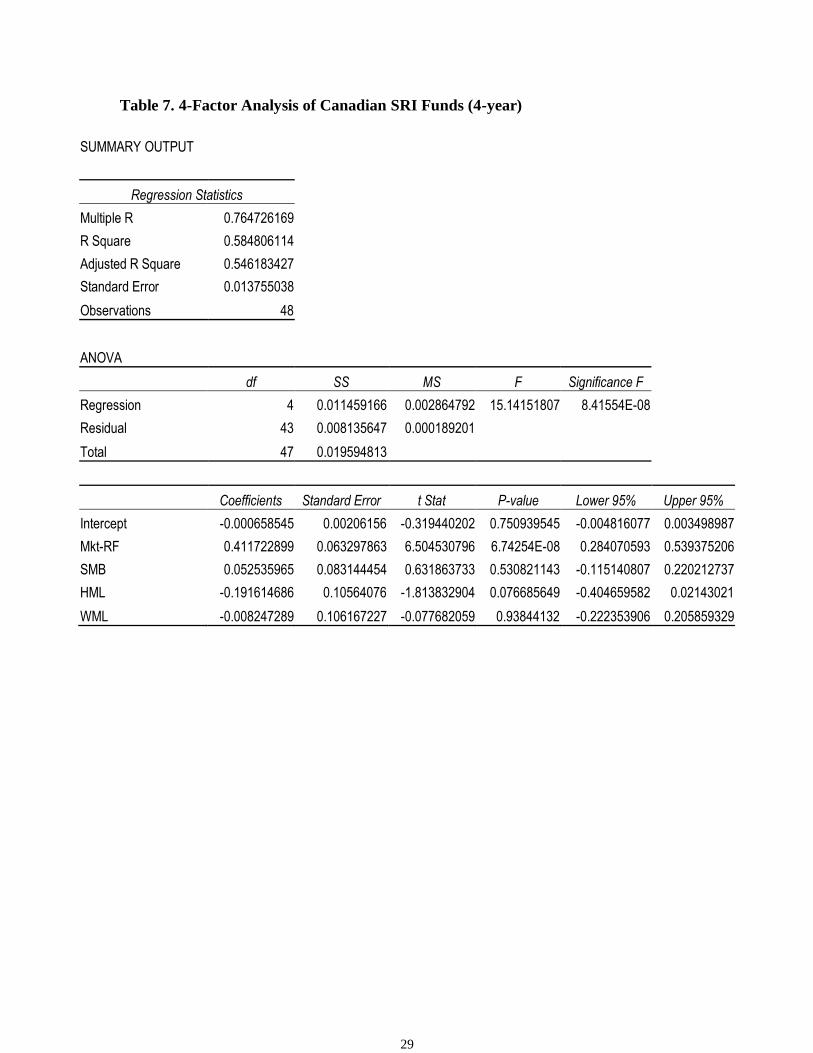
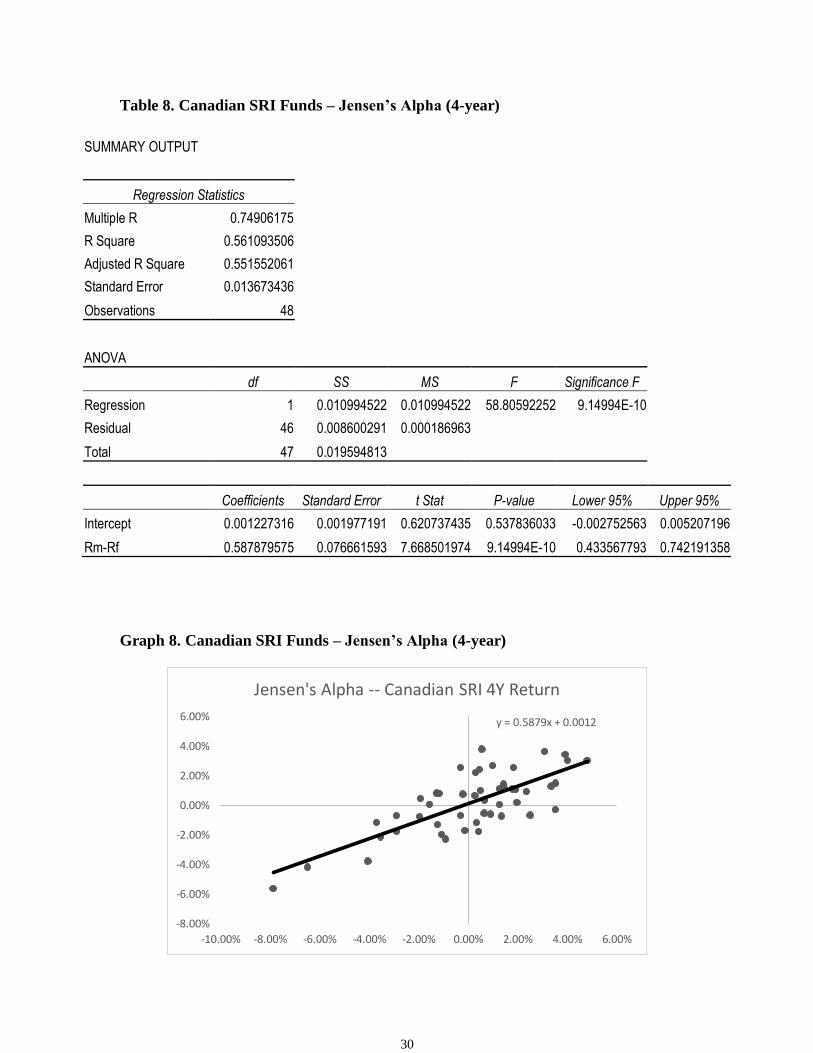
The 4-year Canadian SRI portfolio has an even lower R-square than the 9-year
Canadian SRI Portfolio, with a beta of only 0.4117, which is also lower than that of the
Canadian 9-year SRI Portfolio. And the HML factor in the 4-year analysis is insignificant
relative to the 9-year. The single factor model of 4 year Canadian SRI Portfolio also has
low explanatory power, with an insignificant alpha.
17
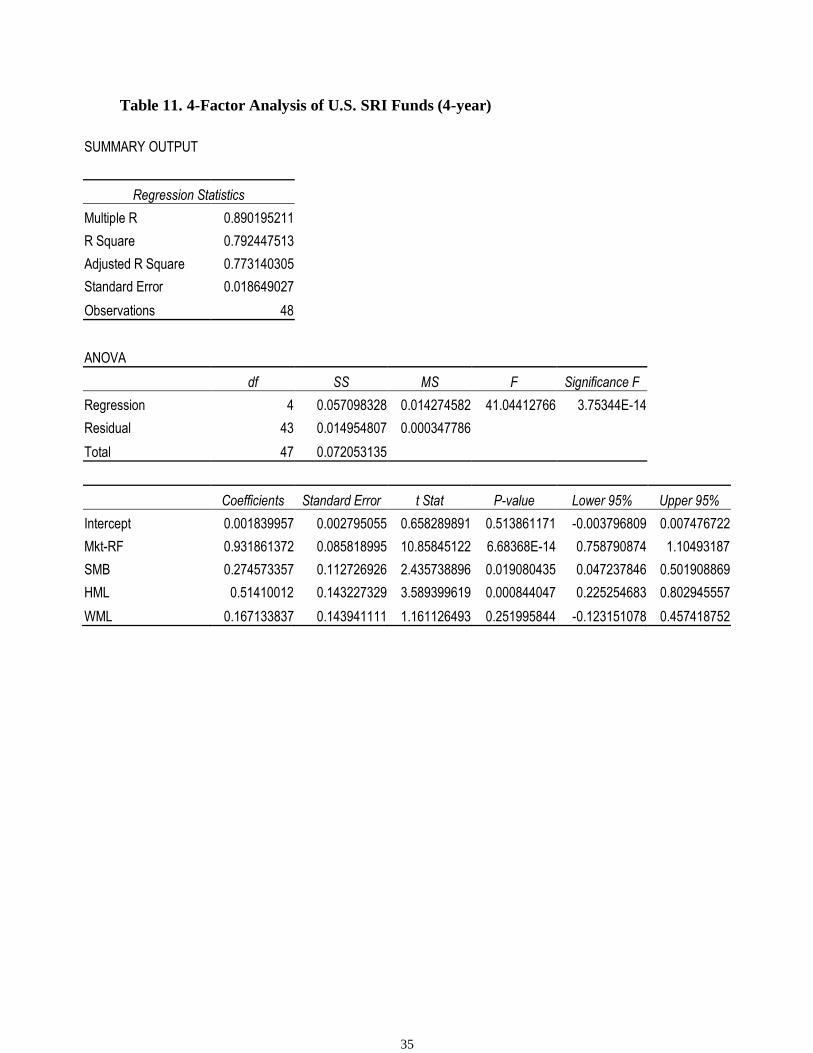
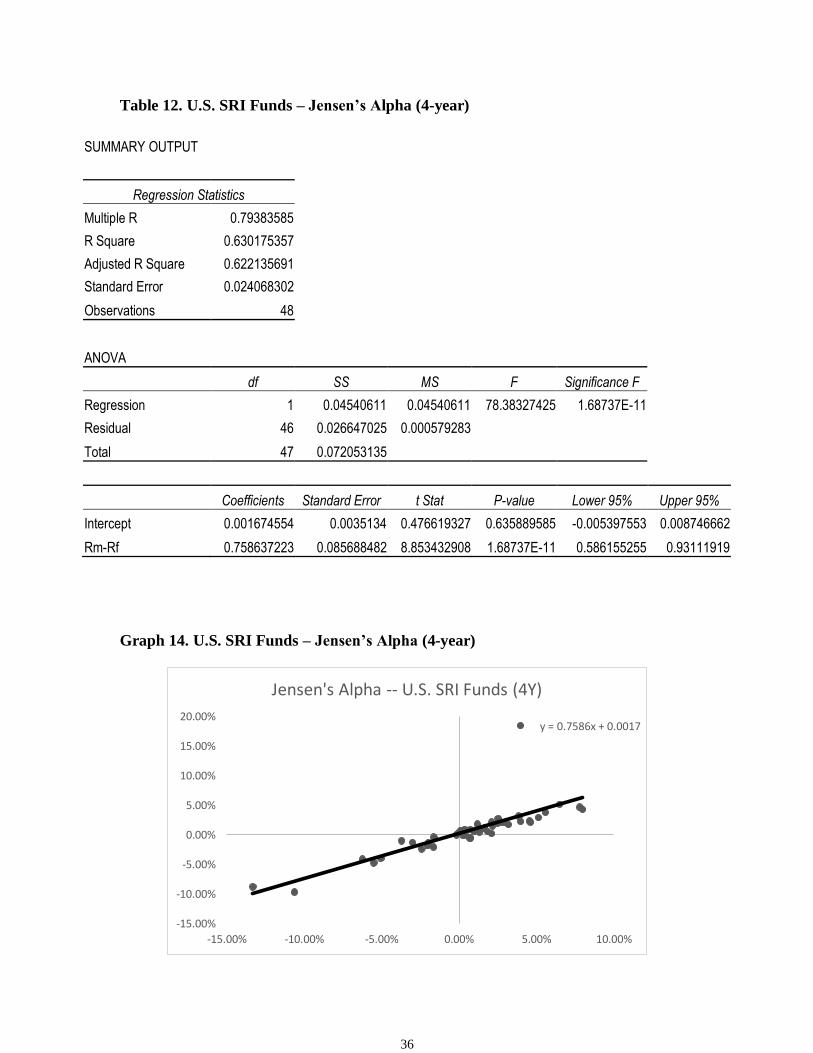
4.3 U.S. SRI Mutual Funds and Alpha
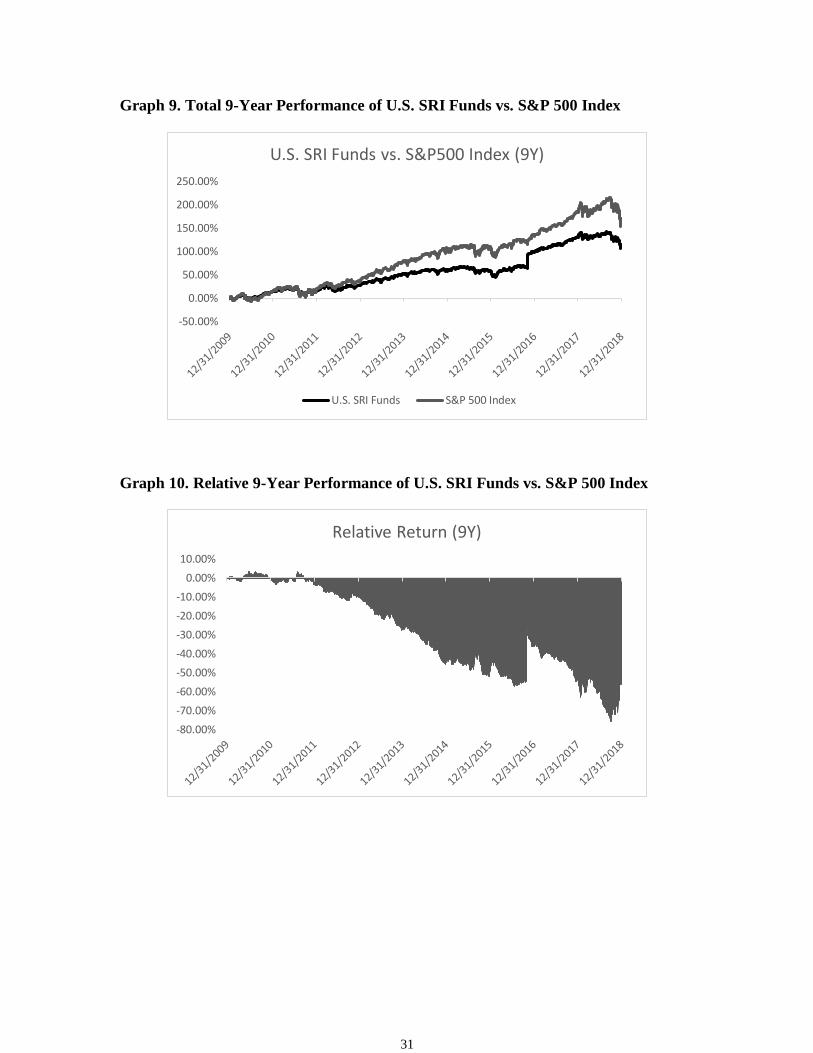
The SRI Funds of U.S. has been underperforming its benchmark since the recovery
of the financial crisis. The explanatory power of the CFF for the 9-year U.S SRI Portfolio
is higher than that of the CFF for the Canadian 9-year portfolio. The U.S. SRI Funds has a
0.17% alpha but still shows no significant at the 95% level. In contrast to its Canadian
counterpart, the Mkt-Rf for the U.S. Portfolio is 1.013, which is larger than the market
index, and the significant SMB factor indicates that the portfolio is holding more small-
cap stocks which have been outperforming the market. The beta in the single factor model
is lower than the CFF’s, at 0.635.
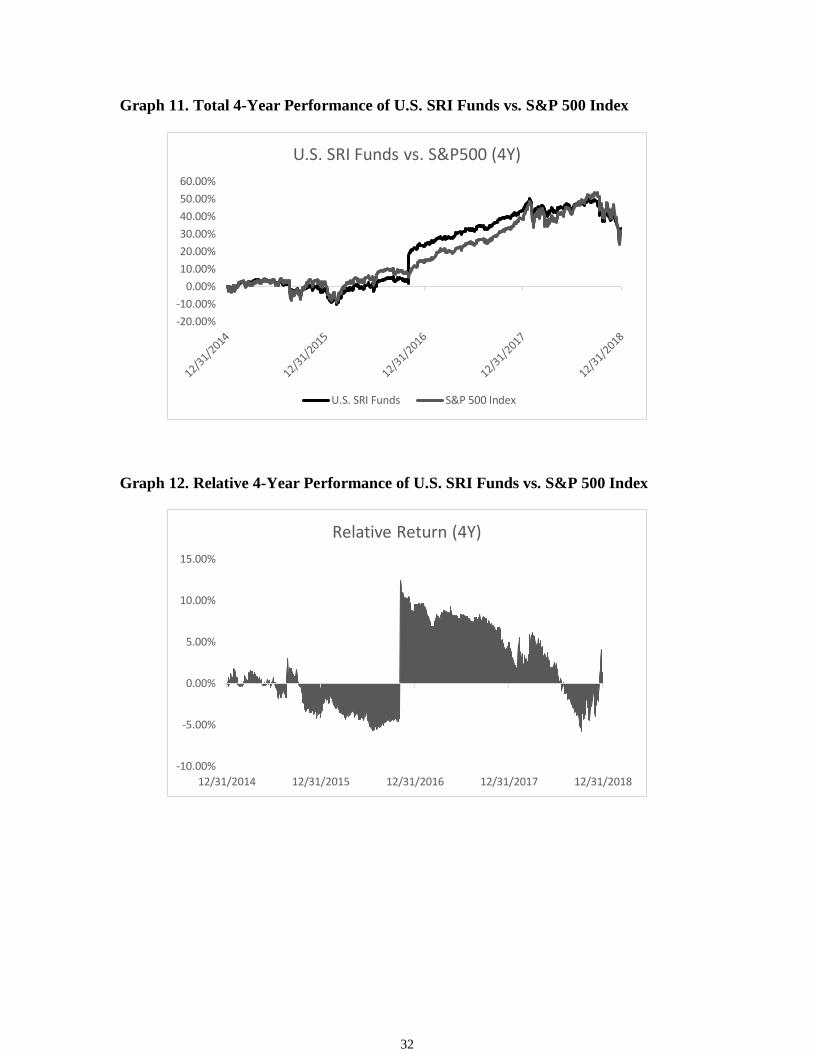
The 4-year U.S SRI Portfolio has higher R-square than the 9-year, with an
insignificant alpha. However, it has a lower beta than the 9-years Portfolio, with both SMB
and HML significant. The 4-year single factor model used to calculate Jensen’s Alpha has
a lower explanatory power than the CFF, as evident by the adjusted R-square of 0.622.
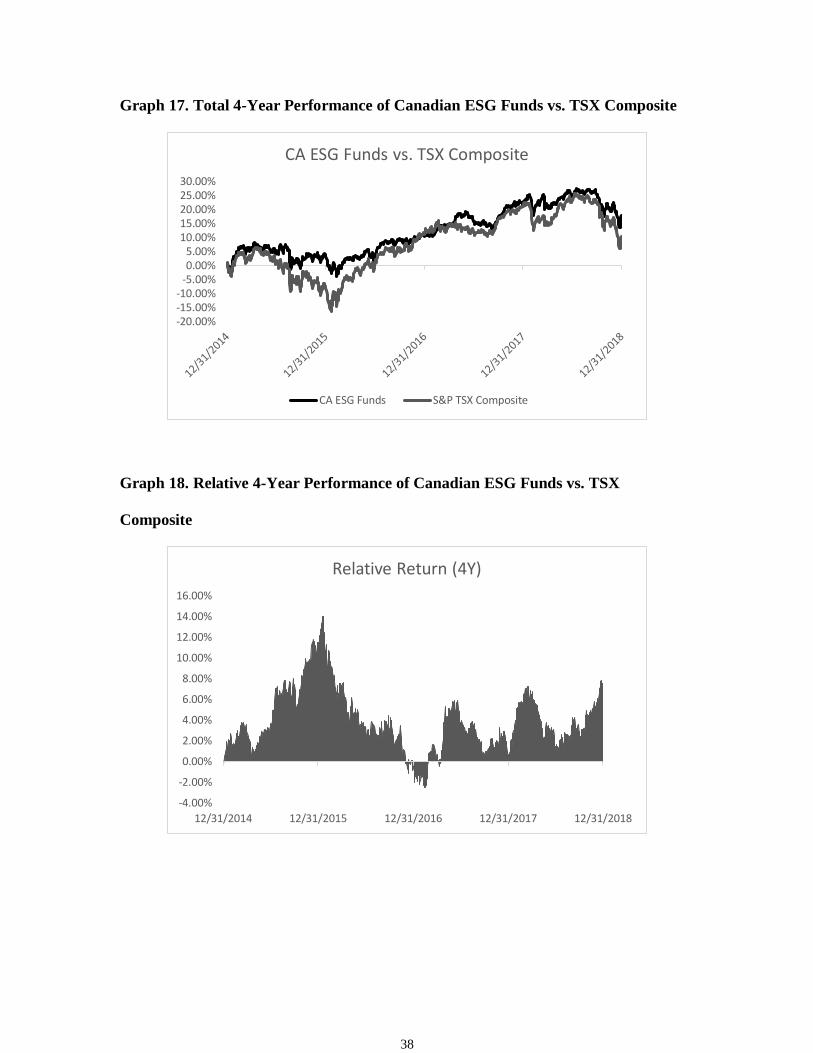
4.4 Canadian ESG Mutual Funds and Alpha
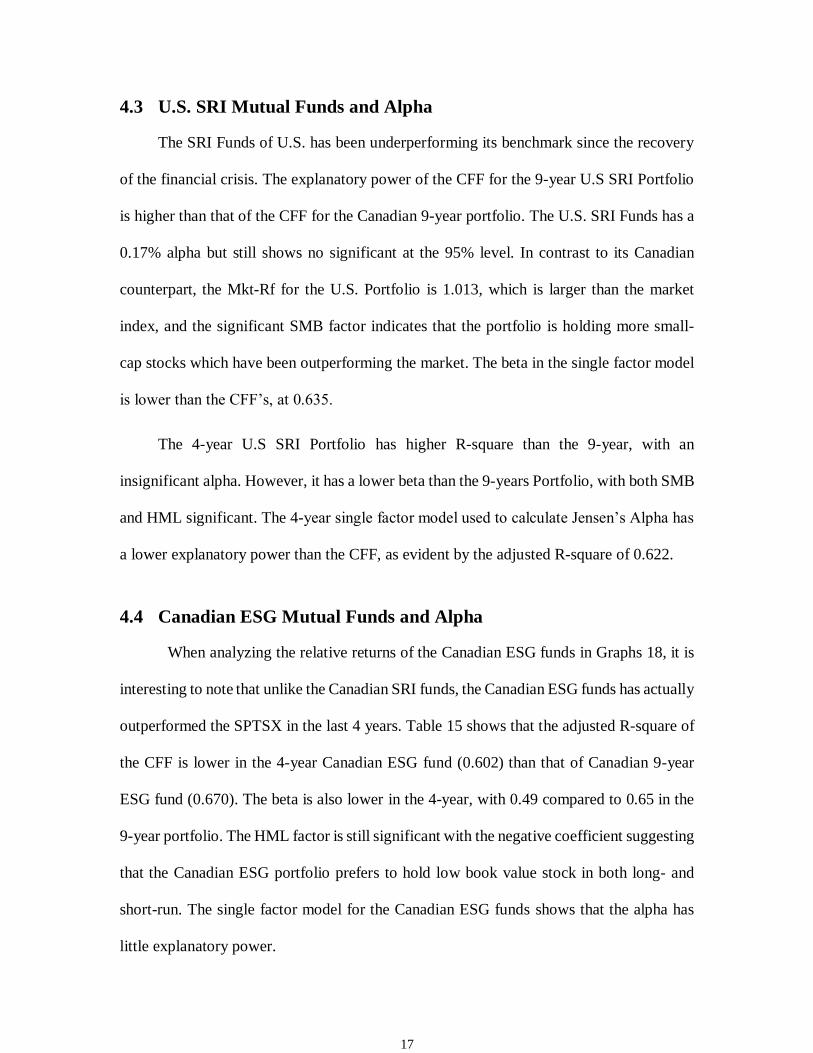
When analyzing the relative returns of the Canadian ESG funds in Graphs 18, it is
interesting to note that unlike the Canadian SRI funds, the Canadian ESG funds has actually
outperformed the SPTSX in the last 4 years. Table 15 shows that the adjusted R-square of
the CFF is lower in the 4-year Canadian ESG fund (0.602) than that of Canadian 9-year
ESG fund (0.670). The beta is also lower in the 4-year, with 0.49 compared to 0.65 in the
9-year portfolio. The HML factor is still significant with the negative coefficient suggesting
that the Canadian ESG portfolio prefers to hold low book value stock in both long- and
short-run. The single factor model for the Canadian ESG funds shows that the alpha has
little explanatory power.
18
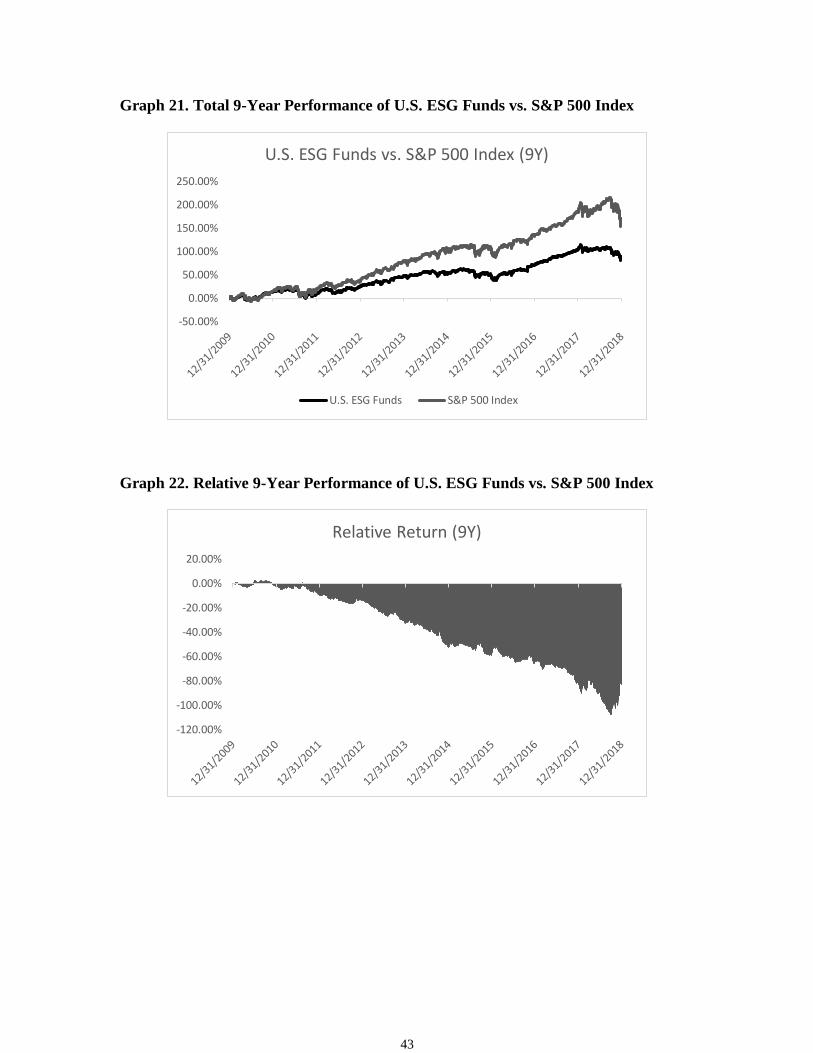
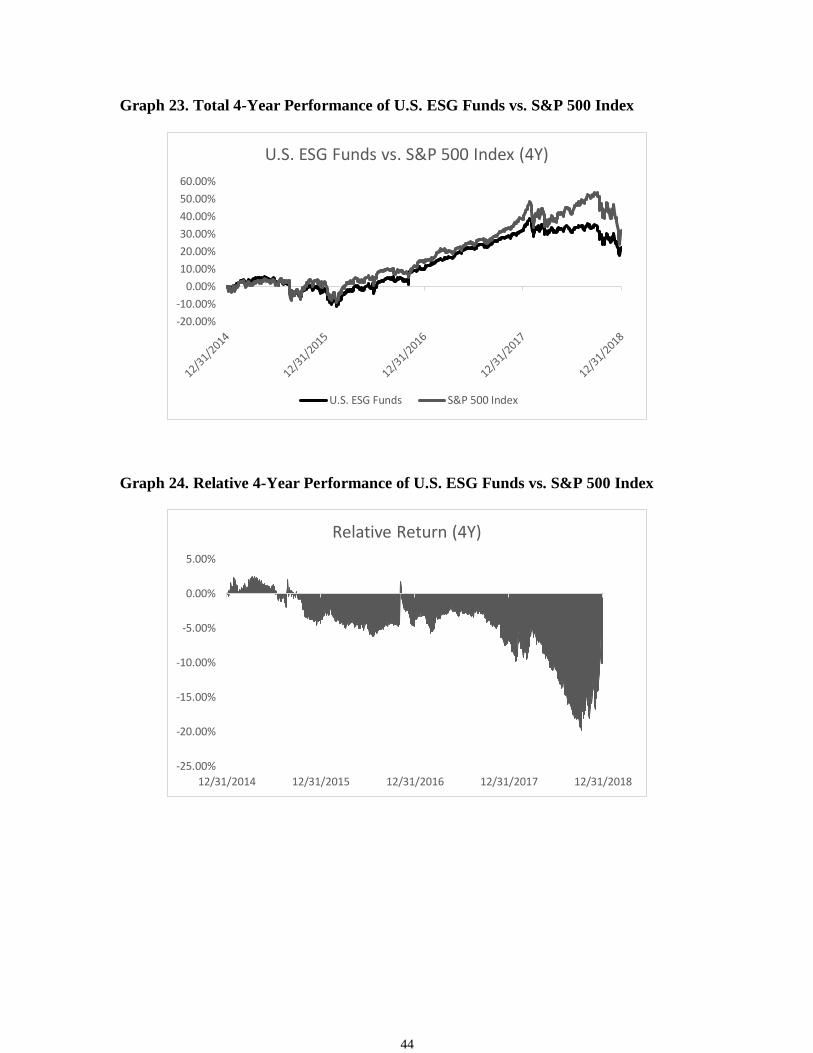
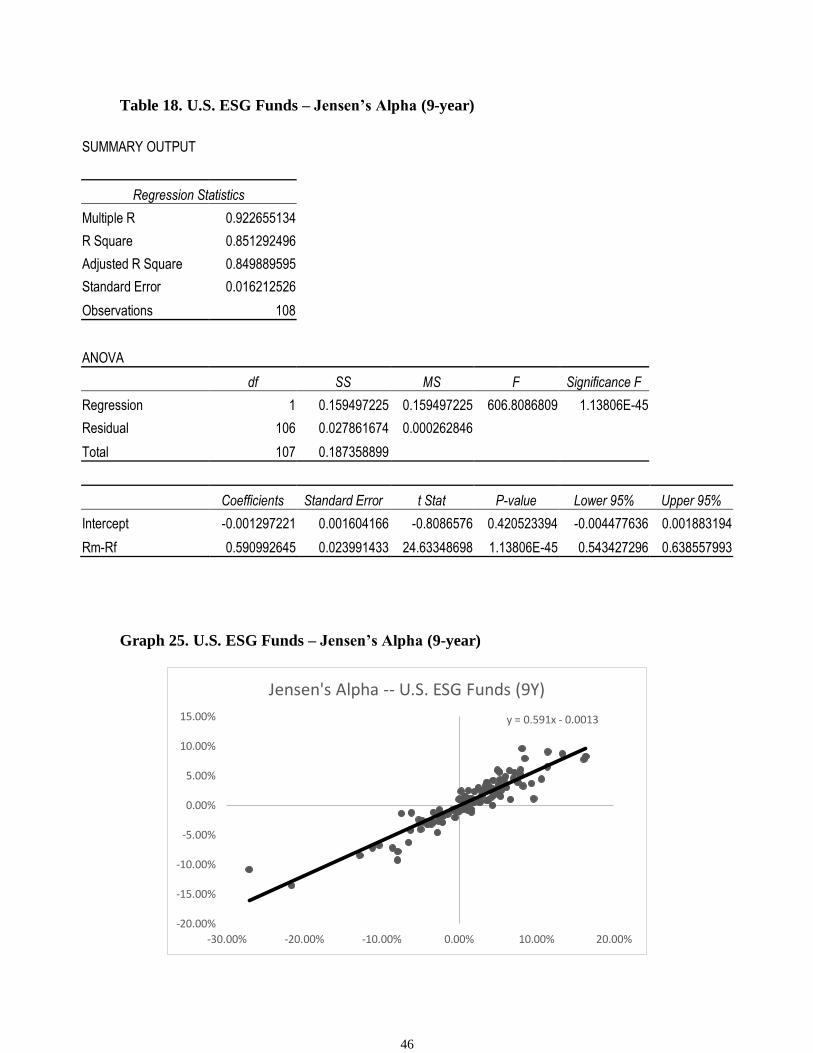
4.5 U.S. ESG Mutual Funds and Alpha
From Table 17, it is shown that the U.S ESG portfolio has an adjusted R-square of
0.88, which is higher than both the U.S SRI portfolio (0.72) and the Canadian ESG
portfolio (0.602). The beta of the 9-year U.S. ESG fund is slightly higher than the market
(1.053), with the momentum factor being negatively significant, indicating that the U.S.
ESG fund tends to hold on to more losers in the 9-year period. In the single factor model,
the beta of the fund is relatively smaller (0.59) than the beta calculated in the multifactor
model (1.05).
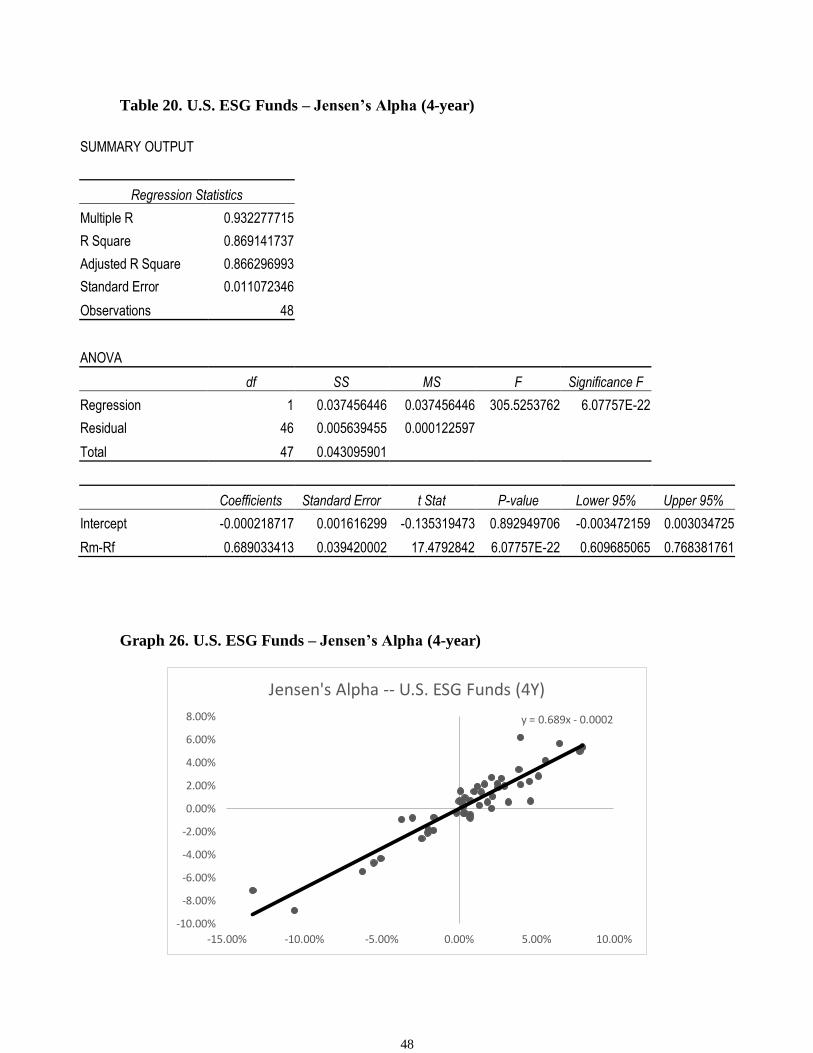
The 4-year ESG fund has almost the same adjusted R-square compared to the 9-
year U.S. ESG portfolio. The 4-year portfolio also has a lower beta (0.823) compared to
the beta (1.05) in 9-year portfolio. WML is no longer significant in the 4-year portfolio.
Jensen’s alpha is still not significant in the 4-year fund, as shown in Table 20.
19
5: Conclusion
Using a wide range of statistical models, we first compared the risk-adjusted
performance of Social indices of Canada and the United States with their benchmarks, we
also compare the risk-adjusted performance from different periods, with different
screenings of the Canadian and United States ethical mutual funds relative to their
conventional portfolio. While most previous work on ethical mutual fund performance has
limited its attention to single-factor benchmark models and only using Fama French 3-
factor model, we utilize the single factor CAPM model as well as the Carhart 4-factor
performance evaluation models. The multifactor specifications has greater explaining
power which not only improves performance measurement, but also conduct the ethical
mutual fund investment styles analysis in greater detail.
Firstly, our results in Single-Factor model showed no significant performance
between each ethical and conventional portfolio. However, after controlling for the style
factor in the multi-factor model, we found only the U.S. 9 years KLD 400 Social Index has
underperform the market by almost 2.57%, and it is statistically significant at 95%. In this
case, an investment in SRI equity indices does impose additional cost in terms of lower
returns for the investors. We also found the Small minus Big factor in the multifactor model
is significant, indicating the KLD 400 Social Index are holding too much small cap stocks
which significantly underperform during this market period. Unfortunately, our result in
the study does not show the ‘catch-up’ effect Bauer et al. (2005) mentioned that the SRI
indices will underperform in the short-term then catch up in the mid-term.
Secondly, another interesting empirical fact we found is that the Canadian SRI fund
consistently have lower beta than the U.S. SRI fund. The U.S. SRI fund is closer to the
20
benchmark with similar beta equaling almost 1, while the Canadian SRI fund has lower
systematic risk in both mid-term and long-term period compares to the benchmark. The
style analysis has explained the different styles between the Canadian and U.S. 9-years SRI
fund, the Canadian SRI fund invests in high book value, while the U.S. SRI fund has more
tilted towards small cap stocks. For the 4-year period, the U.S. SRI fund has both
significance in SMB and HML factor, while the mid-term Canadian SRI fund show no
particular style in its holdings.
Finally, for the other screening method, the ESG fund has neither underperformed
nor outperformed in both single- and multi-factor model. Similar to the Canadian SRI fund,
the Canadian ESG fund also has a low systematic risk with only around half the volatility
as that of the market. The styles in the Canadian ESG fund is similar to that of Canadian
SRI fund, in which both funds are holding more high book value stocks. While U.S. ESG
fund is holding more losing stocks during the 9 years horizon.
21
Appendix
Table 1. 4-Factor Analysis of JSI (9Y)
SUMMARY OUTPUT
Regression Statistics
Multiple R 0.782744747
R Square 0.612689339
Adjusted R Square 0.597792775
Standard Error 0.018733568
Observations 109
ANOVA
df SS MS F Significance F
Regression 4 0.057737131 0.014434283 41.12957487 1.24669E-20
Residual 104 0.036498442 0.000350947
Total 108 0.094235573
Coefficients Standard Error t Stat P-value Lower 95% Upper 95%
Intercept -0.009102738 0.001930757 -4.714594214 7.54775E-06 -0.012931502 -0.005273973
Mkt-RF 0.576744189 0.05271996 10.9397692 5.36982E-19 0.472198531 0.681289847
SMB 0.043969821 0.082669976 0.531871706 0.595949195 -0.119967844 0.207907486
HML 0.151196506 0.089627614 1.686941093 0.094612064 -0.026538417 0.328931429
WML -0.154735493 0.081809545 -1.891411236 0.061351733 -0.316966891 0.007495905
22
Table 2. JSI – Jensen’s Alpha (9Y)
SUMMARY OUTPUT
Regression Statistics
Multiple R 0.947912282
R Square 0.898537694
Adjusted R Square 0.897589448
Standard Error 0.009452962
Observations 109
ANOVA
df SS MS F Significance F
Regression 1 0.084674214 0.084674214 947.5788274 5.57596E-55
Residual 107 0.009561359 8.93585E-05
Total 108 0.094235573
Coefficients Standard Error t Stat P-value Lower 95% Upper 95%
Intercept 0.000850775 0.000922023 0.922726802 0.35822561 -0.000977027 0.002678577
CA Risk Premium 1.014399561 0.032953487 30.78276835 5.57596E-55 0.949073116 1.079726006
Graph 1. JSI – Jensen’s Alpha (9Y)
y = 1.0144x + 0.0009
-12.00%
-10.00%
-8.00%
-6.00%
-4.00%
-2.00%
0.00%
2.00%
4.00%
6.00%
8.00%
-0.12 -0.1 -0.08 -0.06 -0.04 -0.02 0 0.02 0.04 0.06
Jensen's Alpha -- JSI (9Y)
23
Table 3. 4-Factor Analysis of KLD400 Index (9Y)
SUMMARY OUTPUT
Regression Statistics
Multiple R 0.977074645
R Square 0.954674863
Adjusted R Square 0.952931588
Standard Error 0.007821157
Observations 109
ANOVA
df SS MS F Significance F
Regression 4 0.13399595 0.033498988 547.6331205 6.82582E-69
Residual 104 0.006361731 6.11705E-05
Total 108 0.140357681
Coefficients Standard Error t Stat P-value Lower 95% Upper 95%
Intercept -0.025776835 0.00080608 -31.97800669 1.27892E-55 -0.027375322 -0.024178348
Mkt-RF 0.978448798 0.02201028 44.45417357 1.76953E-69 0.934801587 1.022096009
SMB -0.114375694 0.034514239 -3.313869753 0.001266916 -0.182818726 -0.045932662
HML -0.027501845 0.037419013 -0.734969796 0.464011995 -0.101705152 0.046701463
WML 0.012296409 0.034155014 0.360017669 0.719564 -0.055434267 0.080027084

24
Table 4. KLD400 Index – Jensen’s Alpha (9Y)
SUMMARY OUTPUT
Regression Statistics
Multiple R 0.989789281
R Square 0.97968282
Adjusted R Square 0.97949294
Standard Error 0.005162474
Observations 109
ANOVA
df SS MS F Significance F
Regression 1 0.137506009 0.137506009 5159.478937 2.29774E-92
Residual 107 0.002851672 2.66511E-05
Total 108 0.140357681
Coefficients Standard Error t Stat P-value Lower 95% Upper 95%
Intercept -0.000349171 0.000540553 -0.645952287 0.51969321 -0.001420754 0.000722411
U.S. Risk Premium 0.990806304 0.013793861 71.829513 2.29774E-92 0.963461584 1.018151025
Graph 2. KLD400 Index – Jensen’s Alpha (9Y)
y = 0.9908x - 0.0003
-15.00%
-10.00%
-5.00%
0.00%
5.00%
10.00%
-0.15 -0.1 -0.05 0 0.05 0.1
Jensen's Alpha -- KLD400 Index (9Y)
25
Graph 3. Total 9-Year Performance of Canadian SRI Funds vs. TSX Composite
Graph 4. Relative 9-Year Performance of Canadian SRI Funds vs. TSX Composite
-10.00%0.00%
10.00%20.00%30.00%40.00%50.00%60.00%70.00%80.00%90.00%
CA SRI Funds vs. TSX Composite (9Y)
CA SRI Funds S&P TSX Composite
-20.00%
-15.00%
-10.00%
-5.00%
0.00%
5.00%
10.00%
15.00%
20.00%
25.00%
Relative Return (9Y)

26
Graph 5. Total 4-Year Performance of Canadian SRI Funds vs. TSX Composite
Graph 6. Relative 4-Year Performance of Canadian SRI Funds vs. TSX Composite
-20.00%-15.00%-10.00%
-5.00%0.00%5.00%
10.00%15.00%20.00%25.00%30.00%
CA SRI Funds vs. TSX Composite (4Y)
CA SRI Funds S&P TSX Composite
-10.00%
-5.00%
0.00%
5.00%
10.00%
15.00%
20.00%
12/31/2014 12/31/2015 12/31/2016 12/31/2017 12/31/2018
Relative Return (4Y)

27
Table 5. 4-Factor Analysis of Canadian SRI Funds (9-year)
SUMMARY OUTPUT
Regression Statistics
Multiple R 0.787315108
R Square 0.619865079
Adjusted R Square 0.605102558
Standard Error 0.014942178
Observations 108
ANOVA
df SS MS F Significance F
Regression 4 0.037499409 0.009374852 41.98910685 7.66117E-21
Residual 103 0.022996673 0.000223269
Total 107 0.060496082
Coefficients Standard Error t Stat P-value Lower 95% Upper 95%
Intercept 0.000325218 0.001545753 0.210394314 0.833775577 -0.002740418 0.003390853
Mkt-RF 0.510183006 0.042092913 12.12040143 1.52324E-21 0.426701641 0.593664372
SMB -0.035152226 0.067973482 -0.517146178 0.60616289 -0.169961595 0.099657143
HML -0.192799374 0.071488477 -2.696929374 0.008177139 -0.334579908 -0.05101884
WML -0.052179615 0.065313032 -0.798915826 0.426177623 -0.181712609 0.077353379
28
Table 6. Canadian SRI Funds – Jensen’s Alpha (9-year)
SUMMARY OUTPUT
Regression Statistics
Multiple R 0.786703387
R Square 0.618902218
Adjusted R Square 0.615306956
Standard Error 0.014747856
Observations 108
ANOVA
df SS MS F Significance F
Regression 1 0.037441159 0.037441159 172.143839 6.09452E-24
Residual 106 0.023054923 0.000217499
Total 107 0.060496082
Coefficients Standard Error t Stat P-value Lower 95% Upper 95%
Intercept 0.002560435 0.001434267 1.785186552 0.077091176 -0.00028314 0.005404009
Rm-Rf 0.529759628 0.040376913 13.12035971 6.09452E-24 0.44970847 0.609810786
Graph 7. Canadian SRI Funds – Jensen’s Alpha (9-year)
y = 0.5298x + 0.0026
-10.00%
-8.00%
-6.00%
-4.00%
-2.00%
0.00%
2.00%
4.00%
6.00%
8.00%
-15.00% -10.00% -5.00% 0.00% 5.00% 10.00%
Jensen's Alpha -- Canadian SRI 9Y Retuturn
29
Table 7. 4-Factor Analysis of Canadian SRI Funds (4-year)
SUMMARY OUTPUT
Regression Statistics
Multiple R 0.764726169
R Square 0.584806114
Adjusted R Square 0.546183427
Standard Error 0.013755038
Observations 48
ANOVA
df SS MS F Significance F
Regression 4 0.011459166 0.002864792 15.14151807 8.41554E-08
Residual 43 0.008135647 0.000189201
Total 47 0.019594813
Coefficients Standard Error t Stat P-value Lower 95% Upper 95%
Intercept -0.000658545 0.00206156 -0.319440202 0.750939545 -0.004816077 0.003498987
Mkt-RF 0.411722899 0.063297863 6.504530796 6.74254E-08 0.284070593 0.539375206
SMB 0.052535965 0.083144454 0.631863733 0.530821143 -0.115140807 0.220212737
HML -0.191614686 0.10564076 -1.813832904 0.076685649 -0.404659582 0.02143021
WML -0.008247289 0.106167227 -0.077682059 0.93844132 -0.222353906 0.205859329
30
Table 8. Canadian SRI Funds – Jensen’s Alpha (4-year)
SUMMARY OUTPUT
Regression Statistics
Multiple R 0.74906175
R Square 0.561093506
Adjusted R Square 0.551552061
Standard Error 0.013673436
Observations 48
ANOVA
df SS MS F Significance F
Regression 1 0.010994522 0.010994522 58.80592252 9.14994E-10
Residual 46 0.008600291 0.000186963
Total 47 0.019594813
Coefficients Standard Error t Stat P-value Lower 95% Upper 95%
Intercept 0.001227316 0.001977191 0.620737435 0.537836033 -0.002752563 0.005207196
Rm-Rf 0.587879575 0.076661593 7.668501974 9.14994E-10 0.433567793 0.742191358
Graph 8. Canadian SRI Funds – Jensen’s Alpha (4-year)
y = 0.5879x + 0.0012
-8.00%
-6.00%
-4.00%
-2.00%
0.00%
2.00%
4.00%
6.00%
-10.00% -8.00% -6.00% -4.00% -2.00% 0.00% 2.00% 4.00% 6.00%
Jensen's Alpha -- Canadian SRI 4Y Return
31
Graph 9. Total 9-Year Performance of U.S. SRI Funds vs. S&P 500 Index
Graph 10. Relative 9-Year Performance of U.S. SRI Funds vs. S&P 500 Index
-50.00%
0.00%
50.00%
100.00%
150.00%
200.00%
250.00%
U.S. SRI Funds vs. S&P500 Index (9Y)
U.S. SRI Funds S&P 500 Index
-80.00%
-70.00%
-60.00%
-50.00%
-40.00%
-30.00%
-20.00%
-10.00%
0.00%
10.00%
Relative Return (9Y)
32
Graph 11. Total 4-Year Performance of U.S. SRI Funds vs. S&P 500 Index
Graph 12. Relative 4-Year Performance of U.S. SRI Funds vs. S&P 500 Index
-20.00%
-10.00%
0.00%
10.00%
20.00%
30.00%
40.00%
50.00%
60.00%
U.S. SRI Funds vs. S&P500 (4Y)
U.S. SRI Funds S&P 500 Index
-10.00%
-5.00%
0.00%
5.00%
10.00%
15.00%
12/31/2014 12/31/2015 12/31/2016 12/31/2017 12/31/2018
Relative Return (4Y)

33
Table 9. 4-Factor Analysis of U.S. SRI Funds (9-year)
SUMMARY OUTPUT
Regression Statistics
Multiple R 0.85616135
R Square 0.733012257
Adjusted R Square 0.722643801
Standard Error 0.026004825
Observations 108
ANOVA
df SS MS F Significance F
Regression 4 0.191233956 0.047808489 70.69637518 1.12869E-28
Residual 103 0.069653845 0.000676251
Total 107 0.260887801
Coefficients Standard Error t Stat P-value Lower 95% Upper 95%
Intercept 0.001799803 0.002690172 0.669029075 0.504973729 -0.003535518 0.007135124
Mkt-RF 1.013795991 0.073256982 13.83889918 3.07466E-25 0.868508045 1.159083937
SMB 0.306953087 0.118298586 2.59473166 0.01084635 0.072335743 0.541570432
HML 0.207562547 0.124415957 1.668295224 0.09829446 -0.03918716 0.454312254
WML -0.182276942 0.113668435 -1.603584505 0.111867854 -0.407711474 0.043157591

34
Table 10. U.S. SRI Funds – Jensen’s Alpha (9-year)
SUMMARY OUTPUT
Regression Statistics
Multiple R 0.84026303
R Square 0.706041959
Adjusted R Square 0.70326877
Standard Error 0.026897792
Observations 108
ANOVA
df SS MS F Significance F
Regression 1 0.184197734 0.184197734 254.5956817 6.04383E-30
Residual 106 0.076690067 0.000723491
Total 107 0.260887801
Coefficients Standard Error t Stat P-value Lower 95% Upper 95%
Intercept 0.00045256 0.002661431 0.170043704 0.865299887 -0.004823987 0.005729106
Rm-Rf 0.635108101 0.03980358 15.9560547 6.04383E-30 0.556193632 0.71402257
Graph 13. U.S. SRI Funds – Jensen’s Alpha (9-year)
y = 0.6351x + 0.0005
-20.00%
-10.00%
0.00%
10.00%
20.00%
30.00%
40.00%
-30.00% -20.00% -10.00% 0.00% 10.00% 20.00%
Jensen's Alpha -- U.S. SRI Funds (9Y)
35
Table 11. 4-Factor Analysis of U.S. SRI Funds (4-year)
SUMMARY OUTPUT
Regression Statistics
Multiple R 0.890195211
R Square 0.792447513
Adjusted R Square 0.773140305
Standard Error 0.018649027
Observations 48
ANOVA
df SS MS F Significance F
Regression 4 0.057098328 0.014274582 41.04412766 3.75344E-14
Residual 43 0.014954807 0.000347786
Total 47 0.072053135
Coefficients Standard Error t Stat P-value Lower 95% Upper 95%
Intercept 0.001839957 0.002795055 0.658289891 0.513861171 -0.003796809 0.007476722
Mkt-RF 0.931861372 0.085818995 10.85845122 6.68368E-14 0.758790874 1.10493187
SMB 0.274573357 0.112726926 2.435738896 0.019080435 0.047237846 0.501908869
HML 0.51410012 0.143227329 3.589399619 0.000844047 0.225254683 0.802945557
WML 0.167133837 0.143941111 1.161126493 0.251995844 -0.123151078 0.457418752
36
Table 12. U.S. SRI Funds – Jensen’s Alpha (4-year)
SUMMARY OUTPUT
Regression Statistics
Multiple R 0.79383585
R Square 0.630175357
Adjusted R Square 0.622135691
Standard Error 0.024068302
Observations 48
ANOVA
df SS MS F Significance F
Regression 1 0.04540611 0.04540611 78.38327425 1.68737E-11
Residual 46 0.026647025 0.000579283
Total 47 0.072053135
Coefficients Standard Error t Stat P-value Lower 95% Upper 95%
Intercept 0.001674554 0.0035134 0.476619327 0.635889585 -0.005397553 0.008746662
Rm-Rf 0.758637223 0.085688482 8.853432908 1.68737E-11 0.586155255 0.93111919
Graph 14. U.S. SRI Funds – Jensen’s Alpha (4-year)
y = 0.7586x + 0.0017
-15.00%
-10.00%
-5.00%
0.00%
5.00%
10.00%
15.00%
20.00%
-15.00% -10.00% -5.00% 0.00% 5.00% 10.00%
Jensen's Alpha -- U.S. SRI Funds (4Y)

37
Graph 15. Total 9-Year Performance of Canadian ESG Funds vs. TSX Composite
Graph 16. Relative 9-Year Performance of Canadian ESG Funds vs. TSX
Composite
-20.00%-10.00%
0.00%10.00%20.00%30.00%40.00%50.00%60.00%70.00%80.00%90.00%
CA ESG Funds vs. TSX Composite (9Y)
CA ESG Funds S&P TSX Composite
-15.00%
-10.00%
-5.00%
0.00%
5.00%
10.00%
15.00%
20.00%
Relative Return (9Y)
38
Graph 17. Total 4-Year Performance of Canadian ESG Funds vs. TSX Composite
Graph 18. Relative 4-Year Performance of Canadian ESG Funds vs. TSX
Composite
-20.00%-15.00%-10.00%
-5.00%0.00%5.00%
10.00%15.00%20.00%25.00%30.00%
CA ESG Funds vs. TSX Composite
CA ESG Funds S&P TSX Composite
-4.00%
-2.00%
0.00%
2.00%
4.00%
6.00%
8.00%
10.00%
12.00%
14.00%
16.00%
12/31/2014 12/31/2015 12/31/2016 12/31/2017 12/31/2018
Relative Return (4Y)

39
Table 13. 4-Factor Analysis of Canadian ESG Funds (9-year)
SUMMARY OUTPUT
Regression Statistics
Multiple R 0.826111567
R Square 0.682460321
Adjusted R Square 0.670128683
Standard Error 0.016336085
Observations 108
ANOVA
df SS MS F Significance F
Regression 4 0.059076209 0.014769052 55.34222796 7.95547E-25
Residual 103 0.027487371 0.000266868
Total 107 0.08656358
Coefficients Standard Error t Stat P-value Lower 95% Upper 95%
Intercept -0.000648729 0.001689951 -0.383874448 0.70186279 -0.004000348 0.00270289
Mkt-RF 0.649482262 0.046019626 14.11315833 8.13213E-26 0.558213189 0.740751336
SMB -0.078900984 0.074314509 -1.061717083 0.290847248 -0.226286284 0.068484317
HML -0.169181162 0.078157407 -2.164620974 0.03272656 -0.324187945 -0.01417438
WML -0.062930318 0.071405874 -0.881304499 0.380204958 -0.204547028 0.078686392

40
Table 14. Canadian ESG Funds – Jensen’s Alpha (9-year)
SUMMARY OUTPUT
Regression Statistics
Multiple R 0.826735182
R Square 0.683491061
Adjusted R Square 0.680505127
Standard Error 0.016077098
Observations 108
ANOVA
df SS MS F Significance F
Regression 1 0.059165433 0.059165433 228.9036529 3.08681E-28
Residual 106 0.027398147 0.000258473
Total 107 0.08656358
Coefficients Standard Error t Stat P-value Lower 95% Upper 95%
Intercept 0.002138989 0.001563539 1.368043195 0.174191646 -0.00096088 0.005238859
Rm-Rf 0.665944808 0.044016132 15.12956222 3.08681E-28 0.578678545 0.753211071
Graph 19. Canadian ESG Funds – Jensen’s Alpha (9-year)
y = 0.6659x + 0.0021
-12.00%
-10.00%
-8.00%
-6.00%
-4.00%
-2.00%
0.00%
2.00%
4.00%
6.00%
8.00%
-15.00% -10.00% -5.00% 0.00% 5.00% 10.00%
Jensen's Alpha -- Canadian ESG Funds (9Y)

41
Table 15. 4-Factor Analysis of Canadian ESG Funds (4-year)
SUMMARY OUTPUT
Regression Statistics
Multiple R 0.797332276
R Square 0.635738758
Adjusted R Square 0.601853991
Standard Error 0.014419116
Observations 48
ANOVA
df SS MS F Significance F
Regression 4 0.01560312 0.00390078 18.76178646 5.45458E-09
Residual 43 0.008940169 0.000207911
Total 47 0.024543289
Coefficients Standard Error t Stat P-value Lower 95% Upper 95%
Intercept -0.000121581 0.00216109 -0.056259175 0.955395948 -0.004479834 0.004236672
Mkt-RF 0.486719071 0.066353812 7.335208914 4.22229E-09 0.352903857 0.620534286
SMB 0.023567821 0.087158574 0.270401636 0.788144942 -0.152204195 0.199339836
HML -0.224954456 0.110740975 -2.031357007 0.04842883 -0.448284917 -0.001623995
WML -0.03216169 0.111292859 -0.28898251 0.773983436 -0.256605131 0.192281752

42
Table 16. Canadian ESG Funds – Jensen’s Alpha (4-year)
SUMMARY OUTPUT
Regression Statistics
Multiple R 0.770582822
R Square 0.593797885
Adjusted R Square 0.584967404
Standard Error 0.01472172
Observations 48
ANOVA
df SS MS F Significance F
Regression 1 0.014573753 0.014573753 67.24411743 1.50127E-10
Residual 46 0.009969536 0.000216729
Total 47 0.024543289
Coefficients Standard Error t Stat P-value Lower 95% Upper 95%
Intercept 0.002074132 0.002128774 0.974331589 0.334988001 -0.002210868 0.006359131
Rm-Rf 0.67683981 0.082538913 8.200251059 1.50127E-10 0.510697595 0.842982024
Graph 20. Canadian ESG Funds – Jensen’s Alpha (4-year)
y = 0.6768x + 0.0021
-8.00%
-6.00%
-4.00%
-2.00%
0.00%
2.00%
4.00%
6.00%
-10.00% -8.00% -6.00% -4.00% -2.00% 0.00% 2.00% 4.00% 6.00%
Jensen's Alpha -- Canadian ESG Funds (4Y)
43
Graph 21. Total 9-Year Performance of U.S. ESG Funds vs. S&P 500 Index
Graph 22. Relative 9-Year Performance of U.S. ESG Funds vs. S&P 500 Index
-50.00%
0.00%
50.00%
100.00%
150.00%
200.00%
250.00%
U.S. ESG Funds vs. S&P 500 Index (9Y)
U.S. ESG Funds S&P 500 Index
-120.00%
-100.00%
-80.00%
-60.00%
-40.00%
-20.00%
0.00%
20.00%
Relative Return (9Y)
44
Graph 23. Total 4-Year Performance of U.S. ESG Funds vs. S&P 500 Index
Graph 24. Relative 4-Year Performance of U.S. ESG Funds vs. S&P 500 Index
-20.00%
-10.00%
0.00%
10.00%
20.00%
30.00%
40.00%
50.00%
60.00%
U.S. ESG Funds vs. S&P 500 Index (4Y)
U.S. ESG Funds S&P 500 Index
-25.00%
-20.00%
-15.00%
-10.00%
-5.00%
0.00%
5.00%
12/31/2014 12/31/2015 12/31/2016 12/31/2017 12/31/2018
Relative Return (4Y)

45
Table 17. 4-Factor Analysis of U.S. ESG Funds (9-year)
SUMMARY OUTPUT
Regression Statistics
Multiple R 0.940474891
R Square 0.88449302
Adjusted R Square 0.880007312
Standard Error 0.014495148
Observations 108
ANOVA
df SS MS F Significance F
Regression 4 0.165717639 0.04142941 197.180251 2.4675E-47
Residual 103 0.021641261 0.000210109
Total 107 0.187358899
Coefficients Standard Error t Stat P-value Lower 95% Upper 95%
Intercept -0.001619037 0.001499508 -1.079711972 0.282792282 -0.004592957 0.001354884
Mkt-RF 1.053081766 0.040833608 25.78958417 9.70777E-47 0.972097936 1.134065596
SMB 0.003884836 0.0659399 0.058914793 0.953134128 -0.126891404 0.134661075
HML -0.104280751 0.069349736 -1.503693549 0.135720398 -0.241819597 0.033258094
WML -0.155178202 0.063359043 -2.449187897 0.016005692 -0.280835921 -0.029520483
46
Table 18. U.S. ESG Funds – Jensen’s Alpha (9-year)
SUMMARY OUTPUT
Regression Statistics
Multiple R 0.922655134
R Square 0.851292496
Adjusted R Square 0.849889595
Standard Error 0.016212526
Observations 108
ANOVA
df SS MS F Significance F
Regression 1 0.159497225 0.159497225 606.8086809 1.13806E-45
Residual 106 0.027861674 0.000262846
Total 107 0.187358899
Coefficients Standard Error t Stat P-value Lower 95% Upper 95%
Intercept -0.001297221 0.001604166 -0.8086576 0.420523394 -0.004477636 0.001883194
Rm-Rf 0.590992645 0.023991433 24.63348698 1.13806E-45 0.543427296 0.638557993
Graph 25. U.S. ESG Funds – Jensen’s Alpha (9-year)
y = 0.591x - 0.0013
-20.00%
-15.00%
-10.00%
-5.00%
0.00%
5.00%
10.00%
15.00%
-30.00% -20.00% -10.00% 0.00% 10.00% 20.00%
Jensen's Alpha -- U.S. ESG Funds (9Y)

47
Table 19. 4-Factor Analysis of U.S. ESG Funds (4-year)
SUMMARY OUTPUT
Regression Statistics
Multiple R 0.947604147
R Square 0.89795362
Adjusted R Square 0.888460934
Standard Error 0.010113059
Observations 48
ANOVA
df SS MS F Significance F
Regression 4 0.03869812 0.00967453 94.59425638 9.92597E-21
Residual 43 0.004397781 0.000102274
Total 47 0.043095901
Coefficients Standard Error t Stat P-value Lower 95% Upper 95%
Intercept -0.000527539 0.001515712 -0.348046784 0.729503206 -0.003584264 0.002529186
Mkt-RF 0.822745126 0.046538223 17.67891154 2.42505E-21 0.728891855 0.916598397
SMB 0.022030565 0.061129949 0.360389063 0.720320521 -0.101249726 0.145310856
HML 0.029693188 0.077669814 0.38230024 0.704121745 -0.126942919 0.186329296
WML -0.031093172 0.078056886 -0.398339899 0.692350711 -0.188509884 0.12632354
48
Table 20. U.S. ESG Funds – Jensen’s Alpha (4-year)
SUMMARY OUTPUT
Regression Statistics
Multiple R 0.932277715
R Square 0.869141737
Adjusted R Square 0.866296993
Standard Error 0.011072346
Observations 48
ANOVA
df SS MS F Significance F
Regression 1 0.037456446 0.037456446 305.5253762 6.07757E-22
Residual 46 0.005639455 0.000122597
Total 47 0.043095901
Coefficients Standard Error t Stat P-value Lower 95% Upper 95%
Intercept -0.000218717 0.001616299 -0.135319473 0.892949706 -0.003472159 0.003034725
Rm-Rf 0.689033413 0.039420002 17.4792842 6.07757E-22 0.609685065 0.768381761
Graph 26. U.S. ESG Funds – Jensen’s Alpha (4-year)
y = 0.689x - 0.0002
-10.00%
-8.00%
-6.00%
-4.00%
-2.00%
0.00%
2.00%
4.00%
6.00%
8.00%
-15.00% -10.00% -5.00% 0.00% 5.00% 10.00%
Jensen's Alpha -- U.S. ESG Funds (4Y)

49
Bibliography
Bauer, R., K. Koedujk and R. Otten: 2005, ‘International Evidence on Ethical Mutual
Fund performance and Investment Style’, Journal of Banking and Finance,1751-1767.
Bauer, R., R. Otten and A. Tourani Rad: 2006, ‘Ethical Investing in Australia, is there a
financial Penalty?’, Pacific-Basin Finance Journal 14, 33-48.
Bauer, R., R. Otten and J. Derwall: 200, ‘The Ethical Mutual Fund Debate: The New
Evidence from Canada’, Journal of Business Ethics 70, 111-124.
Blanchett, D.M: 2010, ‘Exploring the Cost of Investing in Socially Responsible Mutual
Funds: An Empirical Study’, Journal of Investing 19, 93-103.
Brzeszczynski, J. and G.McIntose: 2014, ‘Performance of Portfolios Composed of British
SRI stocks’, Journal of Business Ethics 120, 355-362.
Carhart, M. M.: 1997, ‘On the persistence in Mutual Fund Performance’, Journal of
Finance 52, 57-82.
Fama, E. and K.R.French: 1992, ‘The Cross-Section of Expected Stock Returns’, Journal
of Finance 47, 427-465
Fama, E. and K.R.French: 1993, ‘Common Risk Factors in the Returns on Stocks and
Bonds’, Journal of Financial Economics 33, 3-53.
Fama, E. and K.R.French: 1996, ‘Multifactor Explanations of Asset Pricing Anomalies’,
Journal of Finance 51, 55-84.
Carhart Benchmark Factors: K.R. French library,
<https://mba.tuck.dartmouth.edu/pages/faculty/ken.french/data_library.html>
50
Jensen, M.C:1968, ‘The Performance of Mutual funds in the period 1945-1964’, Journal
of Finance 23, 389-415
KLD Research Analytics, Inc. The Domini 400 Social Index.
< https://www.msci.com/msci-kld-400-social-index>
Hamilton, S., H. Jo and M. Statman: 1993, ‘Doing well while doing good? The
Investment Performance of Social Responsible Mutual Funds’, Financial Analyst Journal
49, 62-66.
Minor, D.: 2007, ‘Find the Cost of Socially Responsible Investing’, Journal of Investing
16, 54-70
Sauer, D.A:1997, ‘The impact of Socially Responsibility Screens on Investment
Performance: evidence from the Domini Social Index and Domini Equity Mutual Fund’,
Review of Financial Economics 6, 137-149
Sharpe, W.F :1996, ‘Mutual Fund Performance’, Journal of Business 39, 119-138.
Statman, M.: 2000, ‘Socially Responsible Mutual Funds’, Financial Analysts Journal 56,
30-39.
Sustainanalytics, Jantzi Social Index.
< https://www.sustainalytics.com/jantzi-social-index/>

51