the relationship between exercise and executive …
TRANSCRIPT
THE RELATIONSHIP BETWEEN EXERCISE AND
EXECUTIVE FUNCTION IN INDIVIDUALS
WITH DOWN SYNDROME
by
ANDREW TUNGATE
FRANCES CONNERS, COMMITTEE CHAIR ANSLEY GILPIN
MARK RICHARDSON
A THESIS
Submitted in partial fulfillment of the requirements for the degree of Master of Arts in
the Department of Psychology in the Graduate School of
The Univeristy of Alabama
TUSCALOOSA, ALABAMA
2016

Copyright Andrew Tungate 2016 ALL RIGTHS RESERVED
ii
ABSTRACT
Executive function is a set of processes that are responsible for organizing and
controlling goal oriented behavior, especially in novel situations (Banich, 2009) and there is
mounting evidence that exercise improves executive function. It is also a known deficit in
individuals with Down syndrome. The current study investigated if there is a relationship
between exercise and executive function in Down syndrome. Participants were children and
adults ages 6-18 who have previously been diagnosed with Down syndrome. We found no
relationship between exercise and executive function, but many important descriptive findings
emerged from the study. Specifically, the current study includes novel information related to
average steps per day in a population in Down syndrome, replicated the executive function
profile found in previous research, and contributes many important methodological suggestions
for future studies investigating the relationship between exercise and executive function in Down
syndrome.
iii
DEDICATION
This thesis is dedicated to the families and communities willing to participate in my
project. It is also dedicated to all who guided me though the trials and tribulations of creating this
manuscript.

iv
LIST OF ABBREVIATIONS AND SYMBOLS
df Degrees of freedom: number of values free to vary after certain restrictions have been placed on the data
p Probability associated with the occurrence under the null hypothesis of a value as
extreme as or more extreme than the observed value r Pearson product-moment correlation
t Computed value of a t test
< Less than
= Equal to
≥ Greater than or equal to
v
ACKNOWLEDGMENTS
I am grateful for the opportunity to thank my colleagues, friends, and faculty members
who helped me complete this project. I am especially indebted to Dr. Fran Conners, the chair of
my thesis, for sharing her valuable advice and guidance throughout the duration of my project. I
would also like to thank my committee members Dr. Ansley Gilpin and Dr. Mark Richardson for
their valuable input and guidance. I would like to thank the families that participated in the study
as well: this research would not have been possible without them.

vi
CONTENTS
ABSTRACT .................................................................................................. ii
DEDICATION .............................................................................................. iii
LIST OF ABBREVIATIONS AND SYMBOLS ......................................... iv
ACKNOWLEDGMENTS ............................................................................ v
LIST OF TABLES ........................................................................................ vii
1. INTRODUCTION .................................................................................... 1
2. METHODOLOGY ................................................................................... 8
3. RESULTS ................................................................................................. 13
4. DISCUSSION ........................................................................................... 19
REFERENCES ............................................................................................. 24
APPENDIX A ............................................................................................... 31
APPENDIX B ............................................................................................... 37
vii
LIST OF TABLES
1. Means, Standard Deviations (SD), and Confidence Intervals (CI) for the Pedometer Data ................................................................................. 15
2. Means, Standard Deviations (SD), and Confidence Intervals (CI) for the Modified CLASS Data ...................................................................... 16
3. Percent Clinically Elevated, Means, and T-tests for the BRIEF T-scores .... 17
4. Bivariate Pearson Correlation Among Key Variables .................................. 18
5. Partial Correlations Among Key Variables Controlling for Age .................. 18
1
1. INTRODUCTION
Down Syndrome
According to recent estimates, approximately 1 out of every 700 babies are born with
Down syndrome (DS) in the United States (Parker et al., 2010). The trisomy of chromosome 21
is the cause of approximately 95% of diagnoses with DS, translocation of the extra chromosome
is the cause of approximately 3% of diagnoses, and mosaic DS is the cause of approximately 2%
of the diagnoses (Shin, Siffel, & Correa, 2010). It is important to note that despite the specific
cause of DS, the pervading characteristics present in individuals with DS remain the same.
Specifically, the overexpression of chromosome 21 causes both physical and mental differences
in people with DS.
Physically, those with DS have particular characteristics that make them distinguishable
from those without DS. Some common characteristics are a flattened face, almond-shaped eyes
that slant up, a short neck, small ears, a tongue that tends to stick out of the mouth, small hands
and feet, poor muscle tone, and short stature (“CDC - Birth Defects, Down Syndrome -
NCBDDD,” n.d.). Individuals with DS also display differences in cognitive development when
compared to typically developing individuals (i.e., they have intellectual disability (ID)). Those
with DS exhibit relative weaknesses with expressive language, syntactic/morphosyntatic
processing, and verbal working memory when compared to others with conditions resulting in
intellectual disability (e.g., Abbeduto, Warren, & Conners, 2007; Silverman, 2007). The
proposed study does not aim to measure broad cognition as much as it aims to measure executive
function—an important subcategory of cognitive processes.
2
Executive Function
Executive function is a term that encompasses several related, but distinct cognitive
processes. Together these processes are responsible for organizing and controlling goal oriented
behavior, especially in novel situations (Banich, 2009; Lezak, 1982; Zelazo, Carter, Reznick, &
Frye, 1997). Three of the more basic processes of executive function are inhibition, set shifting,
and working memory (Miyake et al., 2000; Zelazo, Craik, & Booth, 2004). Inhibition refers to a
person’s ability to stop, or inhibit, a behavior or a thought. Set shifting, also called attention
shifting or cognitive flexibility, refers to a person’s ability to switch their attention from one task
to another. Working memory refers to a person’s capacity to hold information in their mind and
simultaneously manipulate it. It is common for these different processes to be studied
individually when evaluating executive function (EF) because there is no single test that
accurately measures all the processes involved.
Executive Function in Down Syndrome. Executive function deficit is a known
characteristic of DS (Carney, Brown, & Henry, 2013; Lanfranchi, Jerman, Dal Pont, Alberti, &
Vianello, 2010; Lee et al., 2011; Rowe, Lavender, & Turk, 2006). For example, it has been
found that there is a general deficit in inhibitory control in those with DS (Borella, Carretti, &
Lanfranchi, 2013). In a study involving both participants with DS and typically developing (TD)
participants matched for mental age, participants underwent a battery of EF tasks (Lanfranchi,
Jerman, Dal Pont, Alberti, & Vianello, 2010). The researchers found that participants with DS
performed significantly more poorly than TD participants on tasks assessing set shifting,
planning/problem solving, working memory, and inhibition/preservation, but performed
similarly on tasks assessing fluency. Others have also identified working memory as a specific

3
deficit in DS–especially verbal working memory (Baddeley & Jarrold, 2007; Rowe et al., 2006;
Silverman, 2007).
A deficit in EF affects all areas of life. For example, Lezak (1982) noted that
impairments in EF compromise a person’s ability to maintain an independent, constructively
self-serving, and socially productive life. Executive function was found to be an indicator of
how well children adjust to middle school (Jacobson, Williford, & Pianta, 2011) and is also
associated with the development of social skills (Kiley-Brabeck & Sobin, 2006). Given the
documented difficulties in EF in DS and the importance of EF to everyday functioning, it is clear
that those with DS would benefit from improving EF.
In TD and ID populations, interventions to improve EF have become of increasing
interest, and the success of the interventions has varied. There have been a few interventions that
have effectively used cognitive training to improve EF, (e.g. Dahlin, Bäckman, Neely, &
Nyberg, 2009; Röthlisberger & Neuenschwander, 2012) especially aspects of working memory.
Recent intervention studies have recognized and built on the ability to train the processes
associated with EF as a way to improve EF, or maintain it while aging (Dorbath, Hasselhorn, &
Titz, 2013; Zinke et al., 2014). A study conducted by Miranda et al. (2011) implemented an
intervention for children with ADHD using small-group teaching techniques for parents and
children with training tasks related to EF (i.e., self-instruction techniques, problem solving, anger
management, etc.). After a 10-week intervention period the investigators concluded that the
interventions could have a positive effect on some domains of EF.
Executive Function and Exercise. The relationship between exercise and EF has been
the subject of an increasing amount of research in recent years. Many studies have focused on
the typically developing population, with the bulk of the research focusing on children and older
4
adults (Boucard et al., 2012; Chang, Liu, Yu, & Lee, 2012; Davis et al., 2011; Tanaka et al.,
2009; Tomporowski, Davis, Miller, & Naglieri, 2008; Verbeken, Braet, Goossens, & van der
Oord, 2013). A recent review article on exercise and EF highlighted many studies that provide
evidence that aerobic exercise promotes children’s effortful and goal oriented cognition (see
Best, 2010). Interestingly, the reported effects have been detected after both acute bouts of
exercise as well as after chronic physical training. For example, Davis et al. (2011) conducted an
intervention study of overweight children (BMI ≥ 85%, age 7-11) in which they assessed
changes in cognitive function between children who were assigned to a no exercise control, a 20-
min aerobic exercise group, or a 40-min aerobic exercise group every school day. Cognitive
functioning was assessed pre and post the 3-month intervention. They measured four aspects of
cognitive processes, though planning was the only one related to EF. They found that both
conditions of aerobic training had a positive effect on tasks requiring planning compared to the
no exercise condition. More specifically, the subscale of planning included strategy generation
and application, self-regulation, intentionality, and utilization knowledge. Acute exercise has
been associated with an increased ability to store memories and affect cognitive health in
preadolescents (Hillman et al., 2009; Pesce, Crova, Cereatti, Casella, & Bellucci, 2009).
Hillman et al. (2009) noted that acute exercise affects underlying processes that support EF
across the lifetime.
Neural Mechanisms. There are several possible mechanisms by which exercise may
impact EF skills. A number studies have shown that exercise produces enduring positive effects
on the brain (Cotman, Berchtold, & Christie, 2007; Dishman et al., 2006; Erickson et al., 2011;
Kramer & Erickson, 2007; Praag, Christie, Sejnowski, & Gage, 1999; Praag, 2009). More
specifically, exercise increases blood flow to the brain (see Best, 2010; Erickson et al., 2011;
5
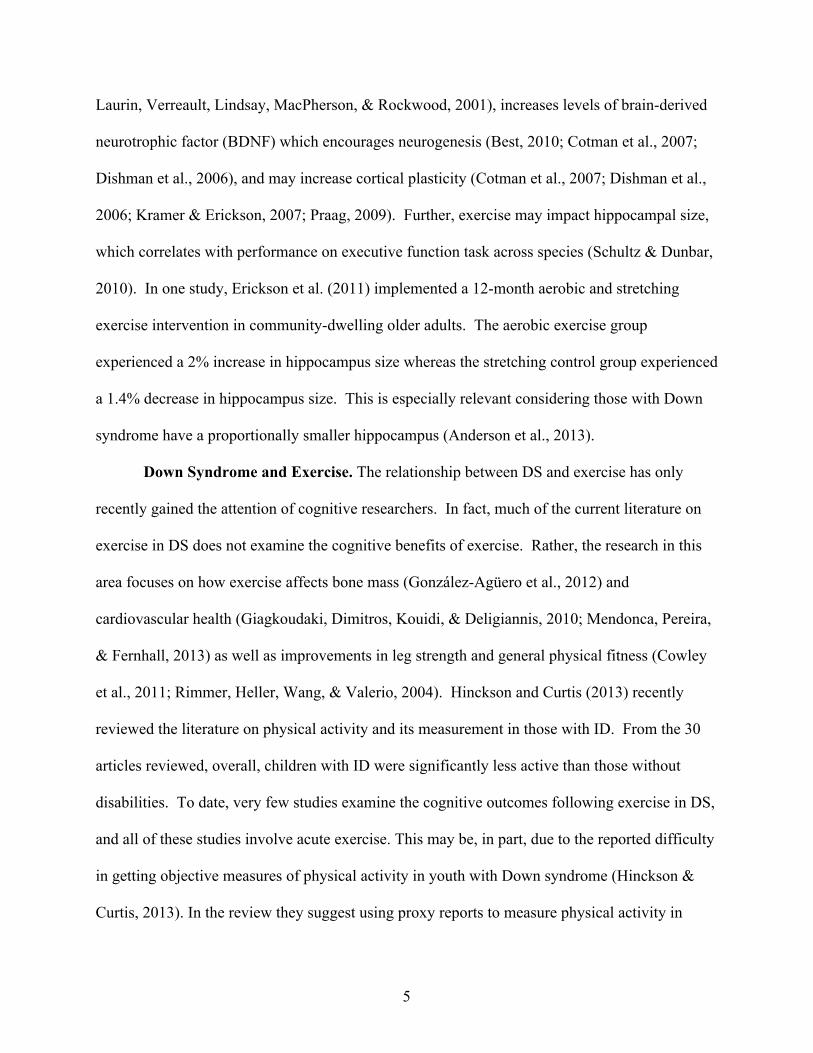
Laurin, Verreault, Lindsay, MacPherson, & Rockwood, 2001), increases levels of brain-derived
neurotrophic factor (BDNF) which encourages neurogenesis (Best, 2010; Cotman et al., 2007;
Dishman et al., 2006), and may increase cortical plasticity (Cotman et al., 2007; Dishman et al.,
2006; Kramer & Erickson, 2007; Praag, 2009). Further, exercise may impact hippocampal size,
which correlates with performance on executive function task across species (Schultz & Dunbar,
2010). In one study, Erickson et al. (2011) implemented a 12-month aerobic and stretching
exercise intervention in community-dwelling older adults. The aerobic exercise group
experienced a 2% increase in hippocampus size whereas the stretching control group experienced
a 1.4% decrease in hippocampus size. This is especially relevant considering those with Down
syndrome have a proportionally smaller hippocampus (Anderson et al., 2013).
Down Syndrome and Exercise. The relationship between DS and exercise has only
recently gained the attention of cognitive researchers. In fact, much of the current literature on
exercise in DS does not examine the cognitive benefits of exercise. Rather, the research in this
area focuses on how exercise affects bone mass (González-Agüero et al., 2012) and
cardiovascular health (Giagkoudaki, Dimitros, Kouidi, & Deligiannis, 2010; Mendonca, Pereira,
& Fernhall, 2013) as well as improvements in leg strength and general physical fitness (Cowley
et al., 2011; Rimmer, Heller, Wang, & Valerio, 2004). Hinckson and Curtis (2013) recently
reviewed the literature on physical activity and its measurement in those with ID. From the 30
articles reviewed, overall, children with ID were significantly less active than those without
disabilities. To date, very few studies examine the cognitive outcomes following exercise in DS,
and all of these studies involve acute exercise. This may be, in part, due to the reported difficulty
in getting objective measures of physical activity in youth with Down syndrome (Hinckson &
Curtis, 2013). In the review they suggest using proxy reports to measure physical activity in
6
children with ID, mainly because of refusal to wear external devices (e.g., pedometers,
accelometers, heart rate monitors, etc.). However, there are a few recent studies that examined
the the cognitive beenfits of exercise in DS. For example, Ringenbach, Albert, Chen, and Alberts
(2014) found that performance on a task involving cognitive planning—the Tower of London—
improved after an assisted cycling session. Further, Chen, Ringenbach, Crews, Kulinna, and
Amazeen (2015) found an improvement in inhibition following treadmill walking in DS; and
more recently (Chen & Ringenbach, 2016) found evidence of a dose-response relationship for
exercise intensity and inhibition scores in individuals with DS.
For those with DS, certain barriers have been identified to engaging in physical activity.
The most notable are competing family responsibilities, reduced physical or behavioral skills,
and a lack of accessible exercise programs (Barr & Shields, 2011). Heller, Hsieh, and Rimmer
(2003) suggested that there is a need not only for accessible programs for those with DS, but also
a need for increased caregiver’s awareness of the importance of exercise for this population.
There has also been a call for greater effort to promote physical activity in those with DS
because of the known benefits it has for improving general health and avoiding chronic disease
(Rimmer et al., 2004) as well as the potential for it to be a catalyst for increased self-esteem and
social interaction (Jobling, 2001). It is also important to understand the relationship between
exercise and executive function in DS because exercise may be an effective way to improve EF
in a population with a general EF deficit.
Taken together, research demonstrates there is an EF deficit that is characteristic of DS,
individuals with DS engage in less exercise than those without disabilities, and exercise
improves the processes that encompass EF in typically developing children and adults. Thus,
research is needed to determine whether increasing exercise in those with DS can lead to
7
improvement in their EF skills. Before attempting an intervention study, however, it is important
to know whether exercise is correlated with EF among those with DS–that is, do those with DS
who exercise more have better EF? Therefore, the purpose of the current study was to determine
whether amount of exercise, or physical activity, relates to EF in participants who have DS. Of
course it is possible that participants who are generally higher functioning may engage in more
exercise and also have higher EF skills. To address this possibility, we will measure adaptive
behavior and examine its influence on the relation between exercise and EF. I hypothesize that
there will be a significant positive correlation between exercise and measures of EF even when
the influence of level of adaptive functioning is controlled.
In the current study, youth with DS wore a pedometer for one week and their parents
completed the Children’s Leisure Activities Study Survey (CLASS, Salmon, Telford, &
Crawford, 2004), the Behavior Rating Inventory of Executive Function (BRIEF; Gioia, Isquith,
Guy, & Kenworthy, 2000), and the Adaptive Behavior Assessment System - Third Edition
(ABAS-III, Harrison & Oakland, 2015). The direct (pedometer) and indirect (parent report)
measures of physical activity were expected to correlate positively with the BRIEF. Adaptive
functioning is expected to mediate this relation, but only partially. After the mediating effect is
accounted for, it is expected that there will remain a significant relation between exercise and
EF.

8
2. METHODOLOGY
Design
I used a correlational design to examine the relations between the dependent variable,
exercise, the independent variable, EF, and the mediator variable – adaptive functioning.
Adaptive functioning was included in the model to clarify the relation between exercise and EF.
For example, if exercise is positively related to EF, this could be because those who are higher in
adaptive functioning are more active and have higher EF. Conversely, there could be a direct
relation between exercise and EF beyond any influence of adaptive functioning level.
Participants
Participants had been previously diagnosed with DS and were ages 6-18 years old. Of
the 26 participants, there were 11 males and 15 females, with a mean age of 11.07 (3.84). I
recruited participants from the University of Alabama Intellectual Disabilities Participant
Registry (UAIDPR). The UAIDPR is a registry used to match researchers with children and
adults who have intellectual disabilities. The UAIDPR recruits participants from Alabama,
Mississippi, Georgia and Florida for behavioral research. Participants were excluded if their
active caregivers had not been their caregivers for more than a year, if their hearing or vision was
poor based on parent report, and if English was not their first language. Twenty-six total families
participated and 14 of the 26 provided full data for analysis; additionally, 25 of the 26 filled out
all of the parent forms, but some were unable to provide pedometer data.

9
Measures
Adaptive behavior measure. Caregivers of the participants with DS were interviewed
using the Adaptive Behavior Assessment System – Third Edition (ABAS-III, Harrison &
Oakland, 2015). Specifically, I used the parent form to assess adaptive behavior of our
participants. The parent form is designed for children ages 5-21. The ABAS-III assesses the
skills that are used in conceptual, social and practical areas of adaptive behavior. The skills
assessed from the parent form are communication, community use, functional academics, home
living, health and safety, leisure, self-care, self-direction, social, and work. It is important to
note the skill “work” is only administered to those who are 17 years old or older, and have a part-
or full-time job. It is also not included in the general adaptive composite (GAC). The raw score
from the assessment is translated to a scaled score and the scaled scores make the GAC. The
parent raters will score each item on a 4-point Likert-type scale with the choices: is not able,
never or almost never when needed, sometimes when needed, and always or almost always when
needed. The test-retest reliability is .88 for the GAC for ages 16-89 (Harrison & Oakland, 2015).
Physical activity measures. Measuring physical activity in participants who have
intellectual disabilities is difficult for multiple reasons (e.g., differences in gait, tampering with
measurement equipment, etc.). Though there are many limitations with this population, it has
been suggested that reports by parents or caregivers are one of the better ways to measure
physical activity in individuals with intellectual disabilities (Hinckson & Curtis, 2013). It has
also been suggested that no single measure is appropriate to accurately measure physical activity
(Chaumeton, Duncan, Duncan, & Strycker, 2011; Welk, Corbin, & Dale, 2000). A study looking
at the use of pedometers in adults with DS noted that though there may be differences in gait
between typically developing individuals and those with DS, use of a piezoelectric pedometer
10
(also known as an accelerometer pedometer) would minimize the differences in gait as opposed
to a spring-levered pedometer (Pitchford & Yun, 2010). Essentially, a piezoelectric pedometer
will more accurately assess when participants are taking steps; because of the differences in gait,
a spring-levered pedometer may count a step when one was not taken or fail to count a step when
one was taken. Pitchford and Yun (2010) also suggested, as other researchers have, the
incorporation of multiple methods in assessing physical activity in individuals with Down
syndrome, noting the limitations of using pedometers alone.
The current study used both parents’ reports as well as a week of pedometer data to
achieve a comprehensive and accurate assessment of physical activity. The Omron HJ-720ITC
pedometer (a piezoelectric pedometer) was used and parents recorded the number of steps at the
end of each day on a tracking-sheet for a seven-day period. The tracking-sheet had a place to
provide the number of steps for a day and a space to provide comments about that day as well.
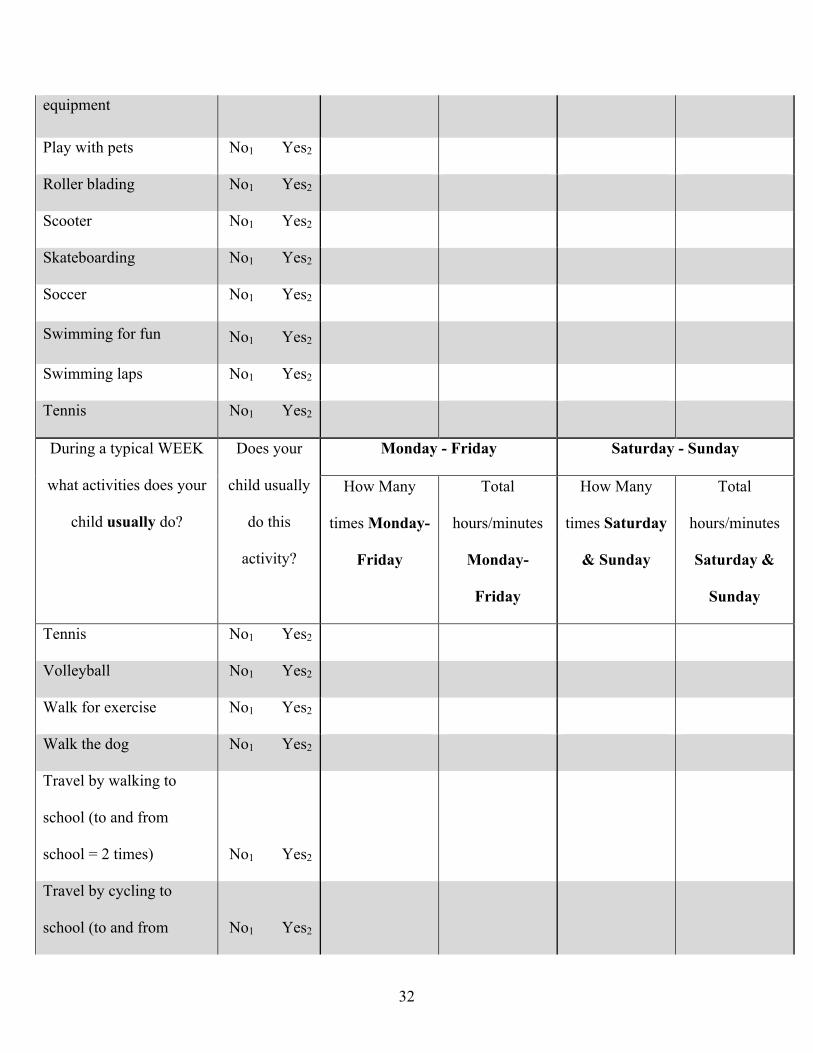
The Children’s Leisure Activities Study Survey (CLASS, Salmon, et al., 2004) is a proxy
report that was adapted for use in the current study. There are not many physical activity
questionnaires that are high in reliability but the CLASS is one of the more reliable physical
activity questionnaires currently available for children (Chinapaw, Mokkink, van Poppel, van
Mechelen, & Terwee, 2010). The test-retest reliability for the proxy and self-report versions
ranged from .62 to .94 (Telford, Salmon, Jolley, & Crawford, 2004). The CLASS requires
parents to report their child’s physical activity during a typical week. The CLASS is set up as a
table with the activity listed in the left column, a yes or no question on whether or not the
participant engages in this activity during a typical week in the next column, then how many
total minutes for each activity for Monday through Friday as well as Saturday and Sunday in
separate columns. The CLASS was modified to include items specific to our culture and
11
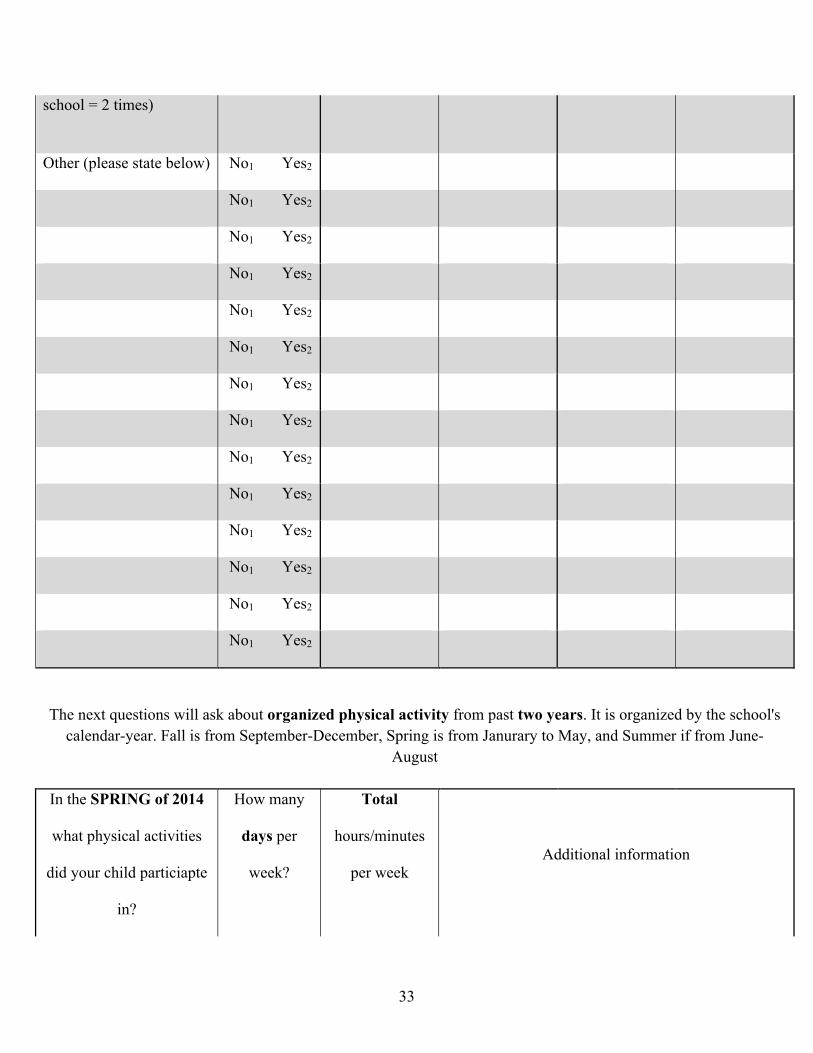
population, as previously it had been used with TD children in Australia. In addition to the
CLASS, the current study included a similarly designed table recording physical activity over the
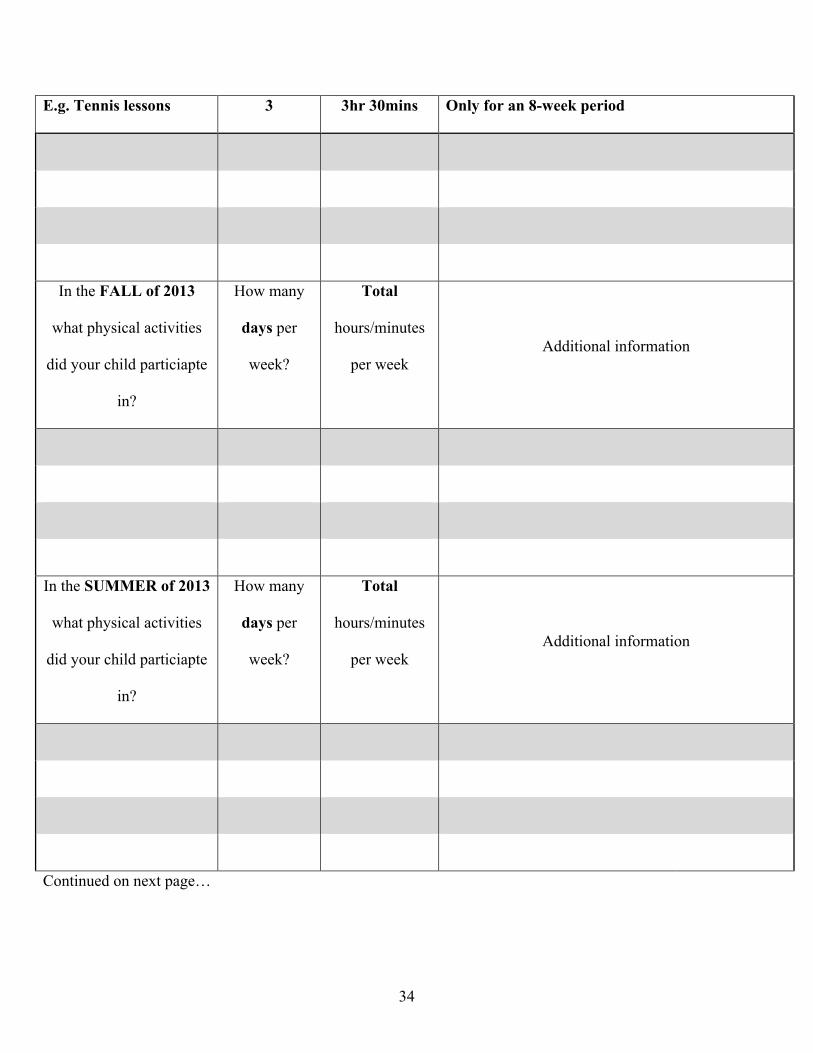
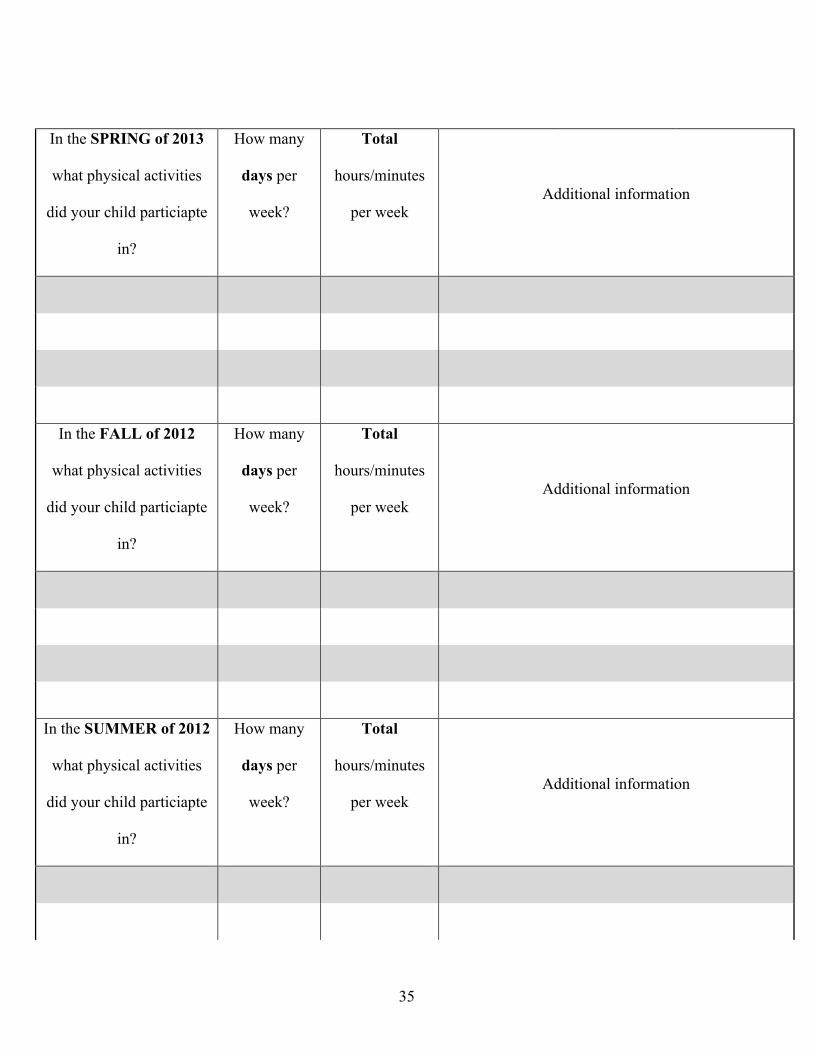
past two years, with a greater focus on organized recreation activities (sports teams, exercise
classes, etc.) The additional table recording the past two years is broken down into school
semesters to help parents understand (i.e., spring 2014, fall 2013, and summer 2013). Please see
Appendix for more details.
Executive function measure.
Behavior Rating Inventory of Executive Function – (BRIEF). The BRIEF (Giola et al.,
2000) is a parent proxy report designed to assess children with disorders in EF from ages 5-18.
The BRIEF was chosen because it allows us to look at age-based norms via T-scores. The
current study used the parent report version of the BRIEF, which uses a 3-point scale for the 86-
item questionnaire: Never, Sometimes, and Often. Examples of prompts parents would respond
to are: “Has a short attention span,” “Keeps room messy,” and “Gets out of seat at the wrong
times.” It is suggested that both parents, or caregivers, be present to compete the questionnaire
and it takes approximately 10-15 minutes to complete. The Cronbach’s alpha for the BRIEF
parent report ranges from r= .80 to r= .89, with test-retest reliability coefficients ranging from
.76 – .85+ with the majority of the scores .80 and above. The BRIEF also has adequate validity
(Giola et al. 2000). The BRIEF consists of eight subscales: Inhibit, Shift, Emotional Control,
Initiate, Working Memory, Plan and Organization, Organization of Materials, and Monitoring;
and three indices: Behavioral Rating Index, Metacognitive Index, and the General Executive
Composite (GEC). Parents were given a frame-of-reference in their instructions for filling out the
BRIEF; referring to “a typically developing child of the same age” if needed. In the current study
BRIEF T-scores were computed and used in the data analysis. T-scores are age-based normative

12
scores with a mean of 50, and a standard deviation of 10. Higher scores on the BRIEF indicate
poorer EF.
Procedure
Parents of participants were mailed the modified CLASS, BRIEF, ABAS-III, a
background questionnaire, and a pedometer and tracking sheet used to record the daily walking
activity for seven days. The caregiver was also given instruction on where to put the pedometer
as well as when to record the daily walking activity. Once the pedometer data were collected and
the forms were completed, participants mailed back forms and pedometer in the pre-paid
postage. If parents did not have questions and did not return the forms for three weeks I would
contact them every one to two weeks to answer questions and discuss other logistical details
related to the study (i.e., whether or not their child would wear the pedometer, reminding them to
send materials back, etc.).
13
3. RESULTS
Exercise
Pedometer Data. An average steps/day variable was computed for the pedometer data. It
was computed by summing the number of steps, for up to five days, and dividing by the number
of days that were summed; this procedure is similar to one previously used by Strycker, Duncan,
Chaumeton, Duncan, and Toobert (2007). If a participant had seven days of pedometer data
(without missing data), the highest and lowest days were removed. For two participants, four
days of pedometer data were used to compute the average because there were not five complete
days of pedometer data. There was a considerable amount of missing data for the pedometer
caused by: complete refusal to wear, partial days, days with 8+ hour car rides, etc. Any missing
data were excluded from the analyses, meaning, we did not compute—via multiple imputation or
other techniques—participants’ missing pedometer data. This decision was made because
techniques that compute missing values rely on large samples: those would not have been
appropriate give the small sample of the current study. It is also important to note that all
variables were normally distributed.
One important question in the study was whether or not participants would wear a
pedometer for a seven-day period, and if any pedometers would be lost during the experiment.
From our sample, three pedometers were lost—hence the data were lost—and nine participants
were unable to wear pedometers. There were no participants that wore the pedometer that were
excluded from the analyses. Meaning, participants excluded from data analysis either did not
wear the pedometer at all, or lost the pedometer shortly after starting to wear it. From ages 5 to
14
13 complete pedometer data depended on the participant; however, all participants 13 years and
older had complete pedometer data. Anecdotally, the older participants seemed to enjoy wearing
the pedometers—many parents commented that they would be purchasing one for their child
once the study was completed. The other obstacle we ran into was the amount of time
participants needed to collect the pedometer data. Theoretically, it should have only taken a little
more than a week or two to finish the parent forms and pedometer data. However, during the
study, many participants were very slow at getting started, they would occasionally skip days,
and would forget to drop the materials off at the post office once done with the study.
One of the goals the current study was to learn whether or not the average number of
steps per day for participants with DS was less than their TD peers. Means and standard
deviations for participants are reported in Table 1. As expected, youth with DS report fewer steps
than TD youths (approximately 9,000 – 13,000 steps per day) based on information reported
from previous studies (Strycker et al, 2007; Tudor-Locke et al. 2011; Beets, Bornstein, Beighle,
Cardinal & Morgan, 2010). Additionally, the activity has a similar pattern, such that boys report
more steps than girls (see Table 1); however, children did not report significantly more steps per
day than adolescents.
15
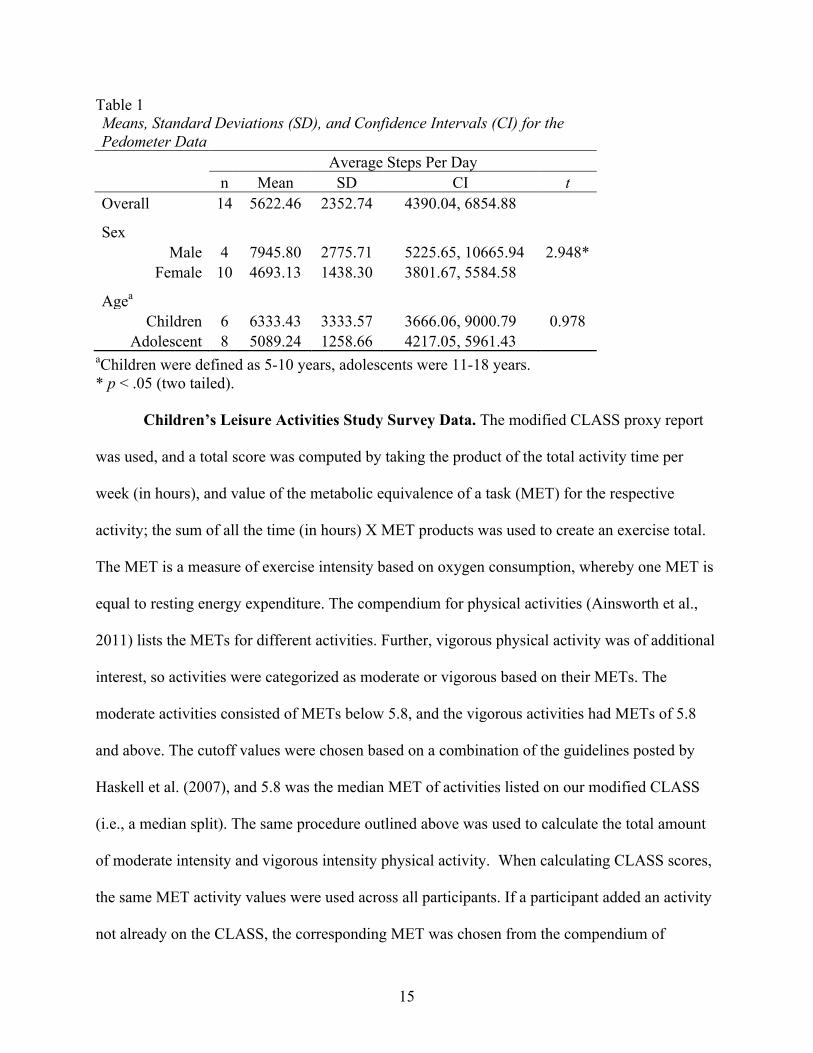
Table 1 Means, Standard Deviations (SD), and Confidence Intervals (CI) for the Pedometer Data
Average Steps Per Day
n Mean SD CI t Overall 14 5622.46 2352.74 4390.04, 6854.88
Sex Male 4 7945.80 2775.71 5225.65, 10665.94 2.948*
Female 10 4693.13 1438.30 3801.67, 5584.58
Agea Children 6 6333.43 3333.57 3666.06, 9000.79 0.978
Adolescent 8 5089.24 1258.66 4217.05, 5961.43 aChildren were defined as 5-10 years, adolescents were 11-18 years. * p < .05 (two tailed).
Children’s Leisure Activities Study Survey Data. The modified CLASS proxy report
was used, and a total score was computed by taking the product of the total activity time per
week (in hours), and value of the metabolic equivalence of a task (MET) for the respective
activity; the sum of all the time (in hours) X MET products was used to create an exercise total.
The MET is a measure of exercise intensity based on oxygen consumption, whereby one MET is
equal to resting energy expenditure. The compendium for physical activities (Ainsworth et al.,
2011) lists the METs for different activities. Further, vigorous physical activity was of additional
interest, so activities were categorized as moderate or vigorous based on their METs. The
moderate activities consisted of METs below 5.8, and the vigorous activities had METs of 5.8
and above. The cutoff values were chosen based on a combination of the guidelines posted by
Haskell et al. (2007), and 5.8 was the median MET of activities listed on our modified CLASS
(i.e., a median split). The same procedure outlined above was used to calculate the total amount
of moderate intensity and vigorous intensity physical activity. When calculating CLASS scores,
the same MET activity values were used across all participants. If a participant added an activity
not already on the CLASS, the corresponding MET was chosen from the compendium of
16
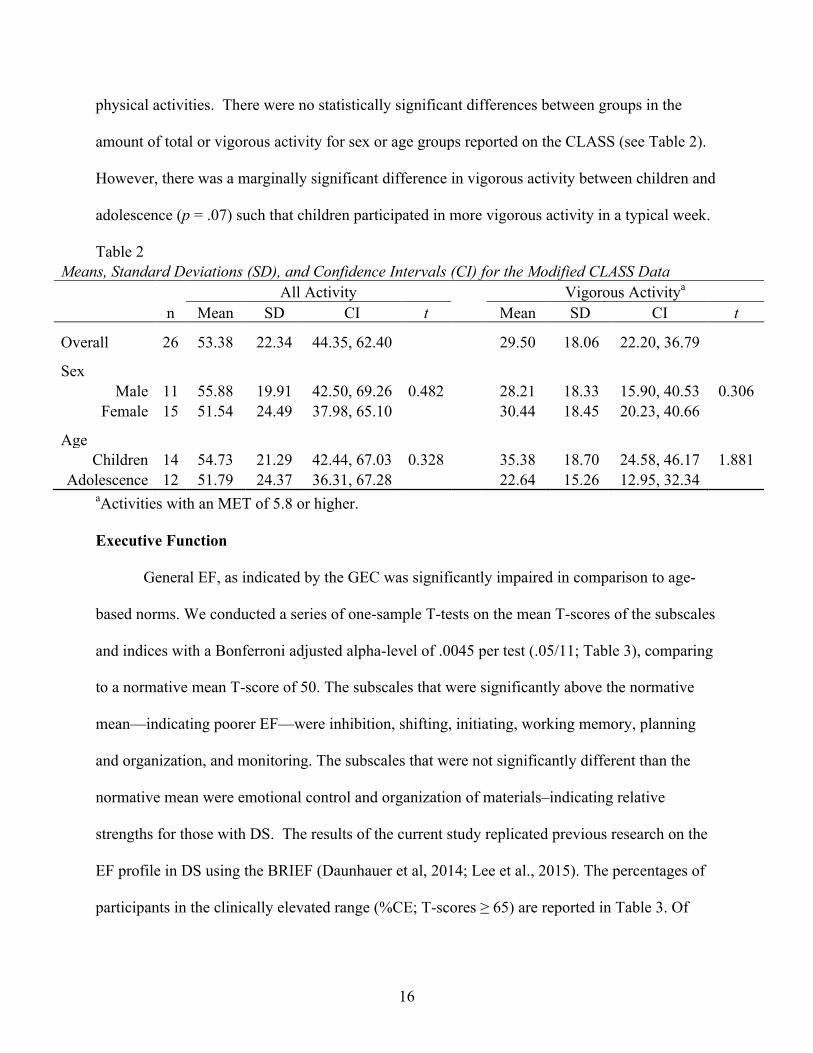
physical activities. There were no statistically significant differences between groups in the
amount of total or vigorous activity for sex or age groups reported on the CLASS (see Table 2).
However, there was a marginally significant difference in vigorous activity between children and
adolescence (p = .07) such that children participated in more vigorous activity in a typical week.
Table 2 Means, Standard Deviations (SD), and Confidence Intervals (CI) for the Modified CLASS Data
All Activity
Vigorous Activitya
n Mean SD CI t Mean SD CI t
Overall 26 53.38 22.34 44.35, 62.40
29.50 18.06 22.20, 36.79
Sex Male 11 55.88 19.91 42.50, 69.26 0.482
28.21 18.33 15.90, 40.53 0.306
Female 15 51.54 24.49 37.98, 65.10
30.44 18.45 20.23, 40.66
Age Children 14 54.73 21.29 42.44, 67.03 0.328
35.38 18.70 24.58, 46.17 1.881
Adolescence 12 51.79 24.37 36.31, 67.28
22.64 15.26 12.95, 32.34 aActivities with an MET of 5.8 or higher.
Executive Function
General EF, as indicated by the GEC was significantly impaired in comparison to age-
based norms. We conducted a series of one-sample T-tests on the mean T-scores of the subscales
and indices with a Bonferroni adjusted alpha-level of .0045 per test (.05/11; Table 3), comparing
to a normative mean T-score of 50. The subscales that were significantly above the normative
mean—indicating poorer EF—were inhibition, shifting, initiating, working memory, planning
and organization, and monitoring. The subscales that were not significantly different than the
normative mean were emotional control and organization of materials–indicating relative
strengths for those with DS. The results of the current study replicated previous research on the
EF profile in DS using the BRIEF (Daunhauer et al, 2014; Lee et al., 2015). The percentages of
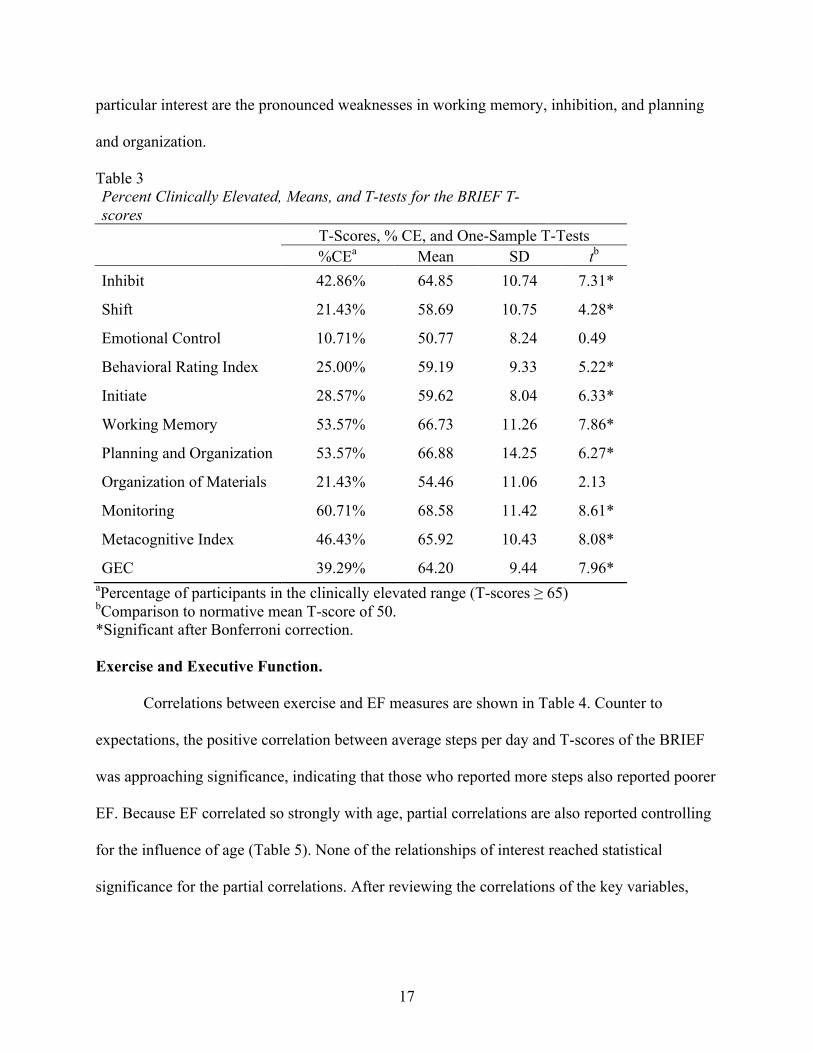
participants in the clinically elevated range (%CE; T-scores ≥ 65) are reported in Table 3. Of
17
particular interest are the pronounced weaknesses in working memory, inhibition, and planning
and organization.
Table 3 Percent Clinically Elevated, Means, and T-tests for the BRIEF T-scores
T-Scores, % CE, and One-Sample T-Tests
%CEa Mean SD tb Inhibit 42.86% 64.85 10.74 7.31*
Shift 21.43% 58.69 10.75 4.28*
Emotional Control 10.71% 50.77 8.24 0.49
Behavioral Rating Index 25.00% 59.19 9.33 5.22*
Initiate 28.57% 59.62 8.04 6.33*
Working Memory 53.57% 66.73 11.26 7.86*
Planning and Organization 53.57% 66.88 14.25 6.27*
Organization of Materials 21.43% 54.46 11.06 2.13
Monitoring 60.71% 68.58 11.42 8.61*
Metacognitive Index 46.43% 65.92 10.43 8.08*
GEC 39.29% 64.20 9.44 7.96* aPercentage of participants in the clinically elevated range (T-scores ≥ 65) bComparison to normative mean T-score of 50. *Significant after Bonferroni correction. Exercise and Executive Function.
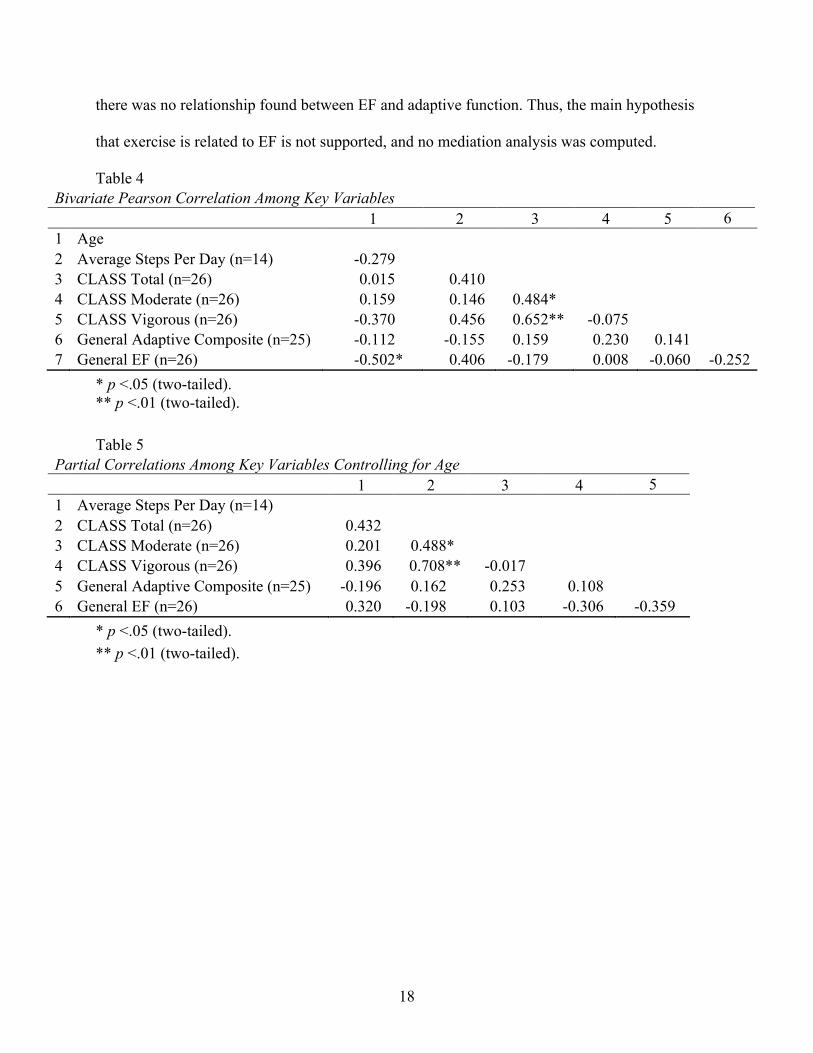
Correlations between exercise and EF measures are shown in Table 4. Counter to
expectations, the positive correlation between average steps per day and T-scores of the BRIEF
was approaching significance, indicating that those who reported more steps also reported poorer
EF. Because EF correlated so strongly with age, partial correlations are also reported controlling
for the influence of age (Table 5). None of the relationships of interest reached statistical
significance for the partial correlations. After reviewing the correlations of the key variables,
18
there was no relationship found between EF and adaptive function. Thus, the main hypothesis
that exercise is related to EF is not supported, and no mediation analysis was computed.
Table 4 Bivariate Pearson Correlation Among Key Variables 1 2 3 4 5 6 1 Age 2 Average Steps Per Day (n=14) -0.279 3 CLASS Total (n=26) 0.015 0.410 4 CLASS Moderate (n=26) 0.159 0.146 0.484* 5 CLASS Vigorous (n=26) -0.370 0.456 0.652** -0.075 6 General Adaptive Composite (n=25) -0.112 -0.155 0.159 0.230 0.141 7 General EF (n=26) -0.502* 0.406 -0.179 0.008 -0.060 -0.252
* p <.05 (two-tailed). ** p <.01 (two-tailed). Table 5
Partial Correlations Among Key Variables Controlling for Age 1 2 3 4 5 1 Average Steps Per Day (n=14) 2 CLASS Total (n=26) 0.432 3 CLASS Moderate (n=26) 0.201 0.488* 4 CLASS Vigorous (n=26) 0.396 0.708** -0.017 5 General Adaptive Composite (n=25) -0.196 0.162 0.253 0.108 6 General EF (n=26) 0.320 -0.198 0.103 -0.306 -0.359
* p <.05 (two-tailed). ** p <.01 (two-tailed).
19
4. DISCUSSION
The main purpose of the current study was to determine if there is a relationship between
physical activity and EF in DS. We expected that those who reported higher amounts of physical
activity would have better EF. There was no significant correlation between scores on the
CLASS and EF. Further, the mediating variable—adaptive functioning—was not related to either
measure of physical activity or to EF. Nevertheless, some interesting descriptive findings emerge
from the study.
Exercise and Executive Function
Importantly, the EF profile replicates findings from previous studies in youth with DS
using the BRIEF (Daunhauer et al, 2014; Lee et al., 2015). Youth with DS have strengths in
emotional control and organization of materials, and weaknesses across the other subscales. The
main analysis in the present study was expected to reveal a significant positive relationship
between exercise and EF after controlling for the influence of adaptive behavior, but a
nonsignificant trend in the opposite direction was found in average steps per day (i.e., more steps
per day were related to poorer EF). The initial take-away may be that poorer EF, as measured by
the BRIEF, is associated with increased average steps per day. However, previous research
suggests that exercise is beneficial for executive function in children (Best, 2010; Davis et al.,
2011; Tomprowski et al., 2008); there are even acute benefits found immediately after walking in
a DS population (Chen, Ringenbach, Crews, Kulinna, & Amazeen, 2015). Thus, the following
are several alternative explanations for our findings.
20
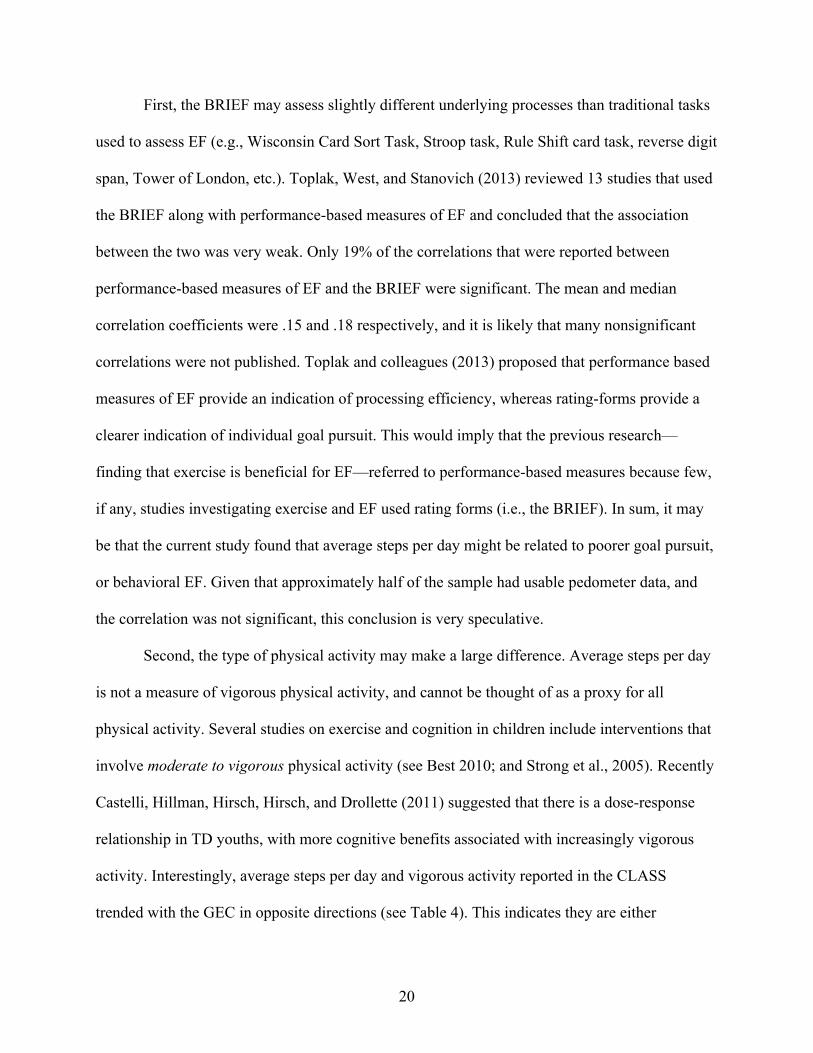
First, the BRIEF may assess slightly different underlying processes than traditional tasks
used to assess EF (e.g., Wisconsin Card Sort Task, Stroop task, Rule Shift card task, reverse digit
span, Tower of London, etc.). Toplak, West, and Stanovich (2013) reviewed 13 studies that used
the BRIEF along with performance-based measures of EF and concluded that the association
between the two was very weak. Only 19% of the correlations that were reported between
performance-based measures of EF and the BRIEF were significant. The mean and median
correlation coefficients were .15 and .18 respectively, and it is likely that many nonsignificant
correlations were not published. Toplak and colleagues (2013) proposed that performance based
measures of EF provide an indication of processing efficiency, whereas rating-forms provide a
clearer indication of individual goal pursuit. This would imply that the previous research—
finding that exercise is beneficial for EF—referred to performance-based measures because few,
if any, studies investigating exercise and EF used rating forms (i.e., the BRIEF). In sum, it may
be that the current study found that average steps per day might be related to poorer goal pursuit,
or behavioral EF. Given that approximately half of the sample had usable pedometer data, and
the correlation was not significant, this conclusion is very speculative.
Second, the type of physical activity may make a large difference. Average steps per day
is not a measure of vigorous physical activity, and cannot be thought of as a proxy for all
physical activity. Several studies on exercise and cognition in children include interventions that
involve moderate to vigorous physical activity (see Best 2010; and Strong et al., 2005). Recently
Castelli, Hillman, Hirsch, Hirsch, and Drollette (2011) suggested that there is a dose-response
relationship in TD youths, with more cognitive benefits associated with increasingly vigorous
activity. Interestingly, average steps per day and vigorous activity reported in the CLASS
trended with the GEC in opposite directions (see Table 4). This indicates they are either
21
measuring different constructs, or capturing separate variance related to one construct (i.e.,
physical activity). Given the theoretical importance of vigorous activity (i.e., more vigorous
activity is cognitively beneficial for children and adolescents, Castelli, 2011) its relationship with
the GEC is encouraging. It is important to note, the conclusions we draw from the average steps
per day are limited by the small sample. Unfortunately, several participants reported having
difficulties with keeping the pedometers on throughout the day.
Exercise
The current study provides novel information on the physical activity levels, especially in
the form of average steps per day, in youth with DS. Youth with DS reported lower average steps
per day than what is typical for their age group. However, the pattern of average steps per day is
the same in DS as it is in TD youths, such that boys reported more steps than girls. There was
also a nonsignificant trend for younger children to record more steps per day than adolescents.
These descriptive findings are especially important because the current study is the first
recording average steps per day in youth with DS. Tudor-Locke, et. al (2011) reported the
average steps per day for TD boys and girls ages 6-11 as 13,00 and 12,000, respectively; boys
and girls ages 12-19 reported 11,000 and 9,000 steps per day respectively. Participants in the
current study reported taking fewer steps per day, which is consistent with previous research
reporting lower activity levels in youth with ID (see Hinkerson & Curtis, 2013).
A review paper by Hinkerson and Curtis (2013) noted the difficulty of obtaining
objective measures of exercise in youth with ID—we encountered some difficulties using
pedometers. The older participants gave complete pedometer data, and some of the younger
participants did not. Additionally, no older participants (i.e., ≥ 13 years old) reported losing the
pedometer. Many parents commented that their child enjoyed wearing the pedometer, so much

22
so that many parents of older participants asked where they could buy a similar one. Our
difficulties with younger participants are consistent with previous accounts of difficulties related
to using objective measures (see Hinkerson & Curtis, 2013) in ID populations; however, we
tentatively suggest the age of 13 may be an approximate cutoff where pedometers become a
viable measure of physical activity in DS.
Limitations
It is important to address a few limitations in the current study. The most notable is the
small sample size in the study. Unfortunately, we are missing data because many participants
had issues with the pedometer—limiting the conclusions we can draw from the pedometer data.
Another limitation is the potential for bias in parent/caregiver reports of their children’s adaptive
behavior, executive function, and physical activity. Although the measures are designed to assess
trait-like behaviors rather than state-like behaviors, parents may have been influenced by their
child’s behavior that day, or shortly before filling out the forms. The physical activity
questionnaire is also limited by parents’ ability to report what their child does throughout the
day, including activities like: physical education classes at school. In the current study, parent-
omitted items were assumed to be true omissions, but the parents may have forgotten to report
some activities.
Future Directions
Our findings indicate that more work needs to be done to improve the measurement of
exercise in DS (e.g., slightly altering the CLASS to reduce parental omissions, and fine-tuning or
finding a different objective measure of exercise in DS). Parental omissions may be reduced by
asking parents to include hour by hour detail on what their children do during a typical day:
asking parents to include time spent sitting, traveling to school, sleeping, walking the dog, etc.,
23
and ensuring it adds up to close to 24 hours. For increased pedometer participation (i.e.,
participants correctly wearing them), it may help to have a smaller and/or more secure pedometer
to reduce the number of children not wanting to wear it or losing it. An alternative objective
measure of physical activity may be the use of a Fitbit-like device. Pending acceptable validity
and reliability, a Fitbit-like device may be a great option in the future. Anecdotally, many parents
who had issues collecting data with the pedometer offered to have their child wear their Fitbit
because their child enjoyed wearing it. Future studies measuring EF would benefit from having a
rating form as well as performance-based measures of EF because they are theoretically nuanced.
Additionally, future studies will be needed to better understand if there is a dose-response
relationship between exercise and EF in youth with DS (e.g., such that vigorous activity is more
beneficial for EF than less vigorous activity). Most of all, this current study highlights the need
for more research to better understand the complex relationship between exercise and EF in DS.

24
REFERENCES
Ainsworth, B. E., Haskell, W. L., Herrmann, S. D., Meckes, N., Bassett Jr, D. R., Tudor-Locke, C., ... & Leon, A. S. (2011). 2011 Compendium of Physical Activities: a second update of codes and MET values. Medicine and science in sports and exercise, 43(8), 1575-1581.
Anderson, J. S., Nielsen, J. A., Ferguson, M. A., Burback, M. C., Cox, E. T., Dai, L., ... & Korenberg, J. R. (2013). Abnormal brain synchrony in Down syndrome. NeuroImage: Clinical, 2, 703-715.
Baddeley, A., & Jarrold, C. (2007). Working memory and Down syndrome. Journal of Intellectual Disability Research, 51(12), 925–931. doi:10.1111/j.1365-2788.2007.00979.x
Banich, M. T. (2009). Executive function the search for an integrated account. Current Directions in Psychological Science, 18(2), 89–95.
Barr, M., & Shields, N. (2011). Identifying the barriers and facilitators to participation in physical activity for children with Down syndrome. Journal of Intellectual Disability Research : JIDR, 55(11), 1020–1033. doi:10.1111/j.1365-2788.2011.01425.x
Beets, M. W., Bornstein, D., Beighle, A., Cardinal, B. J., & Morgan, C. F. (2010). Pedometer-measured physical activity patterns of youth: A 13-country review. American Journal of Preventive Medicine, 38(2), 208-216.
Best, J. R. (2010). Effects of physical activity on children’s executive function: Contributions of experimental research on aerobic exercise. Developmental Review, 30(4), 331–351. doi:10.1016/j.dr.2010.08.001
Borella, E., Carretti, B., & Lanfranchi, S. (2013). Inhibitory mechanisms in Down syndrome: is there a specific or general deficit? Research in Developmental Disabilities, 34(1), 65–71. doi:10.1016/j.ridd.2012.07.017
Boucard, G. K., Albinet, C. T., Bugaiska, A., Bouquet, C. a, Clarys, D., & Audiffren, M. (2012). Impact of physical activity on executive functions in aging: A selective effect on inhibition among old adults. Journal of Sport & Exercise Psychology, 34(6), 808–827. Retrieved from http://www.ncbi.nlm.nih.gov/pubmed/23204360
Carney, D. P. J., Brown, J. H., & Henry, L. a. (2013). Executive function in Williams and Down syndromes. Research in Developmental Disabilities, 34(1), 46–55. doi:10.1016/j.ridd.2012.07.013
25
Castelli, D. M., Hillman, C. H., Hirsch, J., Hirsch, A., & Drollette, E. (2011). FIT Kids: Time in target heart zone and cognitive performance. Preventive Medicine, 52, S55-S59.
CDC - Birth Defects, Down Syndrome - NCBDDD. (n.d.). Retrieved from http://www.cdc.gov/ncbddd/birthdefects/downsyndrome.html
Chang, Y.-K., Liu, S., Yu, H.-H., & Lee, Y.-H. (2012). Effect of acute exercise on executive function in children with attention deficit hyperactivity disorder. Archives of Clinical Neuropsychology, 27(2), 225–237. doi:10.1093/arclin/acr094
Channell, M. M., Loveall, S. J., & Conners, F. a. (2013). Strengths and weaknesses in reading skills of youth with intellectual disabilities. Research in Developmental Disabilities, 34(2), 776–787. doi:10.1016/j.ridd.2012.10.010
Chaumeton, N., Duncan, S. C., Duncan, T. E., & Strycker, L. a. (2011). A Measurement Model of Youth Physical Activity Using Pedometer and Self, Parent, and Peer Reports. International Journal of Behavioral Medicine, 18(3), 209–215. doi:10.1007/s12529-010-9118-5
Chen, C. C., Ringenbach, S. D. R., Crews, D., Kulinna, P. H., & Amazeen, E. L. (2015). The association between a single bout of moderate physical activity and executive function in young adults with Down syndrome: a preliminary study. Journal of Intellectual Disability Research, 59(7), 589-598.
Chen, C. C., & Ringenbach, S. D. R. (2016). Dose–response relationship between intensity of exercise and cognitive performance in individuals with Down syndrome: a preliminary study. Journal of Intellectual Disability Research.
Chinapaw, M. J. M., Mokkink, L. B., van Poppel, M. N. M., van Mechelen, W., & Terwee, C. B. (2010). Physical Activity Questionnaires for Youth: A Systematic Review of Measurement Properties. Sports Medicine, 40(7), 539–563. doi:10.2165/11530770-000000000-00000
Cotman, C. W., Berchtold, N. C., & Christie, L.-A. (2007). Exercise builds brain health: Key roles of growth factor cascades and inflammation. Trends in Neuroscience, 30(9), 464–472. doi:10.1016/j.tins.2007.06.011
Cowley, P. M., Ploutz-Snyder, L. L., Baynard, T., Heffernan, K. S., Jae, S. Y., Hsu, S., … Fernhall, B. (2011). The effect of progressive resistance training on leg strength, aerobic capacity and functional tasks of daily living in persons with Down syndrome. Disability and Rehabilitation, 33(23-24), 2229–2236. doi:10.3109/09638288.2011.563820
Dahlin, E., Bäckman, L., Neely, A. S., & Nyberg, L. (2009). Training of the executive component of working memory: Subcortical areas mediate transfer effects. Restorative Neurology and Neuroscience, 27(5), 405–419. doi:10.3233/RNN-2009-0492

26
Daunhauer, L. A., Fidler, D. J., Hahn, L., Will, E., Lee, N. R., & Hepburn, S. (2014). Profiles of everyday executive functioning in young children with Down syndrome. American journal on intellectual and developmental disabilities, 119(4), 303-318.
Davis, C. L., Tomporowski, P. D., McDowell, J. E., Austin, B. P., Miller, P. H., Yanasak, N. E., … Naglieri, J. a. (2011). Exercise improves executive function and achievement and alters brain activation in overweight children: a randomized, controlled trial. Health Psychology : Official Journal of the Division of Health Psychology, American Psychological Association, 30(1), 91–8. doi:10.1037/a0021766
Dishman, R. K., Berthoud, H.-R., Booth, F. W., Cotman, C. W., Edgerton, V. R., Fleshner, M. R., … Zigmond, M. J. (2006). Neurobiology of exercise. Obesity, 14(3), 345–356. doi:10.1038/oby.2006.46
Dorbath, L., Hasselhorn, M., & Titz, C. (2013). Effects of education on executive functioning and its trainability. Educational Gerontology, 39(5), 314–325. doi:10.1080/03601277.2012.700820
Erickson, K. I., Voss, M. W., Prakash, R. S., Basak, C., Szabo, A., Chaddock, L., … Kramer, A. F. (2011). Exercise training increases size of hippocampus and improves memory. Proceedings of the National Academy of Sciences, 108(7), 3017–3022. doi:10.1073/pnas.1015950108
Giagkoudaki, F., Dimitros, E., Kouidi, E., & Deligiannis, A. (2010). Effects of exercise training on heart-rate-variability indices in individuals with Down Syndrome. Journal of Sport Rehabilitation, 19(2), 173–183. Retrieved from http://www.ncbi.nlm.nih.gov/pubmed/20543218
Gioia, G. A., Isquith, P. K., Guy, S. C., & Kenworthy, L. (2000). Test review behavior rating inventory of executive function. Child Neuropsychology, 6(3), 235-238.
González-Agüero, A., Vicente-Rodríguez, G., Gómez-Cabello, A., Ara, I., Moreno, L. a, & Casajús, J. a. (2012). A 21-week bone deposition promoting exercise programme increases bone mass in young people with Down syndrome. Developmental Medicine and Child Neurology, 54(6), 552–556. doi:10.1111/j.1469-8749.2012.04262.x
Harrison, P. L., & Oakland, T. (2015). Adaptive Behavior Assessment System (3rd ed.). San Antonio, TX: Harcourt Assessment.
Haskell, W. L., Lee, I. M., Pate, R. R., Powell, K. E., Blair, S. N., Franklin, B. A., ... & Bauman, A. (2007). Physical activity and public health: updated recommendation for adults from the American College of Sports Medicine and the American Heart Association. Circulation, 116(9), 1081.
Hillman, C. H., Pontifex, M. B., Raine, L. B., Castelli, D. M., Hall, E. E., & Kramer, a F. (2009). The effect of acute treadmill walking on cognitive control and academic achievement in preadolescent children. Neuroscience, 159(3), 1044–1054. doi:10.1016/j.neuroscience.2009.01.057
27
Hinckson, E. A., & Curtis, A. (2013). Measuring physical activity in children and youth living with intellectual disabilities: A systematic review. Research in Developmental Disabilities, 34(1), 72–86. doi:10.1016/j.ridd.2012.07.022
Jacobson, L. a, Williford, A. P., & Pianta, R. C. (2011). The role of executive function in children’s competent adjustment to middle school. Child Neuropsychology, 17(3), 255–80. doi:10.1080/09297049.2010.535654
Jobling, A. (2001). Life be in it: Lifestyle choices for active leisure. Down’s Syndrome Research and Practice, 6(3), 117–122. Retrieved from http://www.ncbi.nlm.nih.gov/pubmed/11501213
Kiley-Brabeck, K., & Sobin, C. (2006). Social skills and executive function deficits in children with the 22q11 Deletion Syndrome. Applied Neuropsychology, 13(4), 258–268. doi:10.1207/s15324826an1304_7
Kramer, A. F., & Erickson, K. I. (2007). Capitalizing on cortical plasticity: Influence of physical activity on cognition and brain function. Trends in Cognitive Sciences, 11(8), 342–348. doi:10.1016/j.tics.2007.06.009
Lanfranchi, S., Jerman, O., Dal Pont, E., Alberti, A., & Vianello, R. (2010). Executive function in adolescents with Down syndrome. Journal of Intellectual Disability Research : JIDR, 54(4), 308–319. doi:10.1111/j.1365-2788.2010.01262.x
Laurin, D., Verreault, R., Lindsay, J., MacPherson, K., & Rockwood, K. (2001). Physical activity and risk of cognitive impairment and dementia in elderly persons. Archives of Neurology, 58(3), 498–504. Retrieved from http://www.ncbi.nlm.nih.gov/pubmed/11255456
Lee, N. R., Fidler, D. J., Blakeley-Smith, A., Daunhauer, L., Robinson, C., & Hepburn, S. L. (2011). Caregiver Report of Executive Functioning in a Population-Based Sample of Young Children with Down Syndrome. American Journal on Intellectual and Developmental Disabilities, 116(4), 290–304. doi:10.1352/1944-7558-116.4.290
Lee, N. R., Anand, P., Will, E., Adeyemi, E. I., Clasen, L. S., Blumenthal, J. D., ... & Edgin, J. O. (2015). Everyday executive functions in Down syndrome from early childhood to young adulthood: evidence for both unique and shared characteristics compared to youth with sex chromosome trisomy (XXX and XXY). Frontiers in behavioral neuroscience, 9.
Lezak, M. D. (1982). The problem of assessing executive functions. International Journal of Psychology, 17, 281–297.
Mendonca, G. V, Pereira, F. D., & Fernhall, B. (2013). Heart rate recovery and variability following combined aerobic and resistance exercise training in adults with and without Down syndrome. Research in Developmental Disabilities, 34(1), 353–361. doi:10.1016/j.ridd.2012.08.023
28
Miranda, A., Presentación, M. J., Siegenthaler, R., & Jara, P. (2011). Effects of a psychosocial intervention on the executive functioning in children with ADHD. Journal of Learning Disabilities, 46(4), 363–376. doi:10.1177/0022219411427349
Miyake, A., Friedman, N. P., Emerson, M. J., Witzki, a H., Howerter, A., & Wager, T. D. (2000). The unity and diversity of executive functions and their contributions to complex “frontal lobe” tasks: A latent variable analysis. Cognitive Psychology, 41(1), 49–100. doi:10.1006/cogp.1999.0734
Mungas, D., Reed, B. R., Tomaszewski Farias, S., & DeCarli, C. (2005). Criterion-referenced validity of a neuropsychological test battery: equivalent performance in elderly Hispanics and non-Hispanic Whites. Journal of the International Neuropsychological Society : JINS, 11(5), 620–630. doi:10.1017/S1355617705050745
Parker, S. E., Mai, C. T., Canfield, M. a, Rickard, R., Wang, Y., Meyer, R. E., … Correa, A. (2010). Updated National Birth Prevalence Estimates for Selected Birth Defects in the United States, 2004-2006. Birth Defects Research. Part A, Clinical and Molecular Teratology, 88(12), 1008–1016. doi:10.1002/bdra.20735
Pesce, C., Crova, C., Cereatti, L., Casella, R., & Bellucci, M. (2009). Physical activity and mental performance in preadolescents: Effects of acute exercise on free-recall memory. Mental Health and Physical Activity, 2(1), 16–22. doi:10.1016/j.mhpa.2009.02.001
Pitchford, E. A., & Yun, J. (2010). The Accuracy of Pedometers for Adults With Down Syndrome. Adapted Physical Activity Quarterly, 27(4), 321–336. Retrieved from http://www.ncbi.nlm.nih.gov/pubmed/20956838
Praag, H. Van. (2009). Exercise and the brain: Something to chew on. Trends in Neurosciences, 32(5), 283–290. doi:10.1016/j.tins.2008.12.007.Exercise
Praag, H. Van, Christie, B. R., Sejnowski, T. J., & Gage, F. H. (1999). Running enhances neurogenesis, learning, and long-term potentiation in mice. Proceedings of the National Academy of Sciences, 96(23), 13427–13431.
Preacher, K. J., & Hayes, A. F. (2004). Models, SPSS and SAS procedures for estimating indirect effects in simple mediation. Behavior Research Methods, 36, 717–731.
Rimmer, J. H., Heller, T., Wang, E., & Valerio, I. (2004). Improvements in Physical Fitness in Adults with Down Syndrome. American Journal of Mental Retardation, 109(2), 165–174. doi:10.1352/0895-8017(2004)109<165:IIPFIA>2.0.CO;2
Ringenbach, S. R., Albert, A. R., Chih-Chia (JJ), C., & Alberts, J. L. (2014). Acute Bouts of Assisted Cycling Improves Cognitive and Upper Extremity Movement Functions in Adolescents With Down Syndrome. Intellectual & Developmental Disabilities, 52(2), 124-135. doi:10.1352/1934-9556-52.2.124

29
Röthlisberger, M., & Neuenschwander, R. (2012). Improving executive functions in 5- and 6-year-olds : Evaluation of a small group intervention in prekindergarten and kindergarten children. Infant & Child Development, 21, 411–429. doi:10.1002/icd
Rowe, J., Lavender, A., & Turk, V. (2006). Cognitive executive function in Down’s syndrome. The British Journal of Clinical Psychology, 45(1), 5–17. doi:10.1348/014466505X29594
Rueda, M. R., Fan, J., McCandliss, B. D., Halparin, J. D., Gruber, D. B., Lercari, L. P., & Posner, M. I. (2004). Development of attentional networks in childhood. Neuropsychologia, 42(8), 1029–1040. doi:10.1016/j.neuropsychologia.2003.12.012
Rust, J. O., & Wallace, M. A. (2004). Test review. Journal of Psychoeducational Assessment, 22, 367–373.
Salmon, J., Telford, A., & Crawford, D. (2004). The Children’s Leisure Activities Study Summary Report (p. 56).
Sherman, E. M. S., & Brooks, B. L. (2010). Behavior rating inventory of executive function – preschool version (BRIEF-P): Test review and clinical guidelines for use. Child Neuropsychology, 16(5), 503–519. doi:10.1080/09297041003679344
Shin, M., Siffel, C., & Correa, A. (2010). Survival of Children With Mosaic Down Syndrome. American Journal of Medical Genetics, 152(3), 800–801. doi:10.1002/ajmg.a.33295
Silverman, W. (2007). Down Syndrome: Cognitive Phenotype. Mental Retardation and Developmental Disabilities Research Reviews, 13, 228–236. doi:10.1002/mrdd
Strong, W. B., Malina, R. M., Blimkie, C. J., Daniels, S. R., Dishman, R. K., Gutin, B., ... & Rowland, T. (2005). Evidence based physical activity for school-age youth. The Journal of pediatrics, 146(6), 732-737.
Strycker, L. A., Duncan, S. C., Chaumeton, N. R., Duncan, T. E., & Toobert, D. J. (2007). Reliability of pedometer data in samples of youth and older women. International Journal of Behavioral Nutrition and Physical Activity, 4(1), 4. doi: 10.1186/1479-5868-4-4.
Tanaka, K., Quadros, A. C. De, Santos, R. F., Stella, F., Gobbi, L. T. B., & Gobbi, S. (2009). Benefits of physical exercise on executive functions in older people with Parkinson’s disease. Brain and Cognition, 69(2), 435–441. doi:10.1016/j.bandc.2008.09.008
Telford, A., Salmon, J., Jolley, D., & Crawford, D. (2004). Reliability and Validity of Physical Activity Questionnaires for Children: The Children’s Leisure Activities Study Survey (CLASS). Pediatric Exercise Science, 16, 64–78.
Tomporowski, P. D., Davis, C. L., Miller, P. H., & Naglieri, J. a. (2008). Exercise and children’s intelligence, cognition, and academic achievement. Educational Psychology Review, 20(2), 111–131. doi:10.1007/s10648-007-9057-0
30
Toplak, M. E., West, R. F., & Stanovich, K. E. (2013). Practitioner Review: Do performance‐based measures and ratings of executive function assess the same construct?. Journal of Child Psychology and Psychiatry, 54(2), 131-143.
Tudor-Locke, C., Craig, C. L., Beets, M. W., Belton, S., Cardon, G. M., Duncan, S., & ... Blair, S. N. (2011). How many steps/day are enough? For children and adolescents. The International Journal Of Behavioral Nutrition And Physical Activity, 8
Verbeken, S., Braet, C., Goossens, L., & van der Oord, S. (2013). Executive function training with game elements for obese children: A novel treatment to enhance self-regulatory abilities for weight-control. Behaviour Research and Therapy, 51(6), 290–299. doi:10.1016/j.brat.2013.02.006
Weintraub, S., Dikmen, S. S., Heaton, R. K., Tulsky, D. S., Zelazo, P. D., Bauer, P. J., … Gershon, R. C. (2013). Cognition assessment using the NIH Toolbox. Neurology, 80(11 Suppl 3), S54–S64. doi:10.1212/WNL.0b013e3182872ded
Welk, G. J., Corbin, C. B., & Dale, D. (2000). Measurement Issues in the Assessment of Physical Activity in Children. Research Quarterly for Exercise and Sport, 71(2), S59–73. Retrieved from http://www.ncbi.nlm.nih.gov/pubmed/10925827
Zelazo, P. D., Carter, A., Reznick, J. S., & Frye, D. (1997). Early development of executive function: A problem-solving framework. Review of General Psychology, 1(2), 198–226. doi:10.1037//1089-2680.1.2.198
Zelazo, P. D., Craik, F. I. M., & Booth, L. (2004). Executive function across the life span. Acta Psychologica, 115, 167–83. doi:10.1016/j.actpsy.2003.12.005
Zinke, K., Zeintl, M., Rose, N. S., Putzmann, J., Pydde, A., & Kliegel, M. (2014). Working memory training and transfer in older adults: Effects of age, baseline performance, and training gains. Developmental Psychology, 50(1), 304–315. doi:10.1037/a0032982

31
APPENDIX A
During a typical WEEK
what activities does your
child usually do?
Does your
child usually
do this
activity?
Monday - Friday Saturday - Sunday
How Many
times Monday-
Friday
Total
hours/minutes
Monday-
Friday
How Many
times Saturday
& Sunday
Total
hours/minutes
Saturday &
Sunday
E.g. Bike Riding No1 Yes2 2 1hr 10mins 1 20mins
Aerobics class No1 Yes2
Baseball / Softball No1 Yes2
Basketball No1 Yes2
Bike riding No1 Yes2
Bounce on trampoline No1 Yes2
Dance No1 Yes2
Gymnastics No1 Yes2
Household chores No1 Yes2
Jogging or running No1 Yes2
Jumping rope No1 Yes2
Physical education class No1 Yes2
Play on playground No1 Yes2
32
equipment
Play with pets No1 Yes2
Roller blading No1 Yes2
Scooter No1 Yes2
Skateboarding No1 Yes2
Soccer No1 Yes2
Swimming for fun No1 Yes2
Swimming laps No1 Yes2
Tennis No1 Yes2
During a typical WEEK
what activities does your
child usually do?
Does your
child usually
do this
activity?
Monday - Friday Saturday - Sunday
How Many
times Monday-
Friday
Total
hours/minutes
Monday-
Friday
How Many
times Saturday
& Sunday
Total
hours/minutes
Saturday &
Sunday
Tennis No1 Yes2
Volleyball No1 Yes2
Walk for exercise No1 Yes2
Walk the dog No1 Yes2
Travel by walking to
school (to and from
school = 2 times) No1 Yes2
Travel by cycling to
school (to and from No1 Yes2
33
school = 2 times)
Other (please state below) No1 Yes2
No1 Yes2
No1 Yes2
No1 Yes2
No1 Yes2
No1 Yes2
No1 Yes2
No1 Yes2
No1 Yes2
No1 Yes2
No1 Yes2
No1 Yes2
No1 Yes2
No1 Yes2
The next questions will ask about organized physical activity from past two years. It is organized by the school's
calendar-year. Fall is from September-December, Spring is from Janurary to May, and Summer if from June-August
In the SPRING of 2014
what physical activities
did your child particiapte
in?
How many
days per
week?
Total
hours/minutes
per week Additional information
34
E.g. Tennis lessons 3 3hr 30mins Only for an 8-week period
In the FALL of 2013
what physical activities
did your child particiapte
in?
How many
days per
week?
Total
hours/minutes
per week Additional information
In the SUMMER of 2013
what physical activities
did your child particiapte
in?
How many
days per
week?
Total
hours/minutes
per week Additional information
Continued on next page…
35
In the SPRING of 2013
what physical activities
did your child particiapte
in?
How many
days per
week?
Total
hours/minutes
per week Additional information
In the FALL of 2012
what physical activities
did your child particiapte
in?
How many
days per
week?
Total
hours/minutes
per week Additional information
In the SUMMER of 2012
what physical activities
did your child particiapte
in?
How many
days per
week?
Total
hours/minutes
per week Additional information

36
In the SPRING of 2012
what physical activities
did your child particiapte
in?
How many
days per
week?
Total
hours/minutes
per week Additional information

37
APPENDIX B

38
39

40

41