the relationship between oil prices and exchange … · the relationship between oil prices and...
TRANSCRIPT

The Relationship between Oil Prices and Exchange Rates: Theory and Evidence
Independent Statistics & Analysis
www.eia.gov
U.S. Department of Energy
Washington, DC 20585
This paper is released to encourage discussion and critical comment. The analysis and conclusions expressed here
are those of the authors and not necessarily those of the U.S. Energy Information Administration.
Joscha Beckmann, Robert Czudaj, and Vipin Arora June 2017
WORKING PAPER SERIES

June 2017
Joscha Beckmann, Robert Czudaj and Vipin Arora | U.S. Energy Information Administration | This paper is released to encourage discussion and critical comment. The analysis and conclusions expressed here are those of the authors and not necessarily those of the U.S. Energy Information Administration
1
Table of Contents
Abstract ......................................................................................................................................................... 4
About the Authors ........................................................................................................................................ 5
1. Introduction .............................................................................................................................................. 6
2. Classifications and definitions ................................................................................................................... 8
3. Theoretical transmission mechanisms ...................................................................................................... 9
3.1 The impact of oil prices on exchange rates ....................................................................................... 9
3.2 The impact of exchange rates on oil prices ..................................................................................... 10
3.3 Common factors driving oil prices and exchange rates ................................................................... 11
4. Long-run in-sample evidence between exchange rates and oil prices ................................................... 13
4.1 General classification of empirical methods and data used ............................................................ 13
4.2 Empirical Results ................................................................................................................................... 16
4.2.1 Main empirical results .................................................................................................................. 16
4.2.2 Oil-importing countries, oil-exporting countries and sample choices.......................................... 16
4.2.3 Time-varying relationships ........................................................................................................... 17
5. Short-run in-sample evidence between exchange rates and oil prices .................................................. 19
5.1 Main empirical results ..................................................................................................................... 19
5.2 Time-varying relationships and evidence across different sample periods .................................... 20
5.3 Reconciling evidence and theory ..................................................................................................... 21
6. Out-of-sample evidence between exchange rates and oil prices .......................................................... 22
6.1 Classification of empirical methods ................................................................................................. 22
6.2 Main empirical results ..................................................................................................................... 22
6.2.1 Predictive power of oil prices for exchange rates .................................................................. 22
6.2.2 Predictive power of exchange rates for oil prices .................................................................. 23
8. Conclusion ............................................................................................................................................... 26
References .................................................................................................................................................. 28
Appendix ..................................................................................................................................................... 34

June 2017
Joscha Beckmann, Robert Czudaj and Vipin Arora | U.S. Energy Information Administration | This paper is released to encourage discussion and critical comment. The analysis and conclusions expressed here are those of the authors and not necessarily those of the U.S. Energy Information Administration
2
Tables
Table 1. Share of forecasting superiority of exchange rate models against univariate models ................. 24
Table A.1. Literature review ........................................................................................................................ 35

June 2017
Joscha Beckmann, Robert Czudaj and Vipin Arora | U.S. Energy Information Administration | This paper is released to encourage discussion and critical comment. The analysis and conclusions expressed here are those of the authors and not necessarily those of the U.S. Energy Information Administration
3
Figures
Figure 1. Oil price vs. major US dollar index ................................................................................................. 6
Figure 2. Oil price and exchange rate causalities .......................................................................................... 9
Figure 3. Wealth and portfolio channel ...................................................................................................... 10
Figure 4. Long-run vs. short-run dynamics ................................................................................................. 13
Figure 5. Empirical Methodologies ............................................................................................................. 14
Figure 6. Characteristics of Nonlinearities .................................................................................................. 18
Figure 7. Forecast evaluation ...................................................................................................................... 22
Figure 8. Oil price forecast with broad effective US dollar rate (h=1) ........................................................ 24

June 2017
Joscha Beckmann, Robert Czudaj and Vipin Arora | U.S. Energy Information Administration | This paper is released to encourage discussion and critical comment. The analysis and conclusions expressed here are those of the authors and not necessarily those of the U.S. Energy Information Administration
4
Abstract
This paper reviews existing theoretical and empirical research on the relationship between oil prices and
exchange rates. We start with theoretical transmission channels—which point to bi-directional causality.
Empirical research—focused on either explaining or forecasting one variable with the other—is classified
and shows that the evidence varies substantially depending on sample, country choice and empirical
method. Yet there are some common patterns: (i) strong links between exchange rates and oil prices are
frequently observed over the long-run; and (ii) either exchange rates or oil prices are a potentially useful
predictor of the other variable in the short-run, but the effects are strongly time-varying. We also
identify some important avenues for future research such as addressing time-varying predictability and
optimal sample choice for forecasting.
June 2017
Joscha Beckmann, Robert Czudaj and Vipin Arora | U.S. Energy Information Administration | This paper is released to encourage discussion and critical comment. The analysis and conclusions expressed here are those of the authors and not necessarily those of the U.S. Energy Information Administration
5
About the Authors
Joscha Beckman: Ruhr University of Bochum, Chair for International Economics, D-44801 Bochum, e-
mail: [email protected], and Kiel Institute for the World Economy, Hindenburgufer 66, 24105
Kiel.
Robert Czudaj: Chemnitz University of Technology, Chair for Empirical Economics, D-09126 Chemnitz, e-
mail: [email protected], phone: (0049)-371-531-31323, fax: (0049)-371-
531-831323.
Vipin Arora: US Energy Information Administration, 1000 Independence Ave, SW, Washington DC 20585, United States.

June 2017
Joscha Beckmann, Robert Czudaj and Vipin Arora | U.S. Energy Information Administration | This paper is released to encourage discussion and critical comment. The analysis and conclusions expressed here are those of the authors and not necessarily those of the U.S. Energy Information Administration
6
1. Introduction
Policymakers, academics and journalists have frequently discussed the link between oil prices and
exchange rates in recent years—particularly the idea that an appreciation of the US dollar triggers a dip
in oil prices. Empirical research is not so clear on the direction of causation, as there is evidence for bi-
directional causality. Some studies find that an increase in the real oil price actually results in a real
appreciation of the US dollar, while others show that a nominal appreciation of the US dollar triggers
decreases in the oil price. Figure 1 illustrates the link between the nominal West Texas Intermediate
(WTI) crude oil price and the US effective dollar exchange rate index relative to its main 7 trading
partners.
Figure 1. Oil price vs. major US dollar index
Source: own illustration, data taken from Federal Reserve Economic Data.
This paper takes a closer look at the research dealing with the relationship between oil prices and
exchange rates. After a brief review of theoretical transmission channels, we focus on a comprehensive
and critical evaluation of empirical studies surrounding this research area.
We identify four major issues that need to be addressed in order to classify the oil price/exchange rate
relationship. The first is to disentangle a backward (“in-sample”) and a forward looking (“out-of-
sample”) empirical analysis. As will be discussed later, the frequent finding that exchange rates and oil
prices move together over the long-run does not necessarily imply that one is useful when forecasting
the other. The second challenge is to disentangle direct and indirect transmission channels. Direct
channels are the influences either oil prices or exchange rates directly have on each other, whereas
indirect channels are mainly due to other macroeconomic or financial factors. The third major task is to
address the role of time-variation and nonlinearity. A final issue is related policy implications and open
research questions.

June 2017
Joscha Beckmann, Robert Czudaj and Vipin Arora | U.S. Energy Information Administration | This paper is released to encourage discussion and critical comment. The analysis and conclusions expressed here are those of the authors and not necessarily those of the U.S. Energy Information Administration
7
The rest of this paper is organized as follows. Section 3 briefly summarizes various theoretical transmission channels which link oil prices and exchange rates. Based on those considerations, Sections 4 and 5 focus on in-sample validity of the identified transmission channels by reviewing empirical evidence over the short-run and long-run. The question of predictability between oil prices and exchange rate is considered in Section 6. The final two sections focus on policy recommendations and conclusions.

June 2017
Joscha Beckmann, Robert Czudaj and Vipin Arora | U.S. Energy Information Administration | This paper is released to encourage discussion and critical comment. The analysis and conclusions expressed here are those of the authors and not necessarily those of the U.S. Energy Information Administration
8
2. Classifications and definitions
The distinction between real and nominal measures is important when assessing the relationship
between oil prices and exchange rates. The nominal spot exchange rate at a specific point in time 𝑠𝑡is
expressed as domestic currency per US dollar, implying that an increase reflects a nominal appreciation
of the US dollar,
𝑠𝑡= 𝑑𝑜𝑚𝑒𝑠𝑡𝑖𝑐 𝑐𝑢𝑟𝑟𝑒𝑛𝑐𝑦
𝑈𝑆 𝐷𝑜𝑙𝑙𝑎𝑟.
The real exchange rate (𝑞𝑡) also includes price indices for both countries, and reflects the basket of
domestic goods that can be purchased with one basket of US goods. This can be expressed as qt = stpt
pt∗,
where pt and pt∗ denote domestic and foreign (i.e. US) price levels, usually approximated through
consumer or producer prices. An increase is a real appreciation of the US dollar because the real
purchasing power of US goods increases. This definition corresponds to the real exchange rate in
external terms. Some studies consider the ratio between the prices of tradable and non-tradable goods;
this is called the real exchange rate in internal terms, and a relative increase in the price of tradable
goods corresponds to a real depreciation.1
The nominal oil price is usually measured in US dollars per barrel, as shown in Figure 1. The real oil price
is calculated by adjusting the nominal oil price for any changes in the US price level (usually based on the
US consumer price index (CPI)). Both nominal and real exchange rates can be expressed as a geometric
or arithmetic trade weighted index between multiple countries, rather than just between two countries
(so-called bi-lateral exchange rates). Such effective exchange rates reflect overall external
competiveness for an economy Instead of analyzing current or spot price dynamics, another alternative
is to focus on futures price dynamics, as these also reflect expectations. The futures price reflects the
price at a given point t for delivery at t+h.
1The real exchange rate in external terms can be expressed as qt = st
pt
pt∗, where pt and pt∗ denote domestic and foreign (i.e.
US) price levels, usually approximated through consumer or producer prices.

June 2017
Joscha Beckmann, Robert Czudaj and Vipin Arora | U.S. Energy Information Administration | This paper is released to encourage discussion and critical comment. The analysis and conclusions expressed here are those of the authors and not necessarily those of the U.S. Energy Information Administration
9
3. Theoretical transmission mechanisms
Before we turn to the empirical evidence, it is important to identify theoretical links between oil prices
and exchange rates. The various transmission channels are summarized in Figure 2.
The terms of trade channel mostly focuses on real oil prices and exchange rates, while the wealth and
portfolio channels propose an effect from the nominal exchange rate to the nominal oil price. The
expectations channel allows for nominal causalities in both directions.
Figure 2. Oil price and exchange rate causalities
Source: own illustration
3.1 The impact of oil prices on exchange rates The literature considers three direct transmission channels of oil prices to exchange rates: the terms of
trade channel, the wealth effect channel and the portfolio reallocation channel (Buetzer et al, 2016).
The terms of trade channel was introduced by Amano and van Norden (1998a, b). The underlying idea is
to link the price of oil to the price level which affects the real exchange rate (Bénassy-Quéré et al.,
2007). If the non-tradable sector of a country A is more energy intensive than the tradable one, the
output price of this sector will increase relative to the output price of country B. This implies that the
currency of country A experiences a real appreciation due to higher inflation (Chen and Chen, 2007;
Buetzer et al., 2016).
Effects on the nominal exchange rate arise if the price of tradable goods is no longer assumed to be
fixed. In this case, inflation and nominal exchange rate dynamics are related via purchasing power parity
(PPP). If the price of oil increases, we expect currencies of countries with large oil dependence in the
tradable sector to depreciate due to higher inflation. The response of the real exchange rate then
depends on how the nominal exchange rate changes, but relative to the impact of any changes in the
price of tradable (and non-tradable) goods described above. Overall, causality embedded in the terms of
trade channel potentially holds over different horizons depending on the adjustment of prices.

June 2017
Joscha Beckmann, Robert Czudaj and Vipin Arora | U.S. Energy Information Administration | This paper is released to encourage discussion and critical comment. The analysis and conclusions expressed here are those of the authors and not necessarily those of the U.S. Energy Information Administration
10
The underlying idea of the portfolio and wealth channel, introduced by Krugman (1983) and Golub (1983), is based on a three country framework and has been reconsidered by Bodenstein et al. (2011). The basic idea is that oil-exporting countries experience a wealth transfer if the oil price rises (Bénassy-Quéré et al., 2007). The wealth channel reflects the resulting short-run effect, while the portfolio channel assesses medium- and long-run impacts. When oil prices rise, wealth is transferred to oil-exporting countries (in US dollar terms) and is reflected as an improvement in exports and the current account balance in domestic currency terms. For this reason, we expect currencies of oil-exporting countries to appreciate and currencies of oil-importers to depreciate in effective terms after a rise in oil prices (Beckmann and Czudaj, 2013b). There is also the possibility that the US dollar appreciates in the short-run because of the wealth effect—if oil-exporting countries reinvest their revenues in US dollar assets.
The short- and medium-run effects on the US dollar relative to currencies of oil-exporters will depend on two factors according to the portfolio effect. The first is the dependence of the United States on oil-imports relative to the share of US exports to oil-producing countries. The second is oil exporters’ relative preferences for US dollar assets (Bénassy-Quéré et al., 2007; Coudert et al., 2008; Buetzer et al., 2016). Figure 3 summarizes the wealth and portfolio channels.
Figure 3. Wealth and portfolio channel
Source: own illustration
3.2 The impact of exchange rates on oil prices The theoretical starting point for causality from exchange rates to oil prices is the fact that the oil price is
denominated in US dollars. Abstracting from transaction costs, consider the following relationship
between the logarithms of the oil price denominated in a local currency (o_t) and the US dollar (o_t^*)
based on the law of one price
𝑜𝑡∗ = 𝑠𝑡 − 𝑜𝑡.
June 2017
Joscha Beckmann, Robert Czudaj and Vipin Arora | U.S. Energy Information Administration | This paper is released to encourage discussion and critical comment. The analysis and conclusions expressed here are those of the authors and not necessarily those of the U.S. Energy Information Administration
11
Following this equation, an appreciation of the US dollar increases the price of oil measured in terms of
the domestic currency, and this lowers demand for oil outside the US, resulting in a drop in the oil price,
all else equal (Bloomberg and Harris, 1995; Akram, 2009).
Effects on the supply side are potentially relevant but less frequently discussed, mainly because they are
subject to several other factors affecting price setting and production. Positive supply responses may
stem from a rise in the oil price due to a US dollar appreciation if drilling activity and/or production
capacity increases (Coudert et al., 2008). Oil-exporting companies or countries might also decide to
adjust oil prices or supply as a response to exchange rate changes depending on their price strategy
(Yousefi and Wirjanto, 2004).2
Effects on the supply side are potentially relevant but less frequently discussed, mainly because they are
subject to several other factors affecting price setting and production. Positive supply responses may
stem from a rise in the oil price due to a US dollar appreciation if drilling activity and/or production
capacity increases (Coudert et al., 2008). Oil-exporting companies or countries might also decide to
adjust oil prices or supply as a response to exchange rate changes depending on their price strategy
(Yousefi and Wirjanto, 2004).3 If market participants are aware of the underlying link outlined above, an
appreciation of the US dollar immediately triggers expectations of a decrease in the price of oil, and oil
futures might be considered a good hedge against an expected US dollar depreciation (Fratzscher at al.,
2014). If both exchange rates and oil prices are viewed as asset prices, the fact that both are jointly
determined in equilibrium complicates the identification of (one-sided) clear causality (Chen et al.,
2008). 4
3.3 Common factors driving oil prices and exchange rates Having already explained the role of inflation, Figure 2 incorporates other common factors including
GDP, interest rates, stock prices and uncertainty. A full analysis of all possible linkages and other
potential factors is beyond the scope of this paper, but a few important channels are worth mentioning.
GDP and interest rates both affect exchange rates and oil prices and are also interrelated: Monetary
policy reacts to GDP fluctuations5 while interest rate changes affect GDP through total investment and
total spending. An increase in GDP, all else equal, results in an increase in the oil price. Effects on
exchange rates are less clear for both interest and exchange rates. A relative increase in domestic
interest rates should for example depreciate the domestic currency according to uncovered interest rate
parity, but the empirical evidence has demonstrated that an appreciation is frequently observed
2 In the case of partial or full exchange rate pass-through, foreign oil-producers potentially increase the price of oil, or cut
supply, if the US dollar depreciates—and vice versa (Fratzscher et al., 2014). Following a pricing to market strategy they may
hold the oil price in US dollars fixed. 3 In the case of partial or full exchange rate pass-through, foreign oil-producers potentially increase the price of oil, or cut
supply, if the US dollar depreciates—and vice versa (Fratzscher et al., 2014). Following a pricing to market strategy they may
hold the oil price in US dollars fixed. 4 Whether or not the oil price should be considered a forward looking asset price is debated, but recent studies by Killian and
Vega (2011) and Fratzscher et al. (2014) provide evidence for the view that oil prices react to changes in other financial assets. 5 A central bank adjusts interest rates according to deviations of inflation and GDP from specific targets according to the Taylor
rule principle.

June 2017
Joscha Beckmann, Robert Czudaj and Vipin Arora | U.S. Energy Information Administration | This paper is released to encourage discussion and critical comment. The analysis and conclusions expressed here are those of the authors and not necessarily those of the U.S. Energy Information Administration
12
instead, reflecting the notorious forward premium puzzle.6 Another major influence on both the macroeconomic environment and exchange rate dynamics is the degree of uncertainty. A domestic appreciation of the exchange rate might result from uncertainty, if participants expect a currency to act as a safe haven (Beckmann and Czudaj, 2017).7
6 It is also worth mentioning that the intensity of the link between oil prices and exchange rates is of potential relevance for
monetary policymakers. A central bank which aims at price stability will react less to inflationary effects stemming from oil
prices which are at least partially offset by a change in domestic currency value. Central banks which adopt exchange rate
targeting will also take such linkages into account (Reboredo, 2012; Beckmann and Czudaj, 2013a). 7 A possible explanation is that market participants consider news about a weakening of the US economy to have even worse
effects for other countries (Fratzscher, 2009).

June 2017
Joscha Beckmann, Robert Czudaj and Vipin Arora | U.S. Energy Information Administration | This paper is released to encourage discussion and critical comment. The analysis and conclusions expressed here are those of the authors and not necessarily those of the U.S. Energy Information Administration
13
4. Long-run in-sample evidence between exchange rates and oil
prices
4.1 General classification of empirical methods and data used As mentioned in the introduction, in-sample estimates consider the historical relationship between the
price of oil and exchange rates, while out-of-sample analyses use information up to a point t to make
predictions about time t+h. The term “pseudo out-of-sample” corresponds to a situation where future
realizations are used as predictors. A crucial question that arises when studying historical relationships is
whether knowledge about the past is important when making predictions for the future. Empirical
questions usually address two different issues: The causality between oil prices and exchange rates,
and/or the intensity of the link between them.
Figure 4 provides a first distinction between long-run and short-run analysis. The underlying concept of
cointegration relies on the idea of a stable long-run equilibrium with short-run deviations above and
below it that are corrected over time. If exchange rates and oil prices share a long-run (cointegrating)
relationship, they (potentially) still deviate from this relationship in the short-run. The long-run
coefficient characterizes the intensity of the relationship between both variables. A related question is
which variable reacts to deviations from the long-run equilibrium. The so-called error correction
mechanism captures 1.) the speed with which deviations from a long-run equilibrium are corrected; and
2.) the variables responsible for such corrections.
Figure 4. Long-run vs. short-run dynamics
Source: own illustration
The classification of empirical evidence shown in Figure 5 also reflects the distinction between short-run
and long-run dynamics and provides a good guideline for the discussion of empirical results. The
classified methods all correspond to country-specific time series dynamics since such frameworks are
most frequently adopted. slower than countries such as India, where GDP is substantially
underestimated because of price differences.
June 2017
Joscha Beckmann, Robert Czudaj and Vipin Arora | U.S. Energy Information Administration | This paper is released to encourage discussion and critical comment. The analysis and conclusions expressed here are those of the authors and not necessarily those of the U.S. Energy Information Administration
14
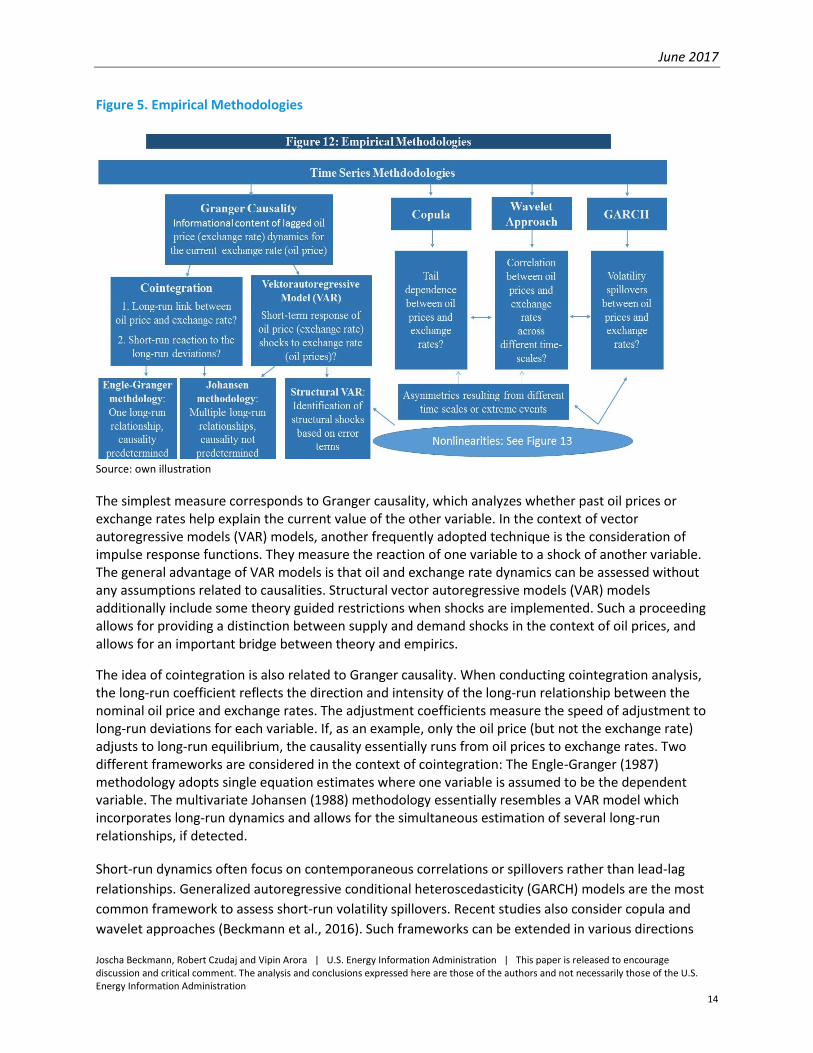
Figure 5. Empirical Methodologies
Source: own illustration
The simplest measure corresponds to Granger causality, which analyzes whether past oil prices or exchange rates help explain the current value of the other variable. In the context of vector autoregressive models (VAR) models, another frequently adopted technique is the consideration of impulse response functions. They measure the reaction of one variable to a shock of another variable. The general advantage of VAR models is that oil and exchange rate dynamics can be assessed without any assumptions related to causalities. Structural vector autoregressive models (VAR) models additionally include some theory guided restrictions when shocks are implemented. Such a proceeding allows for providing a distinction between supply and demand shocks in the context of oil prices, and allows for an important bridge between theory and empirics.
The idea of cointegration is also related to Granger causality. When conducting cointegration analysis, the long-run coefficient reflects the direction and intensity of the long-run relationship between the nominal oil price and exchange rates. The adjustment coefficients measure the speed of adjustment to long-run deviations for each variable. If, as an example, only the oil price (but not the exchange rate) adjusts to long-run equilibrium, the causality essentially runs from oil prices to exchange rates. Two different frameworks are considered in the context of cointegration: The Engle-Granger (1987) methodology adopts single equation estimates where one variable is assumed to be the dependent variable. The multivariate Johansen (1988) methodology essentially resembles a VAR model which incorporates long-run dynamics and allows for the simultaneous estimation of several long-run relationships, if detected.
Short-run dynamics often focus on contemporaneous correlations or spillovers rather than lead-lag
relationships. Generalized autoregressive conditional heteroscedasticity (GARCH) models are the most
common framework to assess short-run volatility spillovers. Recent studies also consider copula and
wavelet approaches (Beckmann et al., 2016). Such frameworks can be extended in various directions

June 2017
Joscha Beckmann, Robert Czudaj and Vipin Arora | U.S. Energy Information Administration | This paper is released to encourage discussion and critical comment. The analysis and conclusions expressed here are those of the authors and not necessarily those of the U.S. Energy Information Administration
15
based on assumptions related to the underlying kind of volatility. Copula frameworks assess and
compare relationships in turbulent and normal times by allowing for tail dependency, i.e. dependency in
the tails of both distributions. Wavelet approaches are adopted to compare dependencies between oil
price and exchange rates over different frequencies. The different scales are denominated 2i, where i
denotes the time frequency. The first frequency corresponds to changes between 21= 2 days, while the
second frequency corresponds to changes between 22= 4 days, with the same logic adopted for higher
frequencies. Essentially, both wavelet and copulas reflect specific forms of asymmetry or nonlinearity by
accounting for different relationships across frequencies (wavelet) or between normal and turbulent
times (copulas). Approaches which account for nonlinearities and different approaches for evaluating
forecasts will be discussed after the next section.

June 2017
Joscha Beckmann, Robert Czudaj and Vipin Arora | U.S. Energy Information Administration | This paper is released to encourage discussion and critical comment. The analysis and conclusions expressed here are those of the authors and not necessarily those of the U.S. Energy Information Administration
16
4.2 Empirical Results
4.2.1 Main empirical results The long-run relationship between the price of oil and exchange rates has been analyzed for several
countries in a range of studies. These cover various spans of data and use both effective and bilateral
exchange rates, as well as nominal and real oil prices.
The bottom line is that several studies have provided evidence for a long-run relationship between
exchange rates and oil. One type of study has focused on the link between the real oil price and real US
dollar exchange rates. Many authors have identified a long-run relationship between both, suggesting
that a real effective appreciation of the US dollar coincides with an increase in the real oil price over the
long-run (Amano and van Norden, 1998a; Coudert et al., 2008 and Bénassy-Quéré et al., 2007;
Beckmann and Czudaj; 2013b). Similar findings have been obtained for bilateral real exchange rates.
Clostermann and Schnatz (2000) establish a long-term link between the real US dollar-euro exchange
rate and the oil price, while Chaudhuri and Daniel (1998) assess real US dollar exchange rates for 16
OECD countries and detect a cointegrating relationship between most of them. Chen and Chen (2007)
use a panel of G7 countries and find that real oil prices have significantly contributed to real exchange
rate movements.
In line with the terms-of trade channel discussed in Section 2, most studies find that the price of oil
affects the exchange rate, but not vice versa. However, it is important to emphasize that the existence
of a long-term relationship does not necessarily imply strong linkages in the short-run. In the case of
linear models, the adjustment to restore disequilibria in many cases is estimated to be higher than 5
years, calling into question any practical relevance. There are also several studies which fail to establish
a cointegrating relationship between exchange rates and the price of oil.
4.2.2 Oil-importing countries, oil-exporting countries and sample choices The terms of trade channel discussed in Section 2 has inspired several authors to focus on effective
exchange rates of oil-importers and oil-exporters. The findings differ remarkably across studies and
countries. The link between nominal exchange rates and price differentials (reflecting the validity of
purchasing power parity (PPP), which constitutes a part of the terms of trade channel) is characterized
by several nonlinearities. PPP is more relevant over the long-run and in the case of high inflation
differentials (Taylor et al., 2001; Kilian and Taylor 2003; Sarno, 2005).
Habib and Kalamova (2007) do not find a long-run relationship between real effective exchange rates
and the oil price for Norway and Saudi Arabia, but report evidence for a long-run real appreciation in
Russia if the oil price rises. On the other hand, Al-Mulali (2010) provides evidence for a real effective
appreciation in the case of an increase in the real oil price. Camarero and Tamarit (2002) find that real
oil prices explain the real exchange rate for the Spanish peseta, while Huang and Guo (2007) show that
real oil price shocks imply an appreciation of the real exchange rate for China based on a structural VAR.
On the other hand, the findings of two recent studies clearly show that there is no unique link between
the real oil price and real effective exchange rates of oil-exporters and oil-importers. Buetzer et al.

June 2017
Joscha Beckmann, Robert Czudaj and Vipin Arora | U.S. Energy Information Administration | This paper is released to encourage discussion and critical comment. The analysis and conclusions expressed here are those of the authors and not necessarily those of the U.S. Energy Information Administration
17
(2016) identify various shocks to real oil prices in a structural VAR and find no systematic evidence that
the exchange rates of oil exporters appreciate against those of oil importers (for a set of 43 countries).
One explanation for the missing link is that countries with a higher oil surplus intervene in the foreign
exchange rate market to prevent appreciation pressures.
Beckmann and Czudaj (2013b) analyze a group of 10 economies and find that the results differ not only
between, but also within the group of oil-exporters and oil-importers. They find that changes in nominal
oil prices trigger real exchange rate effects through the nominal exchange rate and price differentials.
Nominal appreciation against the US dollar is mainly observed for oil-exporting countries, while nominal
depreciation is detected for importing and exporting countries. They also find reverse causality, in the
sense that nominal exchange rates influence nominal oil prices in some cases. The more general
evidence on commodity producing countries also suggests a strong link between real exchange rate
appreciations and an increase in commodity prices. Bodart et al. (2012) analyze 68 economies and find
that such an effect is observed if the dominant commodity accounts for at least 20 percent of total
exports. Overall, there is a clear evidence that sample selection affects empirical results, and offers an
explanation for the huge dispersion of empirical findings across studies which analyze causalities
between oil prices and exchange rates.
4.2.3 Time-varying relationships The previous section has illustrated that the empirical findings differ over time, suggesting that
instabilities are a key ingredient for understanding the oil price-exchange rate link.
Identifying and explaining structural changes represents a major economic and econometric task, and
has inspired several lines of research on the relationship between oil prices and exchange rates. Figure 6
summarizes different kinds of nonlinearities. The first possibility is that the relationship between the
price of oil and exchange rates changes at a specific point in time. Two different ideas for identifying
regime changes can be distinguished. One possibility is to identify a variable which is responsible for
such changes, for example a specific threshold of an observed variable.8 Such models are easy to handle
in terms of interpretation and are well-suited to capture the underlying dynamics if the data is primarily
generated by market forces (Balke and Fomby, 1997). However, if exogenous factors such as policy
interventions or abnormal global economic crises affect the data, a stochastic framework which does
not require a transition variable, such as a Markov-switching approach is better suited.
8 These effects can be formally derived in the context of international arbitrage costs (Taylor et al., 2001).

June 2017
Joscha Beckmann, Robert Czudaj and Vipin Arora | U.S. Energy Information Administration | This paper is released to encourage discussion and critical comment. The analysis and conclusions expressed here are those of the authors and not necessarily those of the U.S. Energy Information Administration
18
Figure 6. Characteristics of Nonlinearities
Source: own illustration
Several authors have adopted nonlinear frameworks when assessing the link between oil prices and
exchange rates. Akram (2004) introduced nonlinear dynamics into the literature on oil prices and
exchange rates. He identifies a nonlinear negative relationship between the value of the Norwegian
krone and crude oil prices based on a threshold model where the change of the oil price determines the
underlying dynamics. The intensity of the link depends on whether fluctuations are within or outside the
normal range, and whether oil prices are falling or rising. Allowing for nonlinearities is also important
when assessing a long-run relationship between oil prices and exchange rates. The finding by Zhang
(2013), that detecting a long-run relationship between the real oil price and the real effective exchange
depends on allowing for structural breaks, reflects the well-established fact that oil price and exchange
rate dynamics are subject to structural breaks. Beckmann and Czudaj (2013b) rely on a Markov-
switching vector error correction model (MS-VECM) and find that adjustment dynamics often differ
significantly between regimes. For most countries oil prices only adjust to long-run deviations in one of
the two regimes, while adjustment speed is often higher in one of the two regimes. Basher et al. (2016)
also apply a Markov-switching approach and identify exchange rate appreciation pressures in oil-
exporting economies after oil demand shocks, but find limited evidence that oil supply shocks display a
similar effect on exchange rates. As discussed above, wavelet and copula approaches also capture
nonlinear patterns in the short-run.

June 2017
Joscha Beckmann, Robert Czudaj and Vipin Arora | U.S. Energy Information Administration | This paper is released to encourage discussion and critical comment. The analysis and conclusions expressed here are those of the authors and not necessarily those of the U.S. Energy Information Administration
19
5. Short-run in-sample evidence between exchange rates and oil
prices
5.1 Main empirical results Many studies dealing with short-run dynamics between exchange rates and the price of oil point to a
causal chain from the US dollar exchange rate to the nominal oil price. Short-term studies analyze both
daily and monthly frequencies, and we begin by summarizing studies dealing with monthly data. The
first empirical study which related empirical oil price-exchange rate dynamics was provided by Trehan
(1986). He argues that the effect of oil price shocks on the US economy is likely to be exaggerated
because the oil price is denominated in US dollars and should not be considered as exogenous. Since
then, several authors have directly analyzed the effects of exchange rate changes on the price of oil.
Among other, Cheng (2008) finds an increase in the real (nominal) oil price as a response to a real
(nominal) effective US dollar appreciation.
Some studies have also focused on the response of oil demand and supply to exchange rate shocks.
Yousefi and Wirjanto (2004) analyze five OPEC countries and provide evidence that crude oil export
prices respond positively to US dollar depreciations. A recent study by De Schryder and Peersman (2016)
offers an interesting perspective on the link between exchange rates and the oil demand of oil importing
countries. They identify a significant decline in the oil demand of 65 oil-importing countries as a result of
an appreciation of the US dollar. Such demand effects are even stronger than exchange rate effects on
the global price of crude oil. This pattern can potentially be explained by stronger pass-through of
changes in the US dollar exchange rate to domestic end-user oil product prices.
There is also plenty of evidence based on structural VARs which focuses on causality in the other
direction, and distinguish between oil demand and supply shocks when analyzing exchange rate
responses. Basher et al. (2012) focus on emerging markets and provide evidence for short-run effects of
oil price shocks on exchange rates. The results of Basher et al. (2016), based on a similar methodology,
show that oil demand shocks have stronger effects on oil-exporter exchange rates as compared to oil
supply shocks.
A comprehensive study by Fratzscher et al. (2014) identifies bi-directional causality between the US
dollar and oil prices since the early 2000s. They focus on daily data between January 2001 and 2012 and
conclude that oil has become a global commodity whose price is driven not only by US-specific factors,
but also financial ones (in particular asset prices). For the sample period they also find that a 10%
increase in the price of oil leads to a depreciation of the US dollar effective exchange rate by
0.28%, while a 1% US dollar depreciation causes oil prices to rise by 0.73%.

June 2017
Joscha Beckmann, Robert Czudaj and Vipin Arora | U.S. Energy Information Administration | This paper is released to encourage discussion and critical comment. The analysis and conclusions expressed here are those of the authors and not necessarily those of the U.S. Energy Information Administration
20
Studies dealing with volatility spillovers also find evidence for bi-directional causality over recent years.
Several authors find evidence for causalities between the price of oil and different exchange rates.
Ghosh (2011) focuses on the periods from 2007 until 2008 and finds that oil price increases depreciate
the Indian rupee relative to the US dollar at a daily frequency. As discussed previously, possible
explanations for the sample and currency-dependent findings include common factors and
asymmetries.9 Cifarelli, G., and Paladino (2010) partly address the role of stock prices as a common
factor. He focuses on spillovers between oil prices, stock prices and US dollar exchange rates and finds
that oil price shifts are negatively related to exchange rate changes. Jiang (2016) analyzes 13 currencies,
4 of them at a daily frequency, and finds asymmetric correlations between oil prices and exchange
rates—with more consistent correlations in case of small fluctuations.
Several studies also find short-run effects of oil price changes on exchange rates by comparing different
frequencies. Benhmad (2012) conducts a wavelet analysis for real US dollar exchange rates and finds
causality from oil prices to exchange rates over higher frequencies. The results over larger horizons
point to bivariate causalities, but have potentially less explanatory power due to a smaller number of
observations. Bouoiyour et al. (2015) also finds causality from oil price changes to the real exchange rate
of Russia
5.2 Time-varying relationships and evidence across different sample periods There is plenty of evidence that the main drivers of oil price changes are subject to structural breaks and
can vary over time. Fan and Xu (2011) find that the price of oil has become more closely related to
macroeconomic fundamentals and financial markets over time. Their findings are based on a wavelet
approach that also suggests the link between US dollar exchange rates and oil has intensified over time.
Many recent studies also find that the relationship between exchange rates and the price of oil has
become more time-varying, in particular after 2009. An early study by Zhang (2008), which analyzes the
period between 2000 and 2005, finds a long-term equilibrium relationship between oil prices and
euro/US dollar exchange rates, but reports little evidence for risk or volatility spillovers. This is in
contrast to findings by Reboredo (2012) and Beckmann et al. (2016) which include the period after
September 2008. Both studies rely on copula models and find that the intensity of the relationship
between oil prices and US dollar exchange rates increased immediately after the onset of the financial
crisis, and is stronger during extreme events. Reboredo (2012) additionally finds that the linkages turn
out to be stronger for oil exporters. The findings by Beckmann et al. (2016) also point to relevance for
the wealth channel. They find that appreciations (depreciations) are positively correlated with an
increase in oil prices for oil exporters (oil importers).
Reboredo and Rivera-Castro (2013) adopt a wavelet approach and also identify a much stronger
relationship after the onset of the financial crisis. The results of Turhan et al. (2014), based on dynamic
conditional correlations, also finds that the correlation has increased and become strongly negative over
9 The study by Bal and Rath (2015) provides an example for the instability of empirical results. They identify statistically
significant bi-directional nonlinear Granger causality between the real effective exchange rates of India and China and the real
oil price. However, De Vita and Trachanas (2016) point to misspecifications in their study and come to different conclusions
based on the same dataset.
June 2017
Joscha Beckmann, Robert Czudaj and Vipin Arora | U.S. Energy Information Administration | This paper is released to encourage discussion and critical comment. The analysis and conclusions expressed here are those of the authors and not necessarily those of the U.S. Energy Information Administration
21
recent years. Jawadi et al. (2016) focus solely on the euro/US dollar exchange rate from 2014 and 2016,
and find significant volatility spillovers from the exchange rate to oil prices using intraday data.
5.3 Reconciling evidence and theory The various short-run linkages identified in empirical studies confirm the importance of both the
denomination and the portfolio channel. There is also a strong consensus that the link between higher
oil prices and US dollar depreciations has become stronger over recent years. While studies point to bi-
directional causality, exchange rate changes are more important for oil prices changes as compared to
the long-run. In the spirit of the denomination channel, these long-run studies often focus on effective
exchange rates, whereas short-run dynamics are mostly based on bilateral US dollar exchange rates.
Results also show difficulty in explaining empirical short-run patterns from a theoretical perspective. At
least the standard theoretical considerations don’t offer any direct explanation for dynamics identified
by wavelet and copula frameworks, for example, intensifying dynamics between oil prices and exchange
rates over time. Such changes are driven by factors which are exogenous in the different models.
Another important question that has not been fully analyzed in detail is the distinction between supply
and demand side effects. Such a distinction could contribute to a deeper understanding of transmission
channels between oil prices and exchange rates. The price setting behavior of oil suppliers and the
implications of exchange pass-through would also add to an understanding of potential exchange rate
effects on oil price dynamics.
Many studies that have established a time-varying relationship between oil prices and exchange rates
over time rely on copula or wavelet approaches. While both frameworks are quite useful and well-suited
to trace back such changes, they are rather descriptive and unable to establish causalities and/or
consider common factors. The underlying question of why the link between the price of oil and
exchange rates has become more time-varying has yet to be analyzed from either a theoretical or an
empirical perspective. Obvious candidates include the changing stance of monetary policy and the
financialization of commodity markets.
Another open issue is the role of policy announcements for oil price-exchange rate dynamics over recent years. There is plenty of evidence that exchange rates react to monetary policy announcements, in particular over the short-run. On the other hand, Kilian and Vega (2011) do not find evidence that energy prices (including oil prices) respond instantaneously to macroeconomic news.

June 2017
Joscha Beckmann, Robert Czudaj and Vipin Arora | U.S. Energy Information Administration | This paper is released to encourage discussion and critical comment. The analysis and conclusions expressed here are those of the authors and not necessarily those of the U.S. Energy Information Administration
22
6. Out-of-sample evidence between exchange rates and oil prices
6.1 Classification of empirical methods The evidence considered so far focuses on in-sample evidence and is not necessarily related to out-of-
sample predictability. The literature on forecasting oil prices based on exchange rates (or vice versa)
starts around 1973, after the breakdown of Bretton Woods. Prior to that point, nominal exchange rates
were fixed relative to the US dollar. As mentioned in Section 4.1, the literature on forecasting considers
statistical and economic criteria for evaluating forecasts.
Figure 6 summarizes the different possibilities for assessing forecasts.
Figure 7. Forecast evaluation
Source: own illustration
Statistical criteria usually compare the point prediction of a specific model to a simple benchmark. In
many cases the random walk without drift is considered to be the toughest benchmark. In such a
framework, the predicted change is zero, i.e. today’s value is considered to be the best predictor. There
are two alternative forecast evaluation methods which have attracted less attention in the literature on
oil prices and exchange rates. One is to focus on directional adequacy instead of analyzing point forecast
adequacy. Another perspective is based on the economic value of forecasts, and considers utility
measures based on dynamic asset allocation strategies.
6.2 Main empirical results
6.2.1 Predictive power of oil prices for exchange rates
The seminal work of Meese and Rogoff (1983)—showing that exchange rate models based on economic
fundamentals are unable to outperform a simple random walk forecast—still constitutes a benchmark
result in the international finance literature. The resulting exchange rate disconnect puzzle remains one
of the most important topics in international economics (Sarno, 2005). In general, the forecasting
performance of fundamental exchange rate models is highly sensitive to the selection of different
currencies, sample periods and forecast horizons (Rossi, 2013). Similar to the in-sample evidence,
country- and time-specific estimates should therefore be interpreted with caution.

June 2017
Joscha Beckmann, Robert Czudaj and Vipin Arora | U.S. Energy Information Administration | This paper is released to encourage discussion and critical comment. The analysis and conclusions expressed here are those of the authors and not necessarily those of the U.S. Energy Information Administration
23
Some papers have found evidence for improved exchange rate forecasts when including the price of oil.
Lizardo and Mollick (2010) imbed the real oil price into a simple form of the monetary model of
exchange rate determination and show that it improves exchange rate predictions for several bilateral
currencies. However, the overall evidence suggests that this is not a systematic finding, nor is it robust
to different time periods.
While one string of the literature has focused on oil-exporting currencies, other authors have turned
their attention to commodity exporters such as Canada, Chile, New Zealand and Australia. Ferraro et al.
(2015) argue that commodity prices predict commodity exporters' exchange rates at a daily frequency,
and this is not evident at quarterly or monthly frequencies. Kohlscheen et al. (2016) find that commodity
price models dominate random walk forecasts in the case of exchange rates. However, their findings are
obtained based on a “pseudo-out-of-sample” exercise where future values of commodity prices are
utilized. They point out that the evidence of out-of-sample predictability using only lagged predictors is
clearly weaker, as a result of the fact that commodity prices are hard to predict. A reasonable conclusion
is that the strong “pseudo-out-of-sample” findings are mostly driven by the correlation between
exchange rates and commodity prices.
Kohlscheen et al. (2016) also provide useful insights on the relationship between country specific
commodity price measures and oil prices. Indices for Colombia and Mexico, for instance, are highly
correlated with the price of oil (0.971), while commodity baskets of other countries such as Chile display
a much lower correlation with the oil price. This suggests that the literature on commodity prices should
be considered for a better understanding of exchange rate-oil price dynamics.
6.2.2 Predictive power of exchange rates for oil prices Before we turn to the existing literature, we analyze the potential of exchange rates for forecasting the price of oil out-of-sample by comparing two rolling window forecast models The first is a simple benchmark model and relies solely on information from the recent past (i.e. 40 observations) of the WTI crude oil price, while the second model also includes recent data on a US dollar exchange rate measure (the US effective dollar exchange rate broad index). We use both models to forecast the price of oil for four different horizons: one-month-ahead (h=1) and twelve-months-ahead (h=12). Figure 8 shows the corresponding results for h=1 and h=12 and reports the observed WTI crude oil price and the rolling window forecasts based on both models. The red dots reflect cases where the benchmark model is superior while the turquois dots represent the exchange rate model. The exchange rate model is better than the benchmark model over 50% of the time.

June 2017
Joscha Beckmann, Robert Czudaj and Vipin Arora | U.S. Energy Information Administration | This paper is released to encourage discussion and critical comment. The analysis and conclusions expressed here are those of the authors and not necessarily those of the U.S. Energy Information Administration
24
Figure 8. Oil price forecast with broad effective US dollar rate (h=1)
Source: own illustration, data taken from Federal Reserve Economic Data.
Table 1 summarizes results over the full sample for different forecasting horizons for the WTI oil price. 10
Table 1. Share of forecasting superiority of exchange rate models against univariate models
h=1 h=3 h=6 h=12
Broad index 0.7004219 0.559322 0.5479744 0.5723542
Major index 0.6561181 0.5635593 0.5714286 0.5226782
The results look encouraging at first sight, and confirm the general result that exchange rates are more
useful for forecasting oil prices over the short-run. The percentage of periods where effective exchange
rate dynamics add information, as opposed to relying solely on past oil prices, does not exceed 60% over
3, 6 and 12 months—while results are more favorable over the short-run. These patterns are confirmed
for common exchange rate expectation dynamics and the Australian dollar, where the percentage is
close to 75% for a shorter sample starting in 1995.
It is important to highlight that even these findings do not necessarily imply that exchange rate
dynamics are useful for oil price predictions for a number of reasons. In terms of absolute differences,
the exchange rate model does not outperform the simpler model by a large amount, while the simpler
model in many cases outperforms the exchange rate model substantially. An example is the case where
the simple model correctly proposes a constant oil price while the exchange rate model predicts
changes which do not materialize.
10 We have also performed the same exercise using either the Australian dollar exchange rate (as a commodity currency), a
common factor across exchange rate expectations over the next month and the effective exchange rate of the US dollar against
major currencies.

June 2017
Joscha Beckmann, Robert Czudaj and Vipin Arora | U.S. Energy Information Administration | This paper is released to encourage discussion and critical comment. The analysis and conclusions expressed here are those of the authors and not necessarily those of the U.S. Energy Information Administration
25
Taking these findings into account, it is not surprising that there is little systematic evidence that
exchange rates are directly useful for oil price predictions. Baumeister et al. (2015) show within a mixed
frequency approach that high-frequency financial data are hardly helpful in forecasting the monthly real
price of oil. The survey by Alquist et al. (2011) provides a comprehensive overview on predictability of
nominal or real oil prices based on macroeconomic aggregates. They conclude that neither short-term
interest rates nor trade-weighted exchange rates have significant predictive power for the nominal price
of oil in terms of point forecasts. However, they also argue that specific bilateral exchange rates might
still be useful. They find that the Australian exchange rate has significant predictive power for the sign of
the change in nominal oil prices over specific horizons.
Alquist et al. (2011) draw an important link to the study of Chen et al. (2010), which shows that
exchange rates of commodity exporters ("commodity currencies") are helpful in forecasting country
specific or aggregate commodity prices.11 Their findings hold for Australia, Canada, Chile, New Zealand
and South Africa where oil is not the primary exported commodity. Alquist et al. (2011) point to the
strong link between other commodities and the price of oil, and argue that the predictive power of a
commodity exporter’s US dollar exchange rate might turn out be useful for oil price predictions via
commodity prices. A related study by Groen and Pesenti (2011) analyzes a broad range of commodity
prices and finds that exchange rates might be useful, but are not systematically more accurate
predictors than simple benchmarks. Drachal (2016) addresses time variation in predictability by
adopting a Dynamic Model Averaging framework for predicting the spot price of oil. He finds exchange
rates to be important predictors between 1995 and 2000 and after 2005, while their relative importance
diminishes between 2000 and 2005.
From an econometric perspective, the considerations so far have illustrated the issue of parameter and
model uncertainty. On the one hand, all possible combinations of K potential explanatory variables for
forecasting oil price or exchange rates result in 2^K different model specifications. In addition,
coefficients of each model are subject to structural changes. A more common approach is to use
Bayesian model averaging (BMA), which updates model weights and coefficient changes within a
recursive learning scheme. These techniques are becoming more popular, and are increasingly used in
the context of oil price and exchange rate predictions. Wright (2008), Della Corte et al. (2009) and
Beckmann and Schüssler (2016) all adopt model averaging techniques in the context of exchange rate
forecasting. When focusing on adequate oil price forecasts, Baumeister et al. (2014) and Baumeister and
Kilian (2015) provide real-time out-of-sample evidence that the combination of forecasting models with
equal weights dominates the approach of selecting one model and using it for all forecast horizons.
11 Chen et al. (2014) find these results to be robust after the onset of the financial crisis.

June 2017
Joscha Beckmann, Robert Czudaj and Vipin Arora | U.S. Energy Information Administration | This paper is released to encourage discussion and critical comment. The analysis and conclusions expressed here are those of the authors and not necessarily those of the U.S. Energy Information Administration
26
8. Conclusion
This paper has addressed and summarized existing research on the link between oil prices and exchange
rates. We have started by identifying different transmission channels which provide simple theoretical
underpinnings of the relationship between exchange rates and the price of oil.
The empirical evidence is strongly time-varying and suggests that past relationships do not necessarily
hold in the future, and the link between in-sample and out-of-sample is often rather weak. A model
which successfully explains past oil price changes based on exchange rates is not necessarily useful for
forecasting the price of oil in the next period. This complicates the task of selecting an adequate
forecasting model and constitutes an important research question.
There is strong evidence that oil prices and exchange rates are related over the long-run. There is also a
fair amount of evidence for various short-run linkages and spillovers between both markets at daily and
monthly frequencies. The inverse causality from US dollar depreciations to increases in the price of oil
often materializes at a daily frequency or over a few months.
A fair conclusion is that exchange rate movements are not a silver bullet for understanding or
forecasting the price of oil—and vice versa—and neither is a substitute for supply or demand factors.
However, each contains potentially useful information for forecasting the other and should be taken
into account, particularly over the short-run. The oil price-exchange rate relationship is evolving over
time and has recently become more volatile. The change in monetary policy and the financialization of
commodity markets offer potential explanations for the intensified relationship. It remains to be seen
whether the intensity of the link is affected by the proposed exit of unconventional monetary policy.
From a policy perspective, an important question besides assessing flexible exchange rates is whether
oil-exporting or oil-importing countries should be in favor of fixed or flexible exchange rate
arrangements.12
Finally, we have identified a number of important open questions. Addressing time-varying predictability
and sample choices is quite important since both exchange rates and oil prices are hard to predict.
Several techniques to tackle the time-varying importance of one for forecasting the other have been
discussed briefly. Relying on a data rich environment in a flexible econometric framework potentially
addresses these issues but the rich toolset makes it difficult to identify one single framework. The idea
of averaging across models and discounting past information in a Bayesian framework is very appealing
and should be considered against various benchmarks. Factor models offer an alternative possibility for
12 Commodity exporters are usually strongly affected by fluctuations in global markets. Dutch Disease corresponds to a
situation where increasing prices of key exported goods lead to an appreciation of the domestic currency, and the stronger
currency harms international competitiveness, negatively affecting other export sectors (Bodart et al., 2012). Fixed exchange
rate arrangements are sometimes seen as beneficial in this regard since they prevent such depreciations and stabilize export
revenues. However, the recent episode of falling oil prices has revitalized this discussion because fixed exchange rates also do
not allow for domestic depreciations in the reverse scenario.

June 2017
Joscha Beckmann, Robert Czudaj and Vipin Arora | U.S. Energy Information Administration | This paper is released to encourage discussion and critical comment. The analysis and conclusions expressed here are those of the authors and not necessarily those of the U.S. Energy Information Administration
27
dealing with rich datasets. A first important avenue for future research is an extension of the study by
Alquist et al. (2011). Considering that their sample ends in 2009, the argument that commodity
exporter’s exchange rates might be useful for oil price predictions deserves further attention over more
recent periods.
Disentangling oil supply and demand factors is also quite important since most studies analyze the
relationship between the oil price and exchange rate without separating oil demand and supply factors.
Such a distinction is of great importance for a theoretical underpinning of the transmission channels
from exchange rates to oil prices. The understanding of the exchange-rate pass-through of oil exporters
potentially explains the time-varying ties between exchange rates and oil prices. Related to the issue of
supply and demand, it also seems quite important to address the role of common factors, such as
monetary policy drivers. At a minimum one should include these factors in an empirical investigation,
while the optimal solution is an evaluation of potential indirect transmission channels. Policy
announcements have already been identified as a potential driver of exchange rate volatility (Conrad
and Lamla, 2010) and exchange rate expectations (Beckmann and Czudaj, 2016), while there has been
much less written about their effect on oil prices. Finally, a critical evaluation of the economic value of
predictions in a multivariate setup, for example in the spirit of Della Corte, Sarno and Tsiakas (2009),
offers an interesting research avenue. Such an exercise potentially sheds some light on the question of
whether exchange rates are a useful predictor for oil prices.

June 2017
Joscha Beckmann, Robert Czudaj and Vipin Arora | U.S. Energy Information Administration | This paper is released to encourage discussion and critical comment. The analysis and conclusions expressed here are those of the authors and not necessarily those of the U.S. Energy Information Administration
28
References
Al-Mulali, U. (2010). The Impact of Oil Prices on the Exchange Rate and Economic Growth in Norway.
MRPA Paper No. 26257, University Library of Munich, Germany.
Alquist, R., Kilian, L., and Vigfusson, Robert J. (2011). Forecasting the Price of Oil. International Finance
Discussion Paper No. 1022, Board of Governors of the Federal Reserve System.
Amano, R. A., and Van Norden, S. (1998a). Oil prices and the rise and fall of the US real exchange rate.
Journal of International Money and Finance, 17(2), 299-316.
Amano, R. A., and Van Norden, S. (1998b). Exchange rates and oil prices. Review of International
Economics, 6(4), 683-694.
Akram, Q. F. (2004). Oil prices and exchange rates: Norwegian evidence. Econometrics Journal, 7, 476–
504.
Akram, Q. F. (2009). Commodity prices, interest rates and the dollar. Energy Economics, 31(6), 838-851.
Bacchetta, P., and Van Wincoop, E. (2004). A scapegoat model of exchange-rate fluctuations. American
Economic Review, 94(2), 114-118.
Bal, D. P., and Rath, B. N. (2015). Nonlinear causality between crude oil price and exchange rate: a
comparative study of China and India. Energy Economics, 51, 149–156.
Balke, N. S., and Fomby, T. B. (1997). Threshold Cointegration. International Economic Review, 38(3), 627-
645.
Basher, S. A., Haug, A. A., and Sadorsky, P. (2016). The impact of oil shocks on exchange rates: A Markov-
switching approach. Energy Economics, 54, 11-23.
Baumeister, C., Guérin, P., and Kilian, L. (2015). Do high-frequency financial data help forecast oil prices?
The MIDAS Touch at Work. International Journal of Forecasting, 31(2), 238-252.
Baumeister, C., Kilian, L., and Lee, T. K. (2014). Are there gains from pooling real-time oil price forecasts?
Energy Economics, 46, 33-43.
Baumeister, C., and Kilian, L. (2015). Forecasting the real price of oil in a changing world: A forecast
combination approach. Journal of Business & Economic Statistics, 33(3), 338-351.

June 2017
Joscha Beckmann, Robert Czudaj and Vipin Arora | U.S. Energy Information Administration | This paper is released to encourage discussion and critical comment. The analysis and conclusions expressed here are those of the authors and not necessarily those of the U.S. Energy Information Administration
29
Beckmann, J., and Czudaj, R. (2013a). Oil prices and effective dollar exchange rates. International Review
of Economics & Finance, 27(1), 621-636.
Beckmann, J., and Czudaj, R. (2013b). Is there a homogeneous causality pattern between oil prices and
currencies of oil importers and exporters? Energy Economics, 40(1), 665-678.
Beckmann, J., Berger, T., and Czudaj, R. (2016). Oil price and FX-rates dependency. Quantitative Finance,
16(3), 477-488.
Beckmann, J., and Czudaj, R. (2017). Exchange rate expectations and economic policy uncertainty.
European Journal of Political Economy, forthcoming.
Beckmann, J., and Schüssler, R. (2016). Forecasting exchange rates under parameter and model
uncertainty. Journal of International Money and Finance, 60, 267-288.
Benhmad, F. (2012). Modeling nonlinear Granger causality between the oil price and U.S. dollar: A wavelet
based approach. Economic Modelling, 29(4), 1505-1514.
Bénassy-Quéré, A., Mignon, V., and Penot, A. (2007). China and the relationship between the oil price and
the dollar. Energy Policy, 35(11), 5795-5805.
Bloomberg, S. B., and Harris, E. S. (1995). The commodity–consumer price connection: Fact or fable?
Federal Reserve Board of New York. Economic Policy Review, 21-38.
Bodart, V., Candelon, B., and Carpantier, J.-F. (2012). Real exchanges rates in commodity producing
countries: A reappraisal. Journal of International Money and Finance, 31(6), 1482-1502.
Bodenstein, M., Erceg, C. J., and Guerrieri, L. (2011). Oil Shocks and external adjustment. Journal of
International Economics, 83(2), 168-184.
Bouoiyour, J., Selmi, R., Tiwari, A. K., and Shahbaz, M. (2015). The nexus between oil price and Russia's
real exchange rate: Better paths via unconditional vs conditional analysis. Energy Economics, 51,
54–66.
Buetzer, S., Habib, M. M., and Stracca, L. (2016). Global exchange rate configurations: Do oil shocks
matter? IMF Economic Review, 64(3), 443-470.

June 2017
Joscha Beckmann, Robert Czudaj and Vipin Arora | U.S. Energy Information Administration | This paper is released to encourage discussion and critical comment. The analysis and conclusions expressed here are those of the authors and not necessarily those of the U.S. Energy Information Administration
30
Camarero, M., and Tamarit, C. (2002). A panel cointegration approach to the estimation of the peseta real
exchange rate. Journal of Macroeconomics, 24(3), 371-393.
Chaudhuri, K., and Daniel, B. C. (1998). Long-run equilibrium real exchange rates and oil prices. Economics
Letters, 58(2), 231-238.
Chen, S.-S., and Chen, H.-C. (2007). Oil prices and real exchange rates. Energy Economics, 29(3), 390-404.
Chen, Y.-C., Rogoff, K. S., and Rossi, B. (2010). Can Exchange Rates Forecast Commodity Prices? Quarterly
Journal of Economics, 125(3), 1145-1194.
Cheng, K. C. (2008). Dollar depreciation and commodity prices. IMF, World Economic Outlook, April, 48–
50.
Cifarelli, G., and Paladino, G. (2010). Oil price dynamics and speculation: A multivariate financial
approach. Energy Economics, 32(2), 363-372.
Clostermann, J., and Schnatz, B. (2000). The determinants of the euro-dollar exchange rate. Synthetic
fundamentals and a non-existing currency. Konjunkturpolitik, Applied Economics Quarterly, 46, 207-
230.
Conrad, C., and Lamla, M. J. (2010). The high-frequency response of the EUR-USD exchange rate to ECB
Communication. Journal of Money, Credit and Banking, 42, 1391–1417.
Coudert, V., Mignon, V., and Penot, A. (2008). Oil price and the dollar. Energy Studies Review, 15(2), 45-
58.
De Vita, G., and Trachanas, E. (2016). Nonlinear causality between crude oil price and exchange rate: A
comparative study of China and India’ — A failed replication (negative Type 1 and Type 2). Energy
Economics, 56(C), 150-160.
Della Corte, P., Sarno, L., and Tsiakas, I. (2009). An economic evaluation of empirical exchange rate models.
Review of Financial Studies, 22(9), 3491-3530.
De Schryder, S., and Peersman, G. (2015). The U.S. dollar exchange rate and the demand for oil. Energy
Journal, 36(3), 263-285.
Drachal, K. (2016). Forecasting spot oil price in a dynamic model averaging framework -

June 2017
Joscha Beckmann, Robert Czudaj and Vipin Arora | U.S. Energy Information Administration | This paper is released to encourage discussion and critical comment. The analysis and conclusions expressed here are those of the authors and not necessarily those of the U.S. Energy Information Administration
31
Have the determinants changed over time? Energy Economics, 60, 35-46.
Engel, C., and West, K. D. (2005). Exchange rates and fundamentals. Journal of Political Economy, 113,
485-517.
Engle, R. F., and Granger, C. W. J. (1987). Cointegration and error correction: Representation, estimation
and testing. Econometrica, 55, 251-276.
Fan, Y., and Xu, J.-H. (2011). What has driven prices since 2000? A structural change perspective. Energy
Economics, 33(6), 1082-1094.
Ferraro, D., Rogoff, K., and Rossi, B. (2015). Can oil prices forecast exchange rates? An empirical analysis
of the relationship between commodity prices and exchange rates. Journal of International Money
and Finance, 54, 116-141.
Fratzscher, M. (2009). What explains global exchange rate movements during the financial crisis? Journal
of International Money and Finance, 28, 1390-1407.
Fratzscher, M., Schneider, D., and Van Robays, I. (2014). Oil prices, exchange rates and asset prices.
Working Paper Series No 1689, European Central Bank.
Golub, S. (1983). Oil prices and exchange rates. The Economic Journal, 93(371), 576-593.
Ghosh, S. (2011). Examining crude oil price – Exchange rate nexus for India during the period of extreme
oil price volatility. Applied Energy, 88(5), 1886–1889.
Groen, J. J., and Pesenti, P. A. (2011). Commodity prices, commodity currencies, and global economic
developments. Commodity Prices and Markets, East Asia Seminar on Economics, 20, 15-42,
University of Chicago Press.
Habib M. M., and Kalamova M. (2007). Are there oil currencies? The real exchange rate of oil exporting
countries. European Central Bank Working Paper Series No 839.
Huang, Y., and Guo, F. (2007). The role of oil price shocks on China's real exchange rate. China Economic
Review, 18(4), 403-416.
Jawadi, F., Louhichi, W., Ameur, H. B., and Cheffou, A. I. (2016). On oil-US exchange rate volatility
relationships: An intraday analysis. Economic Modelling, 59(C), 329-334.

June 2017
Joscha Beckmann, Robert Czudaj and Vipin Arora | U.S. Energy Information Administration | This paper is released to encourage discussion and critical comment. The analysis and conclusions expressed here are those of the authors and not necessarily those of the U.S. Energy Information Administration
32
Jiang, J., and Gu, R. (2016). Asymmetrical long-run dependence between oil price and US dollar exchange
rate—Based on structural oil shocks. Physica A: Statistical Mechanics and its Applications, 456(C),
75-89.
Johansen, S. (1988). Statistical analysis of cointegration vectors. Journal of Economic Dynamics and
Control, 12, 231-254.
Kilian, L., and Taylor, M. (2003). Why is it so difficult to beat the random walk forecast of exchange rates?
Journal of International Economics, 60(1), 85-107.
Kilian, L., and Vega, C. (2011). Do energy prices respond to U.S. macroeconomic news? A test of the
hypothesis of predetermined energy prices. Review of Economics and Statistics, 93(2), 660-671.
Kohlscheen, E., Avalos, F. H., and Schrimpf, A. (2016). When the walk is not random: commodity prices
and exchange rates. BIS Working Papers No 551.
Krugman, P. (1983). Oil and the dollar. In B. Jagdeeps, & P. Bulfordh (Eds.), Economic interdependence
and flexible exchange rates. Cambridge, MA: MIT Press.
Lizardo, R. A., and Mollick, A. V. (2010). Oil price fluctuations and U.S. dollar exchange rates. Energy
Economics, 32(2), 399-408.
Meese, R. A., and Rogoff, K. (1983). Empirical exchange rate models of the seventies: Do they fit out of
sample? Journal of International Economics, 14(1-2), 3-24.
Reboredo, J. C. (2012). Modelling oil price and exchange rate co-movements. Journal of Policy Modeling,
34(3), 419-440.
Reboredo, J., and Rivera-Castro, M. A. (2013). A wavelet decomposition approach to crude oil price and
exchange rate dependence, Economic Modelling, 32 (C), 42-57.
Rossi, B. (2012). The changing relationship between commodity prices and equity prices in commodity
exporting. Economics Working Papers 1405, Department of Economics and Business, ICREA-
Universitat Pompeu Fabra.
Rossi, B. (2013). Exchange rate predictability. Journal of Economic Literature, 51(4), 1063-1119.

June 2017
Joscha Beckmann, Robert Czudaj and Vipin Arora | U.S. Energy Information Administration | This paper is released to encourage discussion and critical comment. The analysis and conclusions expressed here are those of the authors and not necessarily those of the U.S. Energy Information Administration
33
Sarno, L. (2005). Towards a solution to the puzzles in exchange rate economics: Where Do We Stand?
Working Papers 05-11, Warwick Business School, Finance Group.
Taylor, M. P., Peel, D. A., and Sarno, L. (2001). Nonlinear mean-reversion adjustment in real exchange
rates: towards a solution to the purchasing power parity puzzles. International Economic Reviews,
42(4), 1015–1042.
Trehan, B. (1986). Oil prices, exchange rate and the US economy. Economic Review, 4, 3-21.
Turhan, M. I., Sensoy, A., and Hacihasanoglu, E. (2014). A comparative analysis of the dynamic relationship
between oil prices and exchange rates. Journal of International Financial Markets, Institutions and
Money, 32(C), 397-414.
Yousefi, A., and Wirjanto, T. S. (2004). The empirical role of the exchange rate on the crude-oil price
formation. Energy Economics, 26(5), 783-799.
Wright, J. (2008). Bayesian Model Averaging and exchange rate forecasts. Journal of Econometrics, 146(2),
329-341.
Zhang, Y.-J., Fan, Y., Tsai, H.-T., and Wei, Y.-M. (2008). Spillover effect of US dollar exchange rate on oil
prices. Journal of Policy Modeling, 30(6), 973-991.
Zhang, Y.-J. (2013). The Links between the Price of Oil and the Value of US Dollar. International Journal
of Energy Economics and Policy, 3(4), 2013, 341-351.
June 2017
Joscha Beckmann, Robert Czudaj and Vipin Arora | U.S. Energy Information Administration | This paper is released to encourage discussion and critical comment. The analysis and conclusions expressed here are those of the authors and not necessarily those of the U.S. Energy Information Administration
34
Appendix

June 2017
Joscha Beckmann, Robert Czudaj and Vipin Arora | U.S. Energy Information Administration | This paper is released to encourage discussion and critical comment. The analysis and conclusions expressed here are those of the authors and not necessarily those of the U.S. Energy Information Administration
35
Table A.1. Literature review
Author / Year / Journal Year Methodology Variables Included Countries
In-sample / out-of
sample Result / Causality
Ahmad and Hernandez
(2013); Journal of
International Financial
Markets, Institutions &
Money
2013 TAR (threshold
autoregressive) and M-TAR
(momentum threshold
autoregressive)
Real oil prices, real
exchange rates, oil price:
WTI and average of WTI,
Brent and Dubai.
Fifteen largest oil
producers and
largest oil
consumers in the
world (excluding
de facto fixed
regimes): Brazil,
Canada, Eurozone,
India, Iran, Japan,
South Korea,
Mexico, Nigeria,
Norway, UK,
Venezuela
1970:01–2012:01
(monthly data)
Evidence for
cointegration in six of the
twelve countries studied
and additional
asymmetric adjustment in
four countries of which
Brazil, Nigeria and the
UK show higher
adjustment after a
positive shock than after
a negative shock. Real
exchange rate
appreciation following a
rise in the real oil prices
is eliminated faster than a
depreciation following a
fall in the real oil prices.
(Opposite for the
Eurozone)

June 2017
Joscha Beckmann, Robert Czudaj and Vipin Arora | U.S. Energy Information Administration | This paper is released to encourage discussion and critical comment. The analysis and conclusions expressed here are those of the authors and not necessarily those of the U.S. Energy Information Administration
36
Table A.1. Literature review (cont.)
Author / Year / Journal Year Methodology Variables Included Countries
In-sample / out-of
sample Result / Causality
Akram; Econometrics
Journal (2004)
2004 Non-linear econometric
model - framework of Ozkan
and Sutherland (1998),
equilibrium correction model
(EqCMs)
krone/ECU exchange rate
index, oil price
Norway 1.1.1986 – 12.8.1998
(daily)
Strong evidence for a
non-linear negative
relationship between the
value of the Norwegian
krone and crude oil prices
(change in oil prices has a
strong impact
on the exchange rate
when oil prices are
particularly low, i.e.
below 14 USD)
Non-linear model
outperforms the
random walk model in
out-of-sample forecasting
of the exchange rate over
a period of 12 quarters
The out-of sample:
1998:1 to 2000:4
Alquist et al. (2011) 2011 Comparison of different
models (AR, ARMA, VAR,
nonparametric models)
WTI crude oil price, oil
futures, US refiners’
acquisition costs, US Real
GDP
USA Out-of-sample:
1973:1 – 2009:12
The paper provides a vast
overview on oil price
forecasting addressing a
wide range of different
issues.

June 2017
Joscha Beckmann, Robert Czudaj and Vipin Arora | U.S. Energy Information Administration | This paper is released to encourage discussion and critical comment. The analysis and conclusions expressed here are those of the authors and not necessarily those of the U.S. Energy Information Administration
37
Table A.1. Literature review (cont.)
Author / Year / Journal Year Methodology Variables Included Countries
In-sample / out-of
sample Result / Causality
Altarturi et al. (2016);
International Journal of
Energy Economics and Policy
2016 Wavelet coherency e.g.
CWT),
WTI crude oil price,
exchange rate: log nominal
effective OPEC currencies
to USD)
OPEC 1999:02 – 2016:03
(daily data)
Countries with currencies
pegged
to USD are lagging
against oil price changes,
while countries with
a floating exchange rate
and countries with
undisclosed weighted
basket of international
currencies lead changes
in oil price.
Amano, van Norden (1998);
Review of International
Economics
1998 Johansen-Juselius
cointegration test,
Phillips and Hansen´s fully
modified least-squares
estimator (FMLS)
Morgan Guaranty 15-
country real effective
exchange rate.
Domestic price of oil (US
price of West Texas
intermediate crude oil price
index)
Germany, Japan,
United States
In-Sample (s. S&C)
1973:01 – 1993:06
(monthly)
Rise in oil prices by 10%
causes deprecation of
Mark (0.9%) and Yen
(1.7%) and an
appreciation of USD
(2.6%).
Meese and Rogoff
Methodology
Out-of-sample
(updated Data to
March 1995, using
Meese and Rogoff´s
methodology to
forecast, beginning
1985)
Forecast based on oil
prices perform better than
random walk.

June 2017
Joscha Beckmann, Robert Czudaj and Vipin Arora | U.S. Energy Information Administration | This paper is released to encourage discussion and critical comment. The analysis and conclusions expressed here are those of the authors and not necessarily those of the U.S. Energy Information Administration
38
Table A.1. Literature review (cont.)
Author / Year / Journal Year Methodology Variables Included Countries
In-sample / out-of
sample Result / Causality
Amano, van Norden (1998);
Journal of International
Money and Finance
1998 Johansen-Juselius
cointegration test,
Single-equation error-
correction model (ECM)
Real effective (i.e. trade-
weighted) value of the US
Dollar and US real price of
oil (s.a.)
US In sample: 1972:2 –
1993:01 (monthly)
Stabil long run link
between oil prices and the
US real effective
exchange rate. Price of
oil Granger-causes the
exchange rate and not
vice versa. (Higher prices
leads to appreciation)
Out-of-sample:
1985:12 – 1993:01
Single-equation has
significant ability to
predict EX changes out-
of-sample.
Bal, Rath (2015); Energy
Economics
See also: De Vita, Trachanas
(2016).
2015 Hiemstra and Jones (1994)
nonlinear Granger causality
test to the VAR residuals
GARCH (1,1): robustness
check
Real effective exchange
rate (REER) of China
(RXC) and India (RIX),
Crude oil price (real terms
and deflated by US CPI)
India, China 1994:01 – 2013:04
(monthly data)
Oil price do not linear
Granger cause EXR (both
countries).
Significant bi-directional
nonlinear Granger
causality: lagged
information from oil
price influences the EXR
and vice versa (India).
China: EXR causes oil
price (nonlinear and
unidirectional).

June 2017
Joscha Beckmann, Robert Czudaj and Vipin Arora | U.S. Energy Information Administration | This paper is released to encourage discussion and critical comment. The analysis and conclusions expressed here are those of the authors and not necessarily those of the U.S. Energy Information Administration
39
Table A.1. Literature review (cont.)
Author / Year / Journal Year Methodology Variables Included Countries
In-sample / out-of
sample Result / Causality
Basher, Haug and Sadorsky.
(2012); Energy Economics
2012 Structural VAR model Global oil production, oil
prices (WTI), global real
economic activity (index),
EXR, MSCI emerging
stock market index,
interest rates (TED
spread). Dummy (1) to
capture Asian financial
crises (Sept. 1998).
Emerging markets 1988:01 – 2008:12
(Monthly data)
EXR respond to
movements in oil prices
(short run). Positive oil
price shock leads to a
drop in trade-weighted
exchange rate. No
evidence for impact of
EXR shocks on Oil price.
Basher, Haug and Sadorsky.
(2016); Energy Economics
2016 SVAR, Markov-switching
model
world oil supply, global
real economic activity, oil
prices, and exchange rates.
Exporting: Brazil,
Canada, Mexico,
Norway, Russia
and the United
Kingdom.
Importing: India,
Japan, South Korea
1976:02 – 2014:02
(monthly data)
Oil demand shock leads
to significant exchange
rate appreciation
pressures in oil exporting
economies.
Only limited evidence
that oil supply shocks
affect exchange rates for
either
oil exporting or oil
importing countries

June 2017
Joscha Beckmann, Robert Czudaj and Vipin Arora | U.S. Energy Information Administration | This paper is released to encourage discussion and critical comment. The analysis and conclusions expressed here are those of the authors and not necessarily those of the U.S. Energy Information Administration
40
Table A.1. Literature review (cont.)
Author / Year / Journal Year Methodology Variables Included Countries
In-sample / out-of
sample Result / Causality
Beckmann, Czudaj (2013a);
International Review of
Economics and Finance
2013 Markov-switching vector
error correction model (MS-
VECM)
Trade-weighted nominal
and real effective
exchange, three different
country indices (broad,
main, OITP), WTI crude
oil price (in USD/barrel),
US CPI, three-month
treasury bill rate.
US 1974:01 – 2011:11
(monthly data)
Effective depreciation of
the dollar triggers an
increase in oil
Prices (in nominal terms).
Increase in real oil prices
is associated with a real
appreciation of the dollar
(stem from price effects).
Beckmann, Czudaj (2013b);
Energy Economics
2013 Markov-switching vector
error correction model (MS-
VECM)
WTI nominal oil price
expressed in USD, CPI and
exchange rates of 12 oil
exporting and importing
countries
against the US dollar
Oil exporting:
Brazil, Canada,
Mexico, Norway,
Russia;
Oil importing:
Euro Area, India,
Japan, South
Africa, South
Korea, Sweden,
and the UK
1974:01 – 2011:12
(monthly data)
Most important causality
runs from exchange rates
to oil
prices, with a
depreciation of the dollar
triggering an increase in
oil prices. Nonlinearities
are an important issue
when analyzing oil
prices.

June 2017
Joscha Beckmann, Robert Czudaj and Vipin Arora | U.S. Energy Information Administration | This paper is released to encourage discussion and critical comment. The analysis and conclusions expressed here are those of the authors and not necessarily those of the U.S. Energy Information Administration
41
Table A.1. Literature review (cont.)
Author / Year / Journal Year Methodology Variables Included Countries
In-sample / out-of
sample Result / Causality
Beckmann, Berger, Czudaj
(2016); Quantitative Finance
2016 Static and dynamic copula
approach
WTI nominal oil price
expressed in USD and
exchange rates of 12 oil
exporting and importing
countries
against the US dollar
Oil exporting:
Brazil, Canada,
Mexico, Norway,
Russia; Oil
importing: Euro
Area, India, Japan,
South Africa,
South Korea,
Sweden, and the
UK
2003:09 – 2013:09
(daily data)
The intensity of
relationship between oil
prices and FX-rates has
increased over time and
the increased tail
dependency shows that
extreme events are
likelier to occur
simultaneously for both
variables. Currencies of
oil importers and oil
exporters display a
different dependency
structure against the US
dollar in the case of rising
oil prices with the latter
appreciating and the
former depreciating.

June 2017
Joscha Beckmann, Robert Czudaj and Vipin Arora | U.S. Energy Information Administration | This paper is released to encourage discussion and critical comment. The analysis and conclusions expressed here are those of the authors and not necessarily those of the U.S. Energy Information Administration
42
Table A.1. Literature review (cont.)
Author / Year / Journal Year Methodology Variables Included Countries
In-sample / out-of
sample Result / Causality
Bénassy-Quéré et al. (2007);
Energy Policy
2007 Johansen (1988) and
Johansen and Juselius
Cointegration(1990), VECM
Dollar real effective
exchange rate, real EXR
against Euro (from
1978:12), oil price
US, Japan, China,
Eurozone (theory)
1974:01- 2004:11
(monthly data)
Rise of oil price (10%)
coincides with an
appreciation of USD (4
3%) in the long run.
Causality from Oil to
Dollar. Slow adjustment
speed (half-life deviation
of about 6,5 years)
Benhmad (2012); Economic
Modelling
2012 Wavelet approach (DTW:
discrete wavelet transform).
Real oil price (average of
Brent, WTI and Dubai
Fateh), REER (USD),
US 1970:02 – 2010:02
(monthly data).
Strong bi-directional
causal relationship
between the real oil price
and the
real dollar exchange rate
for large time horizons.
But for the first frequency
band (3-month) causality
runs from oil price to
exchange rate.

June 2017
Joscha Beckmann, Robert Czudaj and Vipin Arora | U.S. Energy Information Administration | This paper is released to encourage discussion and critical comment. The analysis and conclusions expressed here are those of the authors and not necessarily those of the U.S. Energy Information Administration
43
Table A.1. Literature review (cont.)
Author / Year / Journal Year Methodology Variables Included Countries
In-sample / out-of
sample Result / Causality
Bodart et al. (2012); Journal
of International Money and
Finance
2012 Unit root tests (LLC, IPS,
INVN), panel cointegration
tests following Fachin
(2007), 3 panel cointegration
techniques: fully modified
OLS, dynamic OLS, BKN
following Bai et al. (2009)
Real effective exchange
rate, price of leading
export commodity, with
and without common time
dummies
14 developing
countries whose
exports are highly
concentrated on
one specific
commodity (>10%)
1980-2008 Price of the dominant
commodity has a
significant long-run
impact on the real
exchange rate when
exports of the leading
commodity contribute to
at least 20% of total
exports. The larger this
share, the large the effect
Bouoiyour et al. (2015);
Energy Economics
2015 ARDL bounds testing
approach, wavelet coherence
(WTC?), wavelet-based
signal detection
Frequency domain approach
Oil price, real exchange
rate, GDP, government
spending, terms of trade,
productivity differential
Russia 1993Q1 – 2009Q4
(Quarterly data)
Oil price causes sharp
real EXR in lower
frequencies.
The link between oil
price and real exchange
rate seems conditioning
upon GDP, government
expenditures, terms of
trade and productivity
differentia

June 2017
Joscha Beckmann, Robert Czudaj and Vipin Arora | U.S. Energy Information Administration | This paper is released to encourage discussion and critical comment. The analysis and conclusions expressed here are those of the authors and not necessarily those of the U.S. Energy Information Administration
44
Table A.1. Literature review (cont.)
Author / Year / Journal Year Methodology Variables Included Countries
In-sample / out-of
sample Result / Causality
Chaban (2009); Journal of
International Money and
Finance
2009 Extension of Hau and Rey
(2006) to commodity-
producing countries with
well-developed equity
markets; structural VAR
model addressing the
simultaneity issue (three
endogenous variables,
exogenous commodity
returns)
Exchange rate returns (dep.
Variable), equity returns,
commodity returns, equity
flows
Australia, Canada,
New Zealand
1980:01-2006:11
(monthly data)
(Table 4: quarterly
regression)
Compared to Hau and
Rey (2006), the portfolio-
rebalancing motive is
weaker in the three
countries. In contrast,
positive correlation
between equity returns
and exchange rate returns
and no significant
correlation between
equity flows and
exchange rate returns.
Possible explanation:
positive equity return
shock affects commodity-
exporting countries via
comm. Prices: less need
to rebalance portfolios
Chaudhuri and Daniel (1998);
Economic Letters
1998 Engel-Granger cointegration,
ECM
Real EXR (foreign
currency price of USD),
real oil price (United Arab
Emirates price of oil)
16 OCED countries 1973:01 – 1996:02
(monthly data)
except It & SWE
(end
1993:11),Belgium
(1980:01 – 1996:03)
Real USD producer price
EXR and real price of oil
are cointegrated for the
most industrial countries.

June 2017
Joscha Beckmann, Robert Czudaj and Vipin Arora | U.S. Energy Information Administration | This paper is released to encourage discussion and critical comment. The analysis and conclusions expressed here are those of the authors and not necessarily those of the U.S. Energy Information Administration
45
Table A.1. Literature review (cont.)
Author / Year / Journal Year Methodology Variables Included Countries
In-sample / out-of
sample Result / Causality
Chang (2014); North
American Journal of
Economics and Finance
2014 Symmetrized copula
framework? 4000758
Crude oil (WTI), nominal
exchange rate,
Australia, Canada
New Zealand
4.1.1990 – 28.6.2016
(daily data)
Exceedance Correlations
between oil and exchange
rate returns are both
positive and symmetrical
Chen and Chen (2007);
Energy Economics
2007 Johansen, Panel
cointegration techniques
(Pedroni 2004?), FMOLS,
DOLS, PMG (pooled mean
group)
Real Oil Price (world oil
price, United Arab
emirates price, Brent,
WTI) real exchange rate,
CPI + implementing
structural breaks,
G7 (Canada,
France, Germany,
Italy, Japan, UK,
US)
1972:01 – 2005:10
(monthly data) in-
sample (1972:01 –
1990:12) & out-of-
sample
Cointegrated relationship
between real oil prices
and real exchange rates.
Forecast based on oil
prices perform better than
those on random walk.
Predictability is higher in
the long run.

June 2017
Joscha Beckmann, Robert Czudaj and Vipin Arora | U.S. Energy Information Administration | This paper is released to encourage discussion and critical comment. The analysis and conclusions expressed here are those of the authors and not necessarily those of the U.S. Energy Information Administration
46
Table A.1. Literature review (cont.)
Author / Year / Journal Year Methodology Variables Included Countries
In-sample / out-of
sample Result / Causality
Chen, Rogoff and Rossi
(2010); The Quarterly Journal
of Economics
2010 In-sample BIVARIATE
GRANGER-CAUSALITY
TESTS , ANDREWS’S
(1993) QLR TEST FOR
INSTABILITIES and out-
of-sample forecasting (AR)
dollar spot prices
in the world commodity
markets to construct
country-specific,
export-earnings-weighted
commodity price indices;
nominal effective
exchange rates; Dow
Jones–AIG Futures and
Spot indices; forward price
data from Bloomberg for a
selected set of metal
products—gold, silver,
platinum, and copper—to
compare with our
exchange rate–based
forecasts
Commodity
Currencies
Australia
(from 1984:1 to
2008:1)
Canada (from
1973:1 to 2008:1),
Chile (from 1989:3
to 2008:1)
New Zealand (from
1987:1 to 2008:1)
South Africa (from
1994:1 to 2008:1).
In-Sample and out-
of-sample
structural link between
exchange
rates and commodity
prices through the terms-
of-trade and
income effects: Exchange
rates are very useful in
forecasting future
commodity prices (causal
interpretation: because
approach is robust to
parameter instabilities
and because commodity
prices are essentially
exogenous to the
exchange rates

June 2017
Joscha Beckmann, Robert Czudaj and Vipin Arora | U.S. Energy Information Administration | This paper is released to encourage discussion and critical comment. The analysis and conclusions expressed here are those of the authors and not necessarily those of the U.S. Energy Information Administration
47
Table A.1. Literature review (cont.)
Author / Year / Journal Year Methodology Variables Included Countries
In-sample / out-of
sample Result / Causality
Coudert et al. (2008); Energy
Studies Review
2008 Johansen (1988) and
Johansen and Juselius (1990)
Cointegration, VAR, BEER
model
Real oil price, US effective
exchange rate, (BEER: net
foreign assets, terms of
trade)
US 1974:01 – 2004:11
(monthly data)
Causality runs from Oil
prices to EXR Increase in
oil leads to appreciation
of USD in the long run.
Adjustment very slow
(6.5 Years). Link (BEER
model) through US net
foreign asset position.
De Schryder and Peersman
(2015); Energy Journal
2015 Oil demand model: panel
error correction model
(ECM), panel error
correction test of
Gengenbach, Urbain,
Westerlund (2008), PANIC
Total oil consumption per
capita, global real US
dollar crude oil price, real
GDP per capita, real US
dollar effective exchange
rate, linear time trend,
65 oil-importing
countries that do
not have the US
dollar as their local
1971-2008 An appreciation of the
US dollar exchange rate
leads to a significant
decline in oil demand.
This effect is
considerably larger than
the impact of a shift in
the global crude US
dollar oil price which

June 2017
Joscha Beckmann, Robert Czudaj and Vipin Arora | U.S. Energy Information Administration | This paper is released to encourage discussion and critical comment. The analysis and conclusions expressed here are those of the authors and not necessarily those of the U.S. Energy Information Administration
48
Table A.1. Literature review (cont.)
Author / Year / Journal Year Methodology Variables Included Countries
In-sample / out-of
sample Result / Causality
test (Bai and Ng 2002),
Mean Group (MG) estimator
and FE, PANIC
decomposition to estimate
common components in the
residuals (adj. MG)
country-specific constant,
common components of
residuals of MG regression
as proxy for omitted
common variables
currency (23
OECD, 42 non-
OECD countries)
may be a consequence of
a stronger pass-through
of changes in the US
dollar exch. rate to
domestic end-user oil
product prices rel. to
changes in global crude
oil price
De Vita, Trachanas (2016);
Energy Economics
“A failed replication” – see
Bal and Rath (2015)
2016 Ng and Perron Test (unit
root), model see Bath and
Rat (2015)
see Bath and Rat (2015) India, China 1994:01 – 2013:04
(monthly data)
‘Pure replication’ and a
‘reanalysis’ of Bal and
Rath (2015).
Oil price is level
stationary I(0).
No evidence for
nonlinear or cointegrated
causality for India and
China

June 2017
Joscha Beckmann, Robert Czudaj and Vipin Arora | U.S. Energy Information Administration | This paper is released to encourage discussion and critical comment. The analysis and conclusions expressed here are those of the authors and not necessarily those of the U.S. Energy Information Administration
49
Table A.1. Literature review (cont.)
Author / Year / Journal Year Methodology Variables Included Countries
In-sample / out-of
sample Result / Causality
Ferraro, Rogoff and Rossi
(2015), Journal of
International Money and
Finance
2015 “Pseudo” out-of-sample fit
with realized fundamentals
(commodity price model)
Canadian-USD nominal
Exchange rate, spot price
crude oil (WTI), Canadian
and US interest rates,13
Canada In Sample and out-
of-Sample.
12/14/1984 to
11/05/2010
(daily , monthly and
quarterly (end-of-
sample)
Empirical results suggest
that commodity prices
can predict commodity
currencies' exchange
rates at a daily frequency,
in the sense of having a
stable “out-of-sample fit”
relationship (not evident
at quarterly and monthly
frequencies).
Fratzscher, Schneider and
van Robays (2014); ECB
Working Paper Series
2014 structural six-variable VAR effective dollar exchange
rate, WTI crude oil price in
USD, Dow Jones Ind. Avg.
Index (US stock returns),
US short-term interest rates
(three-month Certificate of
Deposit), proxy for risk
and a proxy for the
financialization of oil
markets14
02.01.2001 –
19.10.2012 (daily
data)
Bi-directional causality
between the US dollar
and oil prices since the
early 2000s. Causality
between oil prices and
exchange rates runs
negative in both
directions. Oil prices and
the US dollar are
significantly affected by
changes inequity market
returns and risk
13 In addition, we consider other currencies and commodities. The Norwegian krone-US, South African rand-US dollar and Australian Dollar-US dollar nominal exchange rates are from Barclays
Bank International (BBI). The Chilean peso-US dollar exchange rate is from WM Reuters (WMR). Besides the oil price series described above, we use prices for copper and gold. 14 Weekly open interest in the NYMEX oil futures market gathered by the Commodities Futures Trading Commission (CFTC)

June 2017
Joscha Beckmann, Robert Czudaj and Vipin Arora | U.S. Energy Information Administration | This paper is released to encourage discussion and critical comment. The analysis and conclusions expressed here are those of the authors and not necessarily those of the U.S. Energy Information Administration
50
Table A.1. Literature review (cont.)
Author / Year / Journal Year Methodology Variables Included Countries
In-sample / out-of
sample Result / Causality
Ghosh (2011); Applied
Energy
2011 GARCH and EGARCH
model
Brent crude oil, rupee-
dollar exchange rate in
nominal terms. Daily
returns on oil price and
EXR.
India 2.7.2007 –
28.11.2008 (daily
data)
Increase in the oil price
return leads to a
depreciation of
Indian Rupee (to US
Dollar). Positive and
negative oil price shocks
have similar effects, in
terms of magnitude,
on exchange rate
volatility in India
(symmetric effect).
Habib, Bützer and Stracca
(2016); IMF Economic Review
2016 Two-stage approach:
1. Sign restriction identification scheme (VAR)
2. Fixed effects pooled panel model
“first identify oil supply and
demand shocks using a sign
restrictions identification
REER, bilateral nominal
EXR with USD, IMF
Special Drawing Rights,
CPI, stock market returns,
interest rates (mainly
money market), foreign
exchange reserve, self-
constructed EMP index
(exchange market
pressure), currency crisis
43 countries (12
advanced and 31
emerging)
1986:01 – 2013:12
(monthly and
quarterly data)
Main Result: For the full
set of 43 countries
there is no systematic
evidence of a relationship
between the oil or the
commodity trade balance
and exchange rate
movements following oil
price shocks. Countries
with a higher oil surplus

June 2017
Joscha Beckmann, Robert Czudaj and Vipin Arora | U.S. Energy Information Administration | This paper is released to encourage discussion and critical comment. The analysis and conclusions expressed here are those of the authors and not necessarily those of the U.S. Energy Information Administration
51
Table A.1. Literature review (cont.)
Author / Year / Journal Year Methodology Variables Included Countries
In-sample / out-of
sample Result / Causality
scheme, and then condition
exchange rates and other
macro variables in each
individual country to the
shocks estimated
in the first stage in a panel
setting”
dummy, Oil price: US
crude oil imported
acquisition cost by
Refiners denominated in
SDR, oil trade balance (as
share of GDP), commodity
trade balance, Index of
Industrial Production from
OECD
tend to lean against
appreciation pressures by
accumulating foreign
exchange reserves.
In Countries with floating
currencies nominal
appreciation in the wake
of oil demand shocks.
Huang and Guo (2007); China
Economic Review
2007 Four-dimensional structural
VAR (SVAR) model
Real world oil price, real
industrial prod., REER
(deflate nominal RNB by
PPI), relative CPI
China 1990:01 – 2005:10
(monthly data)
Real oil price shock leads
to minor appreciation of
REER in the long run.
Husain et al. (2015); IMF
Staff Discussion Note
2015
Jawadi et al. (2016);
Economic Modelling
2016 Continuous-time jump-
diffusion model, GARCH
USD/EURO exchange rate. US 2014:08 – 2016:01
(intraday data)
Negative relationship
between the US
dollar/euro and oil
returns, indicating
that a US$ appreciation
decreases oil price.
Further evidence for
volatility spillover from
the US exchange market
to the oil market.

June 2017
Joscha Beckmann, Robert Czudaj and Vipin Arora | U.S. Energy Information Administration | This paper is released to encourage discussion and critical comment. The analysis and conclusions expressed here are those of the authors and not necessarily those of the U.S. Energy Information Administration
52
Table A.1. Literature review (cont.)
Author / Year / Journal Year Methodology Variables Included Countries
In-sample / out-of
sample Result / Causality
Jiang, Gu (2016); Physica A 2016 SVAR, multifractal detrended
cross-correlation analysis (MF
DCCA and MF-ADCCA,
asymmetric,
world economic activity
index, world oil production,
WTI oil price, trade weighted
US Dollar Index, bilateral
exchange rates (between the
US dollar and other
currencies15)
US (see currencies
[13])
Exchange rate: 4. Jan.
2000 – 31. Dec. 2014
(daily data)
Other variables:
1994:01 – 2014:12
(monthly data)
Cross-correlations between
oil prices and exchange rates
exist in the long run. Cross-
correlations are multifractal:
they are more persistent in
small fluctuations than that
in large fluctuations.
MF-ADCCA : cross-
correlations between oil
prices and exchange rates
are significantly asymmetric
Kohlscheen et al. (2016); BIS
Working Paper
2016 First-differences, pseudo out-
of-sample prediction (Meese
and Rogoff 1983), compare
Nominal exchange rate,
commodity export price
11 major
commodity-
exporting countries
(Australia, Canada,
Norway, Brazil,
In-sample and out-
of-sample, 2004:01 –
2015:02 (daily data),
Economically and
statistically significant
link between commodity
prices and exchange
rates, even at high
frequencies. This link
15 CAD/USD (Canada/US), MXN/USD (Mexico/US), NOK/USD (Norway/US), GBP/USD (UK/US), JPY/USD (Japan/US), AUD/USD (Australia/US), EUR/USD (EU/US), KRW/USD (Korea/US).

June 2017
Joscha Beckmann, Robert Czudaj and Vipin Arora | U.S. Energy Information Administration | This paper is released to encourage discussion and critical comment. The analysis and conclusions expressed here are those of the authors and not necessarily those of the U.S. Energy Information Administration
53
Table A.1. Literature review (cont.)
Author / Year / Journal Year Methodology Variables Included Countries
In-sample / out-of
sample Result / Causality
MSPE of baseline model
with that of pure random
walk, DM test
index (CXPI), country FE,
year dummies
Chile, Colombia,
Mexico, Peru,
South Africa,
Russia, Malaysia)
Malaysia: 2005:08-
2015:02, Russia:
2009:02-2015:02
remains unaffected when
changes in uncertainty
and risk appetite are
considered. Implies that
currency movements are
not purely random
Narayan (2013); Journal of
Asian Economics
2013 GLS-based time series
predictive regression model
(Westerlund and Narayan
(2012))
Real oil price (Brent), real
exchange rate,
14 Asian
countries16
1990 – 2009
(monthly data)
In-sample and out-
of-sample
Oil price is an important
predictor of exchange
rates of Bangladesh,
Cambodia, Hong Kong,
and Vietnam vis-a` -vis
the US dollar
16 Importers: Japan, China, Hong Kong, Vietnam, Indonesia, the Philippines, Bangladesh and Cambodia. Exporters: India, Korea, Thailand, Singapore, and Malaysia

June 2017
Joscha Beckmann, Robert Czudaj and Vipin Arora | U.S. Energy Information Administration | This paper is released to encourage discussion and critical comment. The analysis and conclusions expressed here are those of the authors and not necessarily those of the U.S. Energy Information Administration
54
Table A.1. Literature review (cont.)
Author / Year / Journal Year Methodology Variables Included Countries
In-sample / out-of
sample Result / Causality
Lizardo and Mollick (2010),
Energy Economics
2010 VAR and VECM (?) Oil price (WTI), nominal
exchange rate (USD), US
money supply (M1)
relative to the foreign
money supply, US
industrial production
(relative to foreign17 Ind
Prod.),
US (to other
countries)
1975 – 2008:01? In
sample and out-of-
sample
Relationship between Oil
price and US EXR
(against major currencies)
Increase in real oil price
lead to significant
depreciation of USD
against net oil exporter
currencies (Canada,
Mexico, Russia) and to
an appreciation against
oil importers (e.g. Japan).
Robustness exercises also
show that oil price shocks
are associated in the
short-run with a decrease
in the value of the USD
relative to all currencies
as well as to the trade
weighted broad and
major indexes
17 Canada, Denmark, Euro Zone (Germany, France, Italy, Netherlands, Belgium/Luxembourg, Ireland, Spain, Austria, Finland, Portugal, Greece, and Slovenia), Japan, Norway, Mexico, Russia,
Sweden, and the United Kingdom

June 2017
Joscha Beckmann, Robert Czudaj and Vipin Arora | U.S. Energy Information Administration | This paper is released to encourage discussion and critical comment. The analysis and conclusions expressed here are those of the authors and not necessarily those of the U.S. Energy Information Administration
55
Table A.1. Literature review (cont.)
Author / Year / Journal Year Methodology Variables Included Countries
In-sample / out-of
sample Result / Causality
Pershin et al. (2016), Journal
of Policy Modeling
2016 Johansen and Juselius (1990)
cointegration (VAR)
Nominal EXR, crude oil
prices - Brent, short term
interbank interest rates
(repo). (+ structural
breaks)
Selected African
countries:
Botswana, Kenya
Tanzania
01.12.2003 –
02.07.2014 (daily
data)
No general rule.
?!?!
Rautava (2004), Journal of
Comparative Economics
2004 VAR and VECM Real GDP, real federal
government revenues,
REER of Ruble
(endogenous variables),
price of crude oil
Russia 1995:01 – 2002:04
(quarterly data)
XXXXXX
Reboredo (2012), Journal of
Policy Modeling
2012 Marginal distribution model:
TGARCH
Copula models
EXR (USD per unit
of foreign currency), Crude
oil price in USD(WTI)
EU (EURO),
Australia, Canada,
UK, Japan,
Norway, Mexico,
TWEXB (US
Federal Reserve’s
Broad Trade
Weighted
Exchange Index)
04.01.2000 –
15.06.2010 (daily
data)
Increase in oil prices is
weakly associated with
USD depreciation and
vice versa. Copula
models: tail independence
between oil prices and
exchange rates in the
periods before and after
the
financial crisis.

June 2017
Joscha Beckmann, Robert Czudaj and Vipin Arora | U.S. Energy Information Administration | This paper is released to encourage discussion and critical comment. The analysis and conclusions expressed here are those of the authors and not necessarily those of the U.S. Energy Information Administration
56
Table A.1. Literature review (cont.)
Author / Year / Journal Year Methodology Variables Included Countries
In-sample / out-of
sample Result / Causality
Reboredo and Rivera-Castro
(2013); Economic Modelling
2013 Wavelet multi-resolution
analysis
EXR(foreign currency per
unit of USD), Crude oil
price in USD (WTI)
EU (EURO),
Australia, Canada,
UK, Japan,
Mexico, Norway,
TWEXB
04.01.2000 –
07.10.2011 (daily
data)
Oil prices and exchange
rates were independent in
the pre-crisis period.
Evidence of contagion
and negative dependence
after the onset of the
crisis. Oil prices led
exchange rates and vice
versa in the crisis period
but not in the pre-crisis
period
Tiwari et al. (2013a); Energy
Economics.
2013 Discrete wavelet transform
(DWT) approach and scale-
by-scale Granger causality
tests
Crude oil price (WTI),
REER.
Romania 1986:02 – 2009:03
(monthly data)
Oil price have strong
influence on the REER in
the short run, but also for
large time horizons.

June 2017
Joscha Beckmann, Robert Czudaj and Vipin Arora | U.S. Energy Information Administration | This paper is released to encourage discussion and critical comment. The analysis and conclusions expressed here are those of the authors and not necessarily those of the U.S. Energy Information Administration
57
Table A.1. Literature review (cont.)
Author / Year / Journal Year Methodology Variables Included Countries
In-sample / out-of
sample Result / Causality
Tiwari et al. (2013b);
Economic Modelling
2013 Wavelet (DWT), non-linear
causality tests.
Real oil price (WTI),
REER (Rupee)
India 1993:04 – 2010:12
(monthly data)
Causal relationship
between oil price and the
real effective exchange
detected at higher time
scales (low frequency)
but not at lower time
(high frequency) scales.
Unidirectional causality
from exchange rates to oil
prices at scale 16-32
month and bi-directional
causality at scale 31-64
month.
Turhan et al. (2014); Journal
of International Financial
Markets, Institutions &
Money
2014 Consistent dynamic
conditional correlation model
(cDCC),
Crude oil price Brent,
Exchange rates ( USD/
local currency)
G20, excluding
Argentina, China
and Saudi Arabia
(controlled
currency regime)
02/01/2000 -
17/04/2013 (daily
data).
Link between oil prices
and exchange rates has
intensified in the last
decade; they became
strongly negatively
correlated (which also
associates an increase in
the oil prices with the US
dollar depreciation
against other currencies.

June 2017
Joscha Beckmann, Robert Czudaj and Vipin Arora | U.S. Energy Information Administration | This paper is released to encourage discussion and critical comment. The analysis and conclusions expressed here are those of the authors and not necessarily those of the U.S. Energy Information Administration
58
Table A.1. Literature review (cont.)
Author / Year / Journal Year Methodology Variables Included Countries
In-sample / out-of
sample Result / Causality
Two events related with
significant shifts in the
correlation levels e.g.
Iraq-war 2003 and GFC
(global financial crises)
in 2008. No effect of
ongoing Eurozone debt
crises on oil price
exchange rate correlation
pattern.
Tiwari and Albulsecu (2016);
Applied Energy
2016 Continuous wavelet
approach (CWT), Markov
regime-switching
VAR (MRS-VAR),
asymmetric multi-horizon
Granger-causality test.
Oil price (Average of
Brent, Dubai, and WTI),
India-US real exchange
rate
India 1980:01 – 2016:02
(monthly data)
Exchange rate
Granger-causes the oil
price in the long run. In
the short run it’s the
opposite. The relationship
is non-linear, asymmetric
and indirect (exist only in
the post-reform period).
Uddin et al. (2013); Economic
Modelling
2013 Wavelet analysis: continuous
wavelet transform (CWT)
and Wavelet coherence
(WTC).
REER (Real exchange
rates), Real oil prices
Japan 1983:06 – 2013:05
(monthly and
quarterly data)
Strength of co-movement
regarding the return on
the real effective
exchange rate and oil
price growth, differ and
deviates over the time
horizon

June 2017
Joscha Beckmann, Robert Czudaj and Vipin Arora | U.S. Energy Information Administration | This paper is released to encourage discussion and critical comment. The analysis and conclusions expressed here are those of the authors and not necessarily those of the U.S. Energy Information Administration
59
Table A.1. Literature review (cont.)
Author / Year / Journal Year Methodology Variables Included Countries
In-sample / out-of
sample Result / Causality
Wang, Wu (2012); Economic
Modelling
2012 Linear causality: VECM,
Nonlinear: BDS test statistic,
Diks and Panchenko (2006)'s
nonlinear Granger causality
test
crude oil, gasoline, heating
oil and natural gas prices
and trade-weighted
exchange rates.
US Jan. 2. 2003 – June
3. 2011 (daily data)
(divided in 2 sup-
periods (03—07;07-
11)
After financial crises: bi-
directional nonlinear
causality between
petroleum prices and
exchange rate. Pre-crises:
, unidirectional linear
causality running from
petroleum prices to
exchange Rates.
Zhang et al. (2008);
Journal of Policy Modeling
2008 VAR, (T)GARCH, VaR :
Granger causality in risk,
GED
Nominal prices: WTI crude
oil price (USD/barrel),
Spot (nominal) exchange
rate of euro against dollar.
US 04.01.2000 –
31.05.2005
Mean Spillover:
Significant long-term
equilibrium cointegrating
relationship can be
identified between the
two markets. This
suggests a crucial reason
for the fluctuation in
crude oil price. Volatility
spillover: No significant
evidence Risk spillover:
compared with the
powerful oil market, the
impact of US dollar
exchange rate is
confirmed to be relatively
partial

June 2017
Joscha Beckmann, Robert Czudaj and Vipin Arora | U.S. Energy Information Administration | This paper is released to encourage discussion and critical comment. The analysis and conclusions expressed here are those of the authors and not necessarily those of the U.S. Energy Information Administration
60
Table A.1. Literature review (cont.)
Author / Year / Journal Year Methodology Variables Included Countries
In-sample / out-of
sample Result / Causality
Zhang (2013); International
Journal of Energy Economics
and Policy
2013 Engle-Granger (1987)
residual-based cointegration
test (ECM), Johansen and
Juselius (1990) rank
cointegration test.
Real crude oil price (WTI,
deflated by US CPI),
REER18 of USD
US 1973:01 – 2010:06
(monthly data)
No cointegration of Oil
price and the value of
USD but considering
structural breaks (1986
& 2005) existence of
significant long run
relationship.
18 defined as the real trade-weighted value of the US dollar against the currencies of a broad group of major US trading partners (euro area, Canada, Japan, Mexico, China, United Kingdom,
Taiwan, Korea, Singapore, Hong Kong, Malaysia, Brazil, Switzerland, Thailand, Philippines, Australia, Indonesia, India, Israel, Saudi Arabia, Russia, Sweden, Argentina, Venezuela, Chile, and
Columbia).

June 2017
Joscha Beckmann, Robert Czudaj and Vipin Arora | U.S. Energy Information Administration | This paper is released to encourage discussion and critical comment. The analysis and conclusions expressed here are those of the authors and not necessarily those of the U.S. Energy Information Administration
1
Shortcuts:
Methodology Variables
DWT: Discrete wavelet transform
ECM: Error correction model
EqCM: Equilibrium correction model
FMLS: Fully modified least-squares estimator
GARCH: Generalized autoregressive conditional
heteroscedasticity TGARCH: Threshold GARCH,
EGARCH: Exponential GARCH
GED: Generalized error distribution
VaR: Value at Risk
VAR: Vector auto regression
SVAR: Structural VAR
BEER: Behavioral Equilibrium Exchange Rate
EMP Index: Exchange market pressure
GFC: Global financial crises
REER: Real effective exchange rate
TED Spread: Treasury Bill Eurodollar Difference
OITP: Other important trading partners
WTI: West Texas Intermediate crude oil price